Article

Fast Heating Model for the Aircraft Cabin Air

1
Shanghai Aircraft Design and Research Institute, Shanghai 201210, China
2
Tianjin Key Lab. of Indoor Air Environmental Quality Control, School of Environmental Science and Engineering, Tianjin University, Tianjin 300072, China
*
Author to whom correspondence should be addressed.
Energies 2019, 12(18), 3565; https://doi.org/10.3390/en12183565
Submission received: 25 June 2019 / Revised: 6 September 2019 / Accepted: 10 September 2019 / Published: 18 September 2019
(This article belongs to the Special Issue Modelling of Thermal and Energy Systems)

Abstract

:
Maintaining a suitable cabin air temperature distribution is essential for providing an acceptable thermal environment for passengers and crew. However, cabin air may be very cold for the first flight in winter morning. It could be difficult to heat quickly the cabin air and to maintain an acceptable temperature gradient before boarding with the existing environmental control system. This study developed numerical model for predicting the heating process that coupled airflow and heat transfer in a cabin. The model was validated by using the experimental data obtained from an MD-82 airliner. With the validated numerical model, this investigation proposed to use an electric blanket to heat cabin air quickly and to reduce the air temperature gradient.

Graphical Abstract

1. Introduction

If a commercial airplane is parked overnight in cold winter, the structure and cabin air of the airplane would be very cold for passengers before the first flight next morning. This would cause harm to passengers due to the low temperature because the thermal comfort is an important part of cabin comfort, which influences the human health significantly [1,2].
Some researches [1,2] on thermal comfort in airliner cabin were conducted by physical measurements or questionnaire survey and important parameters relevant to thermal comfort were identified. Air temperature, relative humidity and vertical temperature difference are the main environmental parameters for cabin thermal comfort. In order to provide a comfortable cabin environment with acceptable environmental parameters, airliners hope to board passengers within an hour in their first service in the morning after the environmental control system (ECS) is turned on. This process is called the fast heating. However, heating the airplane quickly with existing ECS is very challenging. Since all the ECS supplies air in the upper part of a cabin, the air temperature gradient may be very large and thermal discomfort is created [3,4,5,6,7]. There are a lot of existing researches investigating the airliner cabin environment numerically and experimentally, but these studies mainly focused on the cabin airflow [8,9,10,11,12,13,14,15]. The study focusing on the fast heating process in cabin is still unavailable.
This paper aimed to study the fast heating process of the aircraft cabin experimentally and numerically. A mathematical model was established to simulate the unsteady heating process with different heating methods in this paper. To validate the model, fast heating experiments with simulated conditions were conducted in the first-class cabin of a functional MD-82 airliner. A new heating method using the electric heating blanket was proposed based on the traditional method using the ECS to send hot air into the cabin. Finally, an effective fast heating method was given according to the model predictions.

2. Method

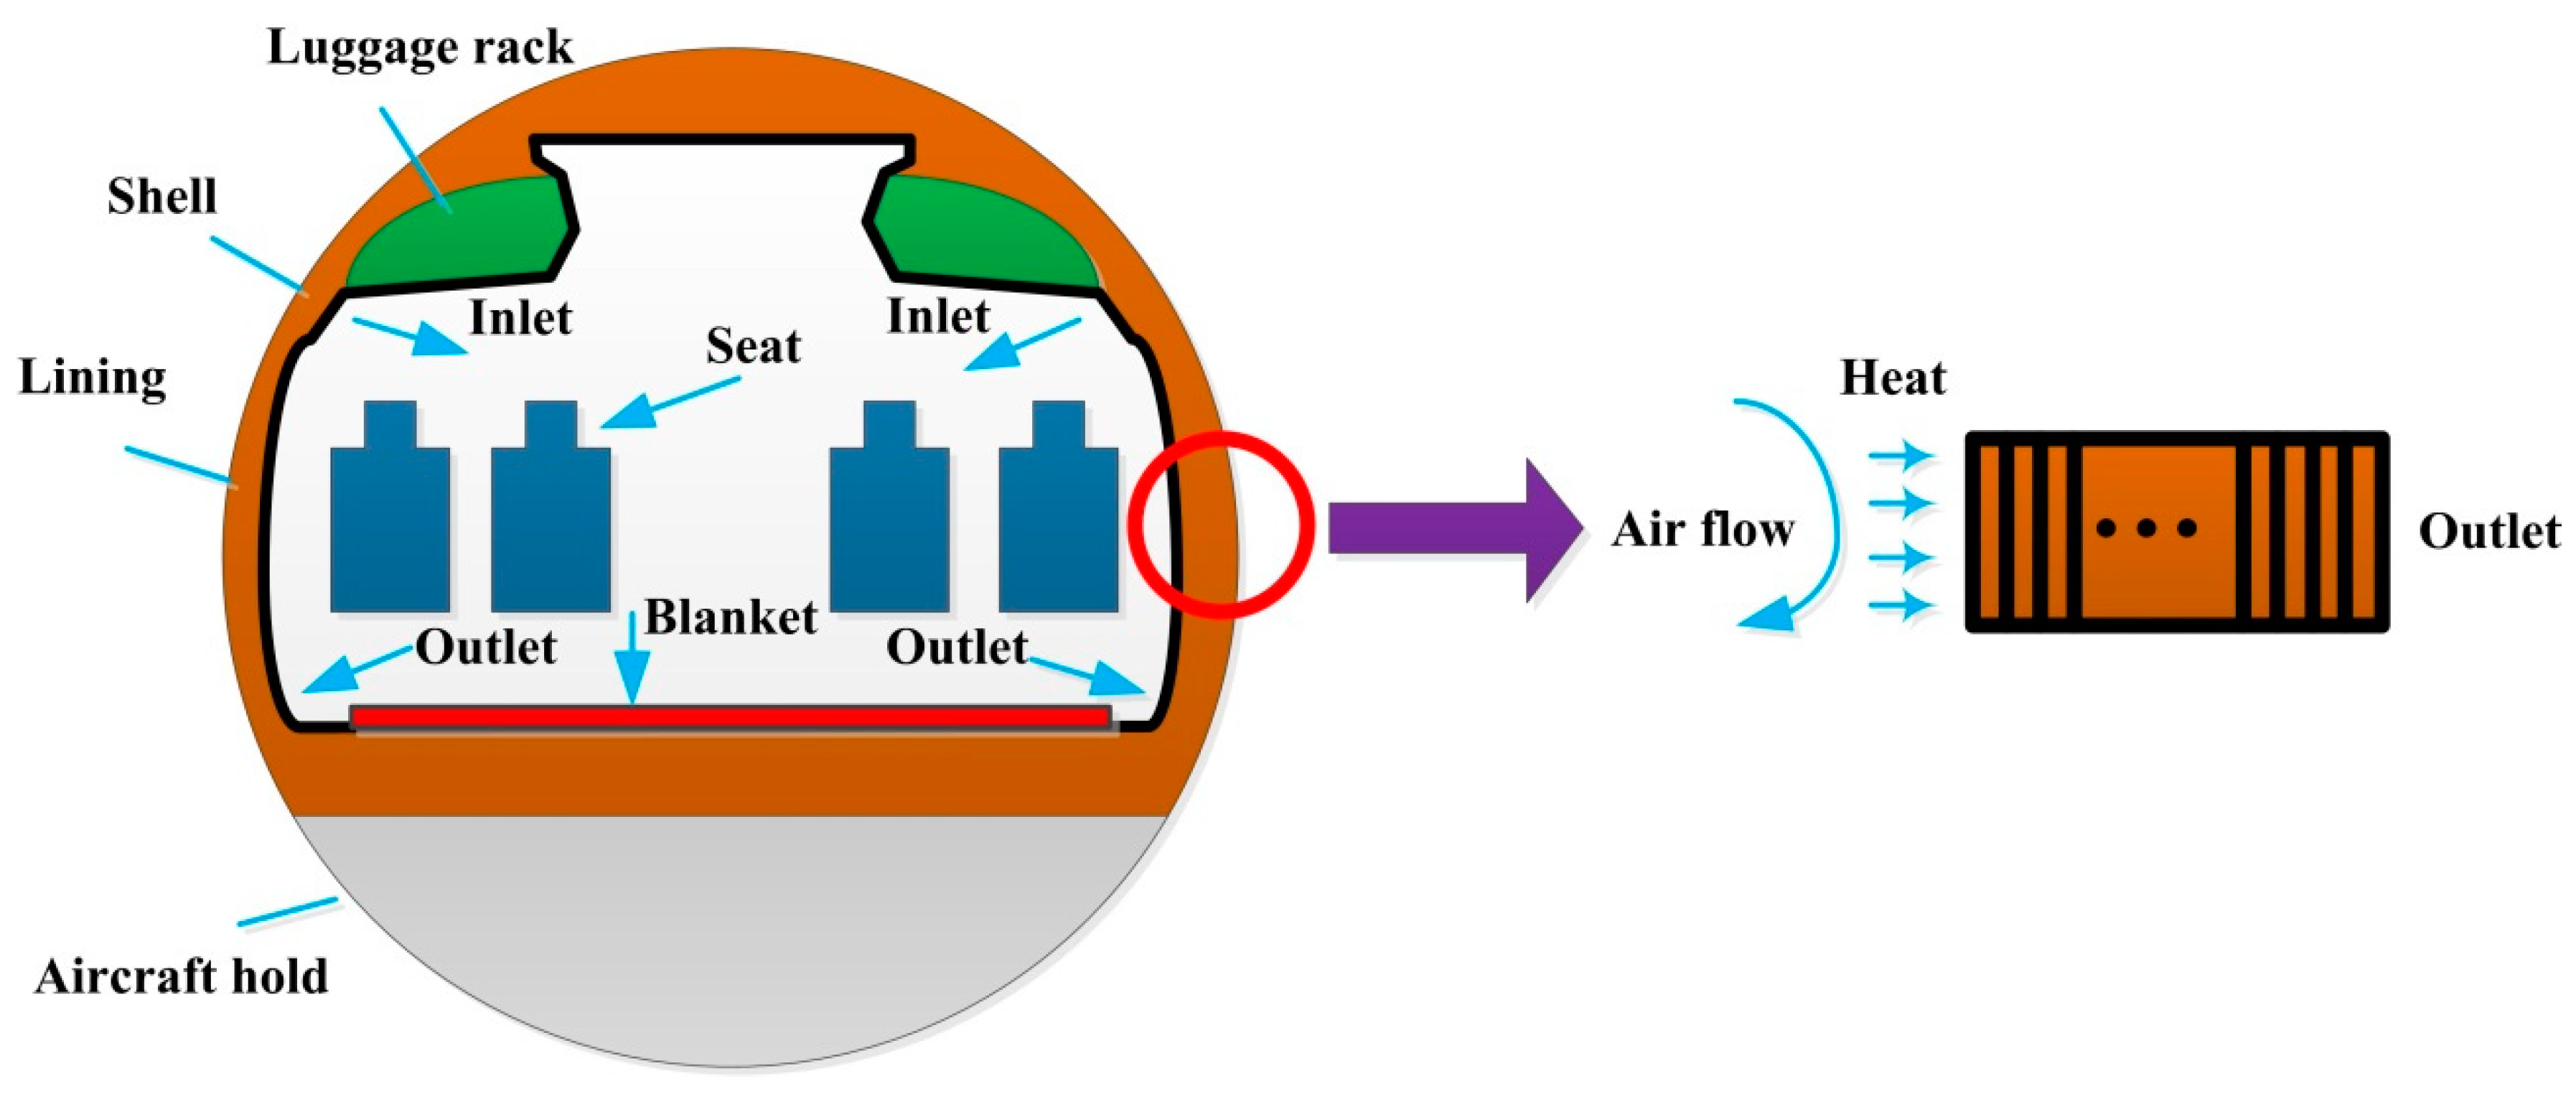
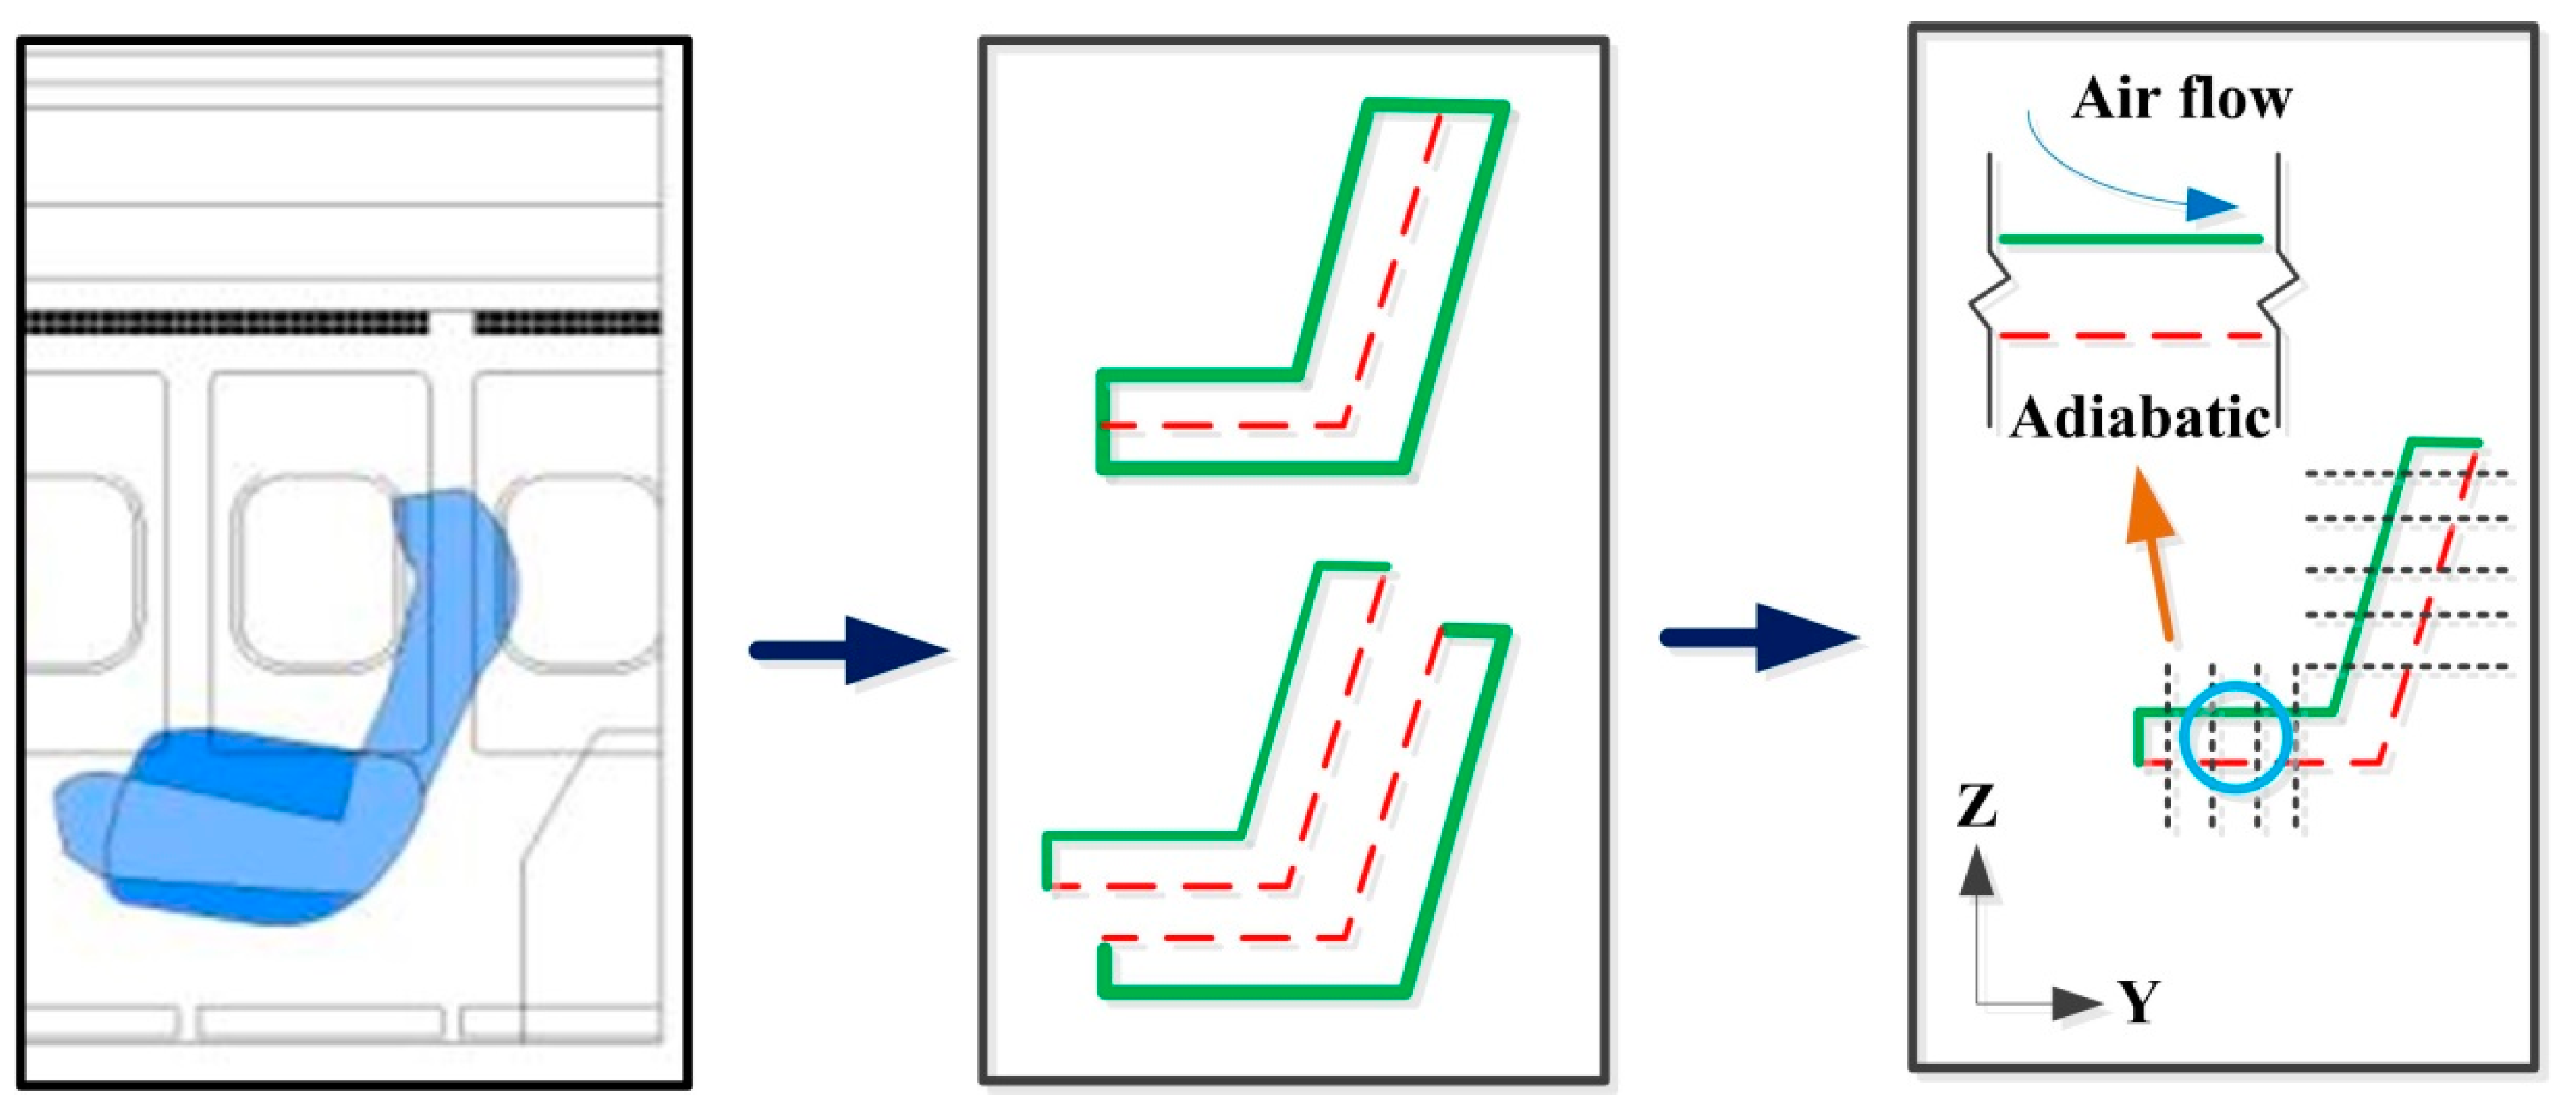
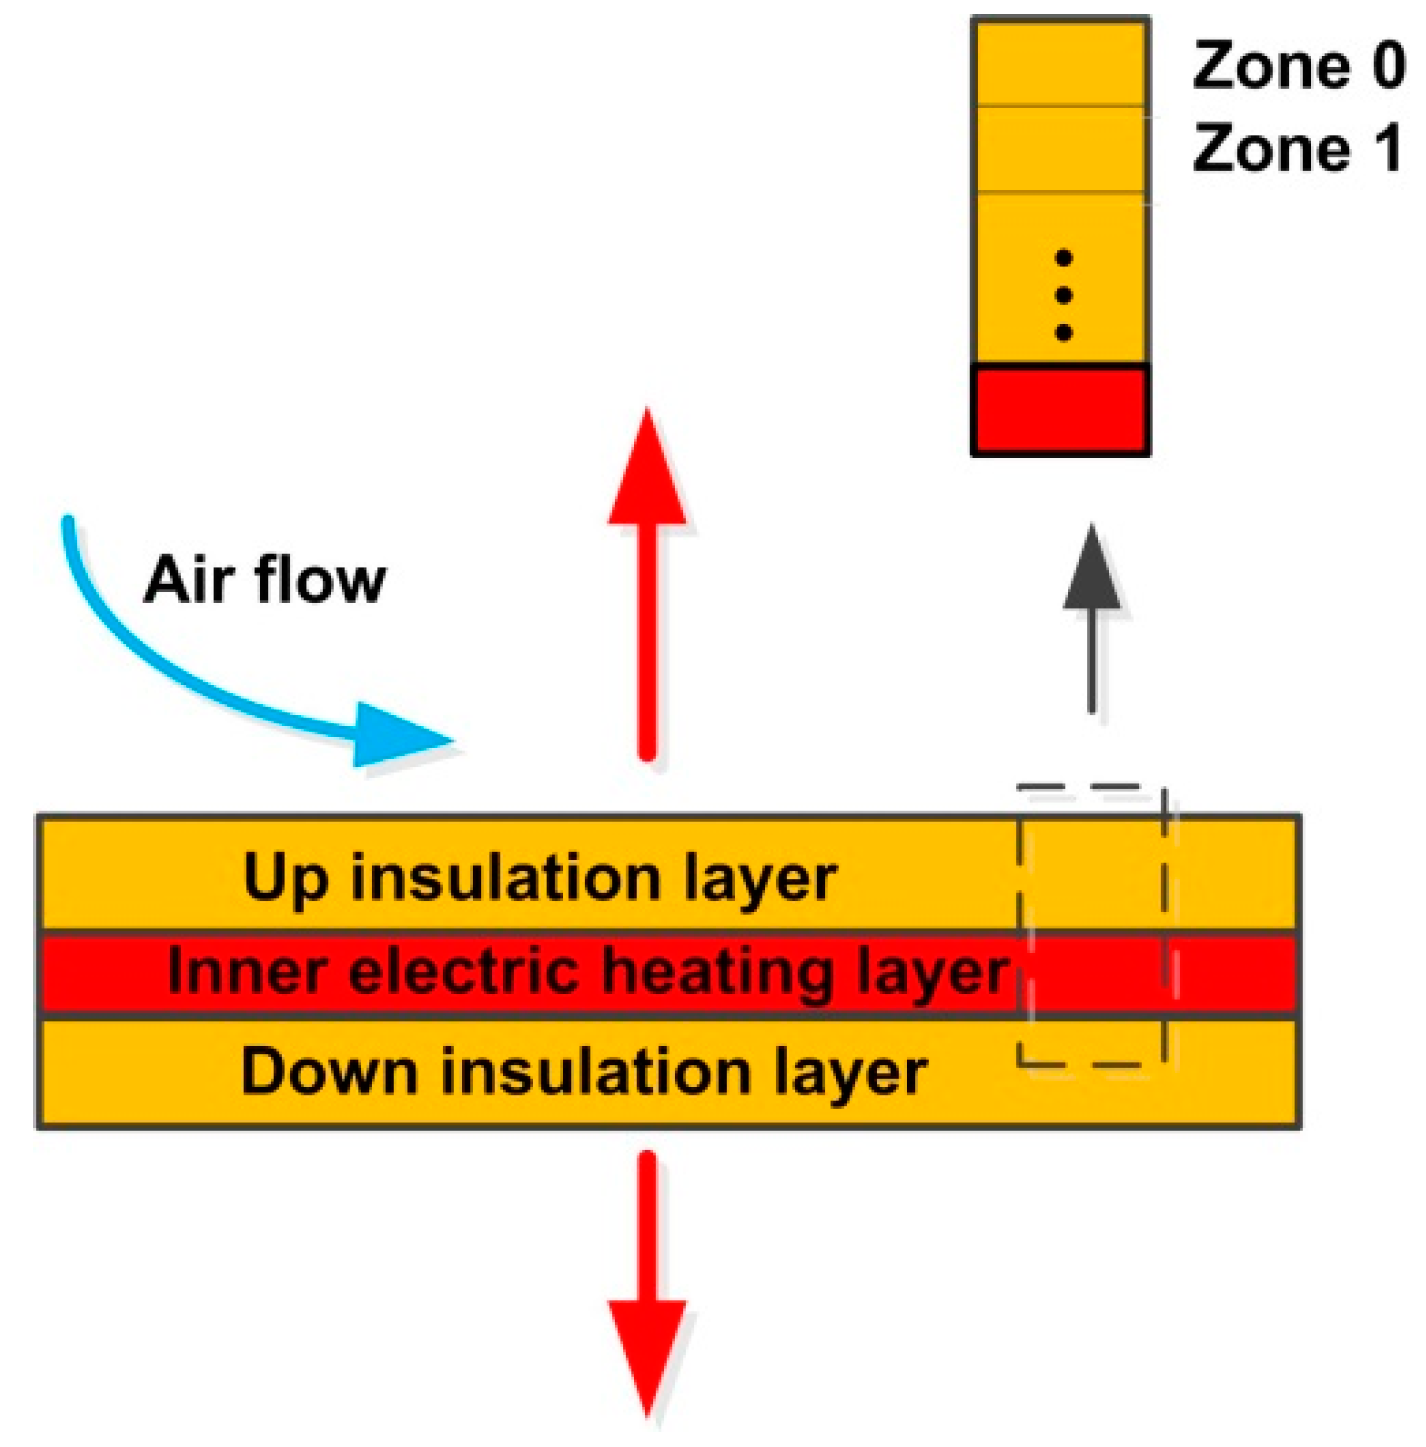
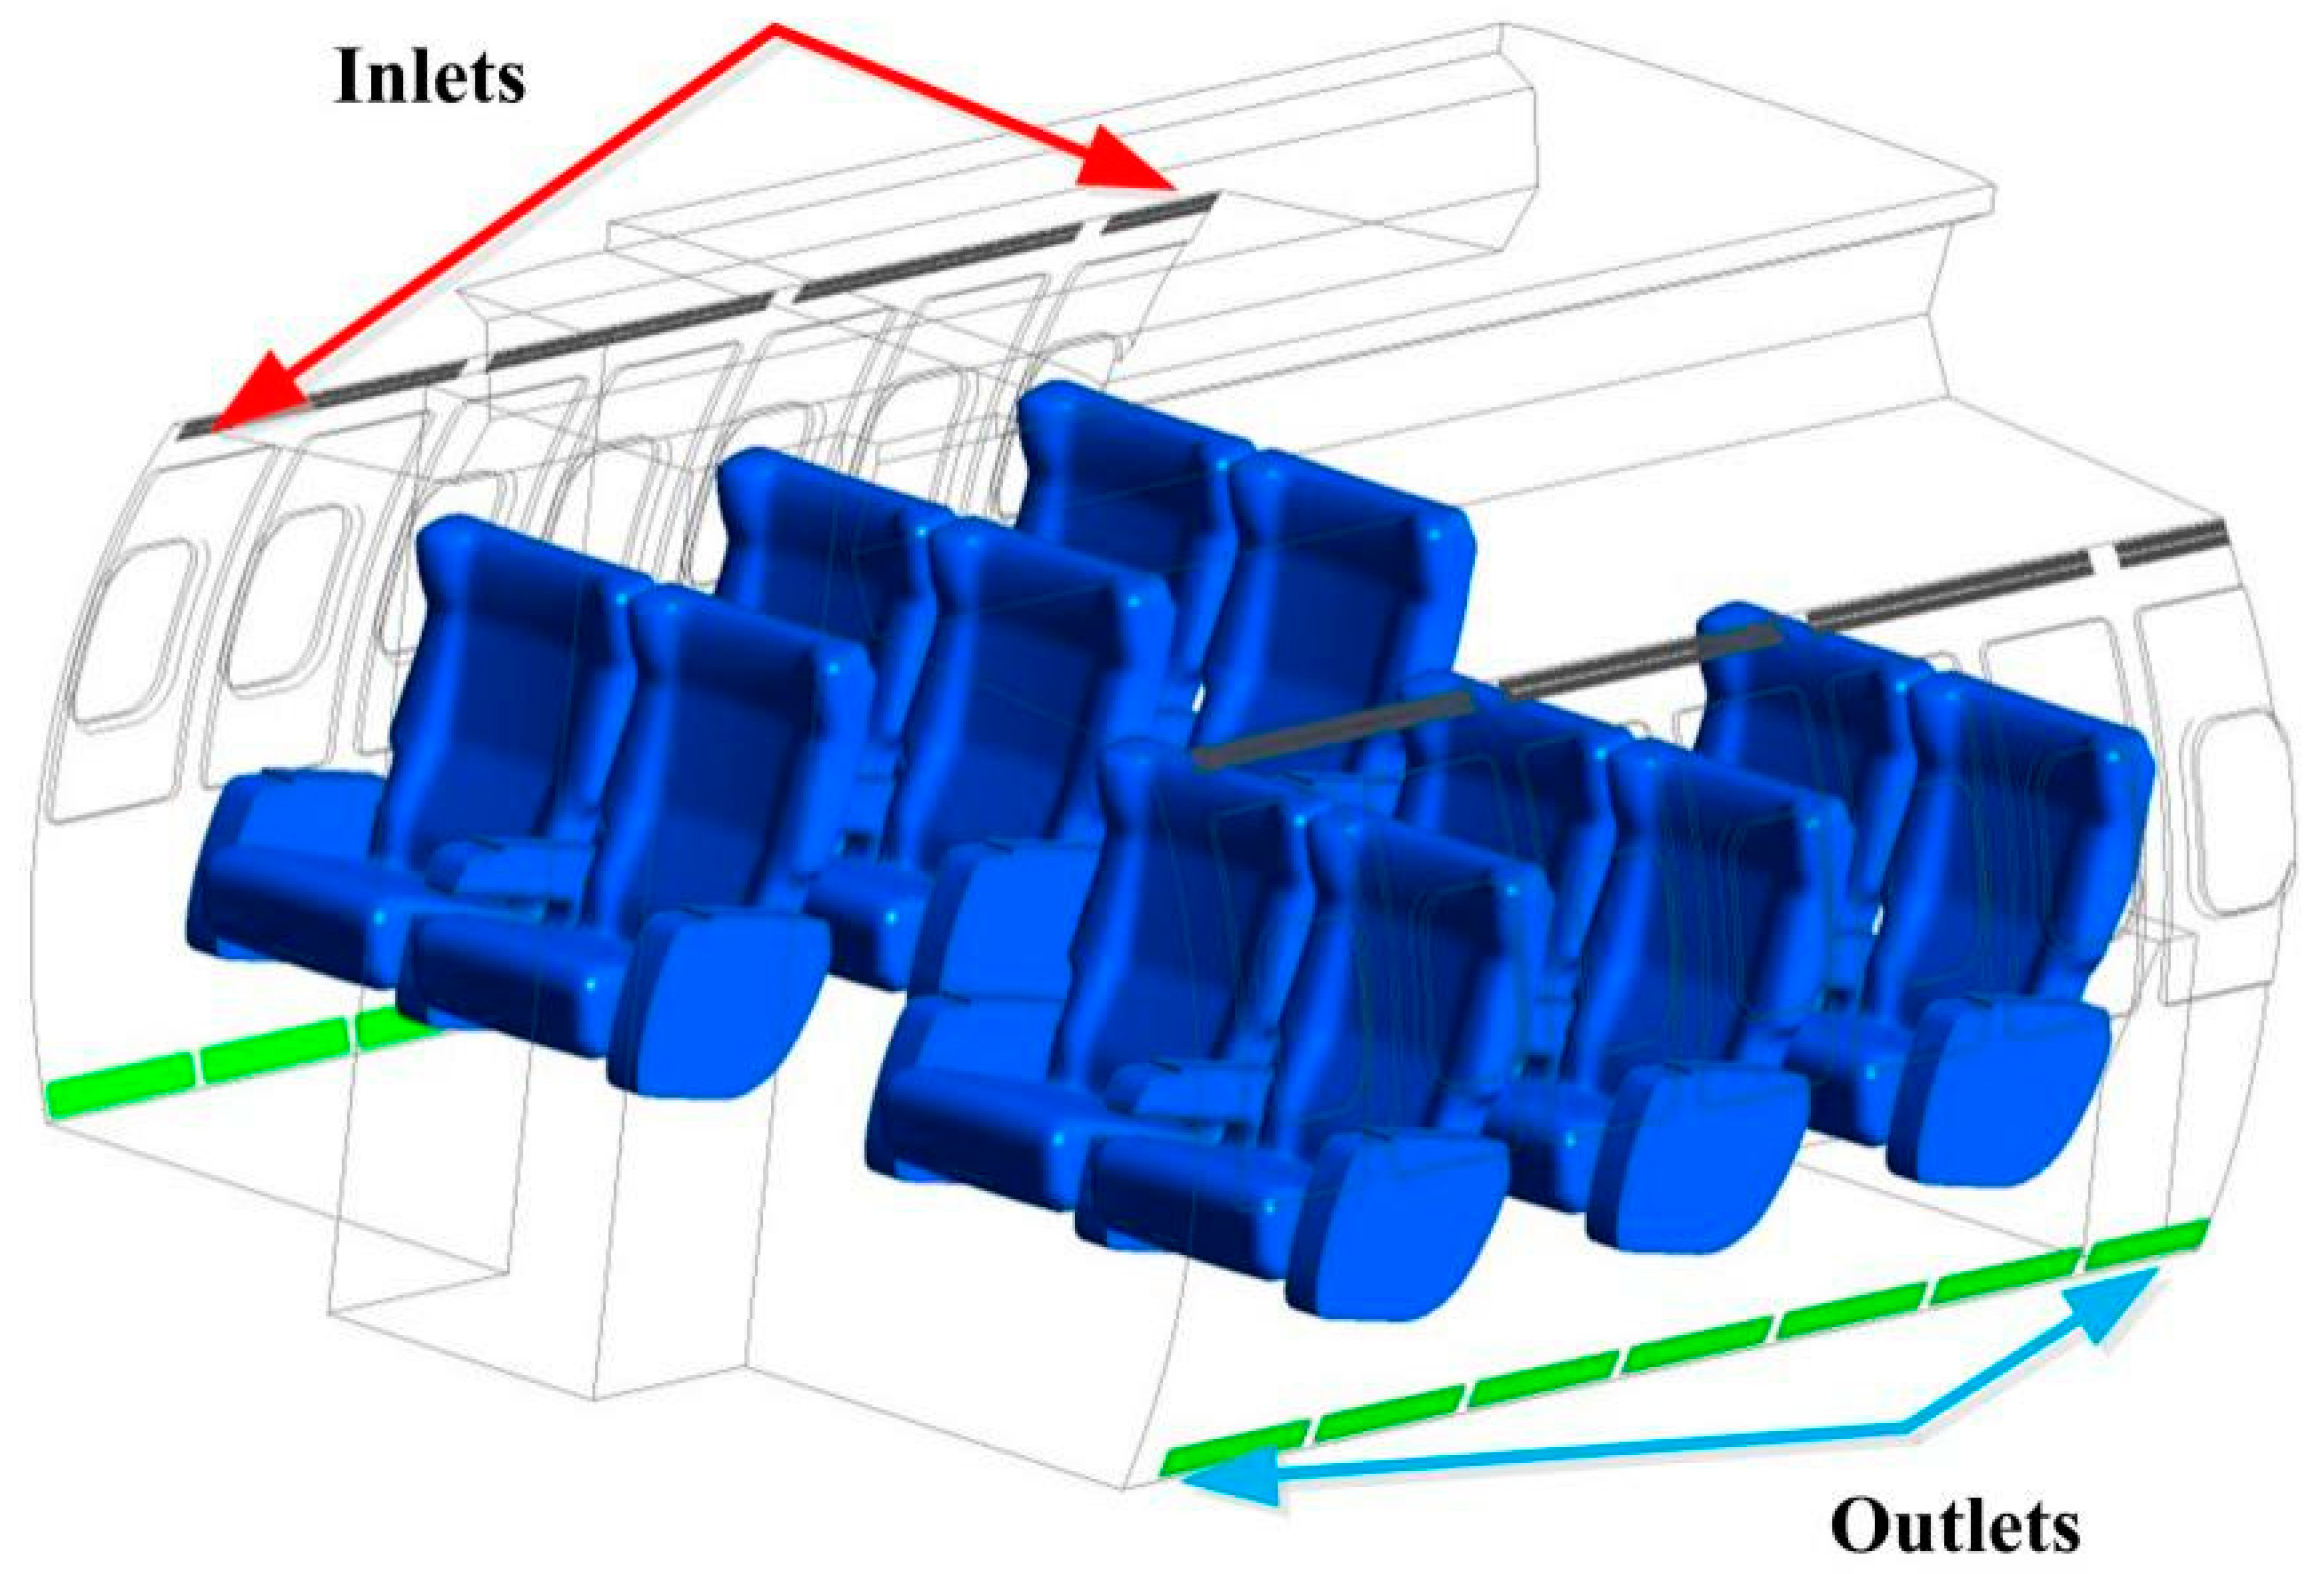
2.1. Physical Description

Figure 1 shows the structures of a typical single-aisle aircraft cabin, which includes air inlets and outlets on two sides, seats, enclosed walls and luggage racks. In the heating process, the hot air from the inlets was supplied to cabin to heat the air and the cabin structure, such as walls, floor, seats, etc. In summary, the physical models in the heating process include the cabin flow field formed by the mixing of the hot and cold air, the heat transfer between the solid objects and the cabin air or atmospheric air. As the hot air enters into the cabin from the top inlets, it is hard to heat the bottom area of the cabin. Thus, it is proposed to use the electric blanket on the cabin floor to heat the bottom area to reduce the vertical temperature difference. For this case, the heat transfer between the electric blanket and the cabin air or the floor should be considered.
For the fast heating study of the aircraft cabin, experiment is the most reliable method. However, it is expensive and time consuming. Besides, it is impossible to do experiments for different types of aircrafts or the heating methods. The better choice is to develop a reliable numerical model, which could simulate the physical processes described above. The existing studies show that the computational fluid dynamics (CFD) is a powerful tool to simulate the air flow and heat transfer in a complex indoor environment, such as the airliner cabin [8,9,10,11,12]. Therefore, this research developed a hybrid CFD model to investigate the fast heating process according to these physical processes.

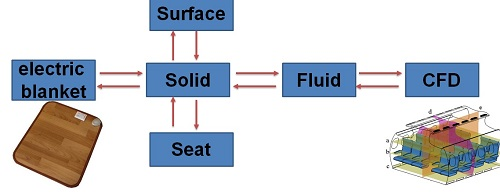
2.2. Numerical Model Description

2.2.1. Cabin Air Flow

In the hybrid model, the air flow in the cabin was simulated by solving a series of Navier–Stokes equations. The flow field could be obtained by numerically solving Navier–Stokes equations with a suitable turbulence model. The RNG k-ε model was used for turbulence simulation of airliner cabin environment due to its accuracy and economy [16,17,18]. Many studies used it to study the air flow and pollutant transport in airliner cabin and its reliability had been proved by the experimental data [9,19]. Otherwise, the RNG k-ε model is capable of modeling relative strong convective heat transfer phenomenon. Some typical convective heat transfer process was simulated by the RNG k-ε model and good agreement between prediction and measurement was obtained, such as turbulent natural convection in two tall air cavities [20], air jet impingement cooling of a heated circular cylinder [21] and single slot jet impinging cooling of a constant heat flux surface [22]. Thus, the RNG model was utilized in this study for the fast heating process. The air flow was calculated by using the commercial CFD software (ANSYS Fluent 12.0) [23].

2.2.2. Cabin Heat Transfer Models Between the Air and the Solid Objects

The heat transfer processes in solid objects (envelop, seat and electric blanket) were simulated by the in-house code. Their models were described in the following sections.
During the heating process, the heat transfer between the cabin air and the outdoor air through the cabin envelope should be considered. The direct approach is to generate the envelope’s geometry and mesh in the computation. However, this will need very fine mesh because of the cabin envelope is very complicated. This study proposed a new method. First, the cabin is divided into many parts along the three dimensional directions with relative coarse cells. The heat transfer through each part is calculated by using a user defined code, which is connected with the CFD solver. Therefore, the CFD mesh does not need to consider the envelope’s geometry, which is modeled by the in-house code. Equation (1) is the basic governing formula used in envelope heat transfer model, which is based on the traditional heat conduction theory [24,25,26]. Equation (2) is utilized to get the heat flux from the external envelope surface to the atmospheric environment.
ρ T t x i [ λ T x i ] = S ,
q = h ( T e x T e n ) ,
where T represents temperature (°C), ρ the density of insulation material (kg/m3), t the flow time (s), λ thermal conductivity (W/m/°C), S the source term including convection and radiation heat flux (W/m2), h the convective heat transfer coefficient of external envelope surface (W/m2/°C), Tex the external envelope surface temperature (°C) and Ten the atmospheric temperature (°C). The radiation exchange between the inner surfaces in the cabin is considered and the surface-to-surface model was utilized [15]. If the envelope cell is adjacent to cabin air, S equals to total heat flux calculated by CFD. If the cell is adjacent to the external environment, S equals to q. Otherwise, S equals to zero.
The seats in airliner cabin had an obvious influence on the cabin thermal environment because they were thermal storage objects. Similar to the envelope heat transfer, a model was developed to model the heat transfer between the seats and the cabin air. Figure 2 shows the details. First, the seat was divided into two parts along the middle line (red dotted line in Figure 2). Second, each part was then subdivided into different zones based on the Z and Y coordinates. The basic governing formula used in seat heat transfer model is Equation (1) too.
The electric heating blanket on the floor could heat the cabin air and the floor. Figure 3 shows a typical pattern of the heating blanket, which consists of an inner electric heating layer and two insulation layers. The electric heat transferred through the upper layer to the cabin air and also transferred to the floor through the down layer. In the model, the blanket was divided into many zones. The temperature in the inner electric device was assumed uniform. Equations (3)–(6) describe the heat transfer model of the electric heat blanket.
q u p τ + Δ τ = T i n τ + Δ τ T u , i n τ R ,
q d o w n τ + Δ τ = T i n τ + Δ τ T d , i n τ R ,
q u p τ + Δ τ + q d o w n τ + Δ τ = q t o t a l ,
ρ T τ x i [ λ T x i ] = S ,
where q u p τ + Δ τ and q d o w n τ + Δ τ represents the heat flux from the inner electric heating device to the upper and down insulation material, T i n τ + Δ τ the temperature value for the inner electric heating layer (°C) and T u , i n τ and T d , i n τ represents the temperature of the cell in the upper or down insulation material neighboring to the inner electric heating device (°C). R represents the thermal resistance (°C/W/m2), q t o t a l the total heat flux of the blanket. In Equation (6), T is the temperature of the cell in insulation material (°C), ρ and λ the density (kg/m3) and heat conductive coefficient of blanket insulation material (W/m/°C), τ the time (s) and S the source term (W/m2). If the envelope cell is adjacent to cabin air, S equals the total heat flux calculated by CFD including convection and radiation heat flux. If the cell is the neighbor to the inner electric heating device, S equals to qup or qdown.

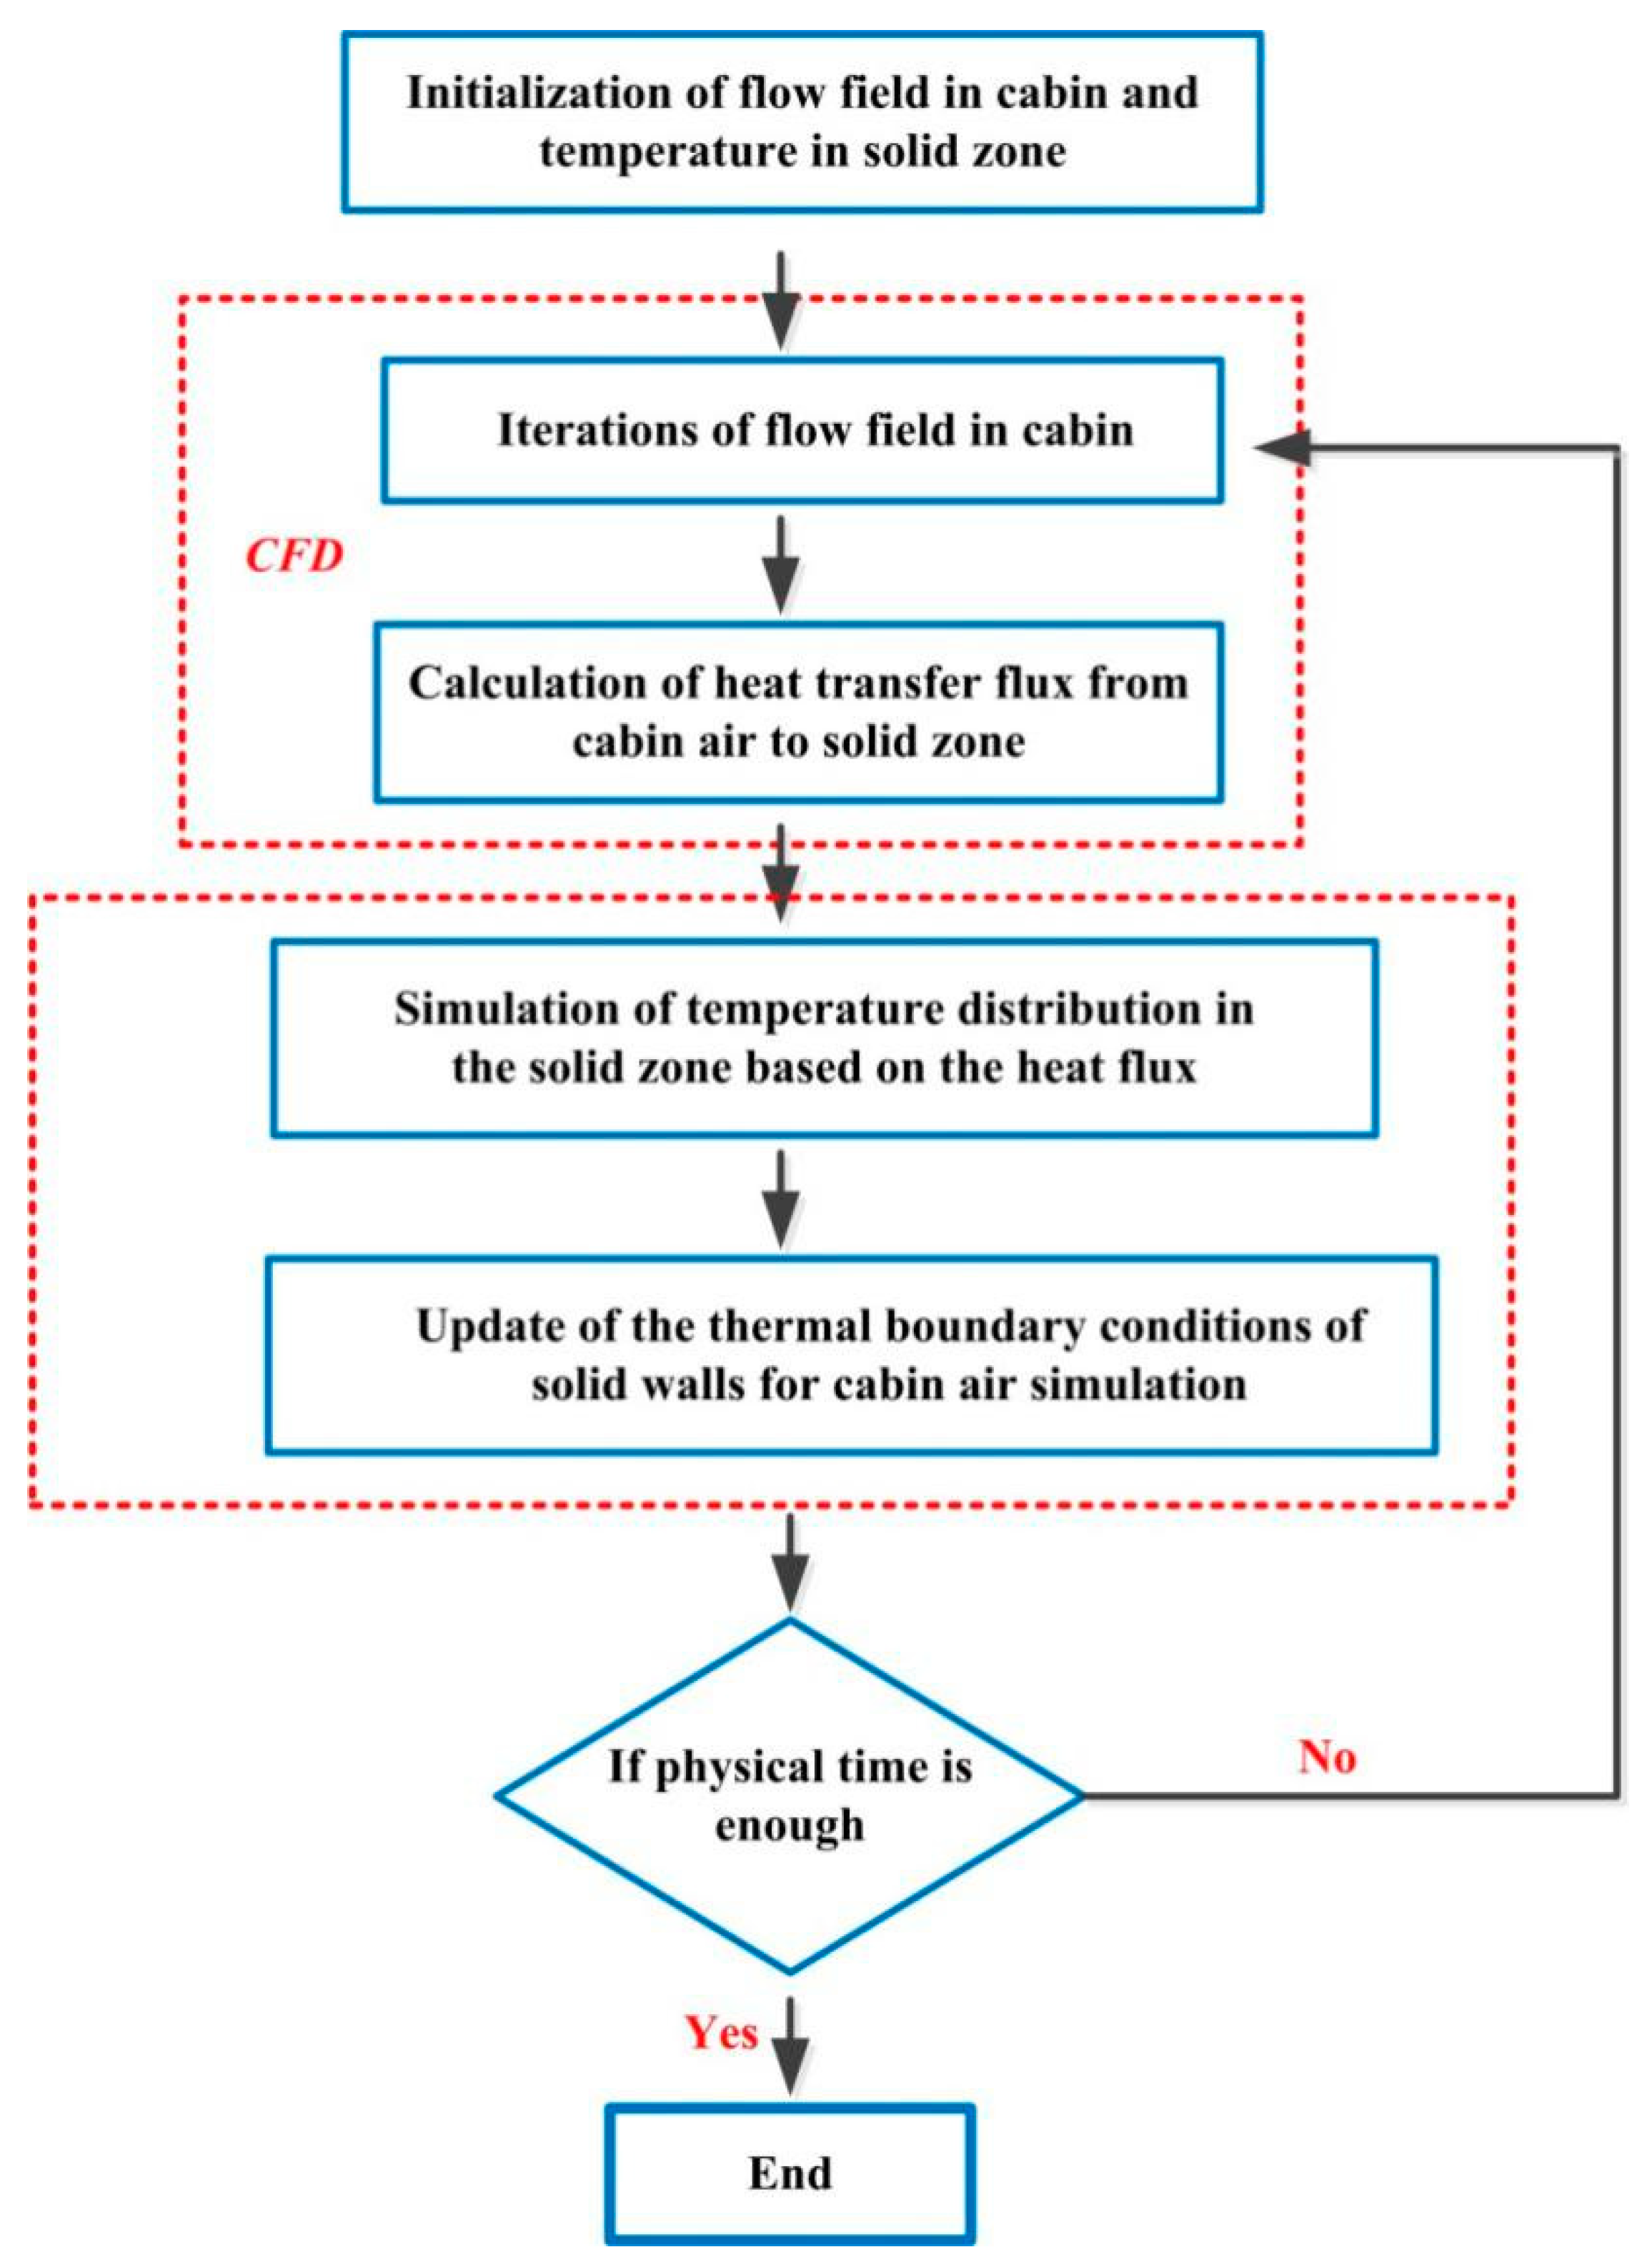
2.2.3. Model Implementation

The cabin air flow model was solved by the ANSYS Fluent 12.1 [23]. The models for the cabin envelope, the cabin seats and the electric blanket were implemented as the user defined functions based on the finite difference method. These functions were connected with the ANSYS Fluent. For the air flow field, this study used the SIMPLE algorithm to couple the pressure and velocity. And the PRESTO! Scheme was adopted for pressure discretization and the first-order upwind scheme for all the other variables. A converged calculation with low order scheme would be more creditable and accurate than a diverged one with high order scheme [8]. The surface-to-surface model was used to model the radiation exchange between the surfaces in the cabin. This method was also adopted in vehicle cabin environment modeling [15]. The relationship between the air density and temperature were considered and the polynomial function was utilized in the air flow modeling [23].
Figure 4 shows the flow chart of the fast heating simulation of the aircraft cabin air. In each time step, the flow field in the cabin was simulated by CFD solver based on the thermal boundary conditions provided by in-house code. Then the in-house code solved the heat transfer equations for solid zones based on the heat flux simulated by CFD and updated the thermal boundary parameters for cabin air flow simulation. In the next time step, the flow field in the cabin was modeled according to the new thermal boundary parameters. This iteration continued until the heating time was reached.

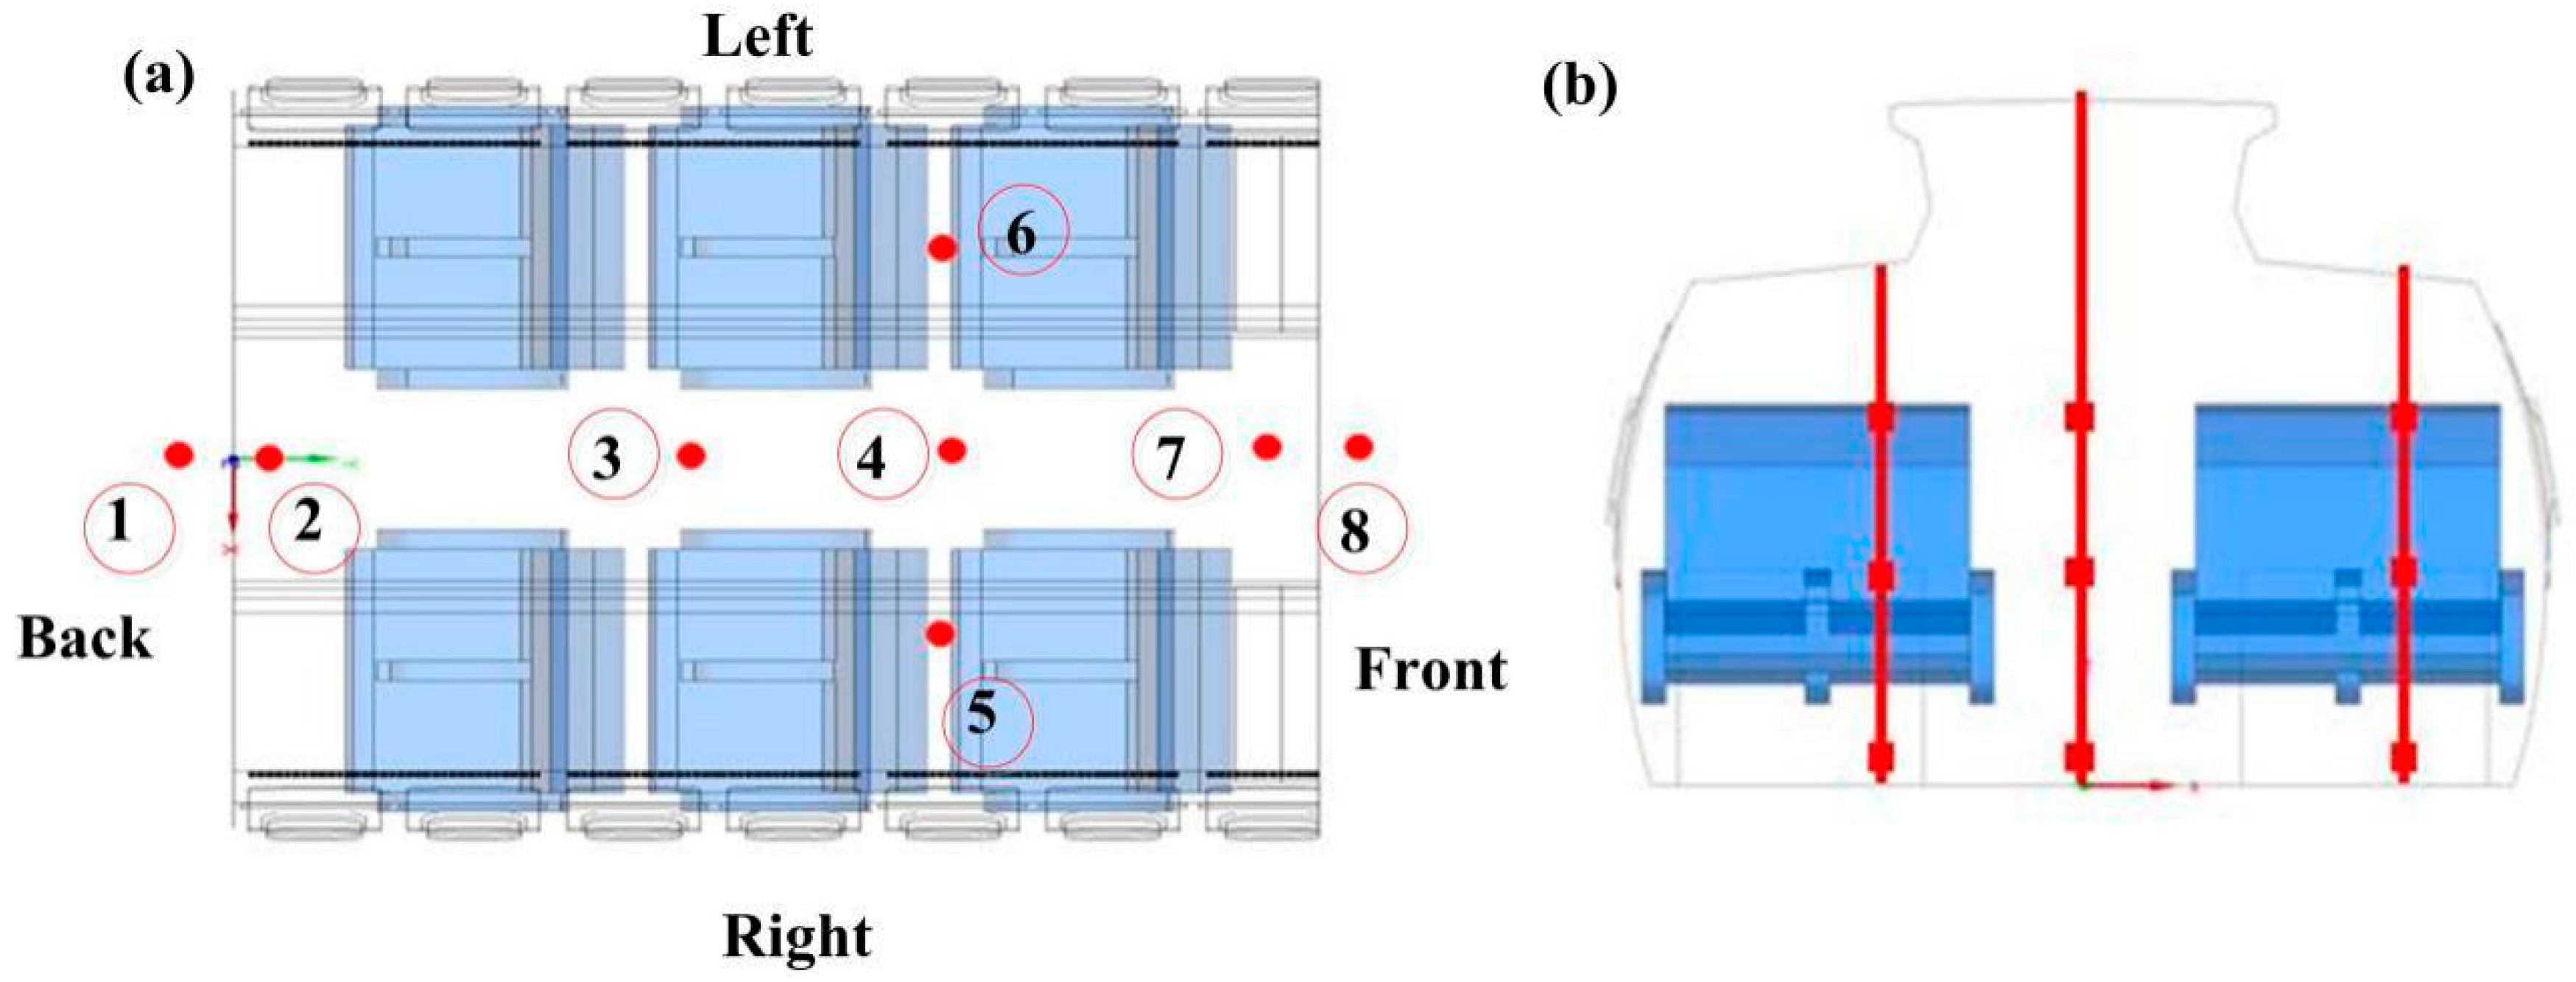
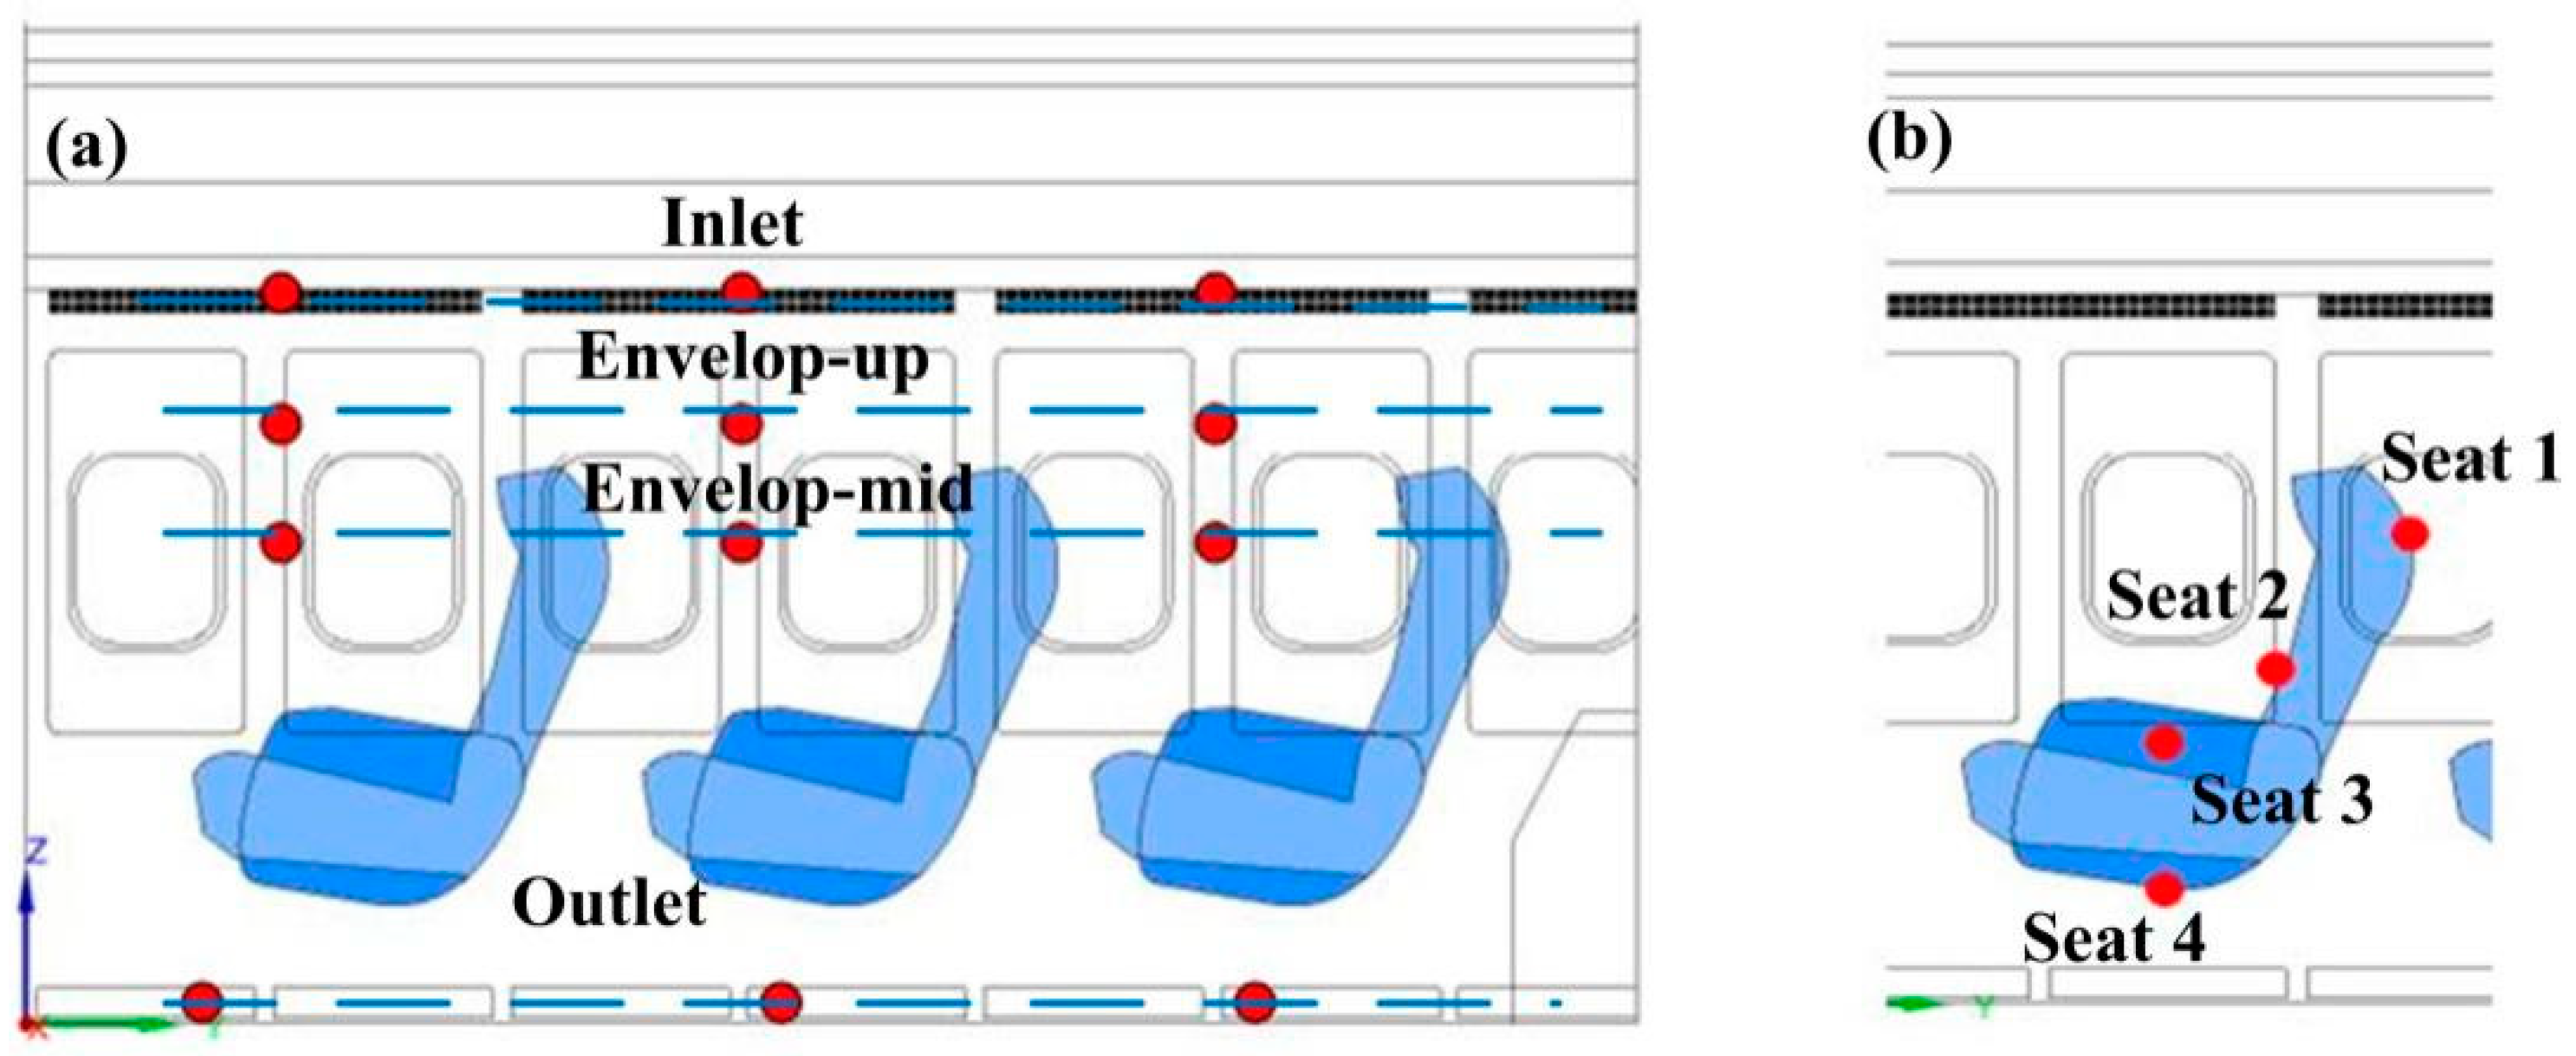
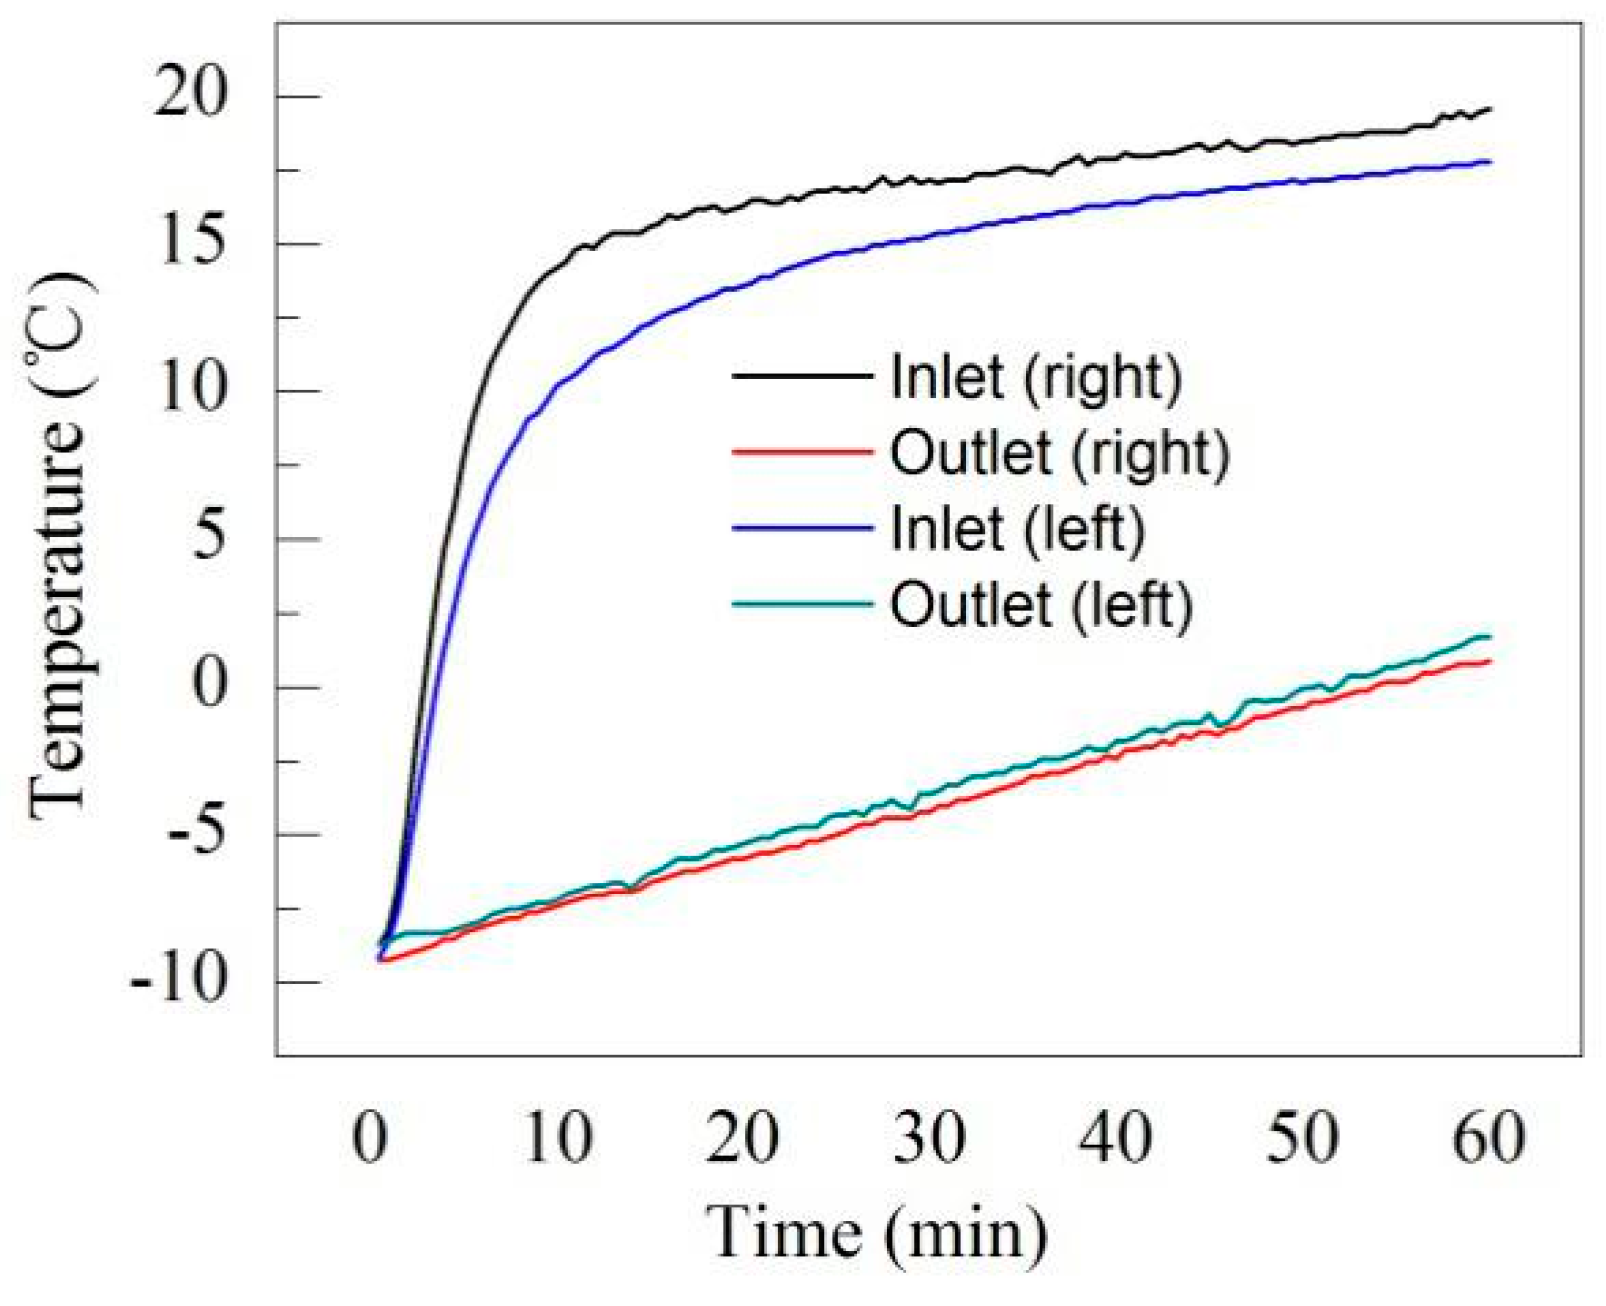
2.3. Experiment Description

The numerical model must be validated by using the experimental data before it could be used. This study conducted fast heating experiments in the airliner cabin for the evaluation of two heating methods and the validation of numerical models. All the experiments were done in the first-class cabin of a functional MD-82 airliner due to economy and previous research achievements. Liu et al. 2012, 2013 measured and simulated the flow field in the first-class cabin of this MD-82 airliner [8,13]. Their data and methods could be used for the fast heating research directly. Figure 5 shows the schematic model of the first-class cabin in the MD-82 airliner: 3.25 m (L) × 2.91 m (W) × 2.04 m (H). There are three rows of seats, three and a half pieces of diffusers, seven outlets and seven windows on each side. More details can be found in Liu et al. (2012, 2013) [8,13].
Two heating methods were tested in winter: The hot air from inlets without (method 1) and with (method 2) the electric heating blanket placed on the floor. Before the fast heating experiment, the MD-82 airliner was parked at the airport for at least seven cold days. If the air temperature in cabin was low enough, the fast heating experiments were conducted in winter morning. As each experiment need much time, two cases were done in two different days. The initial cabin air temperature in method 1 was about −9 °C and −3 °C for method 2. A ground air-conditioning cart was used to supply air into the first-class cabin and the supply air temperature was controlled at 20 ± 1 °C. The initial flowrate in method 1 and method 2 is about 8000 m3/h. The outdoor temperature for method 1 was about −10 °C and −3.5 °C for method 2. In method 2, the electric heating blanket was placed only on the floor aisle and the heating power was 350 W/m2. The temperature and relative humidity data logger sensors (HOBO) were used to measure the air temperature in the cabin. The measuring range was −20 to 70 °C with the resolution 0.12 °C. The thermal resistors were used to monitor the temperatures of solid surfaces, such as the wall, seat and the floor. The measuring range is −40 to 100 °C with the resolution 0.02 °C.
To validate the model, the temperatures of the cabin air and the surfaces of the solid objects were monitored at some points in the experiments. Figure 6 shows the locations of points for air temperature measurements in method 1 and 2. The red points represent vertical rope supporting the HOBO sensors and each rope is numbered. Three HOBO sensors are fixed on each rope, the height of the location for HOBO are 1.1 m, 0.6 m and 0.1 m, as shown in Figure 6b. The three heights represent the head region, waist region and the feet region of passengers sitting in the cabin. The air temperature difference between the head region and feet region has significant influence on the thermal comfort. There are two ropes in aisle (3 and 4) and two (5 and 6) between two chairs. In the front and the back, there are curtains separating the first-class cabin with the economic cabin and the cockpit. For each curtain, two ropes are set to measure the air temperatures, which will be used as the boundary conditions in the air flow filed simulation. Figure 7 shows the locations of points for solid surface temperatures, inlets, and outlets. In Figure 7a, the height of ‘Envelope-up’ was 1.1 m and that of ‘Envelope-mid’ was 0.6 m. The points for seat surface temperature are shown in Figure 7b. Four sensors were located at different heights. Two sensors were used to measure the seat cushion and the other two were used to measure the seat back.

3. Results

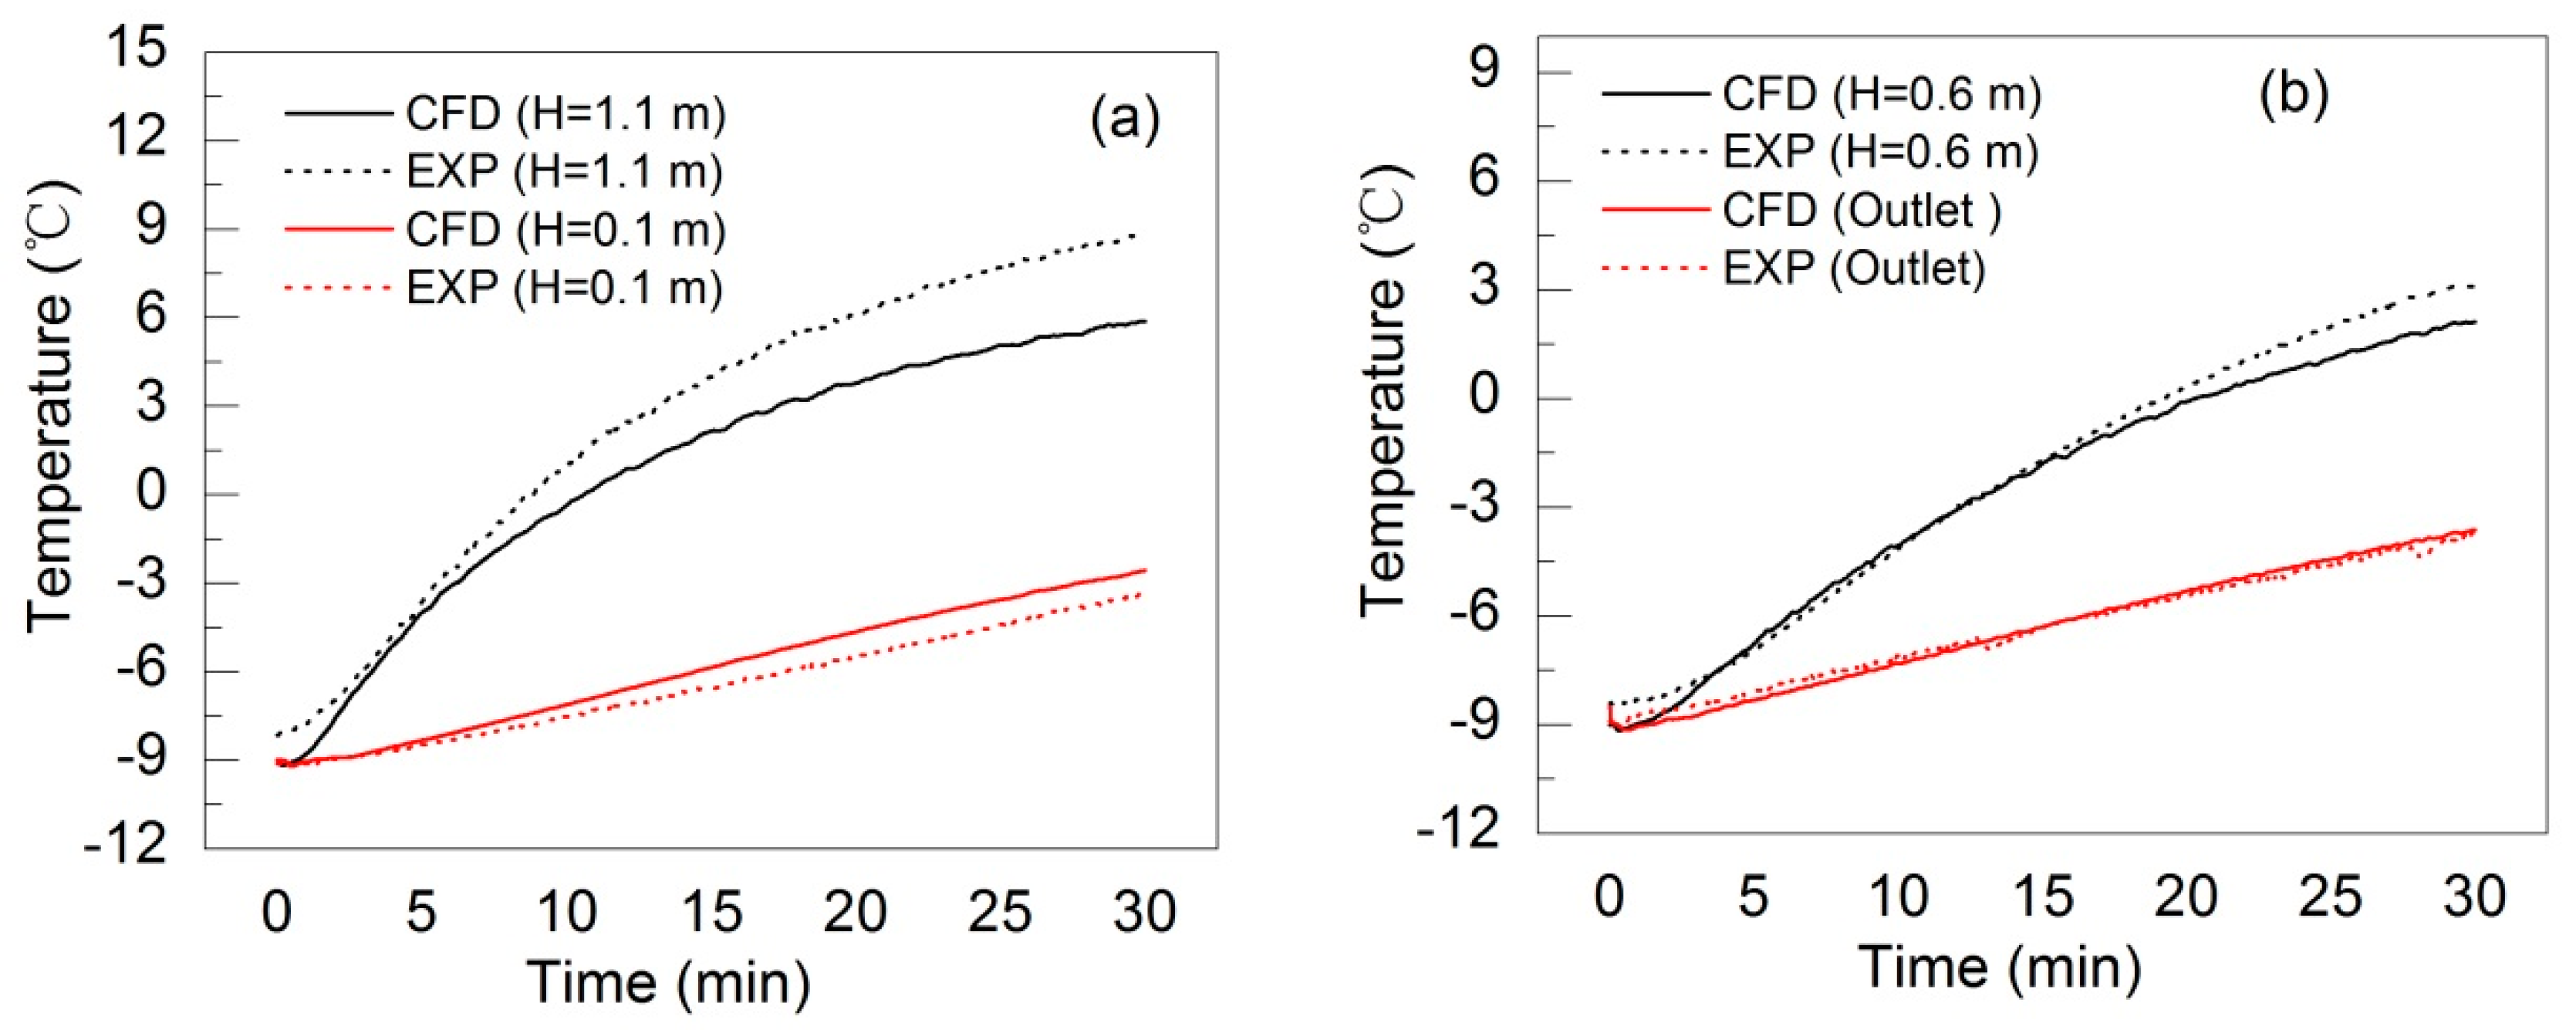
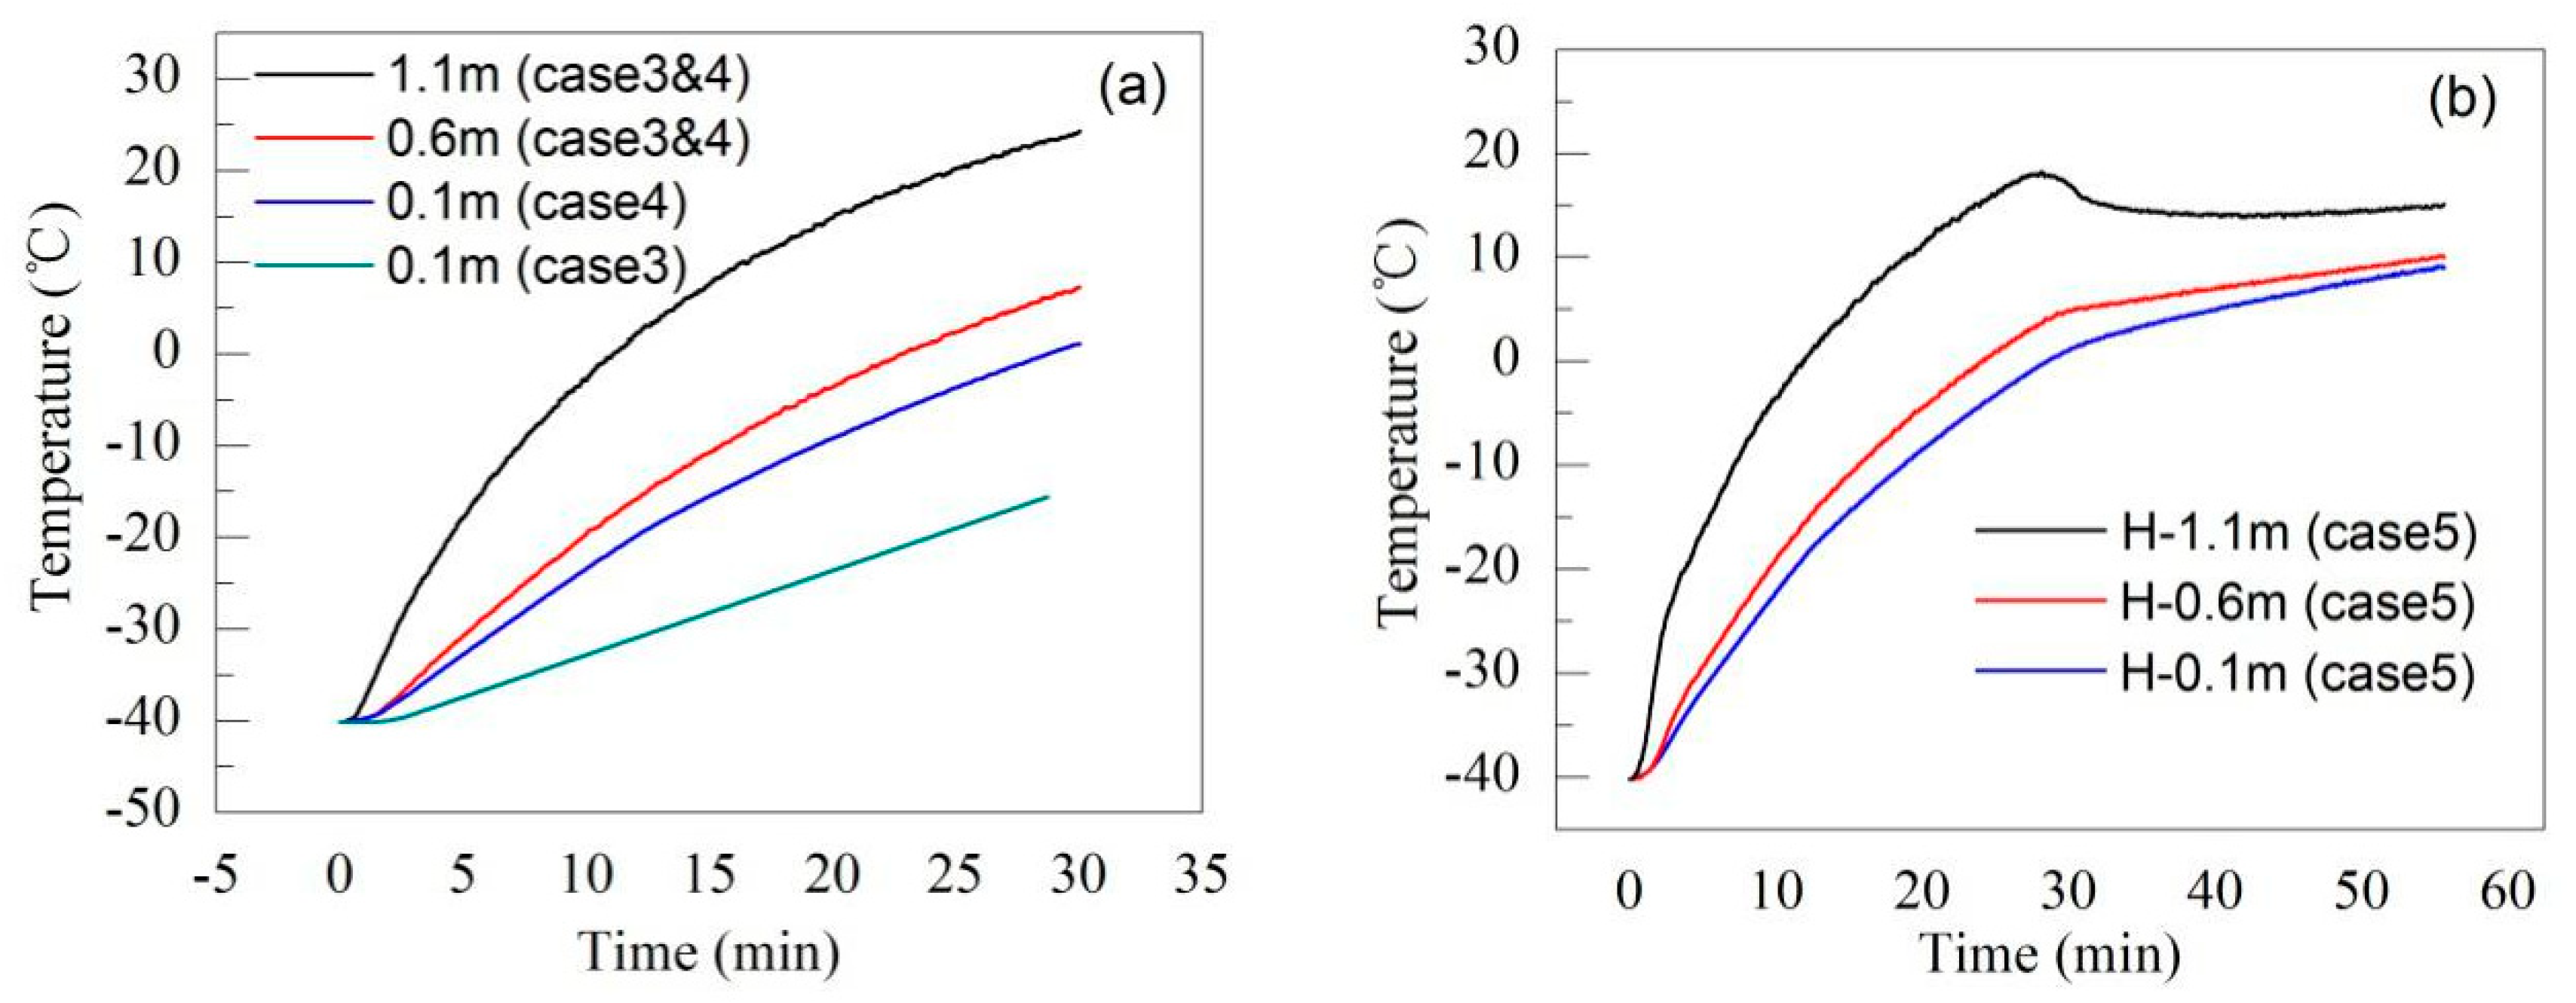
3.1. Method 1: Hot Air

Figure 8 shows the measured air temperature curves of the inlet in method 1. The air temperatures increase gradually, though the temperature of the supply air from ground air condition (GAC) is 20 °C. This is because the supply air went through the cold pipes before it entered into the cabin. The air temperatures differed a little between the left side and the right side (Figure 6) due to the complicated pipes of the airliner. Method 2 had similar results but a different initial temperature of −3.5 °C. In the simulations, the inlet air temperatures used these measured values, not the supply air temperature of the ground air-conditioning cart. Figure 8 also presents the measured outlet air temperatures, which were very close for the two sides. This means that the relative symmetric air flow distribution in the cabin.
The relative errors between the model predictions and experimental data can be calculated by using Equation (7):
e r = 1 T s , 30 T s , 0 T e , 30 T e , 0 ,
where er is the relative error value, Ts,0 and Te,0 are simulated and experimental temperature before the heating and Ts,30 and Te,30 are simulated and experimental temperature when the fast heating is processed for 30 minutes.
Figure 9 shows the comparison of the numerical results of transient air temperatures and solid surface temperatures with the experimental data of method 1. In a horizontal plane, the modeled and measured air temperature distribution is very uniform, so we selected position 3 for comparison, other positions had the same results approximately. Similar to the cabin air, the envelop surface temperature distribution was also uniform in a horizontal plane. The position of the seat is No.2 as described in the Figure 7b, other positions had the similar relative error level. The relative errors calculated by Equation (7) were all below 15%. All the model predictions were lower than the measured data. There were many reasons. First, the geometry used in the models was simplified from the actual cabin. They had many differences. For example, the supporting structure beneath the seats was neglected due to its limited impact on the air flow [8]. The grid number would be too large without this simplification. Second, many literatures [8,19] show that the airflow distribution in the aircraft cabins was extremely complicated and difficult to model accurately. Besides, it is impossible to obtain absolutely accurate boundary conditions for the flow model of the aircraft cabin [13]. The air flow rate in the first-class cabin used in CFD was measured by HSA (hot-sphere anemometers). Since the HSA could not be placed very close to the diffuser slots, the measured flow rate was lower than the actual value because of the velocity decay from the slots to the HSA probes [13]. Thus, the numerical model is acceptable.

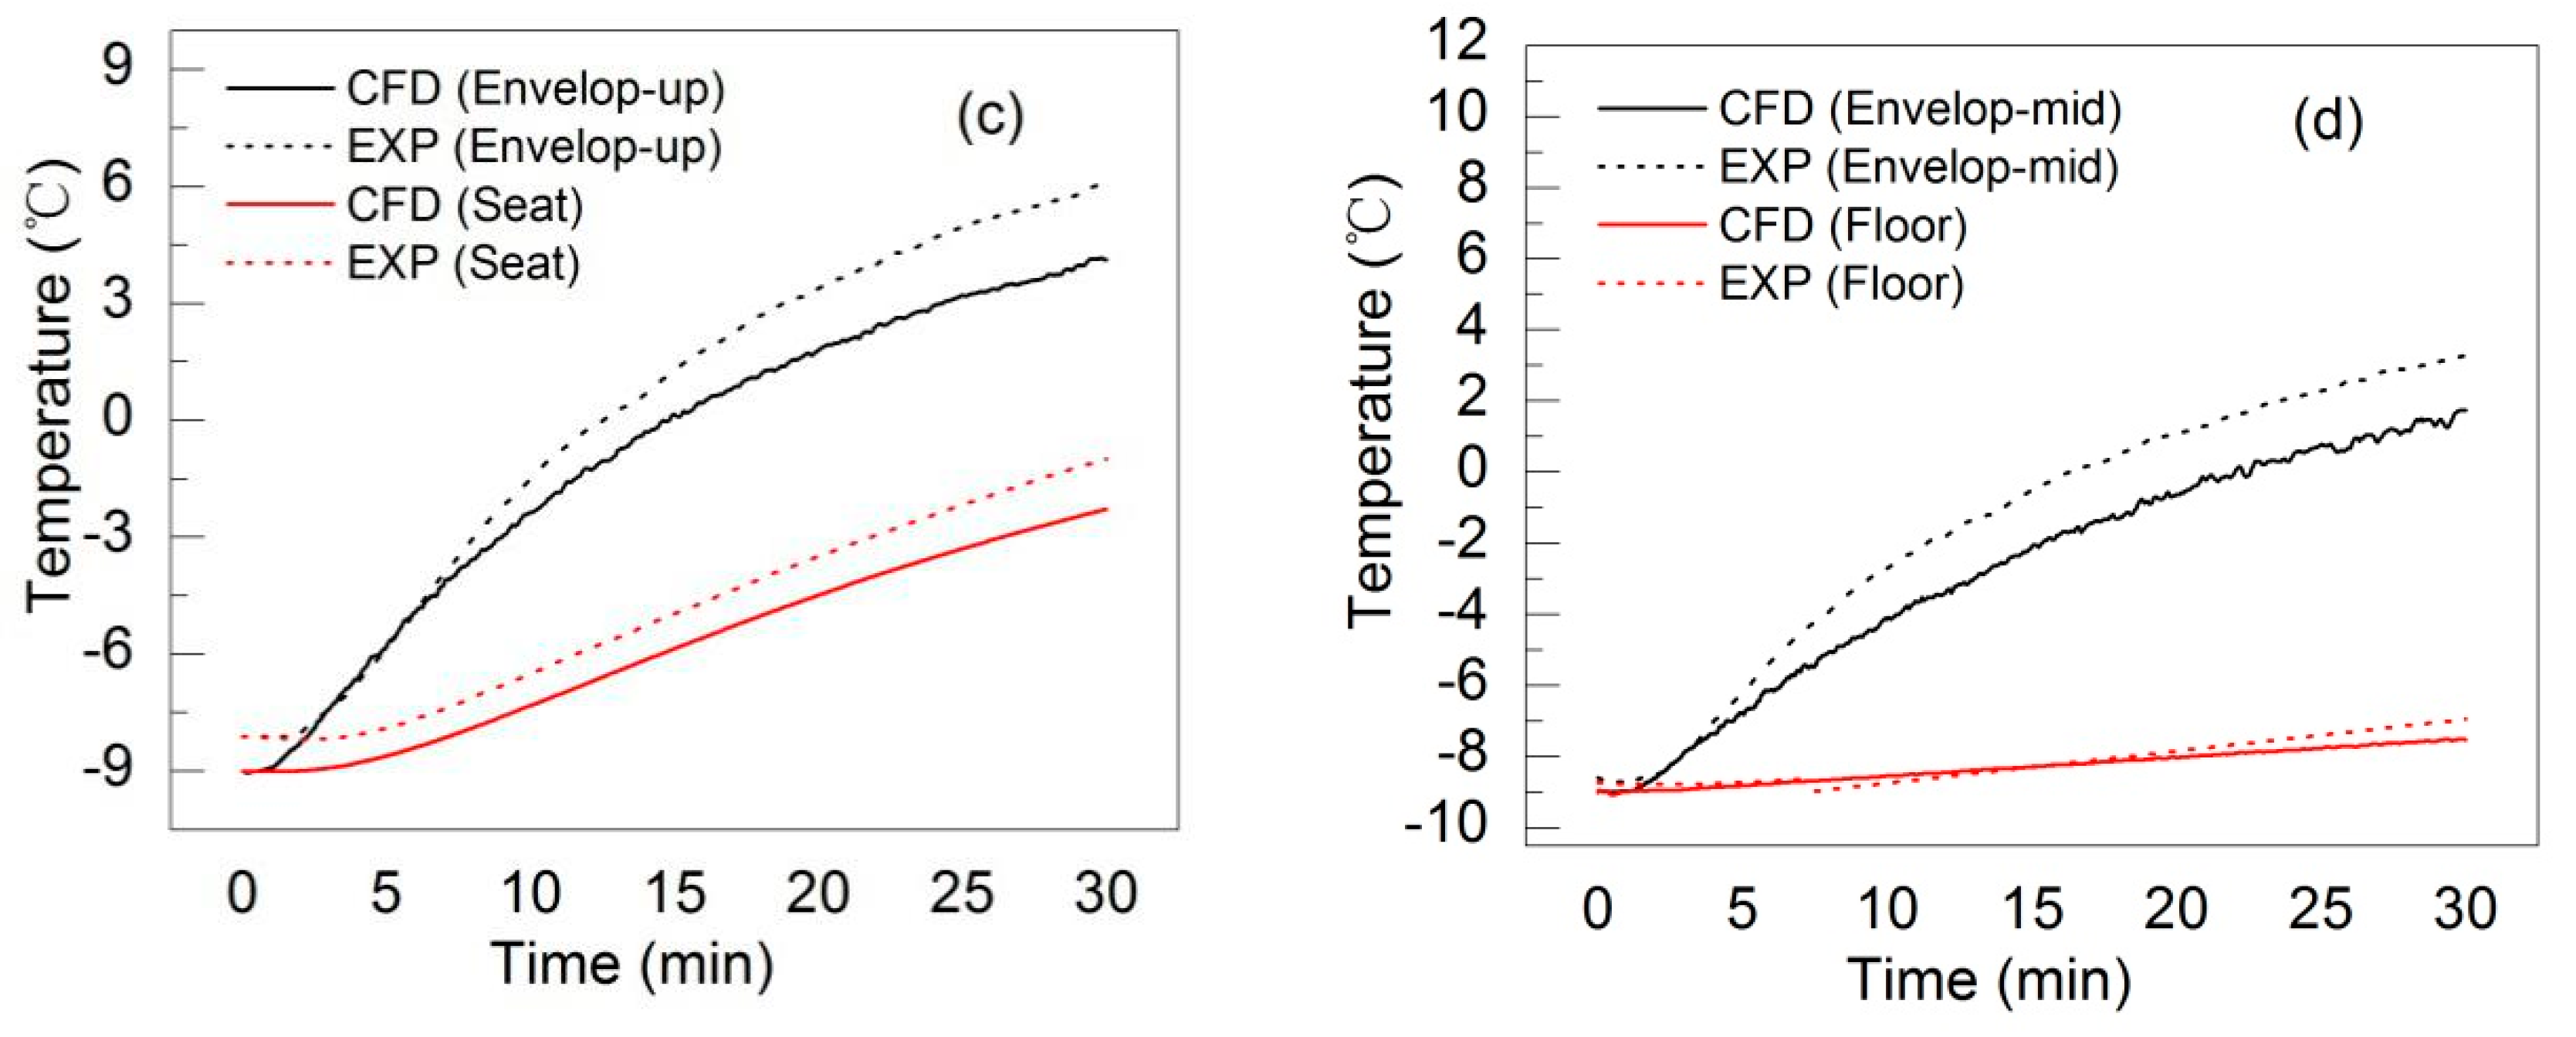
3.2. Method 2: Hot Air with the Electric Heating Blanket

Figure 9 also shows that the air temperature at height of 0.1 m is much lower than that at height of 1.1 m. The vertical temperature difference is still very big, though the hot air is sent into the cabin from the top inlets. Thus, it is better to find a way to heat the air in the bottom area of the cabin except the hot air. The electric blanket is recommended in this study. The parameters were introduced in the experimental description section.
Figure 10 shows the comparison of the numerical results of transient air temperatures and solid surface temperatures with the experimental data when the electric heating blanket is placed on the floor. Similar to the method 1, the position 3 was selected to compare and its relative error by Equation (3) was most obvious due to the effect of the electric heating blanket only being placed on the aisle. The relative errors were all below 15% too. For the two cases, the final air temperatures at the height of 1.1 m and 0.1 m were 6.0 °C and −3.0 °C, 12.8 °C and 7.5 °C, respectively. In comparison to method 1, the final vertical temperature difference in method 2 reduced a lot. Besides, different from method 1, the model predictions of the air temperature at the height of 0.1 m fluctuated obviously. Compared to case 1, method 2 adapted the electric blanket on the floor. As the temperature gradient at the blanket surface was very large, the thermal plume formed near the surface was strong. For the flow field simulation, the strong thermal plume is still a very challenge topic [27]. It needs more study on the CFD theory for the flow with strong boundary thermal plume to solve this problem. Nevertheless, the predictions of the proposed model in this paper are acceptable for engineering applications in the heating process of the aircraft cabin air.

4. Discussion

The above validation of the model for the heating process of the cabin air proved that the model is accurate enough for the engineering application. In this section, the model was used to evaluate the effects of different heating methods under the extreme cold environment, where the atmospheric temperature was −40 °C. The first-class cabin of the MD-82 airliner was still used. Three more cases were discussed. The details are shown in Table 1. Method 3 only increased the temperature of the hot air from the top inlets in comparison to method 1. Method 4 combined method 3 with the electric blanket used in method 2. The area of electric heating blanket was the same to the cabin floor. Actually, the temperature of the supply air from the inlets would decrease to the normal level after the fast heating process. Thus, this situation was considered in method 5, which decreased the supply air temperature after 30 minutes heating.
Figure 11a shows the simulated average air temperatures of the horizontal planes with different height in the first-class cabin of cases 3 and method 4. The air temperatures at the height of 1.1 m and 0.6 m were the same for the two cases except that at the height of 0.1 m. This indicates that the existence of the electric heating blanket had little influence on the air temperature of the upper cabin zone when the electric blanket heating power is not very high. The average air temperatures at the plane of 1.1 m were both 39 °C, while that at the plane of 0.1 m were −20 °C (method 3) and 0 °C (method 4), respectively. The electric blanket was really very effective for heating the air of the bottom area of the aircraft cabin. Figure 11b presents the simulated average air temperatures of the horizontal planes of method 5. The final average air temperature was 15.1 °C and 9.1 °C at the height of 1.1 m and 0.1 m. The vertical temperature difference was reduced a lot to 6 °C compared to that of cases 3 and 4. Though the supply air temperature deceased to 40 °C after 30 minutes, the air temperature in the lower zone kept increasing. In all the simulations, the flow rate of the supply air was not very large due to the limited ability of the available ground air-conditioning cart. A higher flow rate was completely possible to use in the engineering applications. Thus, the final cabin air temperature of the lower zone could be further increased to a very comfortable level for the passengers. These results indicate that the model developed in this paper was very convenient for the analysis of the heating methods for the aircraft cabin air.

5. Conclusions

This study developed an unsteady hybrid CFD model to simulate the fast heating process for the aircraft cabin air. From the results presented in this paper, the following conclusions could be made:
(1) Based on the comparison between the measured and simulated results, the numerical model based on the physical mechanisms of the fast heating process of the aircraft cabin air was acceptable for the engineering application.
(2) The simulated data illustrated that the available ECS could not provide a satisfied thermal environment after heating the airliner cabin for enough time due to the obvious vertical air temperature difference.
(3) Based on the numerical model, we had proposed a hybrid heating method, which utilized an electric heating blanket on the floor and decreased the supplied air temperature if the heating time was long enough. The results described that the vertical temperature difference could be reduced to 6 °C after one hour of heating.

Author Contributions

Conceptualization, Z.Y. and G.W.; methodology, Z.Y. and Z.L.; validation, Z.L.; formal analysis, Z.Y.; investigation, Z.L.; writing—original draft preparation, Z.Y.; writing—review and editing, Z.L.; supervision, G.W.

Funding

This research received no external funding.

Acknowledgments

The research presented in this paper was financially supported by the National Basic Research Program of China (The 973 Program) through grant No. 2012CB720100.

Conflicts of Interest

The authors declare no conflict of interest. The funders had no role in the design of the study; in the collection, analyses, or interpretation of data; in the writing of the manuscript, or in the decision to publish the results.

References

  1. Pang, L.; Qin, Y.; Liu, D.; Liu, M. Thermal comfort assessment in civil aircraft cabins. Chin. J. Aeronaut. 2014, 27, 210–216. [Google Scholar] [CrossRef] [Green Version]
  2. Park, S.; Hellwig, R.T.; Grün, G.; Holm, A. Local and overall thermal comfort in an aircraft cabin and their interrelations. Build. Environ. 2011, 46, 1056–1064. [Google Scholar] [CrossRef]
  3. Cui, W.; Ouyang, Q.; Zhu, Y. Field study of thermal environment spatial distribution and passenger local thermal comfort in aircraft cabin. Build. Environ. 2014, 80, 213–220. [Google Scholar] [CrossRef]
  4. Haghighat, F.; Allard, F.; Megri, A.C.; Blondeau, P.; Shimotakahara, R. Measurement of Thermal Comfort and Indoor Air Quality aboard 43 Flights on Commercial Airlines. Indoor Built Environ. 1999, 8, 58–66. [Google Scholar] [CrossRef]
  5. Ross, D.; Crump, D.; Hunter, C.; Perera, E.; Sheridan, A. Extending cabin air measurements to include older aircraft types utilized in volume short haul operation. Client Rep. 2003, 212034-26. [Google Scholar]
  6. ANSI/ASHRAE Standard 55-2013. Thermal Environment Conditions for Human Occupancy; American National Standards Institute: Washington, DC, USA, 2013. [Google Scholar]
  7. Wu, X.; Olesen, B.W.; Fang, L.; Zhao, J. A nodal model to predict vertical temperature distribution in a room with floor heating and displacement ventilation. Build. Environ. 2013, 59, 626–634. [Google Scholar] [CrossRef]
  8. Liu, W.; Wen, J.; Lin, C.-H.; Liu, J.; Long, Z.; Chen, Q. Evaluation of various categories of turbulence models for predicting air distribution in an airliner cabin. Build. Environ. 2013, 65, 118–131. [Google Scholar] [CrossRef]
  9. Zhang, Z.; Chen, X.; Mazumdar, S.; Zhang, T.; Chen, Q. Experimental and numerical investigation of airflow and contaminant transport in an airliner cabin mockup. Build. Environ. 2009, 44, 85–94. [Google Scholar] [CrossRef] [Green Version]
  10. Lin, C.H.; Horstman, R.; Ahlers, M.; Sedgwick, L.; Dunn, K.; Topmiller, J.; Bennett, J.; Wirogo, S. Numerical simulation of airflow and airborne pathogen transport in aircraft cabins-Part 1: Numerical simulation of the flow field. ASHRAE Trans. 2005, 111, 755–763. [Google Scholar]
  11. Singh, A.; Hosni, M.H.; Horstman, R.H. Numerical simulation of airflow in an aircraft cabin section. ASHRAE Trans. 2002, 108, 1005–1013. [Google Scholar]
  12. Zhang, T.; Chen, Q.Y. Novel air distribution systems for commercial aircraft cabins. Build. Environ. 2007, 42, 1675–1684. [Google Scholar] [CrossRef]
  13. Liu, W.; Wen, J.; Chao, J.; Yin, W.; Shen, C.; Lai, D.; Lin, C.-H.; Liu, J.; Sun, H.; Chen, Q. Accurate and high-resolution boundary conditions and flow fields in the first-class cabin of an MD-82 commercial airliner. Atmos. Environ. 2012, 56, 33–44. [Google Scholar] [CrossRef]
  14. Mizuno, T.; Warfield, M. Development of three-dimensional thermal airflow analysis computer program and verification test. ASHRAE J. 1992, 98, 329–338. [Google Scholar]
  15. Sevilgen, G.; Kilic, M. Three dimensional numerical analysis of temperature distribution in an automobile cabin. Therm. Sci. 2012, 16, 321–326. [Google Scholar] [CrossRef]
  16. Chen, C.; Liu, W.; Li, F.; Lin, C.-H.; Liu, J.; Pei, J.; Chen, Q. A hybrid model for investigating transient particle transport in enclosed environments. Build. Environ. 2013, 62, 45–54. [Google Scholar] [CrossRef]
  17. Gao, N.P.; Niu, J.L. Personalized ventilation for commercial aircraft cabins. J. Aircr. 2008, 45, 508–512. [Google Scholar] [CrossRef]
  18. Isukapalli, S.S.; Mazumdar, S.; George, P.; Wei, B.; Jones, B.; Weisel, C.P. Computational fluid dynamics modeling of transport and deposition of pesticides in an aircraft cabin. Atmos. Environ. 2012, 68, 198–207. [Google Scholar] [CrossRef] [Green Version]
  19. Liu, W.; Mazumdar, S.; Zhang, Z.; Poussou, S.B.; Liu, J.; Lin, C.-H.; Chen, Q. State-of-the-art methods for studying air distributions in commercial airliner cabins. Build. Environ. 2012, 47, 5–12. [Google Scholar] [CrossRef]
  20. Gan, G. Prediction of turbulent buoyant flow using an RNG k-ε model. Numer. Heat Transf. Part A Appl. 1998, 33, 169–189. [Google Scholar] [CrossRef]
  21. Singh, D.; Premachandran, B.; Kohli, S. Numerical Simulation of the Jet Impingement Cooling of a Circular Cylinder. Numer. Heat Transf. Part A Appl. 2013, 64, 153–185. [Google Scholar] [CrossRef]
  22. Isman, M.K.; Pulat, E.; Etemoglu, A.B.; Can, M. Numerical Investigation of Turbulent Impinging Jet Cooling of a Constant Heat Flux Surface. Numer. Heat Transf. Part A Appl. 2008, 53, 1109–1132. [Google Scholar] [CrossRef]
  23. ANSYS Fluent 12.0 Documentation; Fluent Inc.: Lebanon, NH, USA, 2009.
  24. Arpaci, V.S. Conduction Heat Transfer; Addison-Wesley: Boston, MA, USA, 1966. [Google Scholar]
  25. Patankar, S. Heat Transfer and Fluid Flow Numerical Simulation; Hemisphere Publishing Corporation: Washington, DC, USA, 1980. [Google Scholar]
  26. Costa, M.; Buddhi, D.; Oliva, A. Numerical simulation of a latent heat thermal energy storage system with enhanced heat conduction. Energy Convers. Manag. 1998, 39, 319–330. [Google Scholar] [CrossRef]
  27. Zelensky, P.; Bartak, M.; Hensen, J.L.M.; Vavricka, R. Influence of turbulence model on thermal plume in indoor air flow simulation. In Proceedings of the 11th REHVA World Congress & 8th international Conference on IAQVEC (CLIMA 2013), Energy efficient, smart and healthy buildings, Prague, Czech Republic, 16–19 June 2013. [Google Scholar]
Figure 1. Description of the physical model for the cabin air heating process.
Energies 12 03565 g001
Figure 2. Description of the cabin seat model for the heating process.
Energies 12 03565 g002
Figure 3. Description of the electric heating blanket model for the heating process.
Energies 12 03565 g003
Figure 4. The flow chart of fast heating simulation of the aircraft cabin air.
Energies 12 03565 g004
Figure 5. Model of the first-class cabin of the MD-82 aircraft.
Energies 12 03565 g005
Figure 6. Sampled points of air temperature in the experimental cabin. (a) horizontal direction; (b) vertical direction
Energies 12 03565 g006
Figure 7. Sampled points of surface temperature in the experimental cabin. (a) surface temperature of side wall; (b) surface temperature of seat.
Energies 12 03565 g007
Figure 8. The measured air temperature curves for the inlets and outlets.
Energies 12 03565 g008
Figure 9. Comparison of the numerical results of transient air temperatures (a,b) and solid surface temperatures (c,d) with the experimental data of the method 1.
Energies 12 03565 g009aEnergies 12 03565 g009b
Figure 10. Comparison of the numerical results of transient air temperatures (a,b) and solid surface temperatures (c,d) with the experimental data of the method 2.
Energies 12 03565 g010
Figure 11. Simulated unsteady air temperatures without (method 3) and with (methods 4 and 5) an electric heating blanket in the heating process. (a) average air temperatures of the horizontal planes with different height in the first-class cabin of cases 3 and method 4.; (b) average air temperatures of the horizontal planes of method 5.
Energies 12 03565 g011
Table 1. The details of the other three heating methods.
Case No.Electric Blanket (W/m2)Heating Time (min)Supplied Air Temperature (°C)
Method 303075
Method 43503075
Method 5400550–30 min: 75, 30–55 min: 40

