A Comprehensive Method for Subsidence Prediction on Two-Seam Longwall Mining


Abstract
1. Introduction
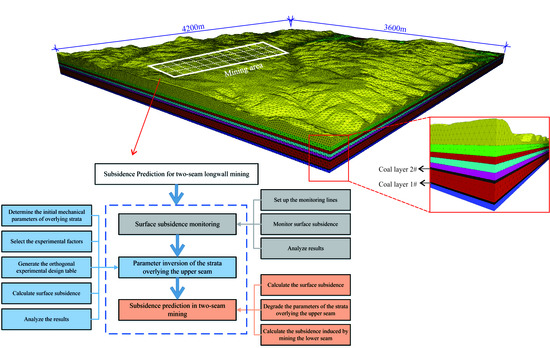
2. Methodology
2.1. Surface Subsidence Monitoring
- (1)
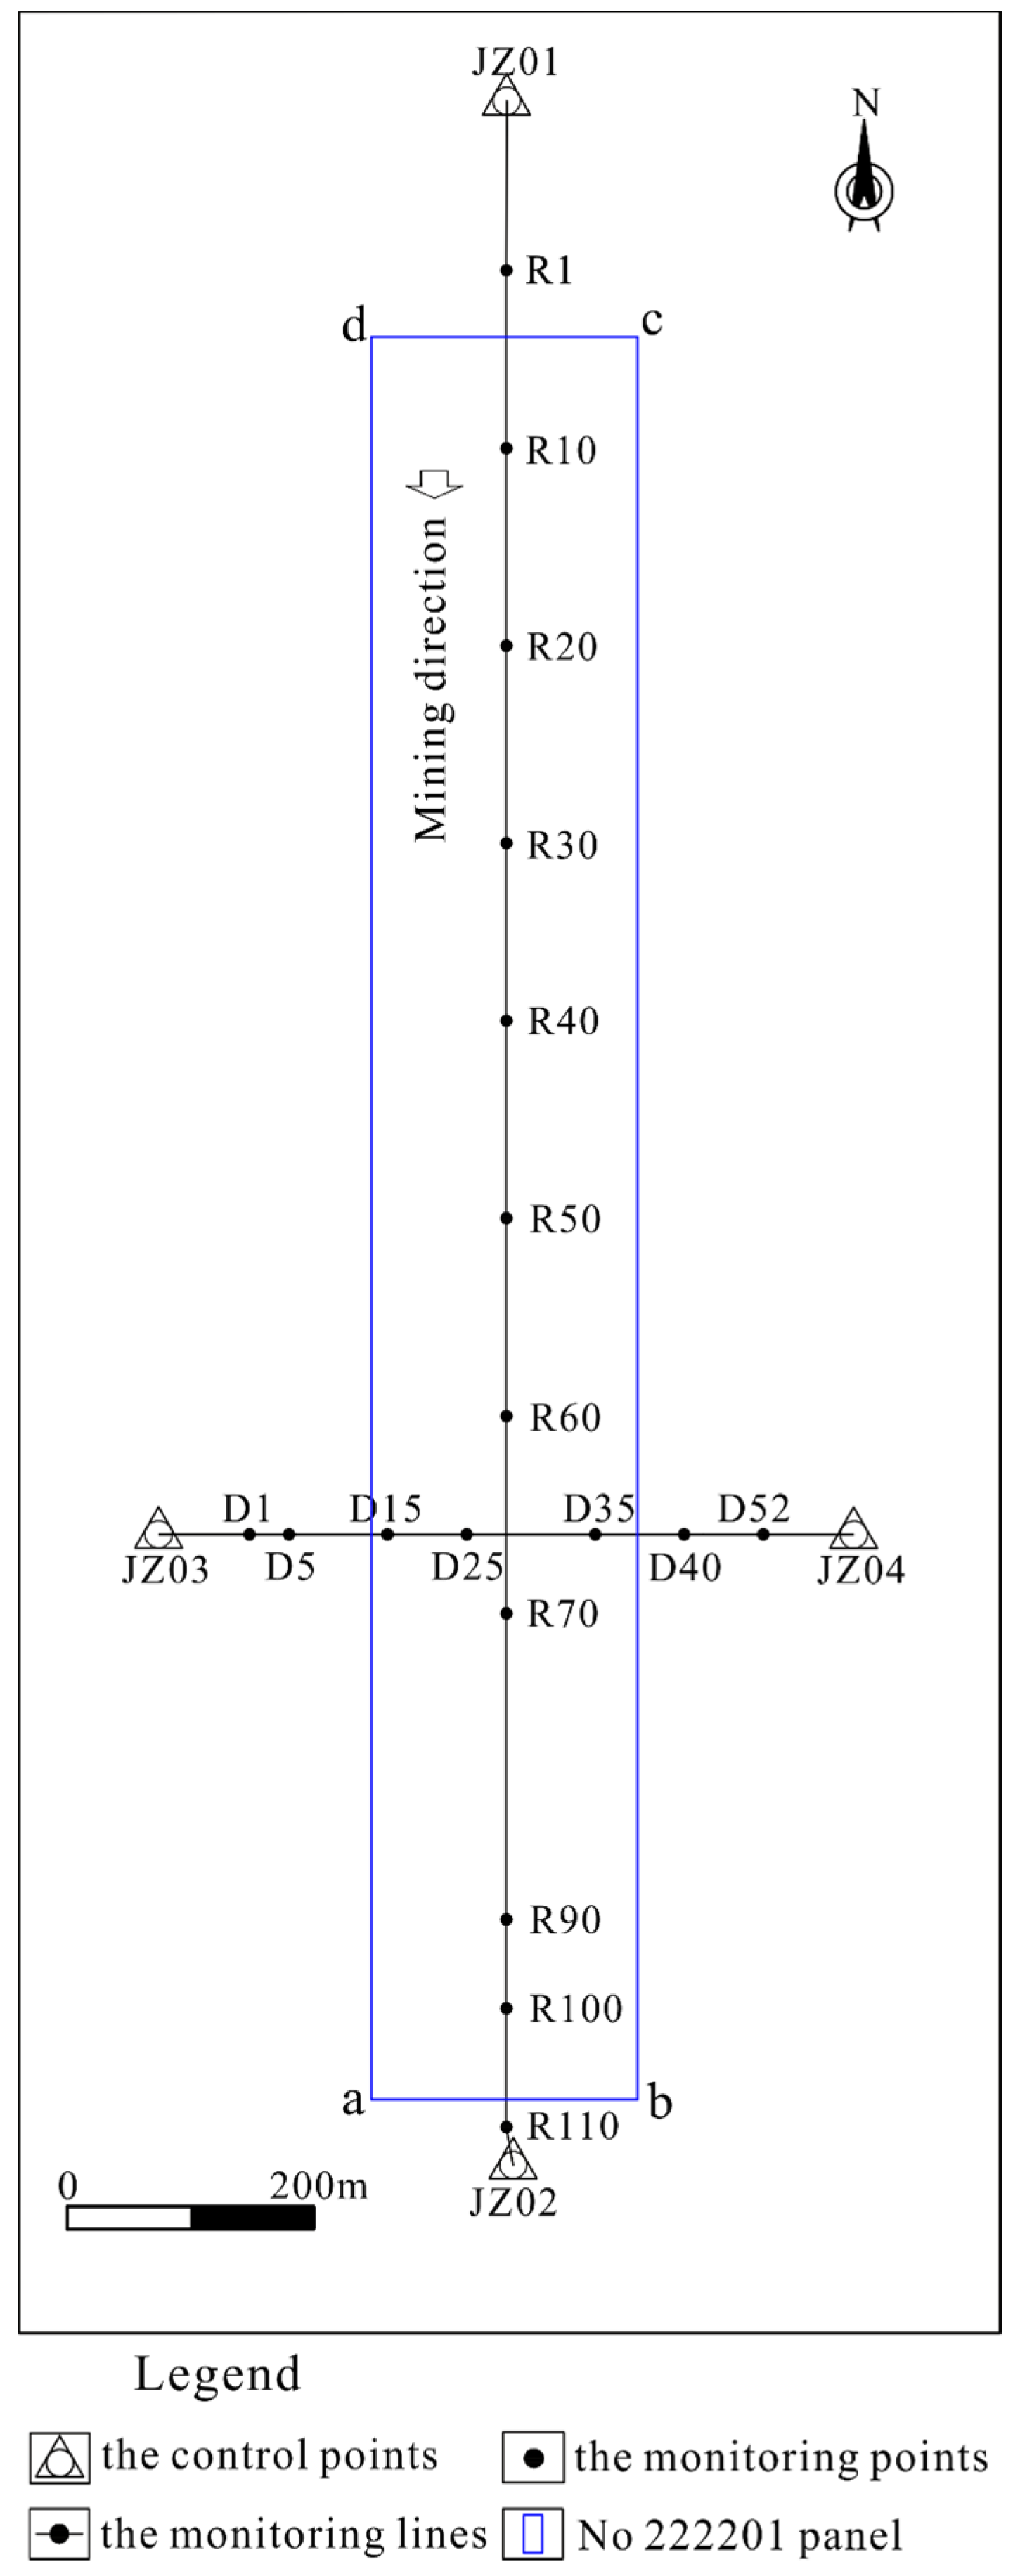
- Set up the monitoring lines. The layout of monitoring lines is generally composed of two crossed lines. One extends along the mining direction of the coal seam, and the other runs perpendicular to the mining direction. Each monitoring line is mainly composed of the control points and monitoring points. The control points are established far from the subsidence area, so they are stable and reliable. The monitoring points are set within the subsidence area.
- (2)
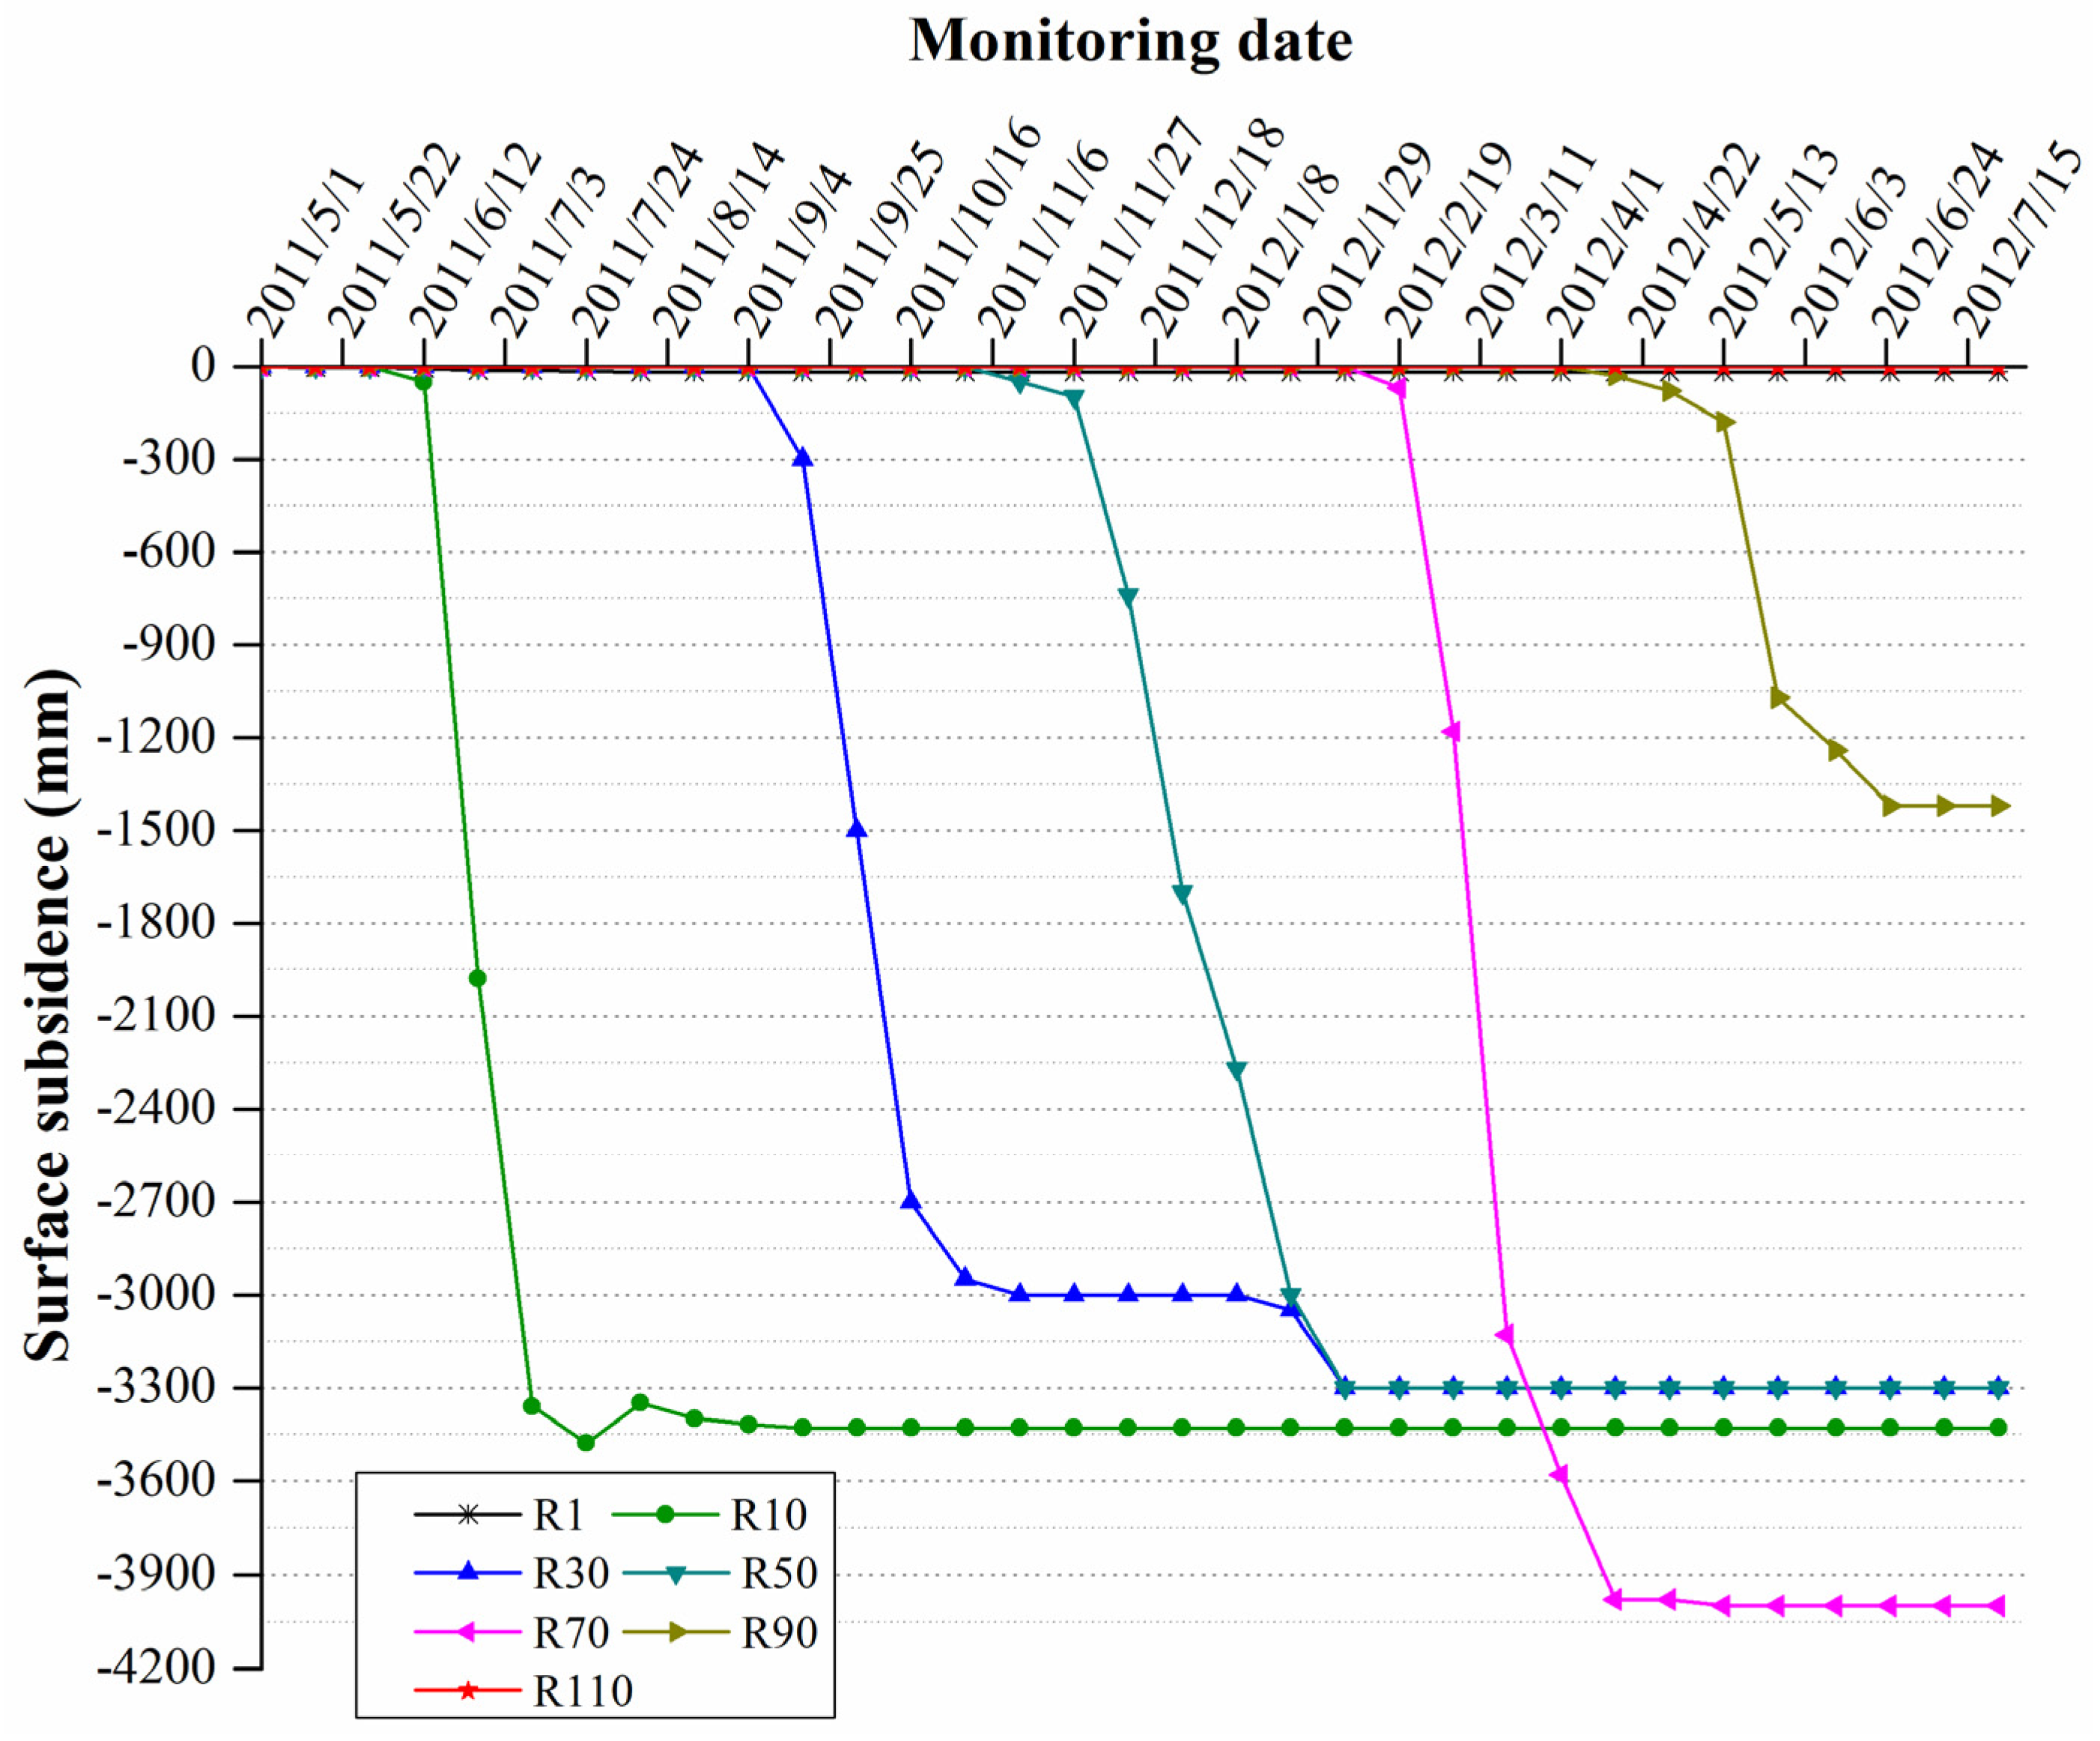
- Monitor surface subsidence. This step mainly consists of measuring the elevation of the monitoring points. The monitoring generally proceeds for longer than one year. The measurement is carried out every 7–10 days. For monitoring points with large subsidence, the measurement frequency should be increased. It can be considered that the entire subsidence of underground mining is completed if the subsidence of each monitoring point increases by less than 30 mm every 6 months.
- (3)
- Analyze result. The mining subsidence can be obtained by calculating the difference of elevation data measured before and after mining.
2.2. Parameter Inversion of the Strata Overlying the Upper Seam
- (1)
- Determine the initial mechanical parameters of overlying strata. The initial mechanical parameters can be determined by laboratory tests, including tests for density (ρ), tensile strength (σt), compressive strength (σbc), modulus of elasticity (E), Poisson’s ratio (μ), cohesion force (c), and angle of internal friction (φ).
- (2)
- Select the experimental factors. The Mohr-Coulomb yielding criterion, which is adopted in this study, can reasonably predict large strata deformation induced by coal-seam mining [21]. Four parameters are considered in this criterion, E, μ, c and φ, which are chosen as the experimental factors.
- (3)
- Select the experimental indicator. The ratio of average surface subsidence (RASS) is defined as the ratio of the average subsidence obtained by monitoring to the average subsidence obtained by numerical simulation. The RASS is adopted as the experimental indicators in this study because it is not susceptible to changes in strata parameters and it can also be obtained in other specific ways, such as field measurement.
- (4)
- Generate the orthogonal experimental design table. An orthogonal experimental design table with multiple factors and multiple levels is established according to the orthogonal experimental design theory. The multiple factors refer to the 4 experimental factors (i.e., E, μ, c and φ), and multiple levels mean that each experimental factor will have different gradients.
- (5)
- Calculate surface subsidence. First, establish the 3D geology model. Second, assign the 4 experimental factors (i.e., E, μ, c and φ) obtained from different schemes of the orthogonal experimental design table to the numerical model. Finally, calculate the surface subsidence to obtain the RASS of each scheme. During the numerical simulation, factors such as boundary conditions and mesh size are all the same, and only the 4 experimental factors (i.e., E, μ, c and φ) will change according to the different schemes.
- (6)
- Analyze the results. When the RASS is closer to 1, the result of this simulation scheme is closer to reality. After comparing the RASS results of different schemes, the factors of the scheme whose RASS is closest to 1 are selected as the optimal parameters of the overlying strata.
2.3. Subsidence Prediction in Two-Seam Mining
- (1)
- Calculate the surface subsidence induced by mining the upper seam (S1) through numerical simulation.
- (2)
- Degrade the parameters of the strata overlying the upper seam. The stress state of the rock overlying the upper seam will redistribute after the mining of the upper seam. The rock will yield if the stress exceeds its strength. Therefore, it is necessary to carry out the parameter degradation of the yielded rock when calculating the subsidence induced by mining the lower seam. In this study, when carrying out the numerical simulation in FLAC3D 5.0 (V5.0, Itasca, Minnesota, USA), the E of yielded rock is reduced by 99.5%, while other parameters are unchanged, according to Ghabraie et al. [21]; the corresponding code is provided in Supplementary Materials.
- (3)
- Calculate the subsidence induced by mining the lower seam (S2). By assigning the degraded parameters to the numerical model, S2 can be calculated. Then, by adding the former subsidence (S1), the final subsidence induced by two-seam mining (S) can be defined as S = S1 + S2.
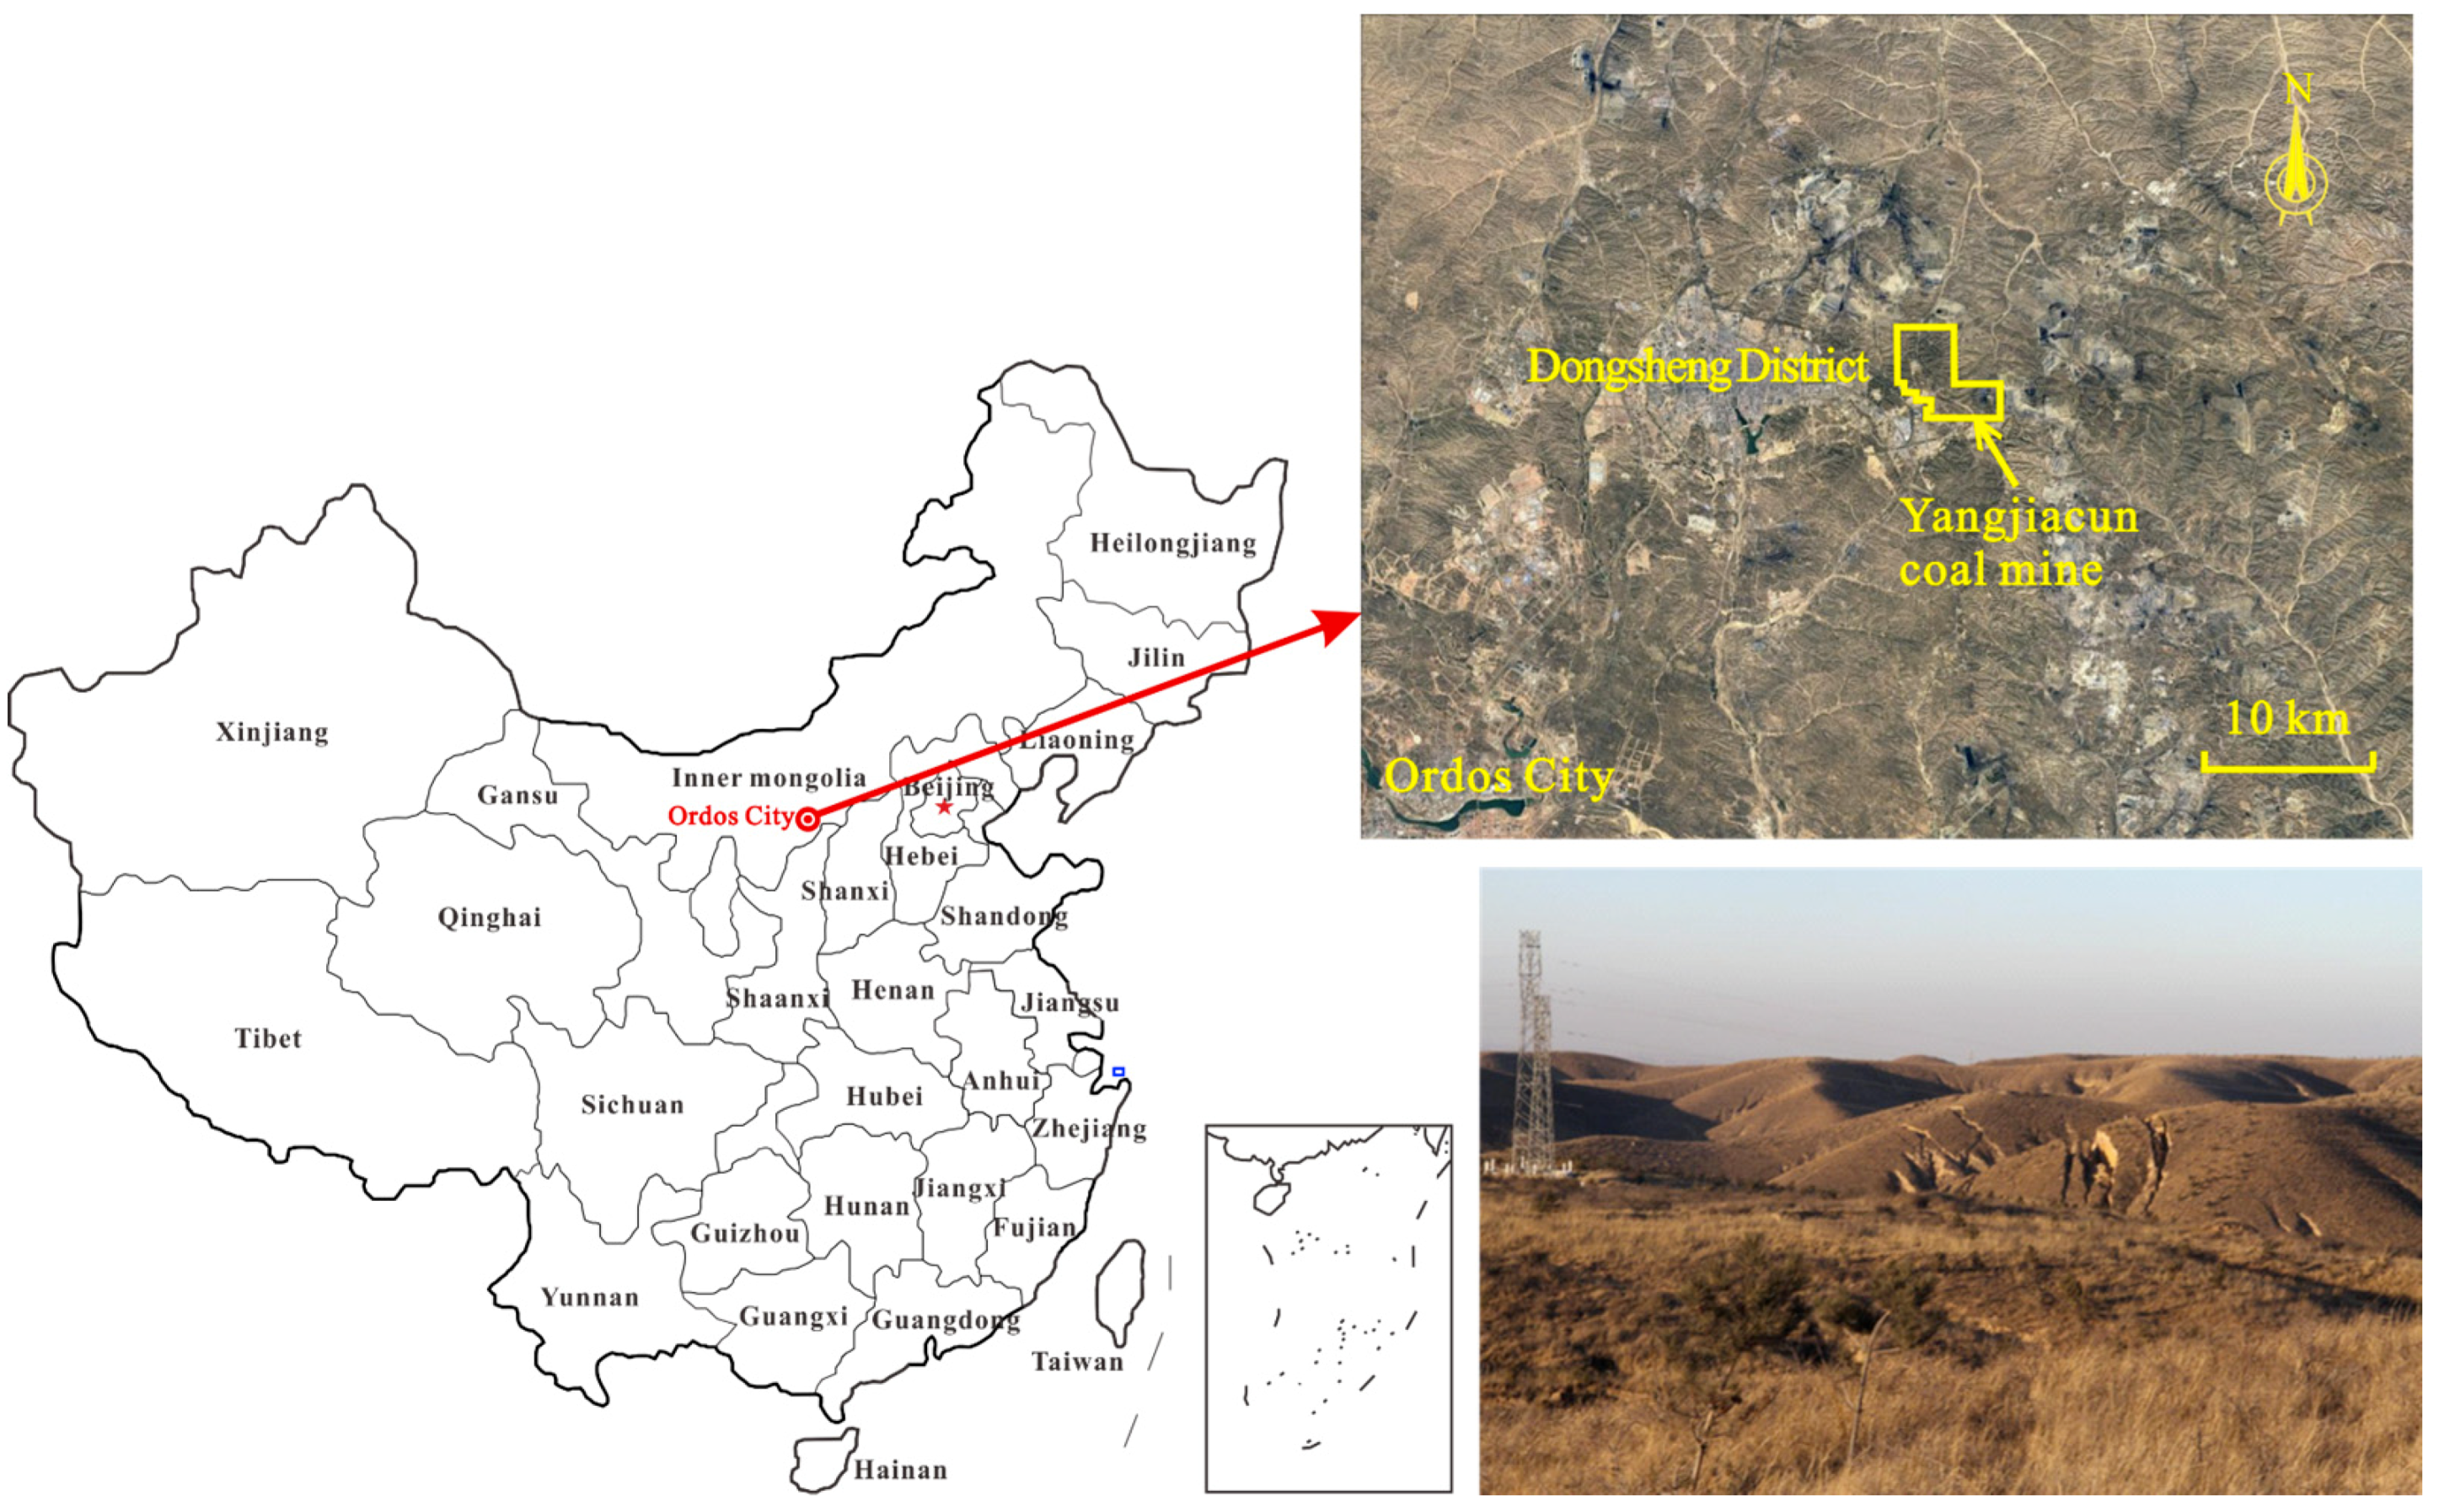
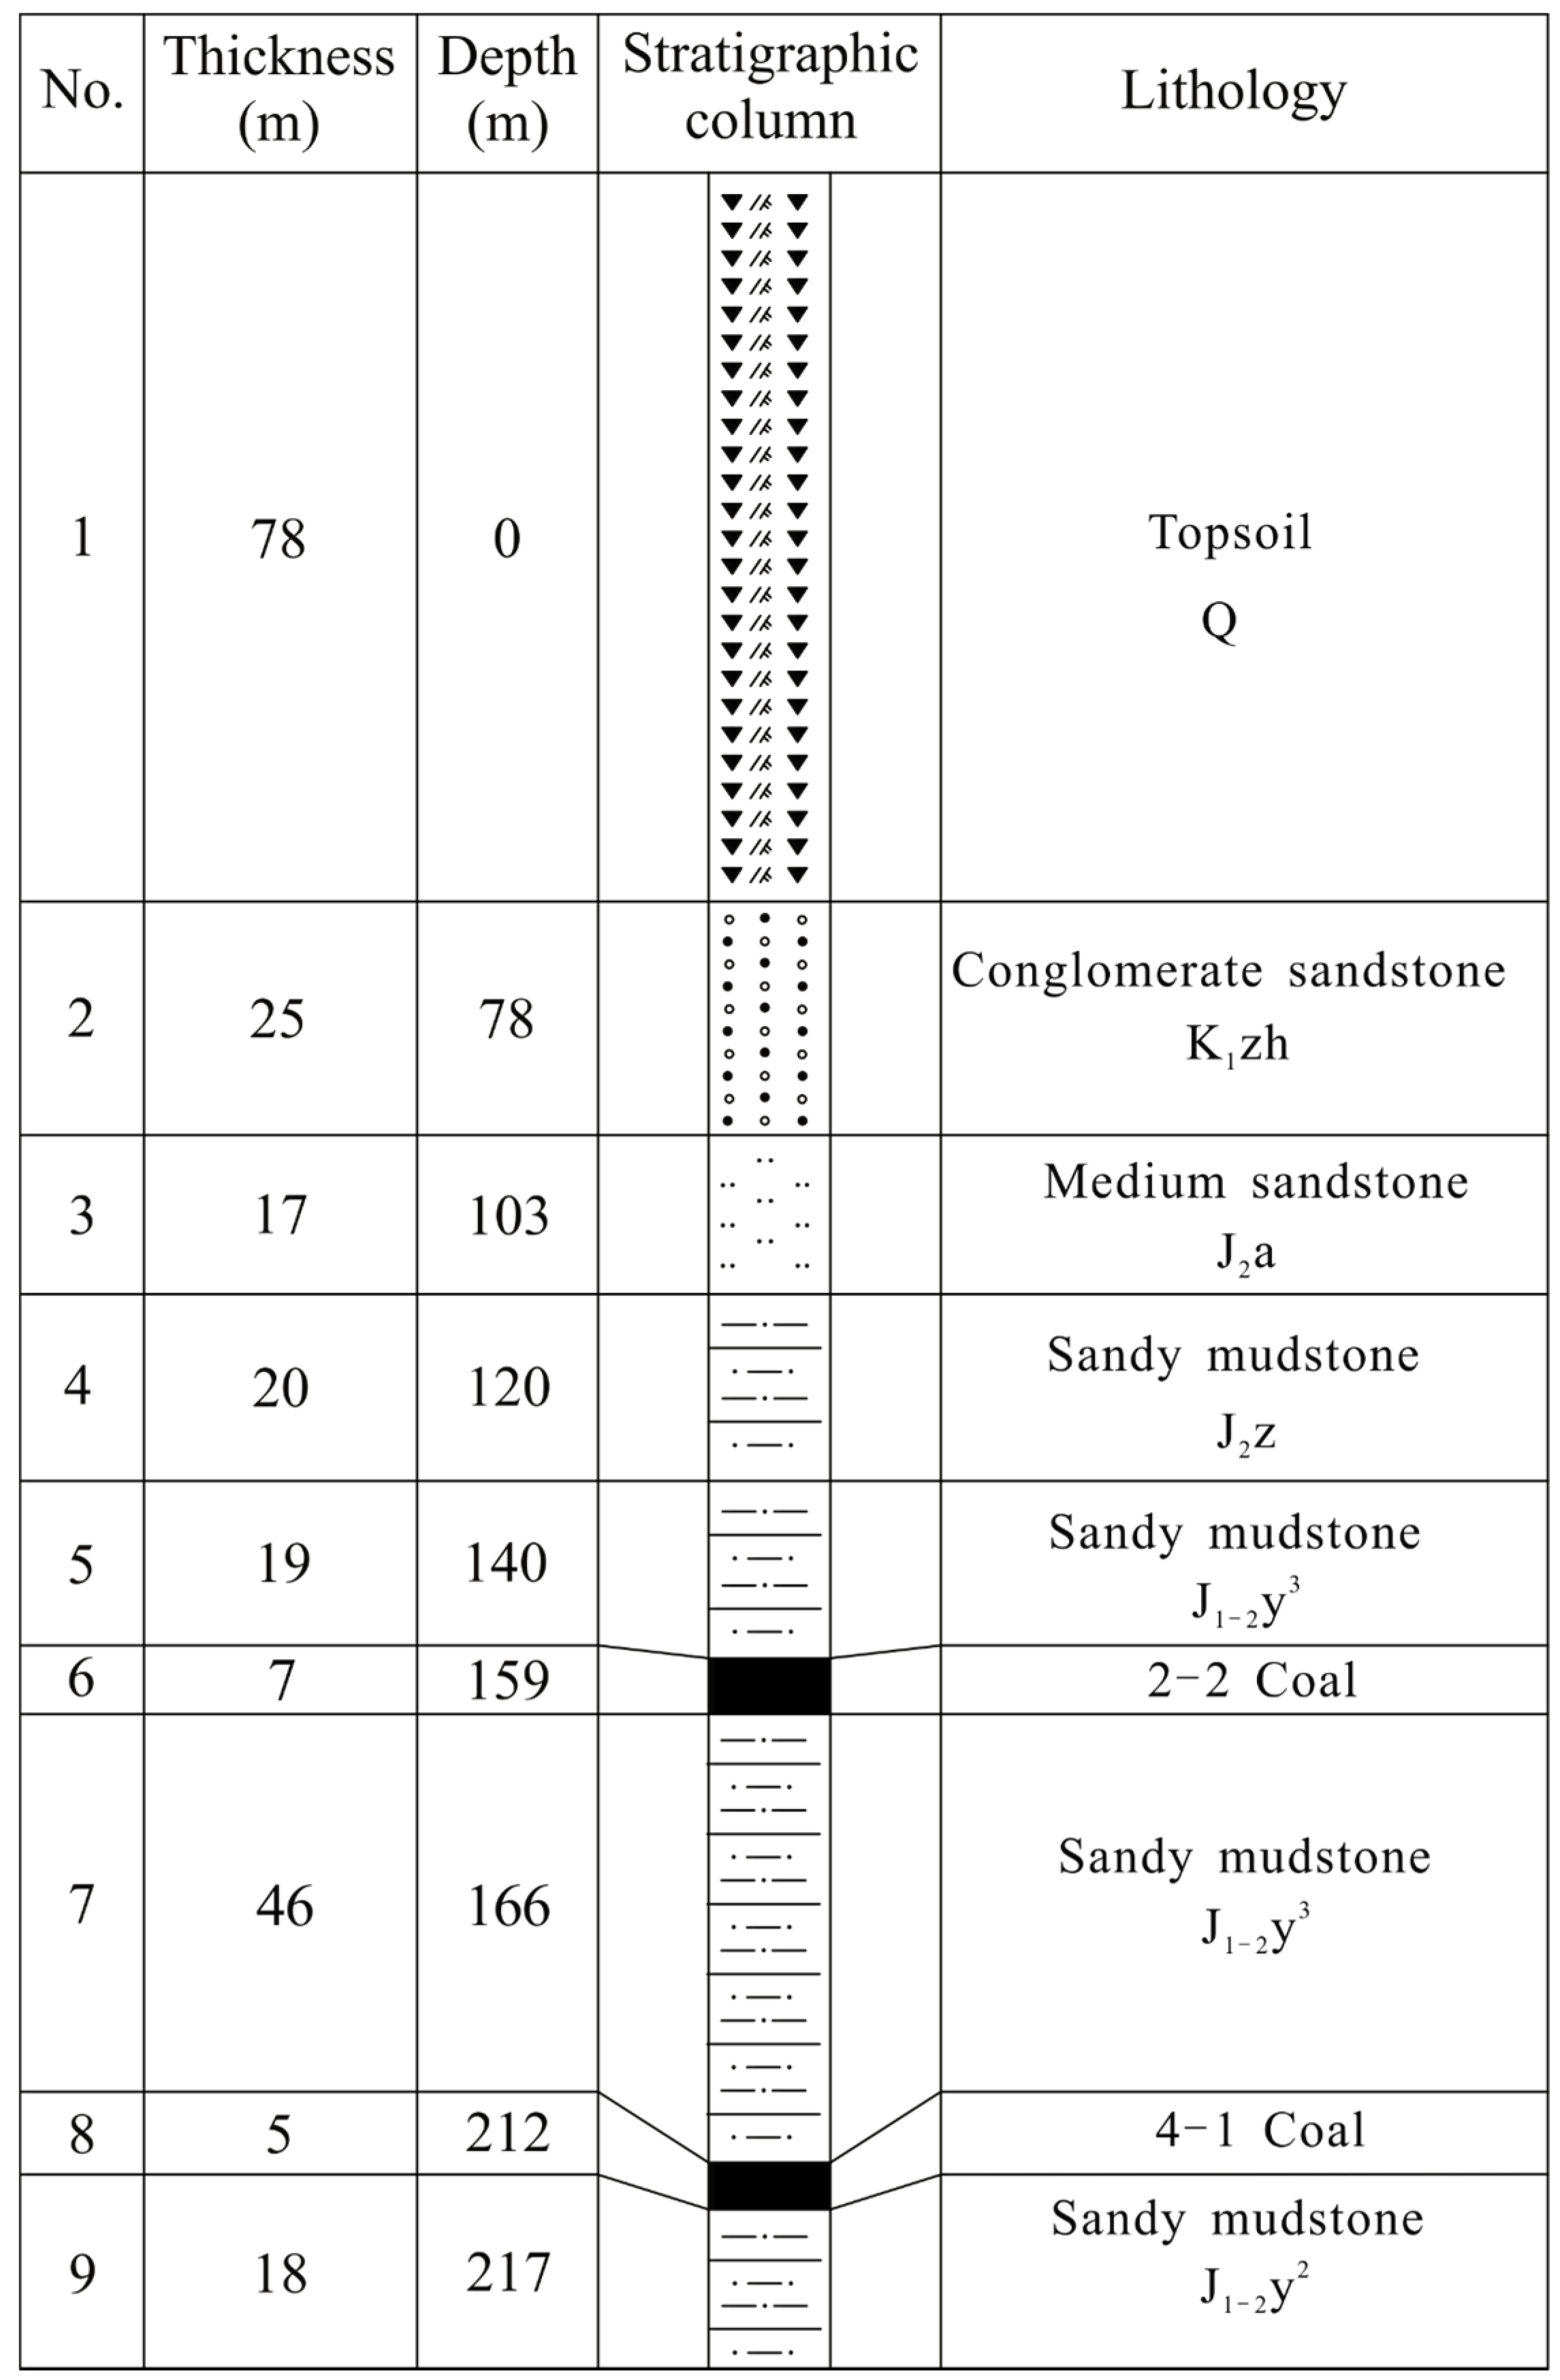
3. Case Study
3.1. Geology and Mining History of the Site
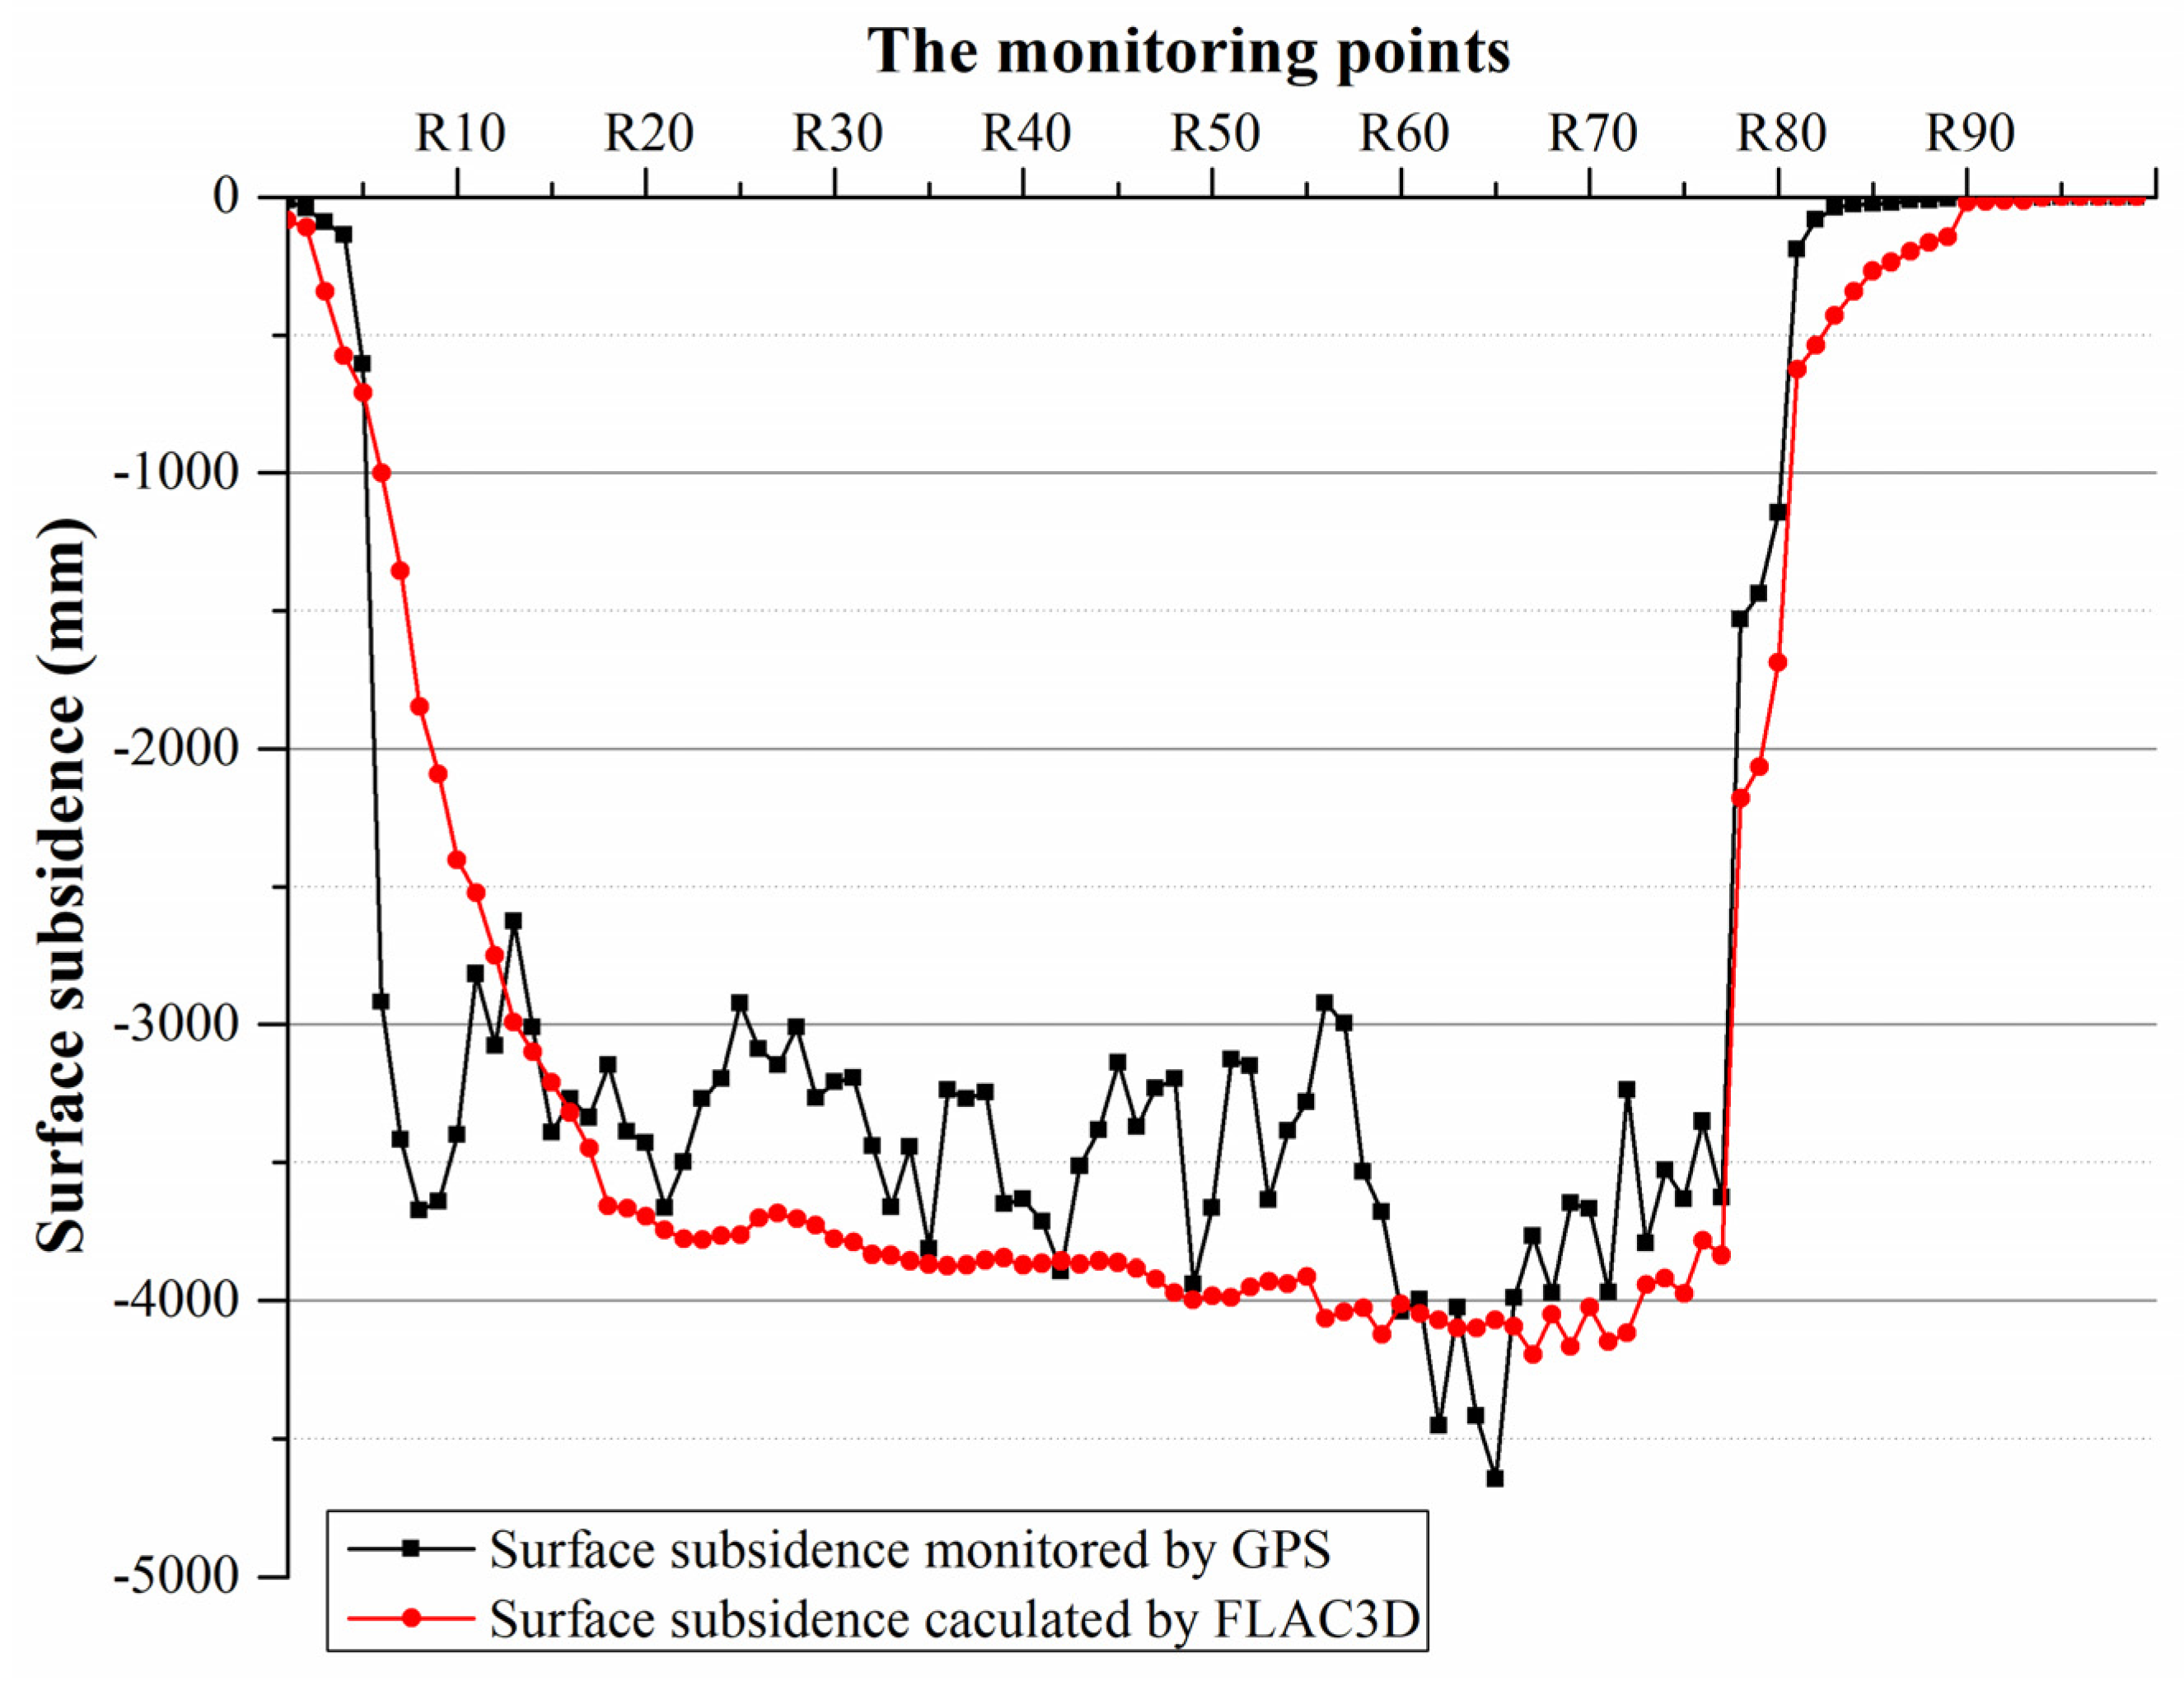
3.2. Surface Subsidence Monitoring
- (1)
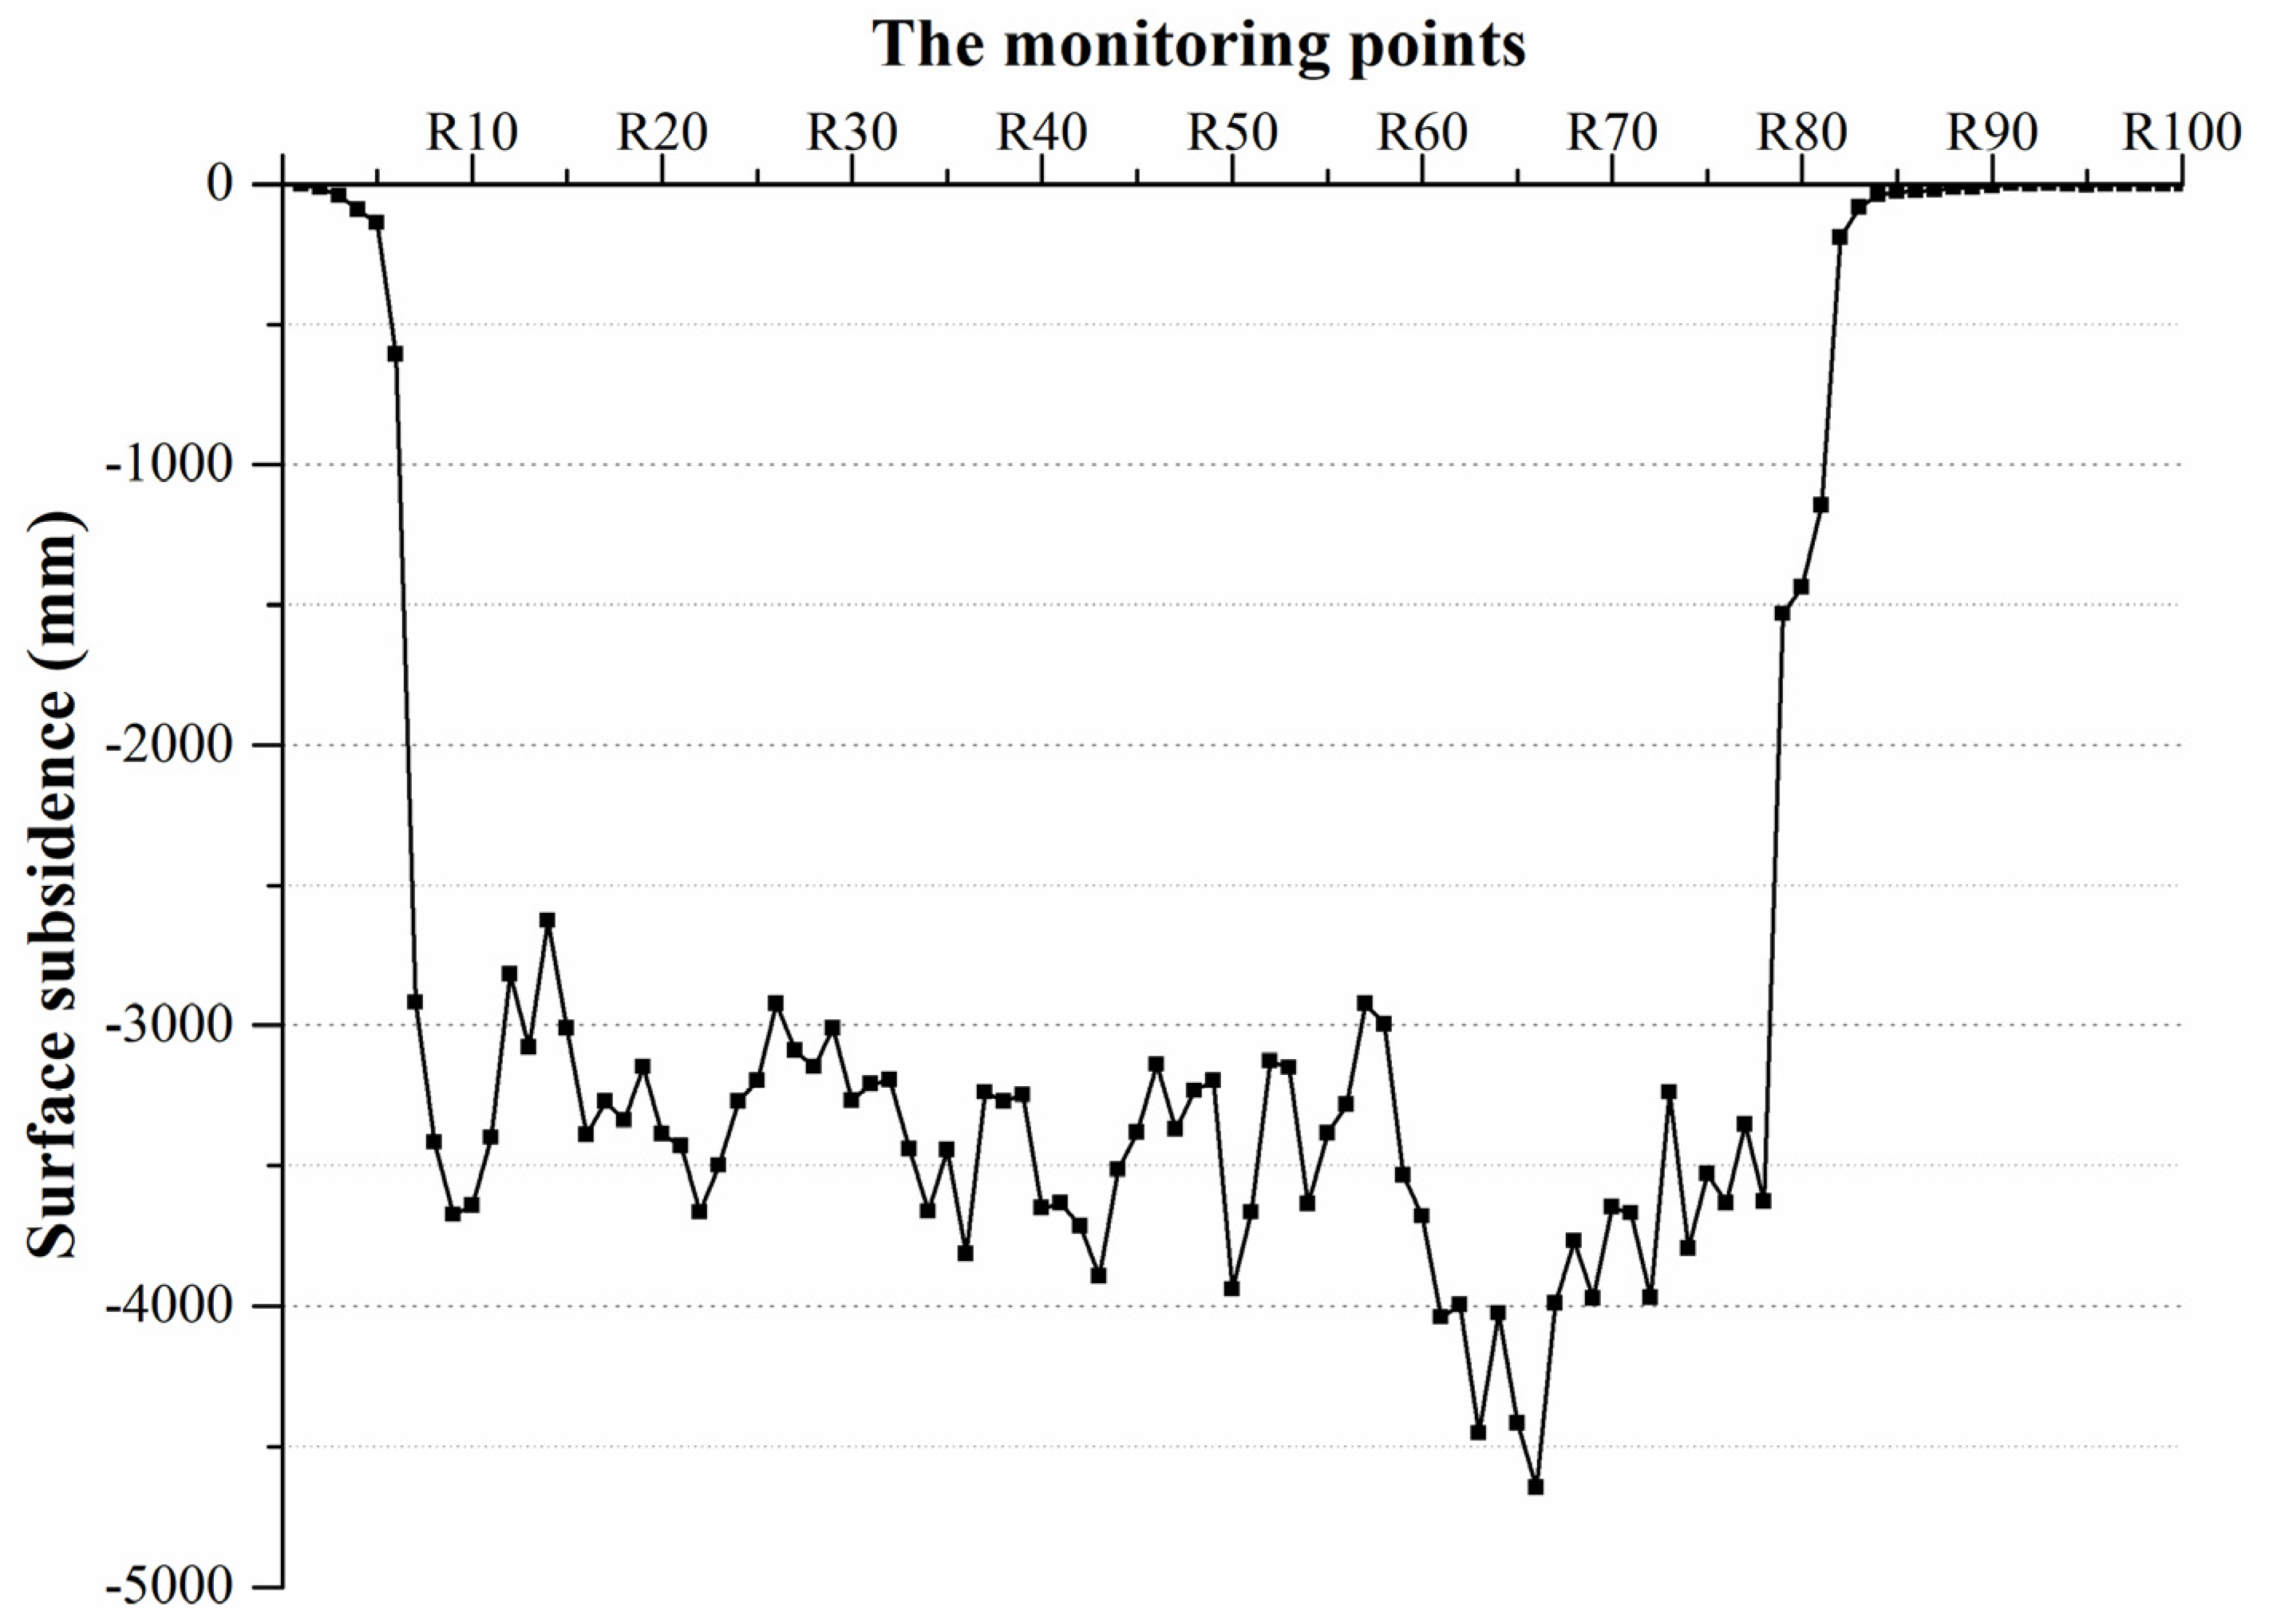
- Because of the small H/M (smaller than 50), the maximum surface subsidence on the R line reached 4.7 m, which occurred at point R68.
- (2)
- The subsidence result of the R line shows a U-shaped characteristic, which is similar to the subsidence result of the Huainan coal mine in Anhui Province [33].
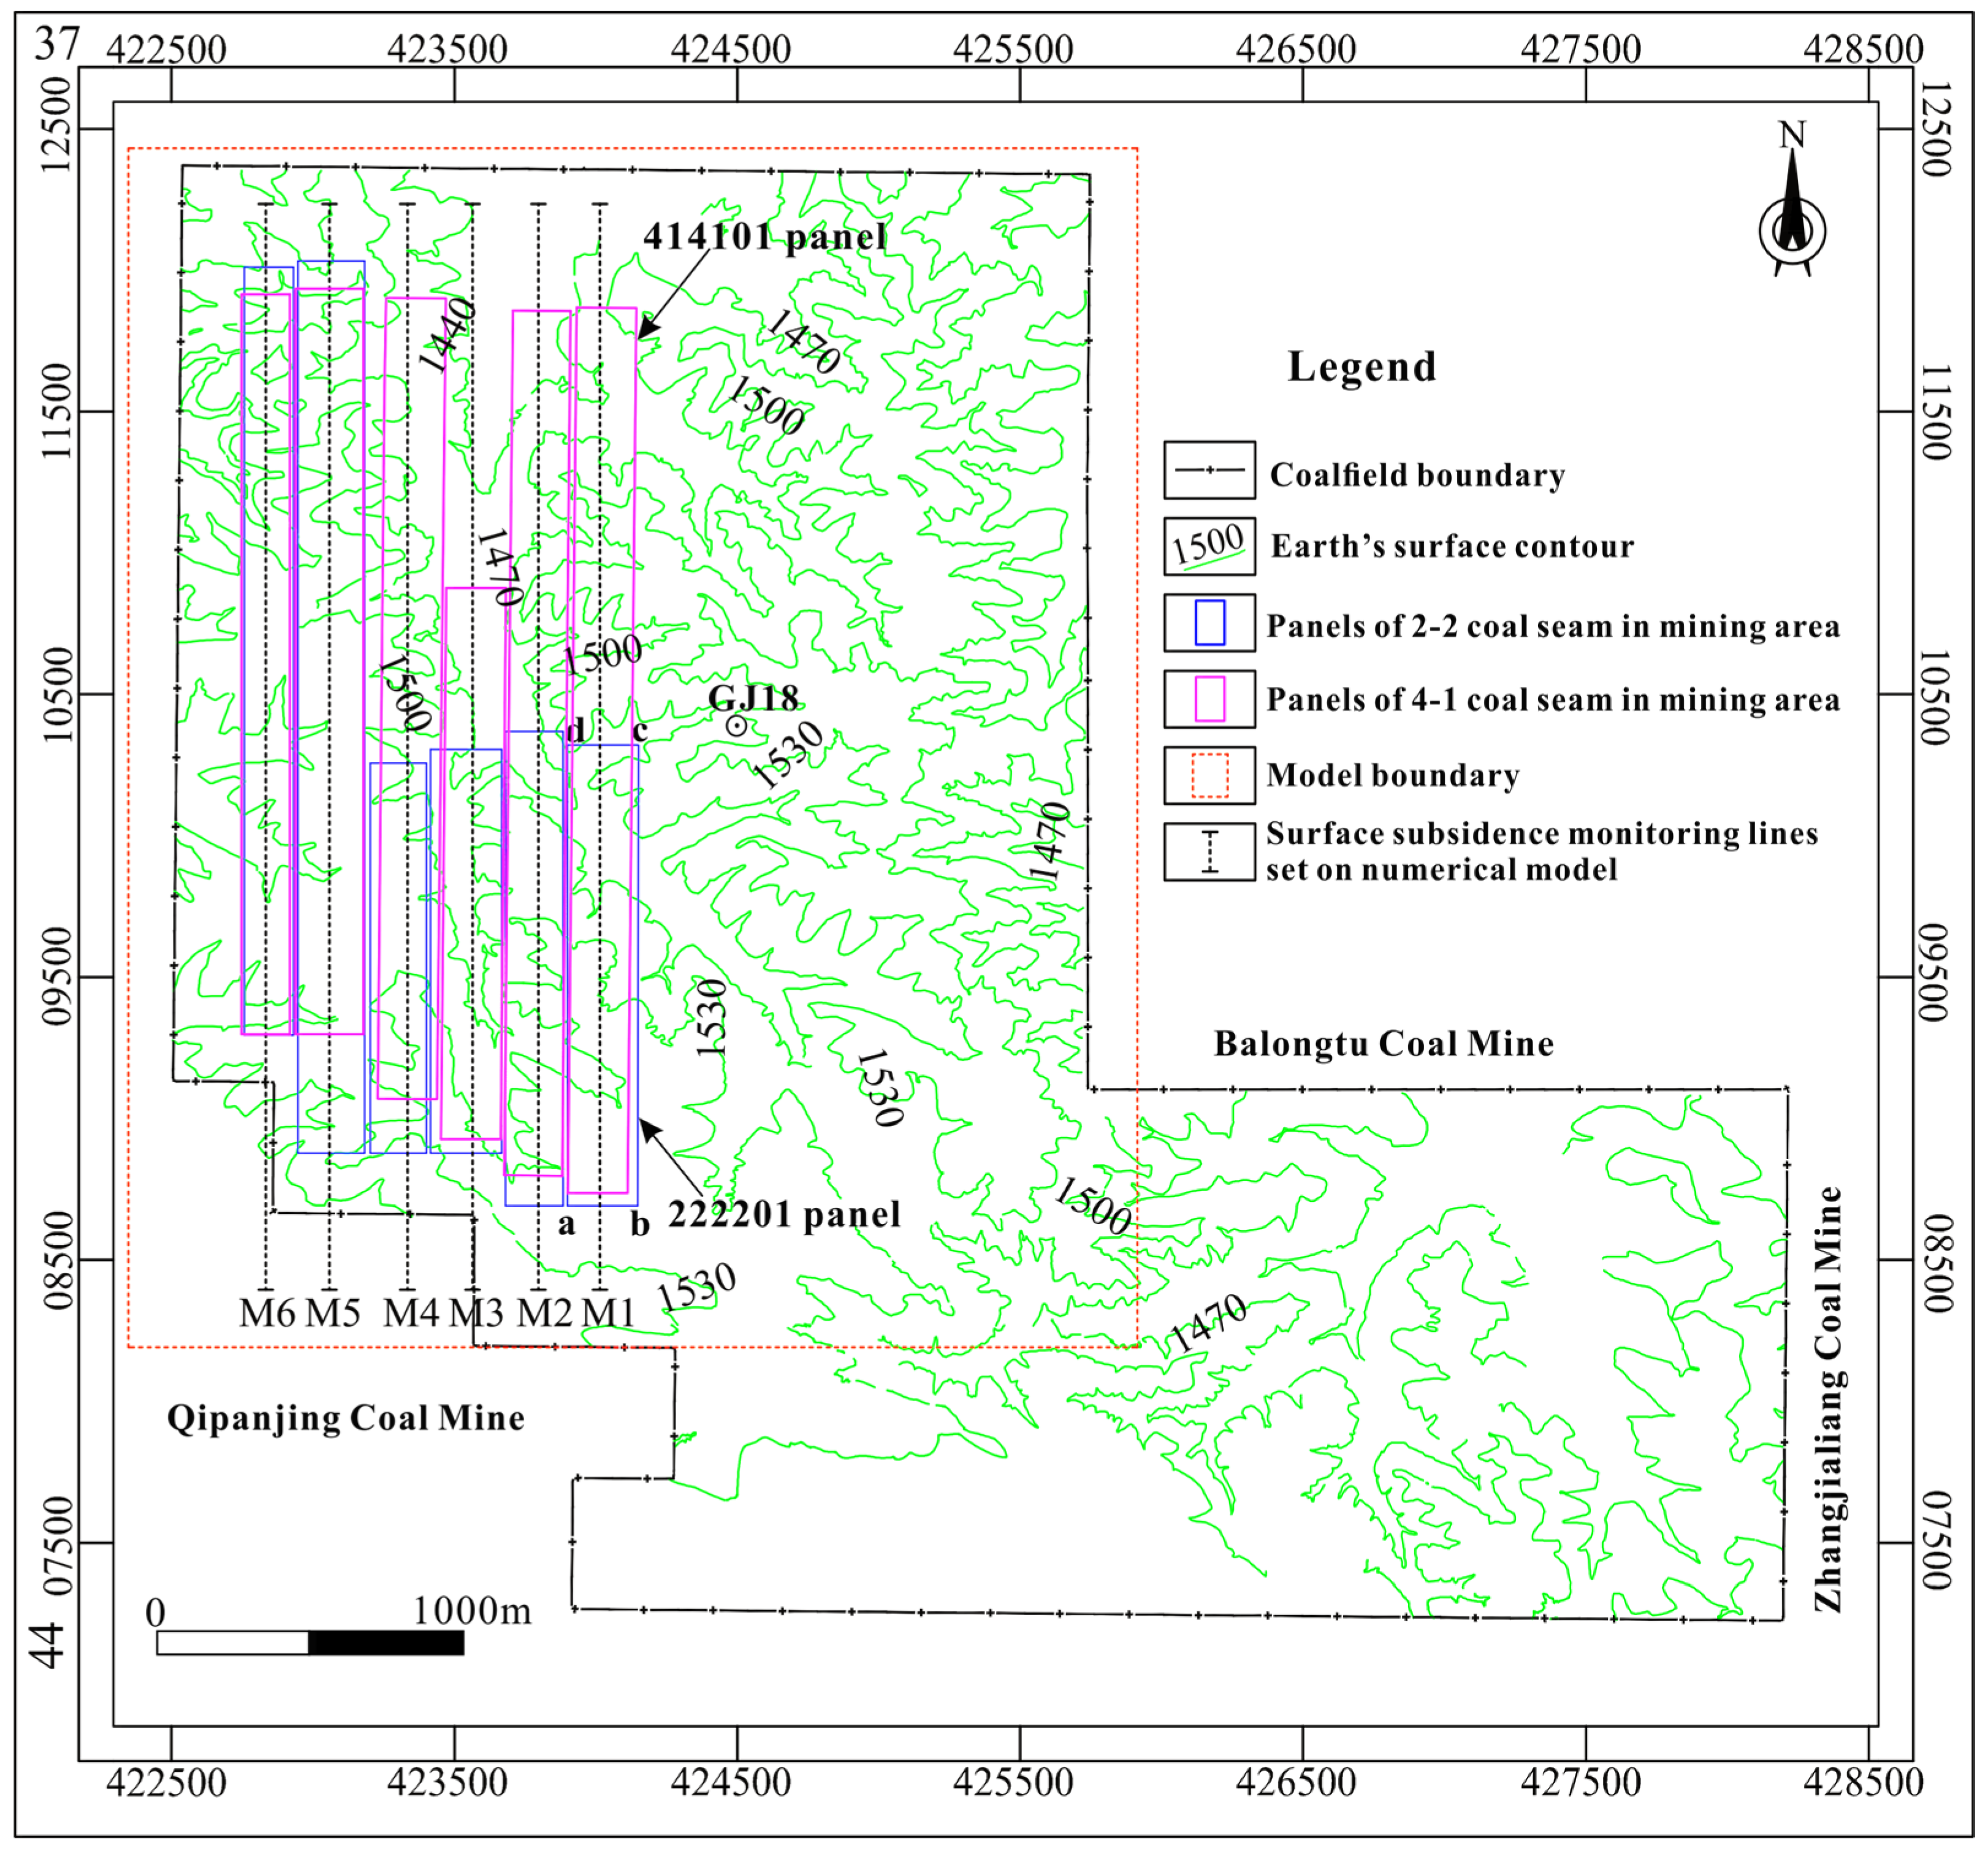
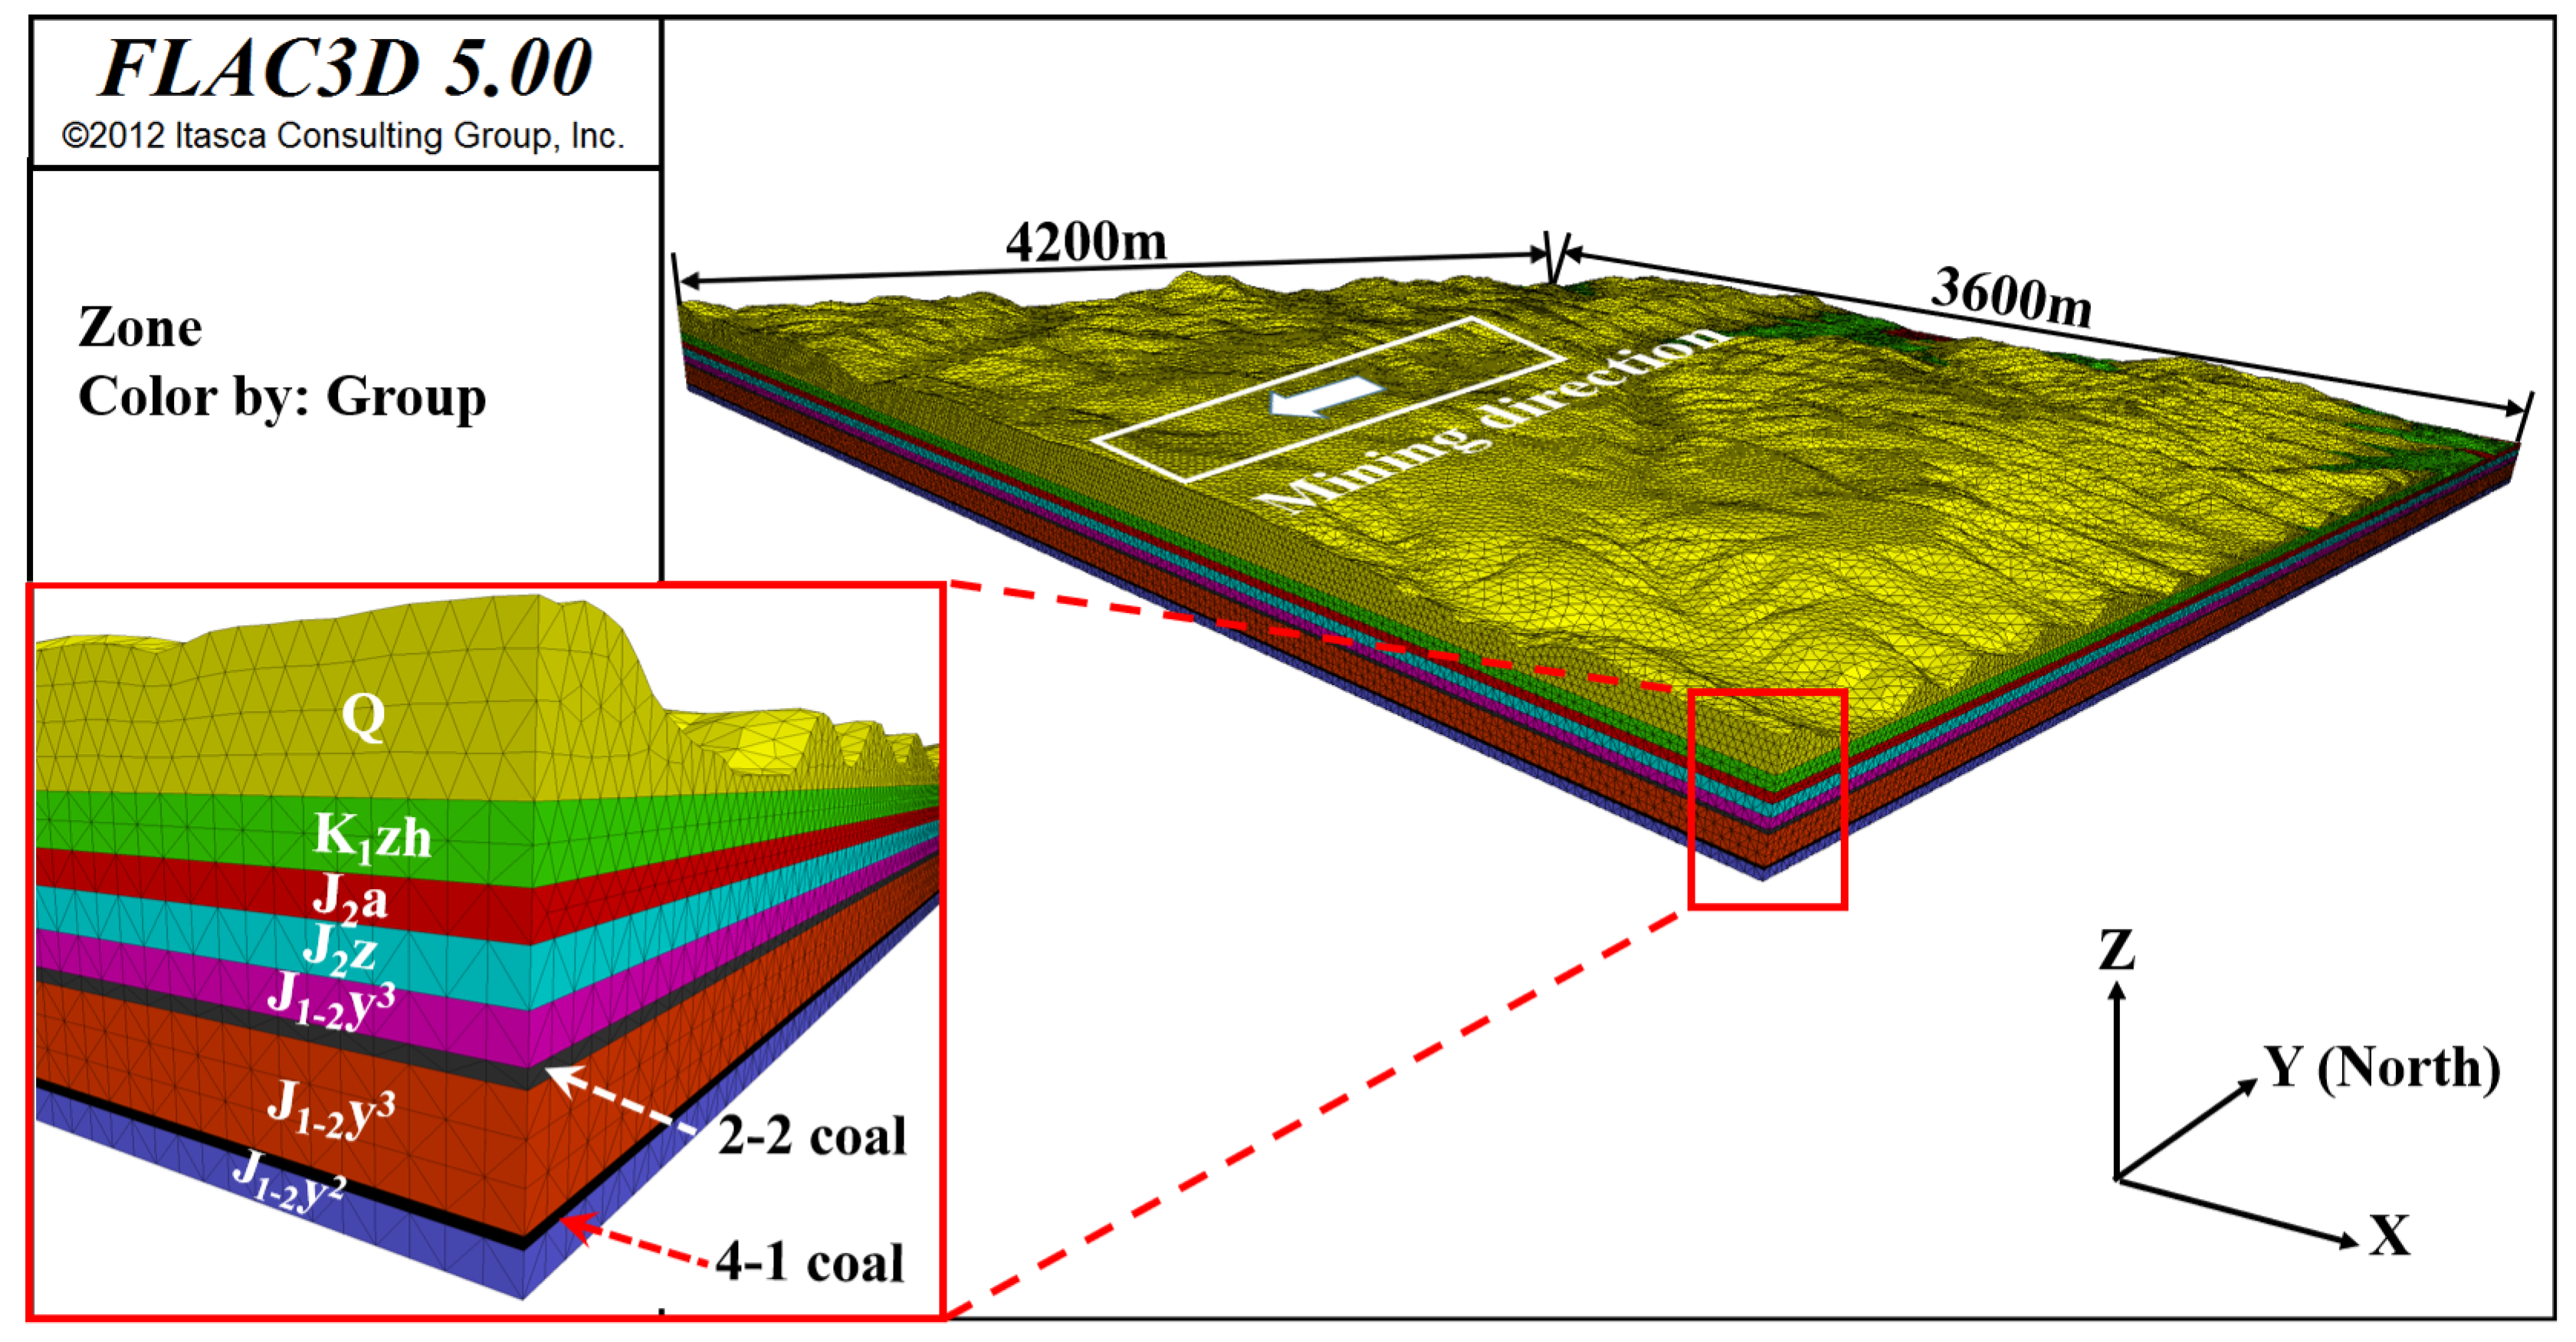
3.3. Numerical Model Based on Finite Element Method
3.3.1. Model Boundary
3.3.2. Mesh Generation
3.3.3. The Constitutive Mechanical Model and Yield Criterion
3.3.4. Boundary Conditions and the Initial State of Stress
3.4. Mechanical Parameter Inversion
3.4.1. Determination of the Initial Mechanical Parameters of Overlying Strata
3.4.2. Selection of the Experimental Factors
3.4.3. Data Selection
3.4.4. Simulation according to the Schemes of Orthogonal Experimental Design
3.4.5. Determination of Strata Parameters
3.5. Prediction in Two-Seam Subsidence
3.5.1. Layout of Subsidence Monitoring Points in Numerical Simulation
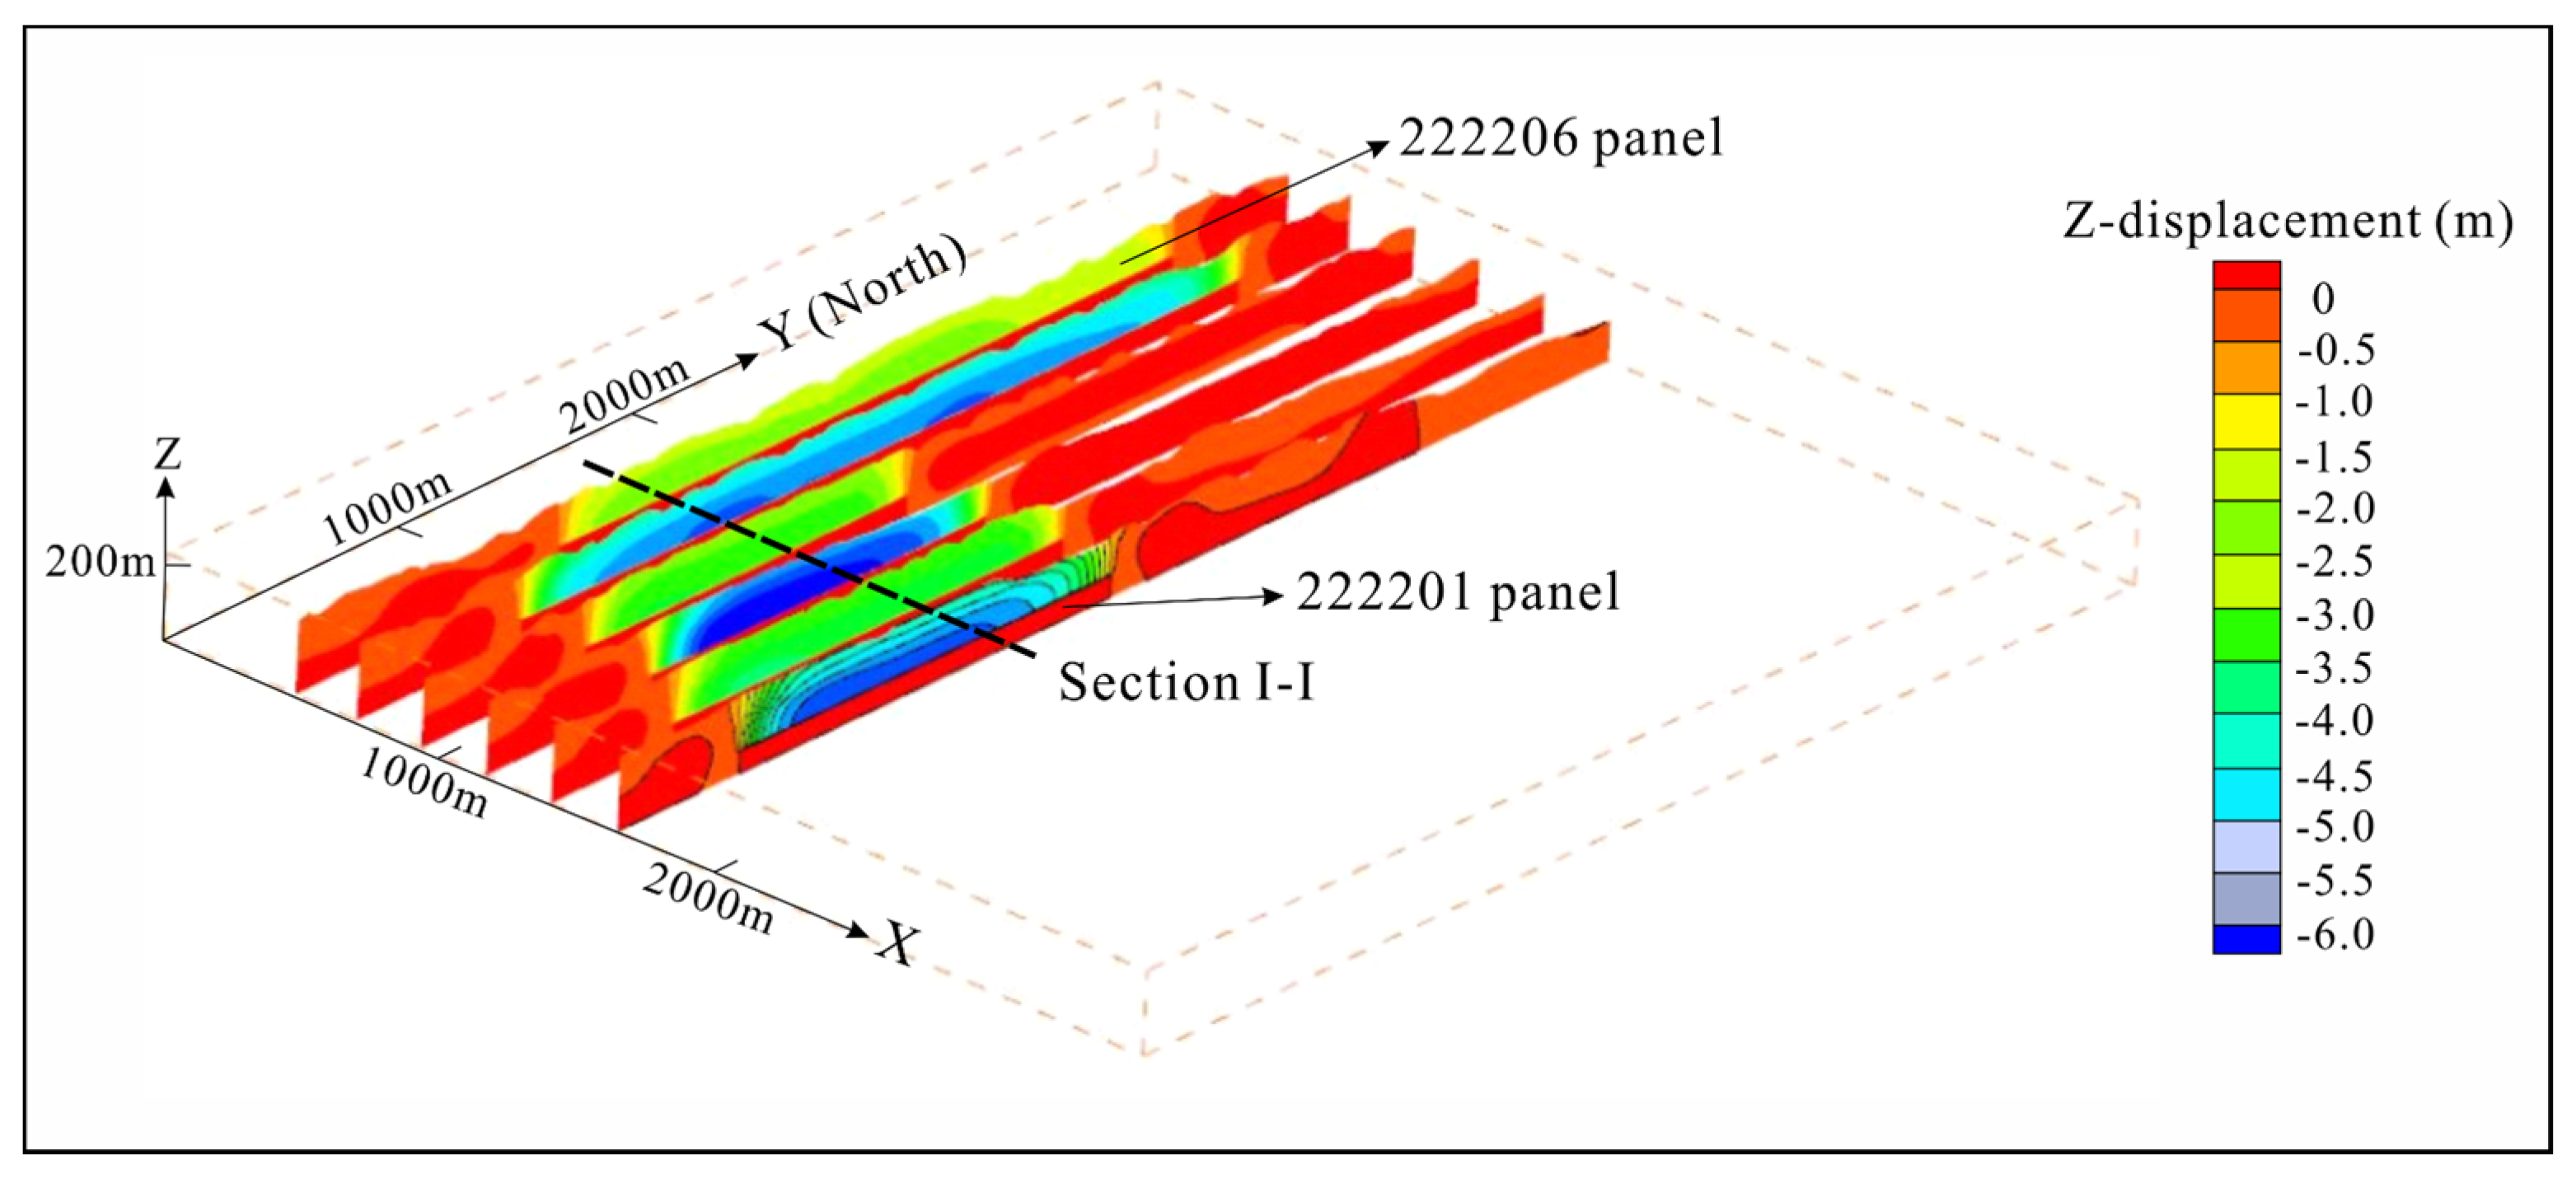
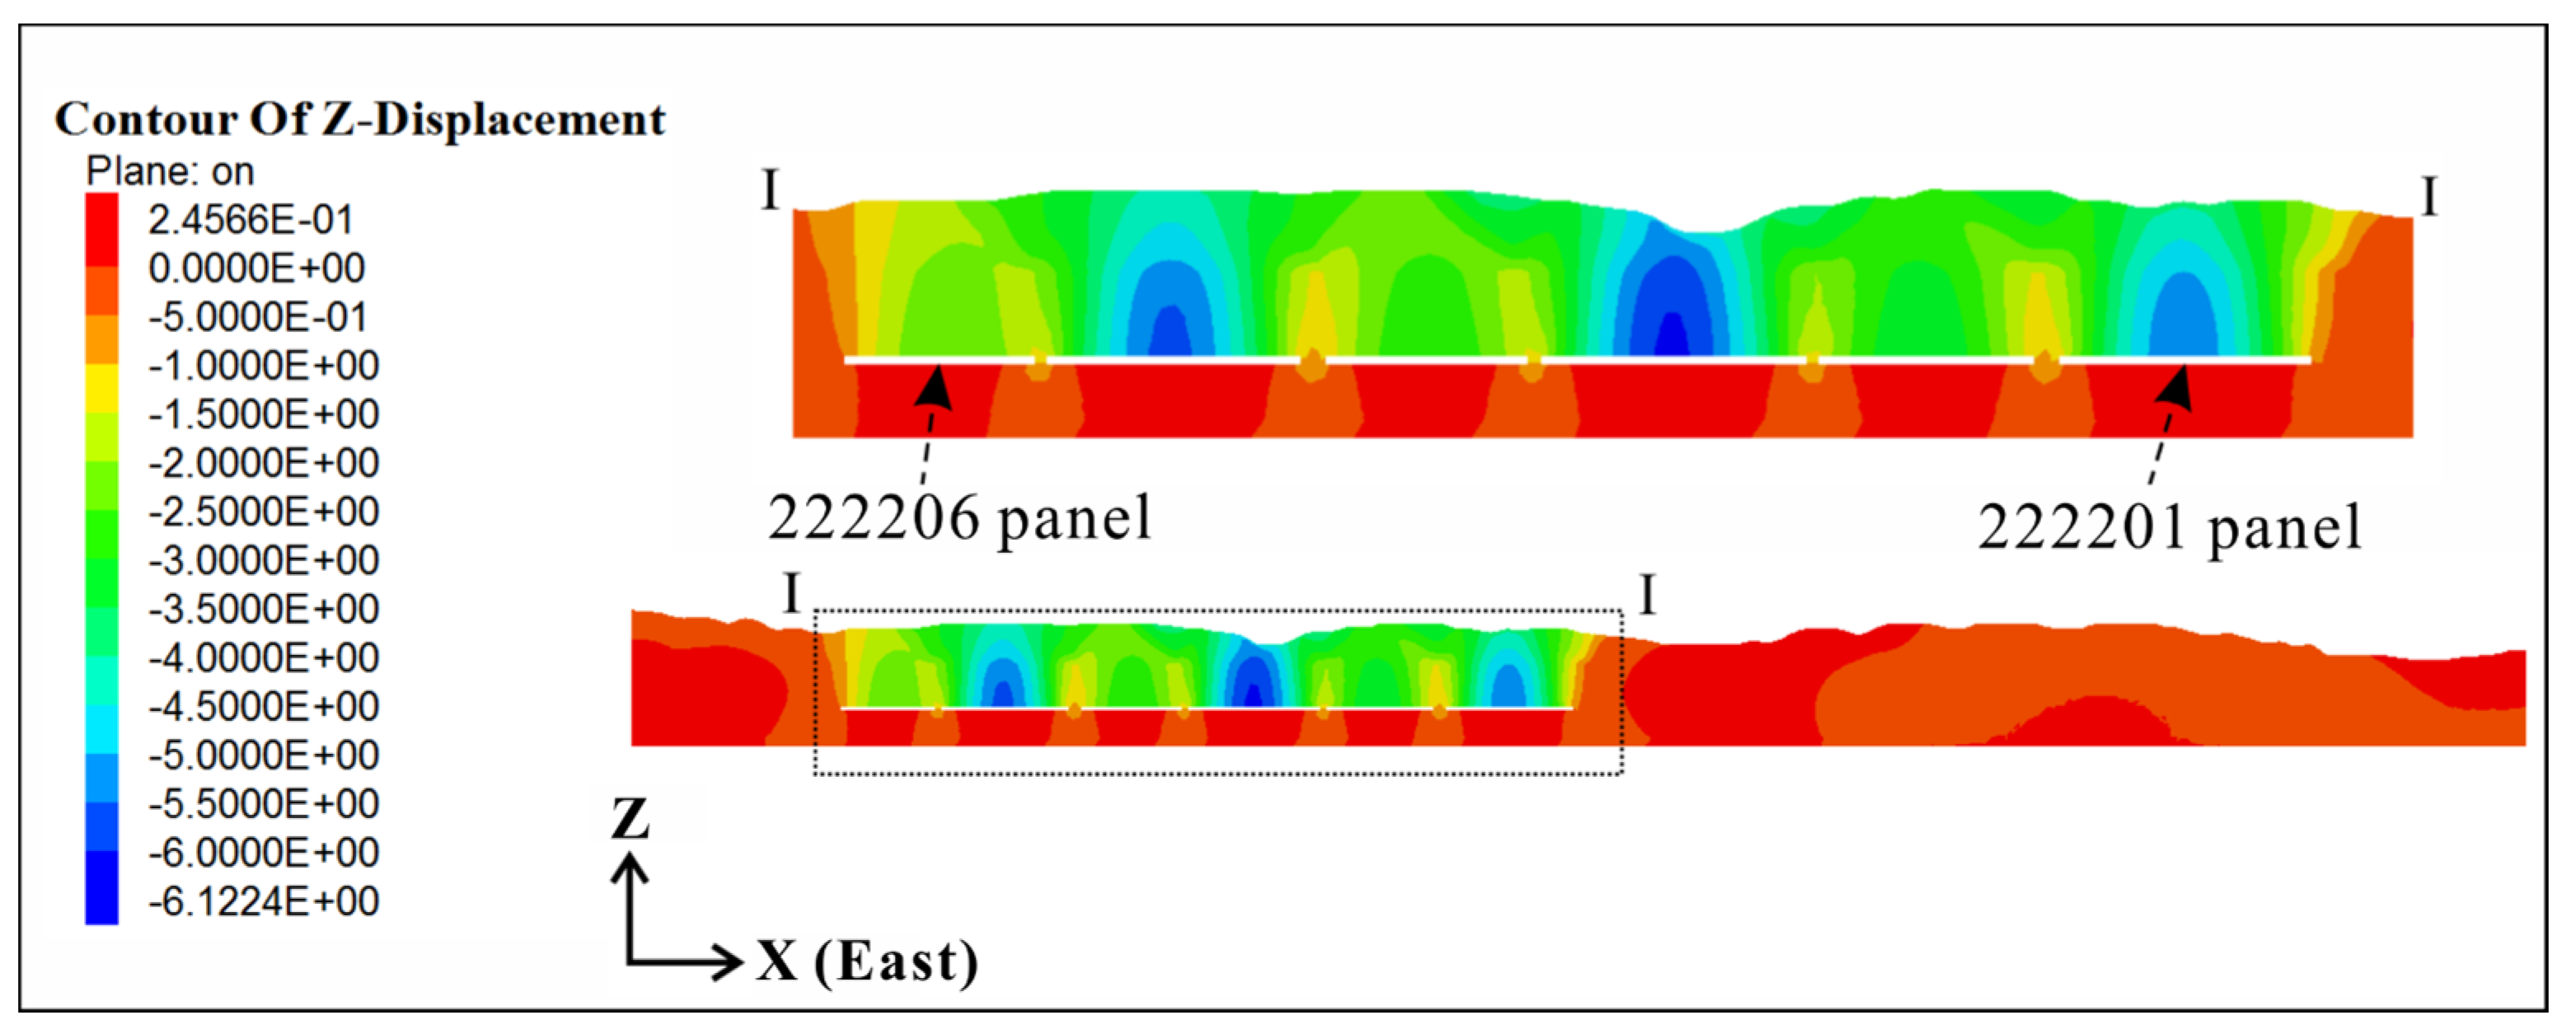
3.5.2. Prediction of Subsidence Induced by Upper-Seam Mining (S1)
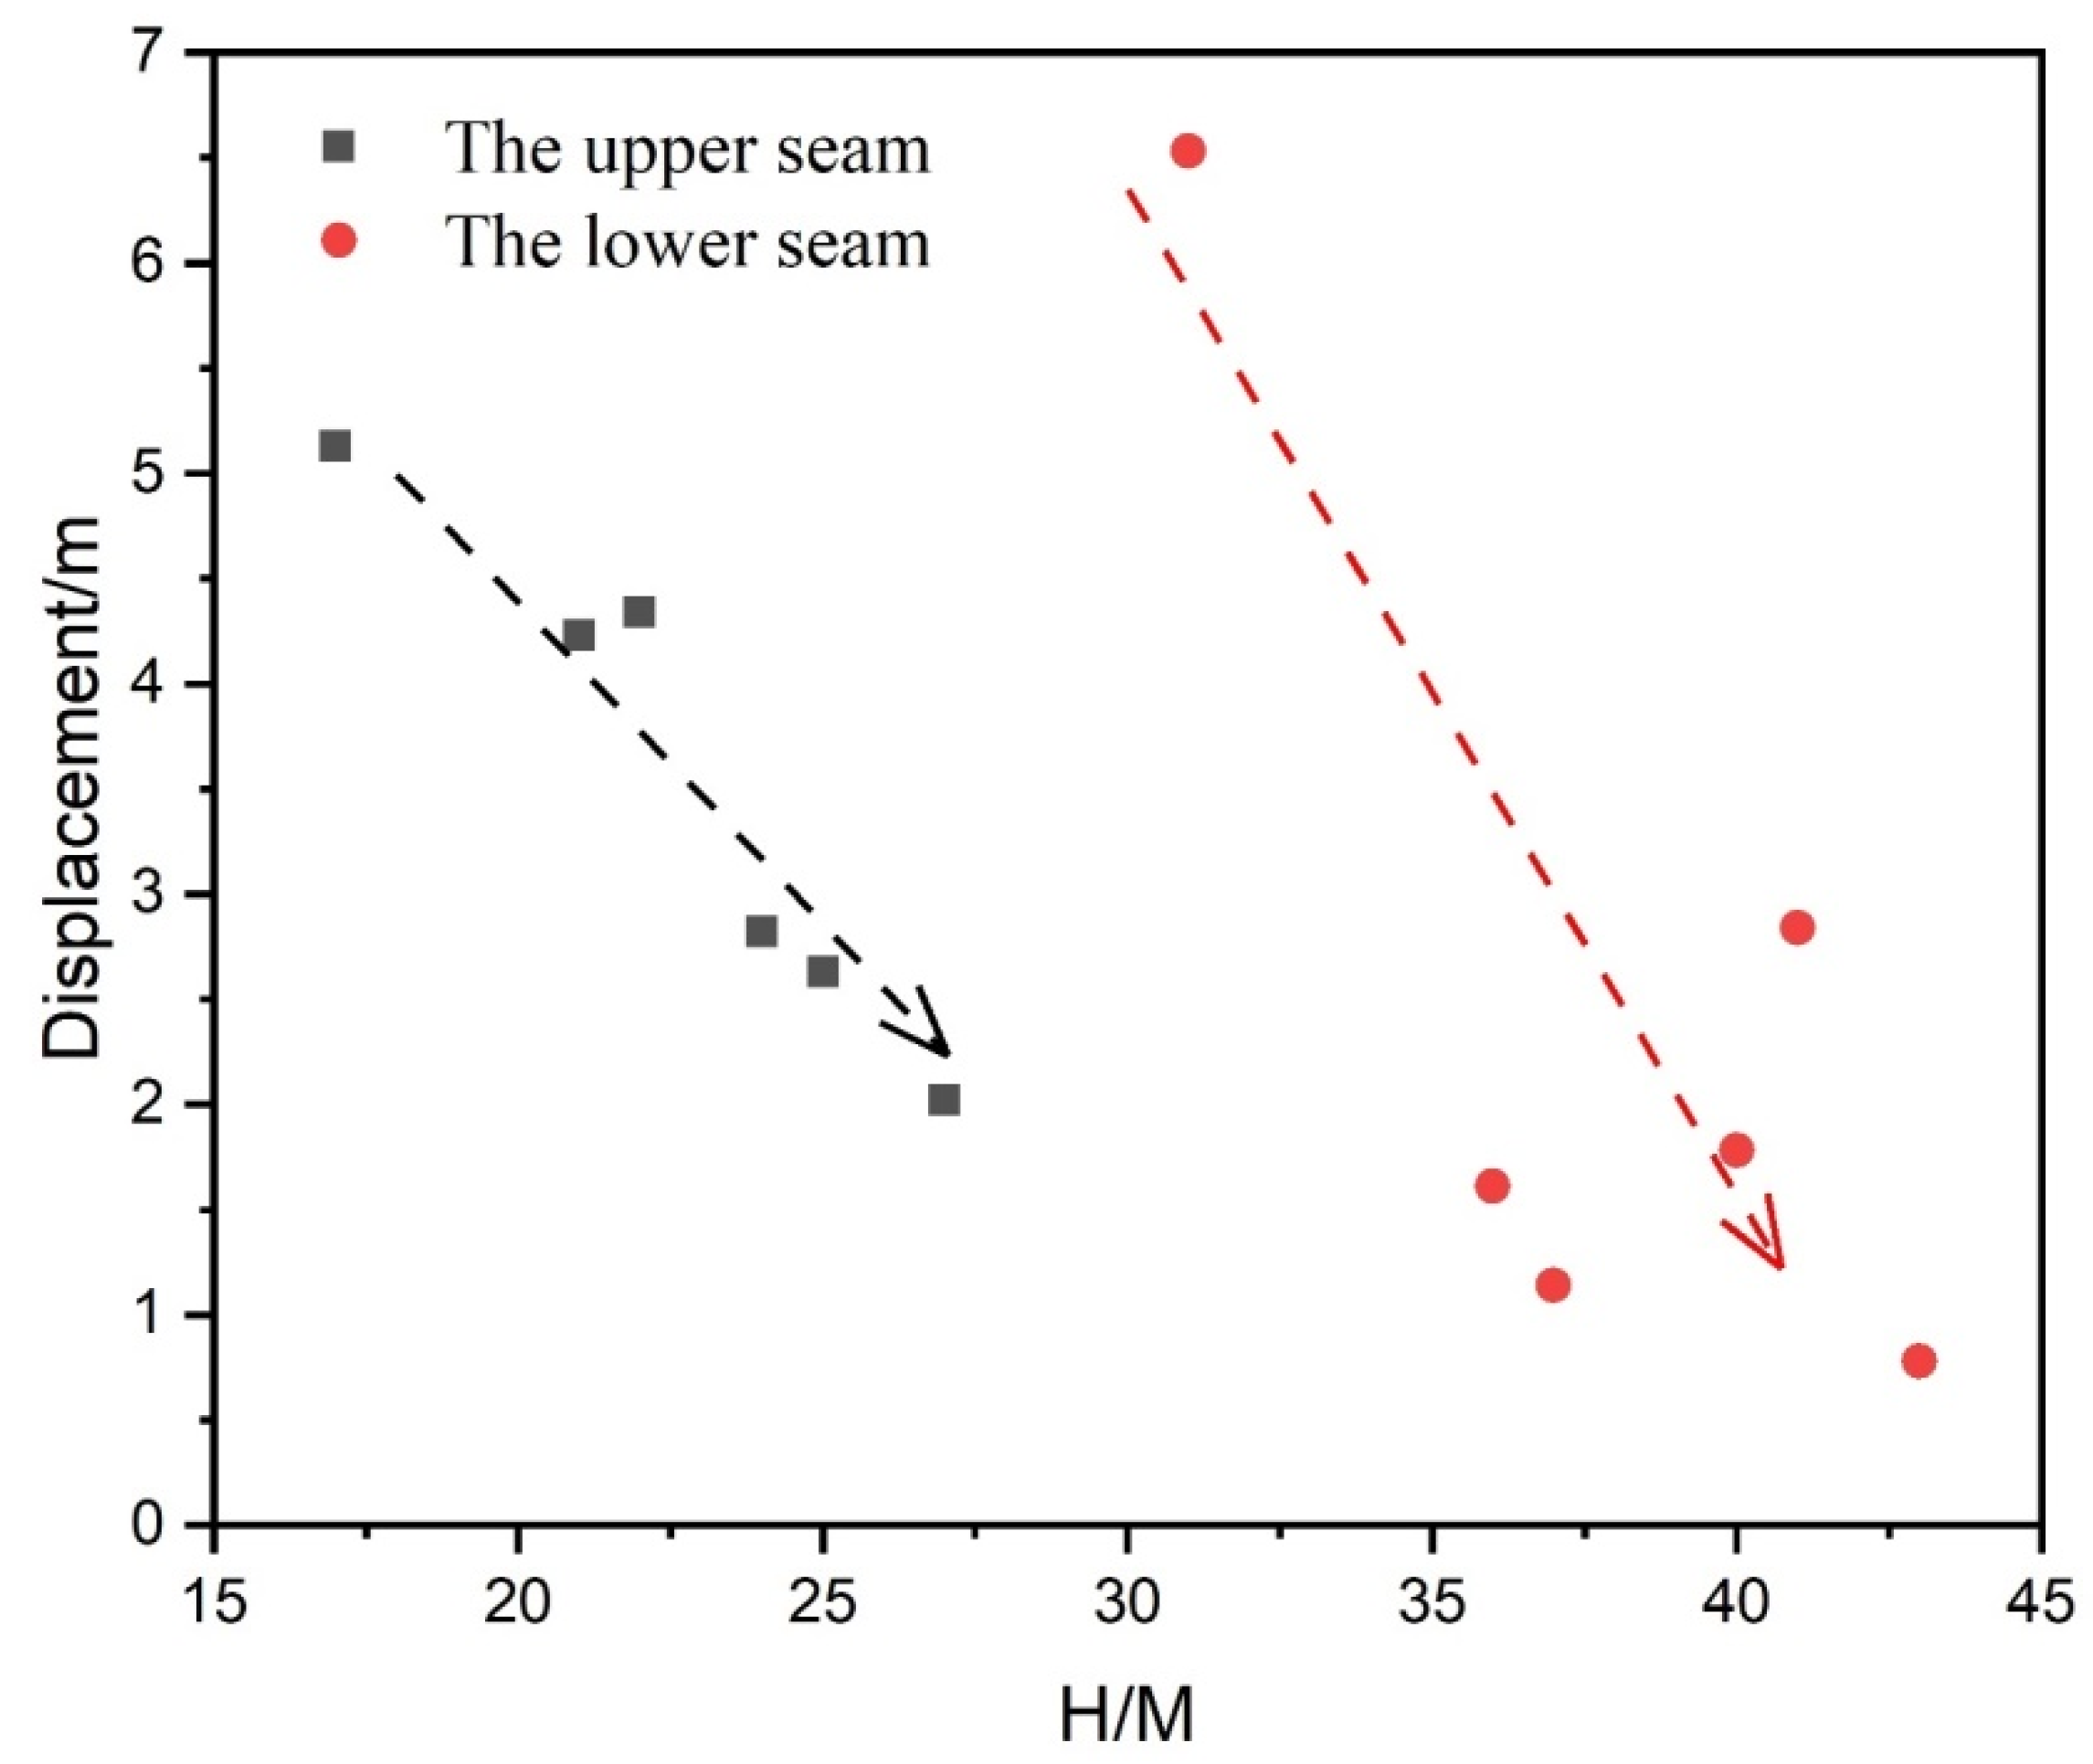
- (1)
- When the development of S1 is completed, the maximum S1 of each panel is relatively large, which ranges from 2.0 to 5.1 m, and the maximum S1 occurs in panel No. 222203.
- (2)
- The maximum S1 of each panel occurs in the central part of the roof. Furthermore, the subsidence is smaller approaching the ground and greater approaching the roofs of the panels.
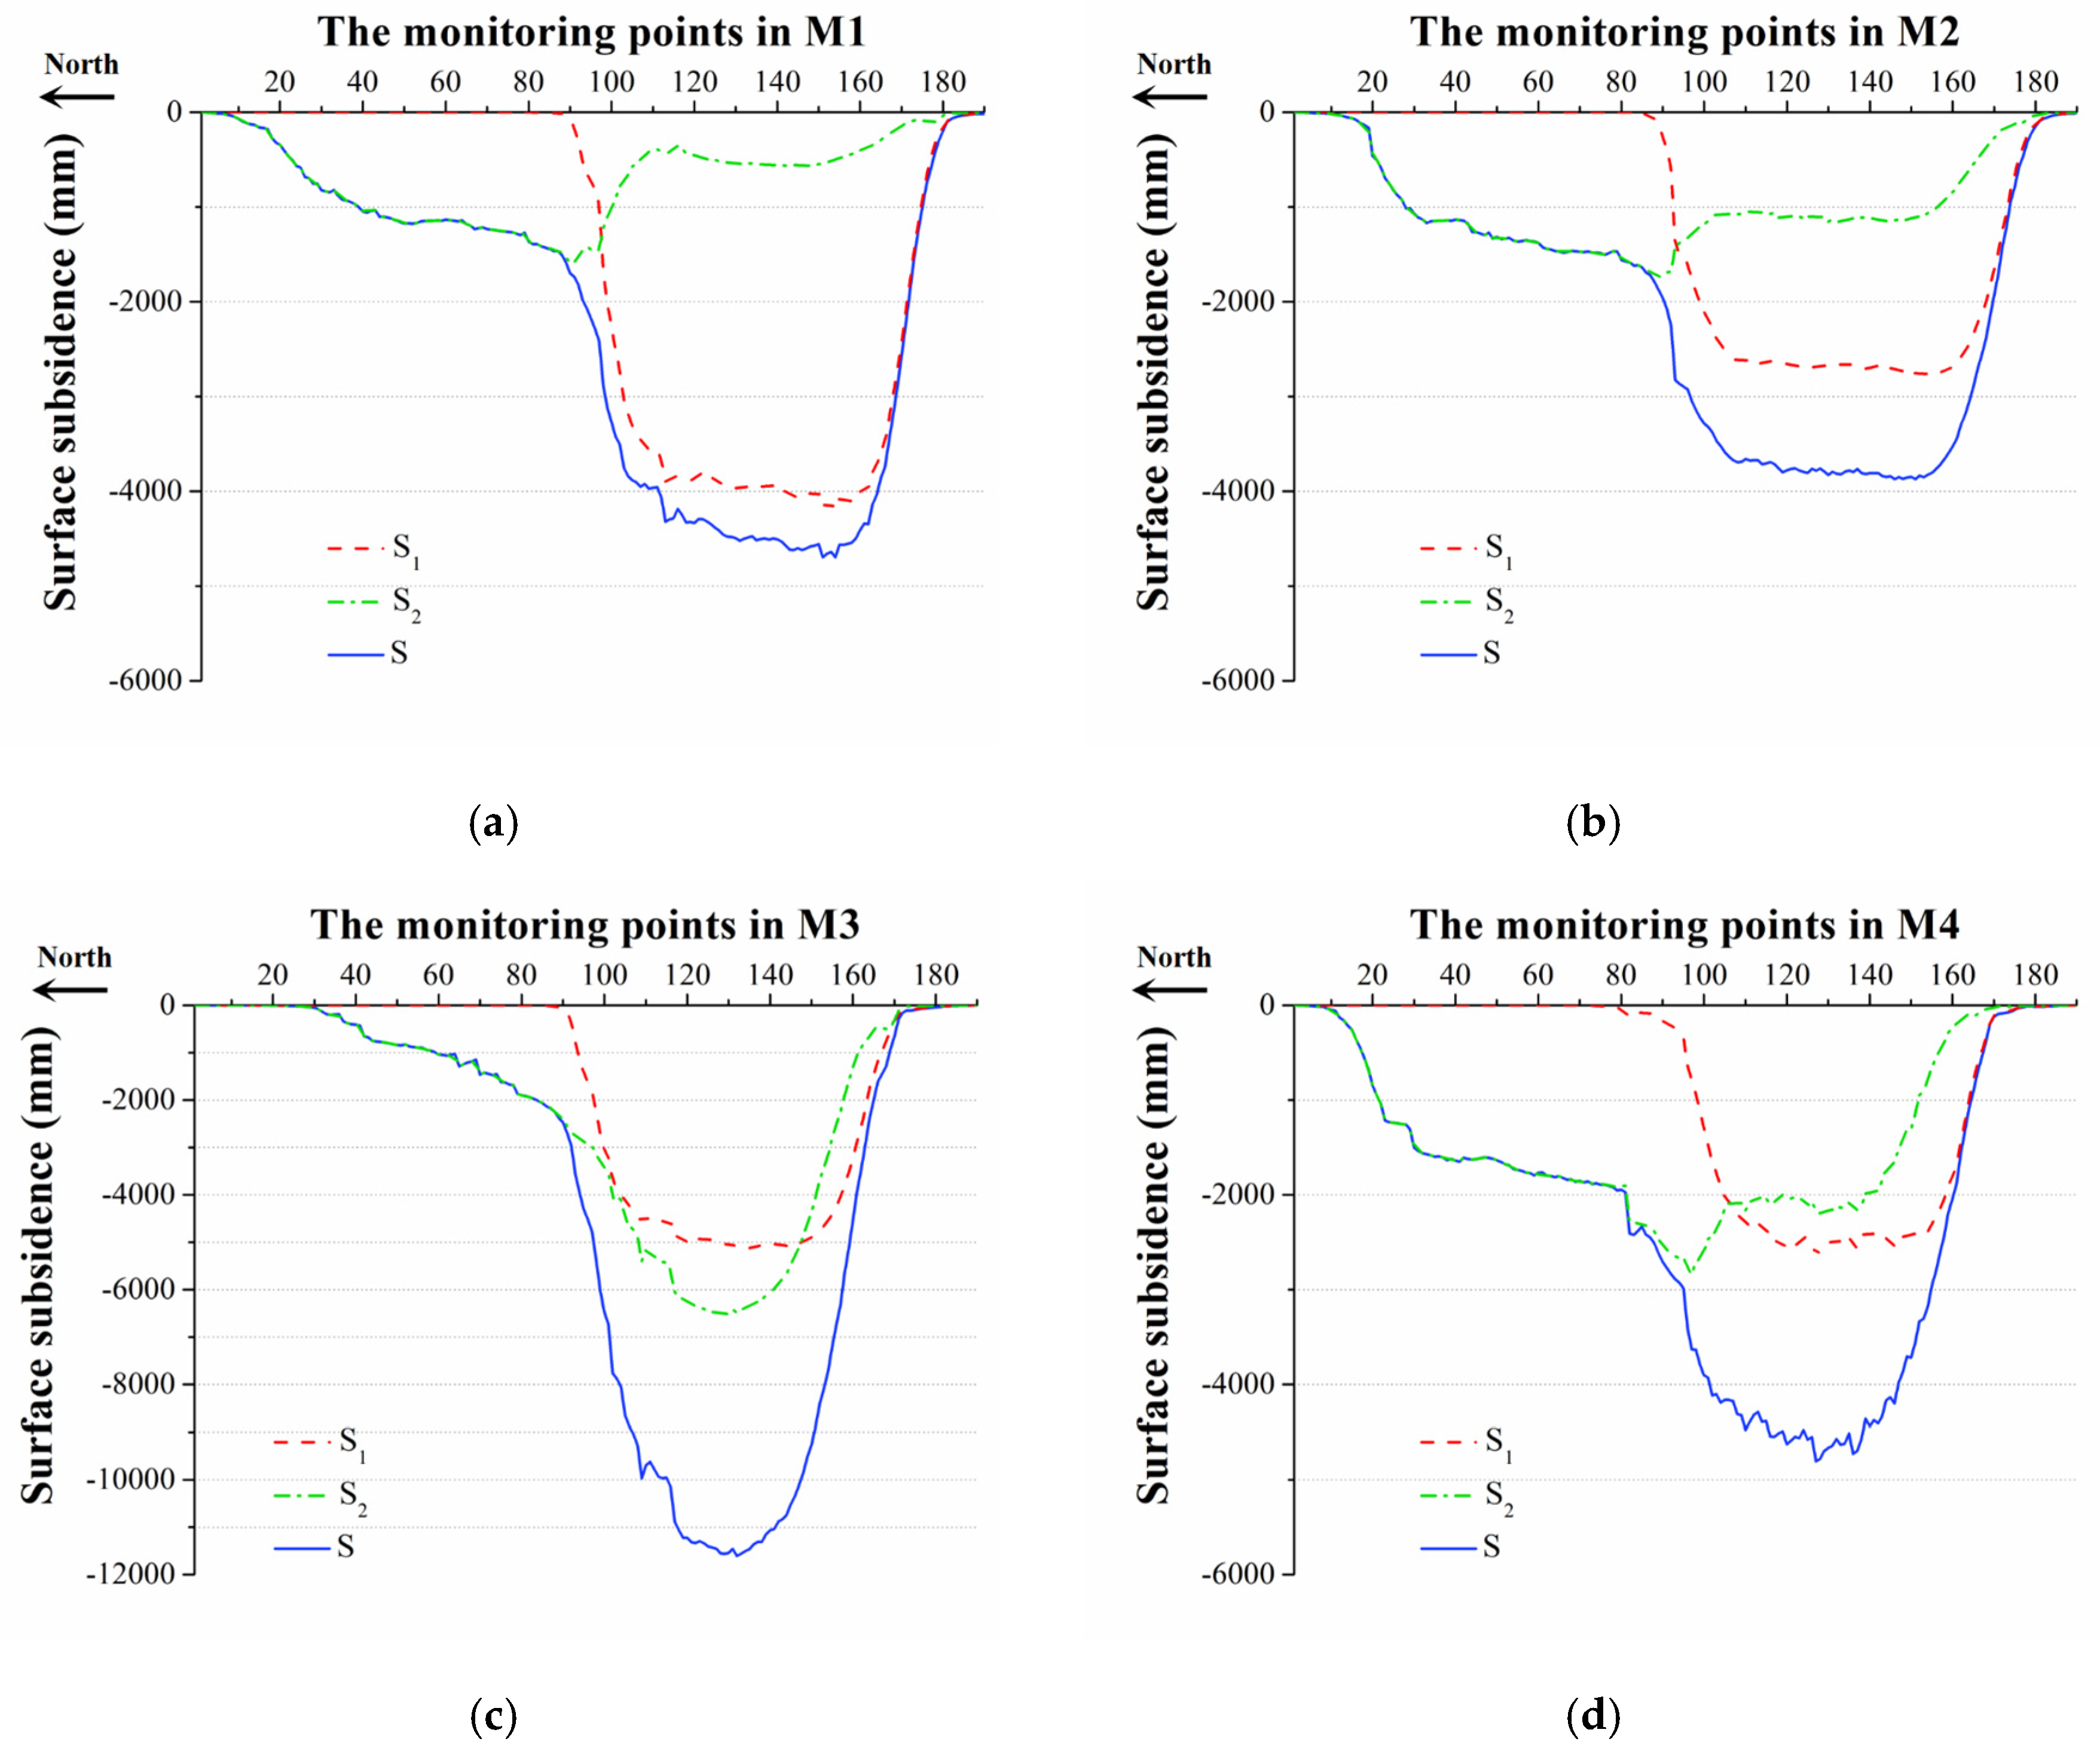
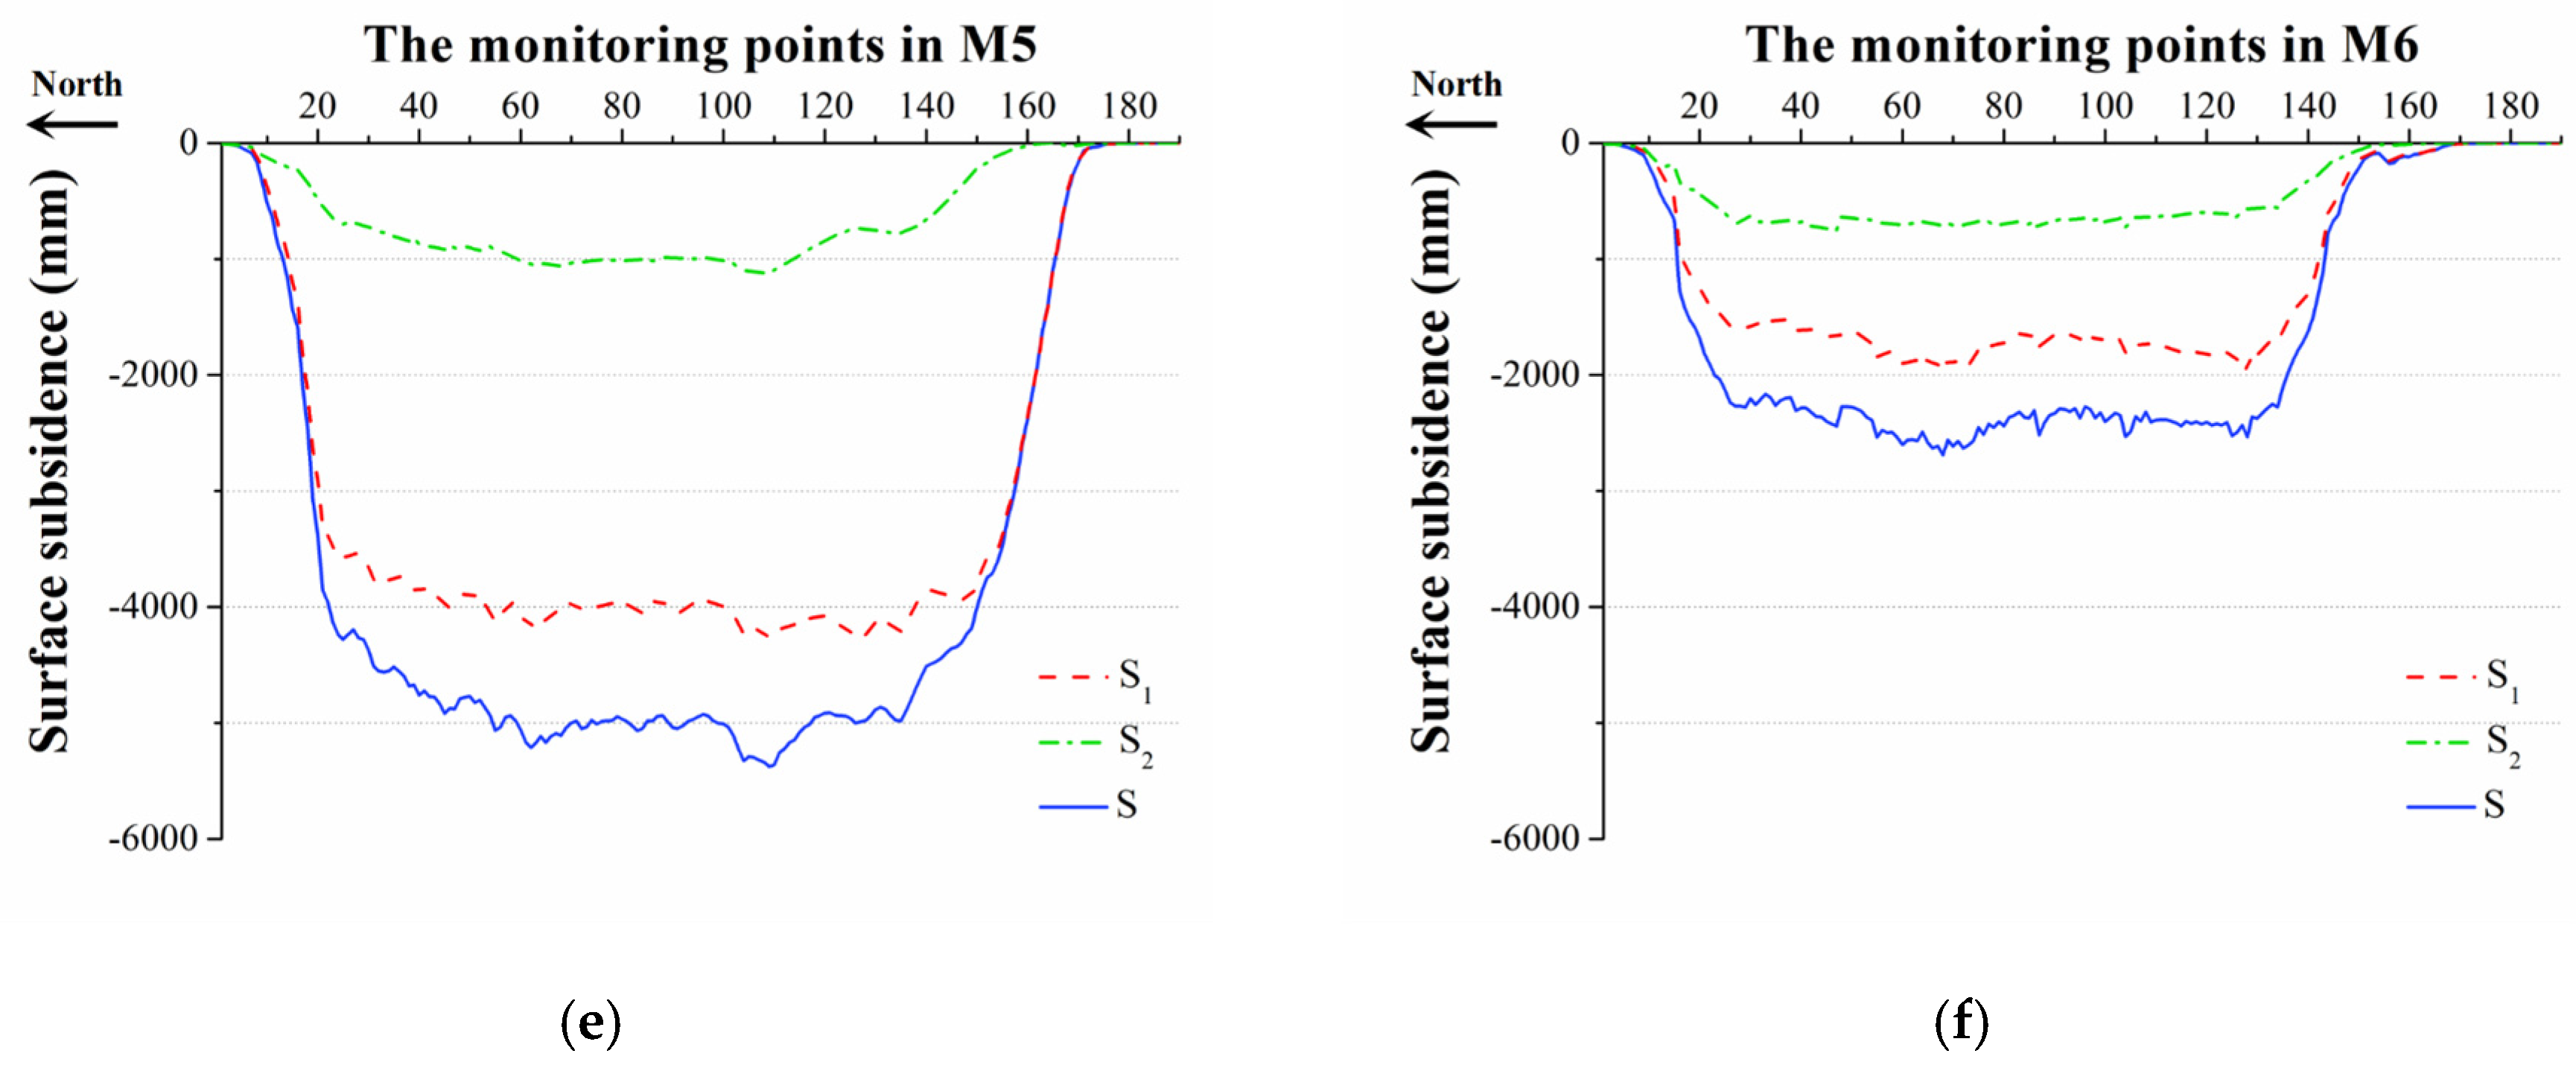
3.5.3. Prediction of Subsidence Induced by the Upper-Seam Mining (S2)
- (1)
- The S of line M3 is maximal (11.6 m), which is approximately 2–4 times larger than the S in other lines.
- (2)
- For the subsidence of lines M3 and M4, the S1 is approximately as large as S2. For the subsidence of lines M1, M2, M5 and M6, S1 is approximately twice as large as S2.
4. Analysis and Discussion
4.1. Effect Factors of Surface Subsidence
4.2. Method of Subsidence Prediction in Single-Seam and Multiseam Mining
5. Conclusions
Supplementary Materials
Author Contributions
Funding
Acknowledgments
Conflicts of Interest
References
- Feng, X.W.; Zhang, N.; Gong, L.Y.; Xue, F.; Zheng, X.G. Application of a backfilling method in coal mining to realise an ecologically sensitive “Black Gold” industry. Energies 2015, 8, 3628–3639. [Google Scholar] [CrossRef]
- Sun, Q.; Zhang, J.X.; Zhang, Q.; Zhao, X. Analysis and prevention of geo-environmental hazards with high-intensive coal mining: A case study in China’s western eco-environment frangible area. Energies 2017, 10, 786. [Google Scholar] [CrossRef]
- Nie, L.; Zhang, M.; Jian, H.Q. Analysis of surface subsidence mechanism and regularity under the influence of seism and fault. Nat. Hazards 2013, 66, 773–780. [Google Scholar] [CrossRef]
- Salmi, E.F.; Nazem, M.; Karakus, M. Numerical analysis of a large landslide induced by coal mining subsidence. Eng. Geol. 2017, 217, 141–152. [Google Scholar] [CrossRef]
- Najjar, Y.; Zaman, M. Surface subsidence prediction by nonlinear finite-element analysis. J. Geotech. Eng. 1993, 119, 1790. [Google Scholar] [CrossRef]
- Alejano, L.R.; RamíRez-Oyanguren, P.; Taboada, J. FDM predictive methodology for subsidence due to flat and inclined coal seam mining. Int. J. Rock Mech. Min. 1999, 36, 475–491. [Google Scholar] [CrossRef]
- Sheorey, P.R.; Loui, J.P.; Singh, K.B.; Singh, S.K. Ground subsidence observations and a modified influence function method for complete subsidence prediction. Int. J. Rock Mech. Min. 2000, 37, 801–818. [Google Scholar] [CrossRef]
- Donnelly, L.J.; De La Cruz, H.; Asmar, I.; Zapata, O.; Perez, J.D. The monitoring and prediction of mining subsidence in the Amaga, Angelopolis, Venecia and Bolombolo Regions, Antioquia, Colombia. Eng. Geol. 2001, 59, 103–114. [Google Scholar] [CrossRef]
- Nicieza, C.G.; Fernandez, M.I.A.; Diaz, A.M.; Vigil, A.E.A. The new three-dimensional subsidence influence function denoted by n-k-g. Int. J. Rock Mech. Min. 2005, 42, 372–387. [Google Scholar] [CrossRef]
- Singh, K.B. Pot-hole subsidence in Son-Mahanadi Master Coal Basin. Eng. Geol. 2007, 89, 88–97. [Google Scholar] [CrossRef]
- Díaz-Fernández, M.E.; Álvarez-Fernández, M.I.; Álvarez-Vigil, A.E. Computation of influence functions for automatic mining subsidence prediction. Comput. Geosci 2010, 14, 83–103. [Google Scholar] [CrossRef]
- Xu, N.X.; Kulatilake, P.H.S.W.; Tian, H.; Wu, X.; Nan, Y.H.; Wei, T. Surface subsidence prediction for the WUTONG mine using a 3-D finite difference method. Comput. Geotech. 2013, 48, 134–145. [Google Scholar] [CrossRef]
- Unlu, T.; Akcin, H.; Yilmaz, O. An integrated approach for the prediction of subsidence for coal mining basins. Eng. Geol. 2013, 166, 186–203. [Google Scholar] [CrossRef]
- Jung, Y.B.; Song, W.K.; Cheon, D.S.; Lee, D.K.; Park, J.Y. Simple method for the identification of subsidence susceptibility above underground coal mines in Korea. Eng. Geol. 2014, 178, 121–131. [Google Scholar] [CrossRef]
- Gao, F.Q.; Stead, D.; Kang, H.P. Numerical simulation of squeezing failure in a coal mine roadway due to mining-induced stresses. Rock Mech. Rock Eng. 2015, 48, 1635–1645. [Google Scholar] [CrossRef]
- Thongprapha, T.; Fuenkajorn, K.; Daemen, J.J.K. Study of surface subsidence above an underground opening using a trap door apparatus. Tunn. Undergr. Space Technol. 2015, 46, 94–103. [Google Scholar] [CrossRef]
- Xu, N.X.; Zhang, J.Y.; Tian, H.; Mei, G.; Ge, Q. Discrete element modeling of strata and surface movement induced by mining under open-pit final slope. Int. J. Rock Mech. Min. 2016, 88, 61–76. [Google Scholar] [CrossRef]
- Suchowerska Iwanec, A.M.; Carter, J.P.; Hambleton, J.P. Geomechanics of subsidence above single and multi-seam coal mining. Chin. J. Rock Mech. Eng. 2016, 8, 304–313. [Google Scholar] [CrossRef]
- Adhikary, D.; Khanal, M.; Jayasundara, C.; Rao, B. Deficiencies in 2D simulation: A comparative study of 2D versus 3D simulation of multi-seam longwall mining. Rock Mech. Rock Eng. 2015, 49, 2181–2185. [Google Scholar] [CrossRef]
- Huang, Q.X.; Cao, J. Research on coal pillar malposition distance based on coupling control of three-field in shallow buried closely spaced multi-seam mining, China. Energies 2019, 12, 462. [Google Scholar] [CrossRef]
- Ghabraie, B.; Ghabraie, K.; Ren, G.; Smith, J.V. Numerical modelling of multistage caving processes: Insights from multi-seam longwall mining-induced subsidence. Int. J. Numer. Anal. Met. 2017, 41, 959–975. [Google Scholar] [CrossRef]
- Ren, G.; Li, G.; Kulessa, M. Application of a generalised influence function method for subsidence prediction in multi-seam longwall extraction. Geotech. Geol. Eng. 2014, 32, 1123–1131. [Google Scholar] [CrossRef]
- Khanal, M.; Adhikary, D.; Jayasundara, C.; Balusu, R. Numerical study of mine site specific multiseam mining and its impact on surface subsidence and chain pillar stress. Geotech. Geol. Eng. 2016, 34, 217–235. [Google Scholar] [CrossRef]
- Zhang, B.; Zhang, L.Z.; Yang, H.L.; Zhang, Z.J.; Tao, J.L. Subsidence prediction and susceptibility zonation for collapse above goaf with thick alluvial cover: A case study of the Yongcheng coalfield, Henan Province, China. Bull. Eng. Geol. Environ. 2016, 75, 1117–1132. [Google Scholar] [CrossRef]
- Ghabraie, B.; Ren, G.; Smith, J.V. Characterising the multi-seam subsidence due to varying mining configuration, insights from physical modelling. Int. J. Rock Mech. Min. 2017, 93, 269–279. [Google Scholar] [CrossRef]
- Ghabraie, B.; Ren, G.; Barbato, J.; Smith, J.V. A predictive methodology for multi-seam mining induced subsidence. Int. J. Rock Mech. Min. 2017, 93, 280–294. [Google Scholar] [CrossRef]
- Hoek, E.; Brown, E.T. Practical estimates of rock mass strength. Int. J. Rock Mech. Min. 1997, 34, 1165–1186. [Google Scholar] [CrossRef]
- Mohammad, N.; Reddish, D.J.; Stace, L.R. The relation between in situ and laboratory rock properties used in numerical modelling. Int. J. Rock Mech. Min. 1997, 34, 289–297. [Google Scholar] [CrossRef]
- Kulatilake, P.H.S.W.; Park, J.; Um, J.G. Estimation of rock mass strength and deformability in 3-D for a 30 m cube at a depth of 485 m at Äspö Hard Rock Laboratory. Geotech. Geol. Eng. 2004, 22, 313. [Google Scholar] [CrossRef]
- Kodama, J.; Miyamoto, T.; Kawasaki, S.; Fujii, Y.; Kaneko, K.; Hagan, P. Estimation of regional stress state and Young’s modulus by back analysis of mining-induced deformation. Int. J. Rock Mech. Min. 2013, 63, 1–11. [Google Scholar] [CrossRef]
- Janin, J.P.; Dias, D.; Emeriault, F.; Kastner, R.; Le Bissonnais, H.; Guilloux, A. numerical back-analysis of the southern Toulon tunnel measurements: A comparison of 3D and 2D approaches. Eng. Geol. 2015, 195, 42–52. [Google Scholar] [CrossRef]
- Chen, K.; Zhang, J.Y.; Jia, X.G.; Li, J. Study on surface ground movement law above fully-mechanized mining face in shallow depth seam. Coal Sci. Tech. 2015, 43, 127–170. [Google Scholar] [CrossRef]
- Zhou, D.W.; Wu, K.; Li, L.; Diao, X.P.; Kong, X.S. A new methodology for studying the spreading process of mining subsidence in rock mass and alluvial soil: an example from the Huainan coal mine, China. Bull. Eng. Geol. Environ. 2016, 75, 1067–1087. [Google Scholar] [CrossRef]
- Li, H.M.; Li, H.G.; Song, G.J.; Wang, K.L. Physical and mechanical properties of the coal-bearing strata rock in Shendong coal field. J. China Coal Soc. 2016, 41, 2661–2671. [Google Scholar] [CrossRef]
- He, G.Q.; Yang, L.; Ling, G.D.; Jia, C.F.; Hong, D. Mining Subsidence Theory; China University of Mining and Technology Press: Xuzhou, China, 1991; p. 79. ISBN 7810214497. [Google Scholar]


| Stratum | Panel | Length (m) | Width (m) | Mined or Unmined (By December, 2018) |
|---|---|---|---|---|
| 2-2 Coal | 222201 | 1600 | 240 | Mined |
| 222202 | 1677 | 200 | Mined | |
| 222203 | 1437 | 250 | Mined | |
| 222204 | 1480 | 200 | Mined | |
| 222205 | 3055 | 240 | Mined | |
| 222206 | 2617 | 170 | Mined | |
| 4-1 Coal | 414101 | 3127 | 212 | Unmined |
| 414102 | 3056 | 204 | Unmined | |
| 414103 | 1950 | 210 | Unmined | |
| 414114 | 2829 | 211 | Unmined | |
| 414105 | 2637 | 240 | Unmined | |
| 414106 | 2617 | 170 | Unmined |
| No. | Strata | E (GPa) | μ | c (MPa) | φ (°) |
|---|---|---|---|---|---|
| 1 | Q | 0.07 | 0.36 | 0.06 | 22.6 |
| 2 | K1zh | 0.70 | 0.29 | 5.36 | 35.1 |
| 3 | J2a | 0.90 | 0.26 | 8.66 | 23.9 |
| 4 | J2z | 1.45 | 0.29 | 15.89 | 23.4 |
| 5 | J1-2y3 | 1.57 | 0.22 | 18.96 | 26.1 |
| 6 | 2-2 coal | 1.05 | 0.31 | 19.25 | 24.5 |
| Level | Factor | |||
|---|---|---|---|---|
| (GPa) | (MPa) | (°) | ||
| I | 0.54 | 0.25 | 2.66 | 20.1 |
| II | 0.75 | 0.27 | 7.01 | 23.0 |
| III | 0.96 | 0.29 | 11.36 | 25.9 |
| IV | 1.17 | 0.31 | 15.71 | 28.8 |
| V | 1.38 | 0.33 | 20.06 | 31.7 |
| Scheme | RASS | ||||
|---|---|---|---|---|---|
| 1 | I | I | I | I | 1.1611 |
| 2 | I | II | II | II | 1.1156 |
| 3 | I | III | III | III | 1.0891 |
| 4 | I | IV | IV | IV | 1.0811 |
| 5 | I | V | V | V | 1.0632 |
| 6 | II | I | II | III | 0.7865 |
| 7 | II | II | III | IV | 0.7796 |
| 8 | II | III | IV | V | 0.7687 |
| 9 | II | IV | V | I | 0.7432 |
| 10 | II | V | I | II | 0.7259 |
| 11 | III | I | III | V | 0.6029 |
| 12 | III | II | IV | I | 0.5964 |
| 13 | III | III | V | II | 0.5913 |
| 14 | III | IV | I | III | 0.5651 |
| 15 | III | V | II | IV | 0.5547 |
| 16 | IV | I | IV | II | 0.4966 |
| 17 | IV | II | V | III | 0.4877 |
| 18 | IV | III | I | IV | 0.4762 |
| 19 | IV | IV | II | V | 0.4632 |
| 20 | IV | V | III | I | 0.4558 |
| 21 | V | I | V | IV | 0.4182 |
| 22 | V | II | I | V | 0.4097 |
| 23 | V | III | II | I | 0.4013 |
| 24 | V | IV | III | II | 0.3958 |
| 25 | V | V | IV | III | 0.3871 |
| No. | Strata | E (GPa) | μ | c (MPa) | φ (°) |
|---|---|---|---|---|---|
| 1 | Q | 0.02 | 0.35 | 0.06 | 22.6 |
| 2 | K1zh | 0.36 | 0.29 | 5.36 | 35.1 |
| 3 | J2a | 0.47 | 0.26 | 8.66 | 23.9 |
| 4 | J2z | 0.75 | 0.29 | 15.89 | 23.4 |
| 5 | J1-2y3 | 0.82 | 0.22 | 18.96 | 26.1 |
| 6 | 2-2 coal | 0.54 | 0.31 | 19.25 | 24.5 |
| Monitoring Line | The Upper Seam | The Lower Seam | |||||
|---|---|---|---|---|---|---|---|
| Mining Thickness (m) | H/M | S1max (m) | Mining Thickness (m) | H/M | S2max (m) | Smax (m) | |
| M1 | 7.0 | 21 | 4.23 | 5 | 36 | 1.61 | 4.74 |
| M2 | 24 | 2.82 | 40 | 1.78 | 3.96 | ||
| M3 | 17 | 5.13 | 31 | 6.53 | 11.62 | ||
| M4 | 25 | 2.63 | 41 | 2.84 | 4.83 | ||
| M5 | 22 | 4.34 | 37 | 1.14 | 5.46 | ||
| M6 | 27 | 2.02 | 43 | 0.78 | 2.72 | ||
© 2019 by the authors. Licensee MDPI, Basel, Switzerland. This article is an open access article distributed under the terms and conditions of the Creative Commons Attribution (CC BY) license (http://creativecommons.org/licenses/by/4.0/).
Share and Cite
Zhang, B.; Ye, J.; Zhang, Z.; Xu, L.; Xu, N. A Comprehensive Method for Subsidence Prediction on Two-Seam Longwall Mining. Energies 2019, 12, 3139. https://doi.org/10.3390/en12163139
Zhang B, Ye J, Zhang Z, Xu L, Xu N. A Comprehensive Method for Subsidence Prediction on Two-Seam Longwall Mining. Energies. 2019; 12(16):3139. https://doi.org/10.3390/en12163139
Chicago/Turabian StyleZhang, Bin, Jiacheng Ye, Zhongjian Zhang, Liang Xu, and Nengxiong Xu. 2019. "A Comprehensive Method for Subsidence Prediction on Two-Seam Longwall Mining" Energies 12, no. 16: 3139. https://doi.org/10.3390/en12163139
APA StyleZhang, B., Ye, J., Zhang, Z., Xu, L., & Xu, N. (2019). A Comprehensive Method for Subsidence Prediction on Two-Seam Longwall Mining. Energies, 12(16), 3139. https://doi.org/10.3390/en12163139