Article

Selection of Best-Suited Wind Turbines for New Wind Farm Sites Using Techno-Economic and GIS Analysis in South Korea

1
Smart City Construction Engineering, University of Science & Technology (UST), 217, Gajeong-ro, Yuseong-gu, Daejeon 34113, Korea
2
Department of Land, Water and Environment Research, Korea Institute of Civil Engineering and Building Technology (KICT), Daehwa-dong 283, Goyangdae-ro, Ilsanseo-Gu, Goyang-si, Gyeonggi-do 10223, Korea
*
Author to whom correspondence should be addressed.
Energies 2019, 12(16), 3140; https://doi.org/10.3390/en12163140
Submission received: 5 July 2019 / Revised: 25 July 2019 / Accepted: 13 August 2019 / Published: 15 August 2019

Abstract

:
South Korea greatly depends upon foreign countries to fulfill its energy requirements, and therefore imports billions of barrels of oil every year. For instance, 94.8% of the total primary energy supply (TPES) was imported from other countries in 2015, at the cost of 91.51 billion euros. There is a realistic challenge in front of the government to reduce these oil imports, and to find alternate (local) sources of energy. Renewable energy (RE) technologies can play a vital role in this regard. The South Korean government has shown a great interest in RE, and intends to achieve a target of 11% of the TPES being generated by RE by the end of 2035, as decided in the Korean Renewable Portfolio Standard (RPS); which showed that only 4.9% of TPES was produced by RE at the end of 2015. The present study proposes ten potential onshore wind farm sites. These locations have been identified by using the GIS–MCDM (geographic information system–multi-criteria decision-making) methodology and a detailed techno-economic assessment has also been presented. Furthermore, the appropriate type of wind turbines has been recommended for each site using detailed analysis of wind conditions, 50-year extreme wind speed (EWS) and turbulence intensity (TI). The analysis showed that all the sites have excellent wind conditions, and they are also economically feasible. Parameters such as AEP (annual energy production), CF (capacity factor), LCOE (levelized cost of electricity), and NPV (net present value) have been estimated for each site, using five different wind turbines manufactured in South Korea. The present study can be very useful for the wind energy sector in South Korea.

1. Introduction

Proposed South Korean wind energy project studies range from very localized studies to projects that evaluate all South Korea. Renewable energy sources such as wind and solar energy are promising solutions and studied for the potential replacement of fossil fuels which have long-term consequences and are not sustainable for South Korea. Although the energy density of fossil fuels is much higher than that of renewable energy, due to zero carbon emissions, renewable energy sources are the desirable choice as alternative fuels. Over recent decades the global capacity of installed wind farms has increased rapidly. Many governments are focusing on green energy sources, such as wind power, to reduce their greenhouse gas (GHG) emissions [1].
South Korea started to increase its wind capacity during the early 1990s. In 1992, the first commercial wind turbine, with a 0.25 GW capacity, was installed on Jeju Island and was connected to the national grid. A wind farm was planned and built in Yeongdeok in 2005, and was the largest wind farm in the country at that time, with a capacity of 0.396 MW. Wind energy production went on to increase sharply after this. Oh et al. [2] investigated Wangdeung-do and Gochang for wind energy exploration. They suggested best-suited wind turbines for these sites by analyzing wind characteristics. Lee at al. [3] determined the wind energy potential of the Younggwang area, where the Korean government will build a wind farm at the end of 2019. They calculated the capacity factor (CF) and net annual energy production (AEP) of this site. Oh et al. [4] analyzed the wind characteristics of Korea, covering the entire country, and studied the possibility of constructing a 100 MW wind farm. Jang et al. [5] analyzed the QuikSCAT wind data to determine the wind speed very low to the ground and reported that the southwest side of the country has high potential for wind energy. Similarly, Kim et al. [6] used economic analysis such as NPV and LCOE to identify wind farm sites with the highest wind speeds within the country. Kim and Kim [7] analyzed the wind characteristics of Yulchon to study the possibility of constructing a wind farm of 30 MW power production capacity. Best-suited wind turbines were selected using a detailed economic as well as technical analysis. There are several other studies as well, in which wind energy potential in different parts of the country was assessed [8,9,10,11,12,13,14,15,16].
There are studies that have been conducted recently to estimate the total wind energy potential of South Korea. For instance, Kim et al. [17] conducted research to estimate the wind potential of the country using a Korean wind map and an environmental conservation value assessment map. They analyzed the wind characteristics and wind potential by considering not only the economic aspects but also environment regulations. They stated that almost 80% of the country’s total area has wind power density (WPD) of less than 250 W/m2 (low), whereas only 4.3% has high WPD (i.e., 450 W/m2 or more). The total wind resource potential was estimated to be 95.9 GW. Another study conducted by Kim et al. [18] estimated the wind resource potential in the mountainous regions of South Korea. They calculated the potential of wind energy in some areas such as Gangwon and it corresponded to a value of approximately 9 GW.
Some onshore and offshore wind farm projects have recently been announced by local governments, the central government, and some private developers. For instance, it was announced in 2010 that an offshore wind farm will be constructed on the west coast of the country, with a cumulative capacity of 2.5 GW. This project will be the largest offshore wind farm in the world and the South Korean government will invest 8 billion euros on the project. The project will be completed in three phases by South Korean companies, led by KEPCO. The first stage of the project, the construction of a 100 MW demonstration wind farm, was initiated in 2011 and completed in 2014. Wind turbines with capacities of 3 MW to 7 MW will be installed and the cost of wind turbines is expected to be 314 million euros. Doosan is the main supplier of the wind turbines for this project. 
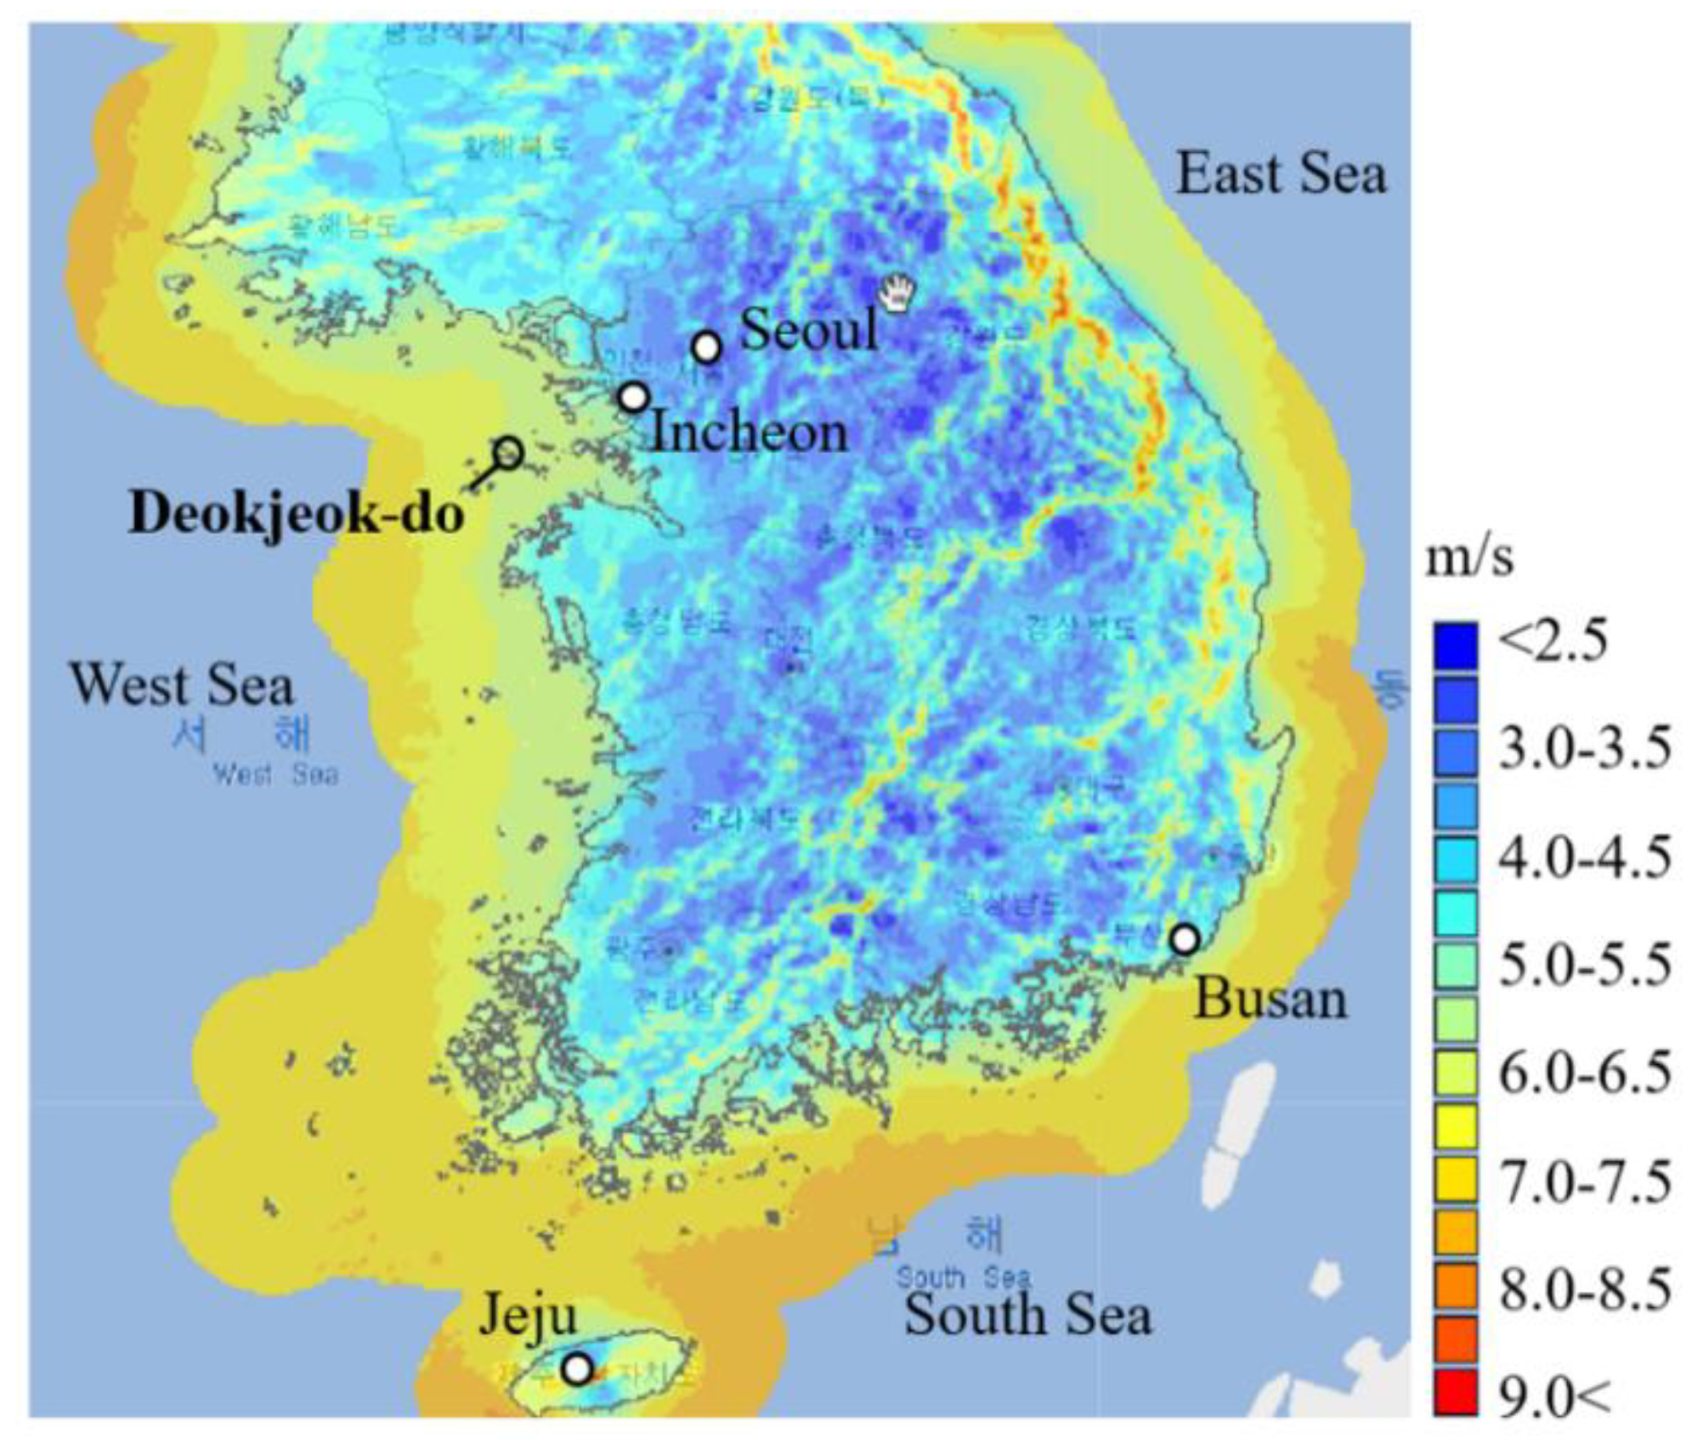
Figure 1 shows the mean wind speed at 40 m above ground level in South Korea [19]. The wind speed is relatively higher in the coastal areas of the country, as shown in Figure 1.
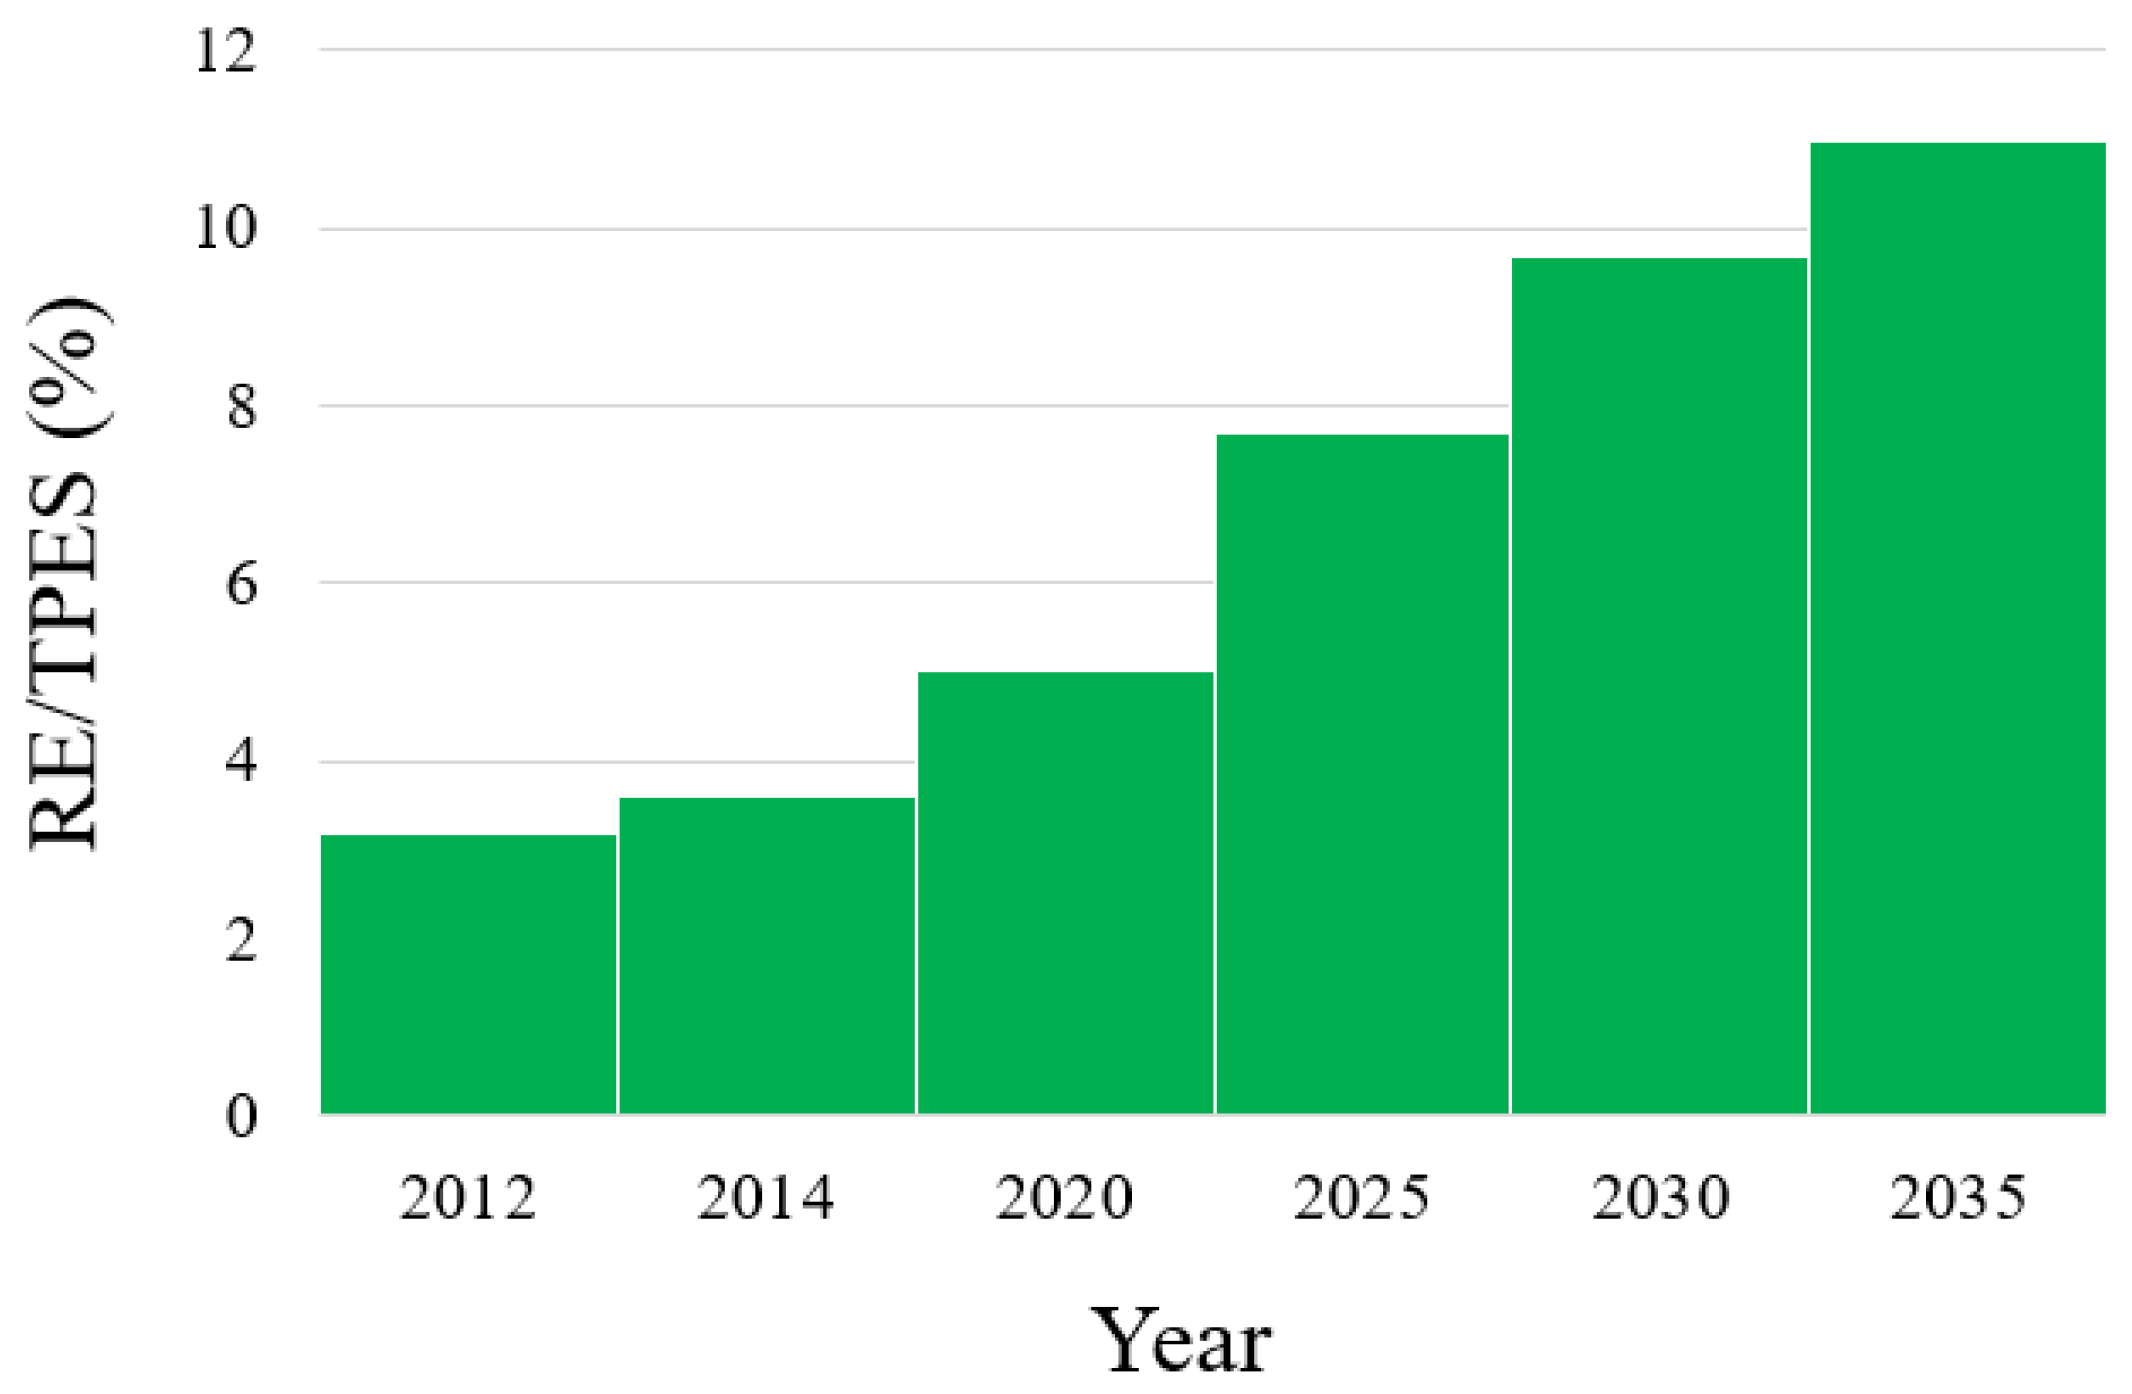
Initially, the South Korean government announced a feed-in-tariff (FIT) system to regulate the share of new and renewable energy (NRE) technologies in total primary energy supply (TPES). However, this system was only valid until 2011, and it was abandoned after that date due to economic reasons. Then in 2012, FIT was replaced by a modern and state-of-the-art plan for renewable energy called the renewable portfolio standard (RPS). According to this new system, the share of the renewable energy was set to be 11% of TPES at the end of 2035, as announced in the 2nd Energy Meeting, held on 19th September, 2014 under the 4th Basic Plan for NRE. The exact share of the renewables in TPES, according to different years, can be found in Figure 2. More details about the RPS and its connection with the energy policy of South Korea can be found here [20,21].
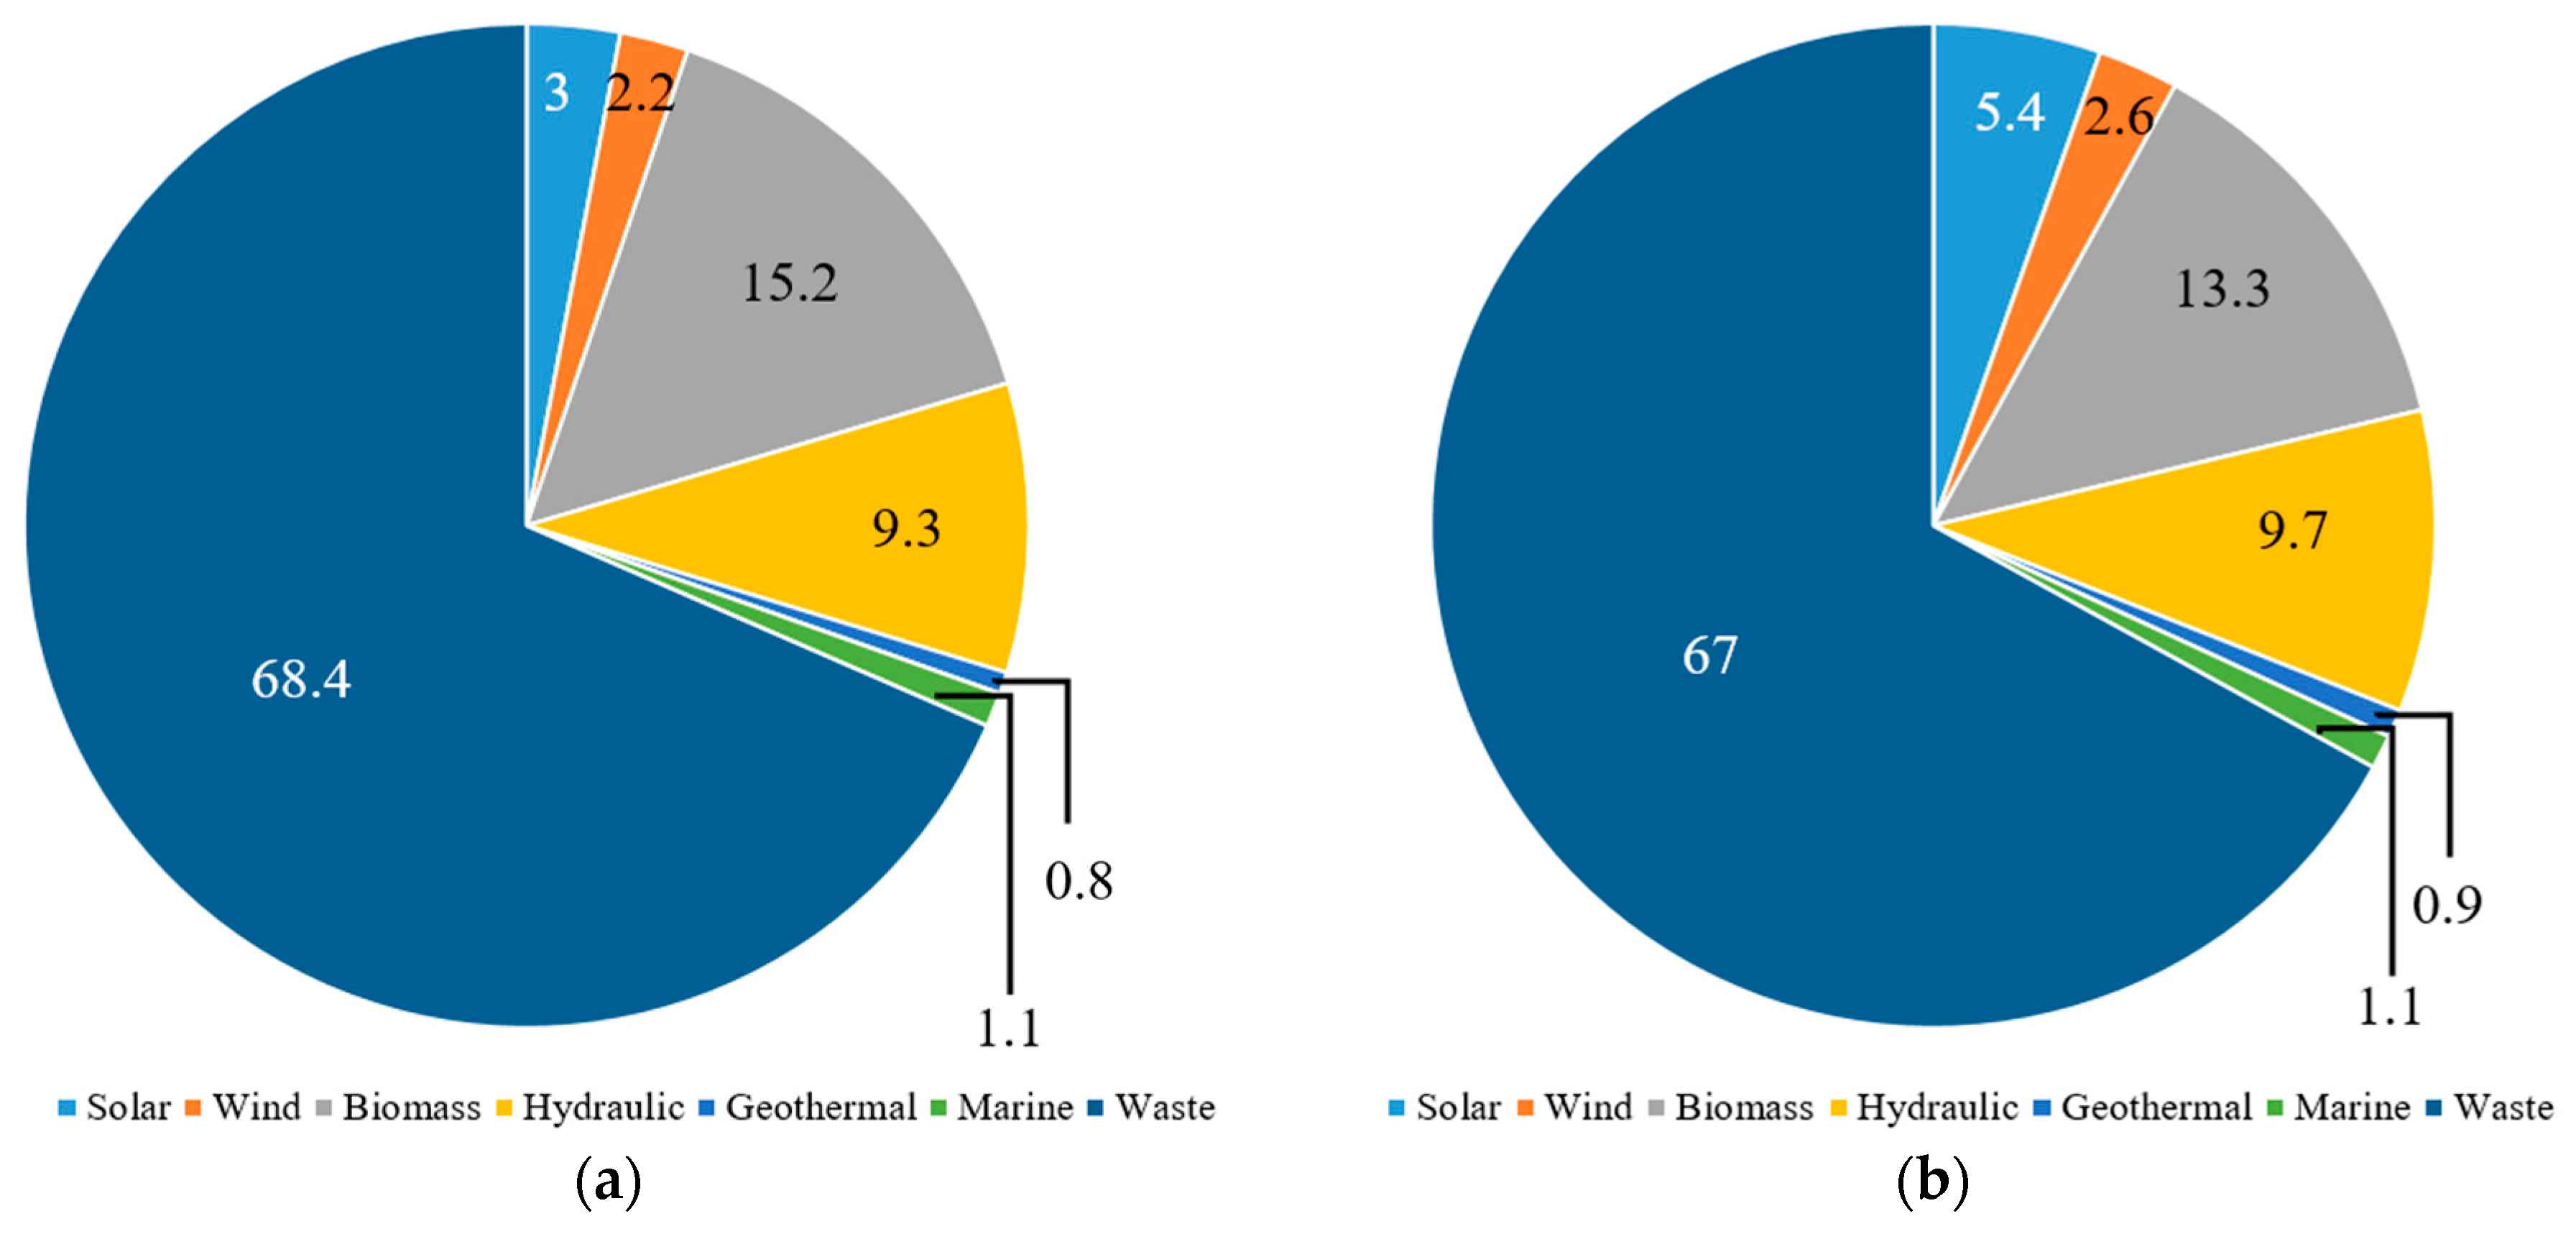
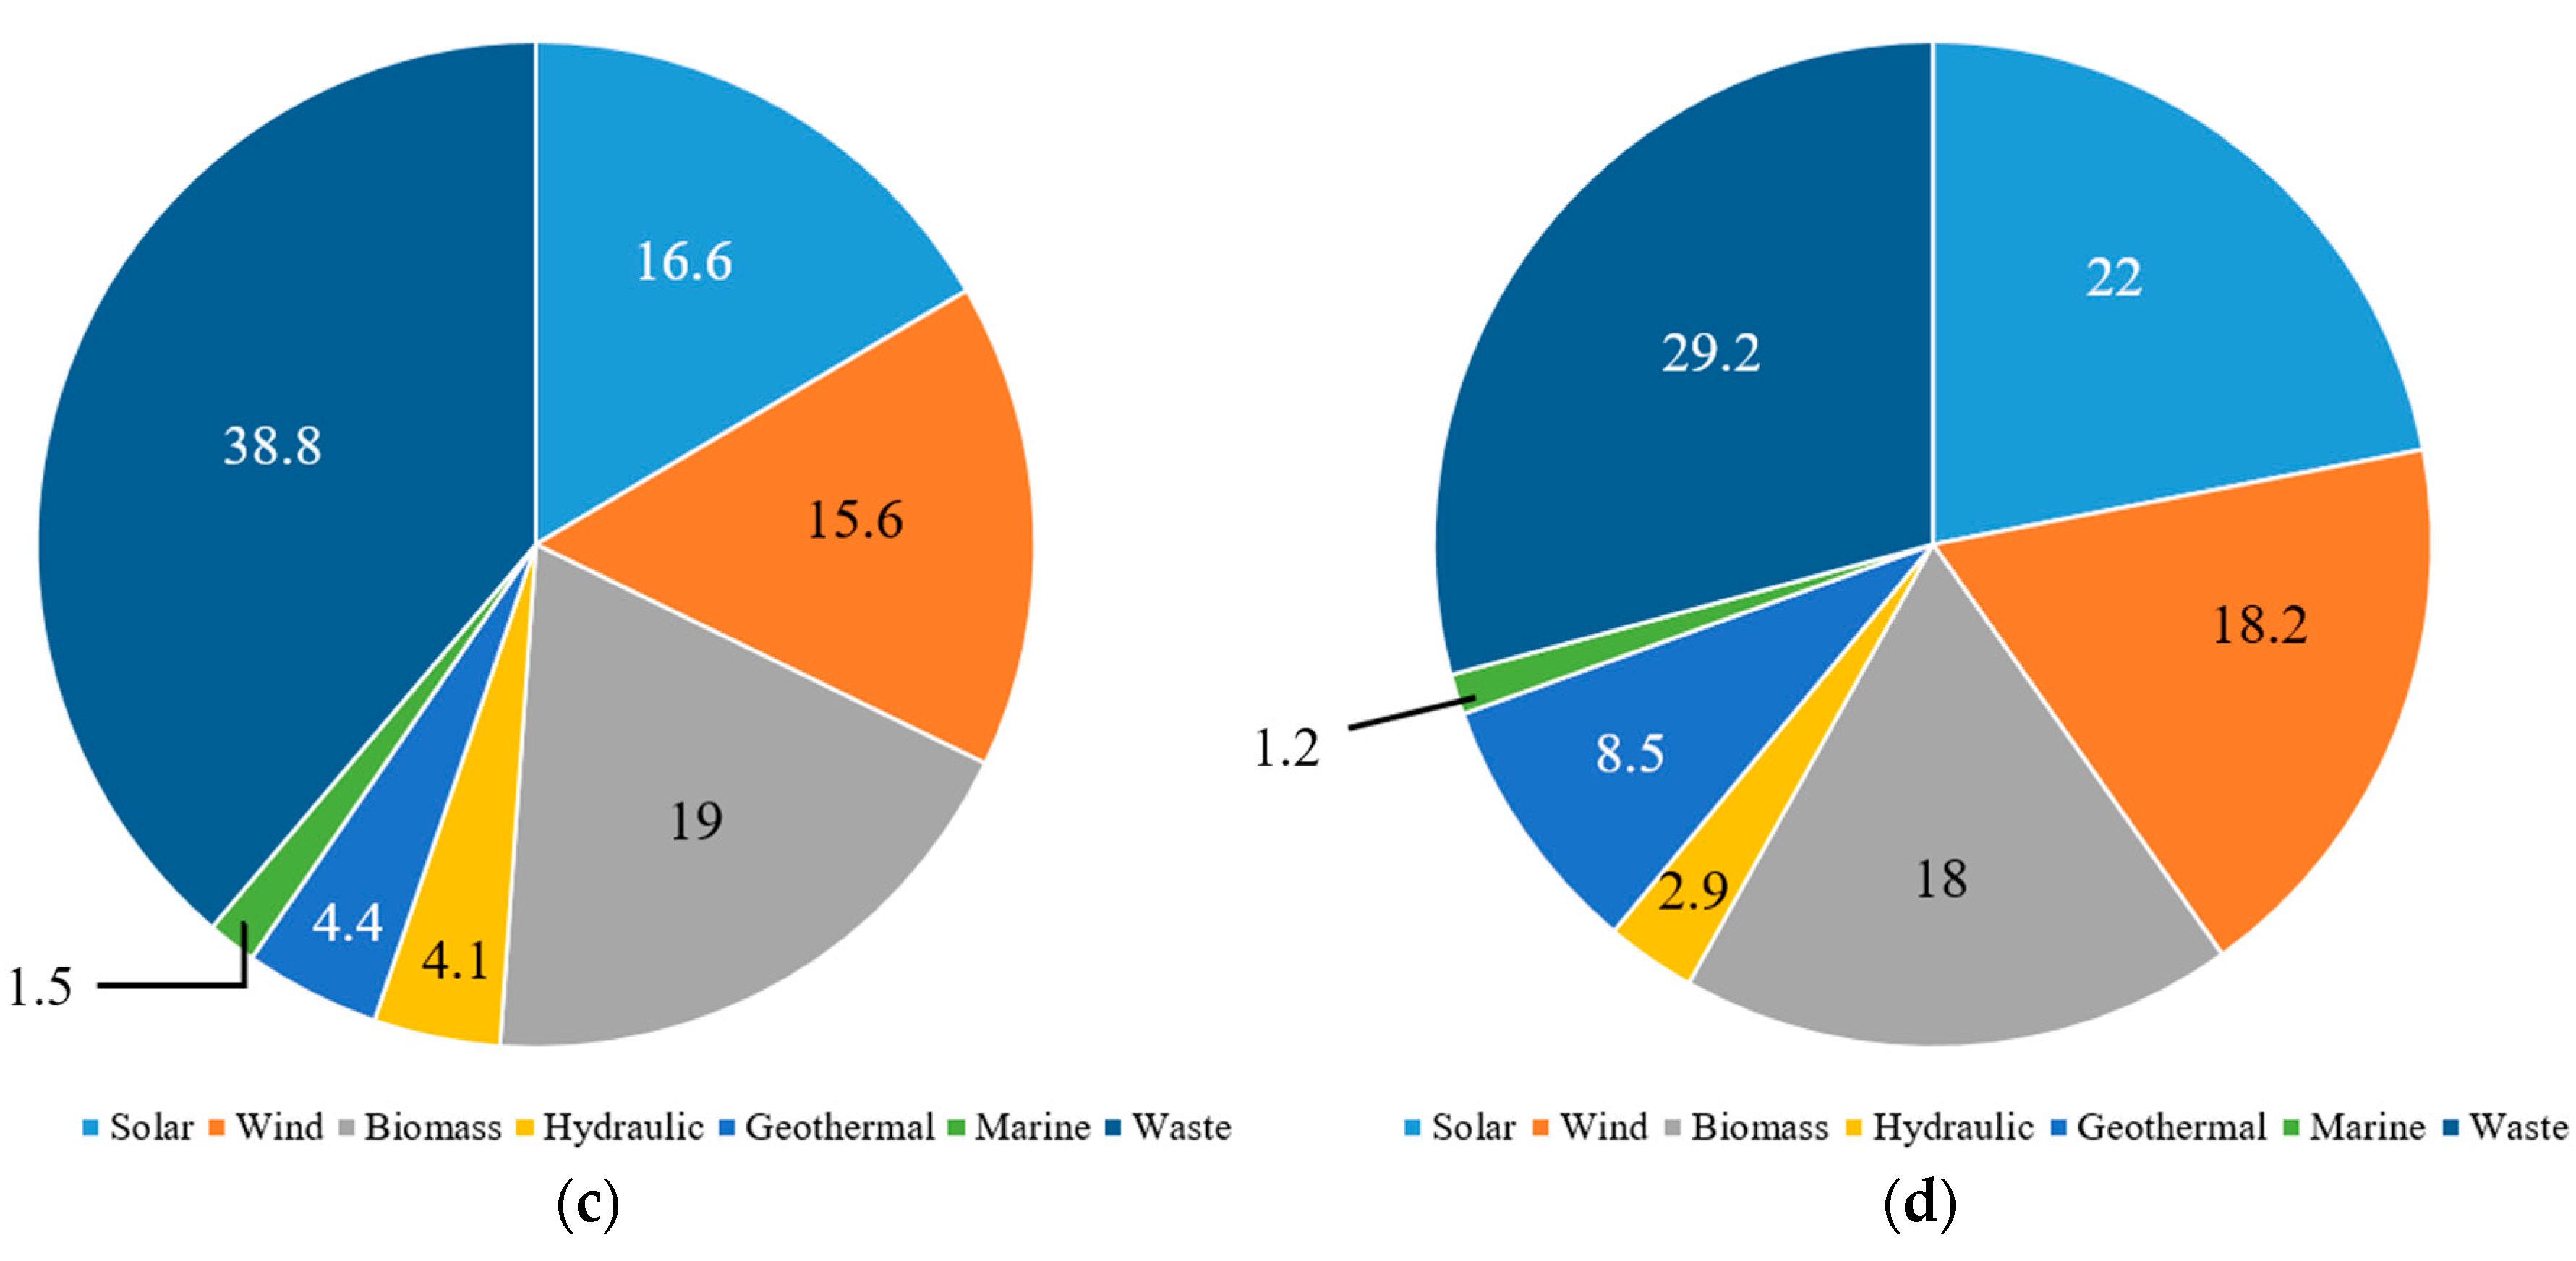
Figure 3 shows the target fractions of different NRE technologies for upcoming years as dictated in the RPS. The government plans to reduce the high percentage of waste (biomass), while increasing the percentages of wind and geothermal resources in upcoming years. In fact, the Ministry of Trade, Industry, and Energy announced that incentives for wind farm operators will be increased, and subsidies for biomass producers will be reduced, thus promoting more eco-friendly energy sources.
As stated in Figure 2, at the end of 2020, NRE supply of TPES will be 5%, out of which 15.6% share must be of wind energy, as shown in 
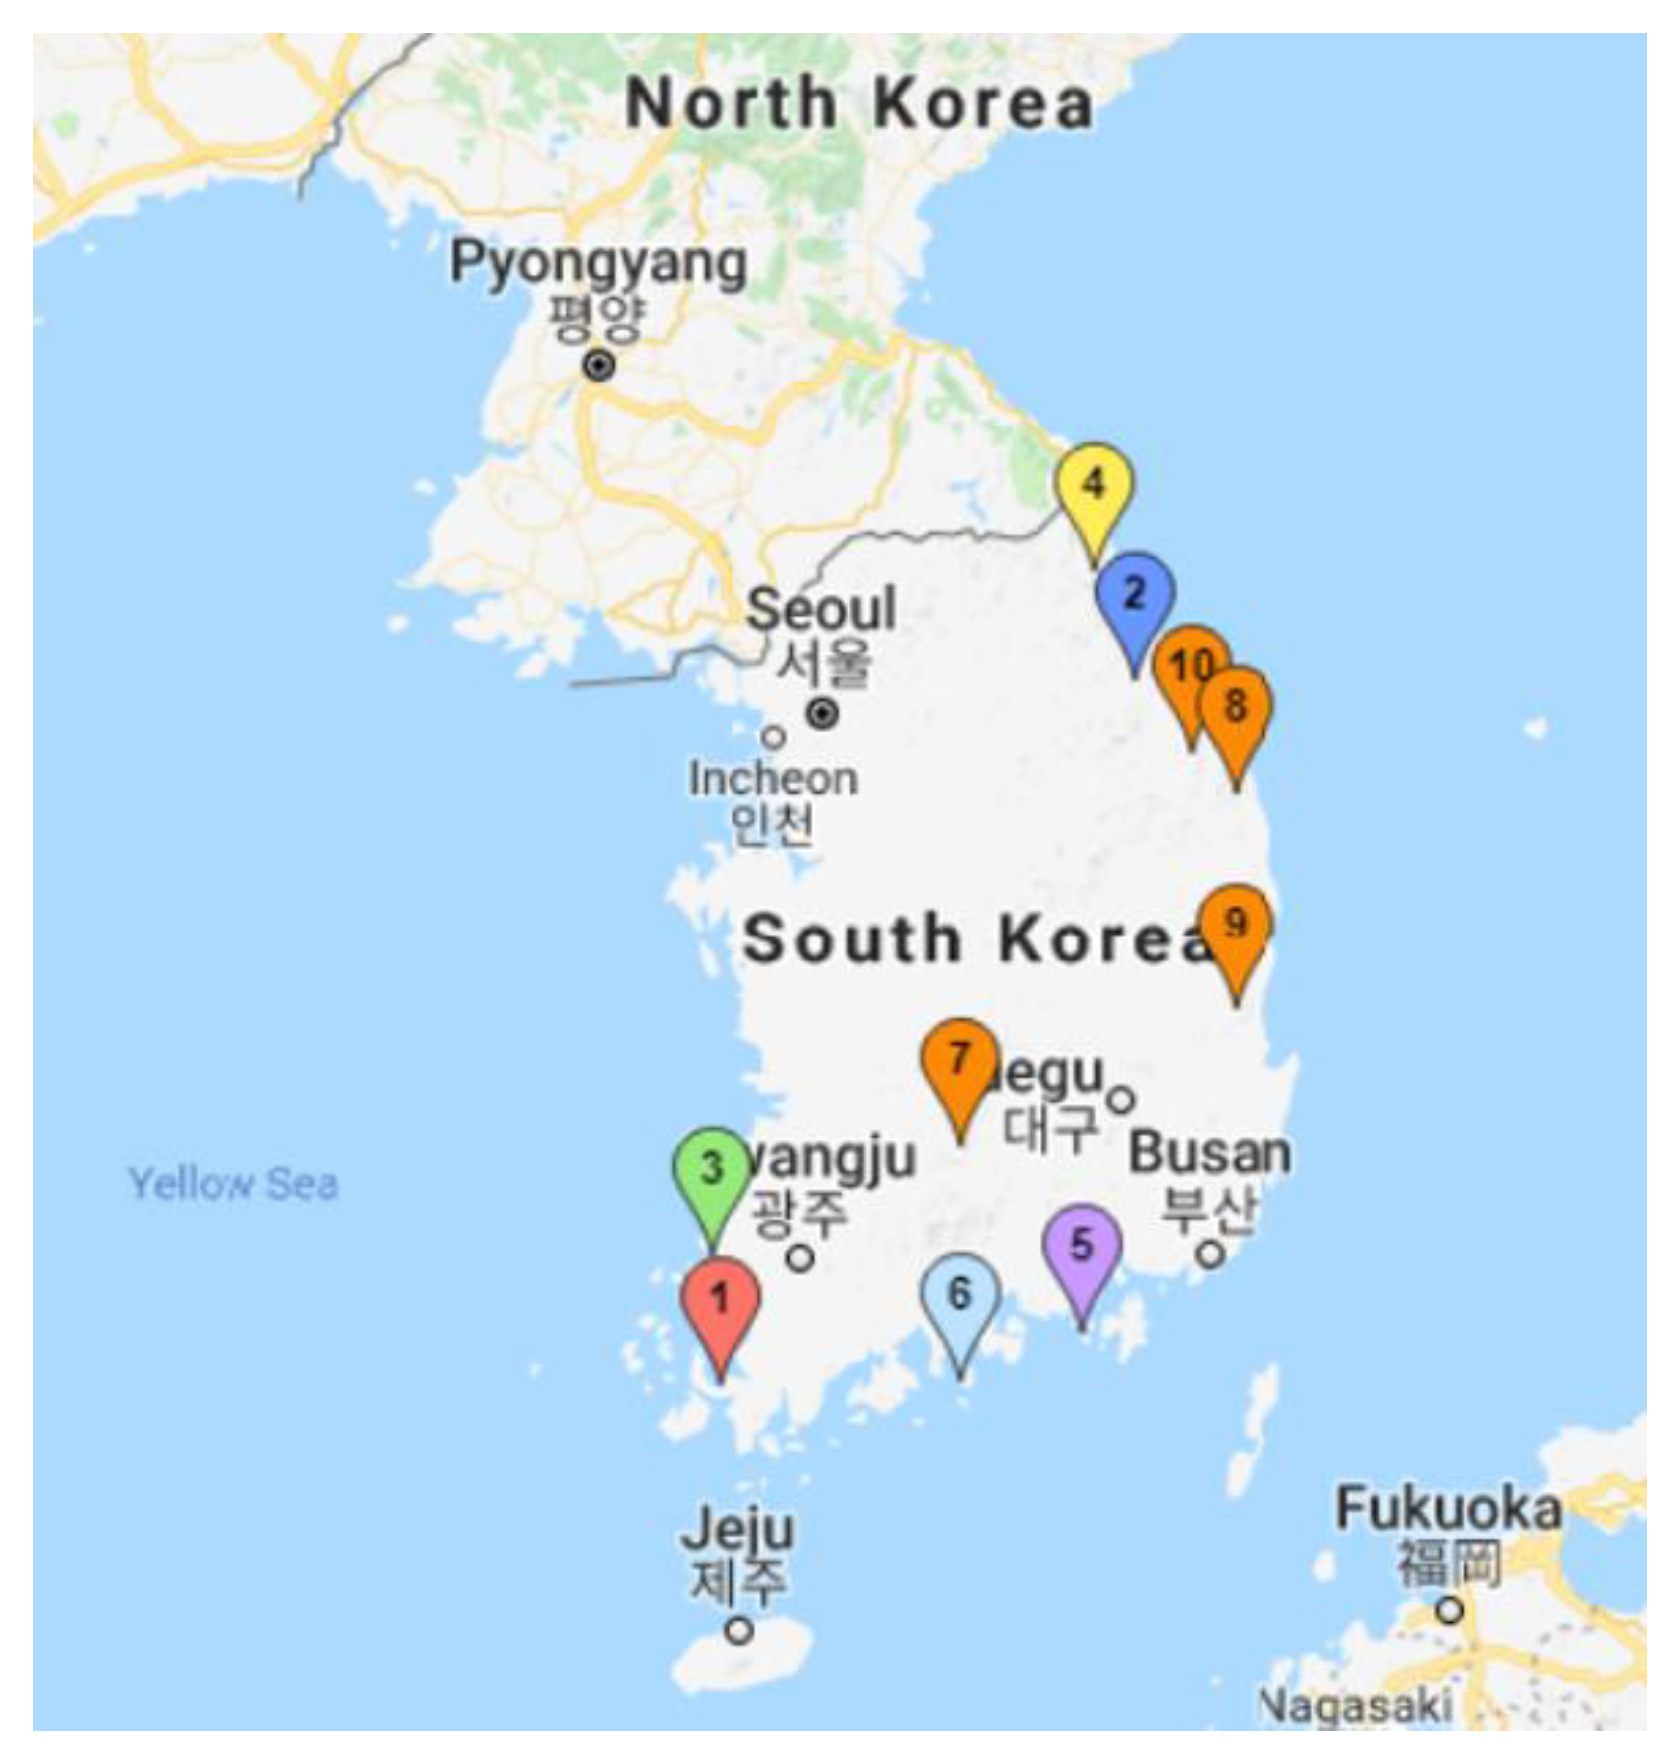
Figure 3c (it corresponds to 0.78% of TPES at the end of 2020). Therefore, there is always an urgent need to build new wind farms. Currently, there are total 80 wind farm sites (both onshore and offshore) in South Korea as of 2016. Table 1 provides a summary of currently operating wind farms in the country.
In the present study, new onshore wind farm sites selected in South Korea have been proposed based on a comprehensive techno-economic analysis. The sites were located by a GIS–MCDM (geographic information system–multi-criteria decision-making) method and detailed techno-economic assessment has been performed for the selected sites. The main focus of the current work is to determine the right type of wind turbines for each site considering local wind conditions, EWS and turbulence intensity (TI). Selection of wind turbine is the most fundamental and vital step of wind farm design process, as determining the optimal and best-suited wind turbine will ensure maximum profits and electricity yields. International electrotechnical commission (IEC) has provided its guidelines to select wind turbines for wind farms and the same methodology will be adopted in the current study. According to the IEC, analyzing the local wind conditions and estimation of EWS and TI are the main pre-requisites for selecting the appropriate type of wind turbine for any wind farm site. Section 2 will provide all the essential details about wind conditions, EWS, TI, and selected wind turbines.

2. Selection of Wind Turbines for Newly Proposed Wind Farm Sites

2.1. The Wind Farm Sites and Local Wind Potential

To determine the promising onshore wind farm sites in South Korea, ten sites are determined using previous research results [22]. Table 2 provides all the essential information about the ten sites proposed in the present study.
Figure 4. shows the geographical positions of all ten sites recommended in this study. Most of the sites are situated on the eastern side of the peninsula, as wind conditions are very good in that part of the country, as shown in Figure 1.
To estimate the wind potential and analyze the wind conditions at each proposed site, wind data was obtained from the Korean Meteorological Administration (KMA) website [24]. The wind data were collected at a height of 10 m at 10-min intervals for 17 consecutive years (2000–2016) at all ten sites. The KMA allows access to these data sets only for research and development (R&D) purposes, and permission was given by the KMA to use this data in the current research.
A wind rose is a diagram that describes the wind conditions at a particular site. Wind rose diagrams were prepared for all sites and are presented in Figure 5. Most of the sites have WPD in a range of 600 W/m2 to 900 W/m2 except sites 8, 9, and 10, where WPD can reach up to 1000 W/m2 (excellent wind conditions at 10-m height). Similarly, it can be seen in Figure 5 that there are two prevailing wind directions, northeast and southwest (0° is considered to be north). It is crucial to determine wind direction, as it can affect the power production of a wind turbine (especially horizontal wind turbines). In this way, the power production of a wind farm can be optimized.
Figure 6 show the percentage frequency of different wind speeds at 90 m height (typical hub height of wind turbine). As shown in the figures, the most frequently occurring wind speeds are in the range of 6 m/s to 13 m/s at all sites. It is also critical to determine the range of frequently occurring wind speeds, so that the right type of wind turbines can be installed at each location. Therefore, any wind turbines with cut-in and cut-out wind speeds corresponding to 4 m/s and 15 m/s, respectively, would be ideal for the proposed wind farm sites.
Weibull-shape parameter (k) and scale factor (c) are two of the most important parameters that need to be estimated when analyzing wind energy potential. Both can be calculated by following the equations:
k = ( σ v m ) 1.086   ( 1 k 10 )
c = v m Γ ( 1 + 1 / k )
where σ is the standard deviation in wind speed, vm is mean wind speed, and Γ is gamma function.
Similarly, the other two important parameters are wind speed with most chance of occurring (vmp) and maximum energy-carrying wind speeds (vmax.E).
v m p = c ( 1 1 k ) 1 / k
v m a x E = c ( 1 + 2 k ) 1 / k
Table 3 summarizes the important statistical parameters for all ten sites calculated at 90 m height. Mean wind speeds are highest (9.82 m/s) at Site 8, and lowest (7.48 m/s) at Site 7. Table 3 also shows the EWS occurring at each site, and the year of the EWS occurrence. Accurate estimations of the EWS are critical from the viewpoint of the safety of the wind turbine, as very high values may break the wind turbine. Most probable wind speed (Vmp) is very similar in Table 3 and in Figure 6 for each site. As shown in Table 3, out of the ten sites, seven are IEC class 7 (highest wind class), two sites are IEC class 6, and the remaining one is IEC class 5.

2.2. Estimation of Extreme Wind Speed (EWS)

IEC has defined wind turbine classes based on wind conditions, especially 50-year return gust wind speed, which is the maximum wind speed occurring during a 50-year time period. Table 4 shows the wind turbine classes as categorized by IEC (IEC regulation 61400-1).
Extreme wind speed was calculated using the theorem of Von Mises (1936) and it is explained in Equation (5) in which “t” is time in years [25].
E W S = β α l n [ ln ( 1 1 t ) ]
In Equation (5), β is termed as location factor (y-intercept of Gumbel plot) whereas α is called the scale factor (slope of Gumbel plot), respectively.
To plot Figure 7, Equations (6)–(8) can be used which use parameter “x” as measured EWS, estimated using real measured wind data, and parameter “y” is Gumbel reduced variate (GRV).
x = α y + β
y = G R V = y G u m b e l = l n { ln [ F ( x ) ] }
t = 1 1 F ( x )
In Equation (8), F(x) is the chance of occurring EWS within given time period and it can be calculated using the real measured wind data by adopting the Von Mises theorem as stated above.
Figure 7 shows the estimated 50-year EWS determined using Von Mises algorithm at all ten locations. It is clear from this figure that all ten locations have very low 50-year return gust, so according to Table 4, all wind turbine classes are suitable for each site.

2.3. Estimation of Turbulence Intensity (TI)

The second very important parameter when selecting a suitable wind turbine is TI, which is defined as the ratio between standard deviation (SD) in measured wind speed and mean wind speed. TI determines the sub-class (A, B, and C) of the wind turbine, which is critical from a safety point of view. Figure 8 shows the TI ranges according to measured wind speed as declared by IEC.
Figure 9 shows the calculated TI at different wind speeds at all ten locations. It is apparent from Figure 9 that all sub-classes of wind turbines are suitable for all ten sites as TI is significantly lower than prescribed by IEC as mentioned in Figure 8.

2.4. The Selected Wind Turbines

To perform a techno-economic analysis, five wind turbines were shortlisted, and their power curves are shown in Figure 10. All five wind turbines meet all the essential criteria, such as EWS and TI, as mentioned above. The main reason for selecting these wind turbines is the fact that they are manufactured by South Korean companies, so the overall cost of the wind turbine will be comparatively less.
Table 5 shows the characteristics of wind turbines shortlisted for current study. All these machines have very low transportation and maintenance expenditures because of the fact that they are produced in South Korea. The names of all wind turbine models use same conventions i.e., “wind turbine model rotor diameter/rated power”. For example, wind turbine WinDS 91.3/3000 means that this wind turbine has rotor diameter of 91.3 m and 3000 kW as rated power.

3. Results and Discussion

3.1. Economic and Technical Methodology

The average power generated by wind turbine can be theoretically determined using the following equation.
P a v e = 0 P t ( v ) f ( v ) d v
In Equation (9), the power curve of each wind turbine is represented by Pt(v) whereas f(v) represents Weibull probability density function. Equation (9) can be expanded into the following equation to calculate the power produced by a wind turbine [25].
P a v e = i = 1 N B 0.5 ( v i + 1 v i ) [ f ( v i + 1 ) P t ( v i + 1 ) + f ( v i ) P t ( v i ) ]
Finally, Equation (10) was used to estimate the annual energy production and capacity factor for each wind turbine as follows.
A E P = P a v e × t
C F = P a v e P R
It is important to mention that all the calculations were carried out with 3% grid losses, 1% transformer losses, 6% wake losses, and turbine availability was taken as 95% [25].
Generally used economic parameters to evaluate a wind project are net present value (NPV) and levelized cost of electricity (LCOE).
The cost of the wind turbine, CwT (k€) can be estimated using Equation (13) [25]:
C w T = 2950 × ln ( P R ) 375.2
where P R is the rated power of wind turbine in MW. NPV is defined as follows:
N P V = t = 0 n B t ( 1 + r ) t t = 0 n   C t ( 1 + r ) t
where “t” represents time period in years, “n” is lifespan of project which is taken as 20 years, and “r” is interest rate in percentage, Bt represents benefits, and Ct represent all types of costs which are majorly divided into two groups, i.e., capital cost and annually occurring operating and maintenance (O&M) costs. Capital costs are the price of the wind turbine itself and price of constructing the tower including transportation and installation, which are taken as 30% of the initial investment price of the wind turbine [25]. The rest of the categories of capital cost have been ignored. Annually occurring expenditures include annual operating and maintenance cost (considered to be 5% of total price of a wind turbine) and annual tax on earnings from selling the electricity. Net present value must always be larger than zero.
LCOE (€/kWh) is simply the net present cost to produce a unit of electricity considering the entire life of wind farm project. Equation (15) can be used to determine LCOE [25]. (Note: The definitions of all the symbols used in Equation (15) are explained in “Nomenclature”).
LCOE = t = 1 n ( I t + O & M t D t + T t ( 1 + r ) t ) t = 1 n A E P t

3.2. Technical Analysis of Newly Proposed Sites

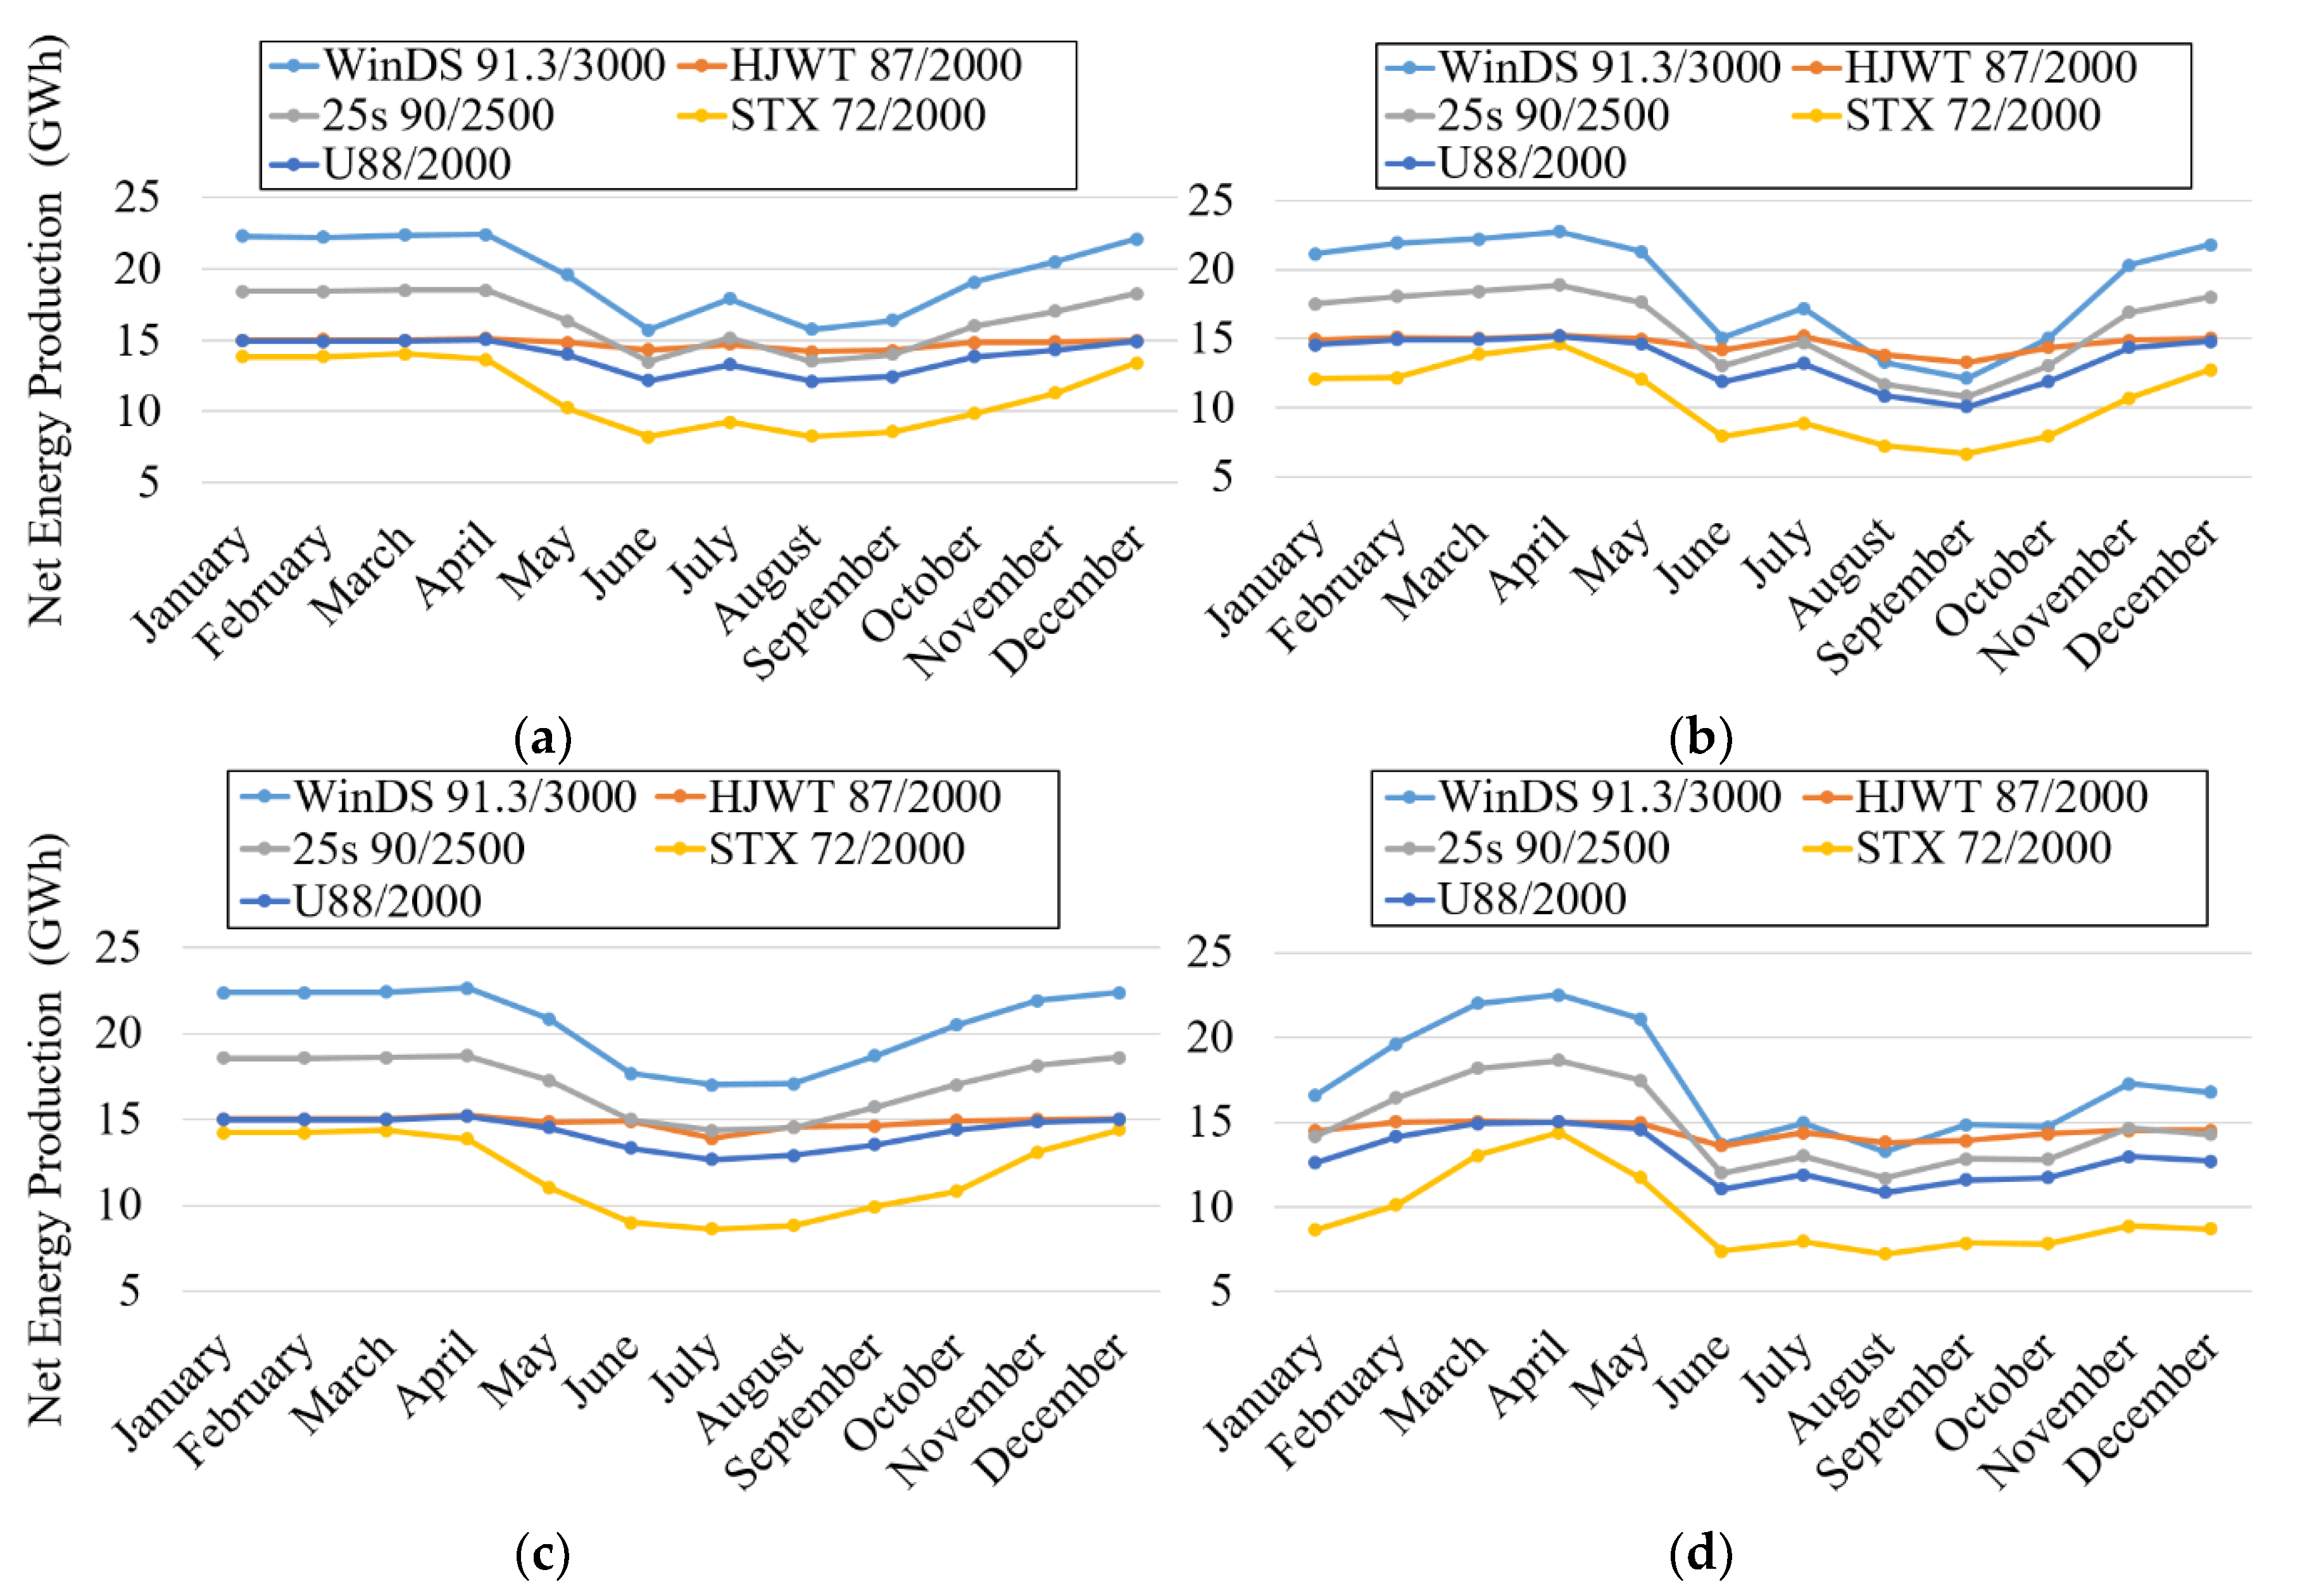
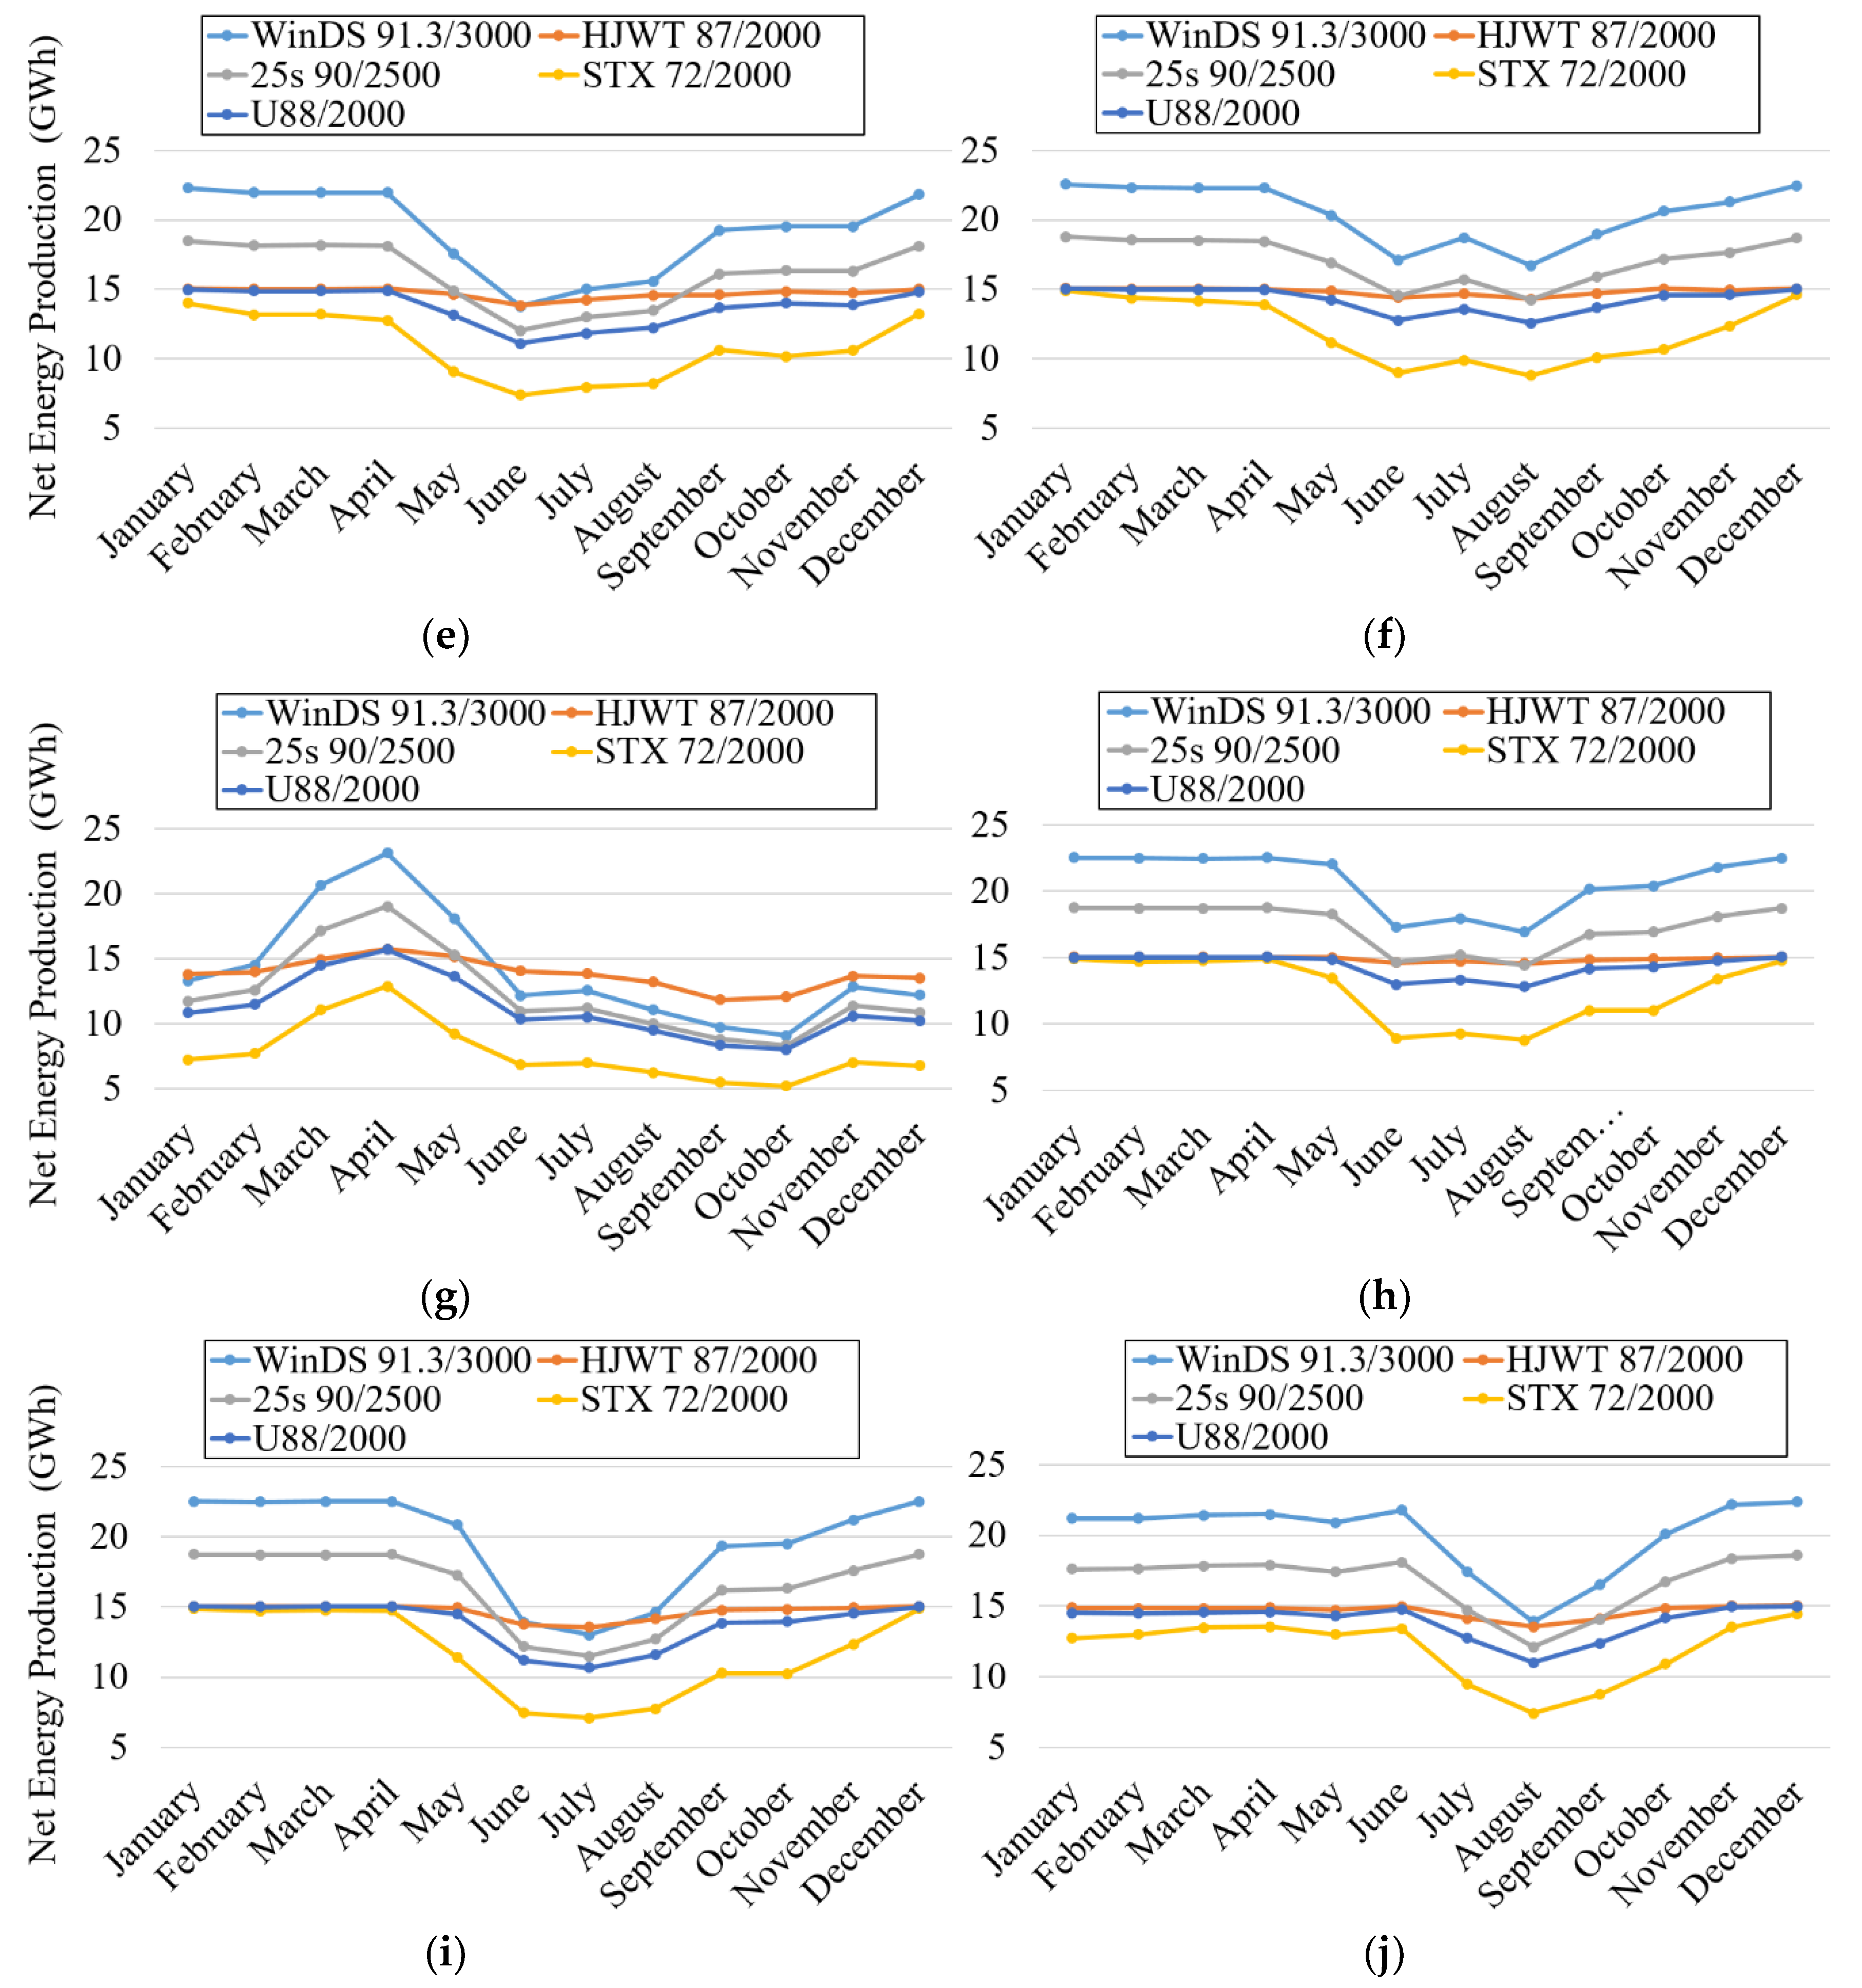
One of the most obvious and primary goals of designing a wind farm is to maximize net energy production. Here the word “net” specifies the final electricity production of the wind farm, which means that all loss types (grid losses, wake losses, transmission losses, etc.) have already been considered. Similar estimations of the net energy production were also made on a monthly basis in the current study and the results are summarized in Figure 11.
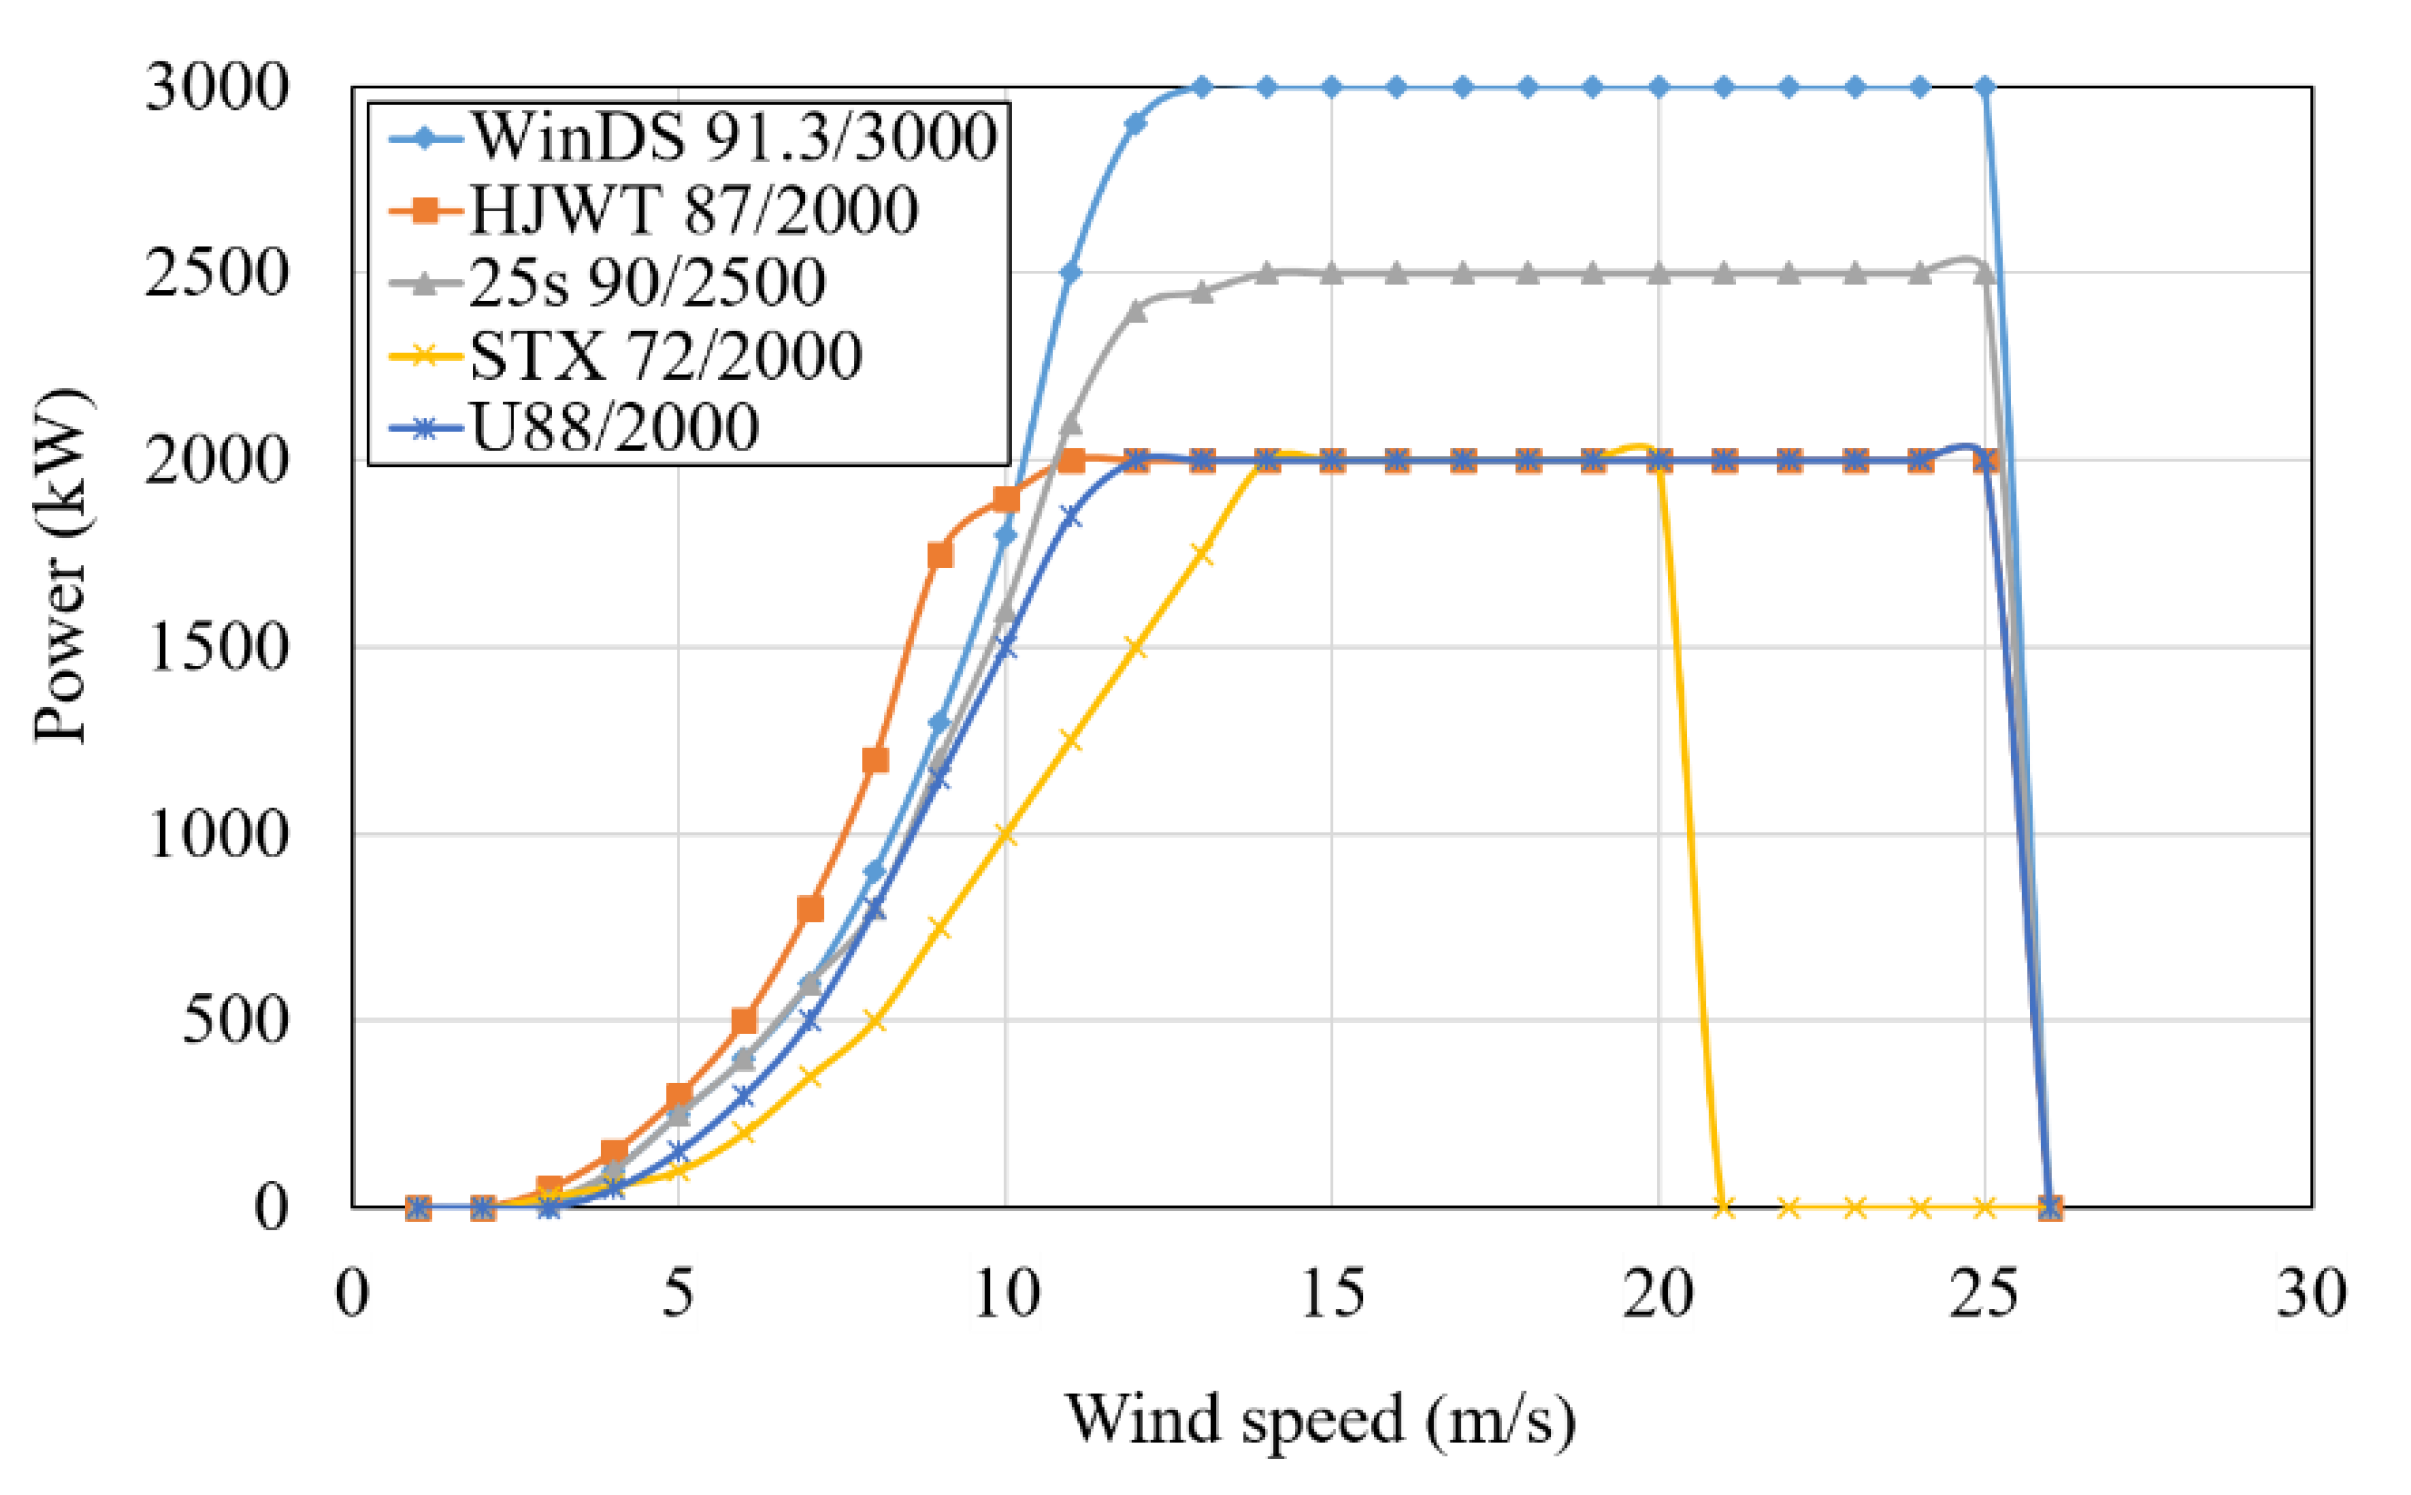
Summer (June–August) is the least “windy” season in South Korea, and therefore net energy production is relatively lower, as compared to other seasons. From Figure 11, it is apparent that the wind turbine model WinDS 91.3/3000 is the most suitable choice according to current scenario. Out of all combinations of wind turbines and sites, the maximum net AEP, up to 249 GWh, can be reached by installing WinDS 91.3/3000 at site 8. If WinDS 91.3/3000 would be installed at all ten sites simultaneously, then 2283.395 GWh of total net energy could be produced annually.
Table 6 summarizes the net annual electricity production at each site using all five wind turbines. It is apparent from Table 6 that WindDS 91.3/3000 is the best wind turbine model for each site based on annual electricity production. However, further economic analysis should be carried out to determine the right type of wind turbine for each site.
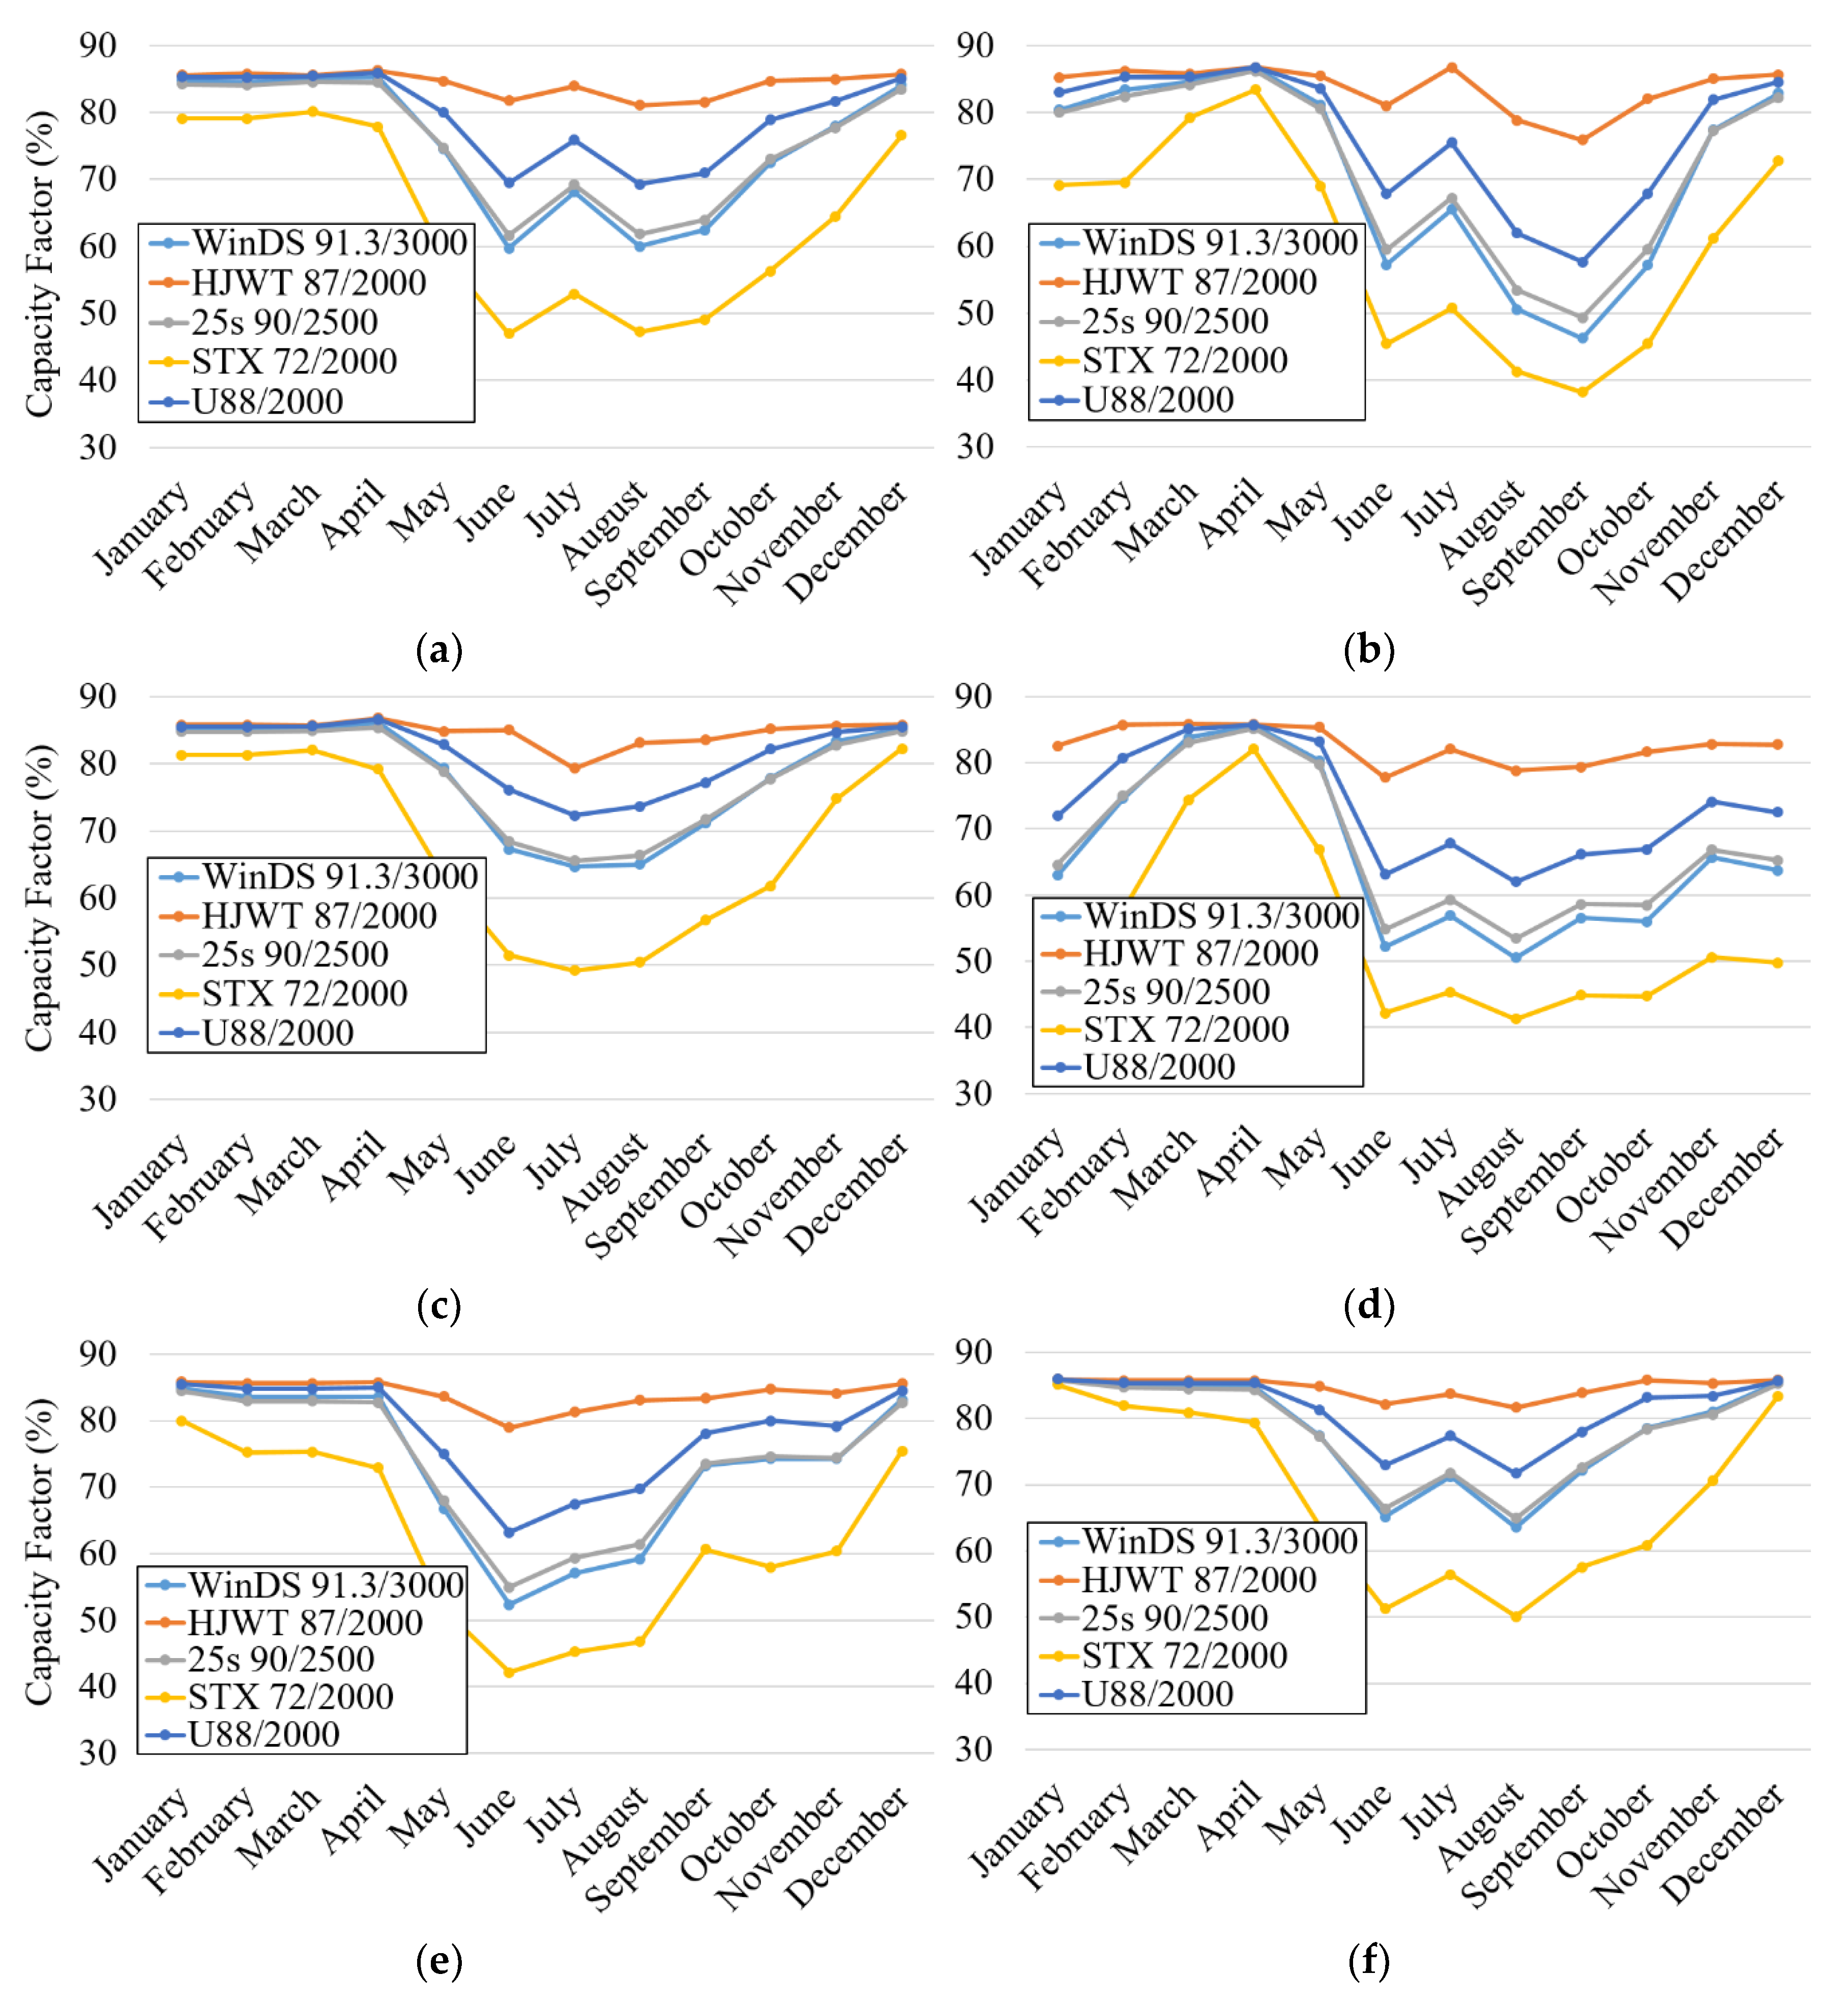
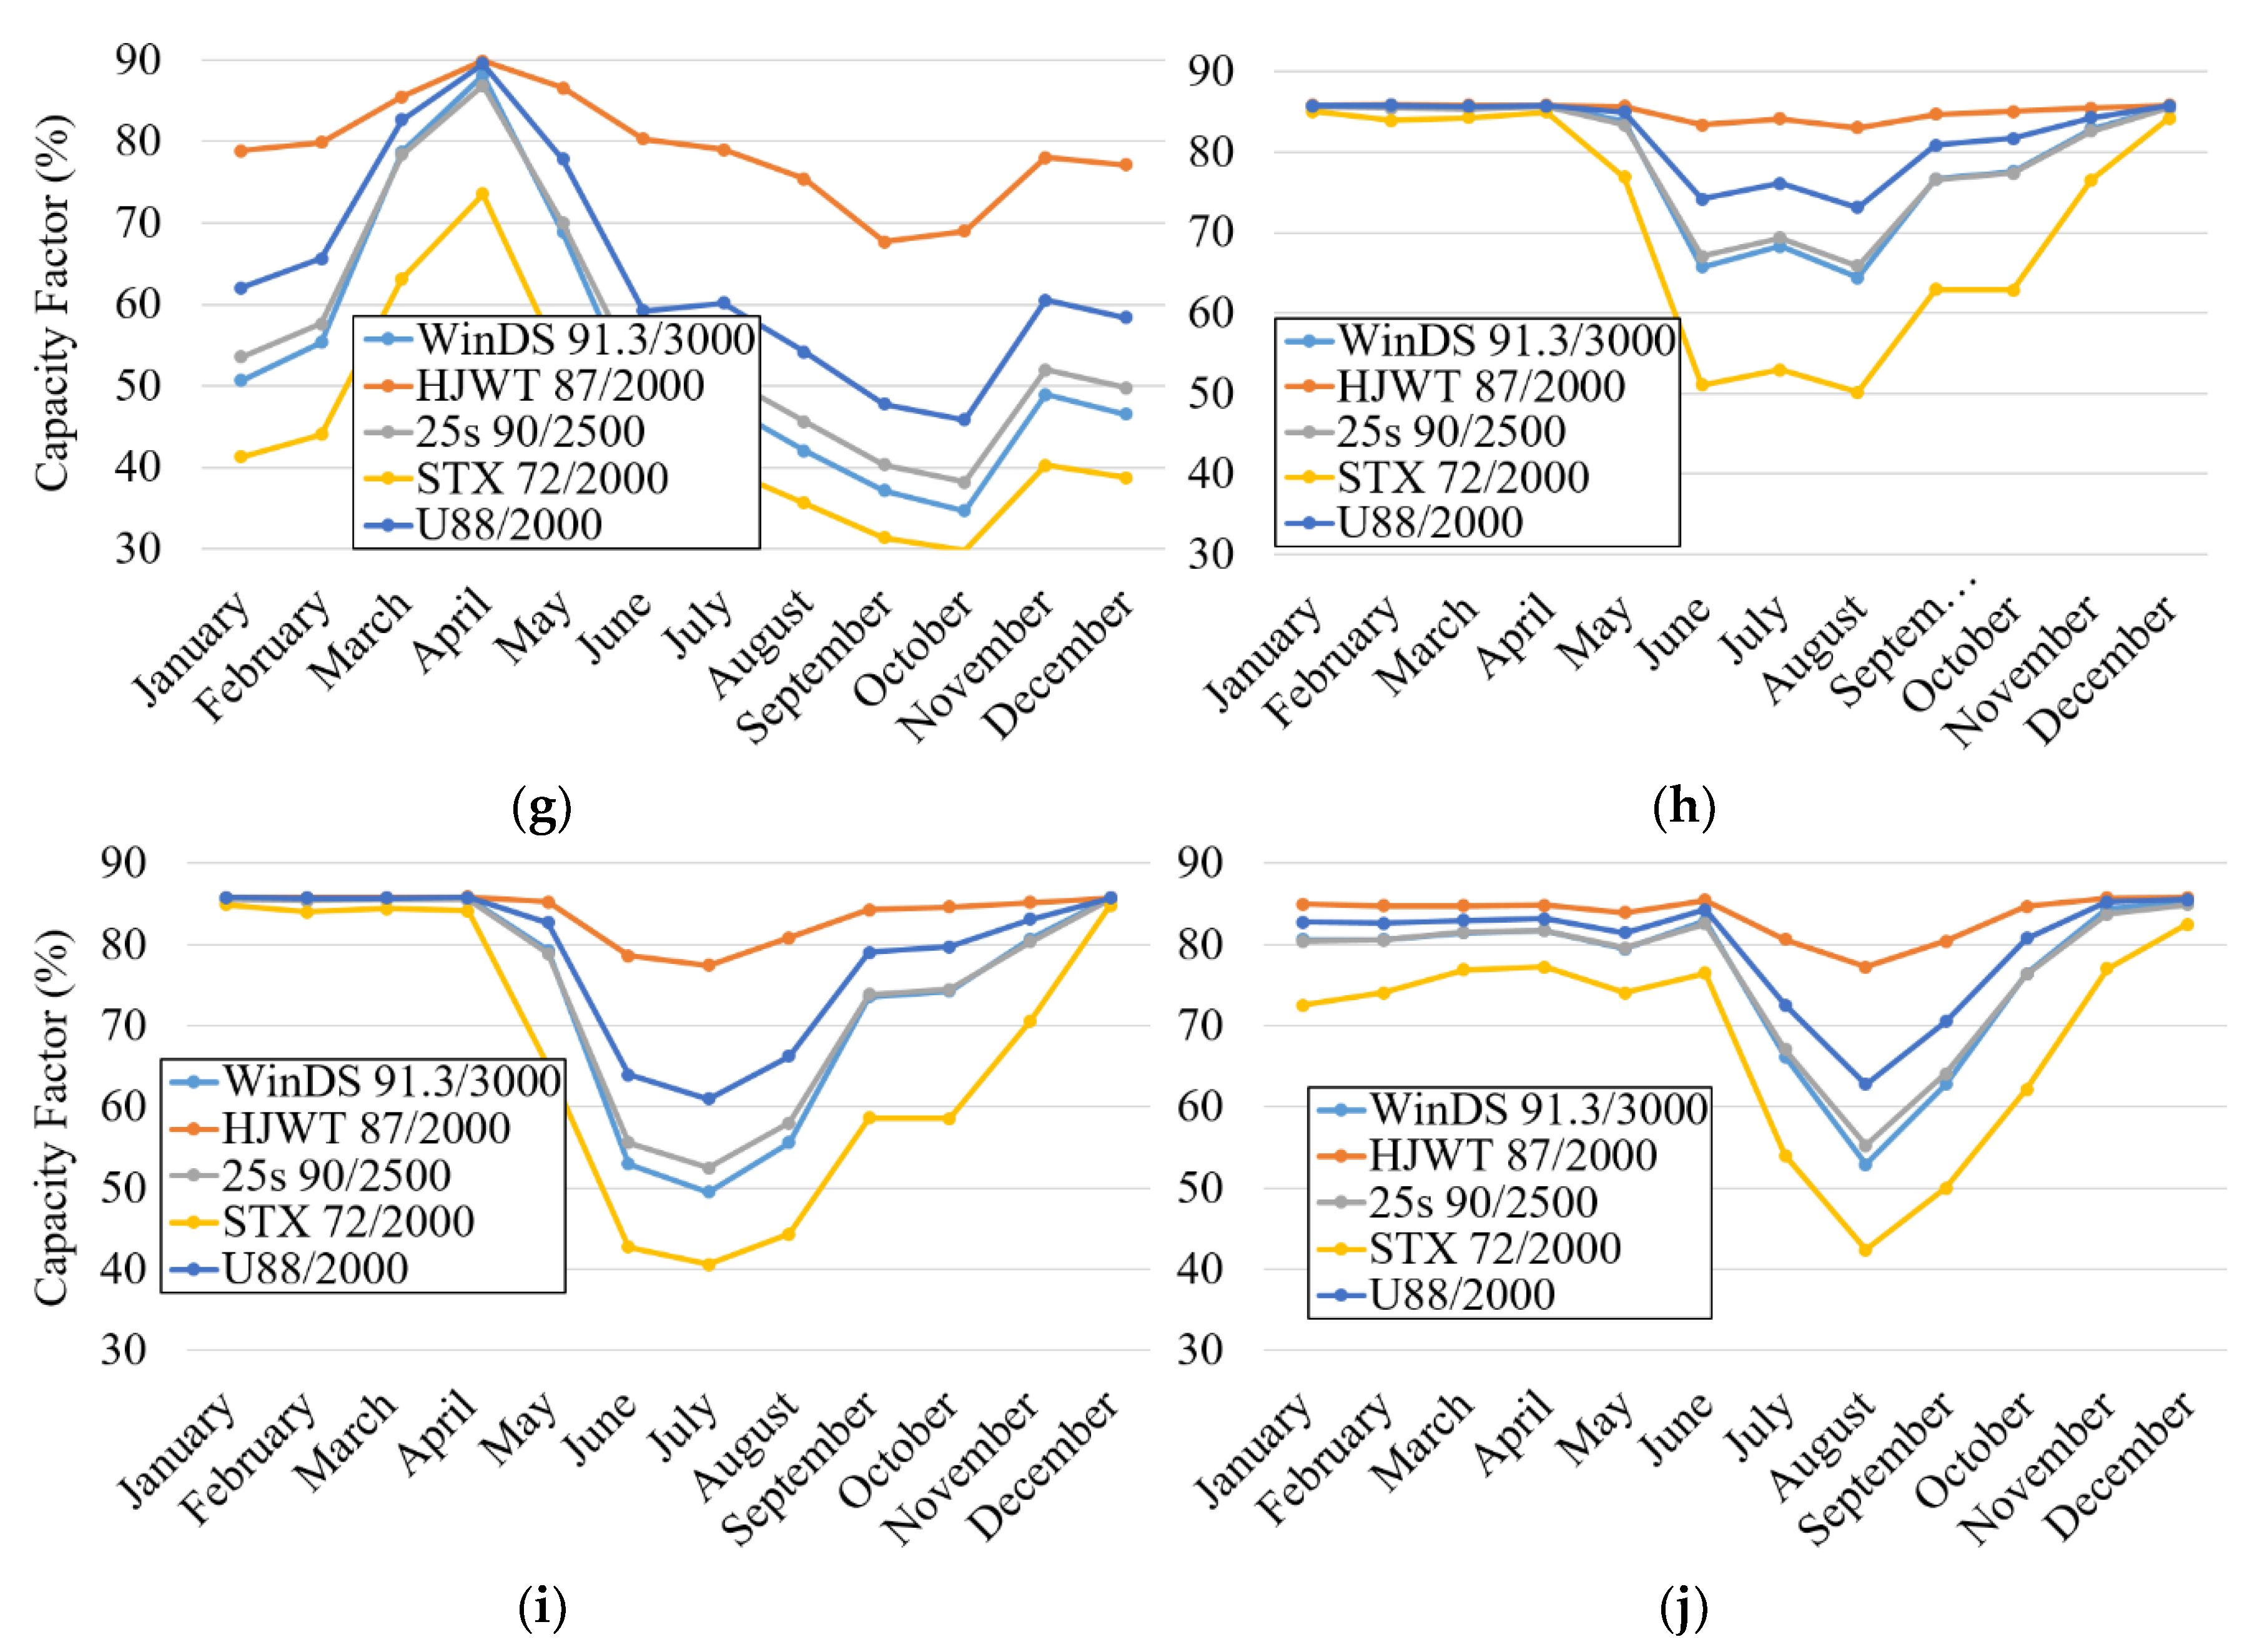
Another very important technical parameter related to wind energy is the CF. CF is the ratio of the average energy produced by the wind turbine in comparison to its rated capacity. Figure 12 shows the variation of the CF monthly for all wind turbines only for selected sites. Wind turbine model HJWT 87/2000 is be the best choice for all wind farm sites when considering the mean values of CF. Although the CF is of critical importance, it never takes precedence over net AEP, as the maximum energy production is the ultimate goal of any wind farm developer.

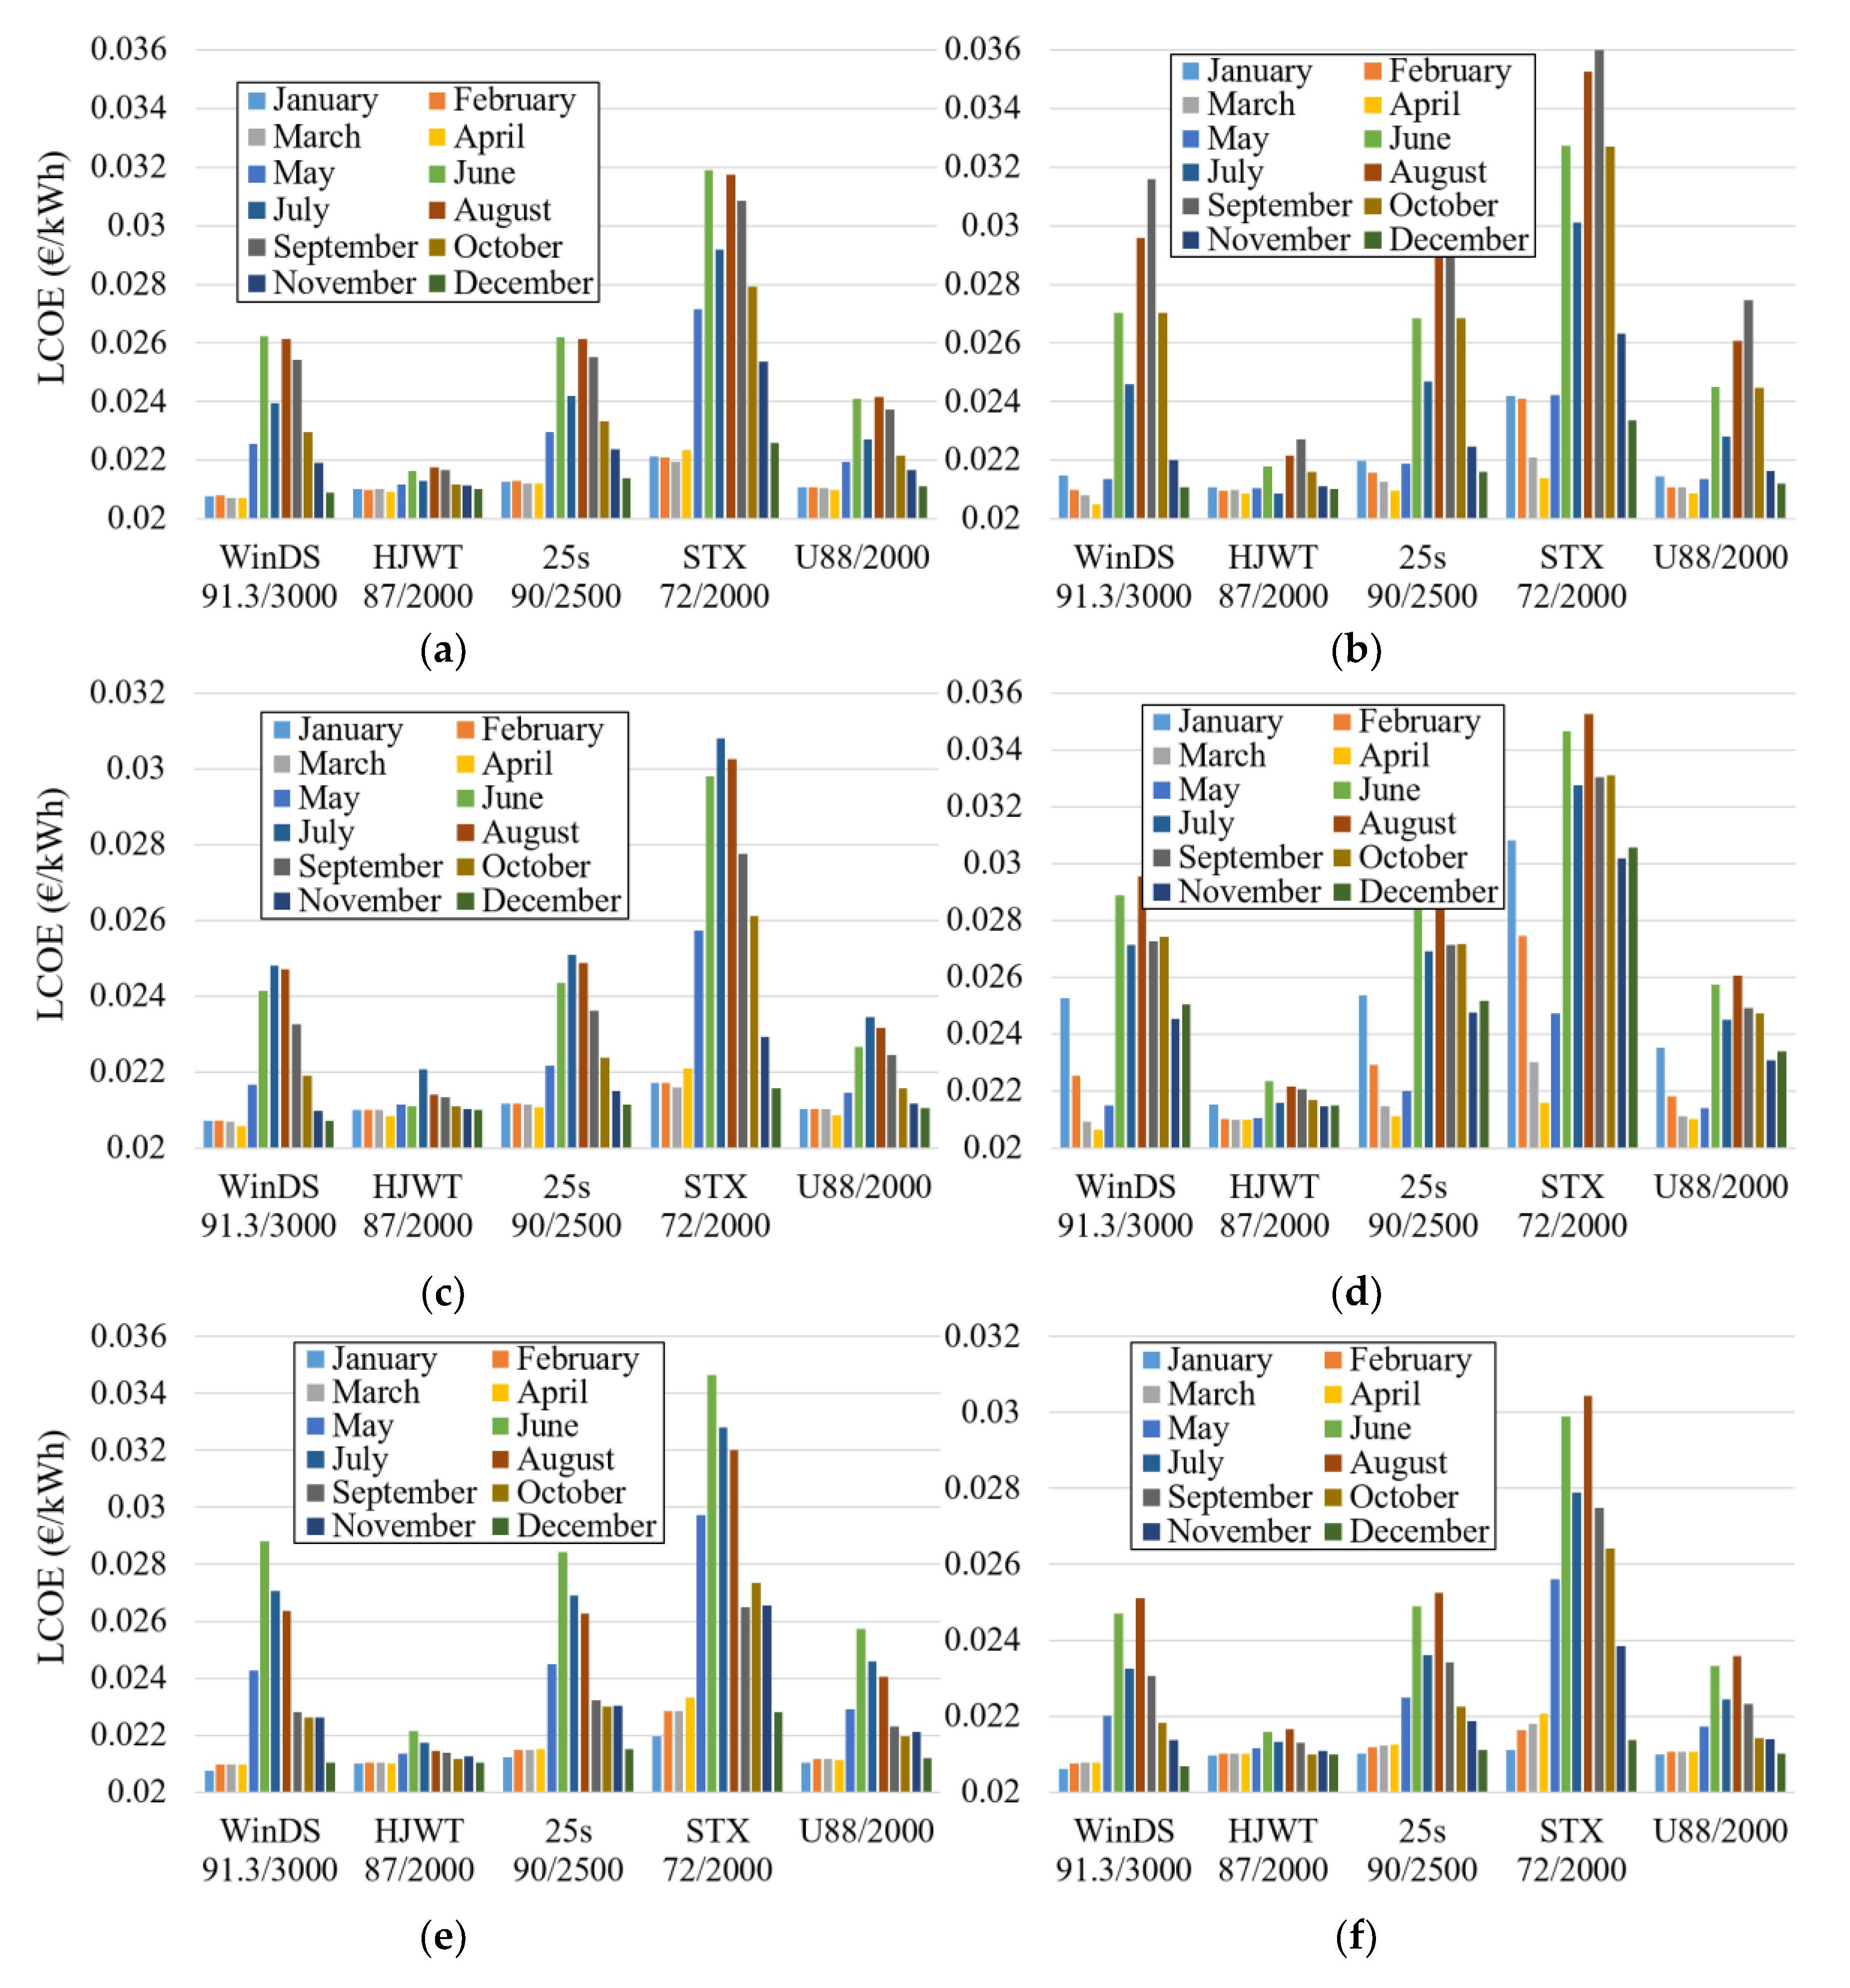
3.3. Economic Analysis of Newly Proposed Sites

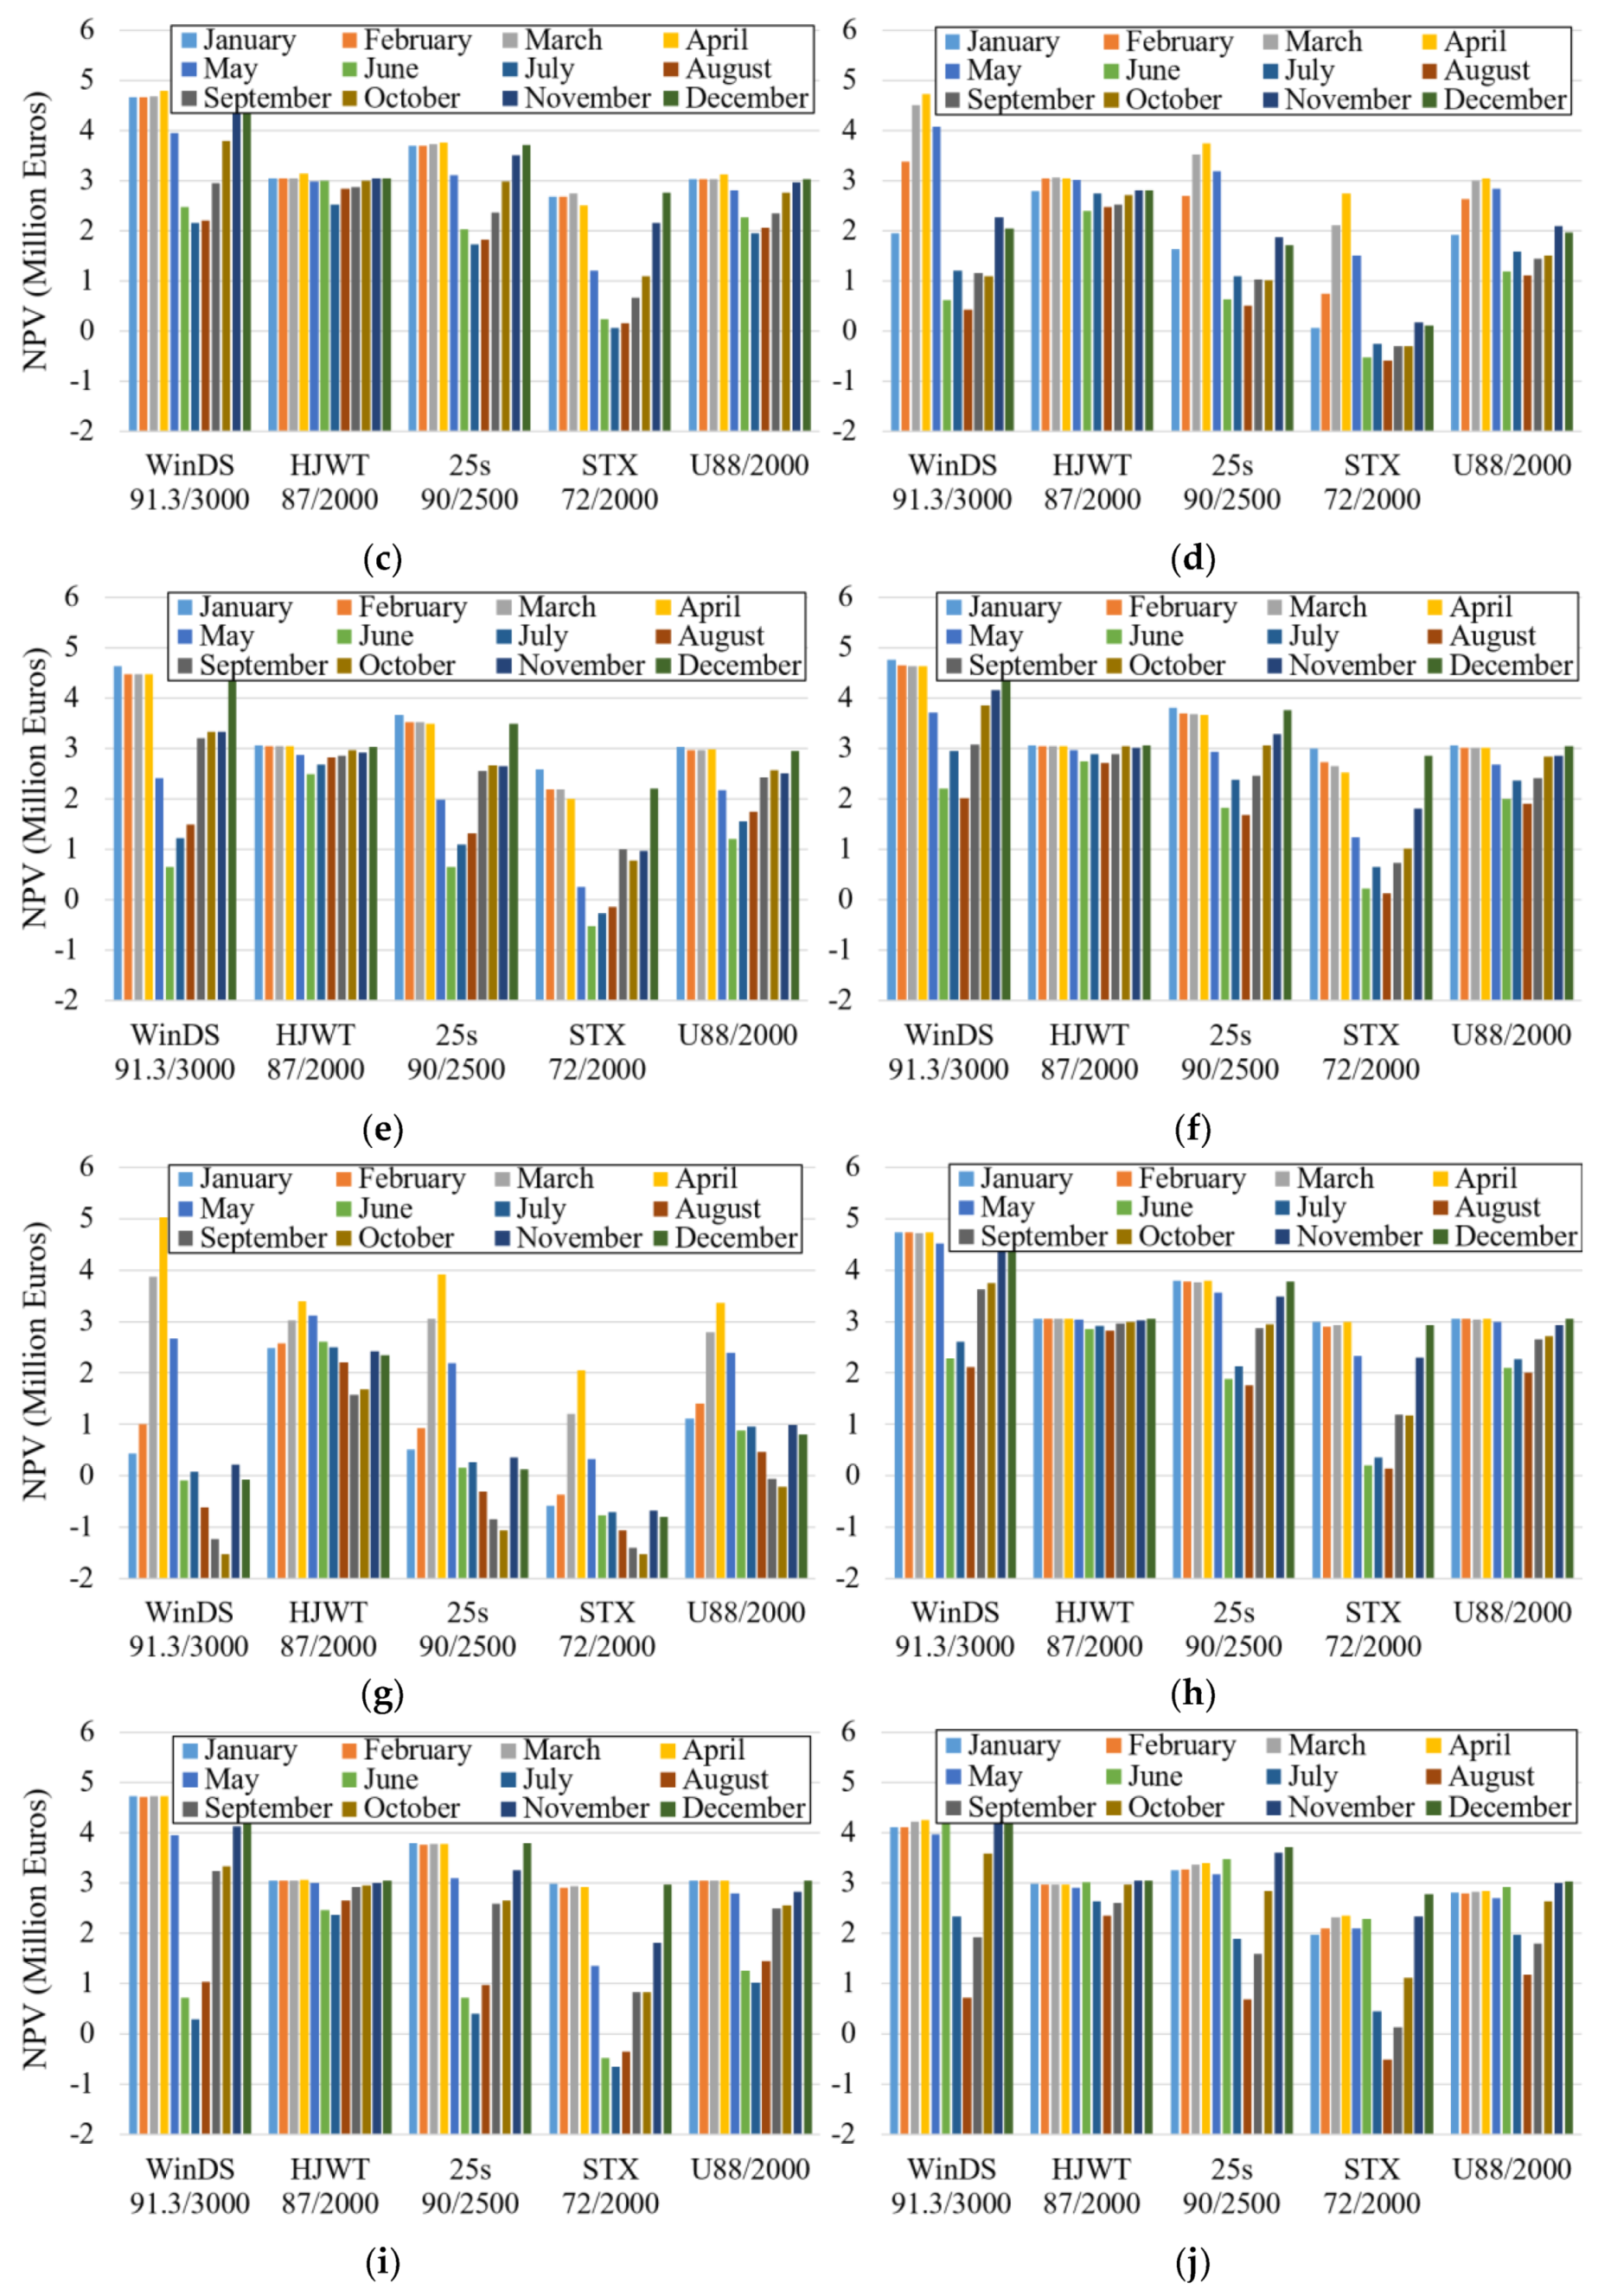
The economic analysis of newly proposed sites is equally important to the technical analysis, because if a site is not economically feasible, then there is no reason to build that wind farm. For economic analysis, there are two important parameters: the LCOE and NPV. As shown in Figure 13, HJWT 87/2000 is be the best choice among all current options, as it produces the lowest values of LCOE at all sites. LCOE can be as low as 0.0457 €/kWh (60 KRW/kWh based upon the exchange rate of 1 € = 1306 KRW).
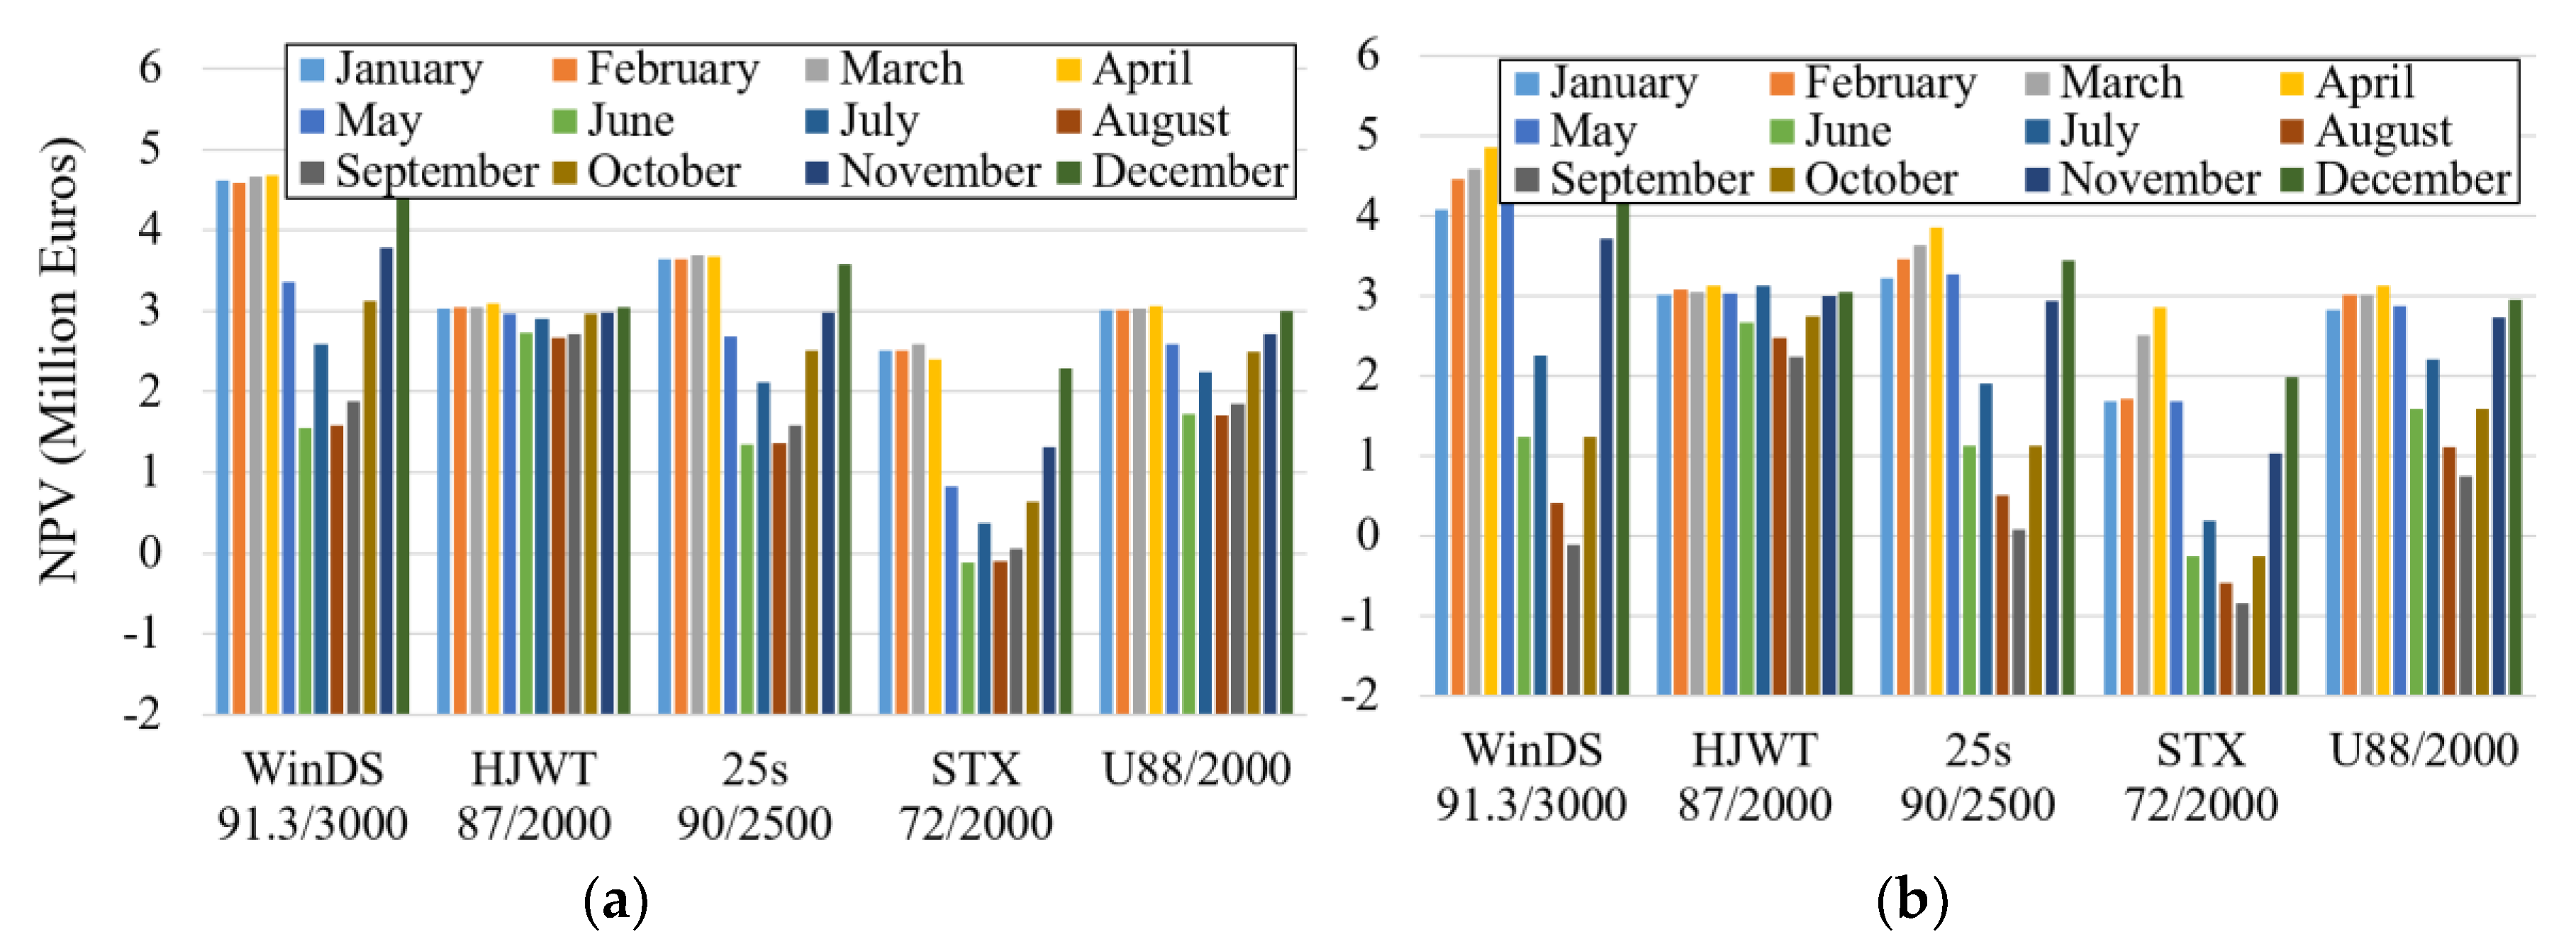
Figure 14 presents the conclusions based upon the analysis of NPV. NPV is simply the difference between all benefits and costs occurring over the entire lifespan of the project (20 years is considered here), when estimated from the start of the project. Therefore, NPV must be greater than zero for the acceptance of a project. It is clear from Figure 14 that NPV is negative for wind turbine model STX 72/2000 at most of the wind farm sites. Therefore, this wind turbine model should not be recommended for installation. It should be noted that at Site 7 NPV is negative for WinDS 91.3/3000 during most months, but at the same time net AEP is also a maximum at some of those times for WinDS 91.3/3000. Therefore, it is really a difficult situation for wind farm developers when choosing WinDS 91.3/3000 for Site 7 due to contradictory conclusions of the analyses of NPV and AEP. The main reason behind this phenomenon is that WinDS 91.3/3000 has relatively highly rated power and energy conversion efficiency, so its net AEP is maximum; but, at the same time, it is the most expensive wind turbine as well, so that its NPV is negative for Site 7.
From the above discussion concerning AEP, CF, LCOE, and NPV it is clear that two wind turbine models are generally recommended for all ten sites—WinDS 91.3/3000 and HJWT 87/2000. However, for Site 7, there is a contradiction between highest net AEP and negative NPV resulting from the application of WinDS 91.3/3000. When contradictory conclusions are obtained, the appropriate wind turbine choice may need further analysis to reach a conclusion as to suitability for each site.

3.4. Limitations and Constraints of Current Techno-Economic Model

Although the results discussed above have high levels of accuracy, there are some limitations and constraints. For example, the total number of wind turbines and their exact positions within a wind farm were not mentioned here because of limited knowledge of geographical information on each wind farm site. To determine total number of wind turbines best suited for a proposed wind farm site, a lot of other information, such as complex wake models, rotor diameter, soil characteristics, and exact positioning of each wind turbine, must be determined simultaneously.
Equation (13) used for estimating the cost of wind turbines was originally used for offshore wind turbines, but the current study has used it for onshore wind turbines. The hub height of each wind turbine was considered to be 90 m to simplify the calculations but this is not a practical scenario as each wind turbine has a different hub height which can lead to different energy production than in the current case. It is noted that the interest rate used for the present techno-economic model is fixed to only one value of 6%, although economic effects vary with interest rates.

4. Conclusions

This study is concerned about the wind energy in South Korea, where most of the energy is imported from other countries in the form of crude oil (94.8% of TPES was imported in 2015). The main focus of the paper is to suggest suitable wind turbines for ten future onshore wind farm sites with great wind energy potential. Additionally, a detailed techno-economic assessment for each site is included.
South Korea produced 1342.4 GWh of electricity through wind during 2015 (0.041% of TPES in 2015) and similarly, this amount was 1683.1 GWh for 2016 (0.049% of TPES in 2016). However, according to RPS, the government intends to increase this fraction up to 0.78% by the end of 2020. Therefore, there is an urgent need to locate new wind farm sites that can host future wind farms. The current study provides ten new potential onshore wind farm sites to address the increasing demand for new energy sources to replace existing fossil fuel imports.
Although the current study does not provide any information about the exact electricity-generation capacity of any of the ten locations, it can surely lead the way for other researchers and government officials for further investigations.
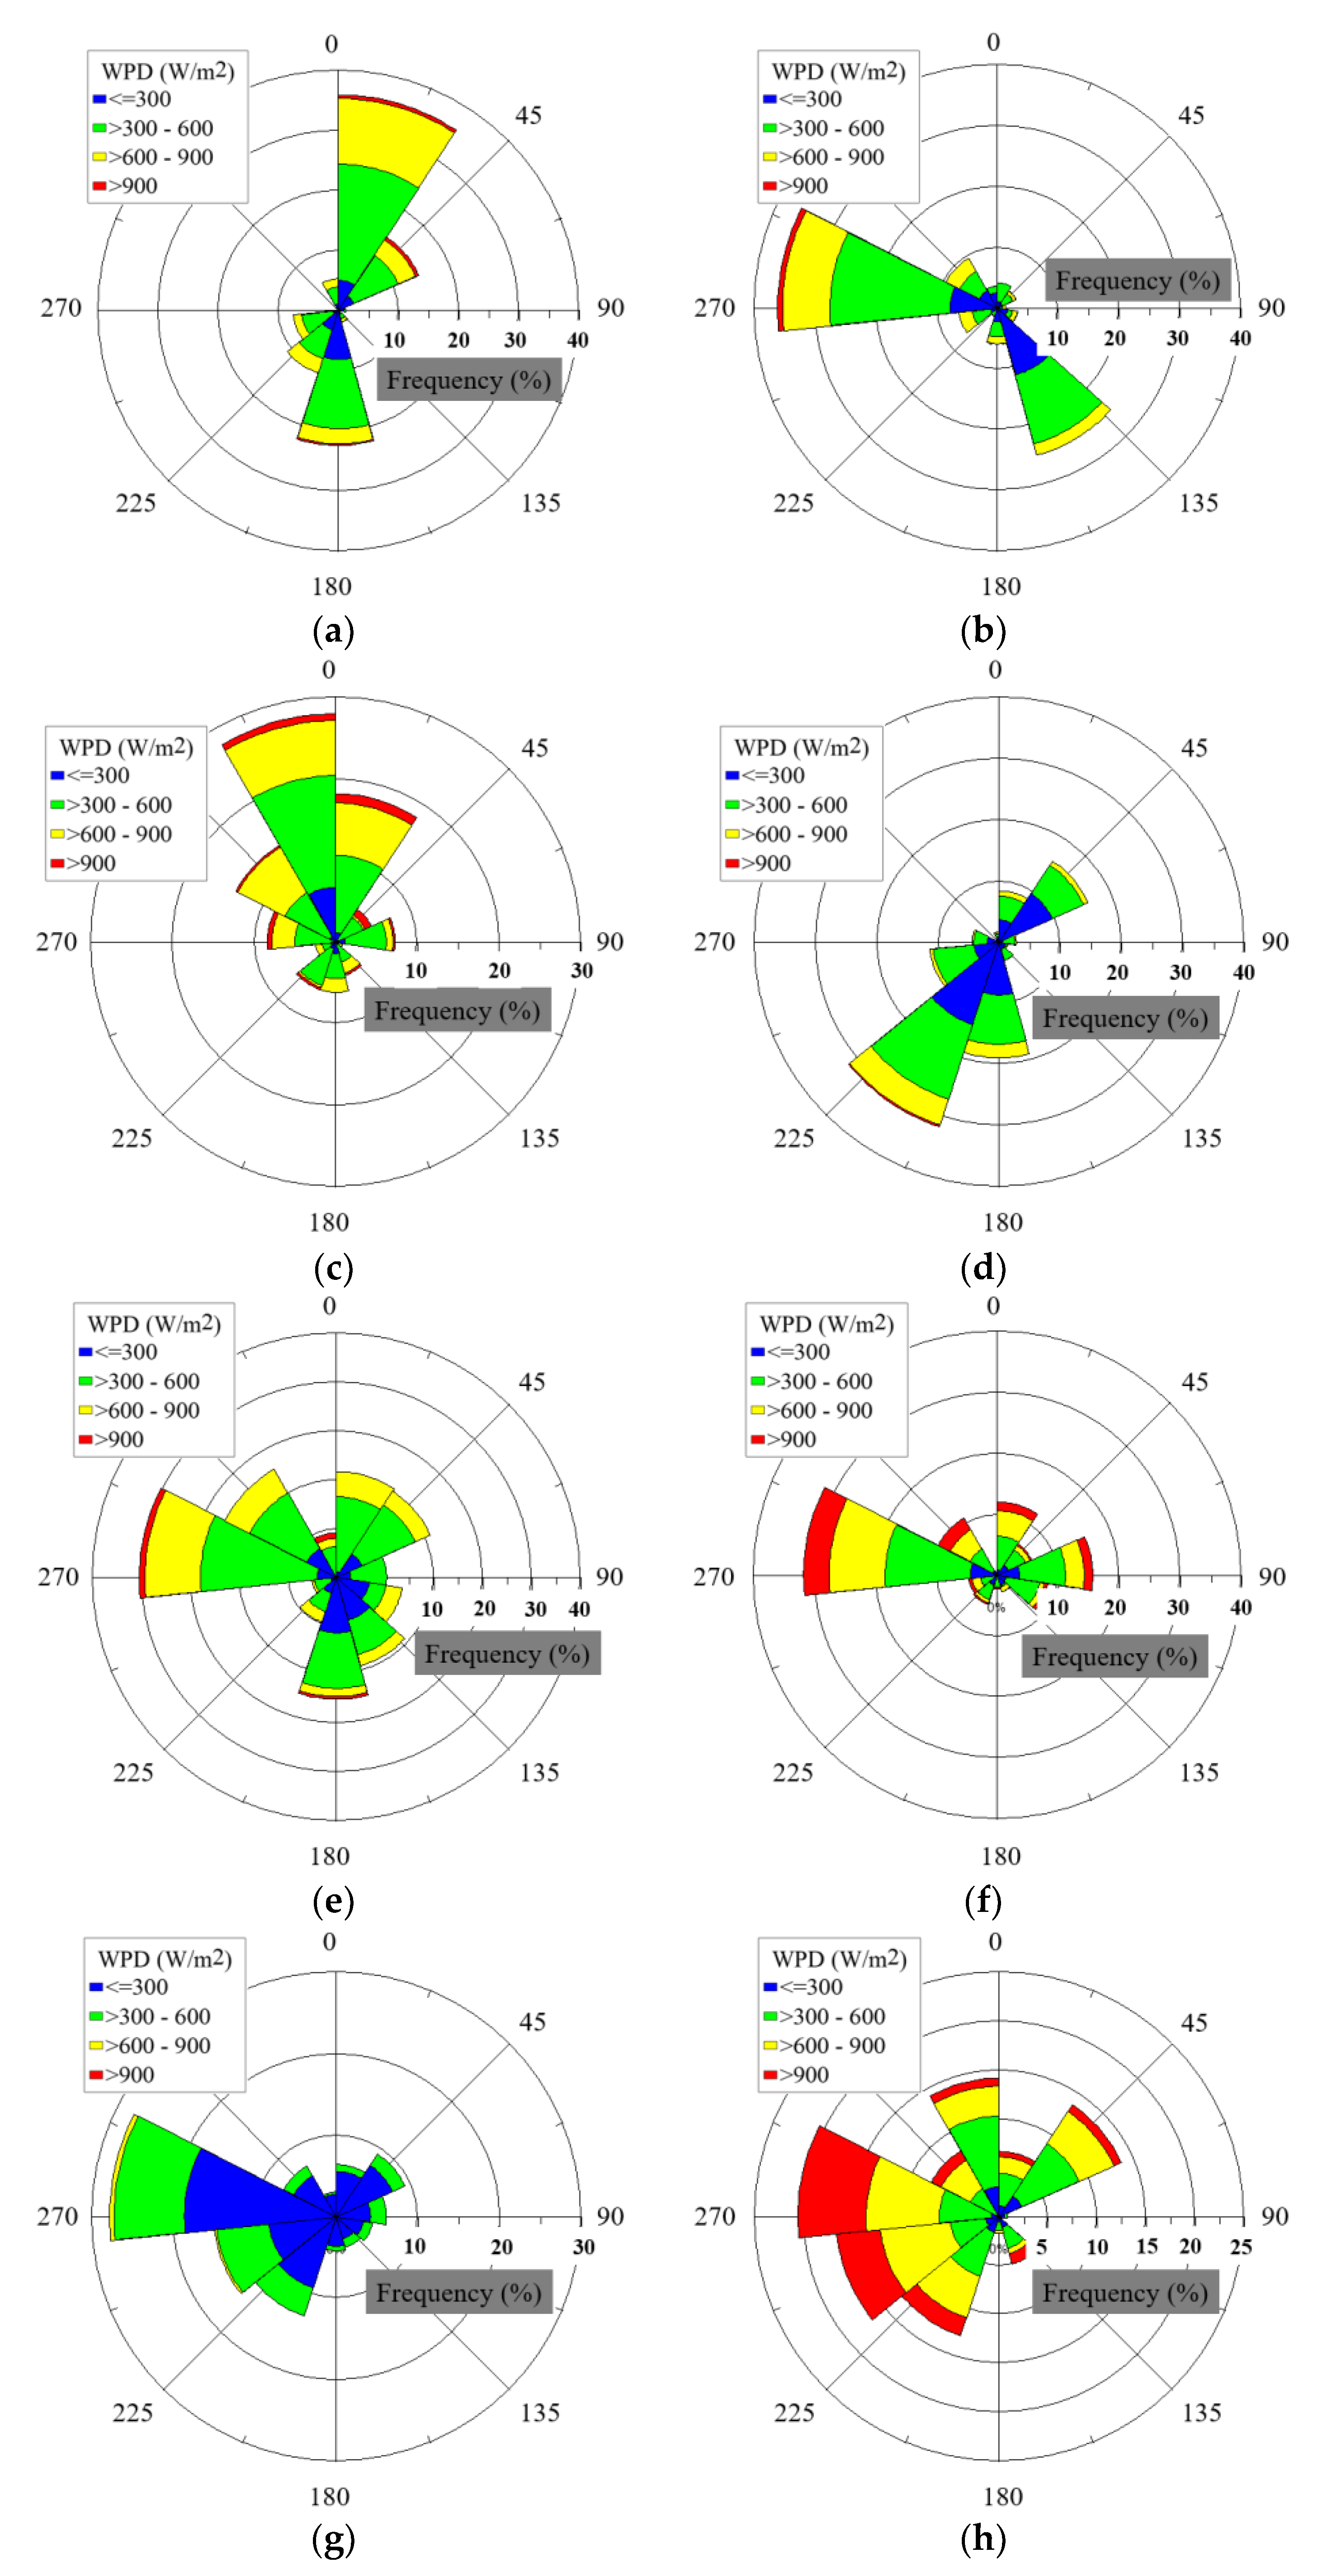
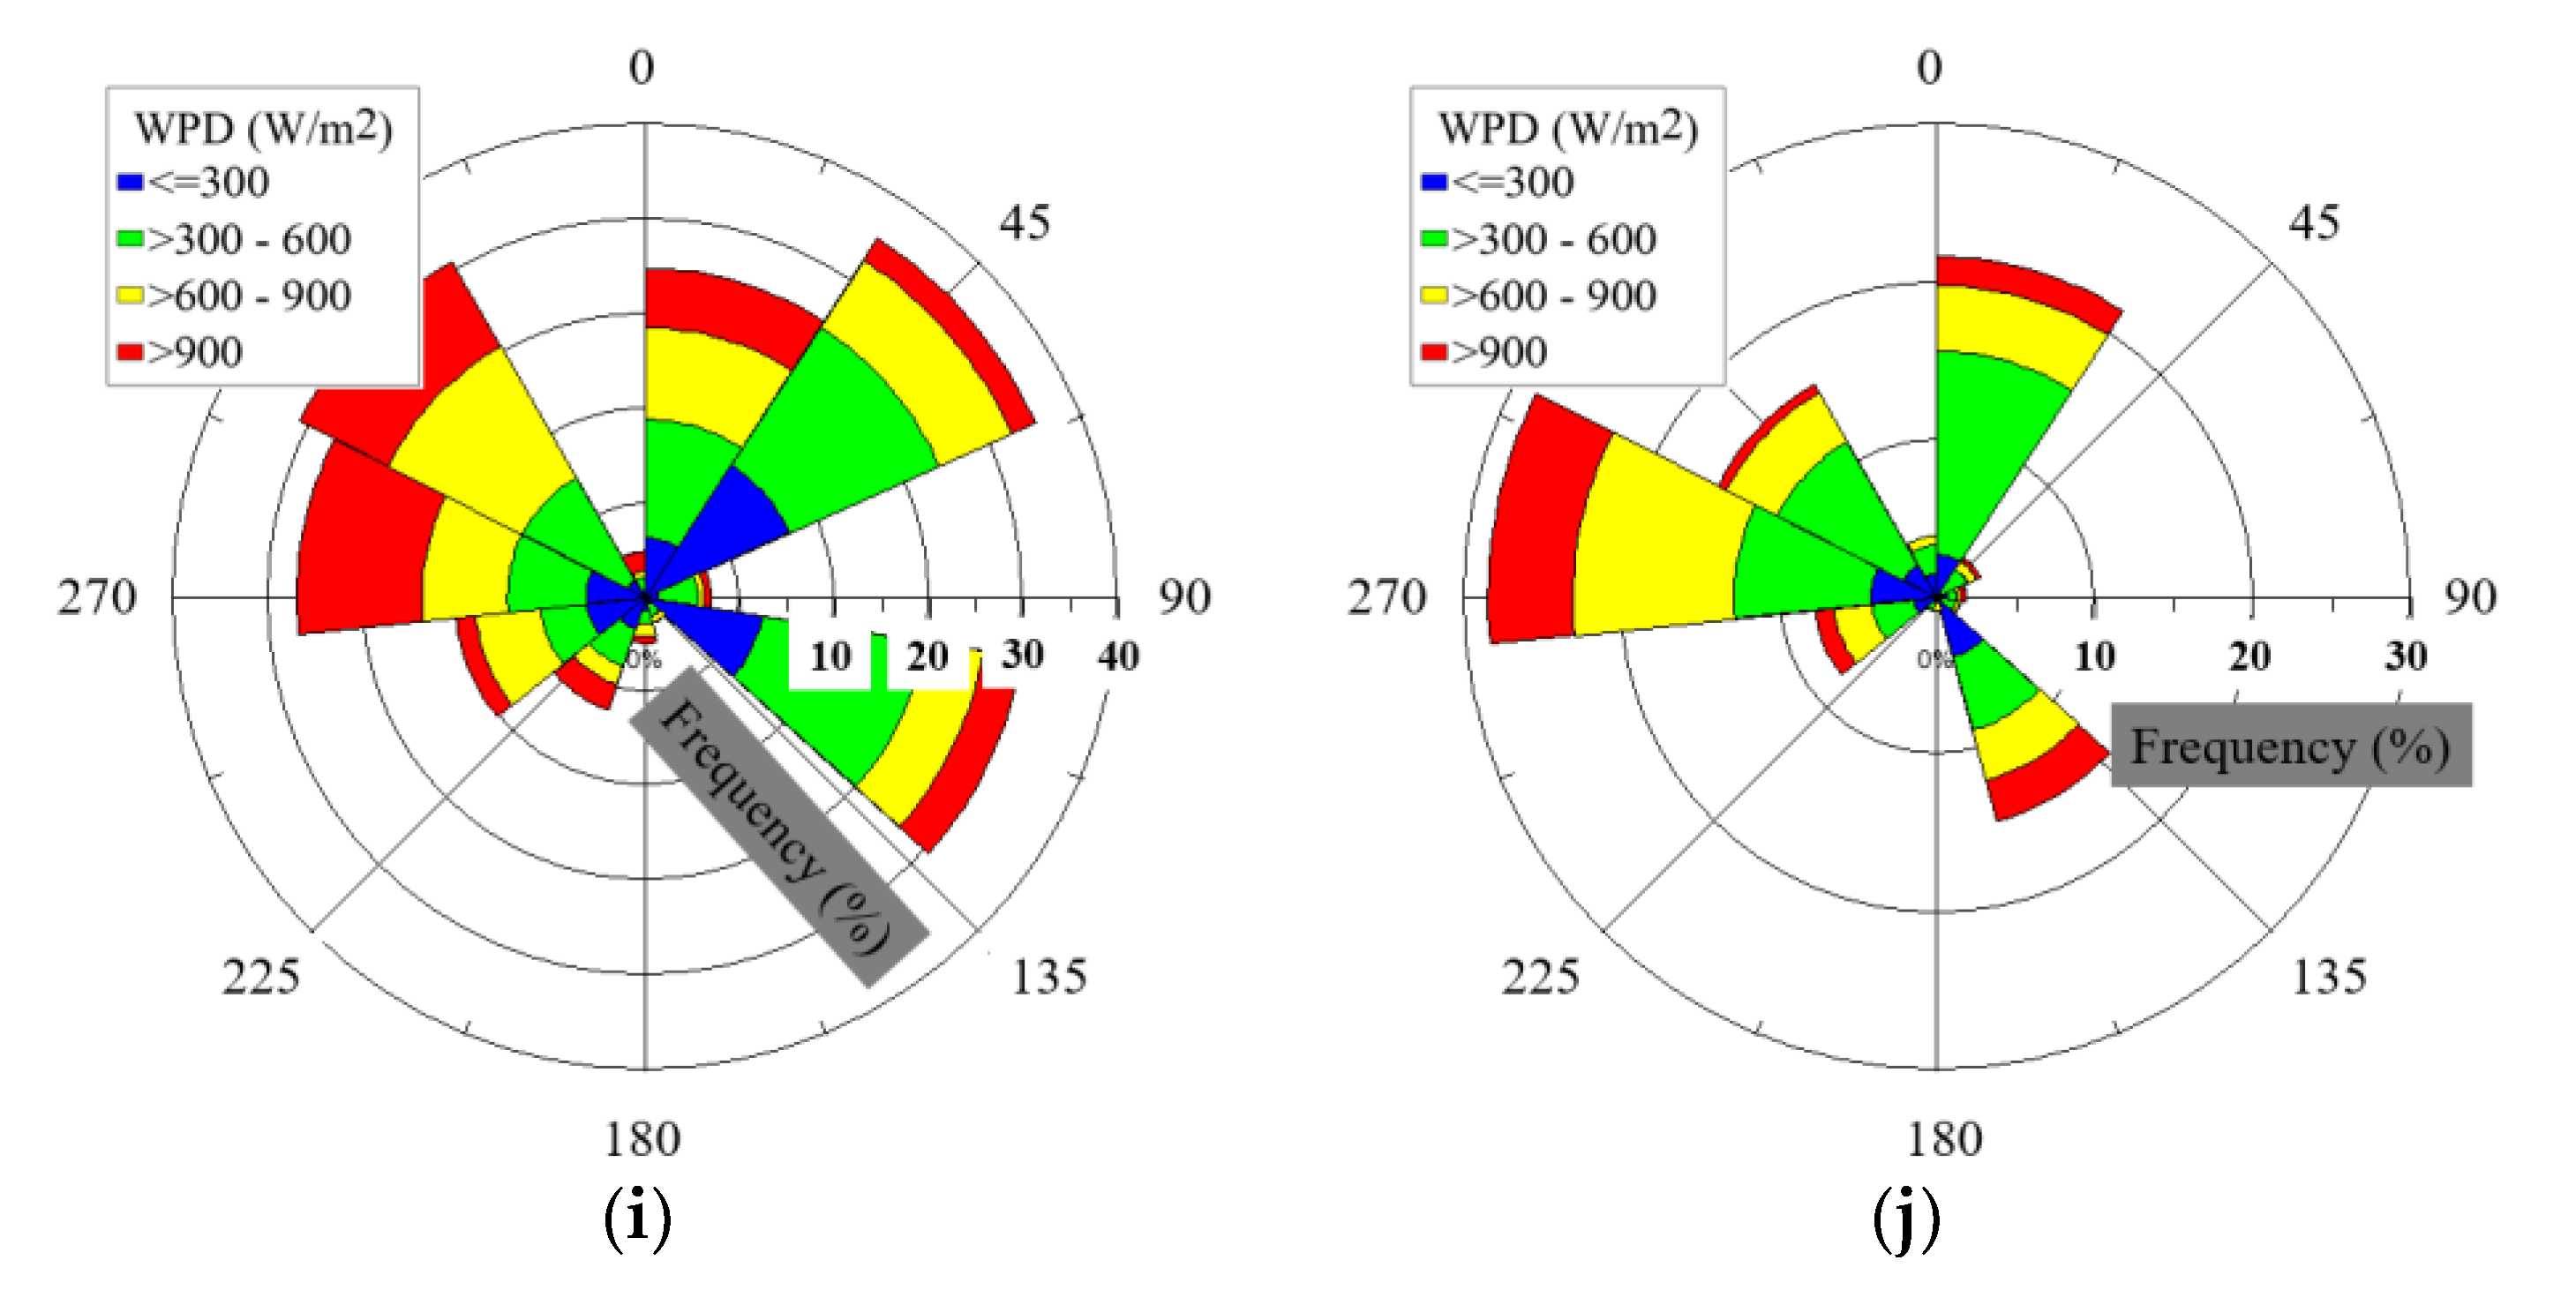
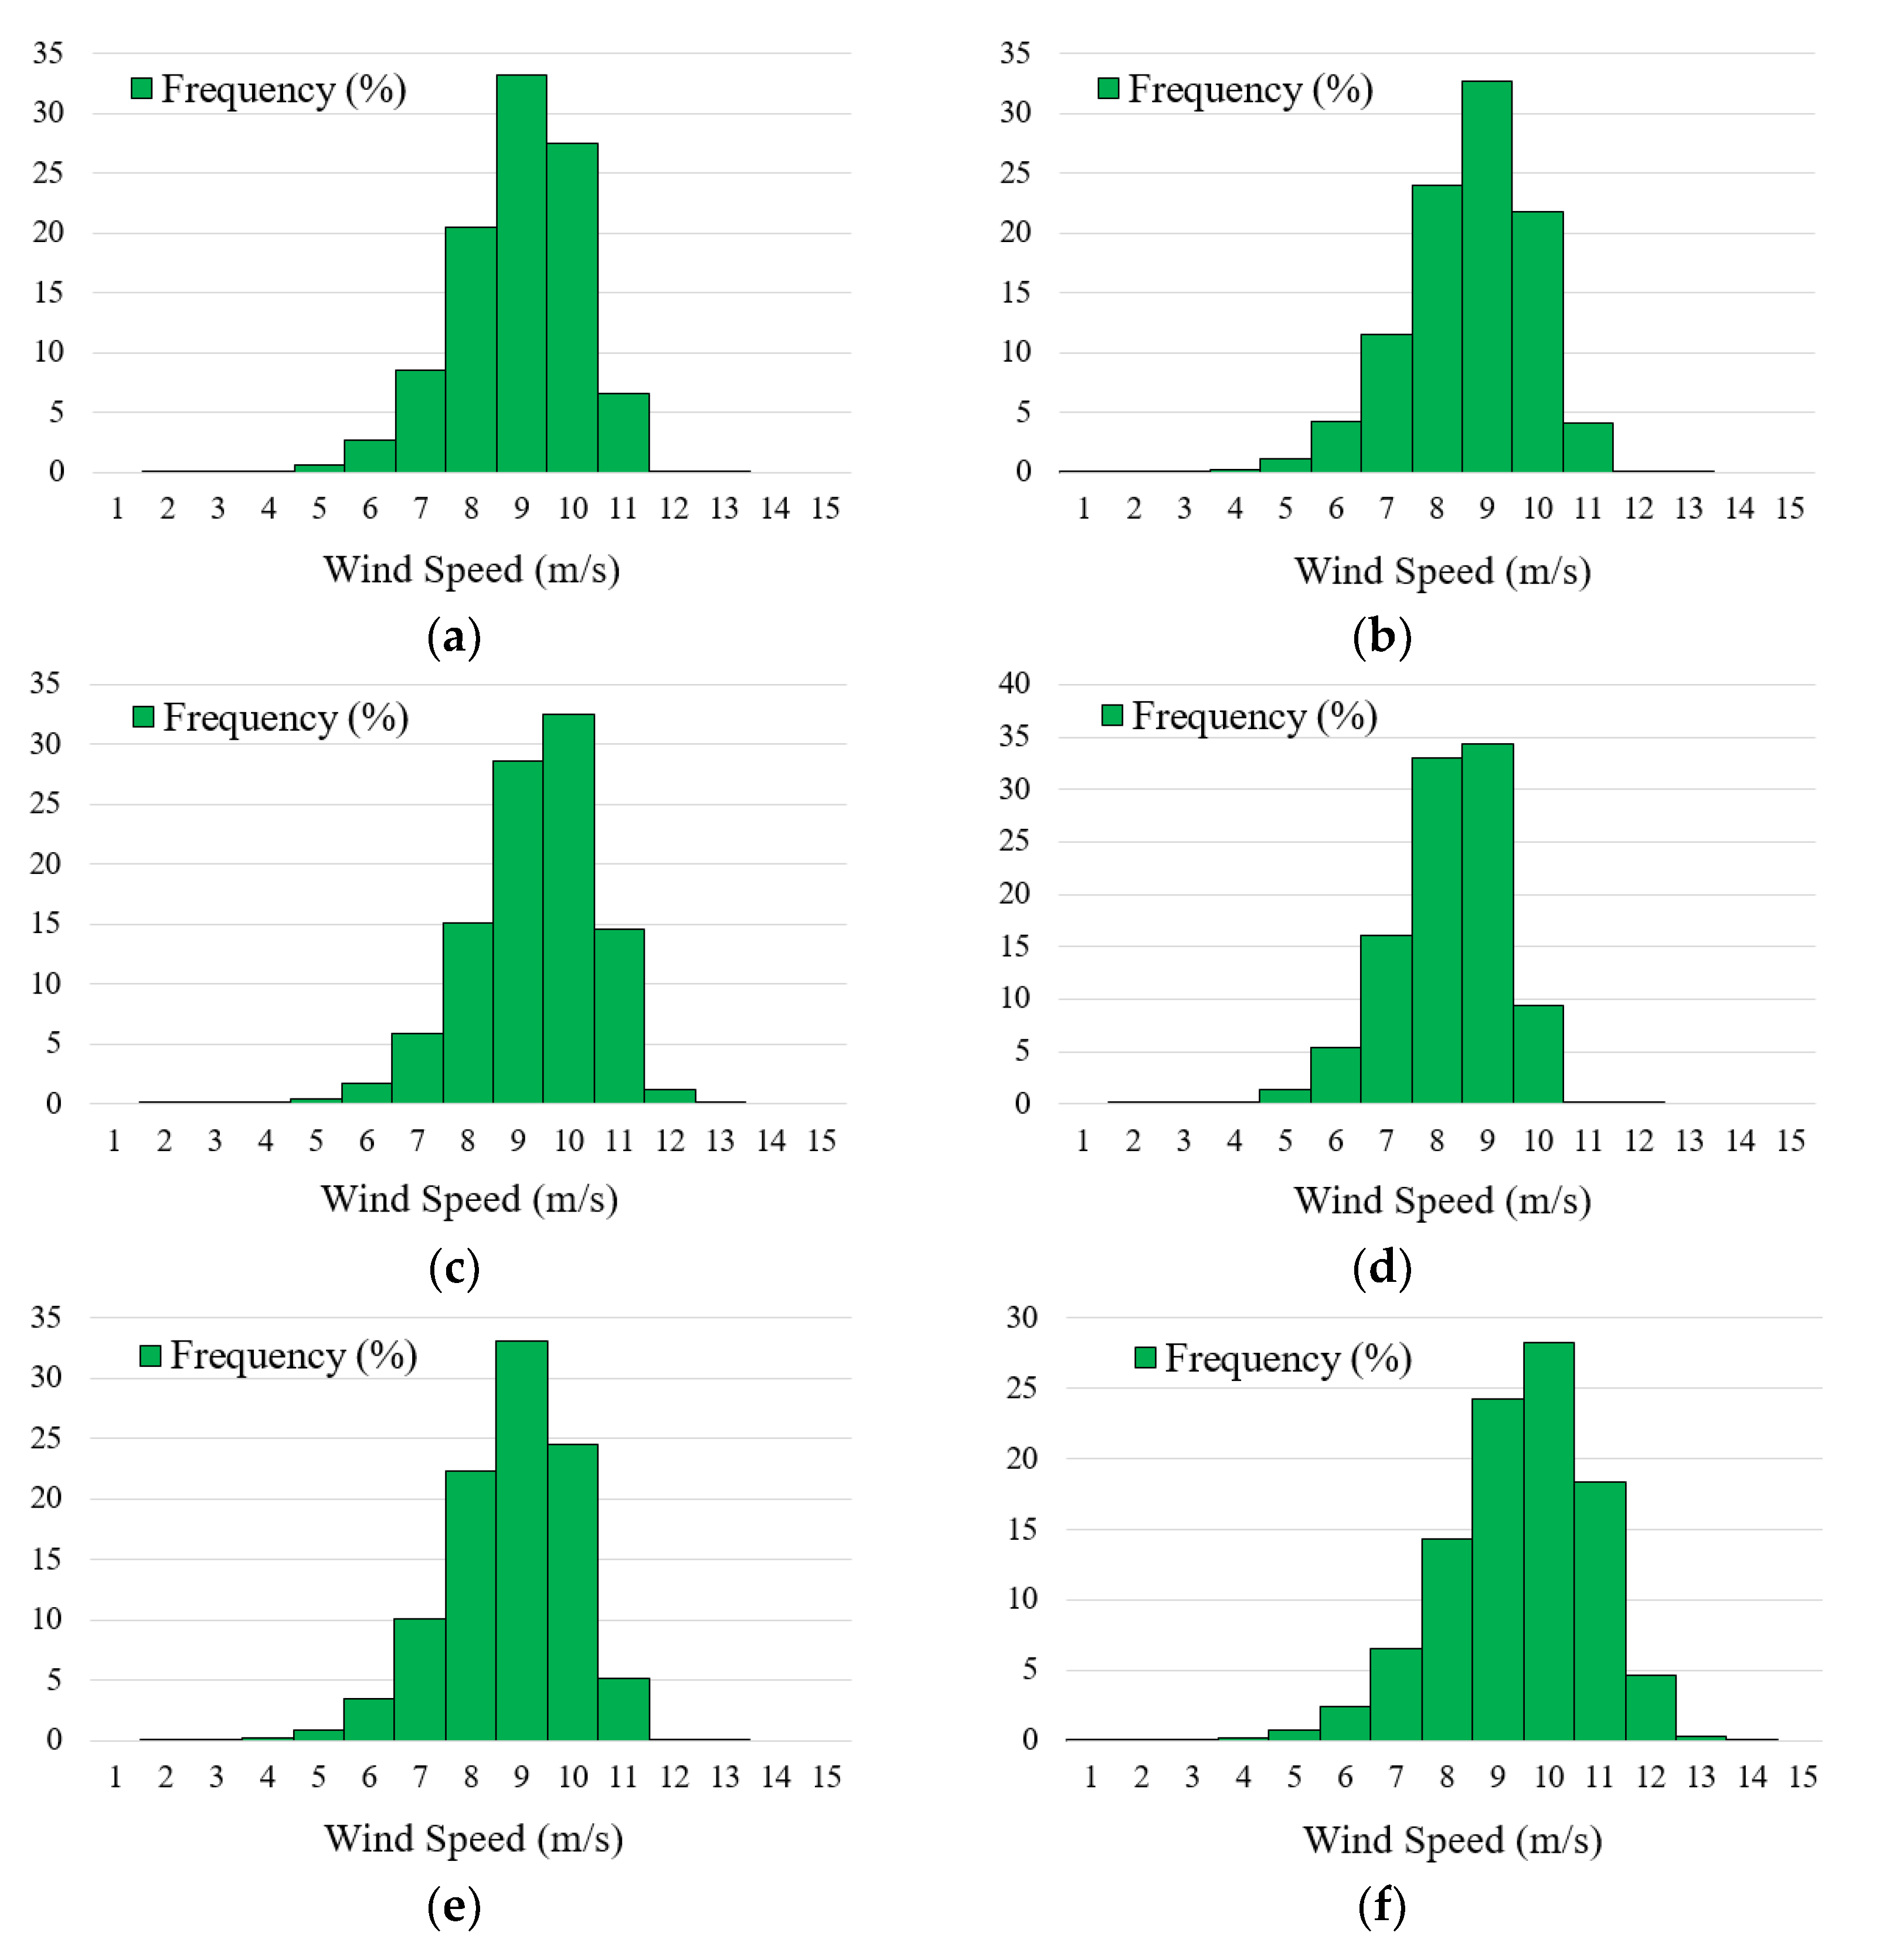
The analysis showed that highest value of mean wind speed was 9.82 m/s at a site located at 37.19° N, 129.22° E, whereas lowest mean wind speed was 7.48 m/s at site located at 35.64° N, 127.72° E. All wind speeds were measured at a height of 10 m. Out of the ten sites, seven sites were classified as IEC wind class 7 (the highest IEC wind class), two were IEC class 6, and one was IEC class 5. Generally speaking, at most of the sites the prevailing wind directions were either northeast or southwest. Techno-economic results were prepared using five wind turbine models manufactured domestically. The maximum AEP can be achieved (up to a value of 250 GWh) by installing wind turbine model WinDS 91.3/3000 at the site located at 37.19° N, 129.22° E. However, the wind turbine model HJWT 87/2000 is recommended for all sites, based on achieving maximum CF. Similarly, an economic analysis was also performed, which is equally important to technical analysis. All the combinations of wind turbines and wind farm sites revealed that the minimum value of LCOE can be as low as 0.0457 €/kWh (60 KRW/kWh based upon the exchange rate of 1 € = 1306 kw). All wind turbine models can produce a positive value of NPV, except STX 72/2000, when installed at six sites out of ten sites. Therefore, apart from STX 72/2000, all other wind turbine models can feasibly be installed at the proposed wind farm sites. The maximum value of NPV (5.031 million euros) can be achieved if the wind turbine model WinDS 91.3/3000 was installed at the site located 35.64° N, 127.72° E.

Author Contributions

All the data were collected and analyzed by S.A., who also devised the methodology and wrote the manuscript. C.-M.J. provided his guidance and supervision for this study.

Funding

This study was supported with major project funding from the Korea Institute of Civil Engineering and Building Technology.

Acknowledgments

We would also like to thank the KMA for providing long-term measured wind data at all proposed wind farm sites.

Conflicts of Interest

The authors declare no actual or potential conflicts of interest.

Abbreviations

TPESTotal Primary Energy SupplyTOETons of Oil Equivalent
LNGLiquefied Natural GasRPSRenewable Portfolio Standard
RERenewable EnergyNRENew and Renewable Energy
WPDWind Power DensitySt. Dev.Standard Deviation
EWSExtreme Wind SpeedAEPAnnual Energy Production
CFCapacity FactorLCOELevelized Cost of Electricity
NPVNet Present ValueO&MOperation and Maintenance
GISGeographic Information SystemMCDMMulti-Criteria Decision-Making
Nomenclature
kWeibull-shape parametercWeibull scale parameter
vWind speedvmMean wind speed
vmpMost probable wind speedvmax EMax. Energy-carrying wind speed
tTimenNumber of wind data
hSpecific heighthRReference height
vhWind speed at hvRWind speed at hR
viInstantaneous wind speedPt(v)Wind turbine power at wind speed v
PaveAverage wind turbine powerNBNumber of speed bins
PRRated power of wind turbinerDiscount rate
BtBenefitsCtCosts (Fixed + variable)
aWind shear constantCWTCost of wind turbine
ItInvestment made in year tDtDepreciation credit
TtTax levyf(v)Frequency of wind speed v
Greek Letters
σStandard deviationΓGamma function
ρ Air densityƩSummation

References

  1. Available online: https://www.gwec.net (accessed on 5 August 2018).
  2. Oh, K.-Y.; Kim, J.-Y.; Lee, J.-K.; Ryu, M.-S.; Lee, J.-S. An assessment of wind energy potential at the demonstration offshore wind farm in Korea. Energy 2012, 46, 555–563. [Google Scholar] [CrossRef]
  3. Lee, M.E.; Kim, G.; Jeong, S.-T.; Ko, D.H.; Kang, K.S. Assessment of offshore wind energy at Younggwang in Korea. Renew. Sustain. Energy Rev. 2013, 21, 131–141. [Google Scholar] [CrossRef]
  4. Oh, K.-Y.; Kim, J.-Y.; Lee, J.-S.; Ryu, K.-W. Wind resource assessment around Korean Peninsula for feasibility study on 100 MW class offshore wind farm. Renew. Energy 2012, 42, 217–226. [Google Scholar] [CrossRef]
  5. Jang, J.-K.; Yu, B.-M.; Ryu, K.-W.; Lee, J.-S. Offshore wind resource assessment around Korean Peninsula by using QuikSCAT satellite data. J. Korean Soc. Aeronaut. Space Sci. 2009, 37, 1121–1130. [Google Scholar]
  6. Kim, J.-Y.; Oh, K.-Y.; Kang, K.-S.; Lee, J.-S. Site selection of offshore wind farms around the Korean Peninsula through economic evaluation. Renew. Energy 2013, 54, 189–195. [Google Scholar] [CrossRef]
  7. Kim, H.; Kim, B. Wind resource assessment and comparative economic analysis using AMOS data on a 30 MW wind farm at Yulchon district in Korea. Renew. Energy 2016, 85, 96–103. [Google Scholar] [CrossRef]
  8. Ali, S.; Lee, S.-M.; Jang, C.-M. Statistical analysis of wind characteristics using Weibull and Rayleigh distributions in Deokjeok-do Island–Incheon, South Korea. Renew. Energy 2018, 123, 652–663. [Google Scholar] [CrossRef]
  9. Baek, S.; Kim, H.; Chang, H. Optimal hybrid renewable power system for an emerging island of South Korea: The case of Yeongjong Island. Sustainability 2015, 7, 13985–14001. [Google Scholar] [CrossRef]
  10. Kang, D.; Ko, K.; Huh, J.J.E. Comparative Study of Different Methods for Estimating Weibull Parameters: A Case Study on Jeju Island, South Korea. Energies 2018, 11, 356. [Google Scholar] [CrossRef]
  11. Kim, H.-G.; Kim, K.-H.; Kang, Y.-H. Wind Resource Assessment for Green Island-Dokdo. J. Korean Sol. Energy Soc. 2012, 32, 94–101. [Google Scholar] [CrossRef]
  12. Ko, K.; Kim, K.; Huh, J. Variations of wind speed in time on Jeju Island, Korea. Energy 2010, 35, 3381–3387. [Google Scholar] [CrossRef]
  13. Lee, B.; Kim, B.; Kim, D.; Kim, H.; Ha, Y.C. An estimation of extreme wind speeds using national wind map. J. Wind Eng. Inst. Korea 2010, 14, 29–38. [Google Scholar]
  14. Lee, B.-H.; Ahn, D.-J.; Kim, H.-G.; Ha, Y.-C. An estimation of the extreme wind speed using the Korea wind map. Renew. Energy 2012, 42, 4–10. [Google Scholar] [CrossRef]
  15. Park, E.J.R.; Reviews, S.E. Potentiality of renewable resources: Economic feasibility perspectives in South Korea. Renew. Sustain. Energy Rev. 2017, 79, 61–70. [Google Scholar] [CrossRef]
  16. Park, Y.C.; Kim, D.S.; Huh, J.-C.; Kim, Y.G. New and renewable energy policies of Jeju island in Korea. Presented at the World Renewable Energy Congress-Sweden, Linköping, Sweden, 8–13 May 2011. [Google Scholar]
  17. Kim, H.-G.; Kang, Y.-H.; Hwang, H.-J.; Yun, C.-Y. Evaluation of inland wind resource potential of South Korea according to Environmental Conservation Value Assessment. Energy Procedia 2014, 57, 773–781. [Google Scholar] [CrossRef]
  18. Kim, H.-G.; Kang, Y.-H.; Kim, J.-Y. Evaluation of wind resource potential in mountainous region considering morphometric terrain characteristics. Wind Eng. 2017, 41, 114–123. [Google Scholar] [CrossRef]
  19. New and Renewable Energy Data Center, Korea Institute of Energy Research. Available online: http://kredc.kier.re.kr/kierflex/#app¼3008&965a-selectedIndex¼0 (accessed on 5 August 2018).
  20. Available online: https://www.keei.re.kr/main.nsf/index_en.html (accessed on 5 August 2018).
  21. Hwang, I. South Korea’s National Basic Plan for New and Renewable Energies. In EDMC Energy Trends; Institute of Energy Economics: Tokyo, Japan, 2014. [Google Scholar]
  22. Ali, S.; Lee, S.-M.; Jang, C.-M. Determination of the Most Optimal On-Shore Wind Farm Site Location Using a GIS-MCDM Methodology: Evaluating the Case of South Korea. Energies 2017, 10, 2072. [Google Scholar] [CrossRef]
  23. Available online: http://www.mapcruzin.com/ (accessed on 5 August 2018).
  24. Available online: https://data.kma.go.kr/data/grnd/selectAwsList.do?pgmNo=35 (accessed on 2 August 2018).
  25. Ali, S.; Lee, S.-M.; Jang, C.-M. Techno-economic assessment of wind energy potential at three locations in South Korea using long-term measured wind data. Energies 2017, 10, 1442. [Google Scholar] [CrossRef]
Figure 1. Mean wind speed at 40 m above ground level in South Korea [19].
Energies 12 03140 g001
Figure 2. Supply targets for new and renewable energy technologies according to RPS [20,21].
Energies 12 03140 g002
Figure 3. NRE supply composition ratio according to RPS (%) (a) 2012; (b) 2014; (c) 2020; (d) 2035 [20,21].
Energies 12 03140 g003aEnergies 12 03140 g003b
Figure 4. Proposed onshore wind farm site locations on map [22,23].
Energies 12 03140 g004
Figure 5. Wind roses of newly proposed wind farm sites at 10 m height (a) Site 1; (b) Site 2; (c) Site 3; (d) Site 4; (e) Site 5; (f) Site 6; (g) Site 7; (h) Site 8; (i) Site 9; (j) Site 10.
Energies 12 03140 g005aEnergies 12 03140 g005b
Figure 6. Wind speed frequencies at 90 m height at newly proposed wind farm sites (a) Site 1; (b) Site 2; (c) Site 3; (d) Site 4; (e) Site 5; (f) Site 6; (g) Site 7; (h) Site 8; (i) Site 9; (j) Site 10.
Energies 12 03140 g006aEnergies 12 03140 g006b
Figure 7. Estimation of EWS (90 m height) at newly proposed wind farm sites (a) Site 1; (b) Site 2; (c) Site 3; (d) Site 4; (e) Site 5; (f) Site 6; (g) Site 7; (h) Site 8; (I) Site 9; (j) Site 10.
Energies 12 03140 g007aEnergies 12 03140 g007b
Figure 8. Wind turbine sub-classes categorized by IEC.
Energies 12 03140 g008
Figure 9. Estimation of TI at newly proposed wind farm sites (90 m height).
Energies 12 03140 g009
Figure 10. Power curves of selected wind turbines [25].
Energies 12 03140 g010
Figure 11. Estimation of net AEP at newly proposed wind farm sites (a) Site 1 (b) Site 2 (c) Site 3 (d) Site 4 (e) Site 5 (f) Site 6 (g) Site 7 (h) Site 8 (i) Site 9 (j) Site 10.
Energies 12 03140 g011aEnergies 12 03140 g011b
Figure 12. Estimation of CF at newly proposed wind farm sites (a) Site 1 (b) Site 2 (c) Site 3 (d) Site 4 (e) Site 5 (f) Site 6 (g) Site 7 (h) Site 8 (i) Site 9 (j) Site 10.
Energies 12 03140 g012aEnergies 12 03140 g012b
Figure 13. Estimation of LCOE at newly proposed wind farm sites (a) Site 1; (b) Site 2; (c) Site 3; (d) Site 4; (e) Site 5; (f) Site 6; (g) Site 7; (h) Site 8; (i) Site 9; (j) Site 10.
Energies 12 03140 g013aEnergies 12 03140 g013b
Figure 14. Estimation of NPV at newly proposed wind farm sites (a) Site 1; (b) Site 2; (c) Site 3; (d) Site 4; (e) Site 5; (f) Site 6; (g) Site 7; (h) Site 8; (i) Site 9; (j) Site 10.
Energies 12 03140 g014aEnergies 12 03140 g014b
Table 1. Breakdown of wind data for 2016.
TypeNumber of SitesNumber of Wind TurbinesCapacity (MW)
Onshore77519996
Offshore31235
Table 2. Geographical details of proposed onshore wind farm sites [22].
Site NumberLatitude (° N)Longitude (° E)Area (km2)Distance to Nearest Power Stations (km)Distance to Nearest Power Lines (km)Distance to Nearest Roads (km)Distance to Nearest Cities (km)Distance to Nearest Railway Lines (km)Mean Slope (%)
134.58126.4229.481513.130.0723.6621.473.41
237.68128.677.3719.6710.050.4120.2518.448.98
335.15126.387.3716.7516.81.2833.6420.272.28
438.14128.457.3710.957.960.1214.5452.983.83
534.81128.387.3717.7212.3802.1341.111.79
634.59127.737.3732.8525.791.6219.6518.421.14
735.64127.727.3713.2411.730.3436.3412.430.55
837.19129.227.3718.16.43.9620.8615.881.55
936.23129.2314.7429.611.630.0525.8919.3432.56
1037.36128.977.371911.331.0719.625.0622.53
Table 3. Wind characteristics at newly proposed onshore wind farm sites (90 m height).
Site RankingMean (m/s)St. Dev (m/s)k (-)c (m/s)EWS (m/s)Year of EWSVmp (m/s)Vmax.E (m/s)Ke (-)WPD (W/m2)IEC Wind Class
18.921.218.769.4313.2220029.309.661.06434.747
28.651.268.099.1811.6220079.039.431.06395.896
39.311.248.939.8314.6720029.7010.061.05494.167
48.221.108.898.6812.1720128.578.891.06340.136
58.781.248.389.3016.7720029.169.541.06414.067
69.411.447.6910.0112.8120079.8310.321.07510.507
77.480.989.077.9010.8420127.808.071.05256.385
89.821.627.0810.4916.87200210.2710.871.08580.077
99.501.776.2110.2214.0720159.9410.691.11525.307
109.491.726.4010.2012.3220079.9310.641.10524.147
Table 4. International electrotechnical commission wind turbine categories.
Main Classes of Wind Turbines
Variable1234 (S)
Reference speed (m/s)5042.537.530
Mean wind speed at turbine hub (m/s)108.57.56
Fifty-year max. wind speed (m/s)7059.552.542
One-year max. wind speed (m/s)52.544.639.431.5
Table 5. Characteristics of selected wind turbines.
Wind Turbine ModelManufacturerRated Power (MW)Rotor Diameter (m)IEC Wind ClassSwept Area (m2)Power Density (m2/kW)
WinDS 91.3/3000Doosan391.3IA65472.19
HJWT 87/2000Hanjin287IIA59452.98
25s 90/2500Samsung2.590IIA63622.55
STX 72/2000STX Wind Power270.65IIB39211.97
U88/2000Unison288IIA60833.05
Table 6. Annual electricity production at each site.
SiteWinDS 91.3/3000HJWT 87/200025s 90/2500STX 72/2000U88/2000
1236.2644177.2335197.7655134.6124167.0234
2224.1202175.9837188.6874127.028161.3653
3245.8752178.1573205.0588142.5747171.3728
4207.3277173.5238176.1564113.6892154.069
5230.175176.5429193.1543130.3182164.2165
6245.66178.071205.0801143.8163170.9324
7169.5359165.9545147.517692.72772133.8121
8249.0736178.8193208.0297149.9412172.4024
9234.9767176.1474197.3888140.6812165.5019
10240.386175.7608201.0122143.5782167.2869
Total AEP (GWh)2283.3951756.1941919.8511318.9671627.983

