Article

Risk-Limiting Real-Time Economic Dispatch in a Power System with Flexibility Resources

1
School of Electrical Engineering, Zhejiang University, No. 38 Zheda Rd., Hangzhou 310027, China
2
Department for Management of Science and Technology Development, Ton Duc Thang University, Ho Chi Minh City, Vietnam
3
Faculty of Electrical and Electronics Engineering, Ton Duc Thang University, Ho Chi Minh City, Vietnam
4
UNSW Business School, The University of New South Wales, Sydney NSW 2052, Australia
5
Economic Research Institute of State Grid Zhejiang Electric Power Co., Ltd., No. 59 Jiefang East Rd., Hangzhou 310008, China
6
State Grid Energy Research Institute Co., Ltd., Beijing 102209, China
*
Author to whom correspondence should be addressed.
Energies 2019, 12(16), 3133; https://doi.org/10.3390/en12163133
Submission received: 6 July 2019 / Revised: 8 August 2019 / Accepted: 12 August 2019 / Published: 15 August 2019
(This article belongs to the Special Issue Modern Power System Dynamics, Stability and Control)

Abstract

:
The integration of numerous intermittent renewable energy sources (IRESs) poses challenges to the power supply-demand balance due to the inherent intermittent and uncertain power outputs of IRESs, which requires higher operational flexibility of the power system. The deployment of flexible ramping products (FRPs) provides a new alternative to accommodate the high penetration of IRESs. Given this background, a bi-level risk-limiting real-time unit commitment/real-time economic dispatch model considering FRPs provided by different flexibility resources is proposed. In the proposed model, the objective is to maximize the social surplus while minimizing the operational risk, quantified using the concept of conditional value-at-risk (CVaR). Energy and ramping capabilities of conventional generating units during the start-up or shut-down processes are considered, while meeting the constraints including unit start-up/shut-down trajectories and ramping up/down rates in consecutive time periods. The Karush–Kuhn–Tucker (KKT) optimality conditions are then used to convert the bi-level programming problem into a single-level one, which can be directly solved after linearization. The modified IEEE 14-bus power system is employed to demonstrate the proposed method, and the role of FRPs in enhancing the system flexibility and improving the accommodation capability for IRESs is illustrated in some operation scenarios of the sample system. The impact of the confidence level in CVaR on the system operational flexibility is also investigated through case studies. Finally, a case study is conducted on a regional power system in Guangdong Province, China to demonstrate the potential of the proposed method for practical applications.

1. Introduction

The ever-increasing penetration of intermittent renewable energy sources (IRESs) such as wind power and photovoltaic power generation brings about higher variability and uncertainty, which poses a serious challenge to the operational flexibility of a power system [1]. Generally, it is relatively straightforward to dispatch controllable resources like conventional thermal power and hydropower units to cope with the fluctuations of the net load (referring to the user load demand not served by IRESs) when the proportion of IRESs is comparatively low [2]. However, as the share of IRESs in the power supply increases, the flexibility level of the system decreases due to the priority of renewable energy generation in the dispatch. On the other hand, the need for flexibility increases due to the inherent intermittency and uncertainty of IRESs, and conventional generating units are therefore required to adjust their power outputs more frequently and sometimes even have to start up or shut down in the real-time unit commitment/real-time economic dispatch (RTUC/RTED) [3]. Moreover, the deviation or the steep changing rate of the net load demand beyond anticipation may lead to insufficient ramping capability even with sufficient installed generation capacity, and thus results in a price spike in the electricity market, undesired curtailment of IRESs, and/or compulsory load shedding. Therefore, it is indispensable for the integration of high penetration of IRESs to ensure that the required operational flexibility is maintained in the power system concerned.
The issues related to the flexibility of a power system have been considered in some existing publications. With the growing integration of IRESs into a power system, the arising issues in both operation and planning have endowed the assessment of flexibility with greater importance. The insufficient ramping resource expectation (IRRE) metric is proposed in [4] to measure power system flexibility for use in long-term planning, and the metric and methodology are further improved in [5] with network constraints considered. Reference [6] proposes a flexibility resource adequacy assessment method which can assess an annual flexible capacity requirement based on the duration curve models of net-load fluctuations. Three metrics power capability for up/down regulation, energy storage capability and power ramping capability are proposed in [7] to quantify and assess available operational flexibility of generating units. An “offline” flexibility index is presented in [8] to measure the technical flexibility level of both an individual generating unit and the whole system. Furthermore, a unit construction and commitment algorithm is introduced in [8] to determine the optimal investments in additional flexible units required to cope with increasing wind power penetration. In [9], the dispatch flexibility of a solar-hydro coordinated generation system is defined as the expected proportion that the coordinated generation can serve the load demand. Reference [10] proposes a systematic method for characterizing intra-hour net load deviations from the operating plan that requires the deployment of flexibility resources and formulates an optimization model to simultaneously evaluate the day-ahead flexibility requirements for different regulation intervals.
In addition to the assessment of power system flexibility on different time scales, the approach to enhance the flexibility of a power system or the procurement of flexibility from a “flexibility market” is another research priority. Flexible ramping products (FRPs), a new market design for improving the operational flexibility of the power system, have attracted extensive attention in academic and industrial communities and have been preliminarily deployed in two major electricity markets, the California Independent System Operator (CAISO) and the Midcontinent Independent System Operator (MISO) [11]. FRPs can cope with unexpected changes in the net load between future periods by retaining some ramping capability in the current dispatch period, thereby avoiding insufficiency of upward or downward ramping capability. A stochastic day-ahead scheduling model of electric power systems with flexible ramping resources for managing the variability of IRESs is proposed in [2], in which the hourly forecast error and the random outages are simulated using the Monte Carlo simulation. In [12] a “multi-timing” day-ahead scheduling method is proposed, which allows for the optimal procurement of flexible ramping capacity on an intra-hourly basis with energy and reserves concurrently optimized over hourly time intervals. References [13,14] compare a deterministic unit commitment model considering FRPs with a stochastic one, and conclude that the latter can achieve a higher social surplus. References [15,16] respectively studied the mechanism of FRPs provided by the interruptible load (IL) and by the battery energy storage in a joint energy and ancillary service market.
FRPs provide a new alternative for the accommodation of high-proportion IRESs. However, many existing works assume by default that the flexibility requirements are met by conventional generating units, neglecting the integration of other emerging flexibility resources such as the demand response (DR). As a resource capable of following the dispatch signal on the demand side, the integration of DR resources can help balance the real-time supply with demand after the large-scale IRES generation is connected to the power system.
Moreover, most of the existing research publications focus on unit commitment and economic dispatch in the day-ahead electricity market using scenario generation methods [2,13,14,15]. Few researchers have explicitly quantified the operational risk in the RTUC/RTED (real-time unit commitment/real-time economic dispatch) with FRPs incorporated, which is one of the reasons why FRPs are employed. Nevertheless, despite the economic optimality, the containment of the operational risk in the power system should also be one of the concerns for the Independent System Operator (ISO). Currently, the ISO directly assigns the requirement for ramping capability or sets a price cap on the FRPs no matter how much the potential demand is. If the bidding price or the opportunity cost of an FRP market participant is greater than the price cap, the participant will not be selected to provide FRPs even if there is a ramp shortage [16]. Complete elimination of the risk is neither economical nor feasible. But an assigned requirement or a fixed price cap may lead to a large shortage of ramping capabilities or even infeasibility of dispatch in some situations.
In this paper, a bi-level risk-limiting RTUC/RTED model considering FRPs provided by generating units and DR resources is proposed with the objective of maximizing the social surplus while minimizing the operational risk. The model can be run by the ISO in the real-time market and considers a system-level ramping capability requirement. Different types of DR resources are modeled and incorporated into the proposed model. The operational risk is quantified by the conditional value-at-risk (CVaR) and the ramping capability requirement is determined by the tradeoff between the operational risk and the operation cost. Then, the bi-level programming problem is converted into a single-level problem using the Karush–Kuhn–Tucker (KKT) optimality conditions and is linearized by the big-M method. Next, scenarios are generated by the Latin Hypercube Sampling method and reduced by the fast forward method. A method for simulating the actual dispatch process with the generated scenarios is then proposed. Finally, a number of cases illustrate the role of FRPs in improving system flexibility and the accommodation of IRESs, as well as the impact of the confidence level in CVaR on the system operational flexibility.
The contributions of this paper are as follows:
(a)
A risk-limiting RTUC/RTED model with FRPs provided by conventional generating units and DR resources is formulated, in which the energy and ramping capabilities of conventional generating units during start-up or shut-down processes are also considered.
(b)
The CVaR is applied to describe the risk of the penalty for IRES curtailment and compensation for load shedding. The demand for ramping capability is then determined by reaching the compromise between economic performance and reliability.
(c)
A validation method that simulates the actual real-time operation is proposed. The proposed model is rolled forward against different realizations of uncertainties generated by Latin Hypercube Sampling method. The expected social surplus and realized operation cost can then be calculated. Different dispatch models will be compared.
(d)
The impact of FRPs on the operational flexibility of power systems and the impact of other factors on the system flexibility with FRPs are illustrated and analyzed.
The remainder of this paper is organized as follows. In Section 2, the concepts and characteristics of power system flexibility and FRPs are introduced. Afterwards, the mathematical formulation of the studied problem is proposed in Section 3. In Section 4, case studies are then carried out with numerical results presented and discussed. Finally, Section 5 concludes this work.

2. Power System Flexibility

2.1. Definition of Flexibility and Acquisition of Flexibility Resources

Flexibility is one of the required features of a power system. Flexibility is needed in multiple stages and processes such as planning, operation, and overhaul of a power system. There is currently no general agreement on the definition of power system flexibility. Generally speaking, the term flexibility describes the ability of a power system to cope with variability and uncertainty in both generation and demand, while maintaining a satisfactory level of reliability at a reasonable cost over different time horizons [8,10]. Reference [4] defines flexibility as the ability of a system to deploy its resources to respond to changes in the net load. According to the International Energy Agency, flexibility expresses the extent to which a power system can modify electricity production or consumption in response to variability, expected or otherwise [17], while the North American Electric Reliability Corporation emphasizes the ability of a flexible power system to deal with load variations [18].
In a narrower sense, power system flexibility refers to the operational flexibility of a power system, which pays more attention to the system operational stage. More precisely, the operational flexibility refers to the ability of a power system to meet various operational constraints and ensure the secure and stable operation at a reasonable cost through unit commitment and economic dispatch that consider the uncertainty and variability on both sides of supply and demand. The definitions of flexibility by CAISO and MISO fall into this category. From the perspective of actual needs in system operations, they define flexibility as the ability of the system to meet potential demand for upward or downward ramping capability by dispatching additional flexibility capacities in a real-time setting [19,20].
Although the definition of power system flexibility is still evolving, the reasons of the need for the flexibility are basically consistent, namely the variability and uncertainty brought about by the integration of a high-penetration level of IRESs, and more intensive and interactive participations from terminal users. Based on the aforementioned definitions of flexibility, characteristics of power system flexibility include directionality, state dependence, multiple spatiotemporal characteristics and probabilistic characteristics.
Flexibility resources refer to resources that can enhance power system flexibility; they are available in all aspects of power sources, power grids, loads and energy storages. More specifically, flexibility can be enhanced by improved operations, demand response, improved grid infrastructures, quick start resources and energy storage [11]. So far, conventional generating units have been the primary providers of flexibility to a power system. However, studies have also indicated that IRESs such as wind power can also be employed in enhancing power system flexibility [21], and that flexibility can be provided by multi-carrier energy systems and virtual power plants [22].

2.2. Flexible Ramping Product

FRPs refer to the capacity dispatchable by the ISO, which is able to deal with the energy imbalances in the RTED [19]. FRPs are also referred to as “flexiramp” in CAISO, and ramp capability in MISO. It is a new type of market product designed to enhance the flexibility of a power system, which can be categorized into improved operations mentioned previously. Since the implementation of FRPs does not require additional new grid equipment or facilities, FRPs are generally regarded as an economical resource for enhancing system flexibility. By retaining some ramping capability in the current dispatch period, FRPs can dispose changes in the net load in the following consecutive periods, thereby alleviating or avoiding the power imbalance caused by insufficient system adjustment capability in real-time operation.
The main differences between the FRPs and other conventional auxiliary services are as follows. Firstly, FRPs are set aside in the current period but used in the future periods, while resources such as regulation and reserves are generally implemented and settled in the current time period. Secondly, the time scale of the regulation is on the level of seconds, which is used to deal with the fluctuations of the net load during the current dispatch period. However, the time scale considered by FRPs is much longer (typically 5–15 min), which is used to cope with the fluctuations of the net load between future time periods (primarily the current time period and the next one). Thirdly, the spinning and non-spinning reserves are mainly prepared for contingencies or overhauls and rarely called on in the RTED, while upward and downward ramping capabilities retained as FRPs are frequently called on in the RTED. Finally, FRPs can improve the ISO’s dispatch flexibility in the RTED while ancillary services usually cannot.
FRPs can be divided into two types, upward ramping products (notated as FRUs in CAISO) and downward ramping products (notated as FRDs in CAISO). Theoretically, any market entity that can follow the dispatching signal of the ISO can serve as a flexibility resource for providing FRPs. Furthermore, it is noted that in the MISO, providers of FRPs do not need to bid for their capacity because FRPs are priced based on the marginal units at optimality, while the bidding is allowed in both day-ahead and real-time markets in the CAISO [19,20].

3. Problem Formulation

The stochastic optimization models are usually computationally intensive, and more importantly the fairness and transparency of the dispatching outcomes for electricity market participants should be guaranteed. The deterministic formulations therefore remain valid and widely used by ISOs worldwide [23]. With this in mind, the presented model in this paper is a deterministic one. In addition, for notation simplicity, other ancillary services such as frequency regulation, spinning and non-spinning reserves are omitted in this work.
The proposed RTUC/RTED model in this work is a bi-level optimization model. The upper level is the model of the joint electricity and FRP market with an objective to maximize the social surplus, while the lower level aims at minimizing the operational risk represented by the CVaR.

3.1. Upper Level

DR programs can be broadly divided into incentive-based programs and price-based programs. The incentive-based DR refers to a controllable and schedulable resource that can serve as an alternative resource on the supply side, and hence is modeled as a virtual power plant in this work. The incentive-based programs include the direct load control (DLC), the interruptible load (IL), the emergency demand response (EDR) and so on. The users of these programs generally need to participate in the electricity market through an agent such as a curtailment service provider or a load service entity. Under normal circumstances, a qualified DLC capacity usually participates in the reserve or regulation market for capacity and energy gain [24]. Therefore, only the IL is considered to provide the “virtual power output” and FRUs through load reduction in this work. The price-based DR, which is not directly dispatched by the ISO but is treated as a predictable change in the amount of the power used, can affect the demand curve and is thus presented by the willingness-to-pay of various user groups of electricity.

3.1.1. Objective Function

With the consideration of DR resources on the demand side, the objective of the proposed joint electricity and ancillary service market is to maximize the social surplus, i.e., the overall utility of consumers minus the total production cost, as formulated in Equation (1). Reference [25] points out that representing the generation in a staircase fashion (energy blocks) may lead to misleading estimations of a system’s ramp availability; therefore, a formulation of power trajectory is proposed. With this in mind, a clear distinction between power and energy is drawn in this work.
In Equation (1), the marginal generating cost of an IRES unit is assumed to be zero. A user group with decremental willingness-to-pay and an IL agent with incremental bidding prices are modeled as user groups with different willingness-to-pay and agents with different bidding prices. The same modeling method is applied to generating units with incremental bidding functions too. The start-up cost C k start includes the energy production cost and the cost of providing fixed upward ramping capabilities during the start-up process. Likewise, the energy production cost and the cost of providing fixed downward ramping capabilities during the shut-down process are included in the shut-down cost C k shut . Therefore, Equations (2) and (3) only consider the energy produced by a unit during its dispatchable state (i.e., u k , t disp = 1). The bidding function for energy production of unit k in Equation (2) also reflects the unit’s energy production cost.
max   J upper = t = 1 T Δ t ( m = 1 N ug π m , t d m , t n = 1 N a λ n , t q n , t ) t = 1 T k = 1 N g ( C k start u k , t start + C k shut u k , t shut + C k fixed u k , t disp + c k , t energy ) t = 1 T n = 1 N a λ n , t up q n , t up t = 1 T k = 1 N g ( γ k , t up r k , t up + γ k , t dn r k , t dn )
c k , t energy = G k ( e k , t ) = b k , t e k , t
e k , t = Δ t [ P k min u k , t disp + 1 2 ( p k , t 1 + p k , t ) ]

3.1.2. Supply and Demand of Power and Ramping Capability

The power supply and demand balance constraint for each time period is presented in Equation (4). The requirements for upward and downward ramping capabilities are respectively governed by Equations (5) and (6), in which an IL is assumed to provide only upward ramping capability because consumers are motivated to resume power consumption immediately after performing responses. As can be seen in Equations (5) and (6), the ramping capabilities provided by generating units during their start-up and shut-down processes are also considered. Since the start-up and shut-down trajectories are fixed, the generating units cannot provide FRP freely as they do in the dispatchable state. However, generating units can still provide fixed ramping capabilities, which can facilitate the power system in some cases and should not be neglected. Normally, the requirements for upward and downward ramping capabilities in period t can be calculated by Equations (7) and (8) with a price cap.
h = 1 N res o h , t + k = 1 N g g k , t + n = 1 N a q n , t = m = 1 N ug d m , t + n = 1 N a Q n , t
k = 1 N g r k , t up + n = 1 N a q n , t up + k = 1 N g z = 1 T k start ( P k , z + 1 start P k , z start ) u k , t z + T k start + 2 start F t up
k = 1 N g r k , t dn + k = 1 N g z = 1 T k shut ( P k , z shut P k , z + 1 shut ) u k , t z + 2 shut F t dn
F t up = max { D t + 1 net D t net + U t , 0 }
F t dn = max { D t net D t + 1 net + U t , 0 }
D t net = D t total O t total = ( m = 1 N ug D m , t + n = 1 N a Q n , t ) h = 1 N res O h , t

3.1.3. Unit Commitment Logic

The relation between the operating state variable u k , t disp and the start-up and shut-down variables u k , t start and u k , t shut is presented in Equations (10) and (11). Constraints Equations (12) and (13) ensure the minimum time duration for the start-up or the shut-down process, while Equation (14) ensures that a unit will not start up again in the course of shut-down. The relation between state variables is illustrated in Figure 1. Furthermore, with constraint Equation (10), variables u k , t start and u k , t shut can be defined as continuous variables as long as u k , t disp is defined as a binary variable.
u k , t disp u k , t 1 disp = u k , t start u k , t shut
u k , t start + u k , t shut 1
z = t T k start t u k , z start u k , t disp
z = t T k shut + 1 t u k , z shut 1 u k , t disp
z = t T k start T k shut + 1 t u k , z shut 1 u k , t start

3.1.4. Power Output Constraints

The total power output including the start-up and shut-down trajectories is presented in Equation (15). Examples of the start-up and shut-down trajectories are given in Figure 1. The starting power output of a shut-down trajectory is omitted in Equation (15), which is Pkmin (i.e., gk,t = Pkmin and pk,t = 0) and is governed by Equation (18). The last power output of a start-up trajectory is also considered to be Pkmin, which is guaranteed by Equation (17). Constraint Equation (16) limits the power output of a unit to be within its technical output range. Other constraints on power outputs of generating units and IL are listed in Equations (19)–(21).
g k , t = z = 1 T k start + 1 P k , z start u k , t z + T k start + 2 start ( i )   start - up   trajectory + P k min u k , t disp + p k , t ( ii )   output   when   being   dispatchable + z = 2 T k shut + 1 P k , z shut u k , t z + 2 shut ( iii )   shut - down   trajectory
p k , t ( P k max P k min ) u k , t disp
p k , t M ( 1 u k , t + 1 start )
p k , t M ( 1 u k , t + 1 shut )
p k , t + r k , t up ( P k max P k min ) u k , t + 1 disp
p k , t r k , t dn 0
q n , t + q n , t up Q n , t

3.1.5. Constraints of Ramping Capacity and Rate

FRP capacity constraints are presented in Equations (22)–(24), while constraints on ramping rates of generating units and IL agents are given in Equations (25)–(27).
r k , t up R k up Δ t
r k , t dn R k dn Δ t
q n , t up V n up Δ t
p k , t p k , t 1 R k up Δ t
p k , t 1 p k , t R k dn Δ t
V n dn Δ t q n , t q n , t 1 V n up Δ t

3.1.6. Network Constraints

The direct current (DC) network power flow limits are enforced by Equation (28), and the elements in the vector of nodal power injection can be calculated by Equation (29).
F j max i = 1 N b H j i p i , t node F j max
p i , t node = h i o h , t + k i g k , t + n i q n , t m i d m , t n i Q n , t

3.1.7. Bounds of Variables

The upper bounds of some variables are listed in Equations (30)–(32). In addition, all the decision variables except p i , t node are nonnegative.
o h , t O h , t
q n , t Q n , t
d m , t D m , t
c k , t energy , d m , t , e k , t , g k , t , q n , t , q n , t up , p k , t , r k , t up , r k , t dn , u k , t disp , u k , t shut , u k , t start 0

3.2. Lower Level

3.2.1. Formulation of Conditional Value-at-Risk

CVaR is originally used in portfolio optimization for effective risk management. It is a risk assessment measure that quantifies the amount of tail risk by taking a weighted average of the “extreme” losses in the tail of the distribution of possible losses, beyond the value-at-risk (VaR) cutoff point.
Let L(x, y) be the loss associated with a set of decision variables x and a set of uncertain parameters y. For a given confidence level β (0 < β < 1), the VaR defined in Equation (34) refers to the smallest loss α, such that probability of losses above that level is at most 1−β [26].
VaR min { α : P { L ( x , y ) α } β }
VaR suffers from lack of convexity and subadditivity, so an alternative measure CVaR that overcomes these issues has been proposed. Assume that the (joint) probability density function of y is denoted by φ(y), and that VaR and CVaR associated with x for a given confidence level β are denoted by αβ(x) and δβ(x). The definition of CVaR is then presented by Equation (35). A practical technique for simultaneously calculating VaR and CVaR is given in Equations (36) and (37). In other words, the minimization of Fβ(x, α) produces a pair of (x*, α*), not necessarily unique, such that x* minimizes the CVaR and α* gives the corresponding VaR [27]. Furthermore, the integral in Equation (37) can be approximated using samples generated from φ(y) as presented in Equation (38).
CVaR 1 1 β L ( x , y ) α β ( x ) L ( x , y ) φ ( y ) d y
min x δ β ( x ) = min x , α F β ( x , α )
F β ( x , α ) = α + 1 1 β max { L ( x , y ) α , 0 } p ( y ) d y
F ˜ β ( x , α ) = α + 1 N sam ( 1 β ) s = 1 N sam max { L ( x , y s ) α , 0 }

3.2.2. Objective Function and Constraints

The operational risk of a power system should also be one of the concerns for the ISO. The operational risk in this paper includes the curtailment of IRESs and compulsory load shedding; it is assumed that other contingencies such as failures of transmission lines and outages of generating units are handled by reserves. From the description above, CVaR can properly measure the tail risk and is regarded as an appropriate approach to integrate the inherent risk management problem in the unit commitment and dispatch procedures [28].
The insufficiency of upward ramping capability (i.e., Δ D t net > f t up > 0) may result in the compulsory load shedding, while the shortage of downward ramping capability (i.e., Δ D t net < f t dn <0) will give rise to the curtailment of IRESs. The penalty for curtailment of IRESs and the compensation for compulsory load shedding can be regarded as a loss to the ISO, and the operational risk in such extreme cases can then be quantified by the CVaR.
In order to minimize the operational risk of the real-time operation for the time duration concerned, the objective function of the lower level model is formulated in Equation (39) following Equation (36). Equations (40)–(42) describe the linearization of the max function in Equation (38). For a given distribution of Δ D t net = D t + 1 net D t net , deterministic samples can be generated by the Latin Hypercube Sampling method with sample points equally spaced on the probability scale, so the fairness and transparency of the dispatching outcomes can be retained. Equations (5) and (6) are replaced by Equations (43) and (44), in which the demanded ramping capabilities are decision variables of the lower-level optimization problem. The lower bounds of the variables are given in Equations (45) and (46). Pursuing economic benefits in the upper-level problem may lead to a large risk; constraint Equation (47) is therefore imposed to limit the risk to an acceptable level. The variables placed at the end of these equations are the Lagrange multipliers for the corresponding constraints.
{ f t up , f t dn } arg min t = 1 T [ α t + 1 N sam ( 1 β ) s = 1 N sam l t , s ]
l t , s C com ( Δ D t , s net f t up ) α t : κ t , s up
l t , s C pen ( Δ D t , s net + f t dn ) α t : κ t , s dn
l t , s 0 : κ t , s
k = 1 N g r k , t up + n = 1 N a q n , t up + k = 1 N g z = 1 T k start ( P k , z + 1 start P k , z start ) u k , t z + T k start + 2 start f t up : μ t up
k = 1 N g r k , t dn + k = 1 N g z = 1 T k shut ( P k , z shut P k , z + 1 shut ) u k , t z + 2 shut f t dn : μ t dn
f t up max { D t + 1 net D t net , 0 } : τ t up
f t dn max { D t net D t + 1 net , 0 } : τ t dn
t = 1 T [ α t + 1 N sam ( 1 β ) s = 1 N sam l t , s ] R ac : ε

3.3. Solution Methology

Mathematically, the proposed RTUC/RTED model in Section 3.1 and Section 3.2 is a bi-level mixed-integer linear programming (MILP) problem, which cannot be solved directly. The KKT optimality conditions are applied to convert the problem into a single-level programming problem [29]. The Lagrangian function of the lower level model is given in Equation (48). The equality constraints and the complementary slackness constraints derived from the Lagrangian function are listed in Equations (49)–(52) and Equations (53)–(60), respectively.
Γ = t = 1 T ( α t + 1 N sam ( 1 β ) s = 1 N sam l t , s ) t = 1 T s = 1 N sam κ t , s up [ l t , s C com ( Δ D t , s net f t up ) + α t ] t = 1 T s = 1 N sam κ t , s dn [ l t , s + C pen ( Δ D t , s net + f t dn ) + α t ] t = 1 T μ t up [ k = 1 N g r k , t up + n = 1 N a q n , t up + k = 1 N g z = 1 T k start ( P k , z + 1 start P k , z start ) u k , t z + T k start + 2 start f t up ] t = 1 T μ t dn [ k = 1 N g r k , t dn + k = 1 N g z = 2 T k shut + 1 ( P k , z shut P k , z 1 shut ) u k , t z + 3 shut f t dn ] t = 1 T s = 1 N sam κ t , s l t , s t = 1 T τ t up ( f t up max { D t + 1 net D t net , 0 } ) t = 1 T τ t dn ( f t dn max { D t net D t + 1 net , 0 } ) + ε [ t = 1 T ( α t + 1 N sam ( 1 β ) s = 1 N sam l t , s ) R ac ]
Γ α t = 1 s = 1 N sam κ t , s up s = 1 N sam κ t , s dn + ε = 0
Γ l t , s = 1 N sam ( 1 β ) κ t , s up κ t , s dn κ t , s + 1 N sam ( 1 β ) ε = 0
Γ f t up = C com s = 1 N sam κ t , s up + μ t up τ t up = 0
Γ f t dn = C pen s = 1 N sam κ t , s dn + μ t dn τ t dn = 0
0 l t , s C com ( Δ D t , s net f t up ) + α t κ t , s up 0
0 l t , s + C pen ( Δ D t , s net + f t dn ) + α t κ t , s dn 0
0 l t , s κ t , s 0
0 k = 1 N g r k , t up + n = 1 N a q n , t up + k = 1 N g z = 1 T k start ( P k , z + 1 start P k , z start ) u k , t z + T k start + 2 start f t up μ t up 0
0 k = 1 N g r k , t dn + k = 1 N g z = 1 T k shut ( P k , z shut P k , z + 1 shut ) u k , t z + 2 shut f t dn μ t dn 0
0 f t up max { D t + 1 net D t net , 0 } τ t up 0
0 f t dn max { D t net D t + 1 net , 0 } τ t dn 0
0 R ac t = 1 T [ α t + 1 N sam ( 1 β ) s = 1 N sam l t , s ] ε 0
The complementary slackness constraints are nonlinear and the big-M method is employed to convert them into linear constraints by introducing ancillary binary variables [29]. To describe the above constraints in a vector form, let g(x) and η denote all the inequality constraints and their corresponding Lagrange multipliers, respectively. The complementary slackness constraints presented in Equations (53)–(60) can then be expressed in a compact way as shown in Equation (61). With the introduced binary variables θ, constraints Equation (61) can be replaced by Equations (62) and (63), in which I is a column vector with all elements being ones.
0 g ( x ) η 0
0 g ( x ) Μ ( Ι θ )
0 η Μ θ
The risk-limiting RTUC/RTED model considering FRPs provided by various flexibility resources proposed in this paper is summarized in Equation (64). It is an MILP problem, which can be solved by commercial solvers.
max   J = t = 1 T Δ t ( m = 1 N ug π m , t d m , t n = 1 N a λ n , t q n , t ) t = 1 T k = 1 N g ( C k start u k , t start + C k shut u k , t shut + C k fixed u k , t disp + c k , t energy ) t = 1 T n = 1 N a λ n , t up q n , t up t = 1 T k = 1 N g ( γ k , t up r k , t up + γ k , t dn r k , t dn ) s . t . ( 2 ) ( 4 ) ( 10 ) ( 33 ) ( 49 ) ( 60 )

3.4. Evaluation Approach

Since the forecast of user load demands (Dm,t or D t total ) and the available power outputs from IRESs (Oh,t or O t total ) are not completely accurate, errors exist in the forecast of the net load in the future periods. The forecasted user demands and power outputs from IRESs can be expressed by random variables, each following a normal distribution [3,15,23,30]. By assuming that the overall load demand D t total and the available power output from IRESs O t total are two mutually independent normal distributions, the net demand D t net = D t total O t total is also a normal distribution, whose expectation and variance can be calculated by Equations (65) and (66), respectively.
E ( D t net ) = E ( D t total ) E ( O t total )
V ( D t net ) = V ( D t total ) + V ( O t total )
Since the net load is a variable that follows a certain distribution and its exact value cannot be known in advance, the net load is simulated using simulation. Different results can be achieved by the same dispatch scheme under different simulated scenarios. As mentioned previously, the shortage of upward or downward ramping capability may result in the compulsory load shedding or the curtailment of IRESs, respectively. Therefore, the lack of operational flexibility of a power system can be measured by the amount of the shed load or curtailed power output from IRESs in a given time duration.
The impact of FRPs on the operational flexibility of a power system and the impact of other factors on the system flexibility with FRPs will be illustrated in this paper by simulating the actual dispatch process on randomly generated scenarios. Specifically, the RTUC/RTED model is rolled forward in different scenarios, and then the probability-weighted values of the social surplus, the actually realized operation cost, and probabilities and quantities of the load shedding as well as the curtailment of IRESs can be attained under different operation conditions.
Please note that this paper does not focus on the forecasting methods for user demand and IRES power output; they are assumed given as input parameters. The steps for generating scenarios by the Latin Hypercube Sampling method [30] and the fast forward method [31] are executed as follows, where each scenario provides a vector of overall load demand (i.e., D t total ) and a vector of the overall available power output from IRESs (i.e., O t total ) at t.
(a)
A baseline of the overall load demand and a baseline of the overall available power output from IRESs are given.
(b)
Samples for the overall load demand and the overall available power output from IRESs in each time period are generated by using the Latin Hypercube Sampling method according to their probability distributions.
(c)
Randomly scramble the order of sample points in each period, and then Nscen representative scenarios are selected based on the fast forward selection method. The probability ρs of each selected scenario is also obtained from the fast forward method.
(d)
The overall load demand D t total and overall available power output from IRESs Ot are allocated to Dm,t, Qn,t and Oh,t at different buses, each following a predetermined proportion.
During the actual system operations, the ISO continuously runs the proposed RTUC/RTED model. At the beginning of the daily system dispatching (i.e., t = 1), the unit commitment at t = 1 should have been determined in the previous period with the dispatch result in the previous period (i.e., t = 0) used as the boundary condition. Therefore, the RTUC/RTED model shown in Equation (64) solves the economic dispatch for t = 1, 2, …, T and the unit commitment for subsequent t = 2, 3, …, T, but only the economic dispatch results for t = 1 and the unit commitment results for t = 2 are practically implemented following the typical rolling horizon manner. Then the model moves to the next period. Note that the operating states of conventional units with a long start-up/shut-down time (e.g., several hours) should have been determined in the day-ahead market and thus remain unchanged in the RTUC/RTED.
It should be noted that in the actual dispatch process used by the ISO, the RTUC and RTED may be deployed in different frequencies. For example, in CAISO the RTUC is deployed in a 15-min resolution while the RTED in a 5-min resolution, which reduces the efficiency requirement for the RTUC and the computation burden for the RTED. However, for programming simplicity the RTUC and RTED are always executed together in this paper, which has no impact on the conclusions obtained except that it requires more computation time.

4. Case Studies and Numerical Results

The method proposed in this paper is first applied to a modified IEEE 14-bus power system in one-hour duration. Based on simulation results, the impacts of FRPs and other factors on the operational flexibility of the power system are illustrated and analyzed. Finally, a case study of an actual power system is conducted to demonstrate the potential for practical applications.
The modified IEEE 14-bus power system consists of 14 buses, 20 branches, five generating units and 11 loads. Among all the units, G1 is the base-load unit with smallest ramping rates and operation cost and offers a lowest bidding price for energy production. G2 is a quick start unit with highest ramping rate but also with a highest operation cost, which gives rise to a higher bidding price for energy production. G3, G4 and G5 are conventional generating units with medium ramping rates and operation cost.
The bidding prices for hourly provision of FRPs of generating units are assumed to be 10% of their bidding prices for the energy production. An IRES generating unit with zero marginal energy production cost is added to bus 14 and an agent with 15 MW IL capacity at a bidding price of 70 $/MWh is placed on bus 4. Load on each bus is assumed to have only one user group but with different willingness-to-pay for electricity. Parameters of generating units and loads are listed in Table 1 and Table 2, respectively. Interested readers are referred to the website http://www.ee.washington.edu/research/pstca/ for the data of branches in the system. Users will be penalized if they are incapable of following the dispatch signals but are not motivated to resume power consumption immediately after performing responses. Moreover, the capacity of IL usually cannot be called too frequently, so V n up is set to infinity while V n dn is assumed to be 0.2 Q n , t . Since the online capacities of IL are usually determined in the day-ahead market, Q n , t is set to be a constant for the time duration.
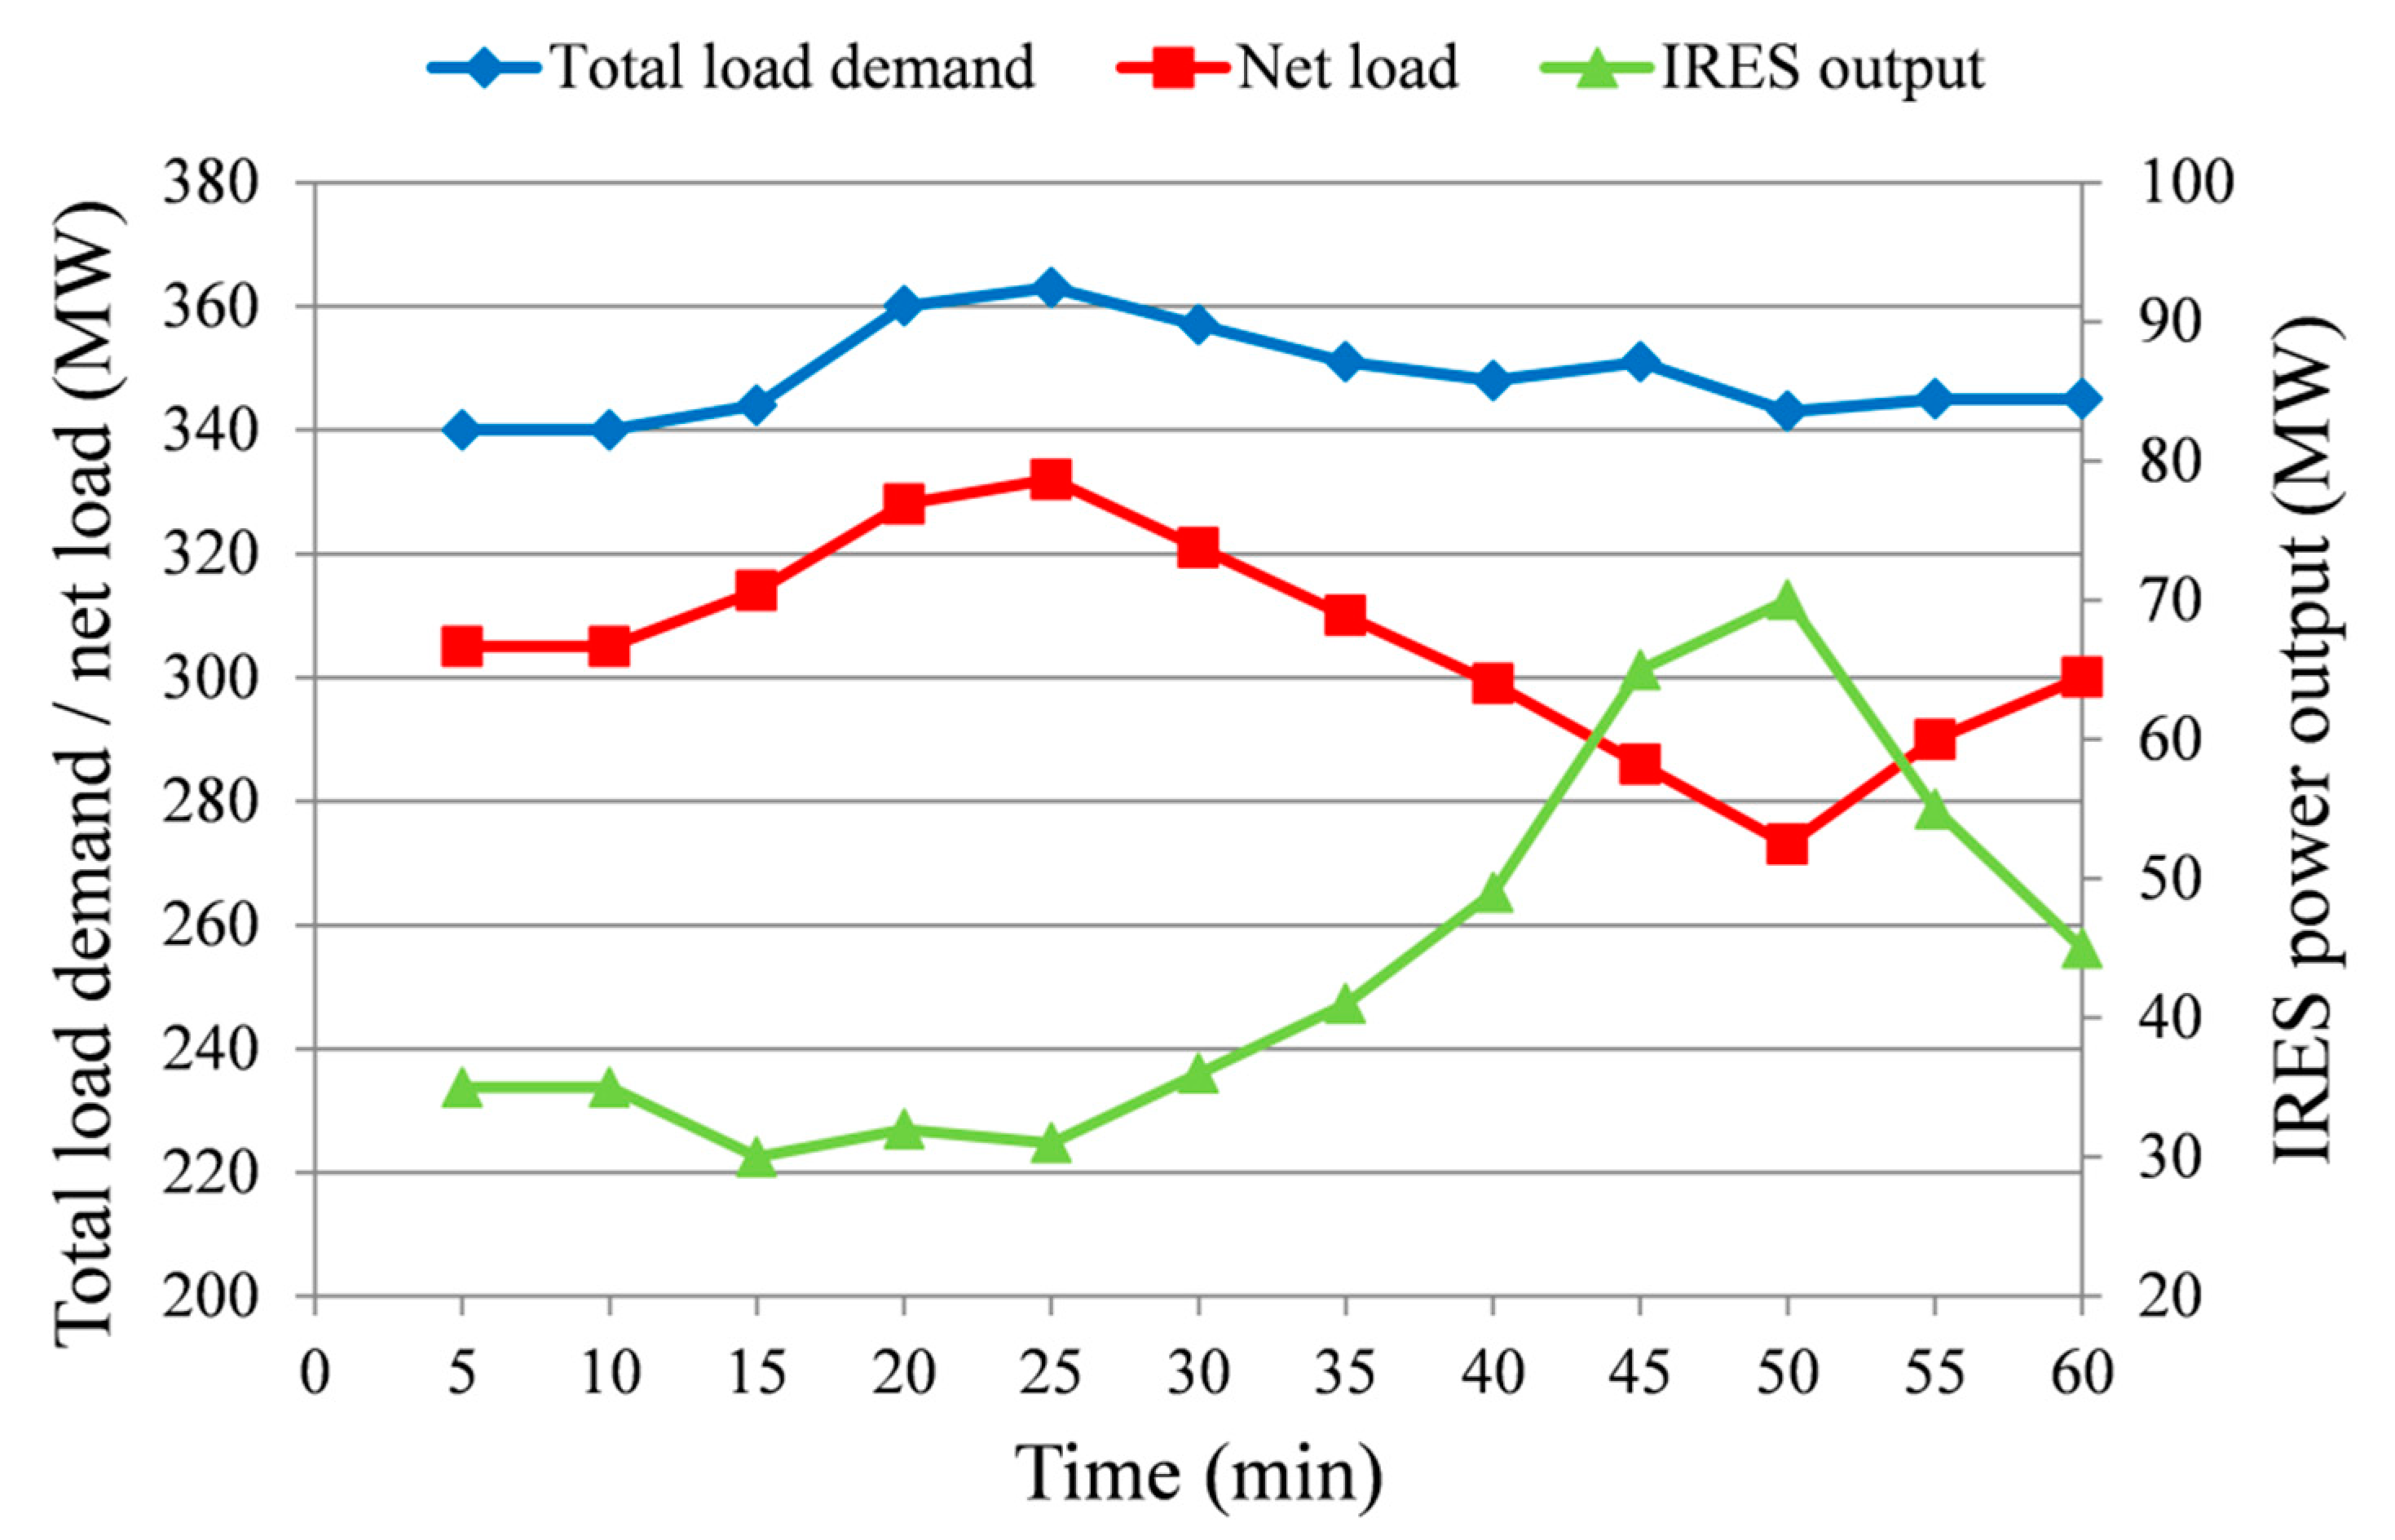
The clearing granularity of the RTED is set as 5 min (i.e., Δt = 5 min and T = 12) in line with the current market practice [15]. The 5-min forecasted overall user load and the overall available IRES power output are presented in Figure 2. The forecasted net load is also presented in Figure 2. As can be seen, the net load profile is fluctuant in Figure 2. Although in reality the net load is unlikely to be so volatile within an hour, this is fabricated this way in order to illustrate the effects of FRUs and FRDs.
There are further assumptions adopted in this paper: (a) The proportions of Dm,t in D t total are constant (i.e., D m , t = a m ( D t total n = 1 N a Q n ) ). (b) Since the network constraints consider DC power flows, the power factor in the whole system is assumed to be a constant (e.g., 0.9). (c) All bidding prices are constant for the time duration concerned. (d) The standard deviations (forecast errors) of D t total and O t total are 1% and 10% of the expected values, respectively. (e) The compensation price for load shedding and the penalty price for the IRES curtailment are both set as 500 $/MWh.
All the tests are implemented on Matlab R2014a, and all the MILP problems are coded and solved by YALMIP [32] and Gurobi.

4.1. The Role of FRPs in Enhancing the Operational Flexibility

In the simulation, it is set that Nscen = 30 and scenarios are generated based on the data in Figure 2. One can then calculate the expectations of the total operation cost, the social surplus, probabilities of load shedding and IRESs curtailment, and quantities of the shed load and the curtailed IRES in the scenarios with and without FRPs, respectively. The simulation results are given in Table 3. In the scenarios with FRPs, three models (fixed FRP demand, varied FRP demand and the risk-limiting model proposed in this work) are adopted for comparison. In the model with fixed FRP demand, the values of F t up and F t dn are set as 10 MW. In the model with varied FRP demand, the FRP requirements are determined by the confidence interval of the forecasted net load.
It can be seen from Table 3 that integrating an appropriate amount of FRPs (considered by all three models) in the RTUC/RTED can reduce the expected values of the probabilities and quantities of IRESs curtailment and load shedding in most cases. However, a higher cost is incurred accordingly, which is mainly reflected by the start-up cost and operation cost of the G2. It can also be observed from the quantity of the shed load that a fixed FRP demand cannot handle the variation in the net load well and sometimes may worsen the situation.
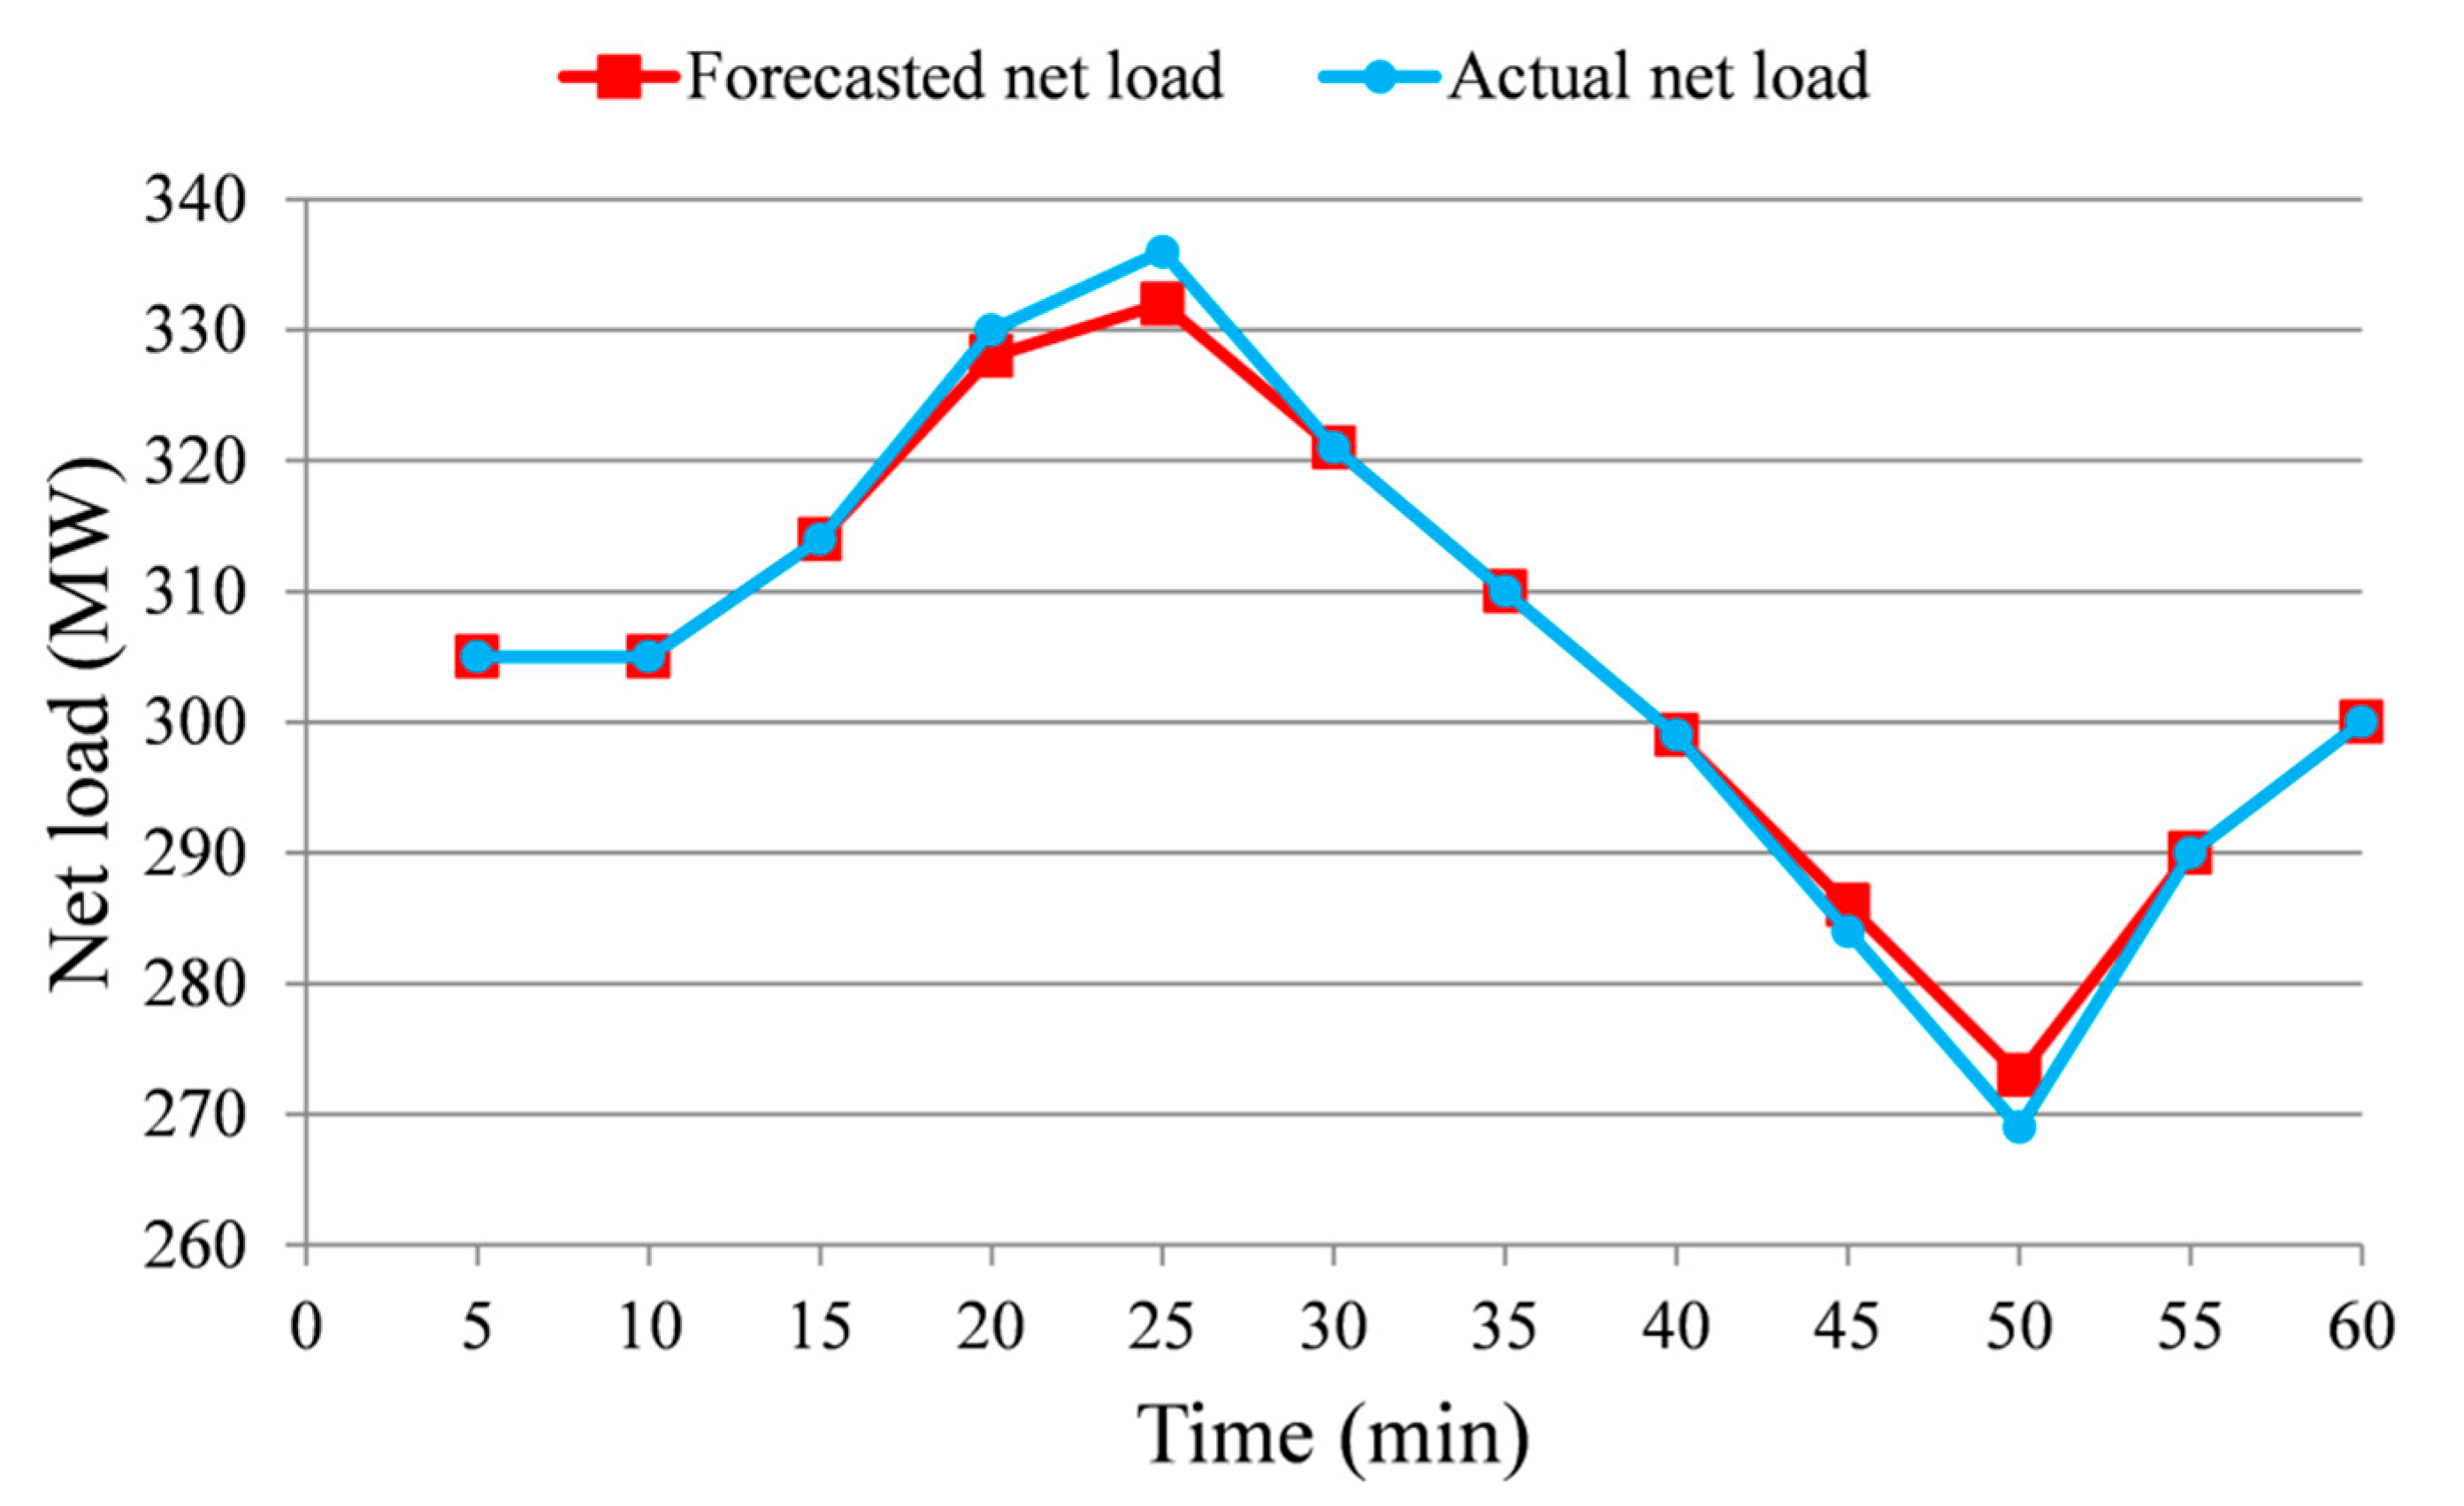
A typical scenario is generated for elaboration. The curves of the forecasted and actual net load are shown in Figure 3. As can be seen, the forecast is accurate in most time periods except some periods such as t = 4, 5, 9, and 10. Furthermore, whether there will be an error in the forecast for the actual overall load and IRESs output in period t will not be known until it is very close to time t. If the forecast is completely accurate, then despite the fluctuation of the net load curve, the IRESs curtailment or load shedding can be avoided even though FRPs are not considered in the RTUC/RTED. As a baseline, Table 4 below first displays the power outputs of generating units and the IL in each period when the forecasts for the net user load and IRESs output is accurate.
When errors are present in the forecast of user load and IRESs output, IRESs curtailment or load shedding may occur. According to Figure 3, at t = 3 the forecast increase in the net load for the next time period is +14 MW. G4, G5 and IL with the highest marginal costs can provide the required 14 MW upward ramping capability, so the ISO will not lower the output of the units with lower marginal costs to retain more upward ramping capability. However, at t = 4 the net load turns out to be 2 MW more than the forecasted value, resulting in an upward ramping capability demand of 16 MW instead of the expected 14 MW. Therefore, in order to maintain the power balance, the ISO has to shed 2 MW user load demand. A similar situation occurs at t = 5 when 5 MW upward ramping capability cannot meet the 6 MW actual demand. Similarly, at t = 10 when the 13 MW downward ramping capability cannot meet the 15 MW actual demand, which incurred IRESs curtailment. In total, 0.1667 MWh IRES power output is curtailed, and 0.4167 MWh load demand is shed for the time duration considered.
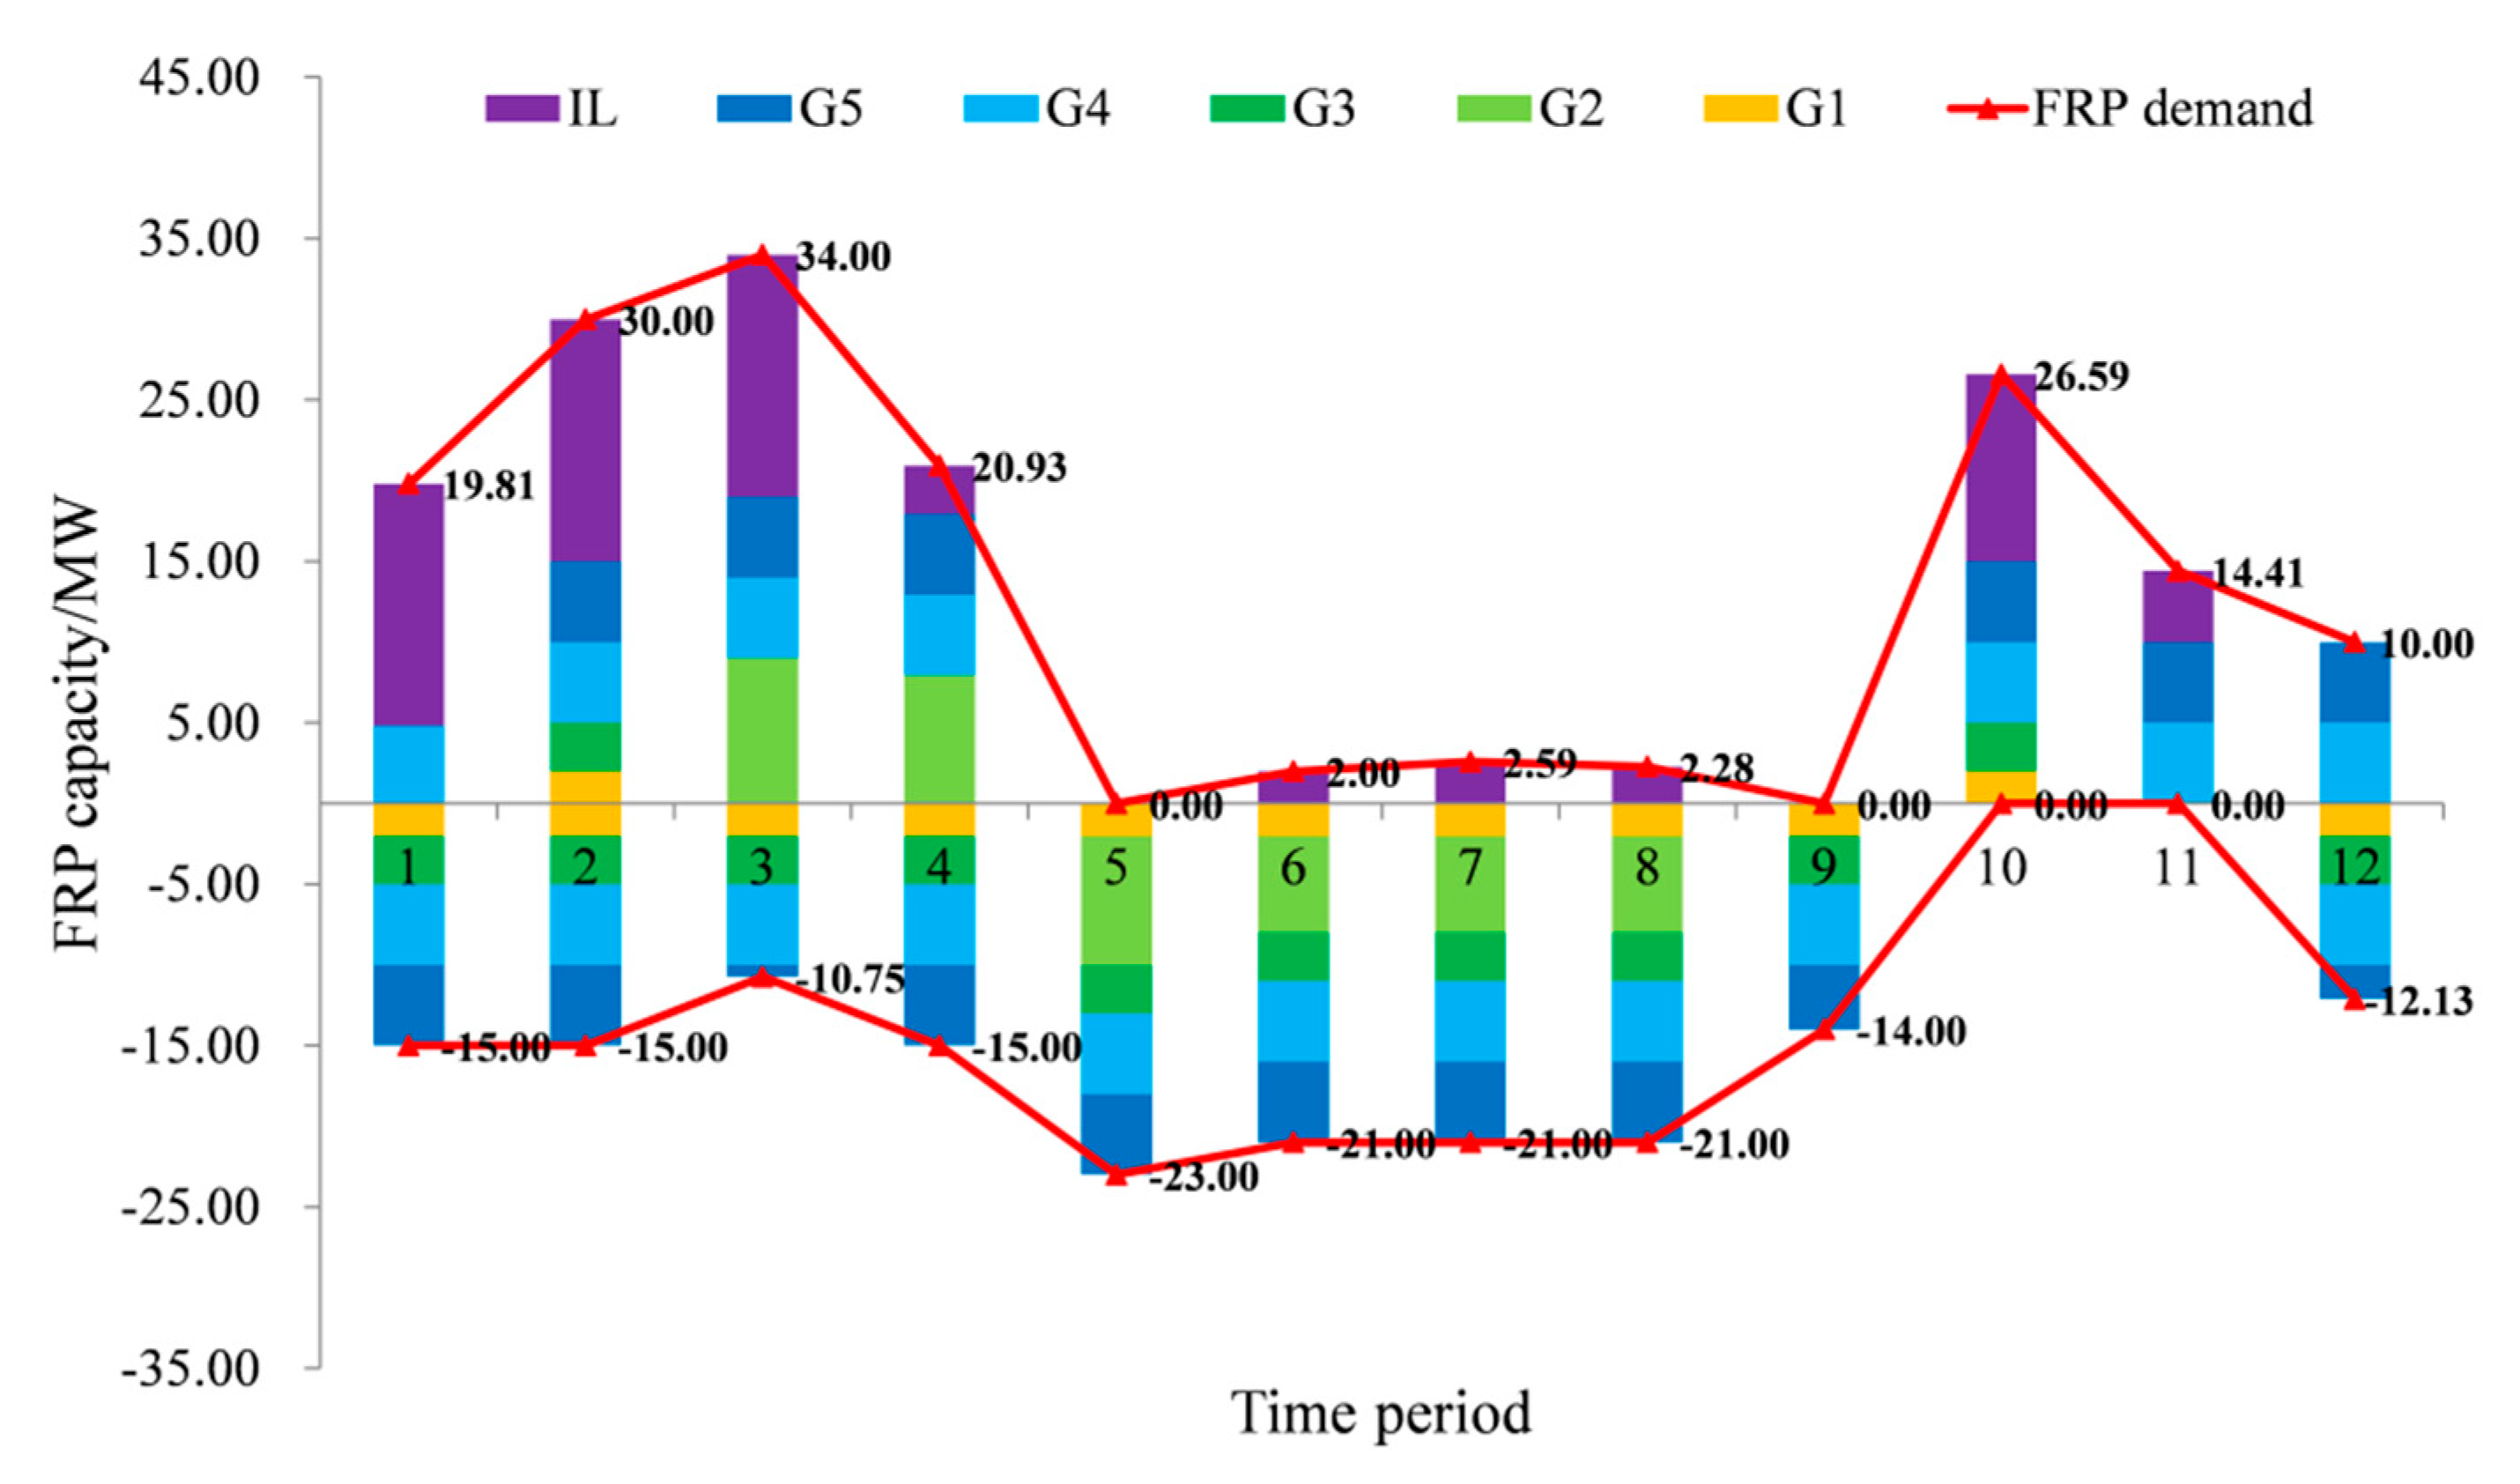
The actual power outputs of generating units and IL in the typical scenario where β = 0.9 and Rac = $1500 are shown in Table 5. Taking the uncertainty into consideration, upward and downward ramping products exceeding the forecasted variations in the net load are procured in order to contain the operational risk. The actual demand and supply of FRUs and FRDs are displayed in Figure 4, in which FRU is represented by the red curve in the positive domain and FRD is represented the red curve in the negative domain. It should be clarified that G2 only provides FRP from t = 4 to t = 5, though it provides ramping capabilities during its start-up or shut-down processes.
As can be seen from Figure 4, the outline of the demanded FRP capacity resembles the curve of the net load. Based on the FRP demand calculated, it is decided to start the G2 with the highest ramping rate at t = 2 and the start-up process ends at t = 4. The start-up of G2 endows the system with adequate resources in response to the peak in the net load. Moreover, the upward ramping capabilities of G2 used in the peak period can then be converted into downward ramping capabilities in the valley period, which brings more flexibility in the real-time dispatch. The integration of FRP in the RTUC/RTED enhances the flexibility of the system to avoid load shedding and IRESs curtailment.
Although the procurement of FRPs aims at alleviating load shedding and IRESs curtailment and both of them can be avoided in the typical scenario, the complete elimination of load shedding and IRESs curtailment is not the primary goal. The FRP requirement calculated by the proposed risk-limiting model allows load shedding or IRESs curtailment but tries to contain the operational risk to an acceptable level, in terms of the compensation for load shedding and the penalty for IRESs curtailment. For example, the required downward ramping capability at t = 9 is 14 MW, which is less than the actual demand 15 MW at t = 10. However, the requirements of downward ramping capabilities in the previous periods still maintain some flexibility, so as to cope with unexpected variation in the net load.
The requirements of ramping capabilities are determined by the tradeoff between risk and cost. In the real-time dispatch, the ISO doesn’t maintain as many FRPs as possible. For example, the maximum downward ramping capabilities that can be provided from t = 6 to t = 8 are 24 MW, but the procured capacities are only 21 MW. In other words, the ISO chooses to save the cost of procuring more ramping capabilities and bear the risk of not procuring them. This implies that the ISO may be willing to take the risk of having insufficient ramping capabilities and paying the compensation for load shedding and the penalty for IRESs curtailment, because the occurrence probability of an extremely adverse event is at most 1-β. What’s more, procurement of ramping capabilities less than the actual demand may not necessarily lead to load shedding or IRESs curtailment according to the example of the typical scenario. In other words, the measurement of the operational risk considers the worst-case scenario, i.e., the procured ramping capabilities are the only resources that the ISO can utilize to cope with unexpected variation in the net load.
From the analyses above, it can be seen that a given amount of variability of the IRES power output could amplify the fluctuation of the net load in the system, which requires the units to adjust frequently and thus brings difficulties to the dispatch decisions. When the variability of IRES output is high, the error of the net load forecast will be high, resulting in an insufficiency of system flexibility, which may lead to IRESs curtailment or load shedding. If an appropriate amount of FRP is integrated into the RTUC/RTED, the operational flexibility of the system can be enhanced with better accommodation of IRESs. Further, the curtailment of IRESs or load shedding can be alleviated or avoided at the expense of higher operation cost. The increase in operation cost of the system after incorporating FRPs into the RTUC/RTED mainly comes from the output reduction of the units with lower marginal costs to obtain the upward ramping capability, or the output increase of the units with higher marginal costs (including starting offline units) to obtain downward ramping capabilities.
It should be noted that a model considering varied FRP demands can also achieve a satisfactory result as the proposed risk-limiting model. For example, if Ut in Equations (7) and (8) is calculated by U t = 0.67 V ( D t + 1 net D t net ) where the coefficient 0.67 stands for a 50% confidence level for the normal distribution, then a decent result can also be obtained. This model is currently widely used and with an appropriate confidence level it can greatly enhance the operational flexibility. It is conceivable that the ISO will be inclined to adopt a high confidence level to avoid the load shedding or the IRESs curtailment. However, adopting a large confidence level to cover more uncertainties of the net load is uneconomical with diminishing marginal utility and may artificially cause insufficiency of system flexibility in the case of limited resources. More importantly, it is difficult for the ISO to determine the confidence level based on its preference for economy or aversion to risk, since the confidence level is not directly linked with revenue or cost. In the risk-limiting model proposed in this paper, all the parameters are in monetary value. The preference for economical performance or aversion to risk can be represented by the acceptable extreme loss and the confidence level. The ISO can just determine the Rac and the demand for FRPs will be automatically determined.

4.2. Effects of the Confidence Level in CVaR on the Operational Flexibility

As described above, CVaR can be used to measure the extreme loss. According to the definition of CVaR, the probability that the loss is greater than CVaR is at most 1 and there is a positive correlation between the confidence level β and CVaR. For a fixed acceptable extreme loss for the ISO, adopting a larger β represents an attempt of the ISO to contain the loss under Rac in more extreme situations. In other words, a larger β indicates a stronger aversion to the risk. For a fixed confidence level, adopting a smaller Rac also indicates a stronger aversion to the risk. On the contrary, adopting a small β or a large Rac indicates a more neutral attitude towards the risk. In order to analyze the impact of the confidence level β on the dispatch results, sensitivity analysis is conducted. The simulation results under different β are presented in Figure 5 and Figure 6, in which Rac = $1500. For the scale of the figure, the total operation cost when β = 0.9 is not plotted in Figure 6.
As can be seen from Figure 5, when β is less than 0.6, the probabilities and the quantity of IRESs curtailment and load shedding (MWh) remain at a relatively constant level. The reason lies in that the ISO focuses on economic performance and is willing to tolerate a higher risk. The total operational cost therefore increases slowly, as presented in Figure 6. When β is equal to or greater than 0.6, the aversion to risk begins to predominate such that the cost of maintaining FRPs increases much faster, and the probability and the quantity of load shedding decline accordingly. The turning point appears when β is greater than 0.7. Load shedding is completely avoided with β ≥ 0.8 and the IRESs curtailment is close to zero with β = 0.9. A surge in the operation cost is accordingly incurred in order to control the operational risk under the acceptable level.
With a stronger aversion to the operational risk, although the operational flexibility of the system is enhanced, the total operation cost increases. The increase in the operation cost of the system mainly comes from the output reduction of the units with lower marginal costs to obtain the upward ramping capabilities, or the output increase of the units with higher marginal costs to obtain downward ramping capabilities. When β reaches 0.9, according to Table 3, the quick start unit G2 is started and the total cost will be much higher due to its start-up and shut-down cost. What is more, a decreasing Rac with a fixed β will have the same effect as an increasing β with a fixed Rac.

4.3. A Case Study on Guangdong Power Grid in China

In order to further demonstrate the potential for practical applications, the method proposed is applied to a regional power system (on 220 kV and 500 kV level) in Guangdong Province in south China in 24-h duration. The regional power system mainly comprises Guangzhou city, the capital of Guangdong Province, and consists of 130 buses, 162 (equivalent) branches, 40 (equivalent) generating units and 92 loads. The total load demand in this regional system is above 22,000 MW in the peak period, and more than half of the load demand is supplied by high voltage direct current (HVDC) transmission lines from neighboring provinces (e.g., Yunnan Province), whose input power cannot be adjusted quickly since it is not directly dispatched by the Power Dispatching Center in Guangdong Province. A gas turbine with 780 MW capacity was just installed in 2018 in Guangzhou, acting as a quick start unit. Considering the facts that the available photovoltaic power output is still a lot less and the demand response is still on the pilot stage in Guangzhou, a wind farm with 2,000 MW capacity and four agents with 125 MW IL capacity each (500 MW in total) are added into the system.
The clearing time period of the RTED adopted by the power dispatching center in Guangdong Province is 15 min (i.e., Δt = 15 min), and 96 dispatch results will therefore be generated in one day. In the current UC/ED program, the objective is to minimize the total operation cost since the demand side is only required to submit electricity demand to the dispatch center, but in the near future the demand side will be allowed to bid quantities and prices in the electricity market and the objective will become maximization of social surplus. The typical daily load demand of Guangdong in summer is shown in Figure 7, with the typical daily power output from a wind farm in Guangdong included [33]; they are used to represent the forecasted overall load demand and the power output from IRESs after scaling. Other assumptions specified for simulations are the same as before.
It can be observed from Figure 7 that the power outputs from wind turbines are very fluctuant and are comparatively higher at night. On the contrary, the total load demand is at its valley in early morning. At 6 am when people begin to get up, the load demand level reaches the valley and then quickly climbs up when people start to work. The steep change in the load demand requires generation units to reduce their power outputs, but at the same time to remain online for providing upward ramping capabilities. The fluctuating wind power output within an hour also poses a challenge to the regulation capabilities of generating units.
Simulation results are presented in Table 6. The curtailment of IRESs mainly occurs during 4–6 am, this is because most generating units have low power outputs (close to their minimum technical outputs) and only a few units (the baseload units) have high power outputs in this period. Therefore, the power system has abundant upward regulation capability but tight even insufficient downward regulation capability. If there is a sudden increase in the wind power output at load valley periods, the power system may have to curtail some wind power output, if the downward regulation capability is insufficient. Moreover, the DR resources in the power system can help to cope with the rapid increase in the net load but can hardly deal with the decrease in the net load.
From the dispatching results with FRPs, it is shown that the load demand at night is allocated on generating units more evenly. In other words, if generating units with higher production costs have higher power outputs at night, then the power system will have more room for addressing the decrease of the net load. It should be noted that the quick start unit is not started, and this means that the power system is of insufficient downward capacities rather than downward ramping rates. Starting an extra generating unit can increase the total ramping rate of the system but cannot provide extra room for downward regulation. With FRPs considered in the RTUC/RTED, the curtailment of IRESs cannot be fully avoided, although the problem is indeed alleviated. It can therefore be concluded that this regional power system cannot completely accommodate 2,000 MW wind power output even with FRPs integrated. To achieve complete accommodation of IRESs more flexibility resources are demanded.

5. Conclusions

The integration of a high proportion of IRESs into a power grid results in higher variability and uncertainty to the power system, and FRPs provide a new alternative for accommodating the high-proportion IRESs. This paper proposes a bi-level risk-limiting RTUC/RTED model considering FRPs provided by different flexibility resources, whose objective is to maximize the social surplus while minimizing the operational risk. The proposed model determines the FRP requirement based on the ISO’s preference for operational efficiency as well as its aversion to the operational risk. Numerical results demonstrated that the implementation of FRPs can help to cope with the unexpected variations in the net load at the expense of higher operation cost. A dynamic FRP requirement can handle the variations in the net load better than the static one, and the proposed risk-limiting model in this paper may be adopted by the ISO to manage variabilities on both the supply and demand sides. In our future work, this study will be extended to incorporate more flexibility resources such as battery energy storages, electric vehicles, and power-to-gas facilities.

Author Contributions

H.L. proposed the methodological framework and mathematical model, and performed the simulations; C.W. modified and improved the mathematical model; F.W. examined the mathematical model, analyzed the results, reviewed the manuscript and provided suggestions; C.-L.T. and J.H. examined the mathematical model, reviewed the manuscript and provided suggestions; L.M. and M.F. initiated this project, and analyzed the results. All authors discussed the simulation results and agreed for submission.

Funding

This work is jointly supported by National Key Research and Development Program of China (2017YFB0902900), and by a SGCC Science and Technology Project entitled “Research on the Selection and Evolution Path of Electricity Spot Market for the National Unified Electricity Market”.

Conflicts of Interest

The authors declare no conflict of interest.

Nomenclatures

Indexes
hIndex for intermittent renewable energy generating units
iIndex for buses
jIndex for branches
kIndex for generating units
mIndex for user groups
nIndex for the interruptible load agents
sIndex for samples or scenarios
tIndex for dispatch time periods
zIndex reused in constraints
Parameters
amThe proportion of the load demand of user group m in the load demand of all the user groups
bk,tBidding price of energy production of unit k at period t (in $/MWh)
dm,0Initial load demand of user group m at the t = 0 period (in MW)
gk,0Initial power output of generating unit k at the t = 0 period (in MW)
CcomCompensation price for load shedding (in $/MWh)
C k fixed Fixed cost of generating unit k for a time period (in $)
C k shut Shut-down cost of generating unit k (in $)
C k start Start-up cost of generating unit k (in $)
CpenPenalty price for IRES curtailment (in $/MWh)
Dm,tMaximum power demand of user group m at period t (in MW)
D t net Actual (when t = 1) or forecasted (when t > 1) net load demand of the power system at period t, D t net = D t total O t total (in MW)
D t total Actual (when t = 1) or forecasted (when t > 1) total load demand of all users (including interruptible load participants) in the power system at period t, D t total = m = 1 N ug D m , t + n = 1 N a Q n , t (in MW)
F t up / F t dn Demanded upward/downward ramping capability for period t (in MW)
Fmax(Fjmax) Rated flow limit matrix of branches with elements Fjmax (in MW)
H(Hji)Power transfer distribution factor matrix of the system with elements Hji
MA big number used in constraints, e.g., M = 999,999
NaNumber of the interruptible load agents
NbNumber of buses
NbrNumber of branches
NgNumber of generating units
NresNumber of intermittent renewable energy generating units
NscenNumber of generated scenarios
NsamNumber of samples in the approximation of the CVaR integral
NugNumbers of user groups
O t total Overall available power output from all intermittent renewable energy generating units in period t, O t total = h = 1 N res O h , t (in MW)
Oh,tAvailable power output of intermittent renewable energy generating unit h in period t (in MW)
Pkmax/PkminMaximum/minimum technical output of generating unit k (in MW)
P k , z start / P k , z shut Power output at the beginning of the zth period of the start-up/shutdown process (in MW)
Qn,tAvailable capacity of interruptible load agent n in period t, normally determined in the day-ahead electricity market (in MW)
RacAcceptable extreme loss for ISO (in $)
R k up / R k dn Maximum ramping up/down rate of unit k during the dispatchable state (in MW/h)
TNumber of dispatch time periods
T k start / T k shut Minimum number of time periods required for start-up/shut-down of generating unit k
V n up / V n dn Maximum upward/downward changing rate of the interruptible load agent n (in MW/h)
UtAn uncertainty factor considered in the calculation of demanded ramping capability at period t, whose value is related to the confidence level
βConfidence level in the conditional value-at-risk
γ k , t up / γ k , t dn Bidding price of the upward/downward ramping products provided by generating unit k at period t (in $/MW)
λ n , t Bidding price of the virtual power output provided by interruptible load agent n in period t (in $/MW)
λ n , t up Bidding price of the upward ramping products provided by interruptible load agent n in period t (in $/MW)
πm,tWillingness-to-pay for electricity by user group m (in $/MWh)
ρsProbability of scenario s
Δ D t net , Δ D t , s net Variation in D t net and a sample of Δ D t net respectively (in MW)
ΔtDuration of a dispatch time period (in h)
Variables
c k , t energy Energy production cost of generating unit k in period t (in $)
dm,tLoad demand of user group m in period t (in MW)
ek,tEnergy scheduled for generating unit k in period t, excluding the energy production during the start-up or shut-down process (in MWh)
f t up / f t dn Demanded upward/downward ramping capability for period t (in MW)
gk,tTotal power output of generating unit k at the end of period t, including the power trajectories during the start-up or shut-down process (in MW)
lt,sAuxiliary variable used in the lower level problem
oh,tDispatched power output of intermittent renewable energy generating unit h in period t (in MW)
pk,tPower output over the minimum technical output of generating unit k at the end of period t (in MW)
p t node ( p i , t node )Vector of nodal power injection with elements p i , t node (in MW)
qn,tVirtual generation output of the interruptible load agent n in period t (in MW)
q n , t up Upward ramping products provided by the interruptible load agent n in period t (in MW)
r k , t up / r k , t dn Upward/downward ramping products provided by generating unit k in period t (in MW)
u k , t disp Binary operating state variable of generating unit k in period t, with 1 standing for dispatchable (with power output exceeding the minimum level in the whole period) and 0 otherwise
u k , t shut Shut-down variable, with 1 marking the beginning of the shut-down process of generating unit k in period t
u k , t start Start-up variable, with 1 marking the completion of the start-up process of generating unit k in period t
αtValue-at-risk at period t (in $)
κ t , s up , κ t , s dn , κt,s, μ t up , μ t dn , τ t up , τ t dn , εLagrange multipliers for constraints
Functions
E(·) Expectation of a random variable
Gk(ek,t)Bidding function as well as the energy production cost of generating unit k in period t (in $)
P{·} Probability of an event
V(·) Variance of a random variable

References

  1. Wu, C.Y.; Hug, G.; Kar, S. Risk-limiting economic dispatch for electricity markets with flexible ramping products. IEEE Trans. Power Syst. 2016, 31, 1990–2003. [Google Scholar] [CrossRef]
  2. Wu, H.Y.; Shahidehpour, M.; Alabdulwahab, A.; Abusorrah, A. Thermal generation flexibility with ramping costs and hourly demand response in stochastic security-constrained scheduling of variable energy sources. IEEE Trans. Power Syst. 2015, 30, 2955–2964. [Google Scholar] [CrossRef]
  3. Heydarian-Forushai, E.; Golshan, M.E.H.; Shafie-khah, M.; Sinao, P. Optimal operation of emerging flexible resources considering sub-hourly flexible ramping product. IEEE Trans. Sustain. Energy 2018, 9, 917–929. [Google Scholar]
  4. Lannoye, E.; Flynn, D.; O’Malley, M. Evaluation of power system flexibility. IEEE Trans. Power Syst. 2012, 27, 922–931. [Google Scholar] [CrossRef]
  5. Lannoye, E.; Flynn, D.; O’Malley, M. Transmission, variable generation, and power system flexibility. IEEE Trans. Power Syst. 2015, 30, 57–66. [Google Scholar] [CrossRef]
  6. Tanabe, R.; Amano, H.; Yokoyama, A. An analytical method for assessing flexible resource adequacy of power systems with a high share of renewables. In Proceedings of the IEEE Manchester PowerTech, Manchester, UK, 18–22 June 2017. [Google Scholar]
  7. Ulbig, A.; Andersson, G. Analyzing operational flexibility of electric power systems. Int. J. Electr. Power Energy Syst. 2015, 72, 155–164. [Google Scholar] [CrossRef]
  8. Ma, J.; Silva, V.; Belhomme, R.; Kirschen, D.S.; Ochoa, L.F. Evaluating and planning flexibility in sustainable power systems. IEEE Trans. Power Syst. 2013, 4, 200–209. [Google Scholar]
  9. Yang, J.W.; Zhang, N.; Kang, C.Q.; Xia, Q.; Miao, M.; Tian, X. Assessing the dispatch flexibility of coordinated solar and hydro generation. In Proceedings of the IEEE Power and Energy Society General Meeting, Boston, MA, USA, 17–21 July 2016. [Google Scholar]
  10. Dvorkin, Y.; Kirschen, D.S.; Ortega-Vazquez, M.A. Assessing flexibility requirements in power systems. IET Gener. Transm. Distrib. 2014, 8, 1820–1830. [Google Scholar] [CrossRef]
  11. Wang, Q.; Hodge, B. Enhancing power system operational flexibility with flexible ramping products: A review. IEEE Trans. Ind. Inform. 2017, 13, 1652–1664. [Google Scholar] [CrossRef]
  12. Marneris, I.G.; Biskas, P.N. Optimal scheduling of flexible ramping capacity in short-term electricity markets. In Proceedings of the Power Systems Computation Conference, Genoa, Italy, 20–24 June 2016. [Google Scholar]
  13. Wang, B.B.; Hobbs, B.F. A flexible ramping product: Can it help real-time dispatch markets approach the stochastic dispatch ideal? Electr. Power Syst. Res. 2014, 109, 128–140. [Google Scholar] [CrossRef]
  14. Wang, B.B.; Hobbs, B.F. Real-time markets for flexiramp: A stochastic unit commitment-based analysis. IEEE Trans. Power Syst. 2016, 31, 846–880. [Google Scholar] [CrossRef]
  15. Hu, J.H.; Wen, F.S.; Wang, K.; Huang, Y.C.; Salam, M.D.A. Simultaneous provision of flexible ramping product and demand relief by interruptible loads considering economic incentives. Energies 2017, 11, 46. [Google Scholar] [CrossRef]
  16. Hu, J.H.; Sarker, M.R.; Wang, J.H.; Wen, F.S.; Liu, W.J. Provision of flexible ramping product by battery energy storage in day-ahead energy and reserve markets. IET Gener. Transm. Distrib. 2018, 12, 2256–2264. [Google Scholar] [CrossRef]
  17. International Energy Agency. Harnessing Variable Renewables: A Guide to the Balancing Challenge; Organization for Economic Co-Operation and Development; International Energy Agency: Paris, France, 2011; p. 35. ISBN 9789264111394. [Google Scholar]
  18. North American Electric Reliability Corporation. Accommodating High Levels of Variable Generation; North American Electric Reliability Corporation: Atlanta, Georgia, 2009. [Google Scholar]
  19. Xu, L.; Tretheway, D. Flexible Ramping Products; California ISO: Folsom, CA, USA, 2012; Available online: http://www.caiso.com/Documents/DraftFinalProposal-FlexibleRampingProduct.pdf#search=Flexible%20ramping%20products (accessed on 1 May 2019).
  20. Navid, N.; Rosenwald, G. Ramp Capability Product Design for MISO Markets; Midcontinent ISO: Carmel, IN, USA, 2013; Available online: https://cdn.misoenergy.org/Ramp%20Product%20Conceptual%20Design%20Whitepaper271170.pdf (accessed on 1 May 2019).
  21. Chen, R.Z.; Wang, J.H.; Botterud, A.; Sun, H.B. Wind power providing flexible ramp product. IEEE Trans. Power Syst. 2017, 32, 2049–2061. [Google Scholar] [CrossRef]
  22. Alizadeh, M.I.; Moghaddam, M.P.; Amjady, N.; Siano, P.; Sheikh-El-Eslami, M.K. Flexibility in future power systems with high renewable penetration: A review. Renew. Sustain. Energy Rev. 2016, 57, 1186–1193. [Google Scholar] [CrossRef]
  23. Morales-Espana, G.; Baldick, R.; Garcia-Gonzalez, J.; Ramos, A. Power-capacity and ramp-capability reserves for wind integration in power-based UC. IEEE Trans. Sustain. Energy 2016, 7, 614–624. [Google Scholar] [CrossRef]
  24. PJM Interconnection. PJM Demand Response Strategy; PJM Interconnection: Valley Forge, PA, USA, 2017; Available online: http://www.pjm.com/-/media/library/reports-notices/demand-response/20170628-pjm-demand-response-strategy.ashx?la=en (accessed on 1 May 2019).
  25. Morales-Espana, G.; Ramos, A.; Garcia-Gonzalez, J. An MIP formulation for joint market-clearing of energy and reserves based on ramp scheduling. IEEE Trans. Power Syst. 2014, 29, 476–488. [Google Scholar] [CrossRef]
  26. Khodabakhsh, R.; Sirouspour, S. Optimal control of energy storage in a microgrid by minimizing conditional value-at-risk. IEEE Trans. Sustain. Energy 2016, 7, 1264–1273. [Google Scholar] [CrossRef]
  27. Rockafellar, R.T.; Uryasev, S. Optimization of conditional value-at-risk. J. Risk 2000, 2, 21–41. [Google Scholar] [CrossRef] [Green Version]
  28. Asensio, M.; Contreras, J. Stochastic unit commitment in isolated systems with renewable penetration under CVaR assessment. IEEE Trans. Smart Grid 2015, 7, 1356–1367. [Google Scholar] [CrossRef]
  29. Zhang, Y.M.; Han, X.S.; Xu, B.; Wang, M.Q.; Ye, P.F.; Pei, Y.N. Risk based admissibility analysis of wind power integration into power system with energy storage system. IEEE Access 2018, 6, 57400–57413. [Google Scholar] [CrossRef]
  30. Wang, J.H.; Shahidehpour, M.; Li, Z.Y. Security-constrained unit commitment with volatile wind power generation. IEEE Trans. Power Syst. 2008, 23, 1319–1327. [Google Scholar] [CrossRef]
  31. Growe-Kuska, N.; Heitsch, H.; Romisch, W. Scenario reduction and scenario tree construction for power management problems. In Proceedings of the IEEE Power Tech Conference, Bologna, Italy, 23–26 June 2003. [Google Scholar]
  32. Lofberg, J. YALMIP: A toolbox for modeling and optimization in Matlab. In Proceedings of the IEEE International Symposium on Computer Aided Control Systems Design, New Orleans, LA, USA, 2–4 September 2004. [Google Scholar]
  33. Liu, Y. Characteristics of wind power and impact on mid-and long-term development of Guangdong power system. Guangdong Electr. Power 2010, 23, 41–46. [Google Scholar]
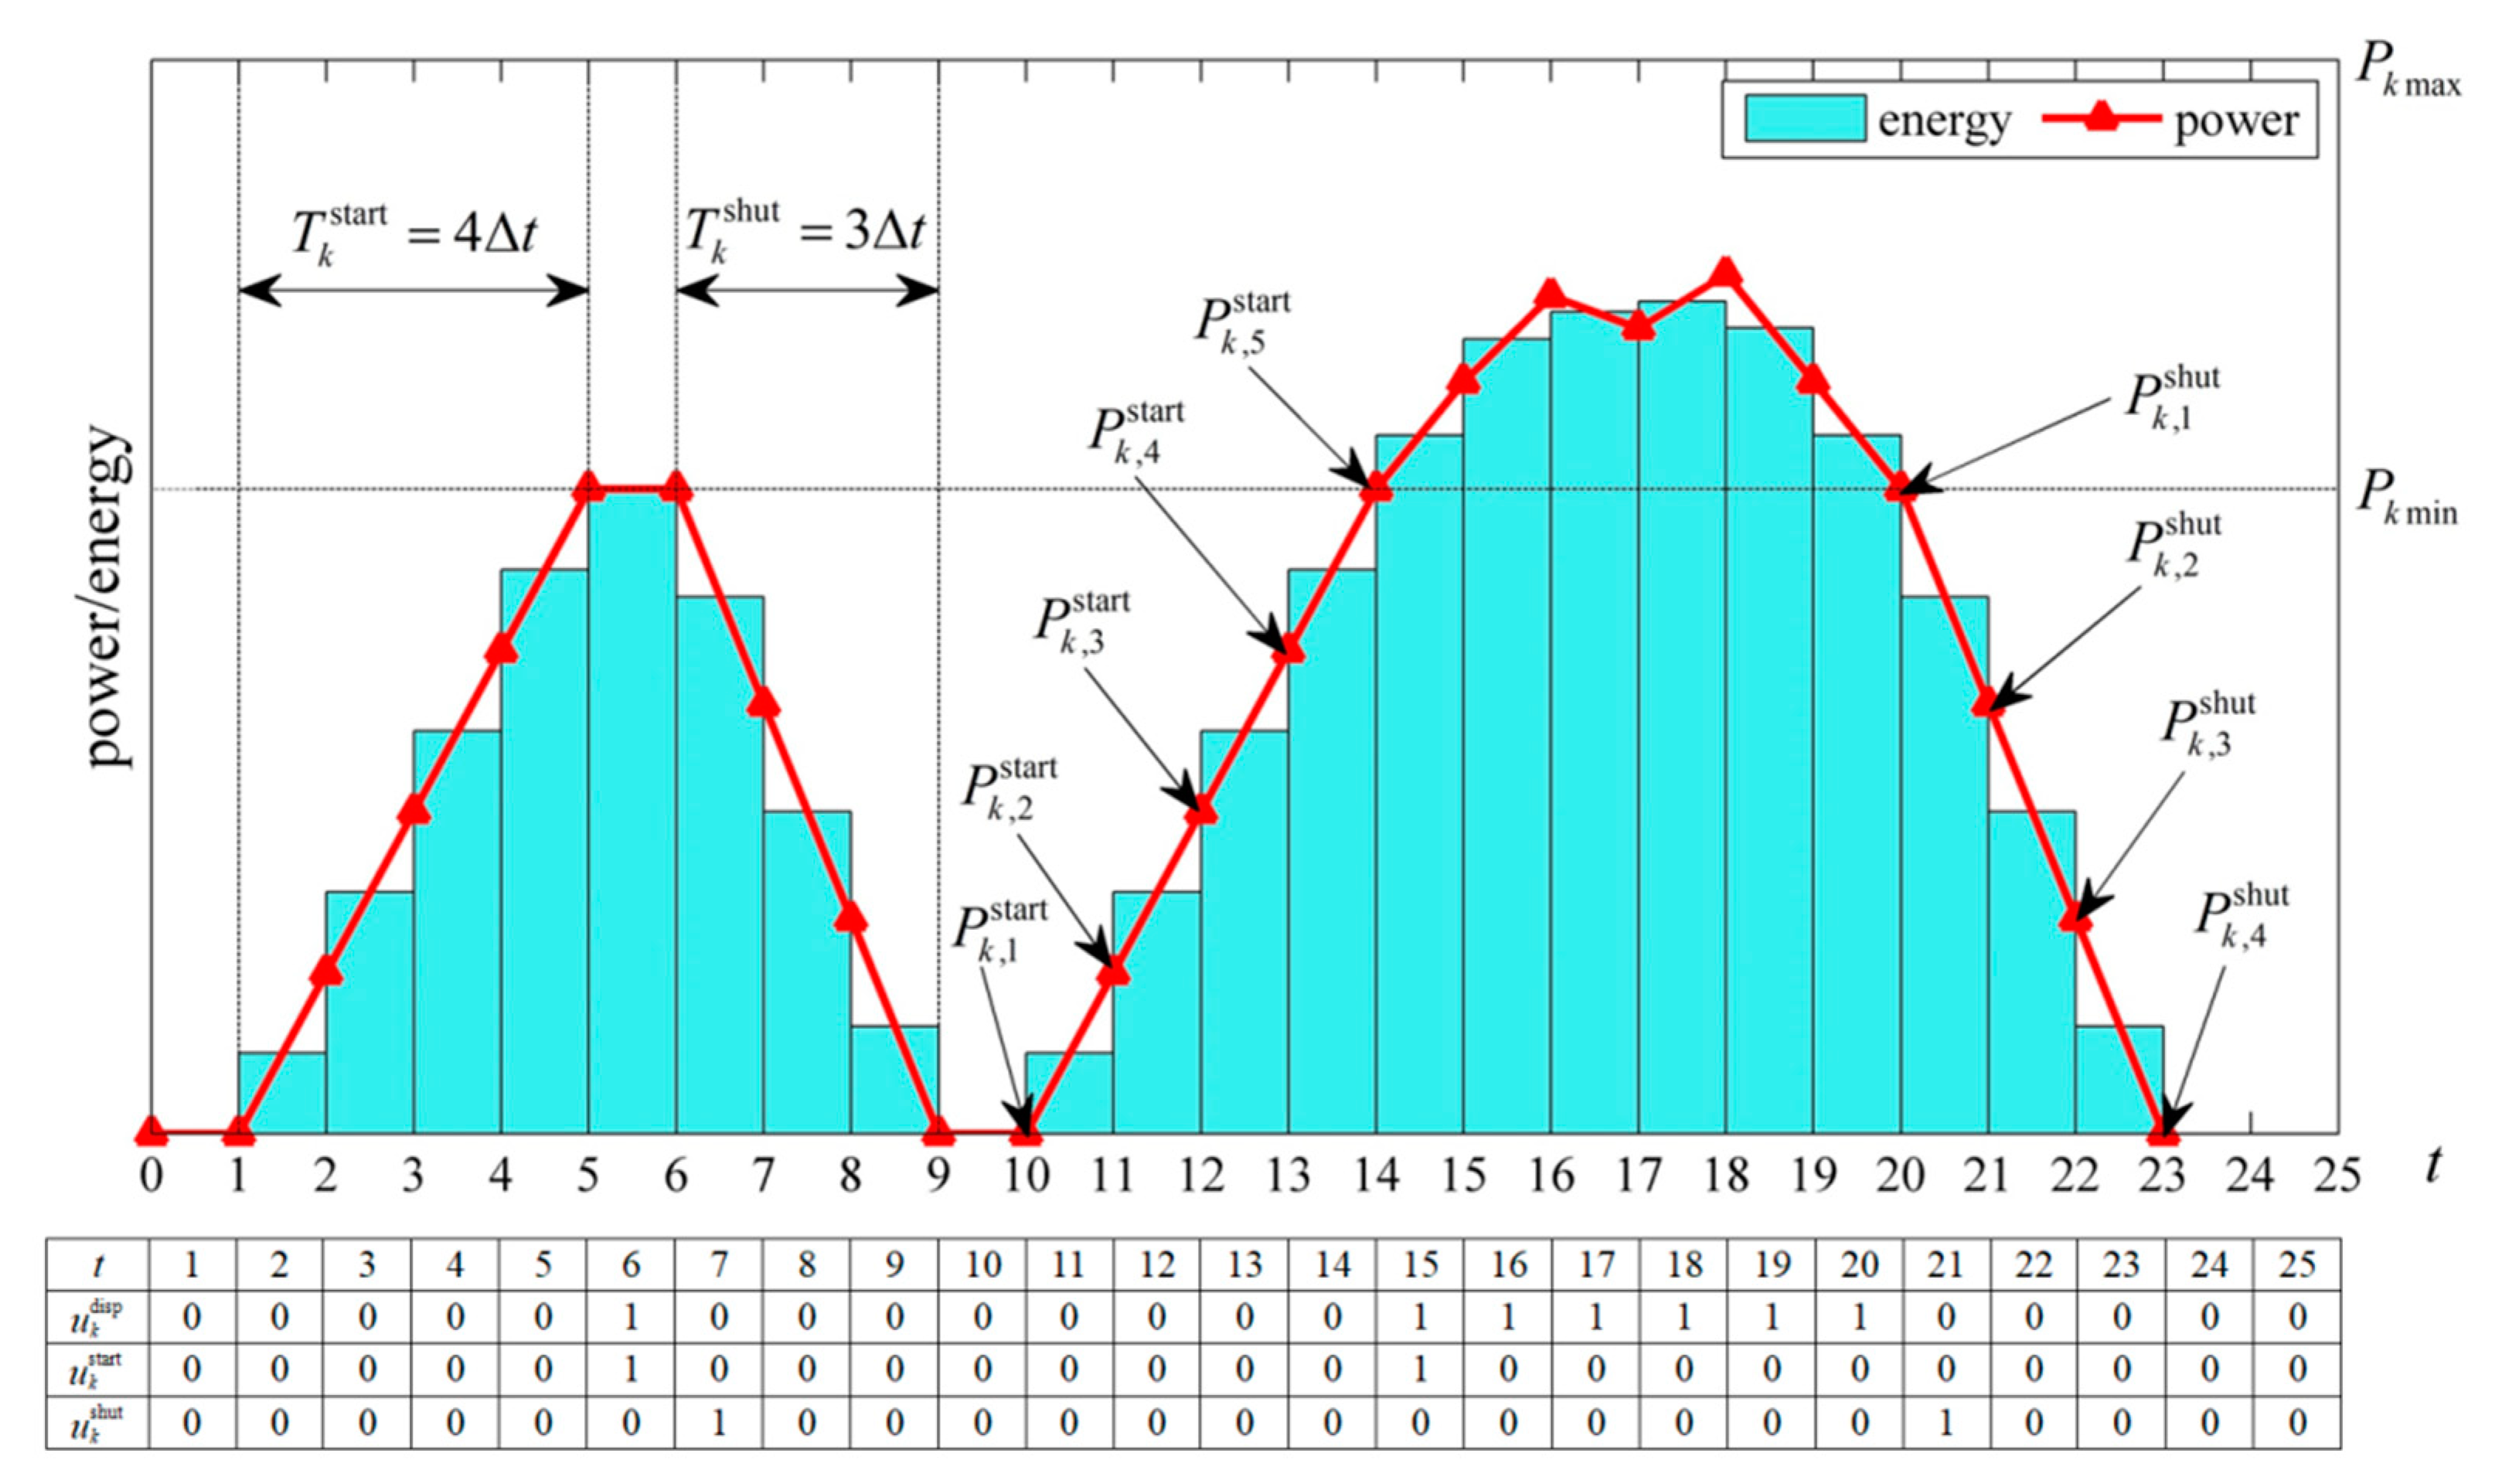
Figure 1. Illustration of state variables, start-up and shut-down trajectories.
Energies 12 03133 g001
Figure 2. Forecasted total load demand, intermittent renewable energy sources (IRES) output and net load.
Energies 12 03133 g002
Figure 3. Forecasted and actual net load in a typical scenario.
Energies 12 03133 g003
Figure 4. Actual demand and supply of flexible ramping products (FRP).
Energies 12 03133 g004
Figure 5. System operational flexibility under different confidence level.
Energies 12 03133 g005
Figure 6. Total operation cost under different confidence level.
Energies 12 03133 g006
Figure 7. Typical daily load demand and power output from a wind farm in Guangdong.
Energies 12 03133 g007
Table 1. Parameters of generating units.
Unit kBusPmax (MW)Pmin (MW)g0 (MW)Rup/Rdn (MW/5 min)TstartTshutbt ($/MWh) γ t u p / γ t d n ($/MW)Cstart ($)Cshut ($)Cfixed ($)
G11100501002--500.4167--0
G22601808321000.833330002500
G33100401003--600.5--0
G468030805--800.6667--0
G586025255--900.75--0
IRES14100035---0---0
Table 2. Parameters of loads.
User Group mBusd0 (MW)am (%)Willingness-to-Pay ($/MWh)
1228.798.86140
23124.9638.45142
34 *58.5113.39144
4510.083.10146
5614.864.57148
6939.1312.04150
71011.943.67152
8114.641.43154
9128.092.49156
101319.235.92158
111419.776.08160
* With IL connected.
Table 3. Simulation results with and without flexible ramping products (FRP).
without FRPFixed FRP Demand
( F t u p / F t d n = 10)
Varied FRP Demand
(50% Confidence Interval)
Risk-Limiting
(β = 0.8, Rac = 1500)
Risk-Limiting
(β = 0.9, Rac = 1500)
Duration of G2 being dispatchable (Δt)00302
Energy provided by G2 (MWh)004.753103.3530
Total operation cost ($)19,682.9019,832.9522,765.4219,892.3022,920.93
Social surplus ($)29,164.6929,014.0026,101.6728,986.5325,957.90
Probability of IRESs curtailment
(counted in periods)
0.04040.03510.00080.01970.0078
Probability of IRESs curtailment
(counted in scenarios)
0.42800.37740.00970.23660.0938
Quantity of curtailed IRES (MWh)0.12490.09990.00050.04870.0137
Probability of load shedding
(counted in periods)
0.09590.08940.02790.00000.0000
Probability of load shedding
(counted in scenarios)
0.96280.88420.29030.00000.0000
Quantity of shed load (MWh)0.22320.22770.08390.00000.0000
Table 4. Power outputs of generating units and IL on the condition of accurate predictions with no FRPs.
t123456789101112
G1 (MW)10010010010010010010010010098100100
G2 (MW)000000000000
G3 (MW)100100100100100100100100979497100
G4 (MW)757075807974696459545358
G5 (MW)252528333833302725252527
IL (MW)51011151514118521515
Table 5. Actual power outputs of generating units and interruptible load (IL) where β = 0.9 and Rac = 1500.
t123456789101112
G1 (MW)100.0098.00100.00100.00100.00100.00100.00100.00100.0098.00100.00100.00
G2 (MW)0.000.009.0018.0026.0018.0012.006.000.000.000.000.00
G3 (MW)100.0097.00100.00100.00100.00100.00100.00100.00100.0097.00100.00100.00
G4 (MW)75.0075.0075.0070.0065.0060.0055.5953.5948.5945.5950.5955.59
G5 (MW)30.0035.0030.0030.0030.0030.0030.0030.0029.0025.0028.8329.41
IL (MW)0.000.000.0012.0015.0013.0012.419.416.413.4110.5915.00
Table 6. Simulation results with and without FRP.
without FRPRisk-Limiting (β = 0.9, Rac = 5000)Risk-Limiting (β = 0.9, Rac = 104)Risk-Limiting (β = 0.9, Rac = 5 × 10⁴)
Total operation cost ($)23.60 × 10623.88 × 10623.88 × 10623.87 × 106
Social surplus ($)48.20 × 10647.82 × 10647.82 × 10647.92 × 106
Probability of IRESs curtailment
(counted in periods)
0.07290.04170.05210.0521
Quantity of curtailed IRES (MWh)194.51125.30139.02161.60
Probability of load shedding
(counted in periods)
0.0104000
Quantity of shed load (MWh)10.70000