Article

Optimal Dispatch of Integrated Energy System Considering Energy Hub Technology and Multi-Agent Interest Balance

1
College of Electrical and Information Engineering, Hunan University, Changsha 410082, China
2
State Grid Yongzhou Power Supply Company, Yongzhou 425000, China
*
Author to whom correspondence should be addressed.
Energies 2019, 12(16), 3112; https://doi.org/10.3390/en12163112
Submission received: 17 July 2019 / Revised: 9 August 2019 / Accepted: 12 August 2019 / Published: 13 August 2019
(This article belongs to the Special Issue Advanced Techniques for Electronic Power and Energy Systems)

Abstract

:
With the gradual liberalization of the energy market, the future integrated energy system will be composed of multiple agents. Therefore, this paper proposes an optimization dispatch method considering energy hub technology and multi-agent interest balance in an integrated energy system. Firstly, an integrated energy system, including equipment for cogeneration, renewable energy, and electric vehicles, is established. Secondly, energy hub technologies, such as demand response, electricity storage, and thermal storage, are comprehensively considered, and the integrated energy system is divided into three agents: Integrated energy service providers, renewable energy owners, and users, respectively. Then, with the goal of balancing the interests of each agent, the model is solved by the non-dominated sorting genetic algorithm-III (NSGA-III) to obtain the Pareto frontier. Since the Pareto frontier is a series of values, the optimal solution of each agent in the Pareto frontier is found by the technical for order preference with a similar to ideal solution (TOPSIS). Ultimately, taking an integrated energy demonstration park in China as a case study, the function of energy hub technology is analyzed by simulation, and the proposed method is verified to be effective and practicable.

1. Introduction

In a contemporary world, which is undergoing drastic development of the energy internet and an increasing connection of energy sources, such as electricity, heat, and cooling, clean and efficient use of energy has gradually become the focus of attention [1]. How to develop energy in ecofriendly way and accelerate the energy transition and improve energy utilization is an urgent problem to be solved. Comprehensive utilization of cooling, heat, electricity, and gas provide new ideas for energy development, and the development of Internet of Things and wide-area communication technology provide convenience for energy integration, coordination planning, and energy supply optimization [2,3]. Based on the combined cooling heating and power (CCHP), the integrated energy system (IES) can improve the utilization efficiency of integrated energy and reduce environmental pollution through the cascade utilization of energy [4].
Research on integrated energy systems is actively carried out, with an emphasis on the optimization dispatch and system planning of integrated energy systems [5,6,7,8]. The authors of [5] proposed an integrated electrical and natural gas system, including wind turbines, cogeneration, and gas supply equipment. With the goal of minimizing operation costs, an optimal dispatch strategy was established; the authors of [6], aiming at solving the problem of the large-scale wind curtailment and poor dispatch economy, established a day-ahead economic dispatch model for a regional power-heat integrated energy system. The proposed model and algorithm analyze the action of each unit in economic dispatch and wind-power accommodation effectively, verifying its efficiency and applicability; in [7], the two-stage optimization algorithm was used to optimize the park-level integrated energy system. The upper layer is aimed at the minimum total annual cost, annual pollution emission, and annual energy consumption, and the lower layer is aimed at the lowest operation and maintenance cost, which can effectively increase the overall benefit of the system. The authors of [8] established an integrated energy model for multi-energy complementary and coordinated development, proposed a distribution network planning strategy based on integrated energy system optimization, and looked to the future of integrated energy systems across regions.
The ETH Zurich Institute first proposed the concept of an energy hub (EH) in the “Future Energy Network Vision” project in 2007 [9]. An energy hub is defined as an input-output port model that describes the exchange and coupling relationships between energy, load, and networks in a multi-energy system. The coupling matrix plays an important role in the planning and operation of multi-energy systems as it can briefly represent the various coupling relationships, such as transformation, storage, and transmission between electric, heat, and cooling [10,11]. As demand response technology plays an important role in promoting operational efficiency of the power system, the optimization dispatch model of integrated energy considering demand response technology is a continuous improvement [12,13]. Based the decentralized load-side demand response structure, some scholars proposed integrated demand response technology, which can improve the utilization of various equipment in the energy hub [14].
Though the above references have made some progress in the study of IESs, there are several factors that have not been considered: (a) In fact, since the devices in the IES are not owned by the same agent, each agent will not sacrifice their own benefits for the sake of the global optimum. It is important to construct a multi-agent model of integrated energy and establish a trading mechanism between the various agents for integrated energy development; (b) in an integrated energy system, there is lots of waste energy, such as residual heating and cooling. If they were recycled, it would further reduce the operation cost of the system. (c) Although the energy hub technology has been mentioned, a few references took this technology into consideration in integrated energy system dispatch and planning research.
In summary, according to the attributes and functions of the devices, this paper divides the IES into three main agents: The integrated energy service provider (IESP), renewable energy owner (REO), and users, respectively; secondly, the mathematical model of energy hub technologies, like integrated demand response, electricity storage, and thermal storage, are established, and the electric vehicle response model is introduced. From the perspective of balancing the multi-agent’s interest, the multi-agent’s optimization dispatch model is proposed, and solved by the NSGA-III, which can get the pareto optimal frontier. Furthermore, since the Pareto frontier is a series of values, the optimal solution of each agent in the Pareto frontier is found by the TOPSIS. Through the simulation, the load curve and the economic benefits of each agent are obtained under different scenarios, and the equipment output considering various technologies of the energy hub is analyzed in detail to illustrate the validity and practicability of the model.
The remaining sections of this paper are as follows: Section 2 describes the integrated energy hub technology. The integrated energy multi-agent model of IES is constructed in Section 3. Section 4 introduces the model solution. A case study and results analysis are given in Section 5. Finally, Section 6 draws the conclusion.

2. Integrated Energy Hub Technology

2.1. Integrated Energy System

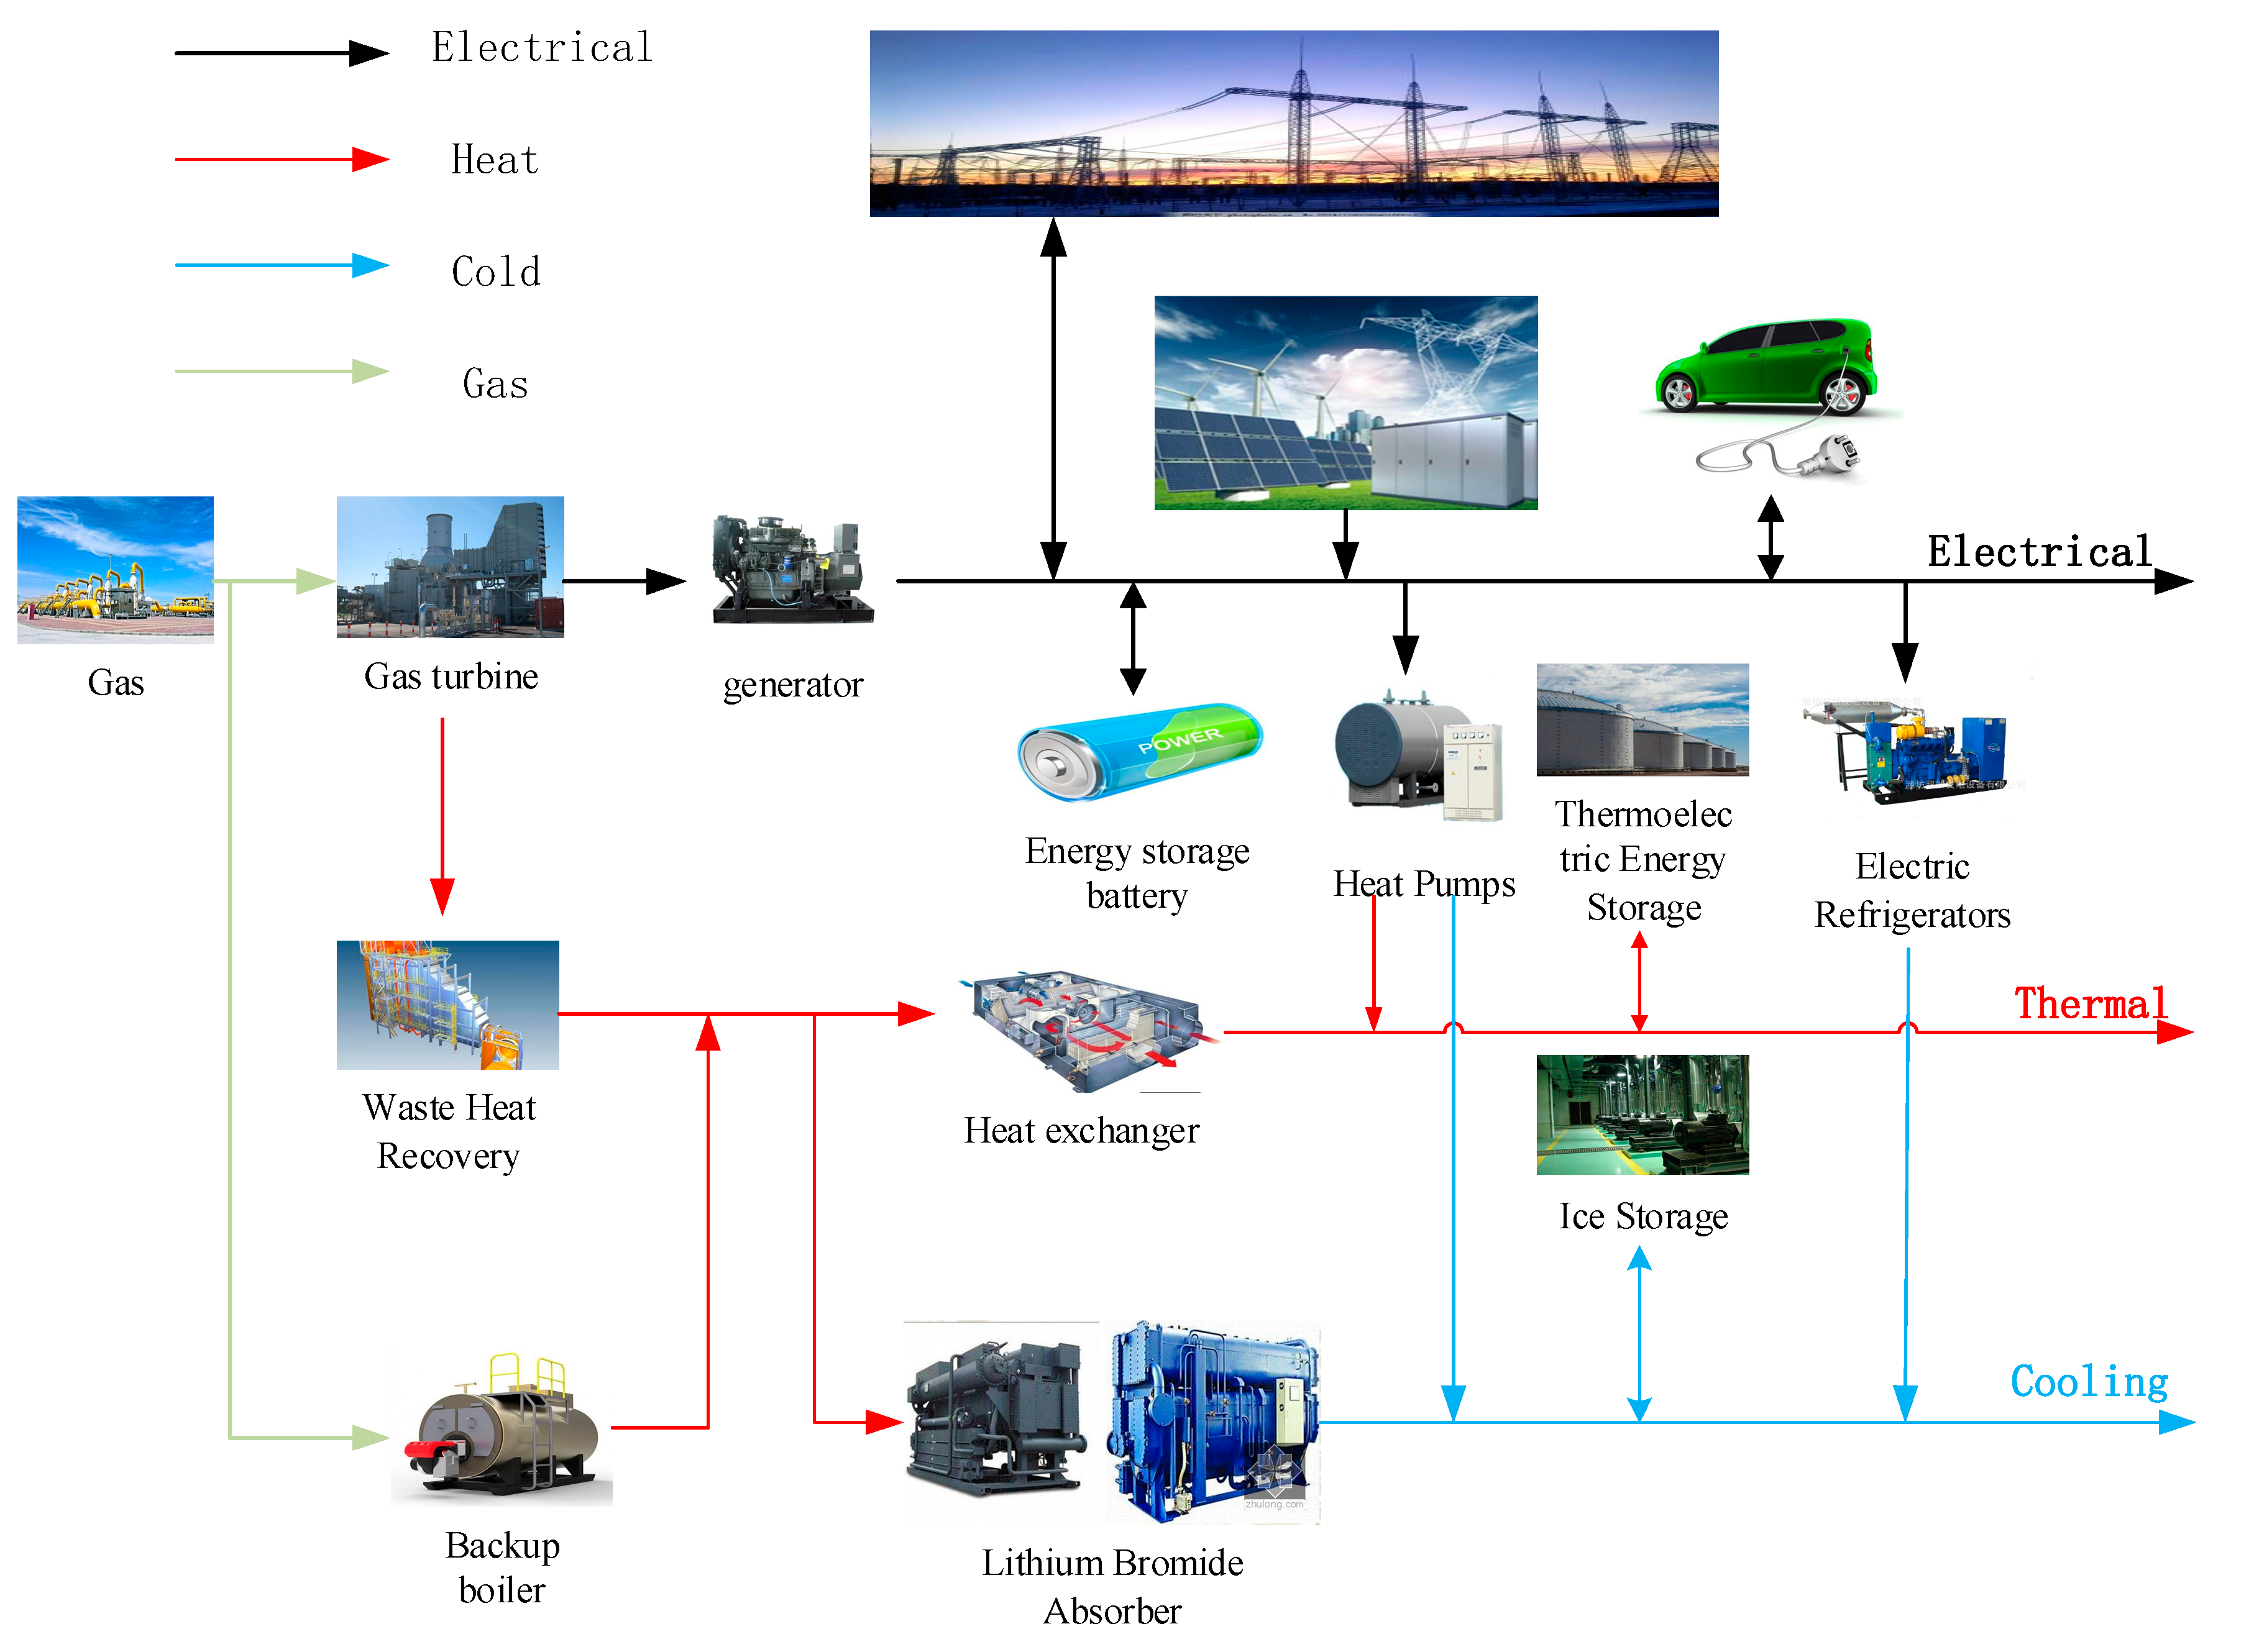
The physical model of the integrated energy system is shown in Figure 1. The system includes energy supply devices, such as cogeneration units, renewable energy, heat pumps, lithium bromide absorption unit, and so on, as well as other equipment that can exchange energy with the system, like thermoelectric energy storage, electric vehicles, ice storage, etc.
As shown in Figure 1, the IESP contains the transmission and conversion equipment of the multi-energy system but is not flexible during the dispatch process [15,16]. With the popularization of the integrated demand response (IDR), energy storage system, and thermal storage system, energy hub technology will make IES’s dispatch more flexible while reducing the operation costs of the system [17].

2.2. Integrated Demand Response

In the power system, the definition of the demand response is that the users adjust their electricity demand according to the time-sharing electricity price. The users can change the power consumption behavior by responding to the incentive from the power grid to reduce the electricity consumption cost and achieve the goal of load shifting [18,19].
In the IES, the diversification of supply methods on the energy supply side makes it possible to convert between energies. On the energy consumption side, users can also choose different energy sources to meet the same energy demand; the energy complementarity of both sides of supply and demand increases the flexibility of the integrated energy system. The users can adjust the energy consumption mode according to the real-time price, which reduces the energy consumption cost and has better acceptability so as to ensure users’ comfort. The integrated demand response model is shown in Equation (1):
[ Δ L 1 Δ L 2 : Δ L j ] = [ d 11 d 12 d 1 i d 21 d 22 d 2 i : : : : d j 1 d j 2 d j i ] [ H 1 H 2 : H i ] ,
where Hi represents the demand response of i-type energy, ΔLj represents the supply of j-type energy, and dji is the demand response coupling factor, indicating the impact of the i-type energy demand response on the j-type energy supply.

2.3. Energy Storage Technology

The utilization of renewable energy is easily affected by external factors; the energy output and load demand cannot be matched, which tends to cause energy shortage at peak and waste at valley [20,21,22]. With the development of energy storage technology, energy can be transferred in a time series through the charge and discharge strategy of energy storage. The dynamic model of the electricity storage system is shown in Equation (2):
{ E es ( t + 1 ) = E es ( t ) ( 1 δ e ) + P es , in η in Δ t E es ( t + 1 ) = E es ( t ) ( 1 δ e ) P es , out Δ t / η out ,
where Ees(t) is the capacity of the electricity storage device at time t; δ e is the self-discharge rate; Pes,in and Pes,out represents the charging power and discharging power, respectively; η in is the charging efficiency of the electricity storage device; η out is the discharge efficiency of the electricity storage device; and Δt is the dispatch time period.
The dynamic model of the thermal storage system is shown in Equation (3):
{ H es ( t + 1 ) = H es ( t ) ( 1 k loss ) + Q es , in k in Δ t H es ( t + 1 ) = H es ( t ) ( 1 k loss ) Q es , out Δ t / k out ,
where Hes(t) is the capacity of the thermal storage device at time t, kloss is the thermal loss rate; Qes,in and Qes,out represents the absorption thermal and released thermal, respectively; kin is the thermal absorption efficiency of the thermal storage device; and kout is the thermal release efficiency of the thermal storage device.

3. Integrated Energy Multi-Agent Model

Based on the actual situation, this paper divides the integrated energy system into the following three main agents: Users, IESP, and REO.

3.1. Users

Both the cooling/thermal load and electricity load of users can participate in the demand response. Thus, according to the time-sharing price of the IESP and the grid, users can adjust their energy consumption behavior to reduce energy costs as much as possible. Therefore, the user’s objective function is:
f Users = min t = 1 N T [ C E ( t ) + C H ( t ) + C C ( t ) + C EV ( t ) ] ,
where NT is the amount of daily dispatch periods; and CE(t), CH(t), and CC(t) represents the users’ electricity, thermal, and cooling cost, respectively. Under the background of demand response, based on the elastic coefficient method [23], the calculation formula is:
C i = m = 1 N T ( Δ L m i + L m i ) ( Δ Q m i + Q m i ) = m = 1 N Q m i L m i ( 1 + k i ) + m = 1 N n = 1 N Q m i ε m n i k i δ i ( 1 + k i ) L m i ,
where δ i  is the ratio of elastic load; Δ L m i is the i-type energy change after the demand response at time m, L m i is the total load before the demand response; Δ Q m i is the price change of i-type energy; Q m i is the initial price; the ratio of Δ Q m i / Q m i is recorded as ki, which is the change rate of electricity price; and ε m n i is the elasticity coefficient, which reflects the adjustment of the users’ load according to the price change. When m = n, ε m n i is called the self-elastic coefficient, otherwise it is called the mutual elasticity coefficient, which is defined as:
ε m n i = Δ L m i δ i L m i / Δ V m i V m i .
In Equation (4), CEV(t) is the energy cost of the electric vehicle owners (EVOs). Since the electric vehicles can not only need be charged from the IESP or the grid but also can be discharged to them, the EVO can determine whether to participate in the dispatch according to the habits of car-using and the charging or discharging prices in each period. According to [24], the response characteristic of electric vehicles is shown as Equation (7):
α = 1699 . 6 Δ p 5 + 1756.3 Δ p 4 696.53 Δ p 3 + 124.44 Δ p 2 5.358 Δ p + 0.0624 ,
where Δp is the difference between the feed-in tariff of electric vehicles and the electricity price of IESP and α is the probability of EVO’s response dispatch.
The purpose of electric vehicles participating in the dispatch is to minimize the cost and they adjust their dispatch strategy according to the charging and discharging tariff of electric vehicles, which is formulated by IESP. However, due to the randomness of EVOs in the dispatch process, it does not always satisfy the response characteristics. In order to express the randomness of EVOs, the introduction of the random variable, r, is proposed. For a given Δp, the probability of an EVO’s response dispatch is α . If r is greater than α , then the EVO participates in dispatch, otherwise it is not involved in dispatch. Therefore, the objective function of the EVO can be expressed as:
C EV ( t ) = { c ev , c ( t ) P ev , c ( t ) ( r α ) when   EV   charging c ev , d ( t ) P ev , d ( t ) ( r α ) when   EV   discharging ,
where cev,c(t) and cev,d(t) represent the charging and discharging electricity price of electric vehicles in the IES at time t, respectively; Pev,c(t) and Pev,d(t) represent the charging and discharging power of electric vehicles at time t, respectively. Meanwhile, Pev,c(tPev,d(t) = 0 means that the electric vehicle cannot be charged and discharged at the same time, and is an upward rounding function.

3.2. Integrated Energy Service Providers

With cogeneration units, boilers, electric refrigerators, lithium bromide absorber, and other energy supply equipment, IESP is responsible for providing users with heat, cooling, and electricity, and is able to purchase electricity from REO and power grids. Meanwhile, electric vehicles can also interact with its electricity. According to the situation of energy balance, the time-sharing price of REO selling to IESP should be negotiated with the REO agent, and the IESP will also, in consultation with the users, determine the time-sharing price of the energy consumption and the charge/discharge price of each time of the electric vehicle. Therefore, the dispatch goal of the IESP is to maximize the total operating income, and the objective function can be expressed as:
f IESP = max t = 1 N T { R E ( t ) + R H ( t ) + R C ( t ) + R EV ( t ) [ c b ( t ) P pe ( t ) + c R 2 I ( t ) P pvM ( t ) + C fuel ( t ) + C st ( t ) + C EP ( t ) + C OM IESP ( t ) + C HS ( t ) + C es IESP ( t ) ] }
where RE(t), RH(t), and RC(t) represent the income of selling electricity, heat, and cooling, respectively; that is, the users’ energy consumption cost, which can be obtained by Equation (5); REV(t) represents the interaction income with EVO, which can be obtained by Equation (8); cb(t) represents the time-sharing price of the grid; Ppe(t) is the power purchased by IESP from the grid at time t; cR2I(t) is the renewable energy feed-in tariff setting by IESP at time t; PpvM(t) is the power purchased by IESP from REO at time t; Cfuel(t) is the gas cost of IESP at time t; Cst(t) is the device start-stop cost at time t; CEP(t) is the environment pollution cost at time t; C OM IESP ( t ) is the device’s operation and maintenance cost in IESP at time t; CHS(t) is the thermal storage device loss cost at time t; and C es IESP ( t ) is the power storage cost at time t, including the battery life loss cost and transmission loss cost [25,26].

3.3. Renewable Energy Owners

REO has power generation equipment of renewable energy and its supporting energy storage equipment. There are three ways to consume energy: Sell electricity to the power grid, sell electricity to the IESP, and storage, respectively. With the goal of maximizing the benefits, the REO can determine the energy output strategy based on the renewable energy feed-in tariff set by IESP and the electricity price sold by the REO to the power grid. Therefore, the objective function is:
f REO = max t = 1 N T [ c R 2 I ( t ) P pvM ( t ) + c out ( t ) P pvI ( t ) C OM REO ( t ) C es REO ( t ) ] ,
where cout(t) is the electricity sale price of REO to the grid at time t; PpvI(t) is the transmission power of REO to the grid at time t; C OM REO ( t ) is the equipment’s operation and maintenance cost in REO at time t; and C es REO ( t ) is the power storage loss costs in REO at time t, including the battery life loss cost and transmission loss cost.

3.4. Constraints

3.4.1. Balance Constraints

(1) Power balance constraint:
P chp ( t ) + P pe ( t ) + P pvM ( t ) + P es _ IESP ( t ) P EB ( t ) P EC ( t ) = P L ( t ) + P ev ( t ) ,
where Pchp(t) is the power supplied by cogeneration equipment at time t; Pes_IESP(t) is the charge or discharge power of the energy storage at time t, which is positive for discharge and negative for charging; PEB(t) is the power consumed by the electric boiler at time t; PEC(t) is the power consumed by the electric refrigerator at time t; and PL(t) is the electrical load at time t.
(2) Thermal power balance constraint:
Q chp ( t ) + Q EB ( t ) + Q es ( t ) Q HC ( t ) = Q L ( t ) ,
where Qchp(t) is the heating power of the cogeneration at time t; QEB(t) is the heating power of the electric boiler at time t; QHC(t) is the heating power consumed by the waste heat refrigeration equipment at time t; and QL(t) is the thermal load at time t.
(3) Refrigerating power balance constraint:
C EC ( t ) + C es ( t ) + C HC ( t ) = C L ( t ) ,
where CEC(t) is the refrigerating capacity of the electric refrigerators at time t; Ces(t) is the reserving and releasing cooling power of the cooling energy storage system at time t; CHC(t) is the refrigerating capacity provided by the waste heat refrigeration equipment at time t; and CL(t) is the cooling load of the IES at time t.

3.4.2. Energy Price Constraints

(1) Price constraint of REO sells electricity to IESP:
c R 2 I , min ( t ) c R 2 I ( t ) c R 2 I , max ( t ) ,
where cR2I,min(t) and cR2I,max(t) represent the minimum and maximum of the renewable energy feed-in tariff at time t, respectively.
(2) Price constraint of EV charging or discharging:
c ev , min ( t ) c ev ( t ) c ev , max ( t ) ,
where cev,min(t) and cev,max(t) represent the minimum and maximum of the charging and discharging price of electric vehicle at time t, respectively.
(3) Price constraints of IESP sells electricity to users:
c min e ( t ) c e ( t ) c max e ( t ) ,
1 N T t = 1 N T c t ( t ) 1 N T t = 1 N T c pe ( t ) ,
where c e ( t ) represents the price of electricity sold by the IESP to the users at time t; c min e ( t ) and c max e ( t ) represent the minimum and maximum of the electricity price sold by the IESP to the users at time t, respectively. Equation (17) indicates that the average energy price in the park is not higher than the price from the power grid to ensure users’ interests.
(4) Thermal Price Constraint
Due to the substitutability between the energy sources in the integrated energy system, the IESP’s thermal selling price needs to refer to the electricity price, which can be described as:
c h ( t ) = β c e ( t ) ,
where ch(t) is the thermal selling price at time t, β is the thermoelectric price ratio, and its constraint is:
β min β β max ,
where βmin and βmax represent the maximum and minimum of the thermoelectric price ratio, respectively.

3.4.3. EV Charging and Discharging Constraints

0 P ev , c v ev , c p ev , c , rate ,
0 P ev , d v ev , d p ev , d , rate ,
S min S ( t ) S max ,
where vev,c, vev,d are the 0–1 variables of whether the EV participates in charging and discharging, 1 means participation, otherwise it does not participate; Pev,c,rate and Pev,d,rate represent the EV charging and discharging rated power, respectively. Smin and Smax represent the upper and lower limits of the electric vehicle’s state of charge, respectively.
Other constraints, such as generator output constraints, generator climbing constraints, energy storage capacity constraints, and transmission power constraints, have been mentioned in many references and this paper will not introduce them again.

4. Model Solution

The dispatch model of IES considering multi-agent’s benefit balance can be described as:
{ min f IESP ( x ) min f REO ( x ) min f Users ( x ) s . t . h i ( x ) = 0 g i ( x ) 0 ,
where hi(x) and gi(x) represent the equality and inequality constraints of the model, respectively; x is the vector of decision variables of all time periods.
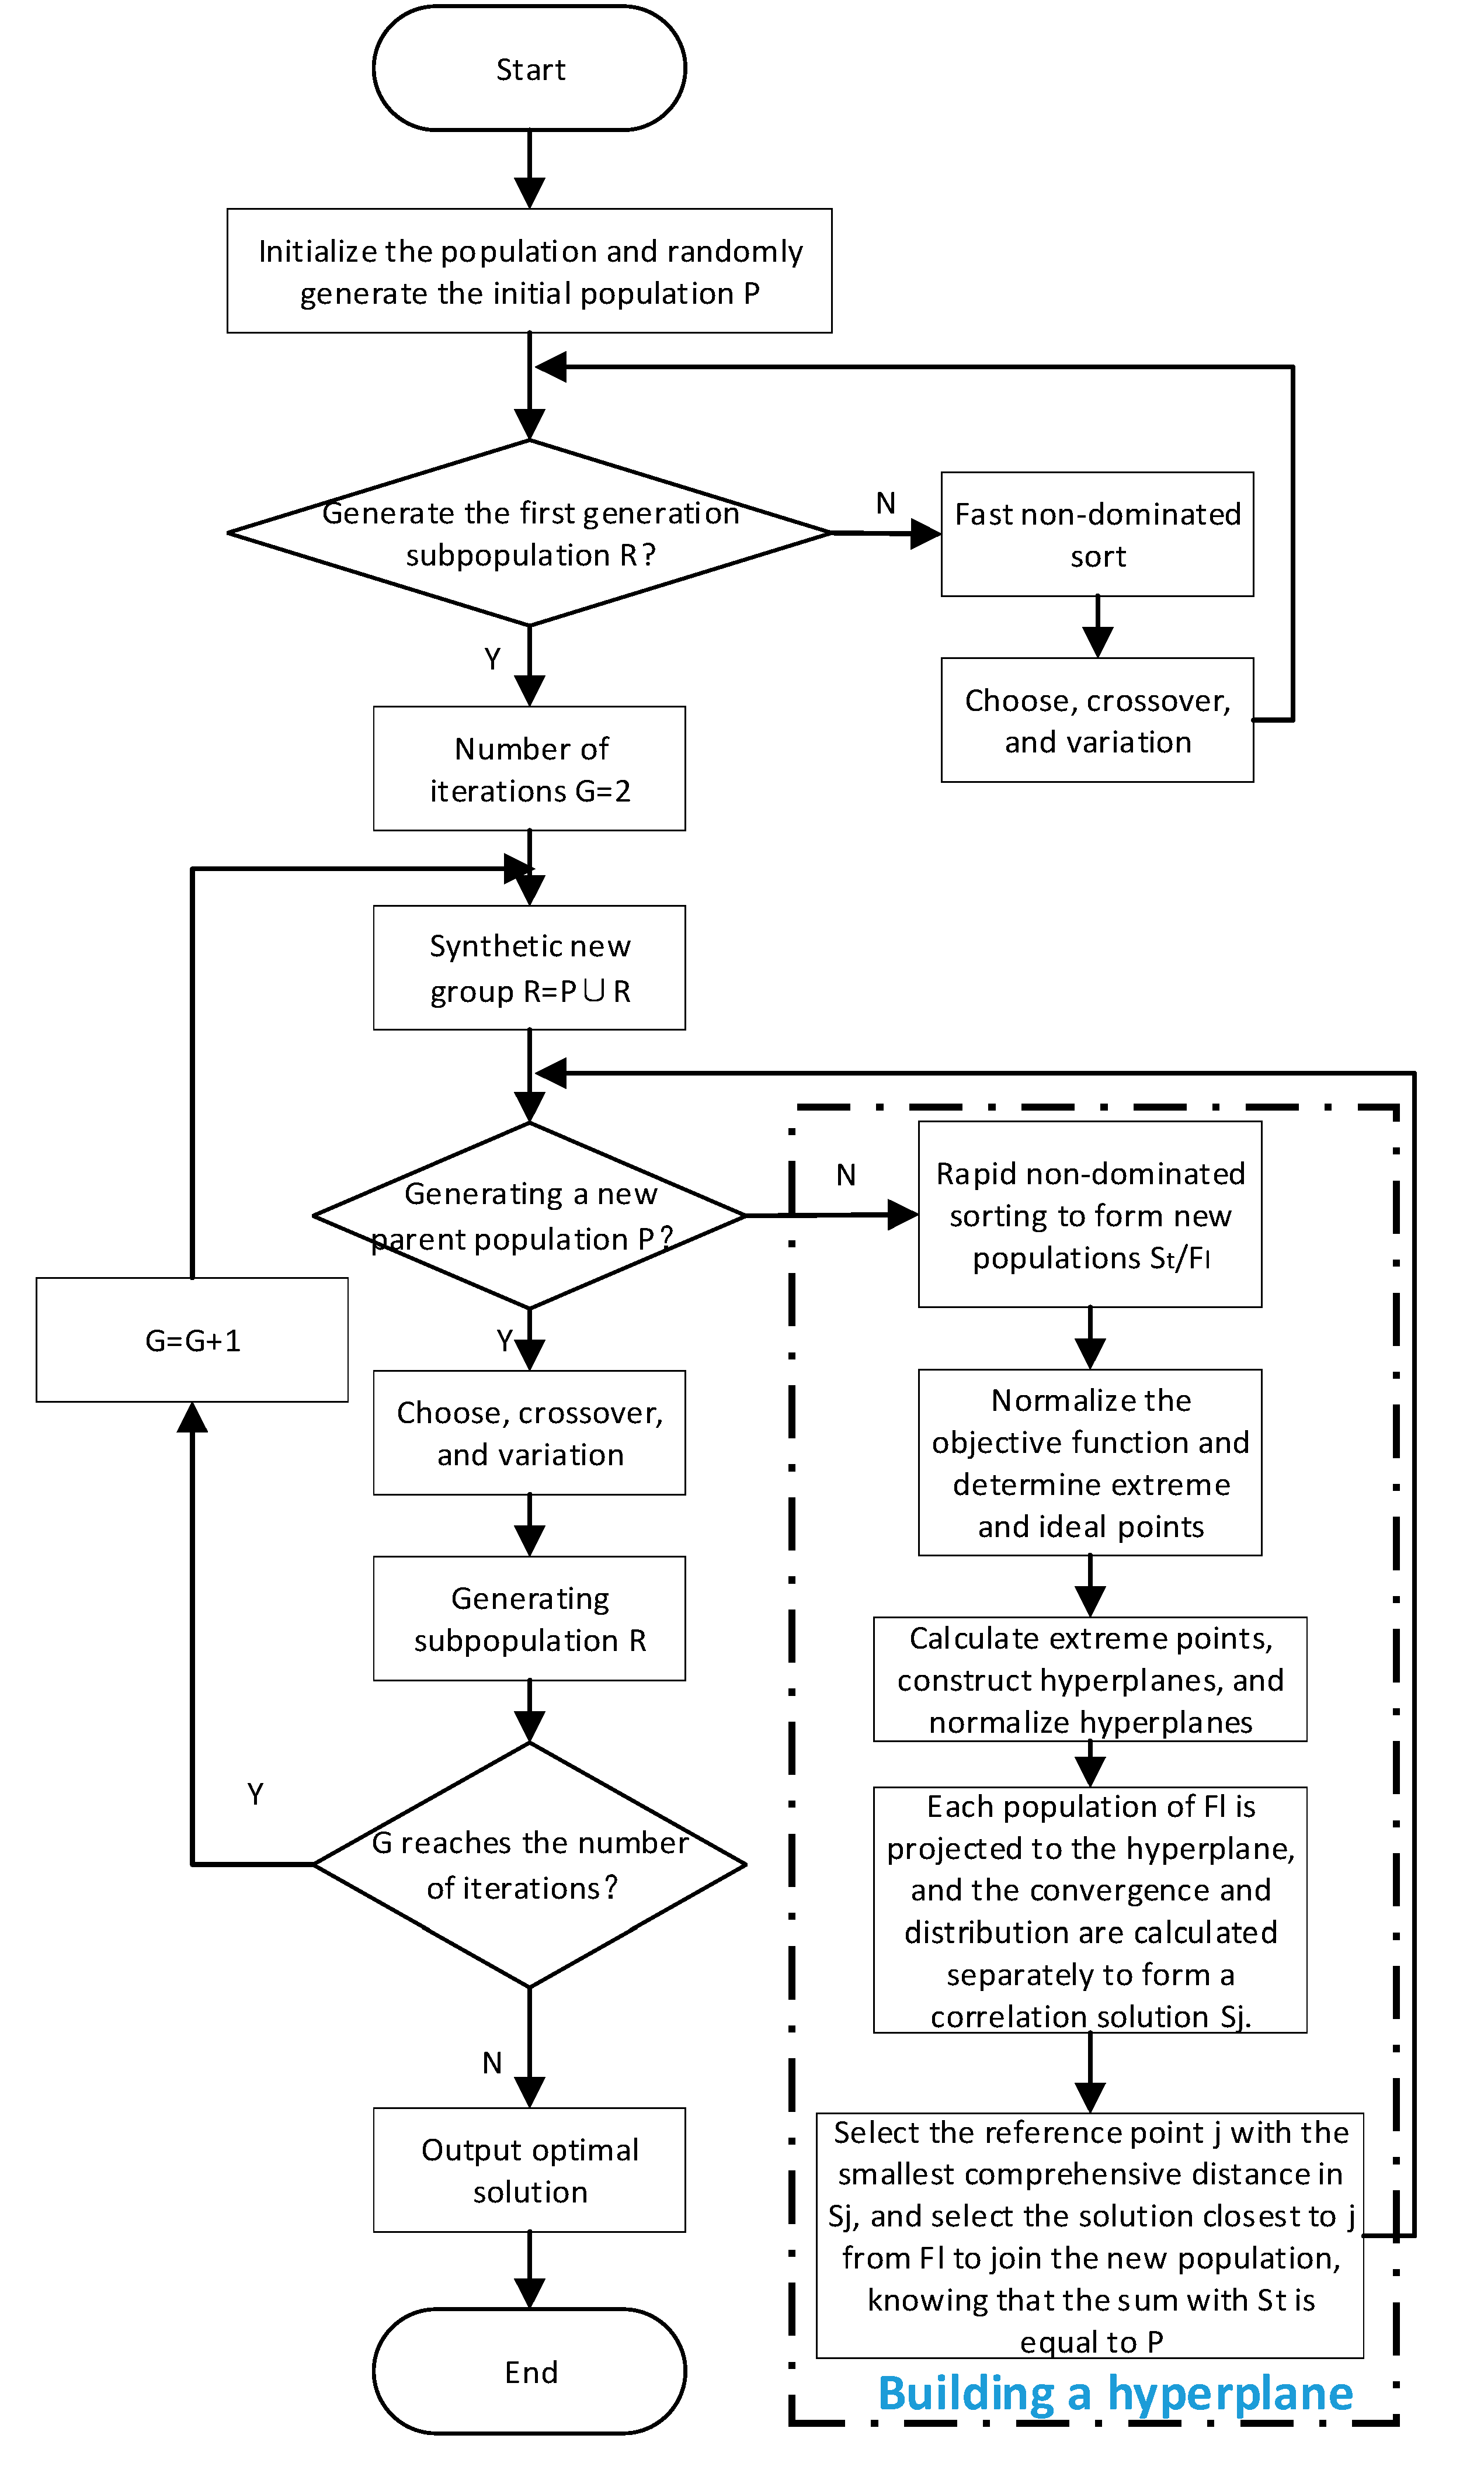
The goal of this model is to balance the interests of the three main agents: IESP, REO, and users. It is known from Equation (23) that it is a common multi-objective optimization problem. The NSGA algorithm is currently a common algorithm to solve multi-objective problems. Since the introduction of the NSGA algorithm by Deb, it has undergone three generations of reforms. At present, the NSGA-II algorithm [27,28] is widely used. The NSGA-II algorithm uses the crowding distance method and the elite strategy to sort, which can effectively ensure the diversity of the population, reduce the computational complexity, and accelerate the Pareto frontier convergence. However, when solving multi-objective problems with more than two objective functions, its computation becomes inefficient and prone to a local optimum. Compared with the previous two generations, the NSGA-III algorithm has improved the selection mechanism. Through introducing the reference point selection and normalization method [29,30], the multi-objective problem of more than two objective functions can be effectively solved. The flowchart is shown in Figure 2.
The difference between NSGA-III and NSGA-II lies in the selection mechanism of the parent population. The selection steps of NSGA-III are as follows:
Step 1: Find the minimum of all targets from the new group, R, and define it as Z i min , which is the ideal point of the objective function, and transform the objective function by Equation (24):
f i ( x ) = f i ( x ) Z i min .
Step 2: Construct a hyper plane. The general intercept formula of the hyper plane is:
f 1 a 1 + f 2 a 2 + + f M a M = 1 ,
where ai is intercept between the hyper plane and axis of each dimension, which can be obtained by the extreme point calculation method. The solution formula of extreme points is shown in Equation (26):
z i extreme = arg min { max i = 1 M f i ( x ) / w i } ,
where M is the number of objective functions, and wi is the weight coefficient. When a dimension weight coefficient is set to 1, the other dimension weight coefficients are 10−6 (infinitesimal close to 0).
Step 3: Based on the hyper plane constructed in step 2, each individual in the population, R, can be normalized to:
f i * ( x ) = f i ( x ) a i Z i min .
Step 4: The projection distance of each individual in the population, R, on the hyper plane after normalization can be expressed as:
d 1 ( u ) = ( i = 1 M f i * ( x ) 1 ) / M .
In the formula, the smaller the value of d1(u), the better the convergence of the individual, u.
Step 5: The crowded distances of each projection point are evaluated by the modified Harmonic mean distance method [31], shown in Equation (29):
d 2 ( u ) = K 1 d 1 u + 1 d 2 u + 1 d K u ,
where K is the square root of the population size, represents the distance between the individual, u, and the Kth nearest individual. The larger the value of d2(u), the better the distribution of the individual, u.
Step 6: Synthesize the convergence and distribution characteristics of the population in the hyper plane, and select the new group R by the selection formula:
D ( u ) = d 1 ( u ) λ d 2 ( u ) ,
where λ is the penalty factor used to balance the proportions of convergence and distribution, when the value of D(u) is smaller, the individual, u, is more likely to be selected into the parent population.
The steps for solving the proposed model using the NSGA-III algorithm are as follows:
Step 1: Input the raw data, including the energy supply and storage equipment parameters, in IESP, the typical daily load curve, integrated demand response parameters, and constraints. Initialize the NSGA-III algorithm parameters: Set the population size to 100, the number of iterations to 50, the crossover probability to 0.8, the probability of variation to 0.2, and Pareto optimal individual coefficient to 0.5.
Step 2: Form the initial population and encode the output of each equipment as the set {X1, X2, …, Xn}. The transaction prices between the agents are represented by XI2U, XR2I, and XR2U, respectively;
Step 3: According to the proposed NSGA-III algorithm, select, cross, and mutate the populations to form a new sub-group, and each dimension of each individual should meet the constraints in the process of selecting, crossing, and mutation.
Step 4: If the number of iterations is reached, generate a Pareto frontier; otherwise, return to step 3.
Step 5: As the Pareto frontier is a series of values, the optimal solution from the frontier of Pareto can be found using the TOPSIS method [32,33], obtaining the optimal dispatch scheme.

5. Results and Discussion

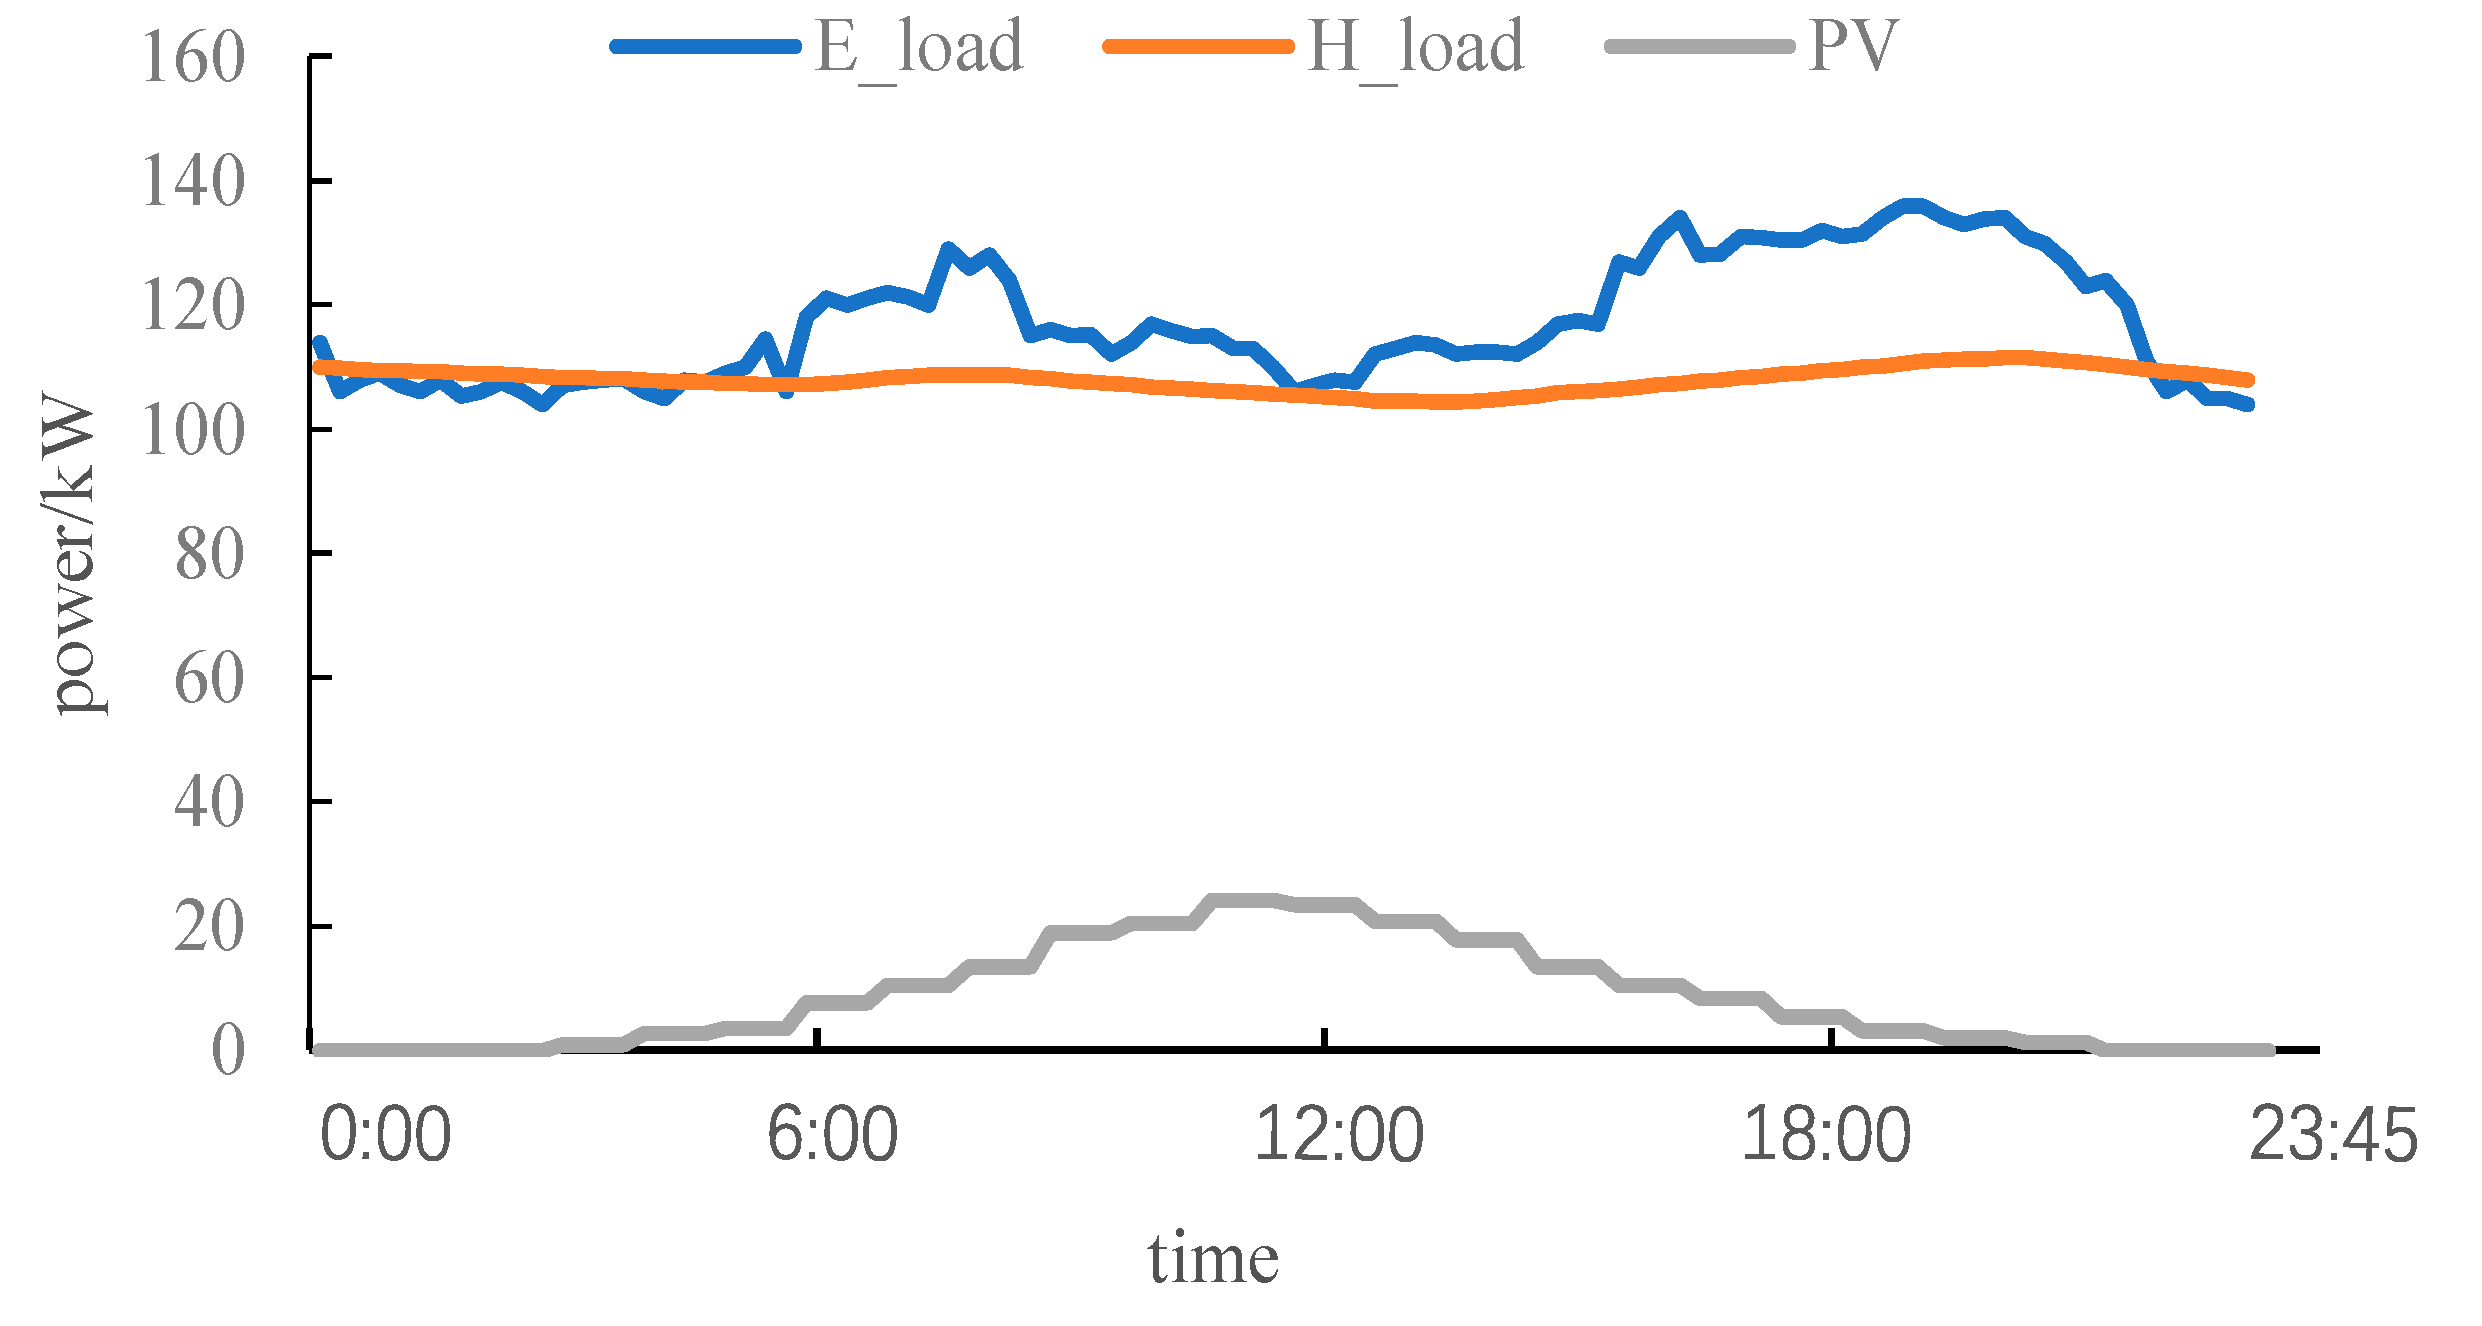
Taking an integrated energy demonstration park in China as an example, the typical daily thermoelectric load and photovoltaic output curve in the park are shown in Figure 3. The cogeneration in this park adopts the “heat-deciding power generation” mode for heating. The renewable energy is mainly based on photovoltaic (PV) and is equipped with 2 × 20 kW distributed photovoltaic units. The cooling load in the park is mainly the air-conditioning load, and this paper turns it into electrical load considerations. The price of gas in the park is 2.93 ¥/m3. The simulation divides the day into 96 time periods with the interval of 15 minutes.
The parameters of the power supply and heating equipment are shown in Table 1, where ki is the constant of unit power operation and maintenance.
Table 2 shows the electricity price purchased by the park from the grid (XG2I) and the price of PV sold to the grid (XR2G) during the peak, flat, and valley period. The peak period is 8:00–11:00, 18:00–22:00; the flat period is 11:00–18:00 and 22:00–23:00; the valley period is 00:00–8:00 and 23:00–24:00.

5.1. Comparative Analysis of Different Scenarios

To illustrate the role of energy hub technology in integrated energy dispatch, the following five scenarios are used to simulate the thermoelectrical power output of the IESP and the overall revenue of each agent:
Scenario 1: The integrated demand response taking into account in the system, both the power storage and thermal storage included in the IESP.
Scenario 2: The integrated demand response taking into account in the system, the power storage included in the IESP, without the thermal storage;
Scenario 3: The integrated demand response taking into account in the system, the thermal storage included in the IESP, without the power storage.
Scenario 4: The integrated demand response not taking into account in the system, both the power storage and thermal storage included in the IESP.
Scenario 5: The integrated demand response not taking into account in the system; neither the power storage nor thermal storage are included in the IESP.
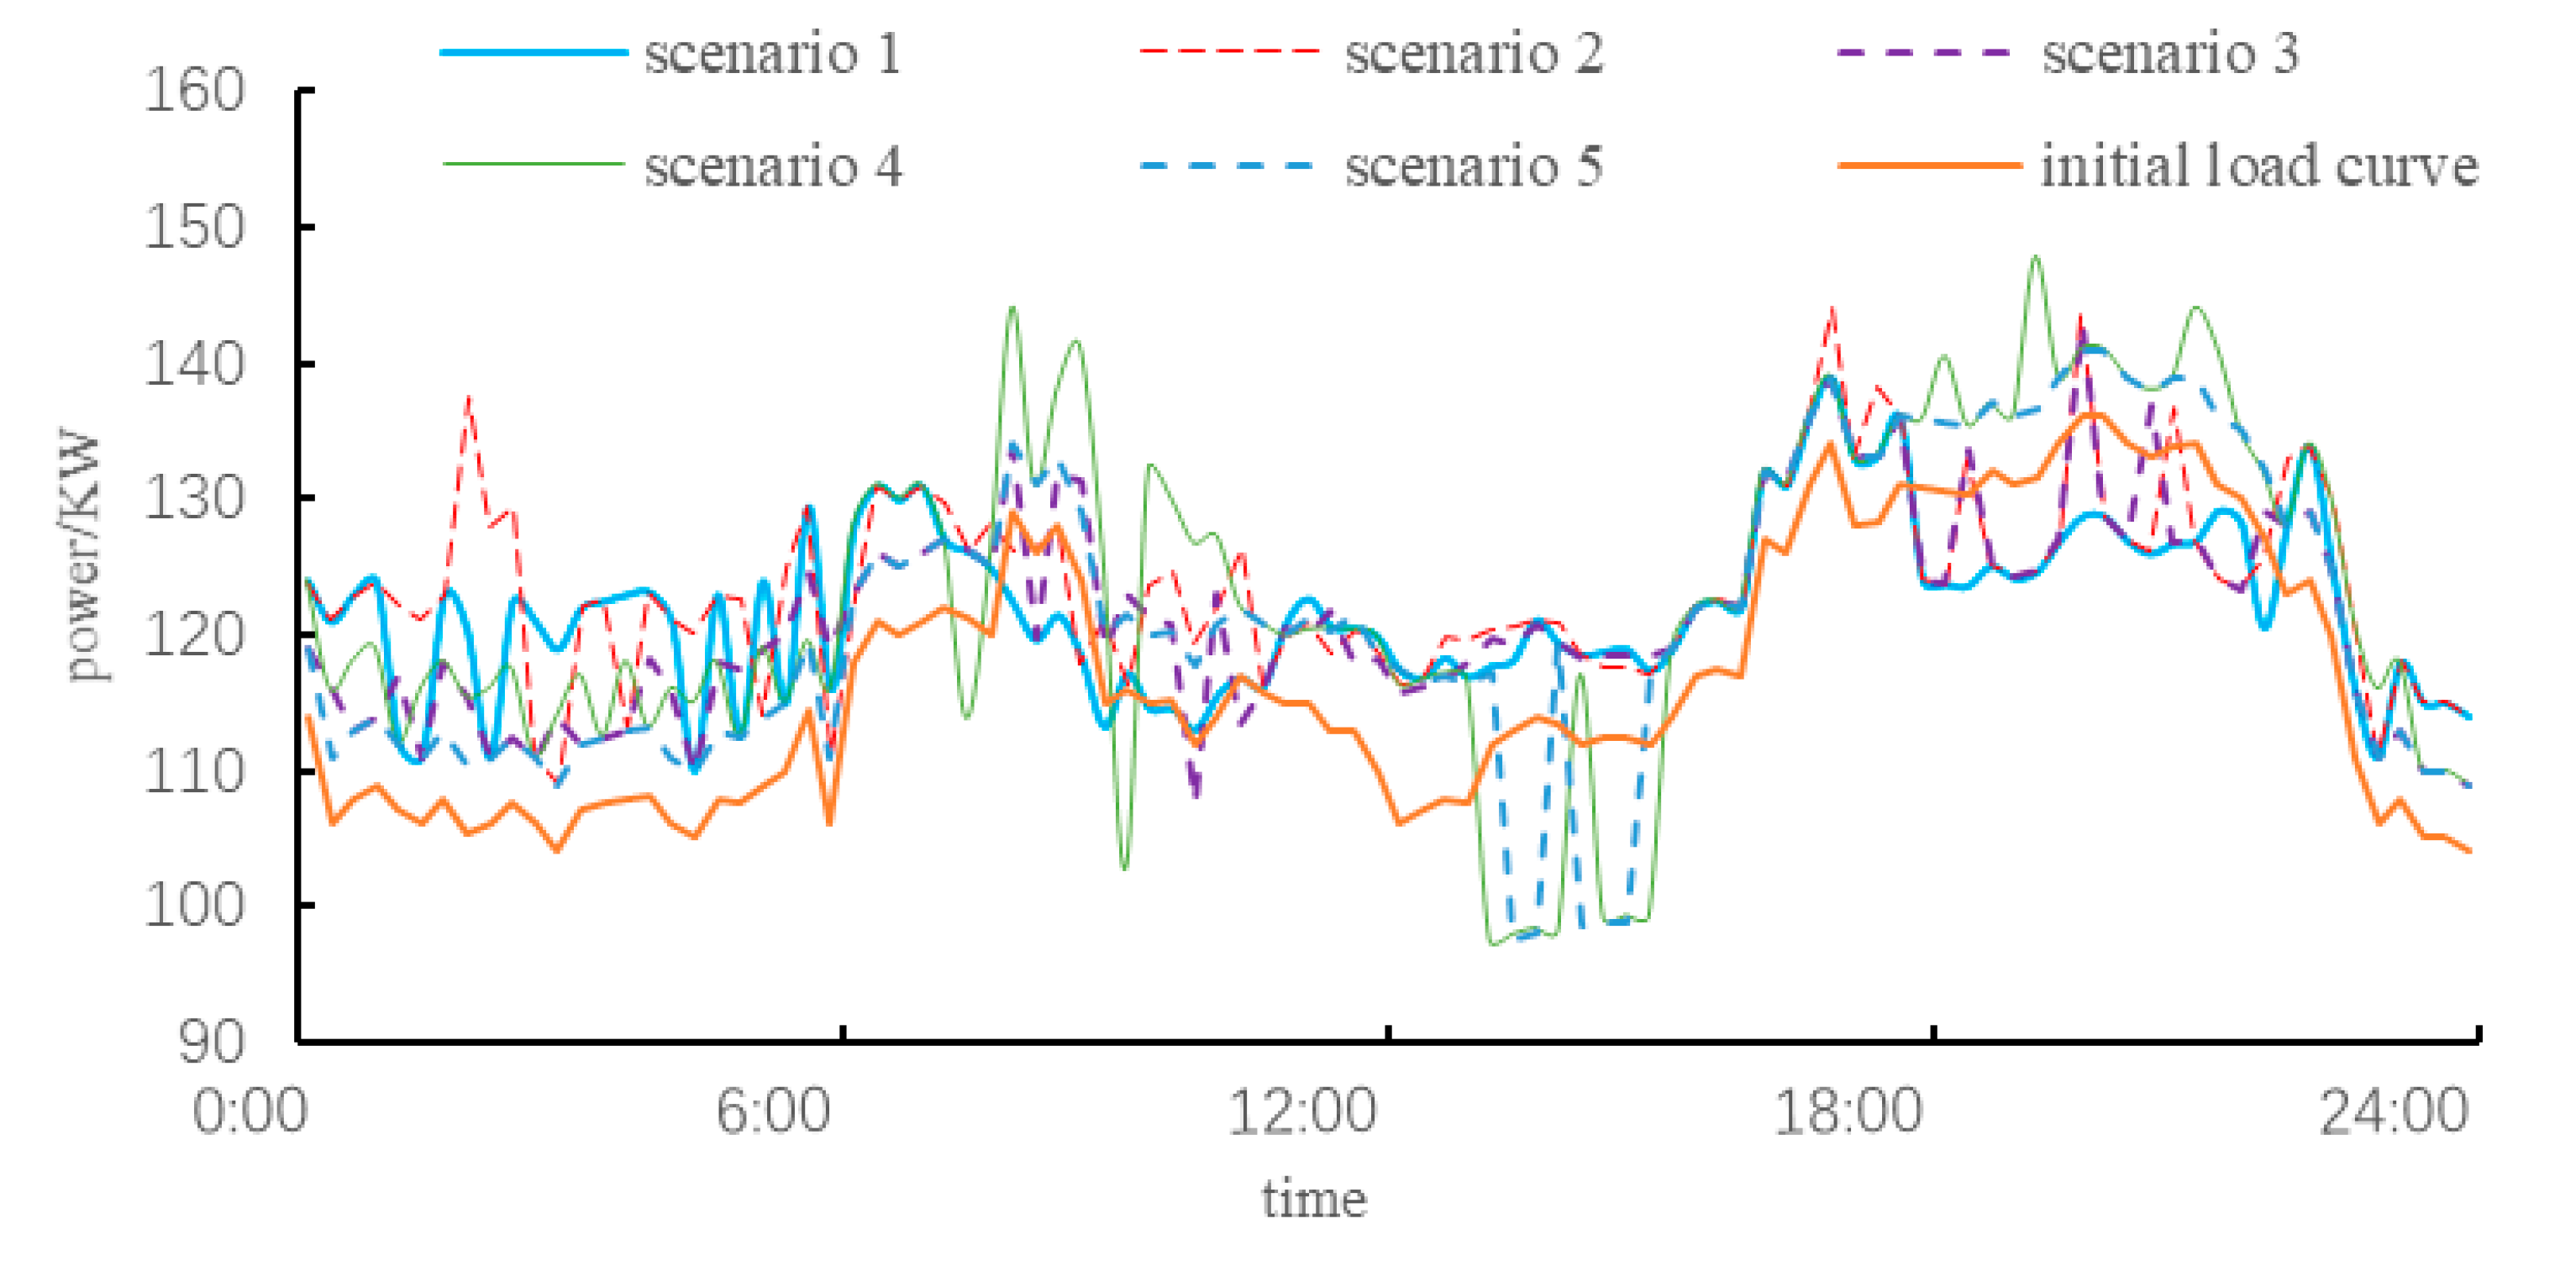
Using the NSGA-III algorithm to solve the integrated energy of the park in different scenarios, the load curve in different scenarios is shown in Figure 4, and the variance of the load curve in each scenario is shown in Table 3. Combined with Figure 4 and Table 3, it can be seen that when the integrated demand response is taken into account, there is an obvious peak-shaving effect. When the IESP contains energy storage devices, the overall variance of the daily load curve is 37.84 (scenario 1). In the same condition, the variance of the daily load curve is 118.78 without the integrated demand response in the system (scenario 4), which is not conducive to the joint output distribution of each generator unit due to the large volatility.
Table 4 shows the economic benefits of each agent in the integrated energy system in different scenarios. From Table 4, it can be seen that the net income of the IESP under the integrated demand response scenario (scenario 1, scenario 2, and scenario 3) is significantly more than the scenario that does not take into account the integrated demand response (scenario 4, scenario 5). Comparing scenario 1 and scenario 4, the net income of scenario 1 is 312.48 yuan more than scenario 4, which does not take the integrated demand response into consideration, while the user energy cost is also relatively low. This shows that the integrated demand response can effectively improve the economics of integrated energy dispatch.
Comparing scenario 1 and scenario 2, in the absence of thermal storage, more thermal is needed to be provided by the CHP to maintain the thermal load balance. Since the CHP operates in the “heat-deciding power generation” mode, the IESP purchases less electricity from the grid and renewable energy owners. Thus, the net income of REO is reduced without the thermal storage.
Since the power storage can adjust the charging and discharging strategy based on the load curve, the power is stored during the valley load period and released during the peak load period, which makes the combined output of each unit more reasonable as well as cuts peaks and fills valleys effectively. Comparing the load curve and the income situation of scenario 1 and scenario 3, it can be seen that in the absence of a power storage device, the load curve fluctuates severely, the net income of the IESP decreases, and the users’ energy consumption cost also increases.

5.2. Analysis of Optimization Dispatch Results

Considering the integrated demand response and game mechanism of the multi-agent’s interest, the pricing table of the trading mechanism between the IESP, REO, and the users in the park is shown in Table 5.
Comparing Table 2 and Table 5, it can be seen that the electricity price sold by REO to IESP is higher than that sold by REO to the grid in each period, and lower than the electricity price purchased by the IESP to the grid, which promotes the internal consumption of renewables in the park and the economics of the IESP. In the bilateral transaction between IESP and users, IESP sells electricity to users at a lower price than the grid, which reduces the energy cost of users. Users are also more inclined to purchase energy from IESP to promote the balance of interests of all agents.
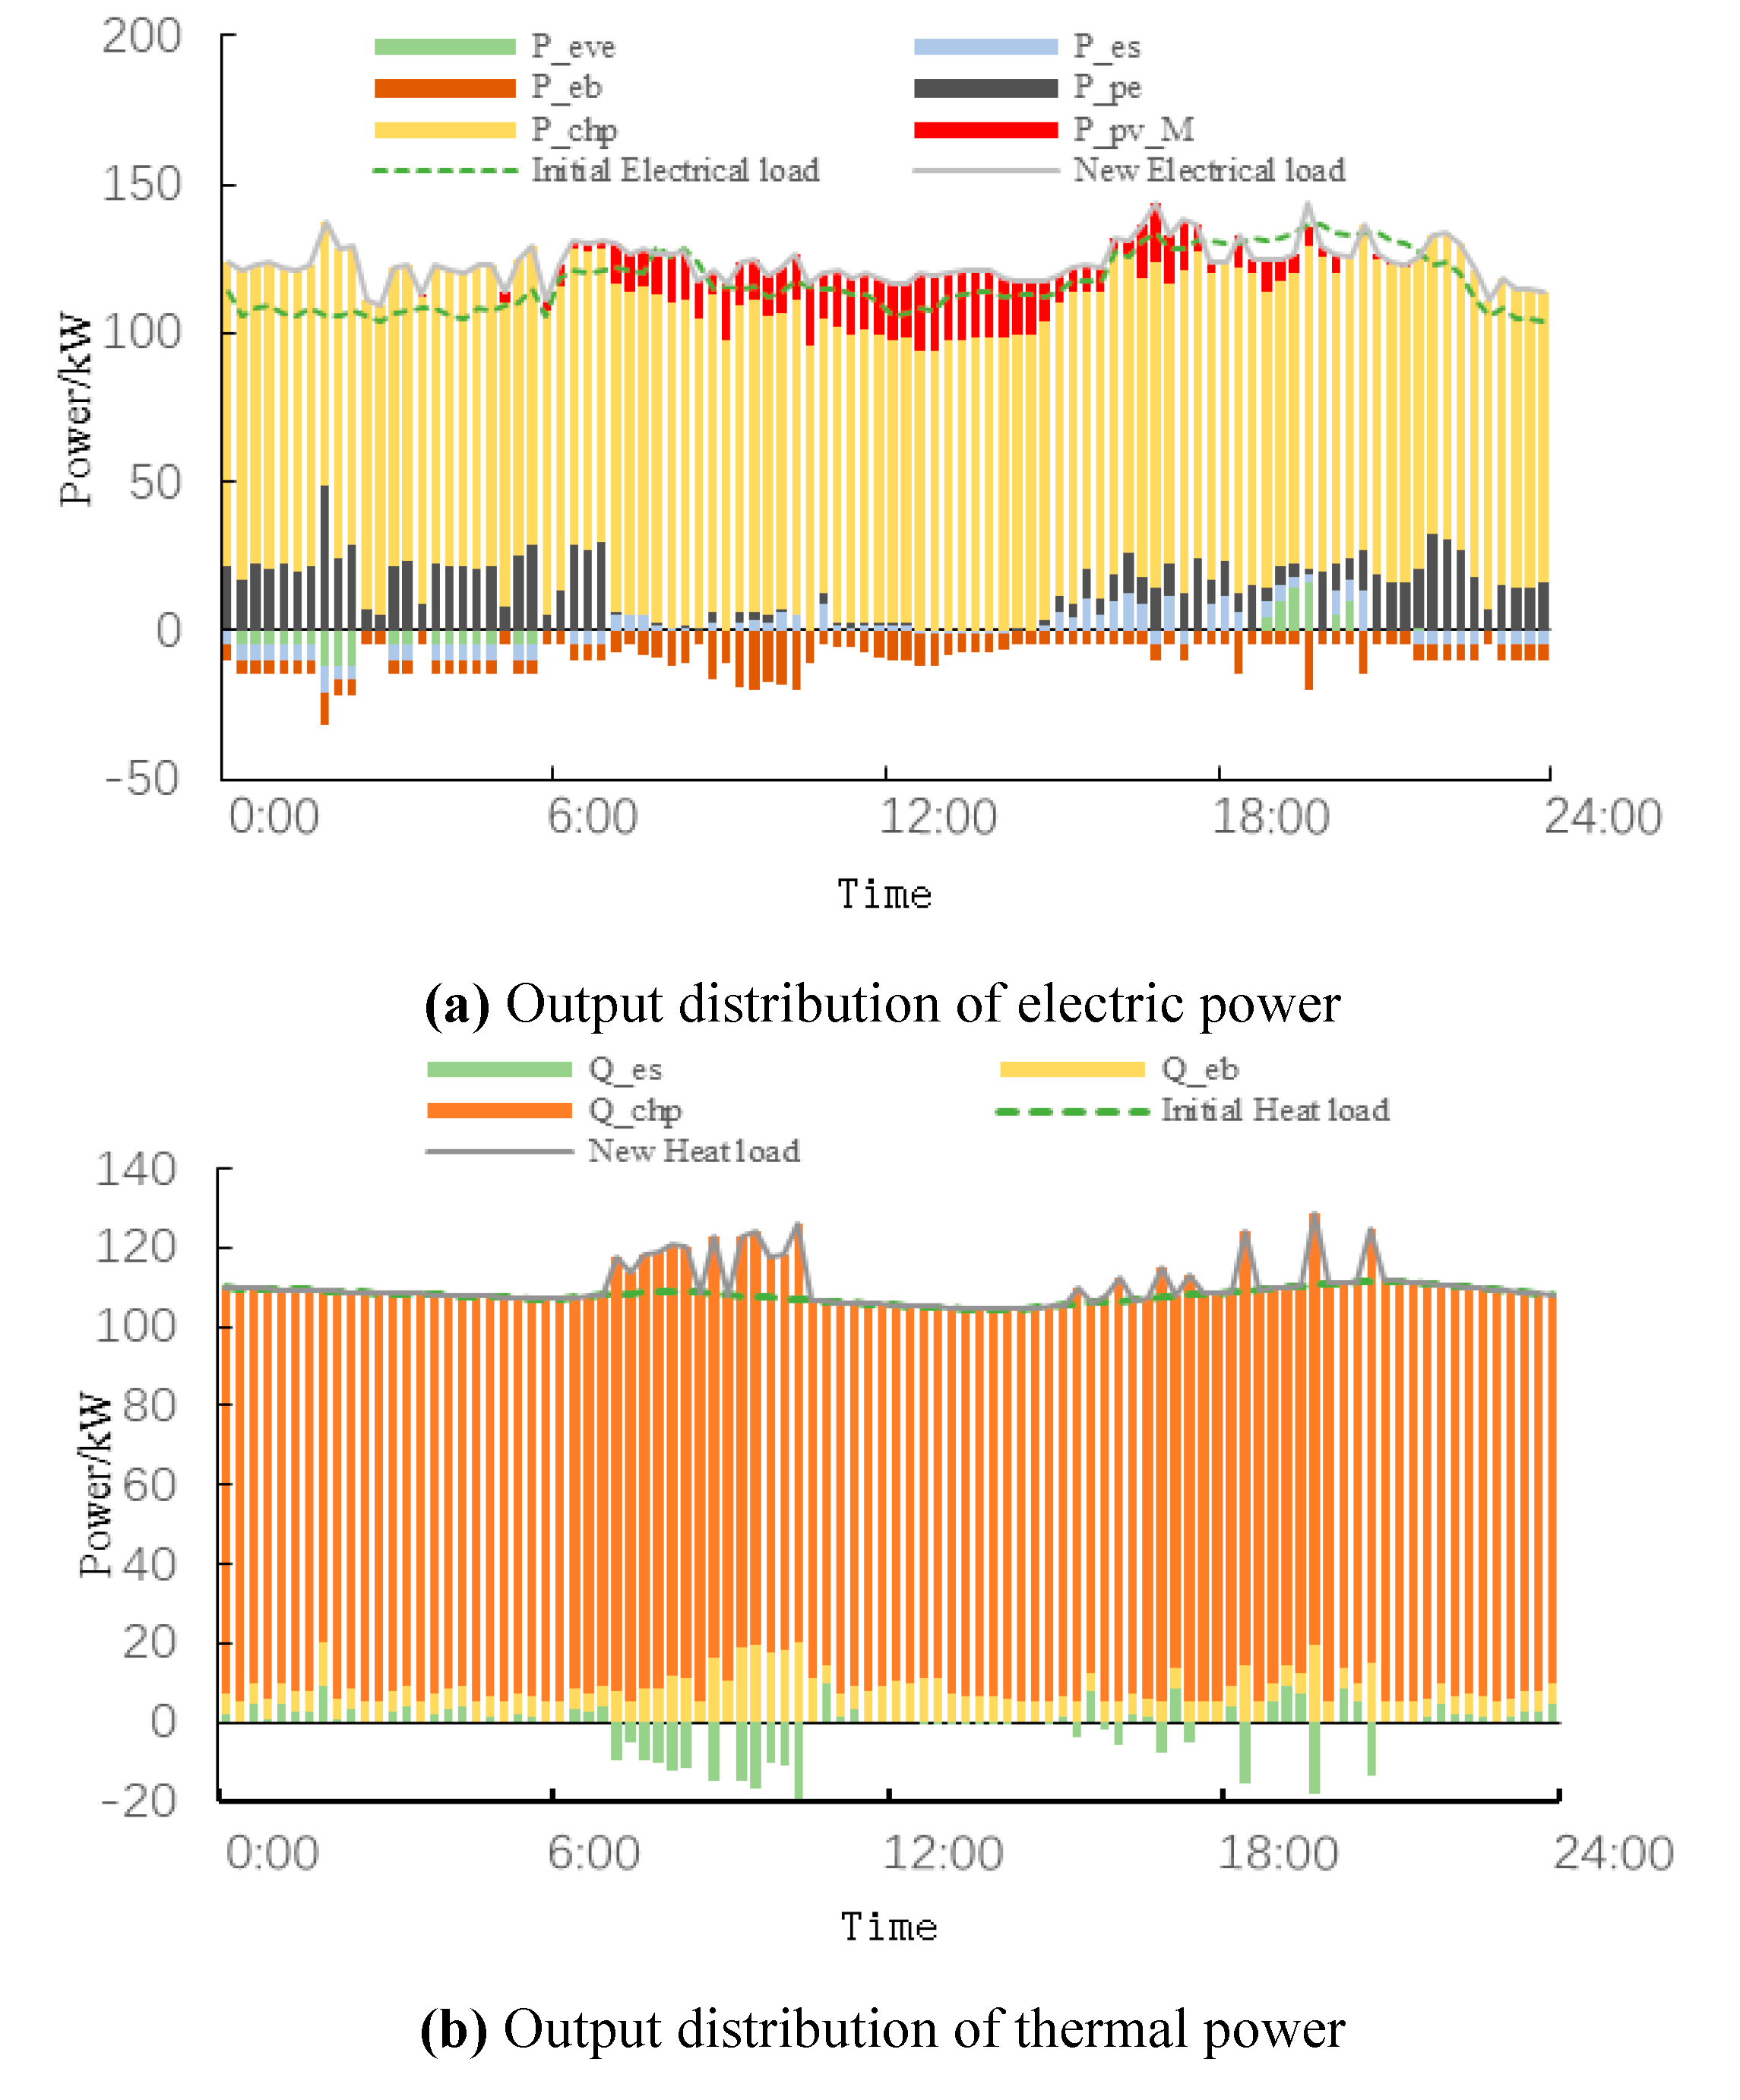
The output distribution of each unit of IESP is shown in Figure 5. During the peak period of the electric load, there is a large disparity between the electric and thermal load. Since CHP operates in the “heat-deciding power generation” mode, the thermal output of CHP is increased to meet the electric load balance. If there is no thermal storage, it will lead to abandonment of thermal energy. The thermal energy recovered by the thermal storage can be used for cooling, as well as for heating for the rest of the time, reducing the gas cost and the output of the CHP during the valley period. Boiler heating leads to an increase in the electrical load curve, but under the combined action of an integrated demand response, energy storage, and electric vehicle, the peak and valley difference of the new load curve is reduced, and the increase of the load curve at 11:00 to 13:00 is beneficial to the output of photovoltaic units.
The time for the electric vehicle to participate in the dispatch is between 19:00 and 6:00 the next day. Through the optimal dispatch, the EVO chooses to discharge during the peak period of the electricity price, and charge during the valley period of the electricity price to maximize the net income. Meanwhile, the EVO electricity discharge price is 0.8981 ¥/kWh, less than the electricity price purchased by the IESP to the grid, reducing the operating costs of the IESP.
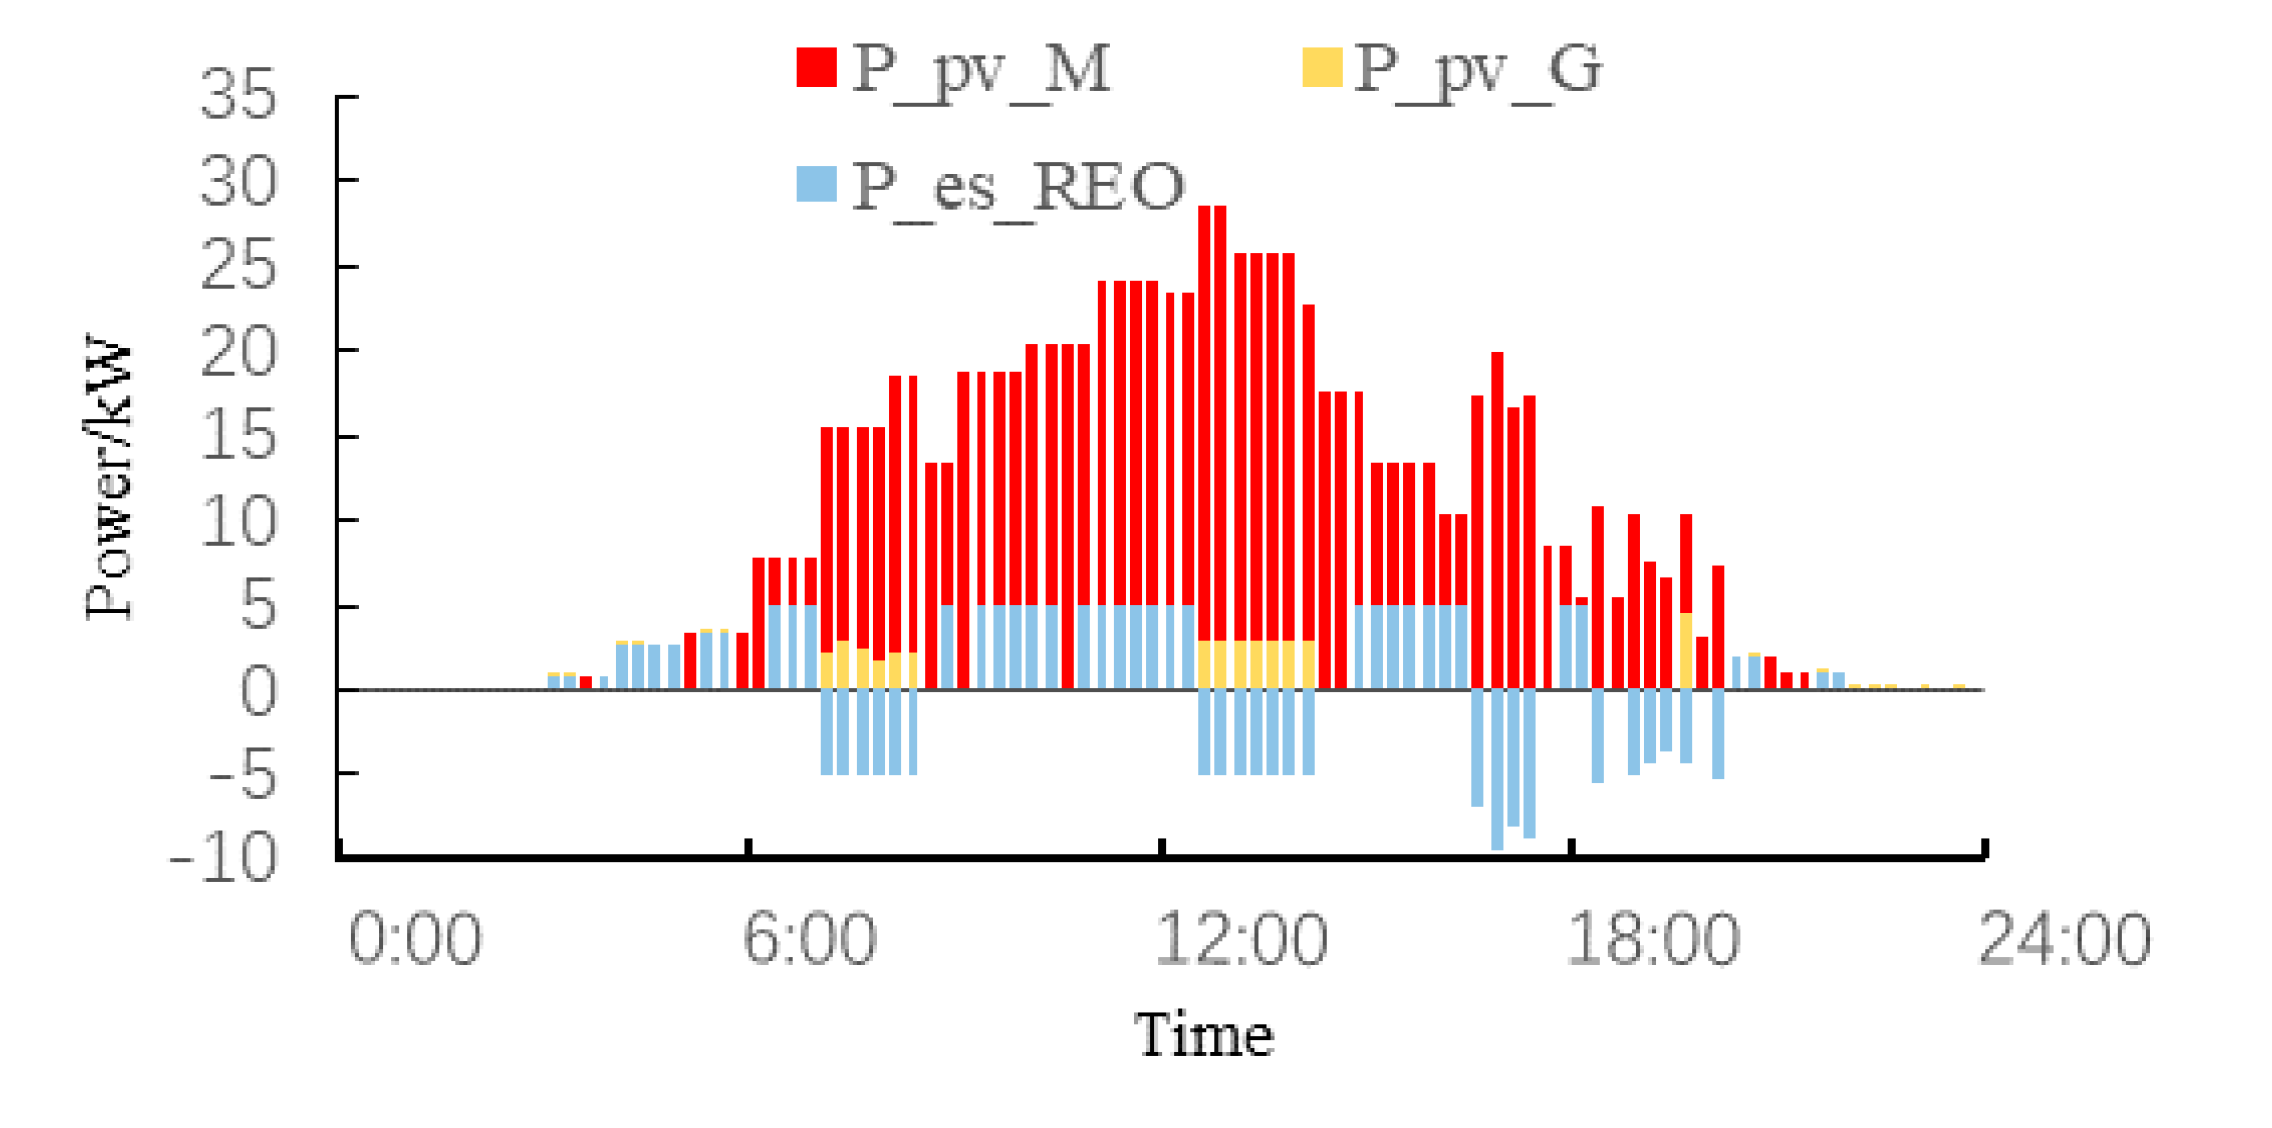
The REO’s output distribution is shown in Figure 6. he internal photovoltaic consumption rate of the integrated energy system is as high as 93.69%. As illustrated in Figure 5, in the photovoltaic sufficient moment, IESP’s power supply mainly comes from CHP and is purchased from REO. The purchase power from the grid is almost 0, which effectively reduces the operating costs of IESP. The energy storage system is configured in the REO, which discharges during the peak load period and stores excess power from the photovoltaic system during the valley load period, increasing REO’s solar energy utilization rate. The time-shift characteristic of the energy storage system makes it possible for REO to sell electricity to the IESP during peak hours (18:00–21:00) in the case of insufficient solar energy, which increases the economic benefits of REO.

5.3. Comparison with Other Dispatch Methods

The authors of [6] introduced a global unified scheduling strategy for IES, including thermoelectric energy storage, renewable energy, and electric vehicles, which is similar to the system structure of this paper but did not consider multi-agent interest balance and energy hub technology in its process of dispatch. Table 6 compares the various costs, benefits, and PV consumption rates of the multi-agent interest-balanced dispatch model in this paper and the global unified dispatch model proposed in [6]. Compared with the strategy proposed in [6], the strategies proposed in this paper are better than the strategies proposed in [6] in the aspects of the costs of electricity purchase, gas purchase, and environmental pollution in the park. Since energy storage plays an important role in multi-agent dispatch, the loss cost is higher, but the value is not large. Under the balancing dispatch, the user’s energy cost is reduced, and the local consumption rate of PV is improved, which illustrates the effectiveness and practicability of the dispatch method to balance the multi-agent’s interest in the park.

6. Conclusions

In this paper, an integrated energy multi-agent model was constructed. With the goal of balancing the interests of all agents, integrated energy hub technology was introduced. Using the NSGA-III algorithm to coordinate the output distribution of each generator unit, the following conclusions were obtained:
(a) The system was divided into three main agents: IESP, REO, and EVO, which is more in line with the actual situation. By optimizing the dispatch to balance the interests, all agents should become the focus of integrated energy optimization dispatch.
(b) The introduction of energy hub technologies, such as integrated demand response, electricity storage, and thermal storage, can effectively reduce the operation cost of the system through the timing shift of energy. In the study of this paper, the operation cost of the system was reduced by 8.1%.
(c) The model was solved by NSGA-III algorithm to get the Pareto frontier, and the optimal optimization dispatch in the Pareto frontier was found by the TOPSIS method. The results in this paper show the effectiveness of the proposed algorithm.
This paper comprehensively considered the interests of each agent in a single park. The integrated energy system dispatch method considering multi-agents’ interests and energy hub technology can effectively improve the flexibility of the cogeneration system and make the power market more transparent and orderly. It can be applied in real life by using the method to optimize the dispatch of park-level integrated energy, through coordinating multiple stakeholders, and guiding the operation of each unit to achieve the goal of balancing interests.
This paper divided the integrated energy system into three agents: IESP, REO, and users. However, the division of multi-agents may not be the same in other parks, and how to divide each agent accurately should be based on actual conditions. On the other hand, the integrated energy interconnection between parks will become the development trend in future integrated energy systems. How to coordinate the planning and dispatch of integrated energy systems between parks will become the focus of future research.
Author Contributions

The methodology was proposed by C.Z. and Y.J., the investigation was done by C.Z., the formal analysis work was done by Y.L., the validation work was done by Z.T., the data curation work was finished by S.W. and Z.H., and the original draft was finished by C.Z. and Y.L.

Funding

This research was funded by National Natural Science Foundation of China (5197070128) and Technical Projects of china Southern Power Grid (No. GDKJQQ20161202).

Conflicts of Interest

The authors declare no conflict of interest.

References

  1. Zhao, D.M.; Xia, X.; Tao, R. Optimal Configuration of Electric-Gas-Thermal Multi-Energy Storage System for Regional Integrated Energy System. Energies 2019, 12, 2586. [Google Scholar] [CrossRef]
  2. Yang, Z.J.; Gao, C.W.; Zhao, M. Review of Coupled System Between Power and Natural Gas Network. Autom. Electr. Power Syst. 2018, 42, 21–31. [Google Scholar]
  3. Li, Y.; Wu, M.; Zhou, H.M. Study on some key problems related to regional multi energy system based on universal flow model. Power Syst. Technol. 2015, 39, 2230–2237. [Google Scholar]
  4. Jia, H.J.; Wang, D.; Xu, X.D. Research on Some Key Problems Related to Integrated Energy Systems. Autom. Electr. Power Syst. 2015, 39, 198–207. [Google Scholar]
  5. Jiang, X.S.; Jing, Z.X.; Li, Y.Z. Modelling and operation optimization of an integrated energy based direct district water-heating system. Energy 2014, 64, 375–388. [Google Scholar] [CrossRef]
  6. Liu, H.; Chen, X.Y.; Li, J.F. Economic dispatch based on improved CPSO algorithm for regional power-heat integrated energy system. Electr. Power Autom. Equip. 2017, 37, 193–200. [Google Scholar]
  7. Zhou, C.H.; Zheng, J.H.; Jing, Z.X. Multi-Objective Optimal Design of Integrated Energy System for Park-Level Microgrid. Power Syst. Technol. 2018, 42, 1687–1697. [Google Scholar]
  8. Li, Y.; Huan, J.J.; Cao, H.Z. Distribution Network Planning Strategy Based on Integrated Energy Collaborative Optimization. Power Syst. Technol. 2018, 42, 1393–1400. [Google Scholar]
  9. Favre-Perrod, P. A vision of future energy networks. In Proceedings of the 2005 IEEE Power Engineering Society Inaugural Conference and Exposition in Africa, Durban, South Africa, 11–15 July 2005; pp. 13–17. [Google Scholar]
  10. Geidl, M.; Koeppel, G.; FavrePerrod, P. Energy Hubs for the future. IEEE Power Energy Mag. 2007, 5, 24–30. [Google Scholar] [CrossRef]
  11. Bozchalui, M.C.; Hashmi, S.A.; Hassen, H. Optimal operation of residential energy hubs in smart grids. IEEE Trans. Smart Grid 2012, 3, 1755–1766. [Google Scholar] [CrossRef]
  12. Bahrami, S.; Sheilhi, A. From Demand Response in smart Grid Toward Integrated Demand Response in Smart Energy Hub. IEEE Trans. Smart Grid 2016, 7, 650–658. [Google Scholar] [CrossRef]
  13. Mancarella, P.; Chicco, G. Real-time demand response from energy shifting in distributed multi-generation. IEEE Trans. Smart Grid 2013, 4, 1928–1938. [Google Scholar] [CrossRef]
  14. Wang, Y.; Zhang, N.; Kang, C.Q. Review and Prospect of Optimal Planning and Operation of Energy Hub in Energy Internet. Proc. CSEE 2015, 35, 5669–5681. [Google Scholar]
  15. Xu, Q.S.; Li, L.; Sheng, Y.H. Day-Ahead Optimized Economic Dispatch of Active Distribution Power System with Combined Cooling, Heating and Power-Based Microgrids. Power Syst. Technol. 2018, 42, 1726–1735. [Google Scholar]
  16. Zhou, X.X.; Lu, Z.X.; Liu, Y.M. Development models and key technologies of future grid in China. Proc. CSEE 2014, 34, 4999–5008. [Google Scholar]
  17. Zhang, Y.N.; He, Y.B.; Yan, M.Y.; Guo, C.X.; Ding, Y. Linearized Stochastic Scheduling of Interconnected Energy Hubs Considering Integrated Demand Response and Wind Uncertainty. Energies 2018, 11, 2448. [Google Scholar] [CrossRef]
  18. Zhang, X.; Shahidehpour, M.; Alabdoulwahab, A.A. Hourly electricity demand response in the stochastic Day Ahead scheduling of coordinated electricity and natural gas networks. IEEE Trans. Power Syst. 2016, 31, 592–601. [Google Scholar] [CrossRef]
  19. Lin, J.C.; Zhu, K.W.; Liu, Z.L.; Jenny, L.; Tan, X.C. Study on A Simple Model to Forecast the Electricity Demand under China’s New Normal Situation. Energies 2019, 12, 2220. [Google Scholar] [CrossRef]
  20. Wang, W.L.; Wang, D.; Jia, H.J. Review of steady-state analysis of typical regional integrated energy system under the background of energy internet. Proc. CSEE 2016, 36, 3292–3306. [Google Scholar]
  21. Wang, H.C.; Yin, W.S.; Elnaz, A. Modelling and optimization of CHP based district heating system with renewable energy production and energy storage. Appl. Energy 2015, 159, 401–421. [Google Scholar] [CrossRef]
  22. Fikiin, K.; Stankov, B.; Evans, J.; Maidment, G.; Foster, A.; Brown, T.; Radcliffe, J.; Youbi-Idrissi, M.; Alford, A.; Varga, L.; et al. Refrigerated warehouses as intelligent hubs to integrate renewable energy in industrial food refrigeration and to enhance power grid sustainability. Trends Food Sci. Technol. 2017, 60, 96–103. [Google Scholar] [CrossRef]
  23. Wang, Q.X.; Liu, D.C.; Wu, J. Comprehensive optimization including user behavior analysis for supply and demand sides of IES-MEC. Electr. Power Autom. Equip. 2017, 37, 179–185. [Google Scholar]
  24. Zhu, Y.S.; Wang, J.; Qu, B.Y. Dynamic environmental and economic dispatch of power system with EVs. Electr. Power Autom. Equip. 2016, 36, 16–23. [Google Scholar]
  25. Lorenzo, B.; Stefano, C.; Vincenzo, M.; Marina, S. Ancillary Services Provided by Hybrid Residential Renewable Energy Systems through Thermal and Electrochemical Storage Systems. Energies 2019, 12, 2429. [Google Scholar] [Green Version]
  26. Mohammed, A.A.; Muhammad, K.; Fahad, A. Optimal Sizing of Battery Energy Storage for a Grid-Connected Microgrid Subjected to Wind Uncertainties. Energies 2019, 12, 2412. [Google Scholar] [Green Version]
  27. Bahram, G.; Reza, S.; Mehdi, M. operational and economic optimization of cryogenic natural gas plant using NSGAII two-objective genetic algorithm. Appl. Energy 2018, 159, 401–421. [Google Scholar]
  28. Coello, C.A. Evolutionary multi-objective optimization: A historical view of the field. IEEE Comput. Intell. Mag. 2006, 1, 28–36. [Google Scholar] [CrossRef]
  29. Yi, J.H.; Xing, L.N.; Wang, G.G. Behavior of Crossover Operators in NSGA-III for Large-Scale Optimization Problems. Inf. Sci. 2018. [Google Scholar] [CrossRef]
  30. Bi, X.J.; Wang, C. Many-objective evolutionary algorithm based on hyperplane projection. J. ZheJiang Univ. (Engine Sci.) 2018, 52, 1284–1293. [Google Scholar]
  31. Bi, X.J.; Zhang, Y.J.; Chen, C.Y. A many-objective evolutionary algorithm based on fuzzy dominance: MFEA. Acta Electr. Sin. 2014, 42, 1653–1659. [Google Scholar]
  32. Han, L.; Wang, S.X.; Zhao, G. Optimal Planning of Distributed Generators Based on Combination of Interval TOPSIS Method and Genetic Algorithm. Autom. Electr. Power Syst. 2013, 37, 37–42. [Google Scholar]
  33. Qian, W.Y.; Dang, Y.G.; Xiong, P.P. Economic dispatch based on improved CPSO algorithm for regional power-heat integrated energy system. Syst. Engine 2009, 27, 124–126. [Google Scholar]
Figure 1. Physical model of integrated energy system considering integrated demand response (IDR).
Energies 12 03112 g001
Figure 2. Flow chart of NSGA-III.
Energies 12 03112 g002
Figure 3. Thermoelectric load and photovoltaic output power in summer.
Energies 12 03112 g003
Figure 4. Daily load curve in different scenarios.
Energies 12 03112 g004
Figure 5. Output distribution in IESP.
Energies 12 03112 g005
Figure 6. Electric power output distribution of REO.
Energies 12 03112 g006
Table 1. Time-of-use price.
TypeInstalled CapacityPmin/kWPmax/kWki/(¥/kW·h)
CHP150 kW751500.024
PV2 × 20 kW0400.0182
EB10 kW0100.01495
ES19.2 kW4.8160.00195
HS4 × 5 kW·h1.519.20.0013
Table 2. Time-of-use price (¥/kW·h).
PeriodXG2IXR2G
Peak period1.13650.6123
Flat period0.65980.3582
Valley period0.18850.1222
Table 3. Variance of the microgrid load curve in different scenarios.
ScenarioScenario 1Scenario 2Scenario 3Scenario 4Scenario 5
Variance37.8446.3753.99118.78142.75
Table 4. Revenues of various agents in different scenarios.
ScenarioIESP Net Income/¥REO Net Income/¥Users’ Energy Consumption Cost/¥
Scenario 13148.47469.315068.44
Scenario 23071.56401.595246.31
Scenario 33011.42466.025120.64
Scenario 42835.99482.715248.18
Scenario 52822.78406.315364.51
Table 5. Transaction pricing between agents (¥/kW·h).
PricePeak PeriodFlat PeriodValley Period
cR2I0.86880.51570.1574
ce0.98450.51240.1523
ch0.75630.44160.1015
Table 6. Comparison of economics of and PV consumption under different dispatch methods.
EconomicsMulti-Agent Interest BalanceGlobal Unified
Electricity purchase cost/¥163.41198.23
Gas purchase cost/¥1821.241865.42
Environmental pollution cost/¥145.51156.42
Operation and maintenance cost/¥69.6565.23
Energy storage loss cost/¥23.159.51
User’s energy consumption cost/¥5068.545436.94
PV local consumption rate/%93.6984.62