1. Introduction
Illegal, unreported, or unregulated (IUU) fishing was about of 30% of the total catch of global fishing in 2010, costing coastal economies billions and depleting fish populations at unsustainable rates [
1]. This IUU fishing is estimated to be about USD 10 billion to USD 23.5 billion worldwide, corresponding to 11–26 million tonnes of fishery product [
2]. This problem is more severe in developing countries, which face severe consequences such as food insecurity and challenges in addressing this problem. Studies conducted by the UNODC identify the fisheries industry vulnerable to international organized crime [
3]. IUU is also associated with environmental crimes damaging marine living resources. IUU fishing affects primarily small-scale fisheries communities in developing countries [
4]. IUU fishing is generally considered an environmental crime as it changes ecosystems and affects society as a whole. This problem is difficult to estimate because the illegal activities are performed at high sea, and the assessment of fish stocks is based on estimates [
3]. In 2013, the Organisation for Economic Co-operation and Development (OECD) studied the problem of IUU and created a report where it discusses the various approaches used by criminals to evade tax, such as using a false declaration of catch, changing the location of where the fish was caught, providing incorrect description of fisheries products, etc. [
5].
The major problem is the high revenue from IUU activities, and the corrective measures should focus on: (1) reducing revenue from IUU fishing; (2) increasing operating costs for IUU vessels; (3) increasing capital costs of IUU vessels; and (4) increasing risk and cost of engaging in IUU activities [
6]. The same study found that weak governance arrangements and control process in the fisheries sector is considered the main vulnerability of IUU activities. To mitigate this problem, governments should create stronger policy frameworks and better control processes. A key area for improvement is the tracking of the vessels and the use of data analytics to fast fraud identification. There is a need to have accurate and complete information on vessel activity in the deep seas [
7].
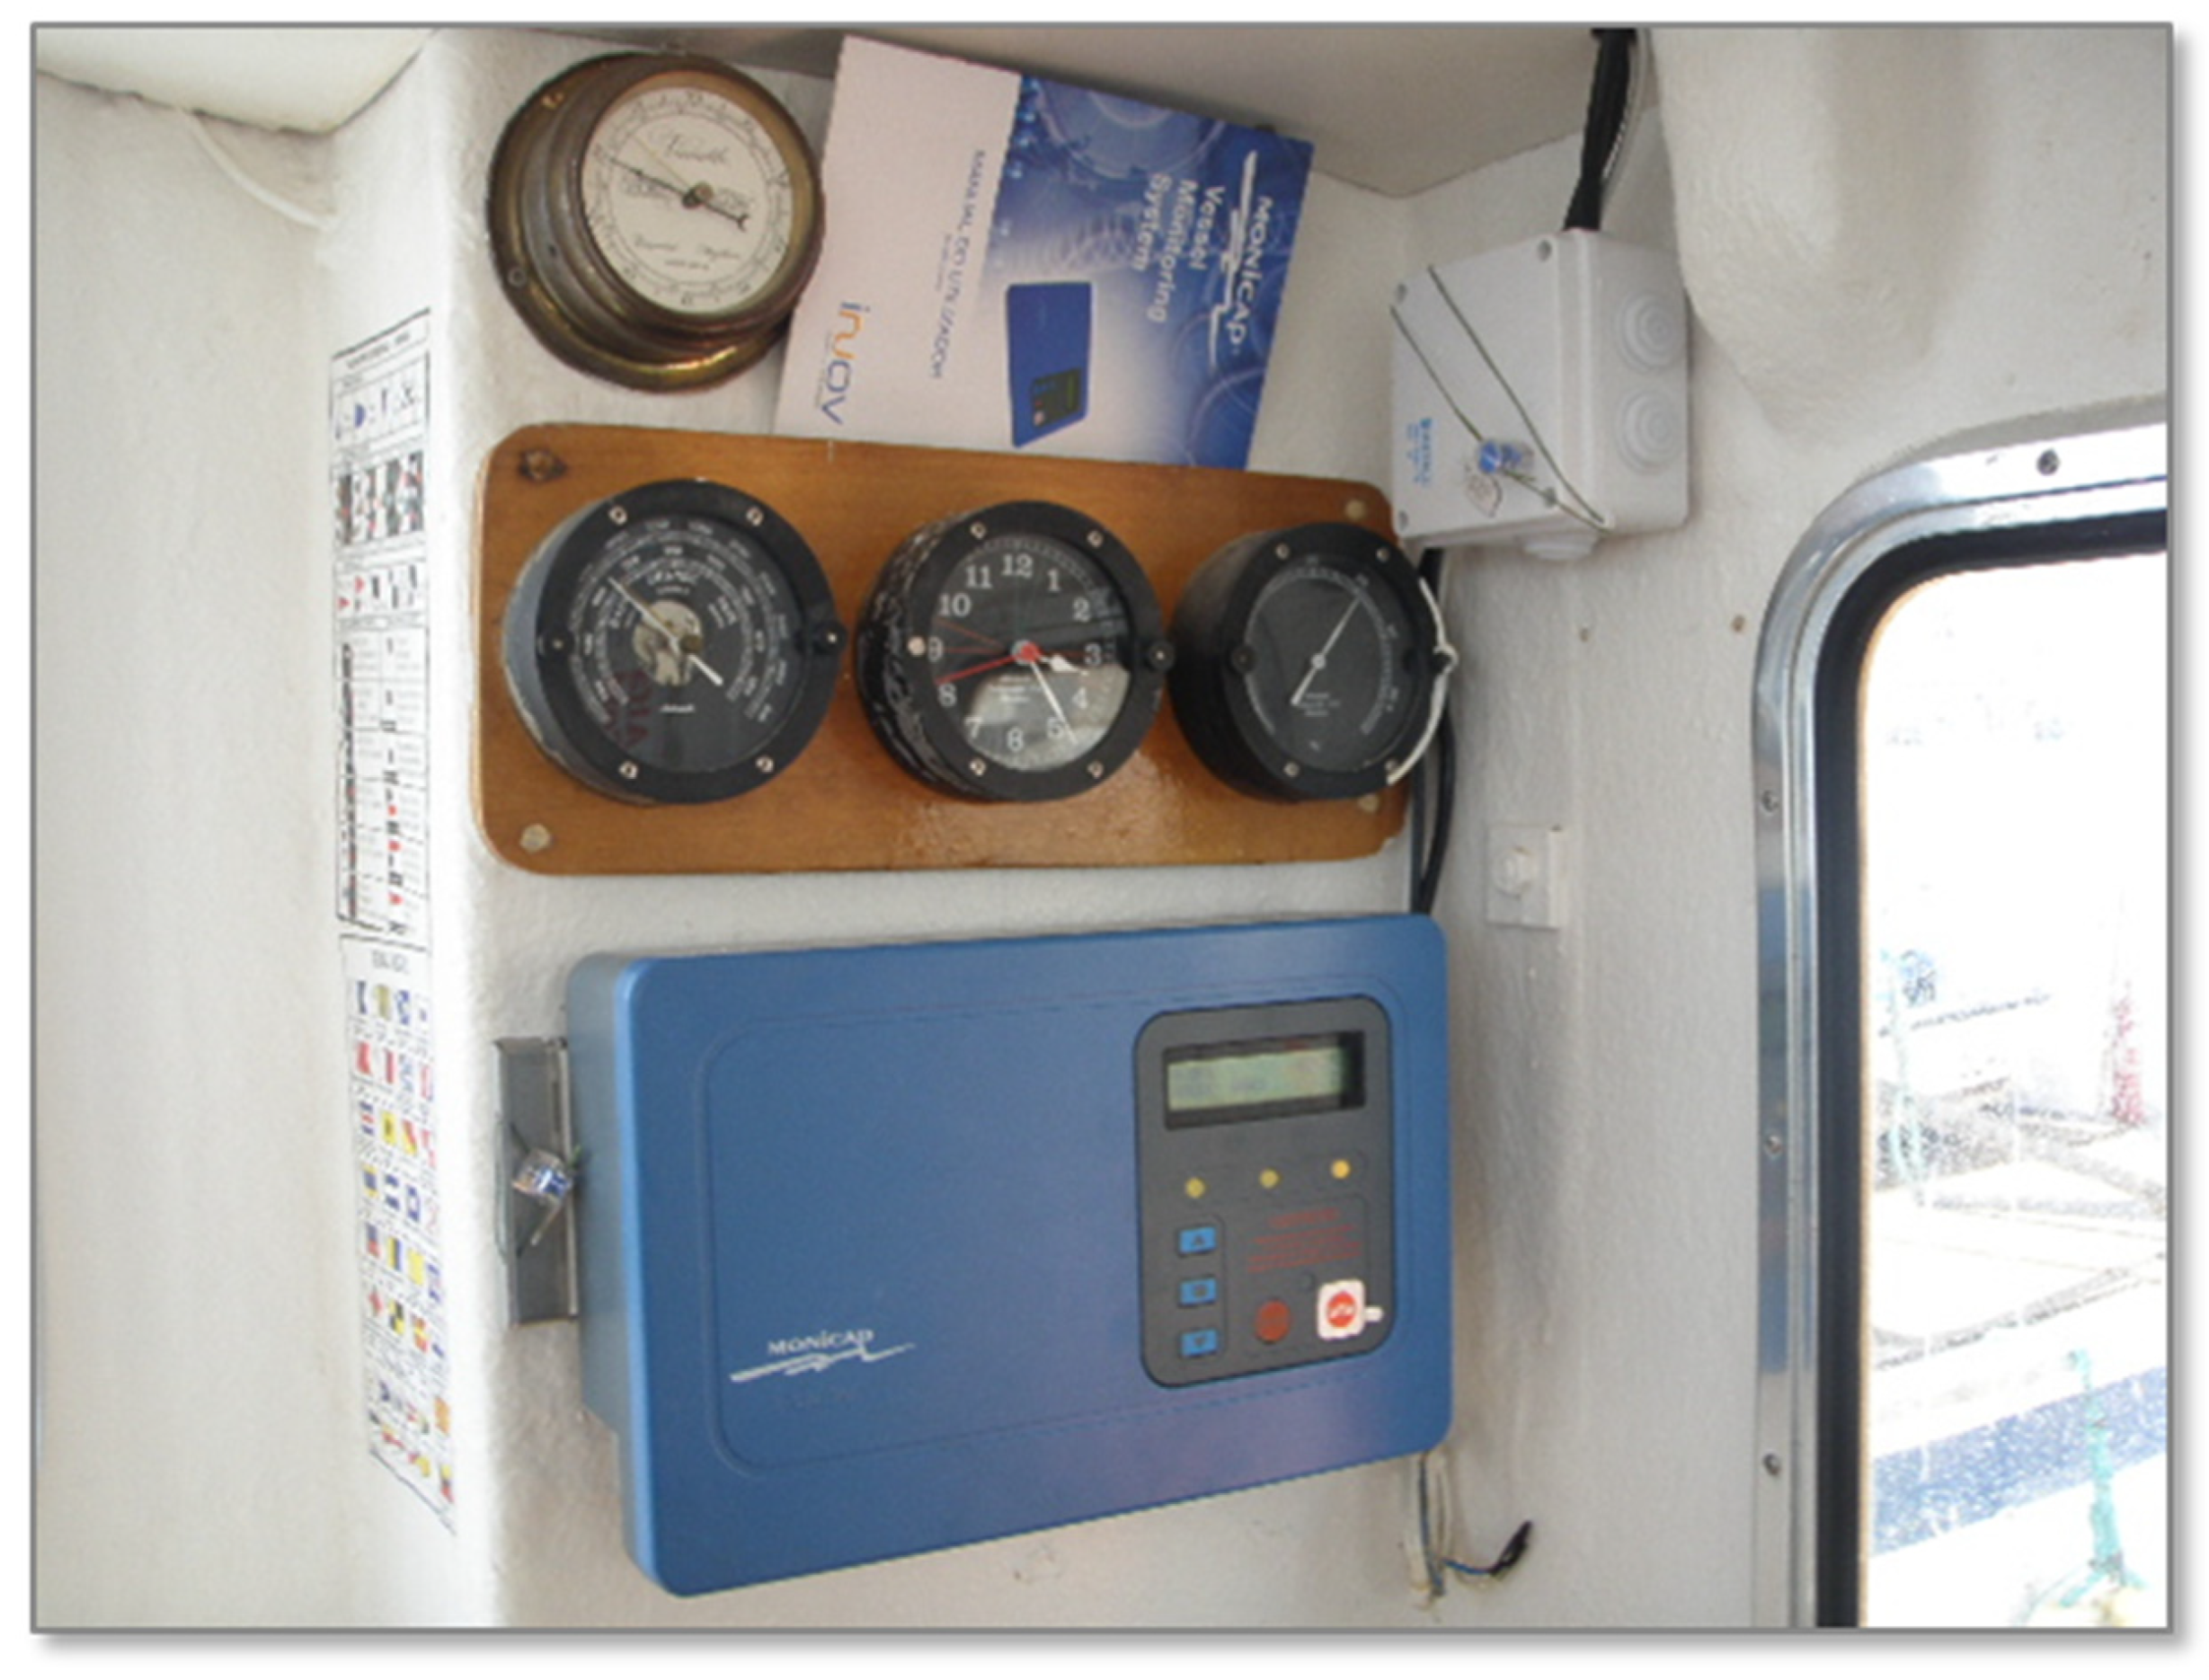
To address these issues, the Vessel Monitoring System (VMS) system is proposed. The VMS (MONICAP™,
http://www.xsealence.pt/equipamentos/), consists of continuous monitoring equipment (EMC—“blue box”) installed on fishing vessels, which records and transmits satellite information on the vessel’s geographic position, course and speed to a Fisheries Control and Monitoring Center (FCMC) in real-time every 2 h. Geo-referenced information is currently available for all vessels with a total length of more than 12 m and is used for inspection, monitoring, and control of fishing activities. In Portuguese national waters (continental EEZ, Madeira, and the Azores), this universe comprises all coastal trawlers, as well as the great majority of the purse-seine fleet and a percentage of longlines, gill nets, and traps (Regulation (EU) No 1380/2013 of 11 December on the CFP). This information presents great potential for research, allowing the mapping and quantification of fishing activities. It has been used in this industry since the last decade, in the analysis of fleet dynamics, as well as in the estimation of fishing efforts. Underlying this analysis is the identification of the most important phases of fishing operations. The use of VMS points towards this purpose as it requires the knowledge of the operations onboard the different types of vessels, resulting from detailed in loco observations. However, high-quality information regarding the frequency of vessel position records is essential. With a high frequency of records, an experienced observer will be able to identify spatial patterns corresponding to the different phases of the operations. Due to high communication costs, the current transmission rate is only one position every two hours, which compromises the identification of the most important phases of the fishing operations. However, in the blue box proposed in this research, these registers occur every 10 min, and it can be programmed to increase this frequency.
The MONICAP™ Terminal (
Figure 1) supports a wide range of supply voltages covering the needs of different vessels, supports multiple communication media (allows the automatic selection of the most appropriate means of communication or the lowest cost) and has the capacity to transmit to more than one control center—if the rules so require. It can store the last 65,535 records (from 455 days, once every 10 min), and transmit the last 1000 records stored. It is possible to perform parameterization both locally and remotely, which can be done for all zones, by groups of zones, or by individual zones: setting transmission parameters (e.g., 24/24 h transmission when at port); configuring events that require transmissions (e.g., transmits whenever the vessel enters a restricted zone within a certain period); set the “wake up” frequency of the mobile unit (e.g., when in battery mode it can wake up every 2 h if in port). It also has an extended alarm management system, which can be used to generate alarms in real-time regarding internal or external abnormalities to alert the control center. There are 34 different alarms, such as: (1) attempt to tamper the terminal; (2) external power failure/cut-off; (3) antenna blockage; (4) hardware problem; (5) distress request (SOS); and (6) hardware change.
The MONICAP™ Terminal installed onboard records a set of data (position, date/time, integrity, status records) by using an integrated GPS+SBAS (EGNOS) system [
8], guaranteeing precise position information.
2. State of the Art and Edge Computing Approach
Research work on a cloud computing approach has been used in data processing to extract knowledge for further assessment of the fishing impact and find illegal activities [
9,
10,
11]. These studies range from the processing of time and space collected data to the identification and evaluation of the environmental impacts of the fishing activity [
12,
13]. VMS also has similarities to fishing reports files about the caught fish [
14], and a series of tools can be applied for data processing towards knowledge extraction with two main software libraries: VMStools [
15] and VMSbase [
16], for R.
Several efforts have been performed in a centralized approach at cloud servers with data processing to extract knowledge, but it is possible to start at edge computing at VMS or AIS systems in a similar approach that has been applied in an IoT system to avoid the transmission of billions of data files [
17]. Some approaches can be applied to the current case to save communication that is expensive due to the use of the satellite at sea (in remote sea zones, only satellite communications are available).
Most VMS or AIS lack processing power, storage capacity, and memory [
14], because they are embedded systems and associated transmitted costs lead to data transmission every 10 min. In some cases this frequency is not enough, as in the example of the detection of purse-seiner fishing, in which the vessel operation is done in less than 5 min.
Edge computing is based on processing data near the edge of the specific network, where the data is being generated, instead of in a centralized data-processing location. Edge computing reduces the volumes of data that must be transmitted and, consequently, provides lower latency and reduces transmission costs. A survey about the current development and status of edge computing is found at [
18], which also discusses future research directions of edge computing. This technology approach allows giving highly responsive cloud services for mobile computing, scalability, and privacy-policy enforcement for IoT [
19].
The vessel monitor system was developed based on the paradigm of cloud computing with the transmission of data to a central system. Because of the high communication costs at sea (most cases are based on satellite communications, which is the only one available at high sea), the data collection process is in general around once every 10 min. In some cases, this time span can be a problem because, for the monitoring process, there is a loss of reaction time and the ability to identify some fishing activities such as purse-seine.
3. Proposed Approach
To overcome the traditional VMS processing power limitations, we choose an algorithms’ approach with low memory, i.e., CPU capacities to identify local patterns. These patterns are used to decide if the collected data should be immediately transmitted or at the port only.
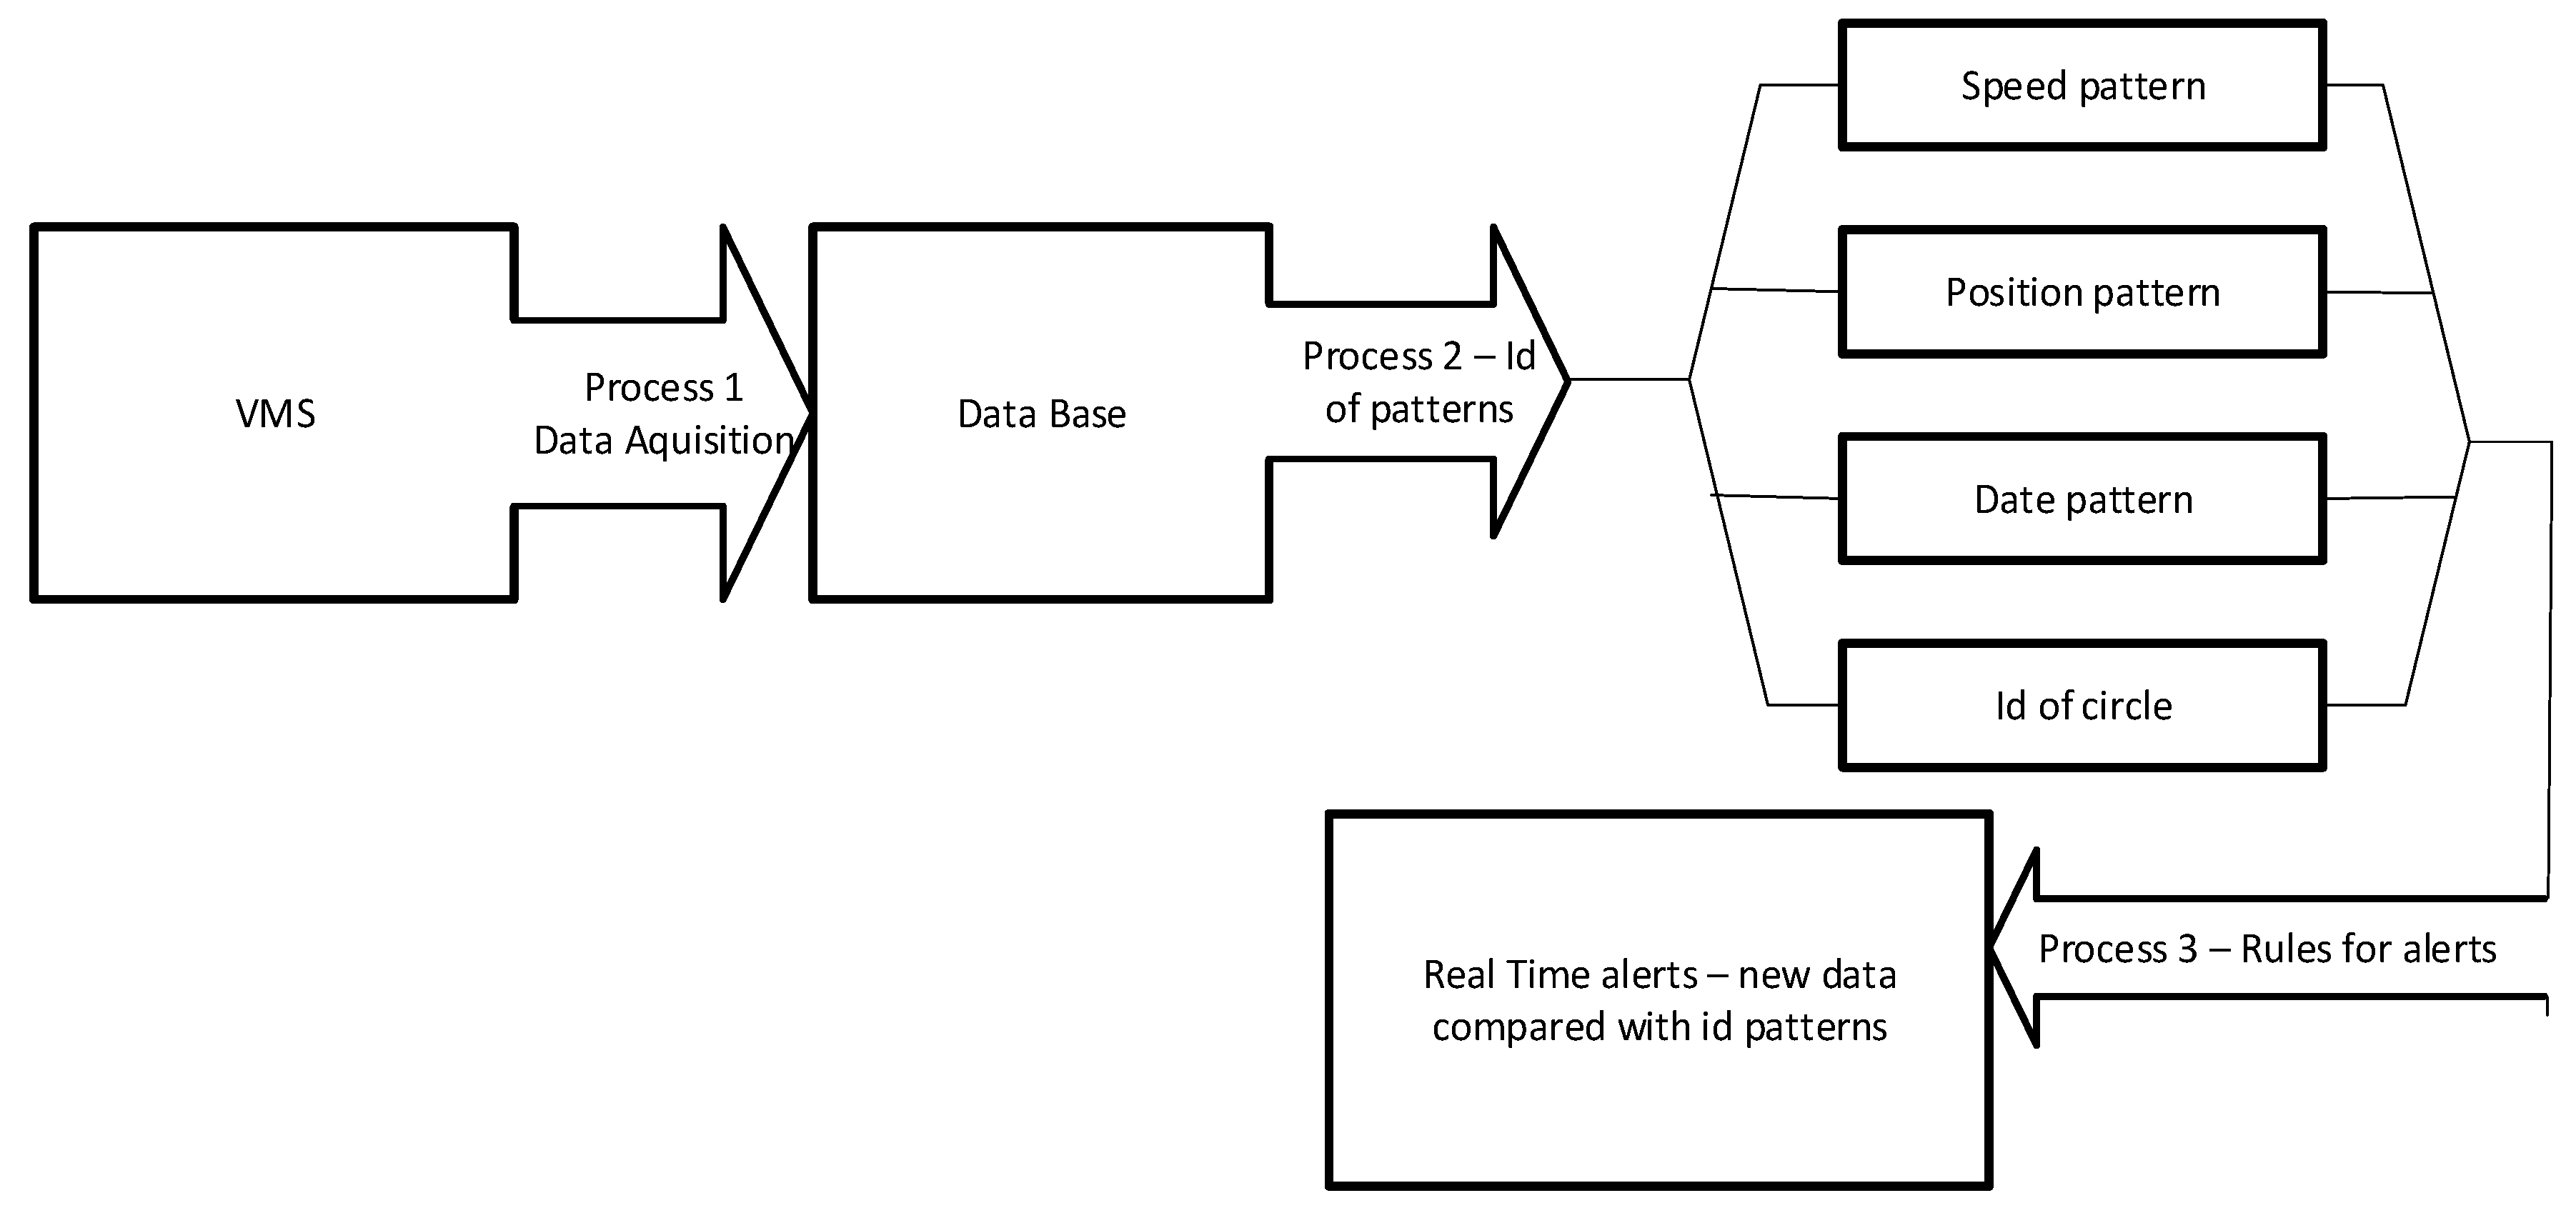
Our proposed system is illustrated in
Figure 2: to create an edge computing approach on a local VMS box that sends alerts of possible abnormal behavior for the fishing control process to legal authorities. This emergent approach fits in this monitoring process because of the need to reduce communication costs. In this case, these edge processes reduce communication costs based on the fact that data is only transmitted if out of pattern data is registered. The creation of real-time alerts of possible non-conformity actions in the fishing activity allows legal authorities to perform targeted inspections to assess possible non-conformity actions. Since most of the data is stored locally, it is possible to increase data sampling frequency to a configurable parameter with frequency of around once every one minute (process 1), create data patterns based on historical data (process 2) and feed an alarm process based on these patterns (process 3), implemented in a decision tree process associated with configurable probability parameters. These processes together are the basis for the edge computing approach.
In a more detailed way, the three processes used in this Monicap system (VMS), in which an edge computing approach is implemented, are as follows:
Process 1: Creates a local database in SQL (structured query language) and sets the sampling time based on a configurable parameter. For each vessel, data is collected and stored locally on the VMS system.
Process 2: Implements a mining processes to identify patterns on VMS data (speed, position, date, and course direction). Taking into account the data collection process periodicity (which is a configurable parameter), it is possible to identify patterns for:
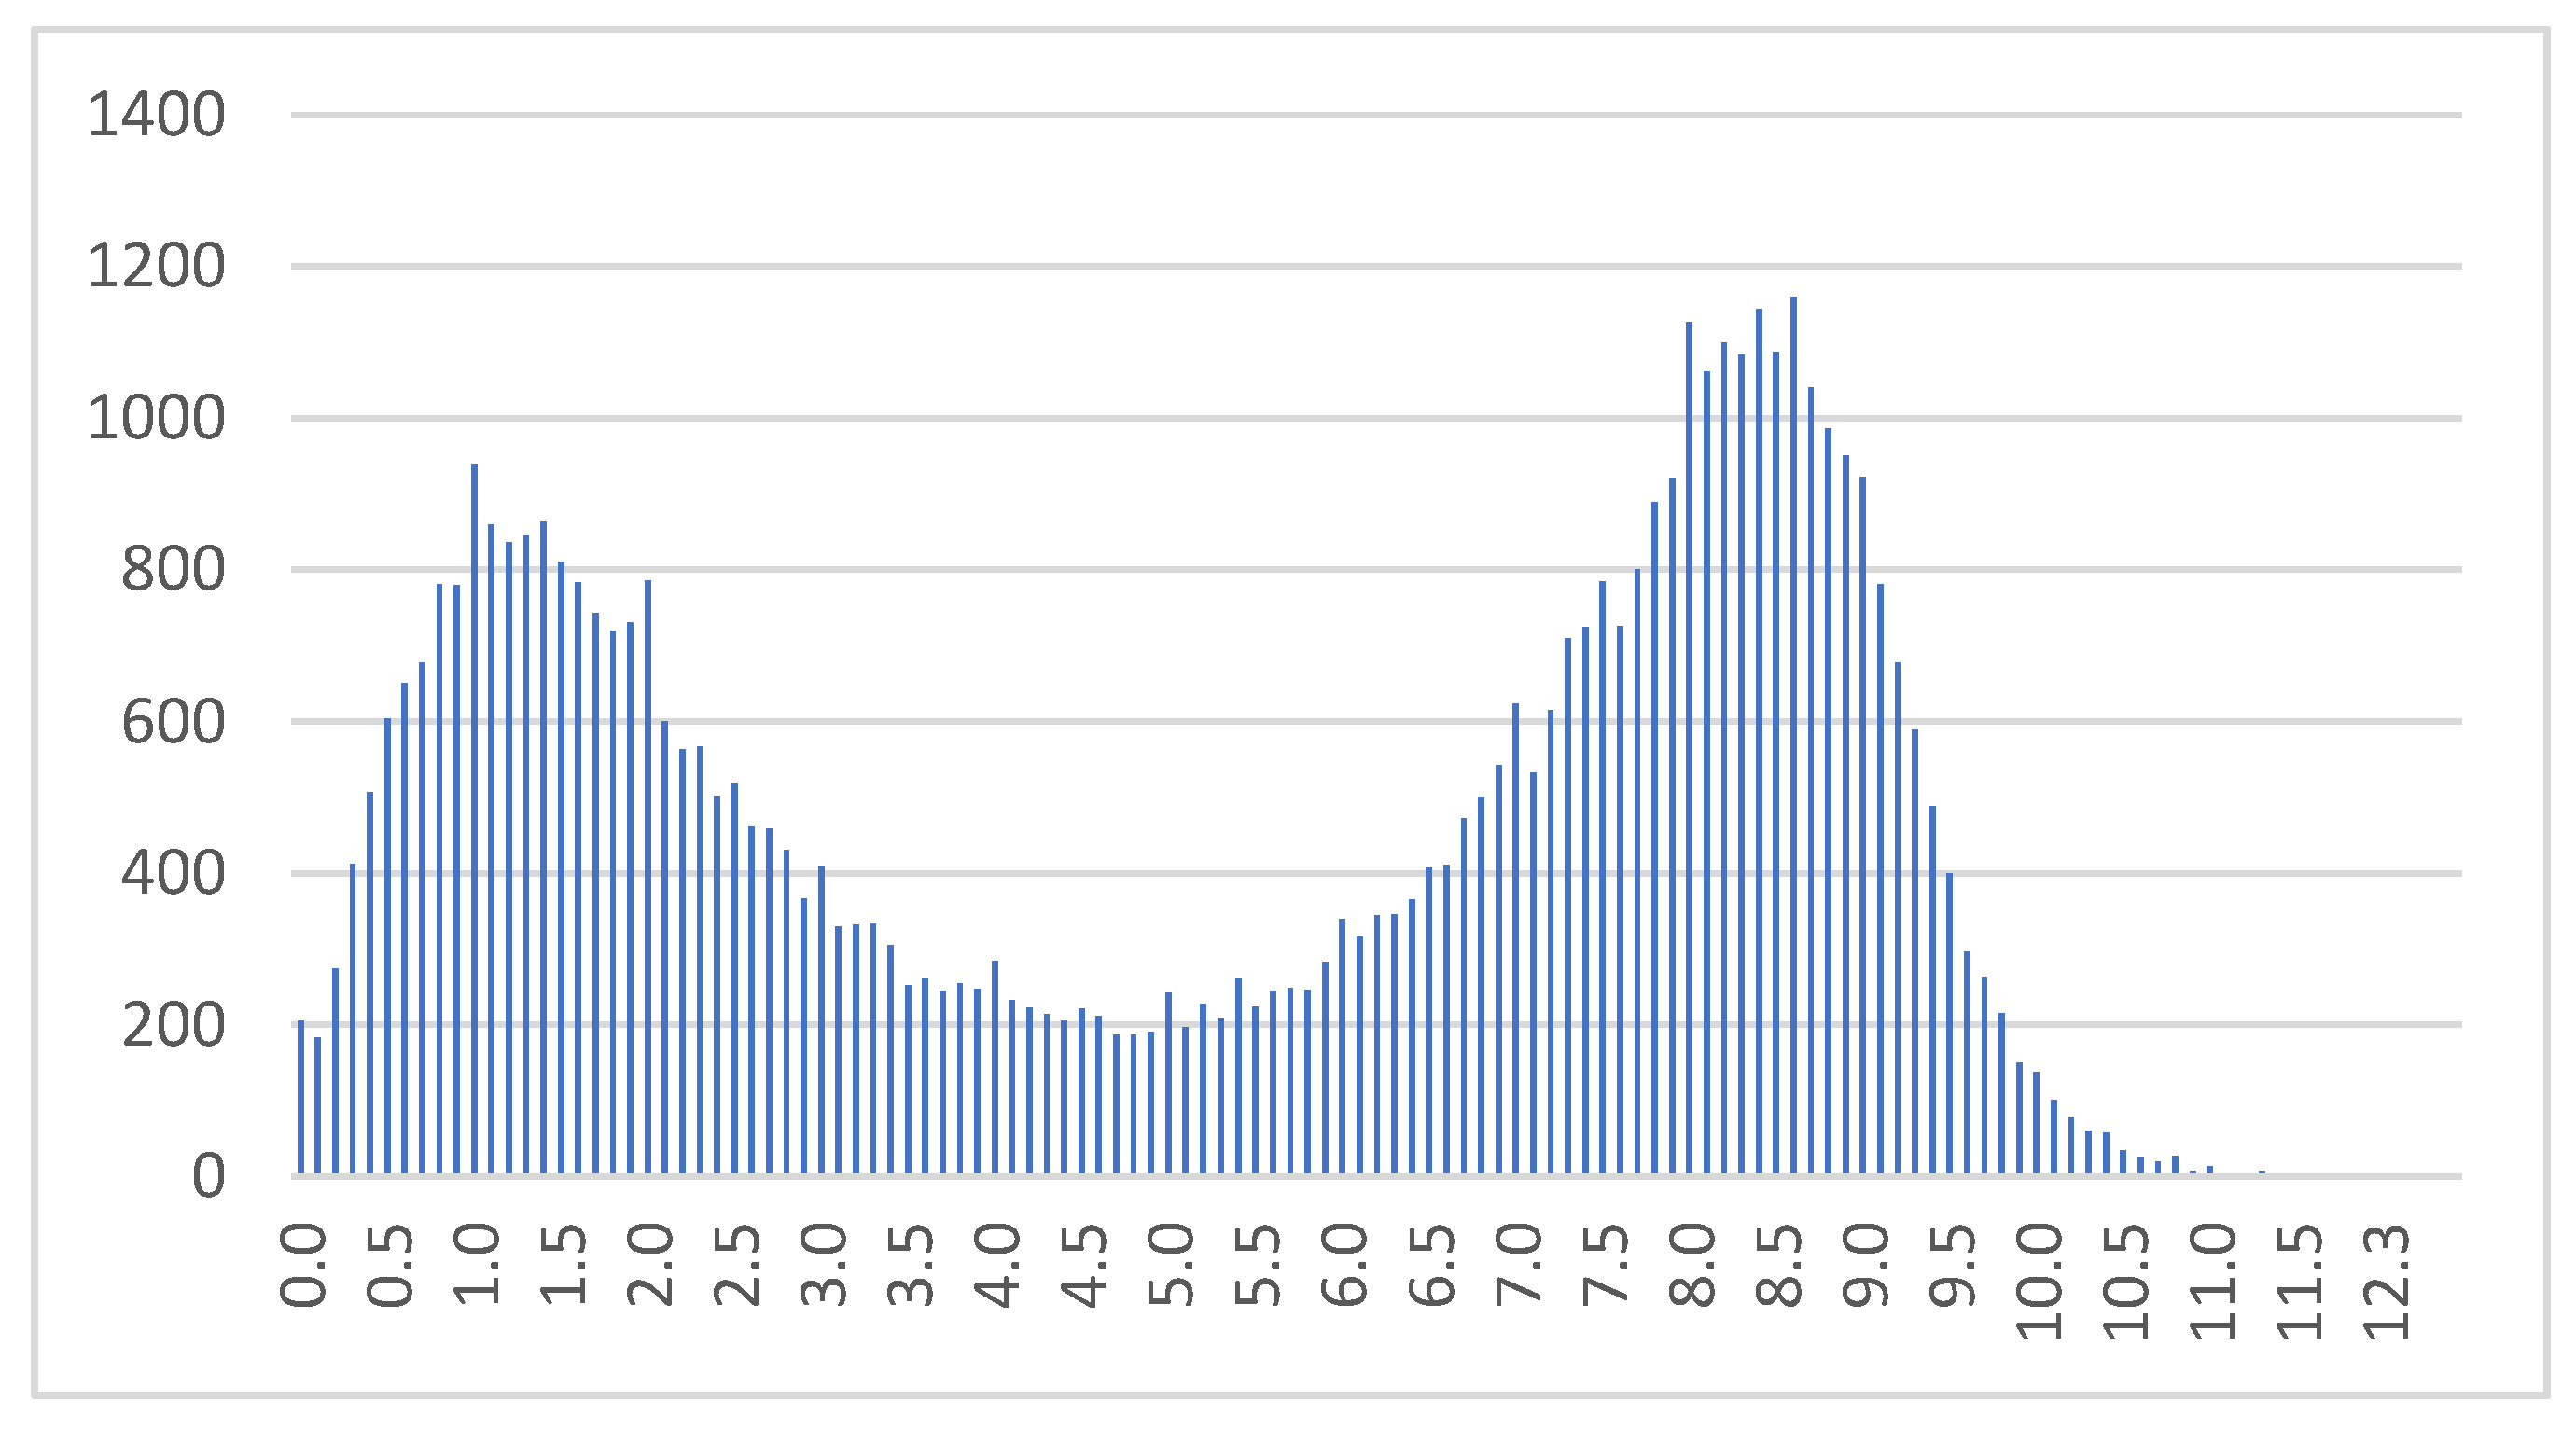
Speed: Based on the velocity data collected, a statistical distribution is applied to group speed in discrete classes. From the usual curve we have two gaussian curves, visible in
Figure 3, where the highest speed corresponds to the movement of the vessel to and from fishing zones and ports, and the lowest speed is associated with the fishing activity. The smallest gaussian velocity, with an associated probability, can indicate the type of fishing as a function of the speed. This analysis is applied to each vessel and, thus, has personalized information on the speed standards of fishing and can be customized based on the function of the time of the year and the fishing zone.
Geographic position: There is an implementation of the K-means, heat maps, and BDscan algorithm for the identification of the fishing areas according to the time of the year and the vessel. This process comprises the implementation of the algorithm referred to in the embedded system, which allows to group data and creates a computational representation of the associated region, allowing fishing zones to be able to be represented computationally in a simple way: identification of rectangles, circles, or other polygons. These clustering algorithms were implemented based on low computer power applied.
Change of direction: Taking into account changes in the course of the vessel, one can calculate the total rotation performed in a time interval and get the angular velocity. These parameters (total rotation and speed angular) allow inference or exclusion, with some degree of certainty, of the activity exerted at a certain moment by the vessel.
A good example is the fishing of the siege, which is characterized by the fact that the vessel completely circumvents the shoal in a short time interval (a few minutes). On the one hand, trawling requires that only minor adjustments are made to the vessel, so the 10 min transmission is enough. The net is maximized when it moves in a straight line, but the net weight itself greatly limits the performance of the vessel by preventing it from being able to make major changes to its course.
- 3.
Process 3: Comprises the implementation of a decision tree with four levels, taking into account the standards identified in process 2 output, for the analysis of the data flow created against the standards mentioned above. This comparison can be performed based on the vessel’s data or on standards of fisheries identified at the central system by analyzing the patterns of different vessels.
This process generates data alerts when deviations from the patterns are identified and associates them with a probability. The implementation of the four defined levels, with questions of yes or no (chosen depending on the defined probability threshold), allow the alerts above to be transmitted to supervisory authorities.
Portugal has one of the most extensive EEZ in proportion to its surface, and IUU needs to be controlled. Xsealence company (
https://www.xsealence.pt/) applied this proposal to the Portuguese fishing fleet in 2018 and 2019, in an initial pilot of 50 vessel that covers all fishing activity (for details see
Section 4).
3.1. Analysis of the Speed Profile
To know whether a vessel is fishing or not we can use its velocity patterns, given that the speed of the vessel differs when it is traveling and when it is fishing. We can verify this fact by observing the graphic shown in
Figure 3, corresponding to vessel 2 of our study.
The histogram allows for the recognition of two different velocity patterns, identified by two distinct distributions that are visible when the data on the velocity of each of the vessels is graphically represented. The part of the distribution showing lower average speeds corresponds to fishing activity, and the other (higher) speed observations correspond to the movement of the vessel between the port and the fishing sites. So, it is needed to isolate the first distribution’s range to be able to classify the upcoming velocity’s as connected to fishing or not.
To isolate the first distribution, the hill-climbing algorithm [
20] was used. This algorithm is a local optimization algorithm that provides a direct search. The Stochastic hill-climbing algorithm works supported in an iterative process of randomly selecting a neighbor for a candidate solution. The acceptance of the solution is conditioned by an improvement criterion concerning the previous solution.
The implementation used was altered in a way that when the algorithm converges to the maximum, it will continue to find the limit of the distribution.
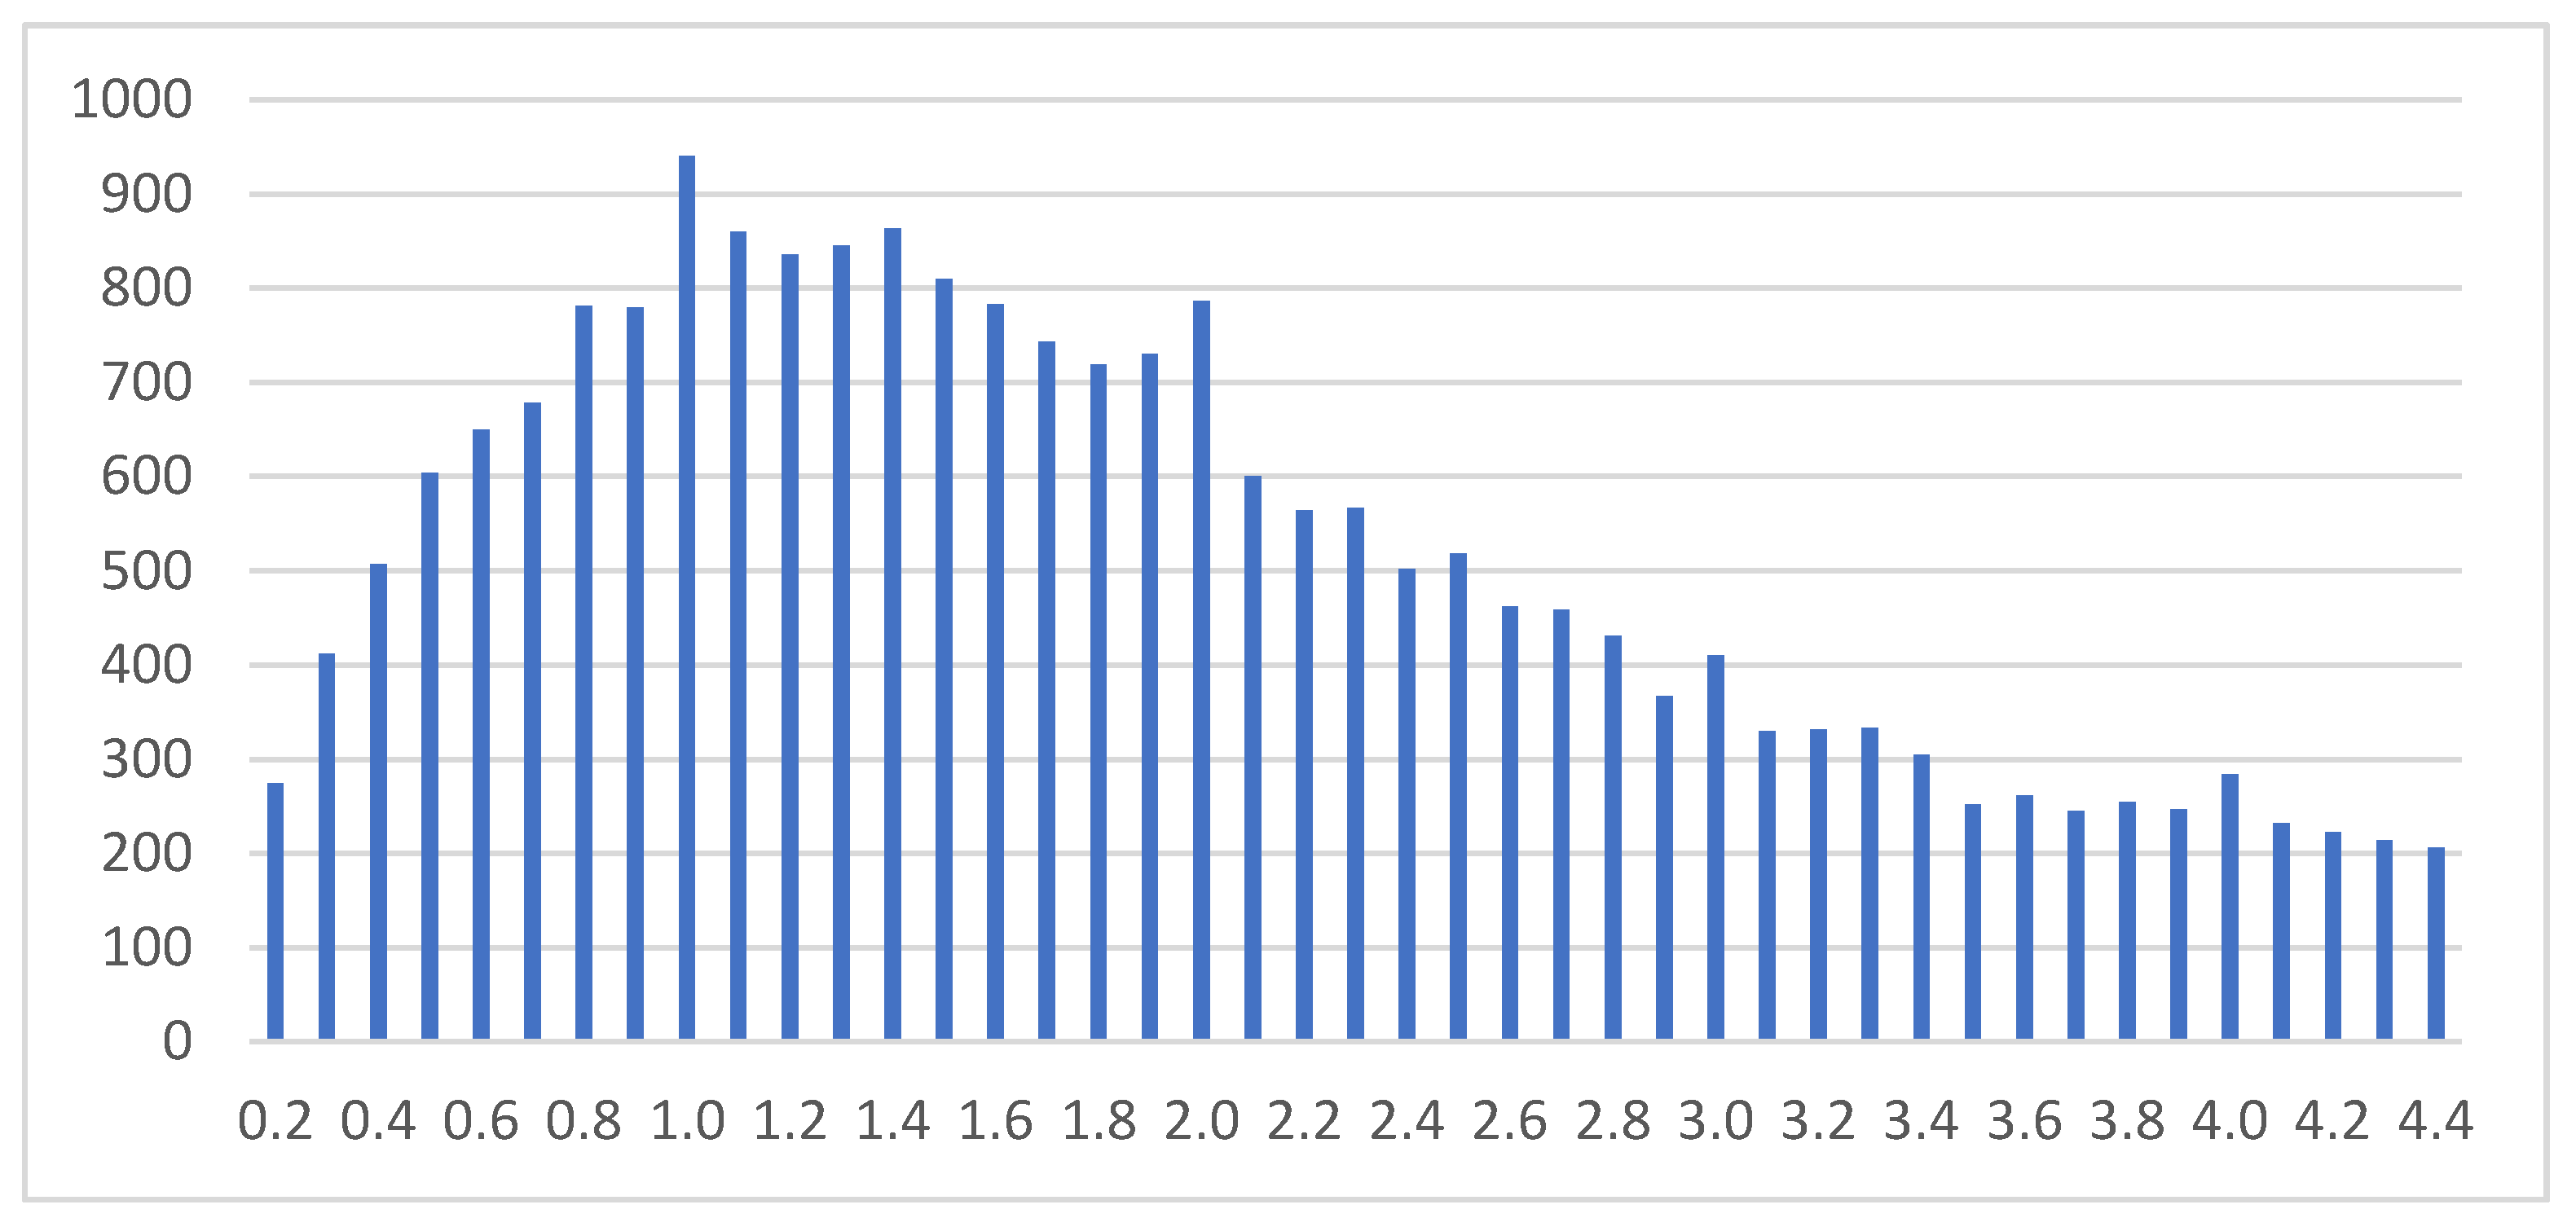
To obtain this solution, the algorithm searches for the first local maximum that does not have a higher value in the following three points (current key + 0.5, current key + 1 and current key + 2). This way, we can find the maximum value of the fishing speed range.
To find the end of the fishing speed range, the algorithm continues to sweep the histogram until the next three points are not lower than the current point. This way, we can end up with a histogram of the intended distribution as we can observe in
Figure 4.
Once the distribution corresponding to the fishing speeds has been identified, the next step is to define a range to classify the new data, minimum speed, and maximum speed.
Within this range, the vessel is classified as being fishing. With this purpose, three optional procedures were considered:
Standard variation: This solution assumes that the velocity distribution is a normal distribution. Using the distribution of the fishing velocity, it is possible to find the fishing velocity with more occurrences. Taking into consideration the standard variation, it is possible to define a distance from the mean and so the minimum population desired (explained by Chebyshev’s inequality [
21]) to be within the fishing range can be identified.
Kernel Density Estimation: Kernel density estimation estimates the probability of the density function by imposing a model function on every data point and then adding them together. The function applied to each data point is called a kernel function [
22].
Filter: By using a filter that removes all the velocity occurrences that happen less than 10% of the maximum occurrence and isolating the occurrences that are followed, it is possible to retrieve a clean distribution of the fishing speed of a vessel. With this, it is possible to use the first and last values of the distribution to classify the new inputs. To isolate the fishing speed, the hill climb algorithm can be used, assuming that the first distribution is the fishing speed.
The used procedure was performed in two parts: it started with the use of the method based on the filter to isolate the fishing speed from the remain; then, the Kernel distribution method was applied. The purpose of their use is as follows:
Filter: In the first step, it retrieves all the velocity data from the database to create a histogram such as the one shown in
Figure 3. In the next step, it uses the hill-climbing algorithm to get the minimum and the maximum value of the first distribution. Velocity 0 was removed as we did not want to consider when the vessel is completely stopped.
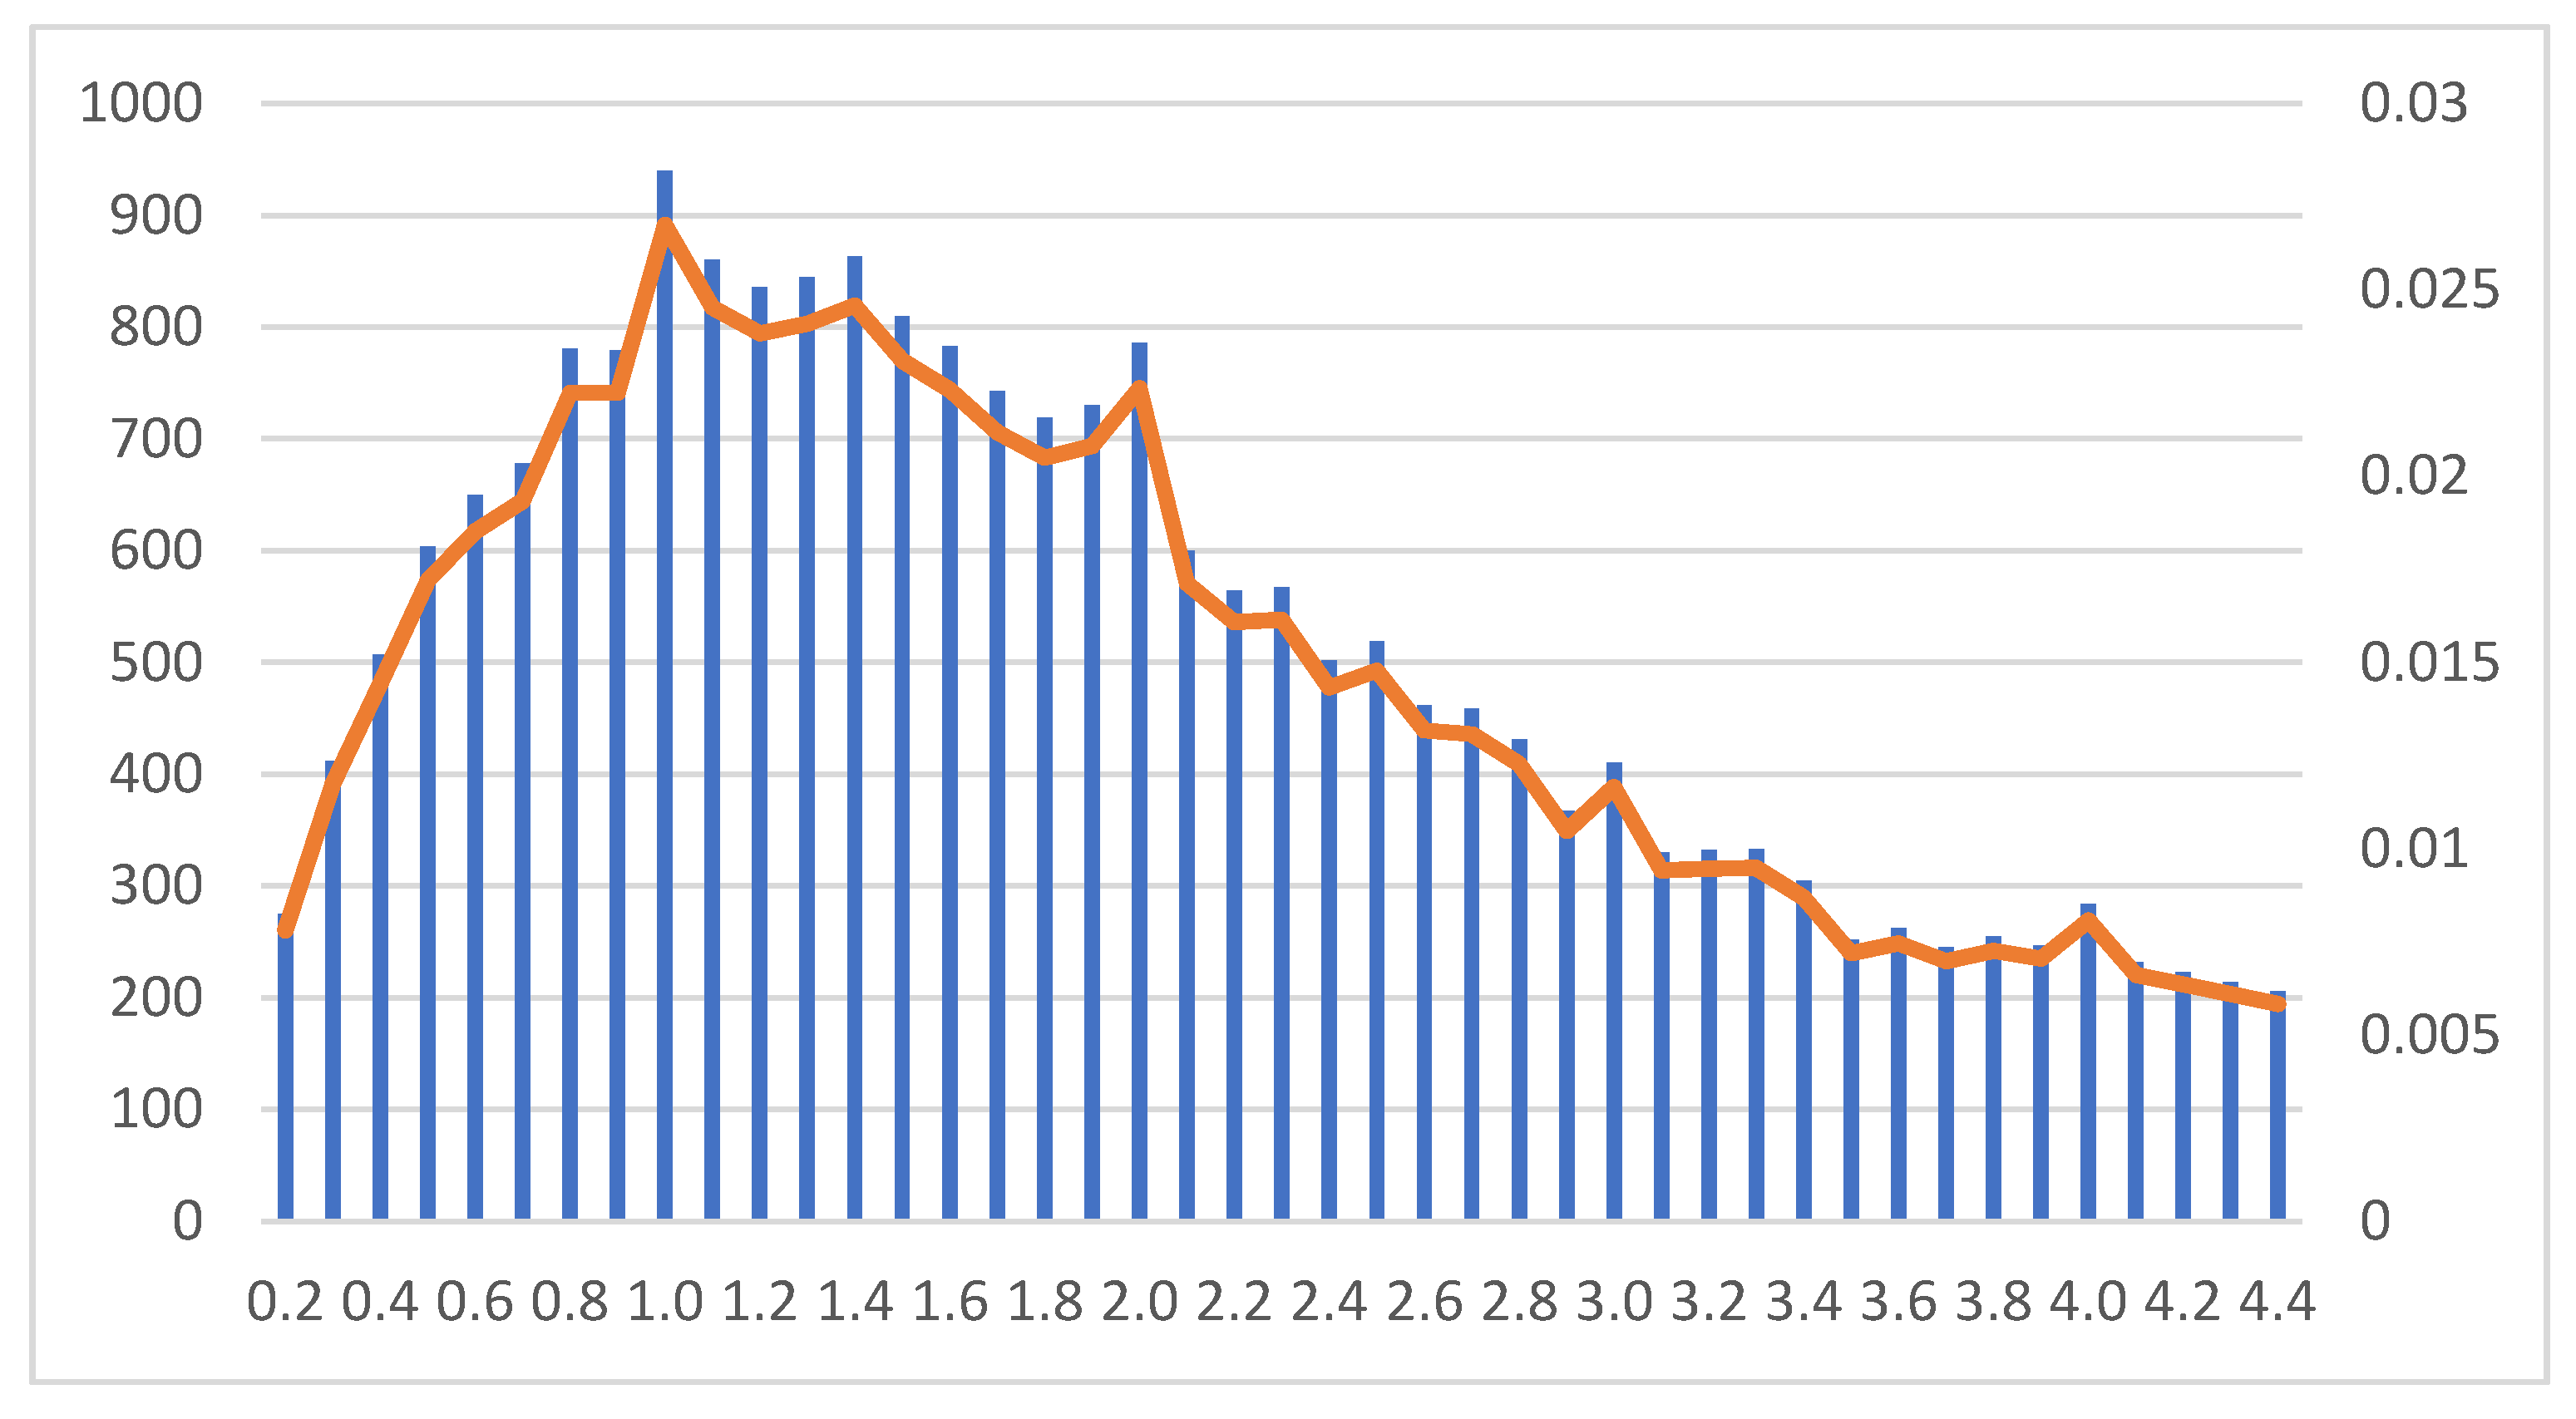
Kernel: A Kernel distribution method was applied in the filtered histogram to have the distribution represented in orange in
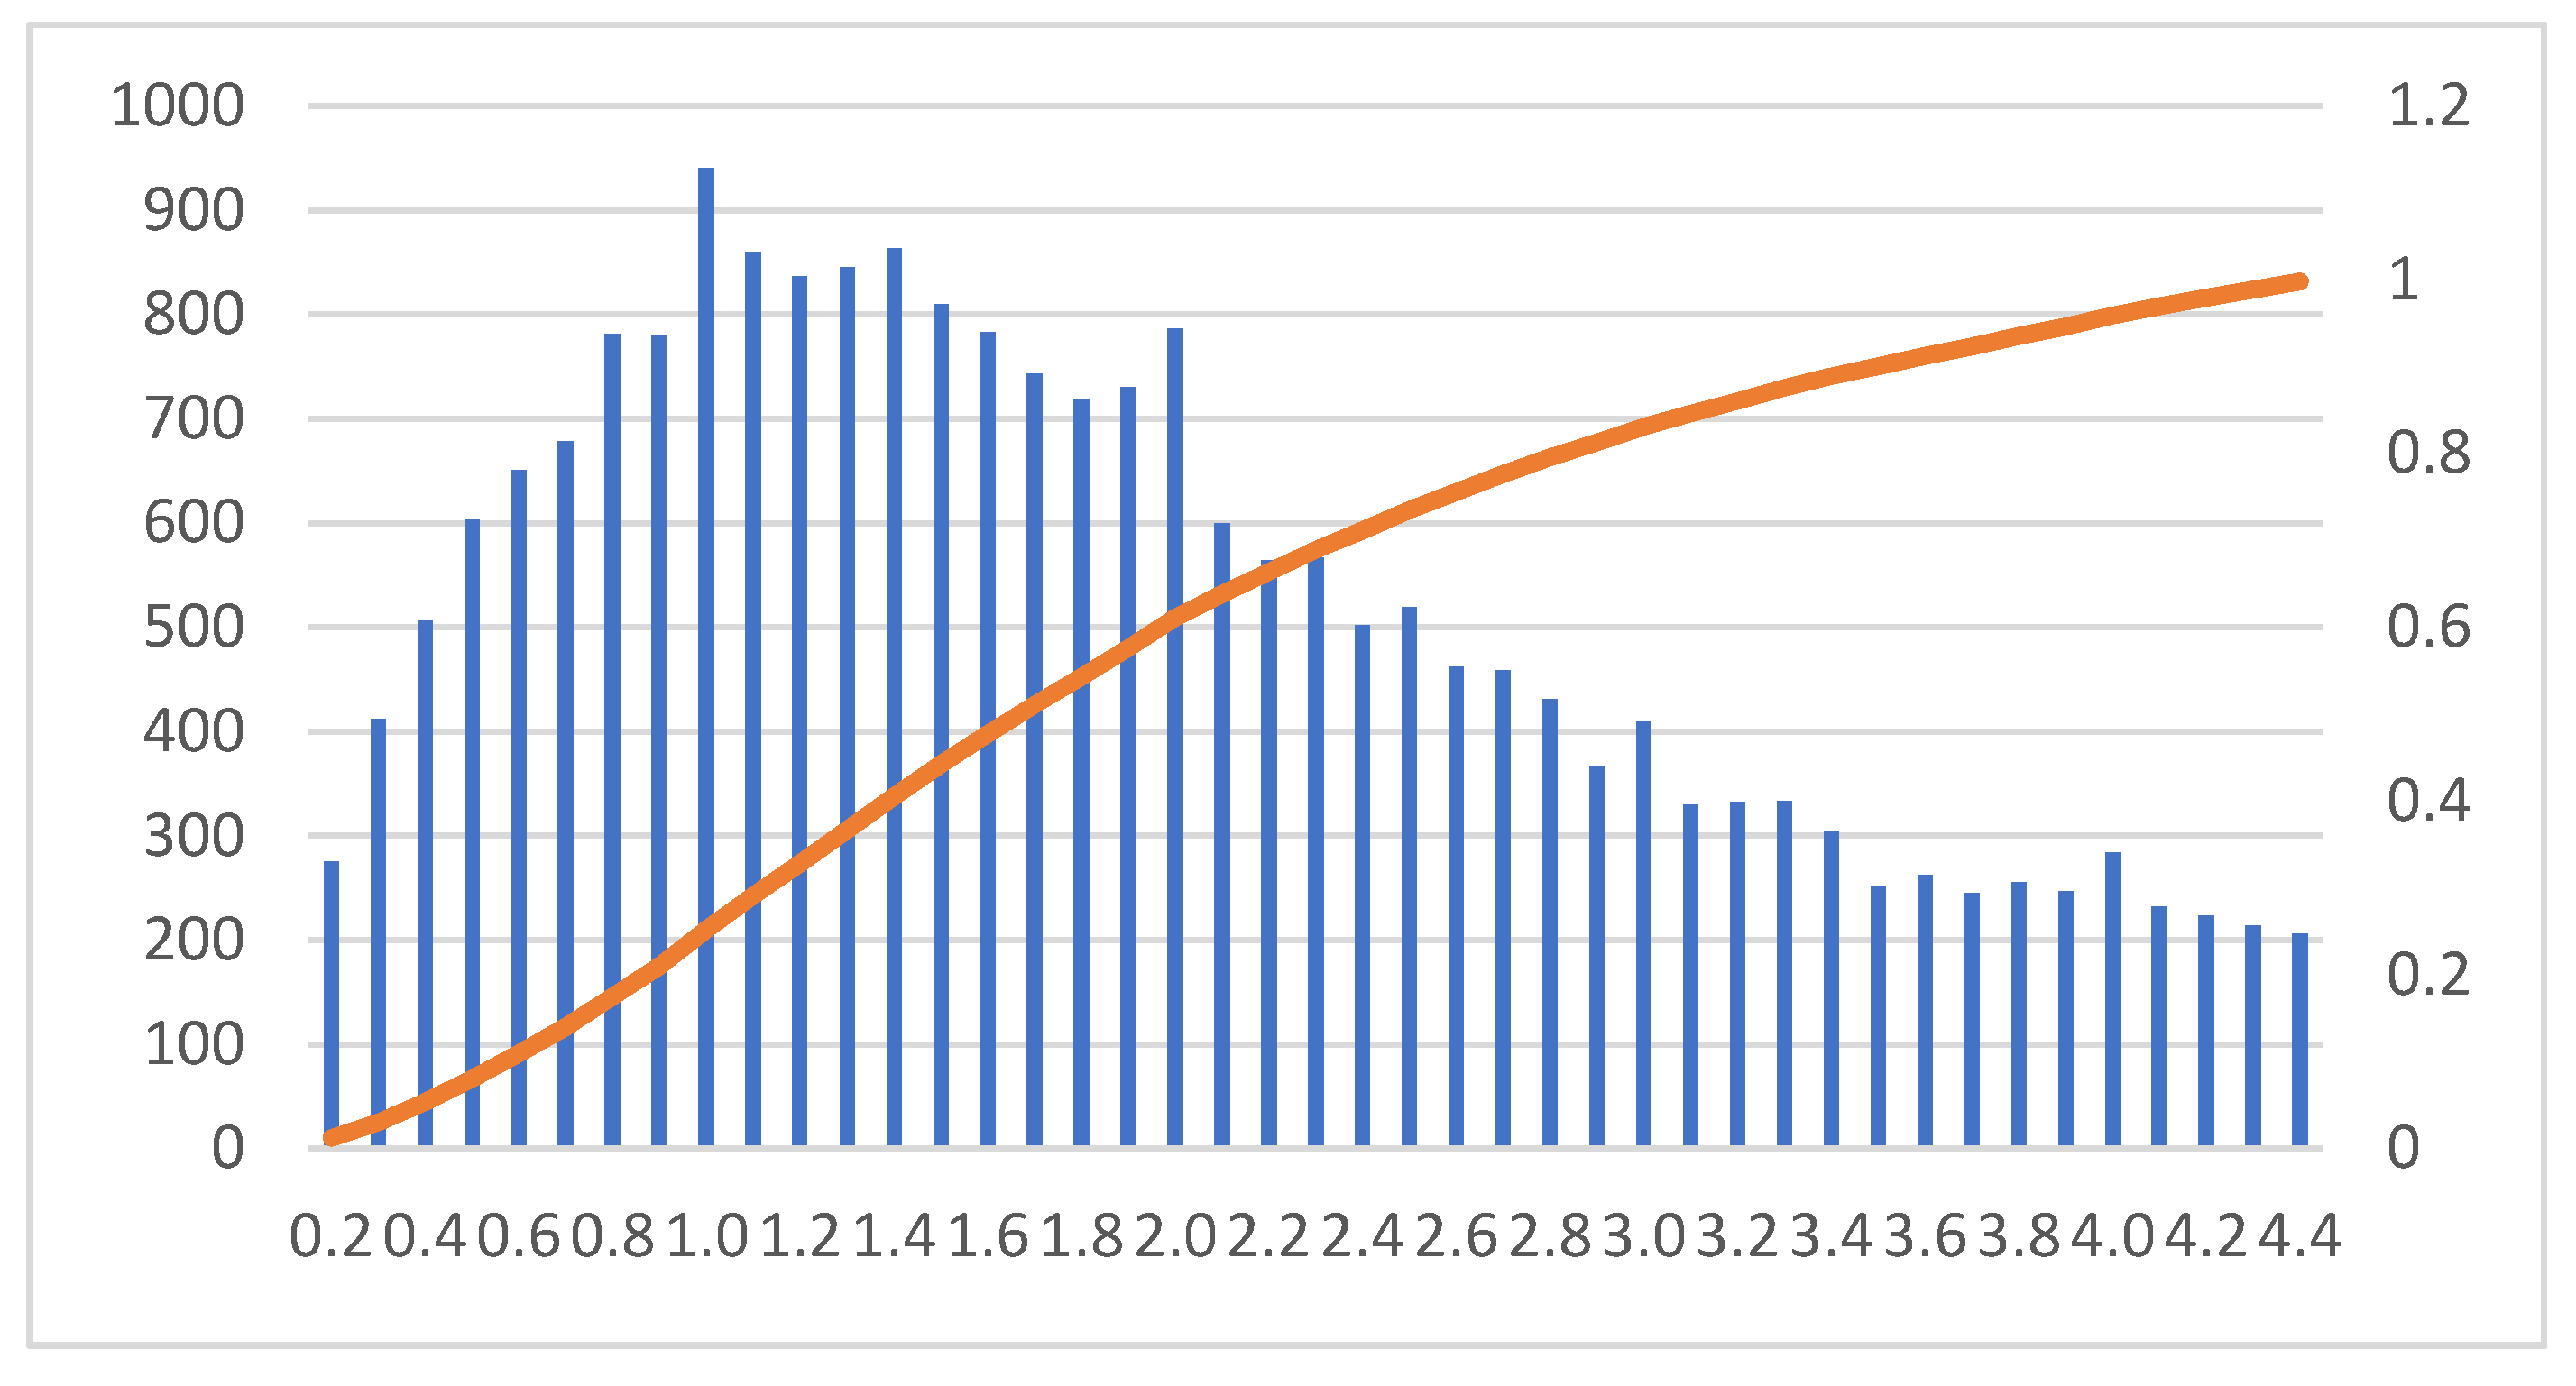
Figure 5. A dictionary with the velocities and the cumulative percentage of velocity was created. This led to a histogram such as the one shown in
Figure 6 [
23].
Then, a range across quartiles is defined for probability. As in the estimation of confidence intervals, a confidence level is defined here as well, which will be associated with the two-speed limits that correspond to the fishing activity.
Once these limits are set, it is possible to compare the new data with the established limits. If the new data is within limits, it is classified as fishing. Otherwise, it is classified as not fishing.
Fishing Spots: Using the history of GPS locations by vessel, it is possible to identify whether the vessel is fishing in its regular fishing zone or in a new location. Fishing in different zones may mean two distinct options: either the vessel has changed its type of fishing, or the vessel may be performing some operation outside legality.
Figure 7 shows the GPS points of a vessel. Using methods based on clustering, it is possible to identify several zones that are the normal fishing zones of that vessel. When the vessel is outside those zones, an alert should occur.
Using the fishing velocity range identified in the previous steps, we get the GPS points of the vessel within that range. Consequently, it is possible to work only with the positions where the vessel was fishing (see
Figure 7). The next step is to use a clustering algorithm to define the fishing zones so that we can compare them with the new GPS points.
3.2. Clustering Geographic Position
Several approaches were applied to determine the geographic clustering position of fishing points, such as: K-means, density-based cluster, and DBScan. The output is the identification of the usual fishing zones for each vessel. If newly collected data identifies the vessel as being outside these zones, data is sent and possible alerts can be generated.
K-means [
23] is a cluster unsupervised learning algorithm that divides the partition of n geographic measurements into K clusters, in which each observation belongs to the cluster with the nearest mean. This approach divides the space into K zones. K-means [
23] is one of the simplest algorithms that solve the well-known clustering problem, with low CPU and memory usage. The main issue with its implementation is the definition of K, which is not easy to define among a diversity of fishing vessels. The K centroids are stored at the vessel, so that it is possible to compare the collected data with a distance to this centroid. If a set of new alerts is identified in a short-range period (configurable parameter), the K-means algorithm is performed with K + 1, because it is very likely that this is a new fishing zone.
Density-based cluster: Density-based clustering algorithms [
24] is another implemented approach that complements the previous with the need of computer CPU and memory. This algorithm finds clusters based on the estimation of the density of data points in a region. This approach has the advantage of finding fishing zones without a previous definition of the number of clusters (K). Based on the GPS collected data, the algorithm clusters are dense regions in the data space, separated by regions of lower object density (noise) [
25].
The conceptual approach of density-based clustering is that for each instance of a cluster, the neighborhood of a given radius (Eps) must contain at least a minimum number of instances (Min Pts). This approach allows for the identification of newly collected data out of this cluster (with a radius to the group centroid bigger than the other group elements to this centroid).
DBScan: DBScan is a density-based spatial clustering for data with noise [
26]. It is a density-based clustering algorithm, because it works based on data density distribution points.
After some testing during 2018, and based on
Table 1, it was decided that the DBScan is the best approach for this case.
Between the K-means algorithm and the density-based cluster algorithms, it was decided that the density-based cluster was of great advantage to identify the probability of the new GPS point belonging to a cluster in the probabilistic cluster distribution. Consequently, the user can define what the best configuration is for his case. The clusters themselves are equal between K-means and density-based cluster, as density-based cluster uses K-means to define the centroid—it only differs by adding a layer to define the area of density per cluster.
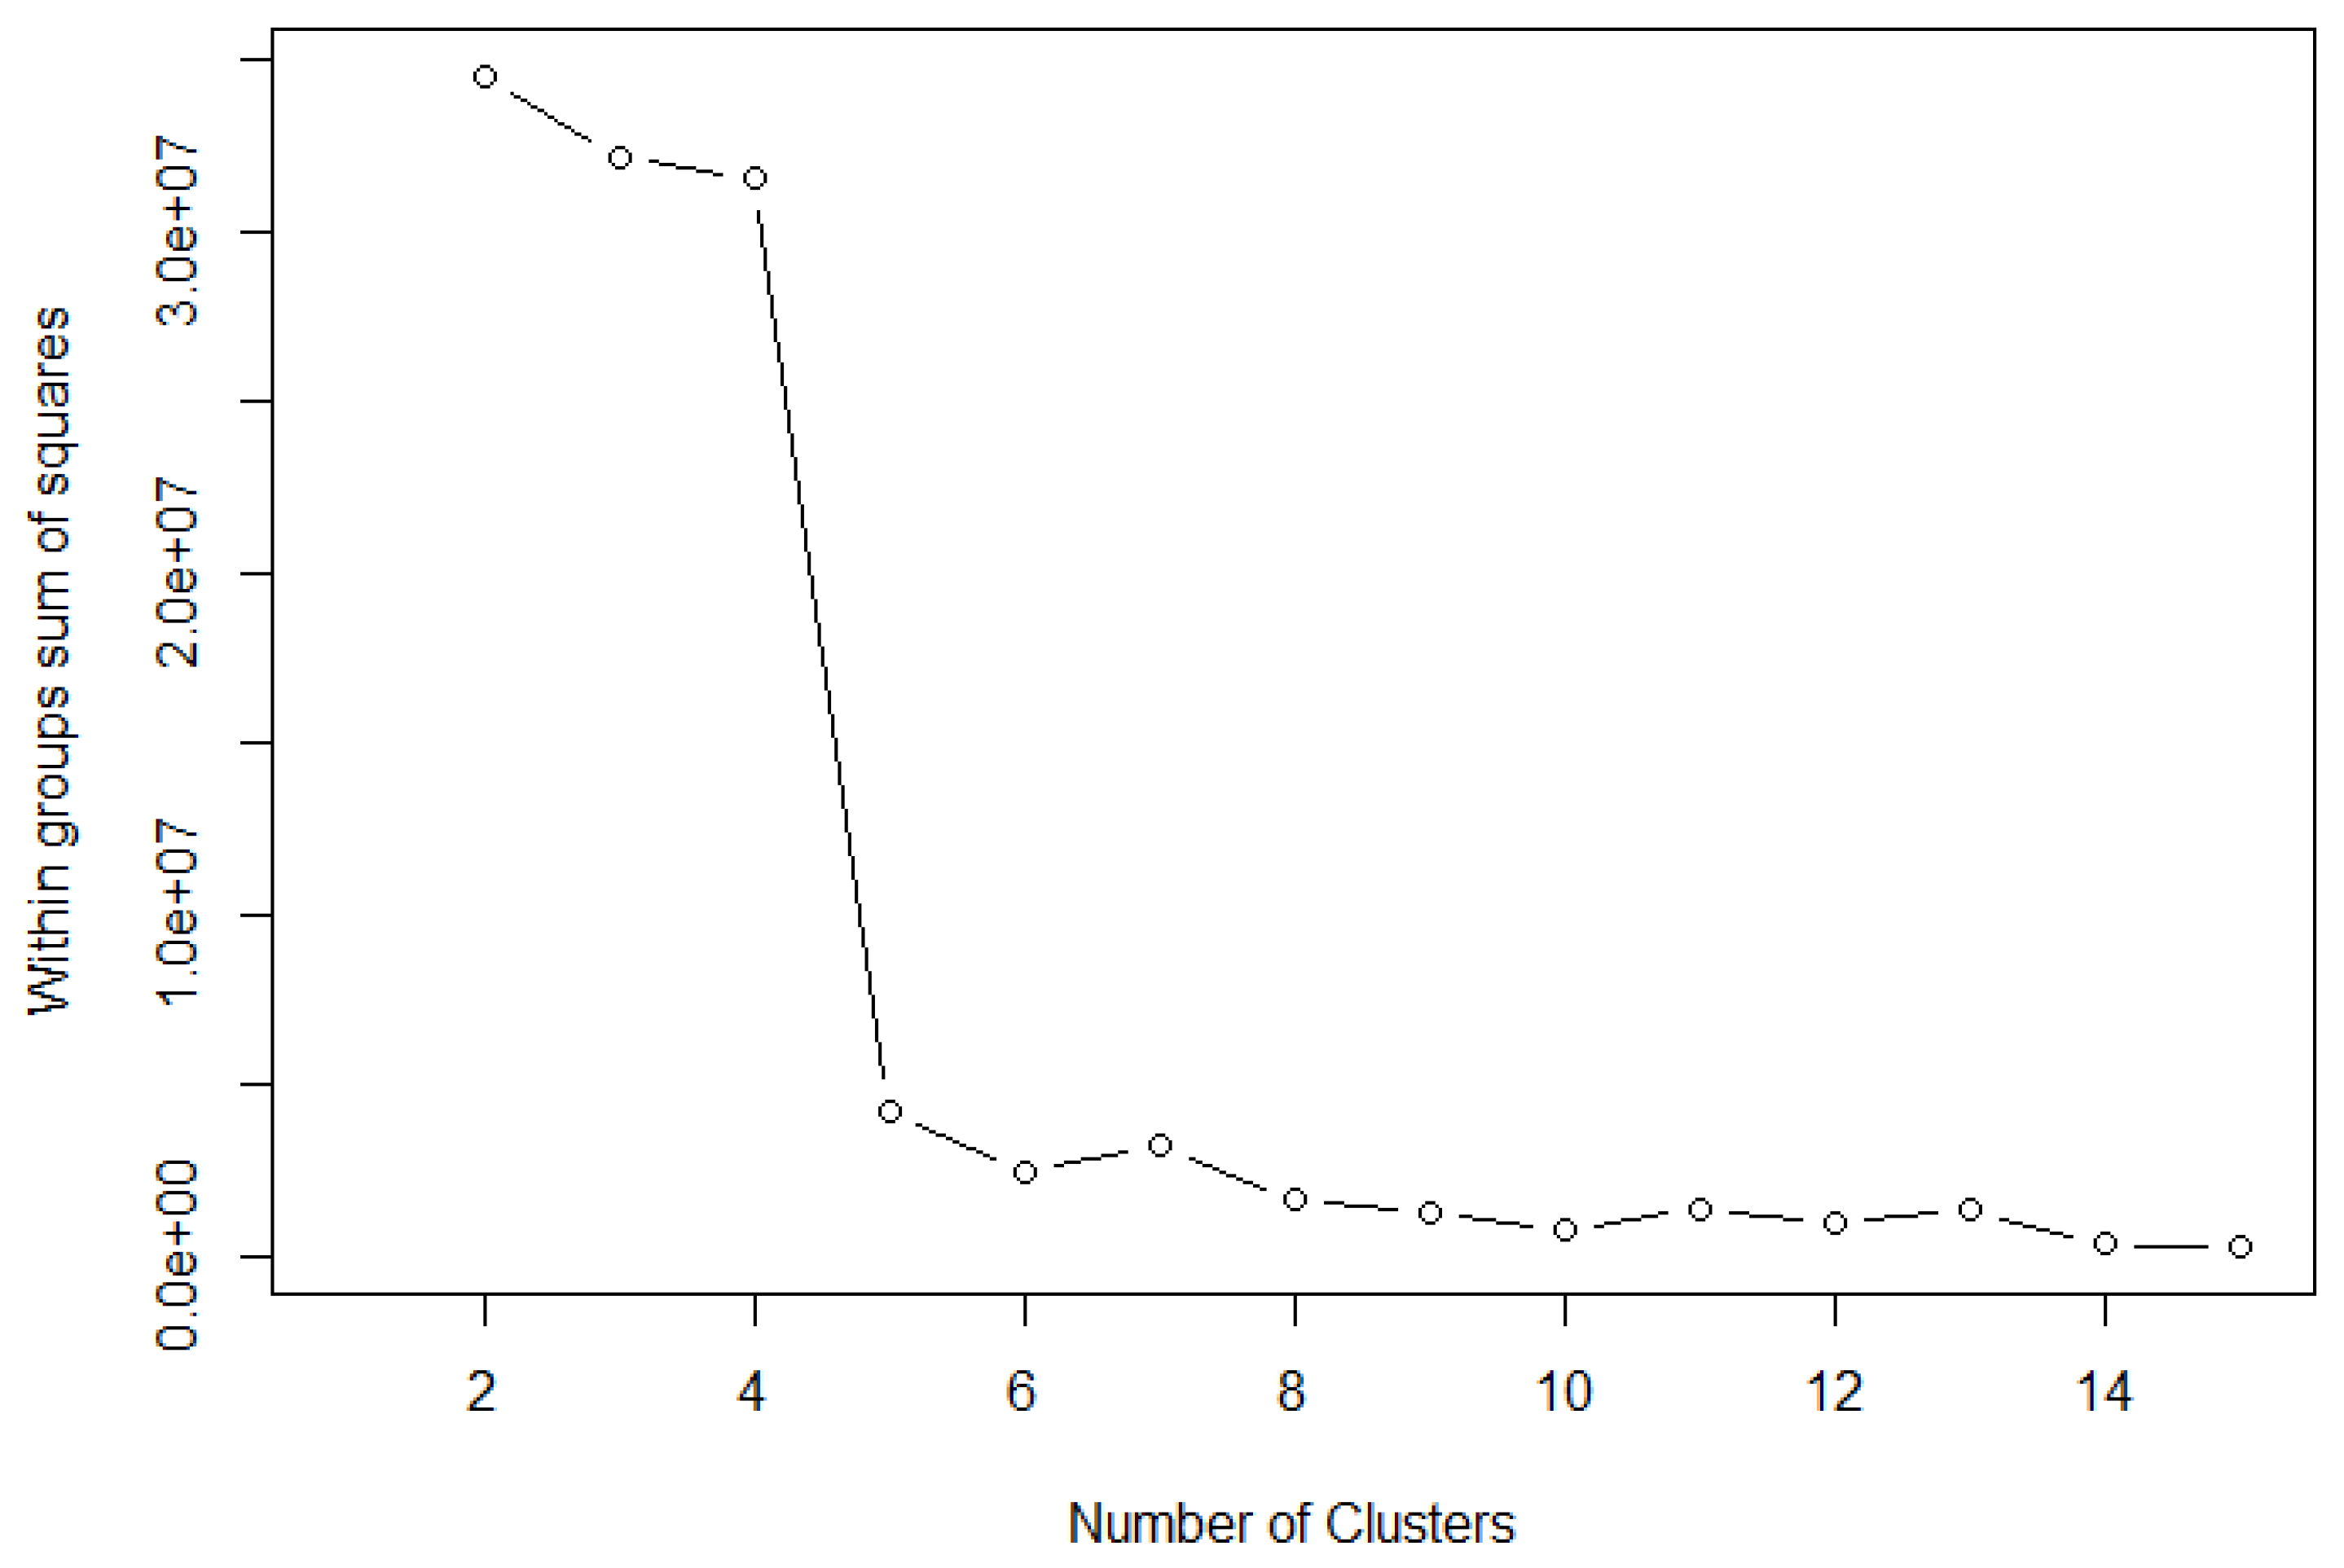
To decide the number of clusters, the elbow method [
27] was used for the within-cluster sum of squares, as can be seen in
Figure 8. Sum of squared error by number of clusters. The within means the distance the vectors in each cluster are from their respected centroid. The goal is to get this number as small as possible. One approach to handle such objective is to run the K-means clustering multiple times, raising the number of the clusters each time. Then it is possible to compare the within each time, stopping when the rate of improvement drops off. The better case corresponds to find a low within while still keeping the number of clusters low.
The elbow method is visual. The idea is to start with K = 2, and keep increasing it in each step by one unit, calculating the clusters and the cost that comes with the training. At some value for K the cost drops dramatically, and after that, it reaches a plateau when you further increase it—this is the K value we want. We can observe that six clusters are a good number, as the error is not decreasing much as the number of clusters increases. To exemplify, the data used in
Figure 8. Sum of squared error by number of clusters is from the GPS points.
3.3. Direction Analysis
We intend to explore the possibility of establishing an angular velocity profile of a vessel in order to be able to identify whether it belongs to a specific type of fishing technique, as each technique requires a particular vessel behavior. The purse-seiner fishing technique is characterized precisely by performing a circular route in the fishing. This approach is used only for purse-seiner identification.
Purse-seiners are long nets deployed hanging vertically from floats around schooling fish on or near the surface by the vessel or by a separate skiff. To avoid fish from escaping, the circle is performed quickly at high speeds averaging around 10 knots. The circle radius depends on the vessel and is detected from direction velocity. After the circle is defined, the net is closed around the fish to the end of the fish bailing operation when the net is lifted out of the water. During this last operation, the vessel stays more or less stationary with speed less than 2.5 knots.
If the vessel is detected as conducting a movement similar to the one required by the purse-seiner technique and it is not licensed to it, an alert is issued.
3.4. Temporal Analysis
Temporal patterns allow identifying working periods based on date and time. They are used at the beginning of the trip and do not have a great effect on this local process for the identification if the data was to be transmitted. After testing with data from a year period (2018), it was decided not to implement this analysis due to the fact that unclear patterns were identified during the test year.
4. Edge Computing Implementation Process
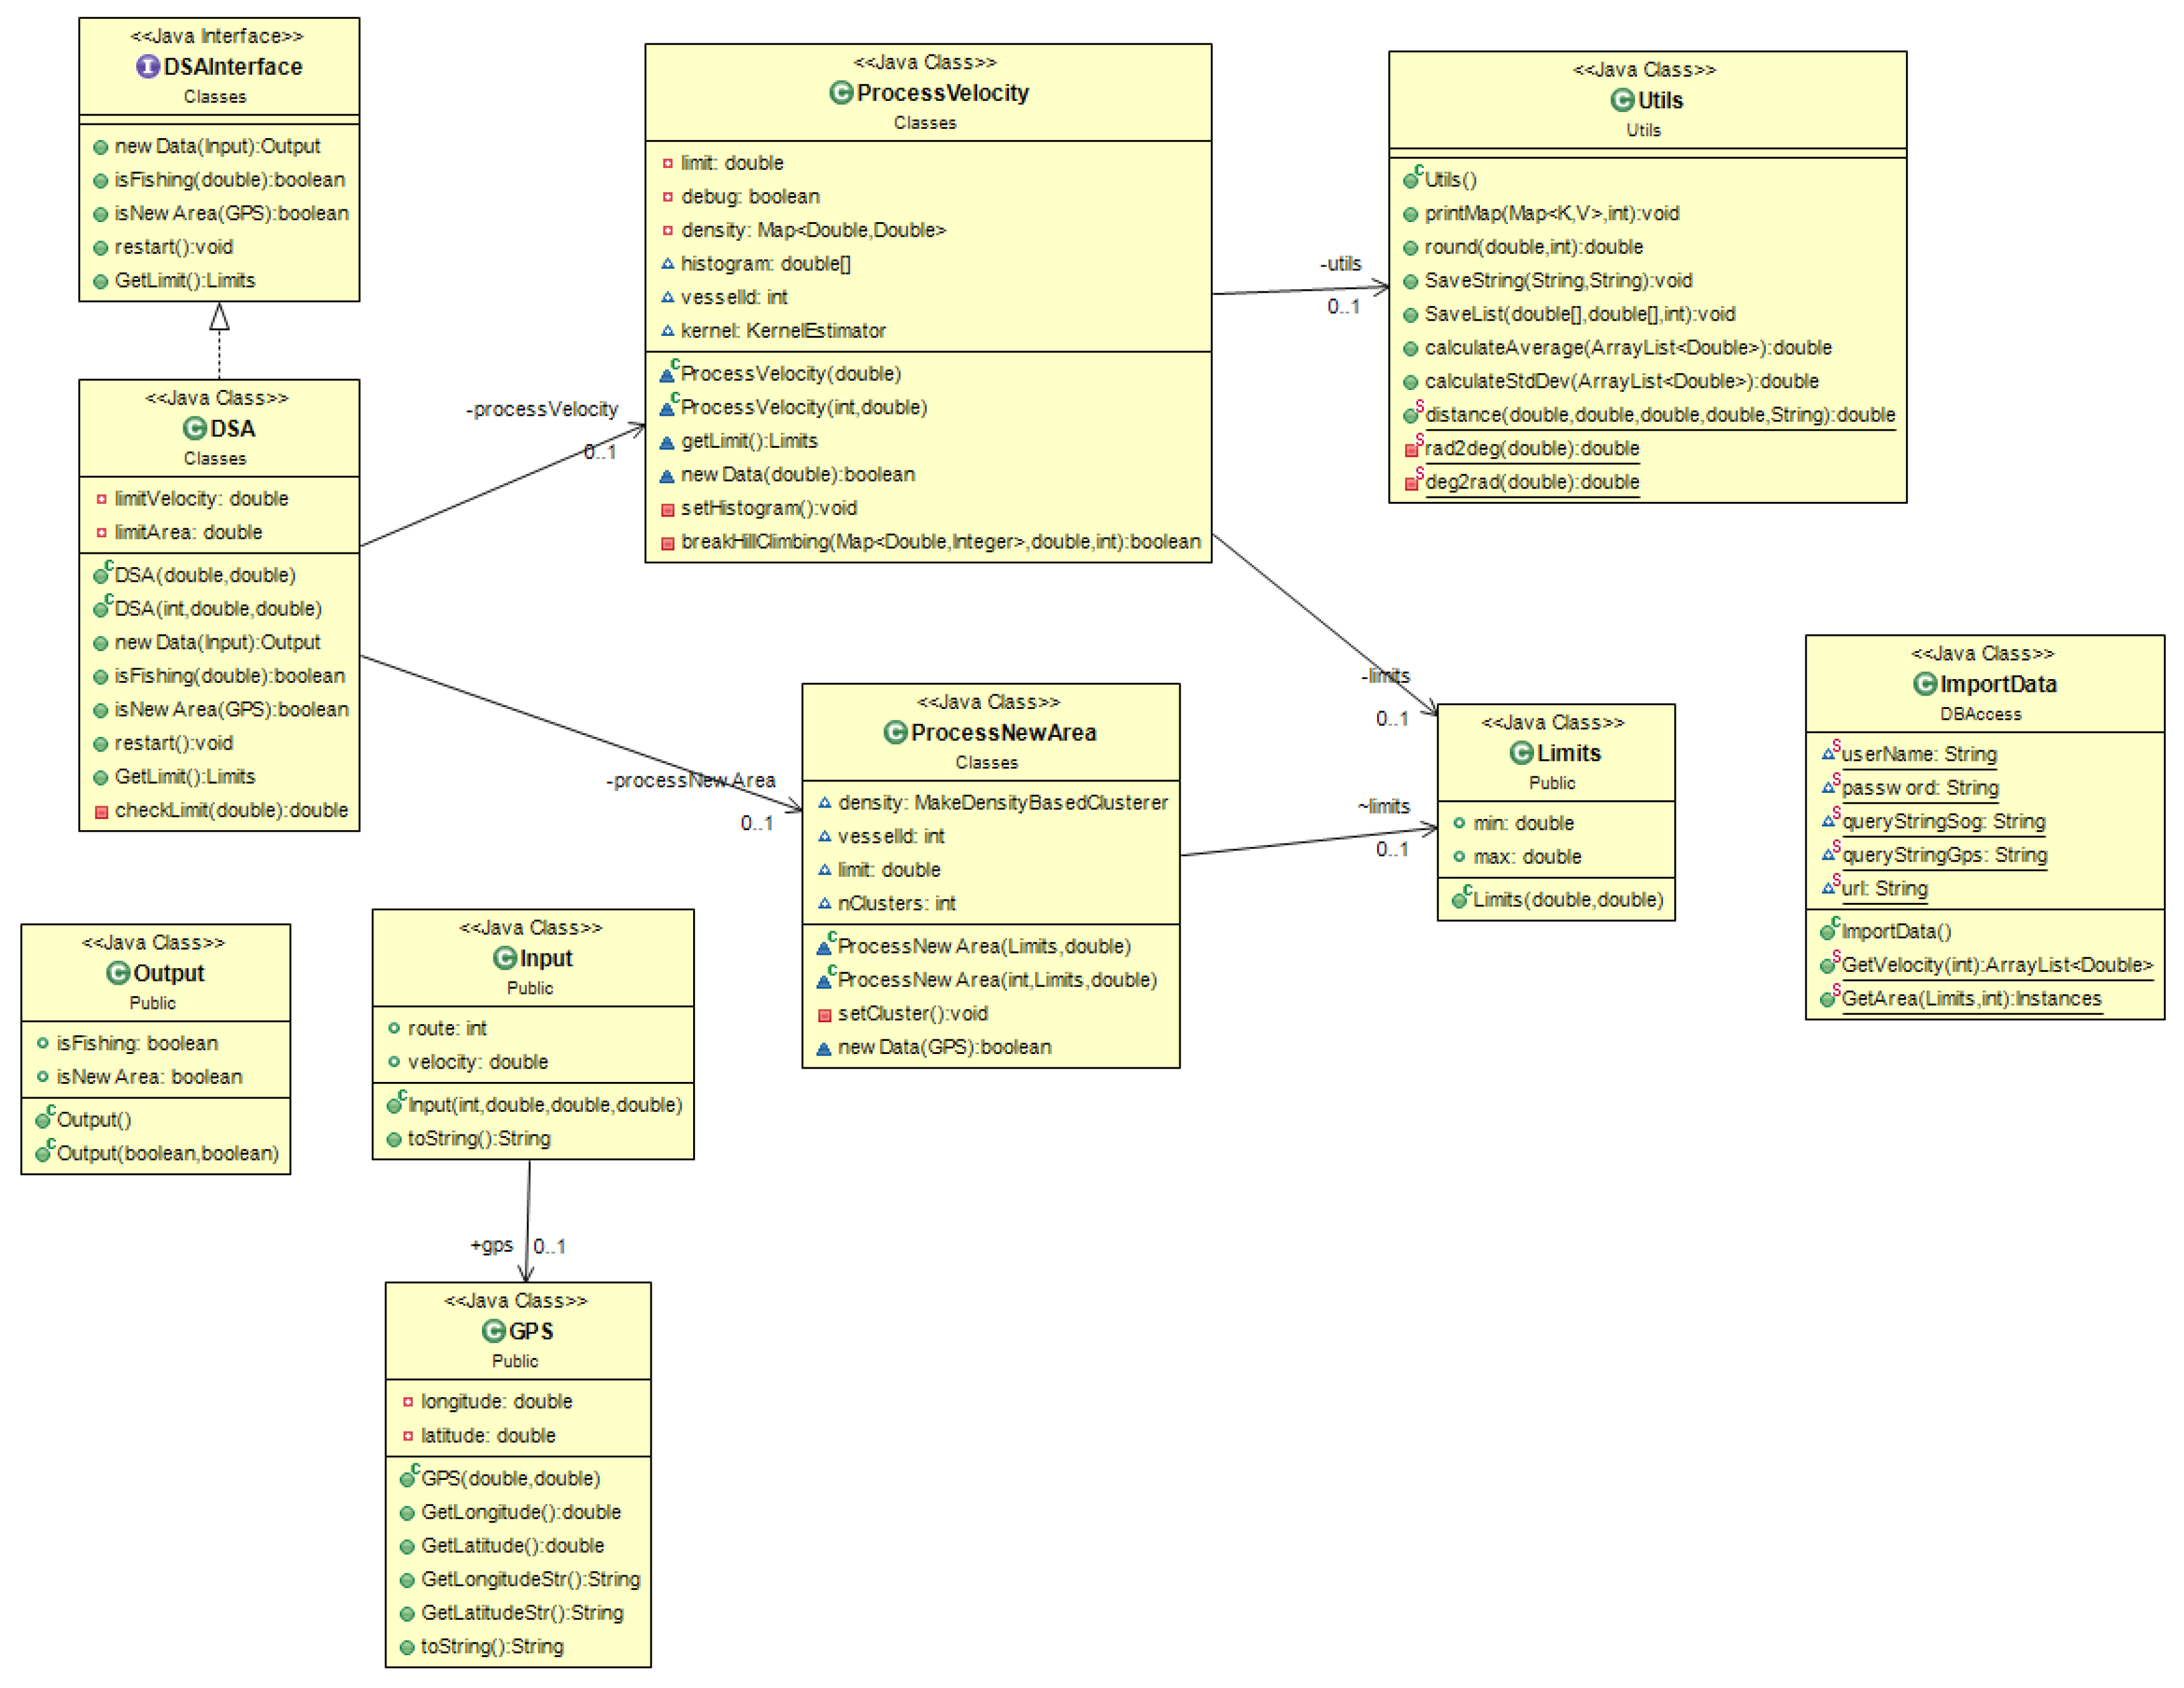
A software application called DSALib (Decision Support Alerts Library) was created. For a market solution, this library could be used by the main application of MONICAP to send alerts to support decision making.
The application starts by initializing three objects:
ProcessVelocity: This object will request to the static class ImportData to retrieve all SOG (speed over ground) data from the database. Then, the process will end with the identification of the fishing speed limits (minimal speed of fishing and the maximal speed of fishing).
ProcessNewArea: This object is only initialized after ProcessVelocity because it needs the velocity fishing limits to create the fishing zones clusters. With these limits, the object request to ImportData only the latitude and longitude where the vessel was in between the velocity limits. With this, the object produces the clusters of the fishing areas.
Processdirangular: This object is only initialized after ProcessVelocity because it needs the fishing velocity. This process finds circles and associated radius and supports the identification of the purse-seiner technique.
Once the three objects are ready, we need to send a new velocity data and GPS coordinates to receive an object with an “isFishing” as true, if the vessel is fishing, and an “isNewArea” as true, if the vessel is in an area that is not a normal fishing area and is in fishing velocity (see
Figure 9).
To develop the software, Java was used as it is a powerful, fully object-oriented, and cross-platform programming language. MONICAP uses Linux, so using a JRE (Java Runtime Environment) application is a good choice.
Additionally, we implemented a process to identify possible transshipment with the VMS box Bluetooth transmission. A typical communication based on applied power has a range of 100 m. If another vessel is within this distance, each one of them will capture the Bluetooth signal, and a transmission process is started. If they keep this distance and position for a certain period (configurable parameter) an alert is generated in the central system for a drone visual inspection at the identified location.
The other transmission process is based on a fishing position out of the existing patterns of each vessel. This approach suffers from a cold start problem, and during the first working month, the system is configured to transmit every 10 min. Once the initial patterns are defined, the system starts to transmit based on the proposed method, thereby reducing communication costs.
Additionally, we created an internal process to check whether the antenna is tapered. A behavior adopted at some vessels that do not want to be located is to block antenna with metal to damage the transmission signal. If this behavior is detected—as the system tries to transmit data and is not able to—an alert is also issued.
5. Results
This project is an addition to the existent proprietary system developed by XSealence—the Integrated Control Center. In 2018, the system recorded 1,048,576 events based on 85,024 vessel trips data from Portuguese fishing fleet.
Table 2 shows a picture with a small sample of these records with the following variables: (1) NAME: the name of the vessel. The system was installed in 310 different vessels; (2) DATETIME: Date and time in format (DD-MM-AAAA HH:MM); (3) GPS coordinates of Latitude and Longitude; (4) COURSE: represents movement direction and ranges from 0 (north) to 360 degrees. The average measurement was of 138.4 with a deviation of 116.55; (5) SPEED: vessel speed in knots. Data collected ranged from 0 to 23, with a mean of 1.13, and a standard deviation of 2.7. These data were created automatically, as opposed to the manual reports generated by the captain of the vessel, which is produced at the end of each trip.
At deep sea, the only communication system available is satellite—which is very expensive. Consequently, this cost heavily restricts the amount of data to be transmitted. In 2018, we tested the edge computing approach in 50 vessels out of a population of 310, divided by 10 in each fishing gear: (1) trawls; (2) surrounding nets with a purse seine; (3) hooks and lines; (4) traps; and (5) hillnets and entangling nets. During the initial semester, they transmitted once every 10 min, and after this period (second semester), they started using the proposed approach of edge computing at VSM box. This allowed comparing the data transmission performed. In the second semester (when this approach went live and was already implemented on the 50 vessels) the transmission frequency was only reduced by 20%, on average. Further analysis allowed identifying that this low reduction in the transmission frequency was due to the fact that new fishing positions were found. The final results showed that in the last months of 2018, there was already a reducion of 70% on the communication frequency. Data for the first three months of 2019 showed savings of up to 90% in five of the analyzed vessels. All of these five vessels use a fishing technique named trawl fishing and are not adapted to conduct other techniques. It is then possible to state that consistency in fishing technique allied with a regular fishing behavior (use of regular fishing areas and overall behavior) leads to reduced abnormal behavior, which results in a reduction in the need to transmit data and, therefore, the associated costs.
6. Conclusions
This research work aimed at developing an alternative deep-sea vessel positioning data collection process that would lead to a reduction in satellite communication costs. The approach used was based on edge computing process at a monitor box in the vessel, collecting data more frequently than the current solutions, however transmitting it only if abnormal behavior is detected.
Illegal, unreported, or unregulated (IUU) fishing is flagellating fragile coastal economies and fish populations at unsustainable levels. Besides this, there are illegal activities conducted at deep-sea that need to be identified and fought against.
Until now, vessel monitoring systems were based on a 10-min data transmission from the vessel, and several approaches are available for such purpose [
14,
28]. All these approaches lead to high communication costs, as only satellite communication is available at deep sea. The contribution of this research to theory comes from the fact that it is the first to use edge computing process in a monitor box in a vessel, allowing VMS to transmit data only if abnormal behavior is detected. Alongside, we bring a novel intelligent approach for the monitor box to decide if there is a need for transmitting the data when is it collected, or only at the port when the communication is cheaper. Additionally, the proposed local storage allows increasing monitoring sample rate from 10 min to only 1 or less (it is now a configurable parameter in the VMS box).
The proposed approach showed to be able to reduce communication costs up to 70% to 90%. Taking into account that deep-sea vessels can require up to US $12,000 per year on satellite communications, the adoption of this solution can lead to substantial savings. Consequently, it is a major contribution to practice. Additionally, being able to evaluate detailed data concerning the location and behavior of the vessels will be a great tool against the tax fraud that occurs in the fishing sector and also a possibility to understand fishing patterns and clusters to create plans for environmental protection.
The clustering process proposed can be very useful to understand the fishing patterns in a given area and with the possibility, over the years, to understand if there are variations in the level of hours of fishing in each zone and manage limitations for protection of species. At the same time, the volume of fish available might also be possible to assess based on the time vessels spend in traditional zones (if they tend to avoid their traditional zones, it is very likely that these zones are lacking in the traditional volume of catch they provide). These same movements of vessels can provide strong hints on zones where certain types of schools are emerging as well.
With the proposed approach, the fishing control process is not reduced as ports with GSM, Wi-Fi, or other low-cost communication systems can transmit data to the central control server, and the data partners can become synchronized.
The findings of this research are based only on a sample of 50 vessels from one country—Portugal—and specifically from one of its regions (the south), which limits its impact. Nonetheless, in countries or regions with a similar culture and fishing traditions, it is possible that results would not be far from the results reported in this article. In countries or regions with substantial cultural differences and in which vessels are currently not continuously monitored, this approach can be a good solution to regulate the fishing activity as well as to signal and prevent illegal activities.


