Abstract
The high penetration level of photovoltaic (PV) generation in distribution networks not only brings benefits like carbon savings, but also induces undesirable outcomes, like more harmonic components and voltage fluctuations. Driven by decreasing costs of energy storage, the focus of this paper is to investigate the feasibility of applying energy storage in the grid-connected PV system to mitigate its intermittency. Firstly, to appreciate the functionality of storage, a generic PV-battery-supercapacitor model was simulated in MATLAB/Simulink, and a flat load profile was obtained to enhance predictability from the network management point of view. However, the usage of supercapacitors at the residential level is limited, due to its high startup costs. Secondly, a detailed residential PV-battery model was implemented in the System Advisor Model (SAM) based on local data in Dubai. The optimal sizing of a battery system was determined by assessing two criteria: The number of excursions, and average target power, which are contradictory in optimization process. Statistical indicators show that a properly sized battery system can alleviate network fluctuations. The proposed sizing method can be also applied to other PV-storage systems. Finally, economic studies of PV-battery system demonstrated its competitiveness against standalone PV systems under appropriate tariff incentives.
1. Introduction
Photovoltaic (PV) generation is one of the most widely applied forms of renewable energy generation (REG), which converts universally available solar energy into electricity through the photovoltaic effect [1]. The whole generation process is nearly independent of fossil fuels, and the rapidly growing usage of PV technologies is in line with sustainable goals and renewable targets proposed worldwide. Moreover, recent price drops in solar panels since 2010 have boosted PV installations globally, and the cumulative installed capacity of PV panels worldwide reached 385 GW in 2017 [2]. Supported by various incentive plans and more large-scale development contracts, the overall PV industry is expected to follow the current exponential trend of development in the coming ten years. According to the World Bank, electric power consumption per capita in the United Arab Emirates (UAE) is more than three times higher than the world average [3]. Hence, massive PV projects are a promising solution to compensate the high energy budget, especially suitable for countries like the UAE, which is abundant in solar energy.
Unlike fossil fuels, the intermittent and non-dispatchable nature of REG poses new threats to power systems, and potential impacts include voltage fluctuations, harmonics, reverse power flows and malfunction of protection devices [4]. Specifically, the voltage problem under high PV penetration is studied in [5]. Using practical UK distribution network data, voltage rise at midday and voltage dip during occasional clouds are observed and assessed, and the influence on network management relies on case-by-case network status. Meanwhile, excessive harmonic voltage and current induce extra losses, like core losses in transformers and generators, as well as increase transmission losses in the conductor, which further causes overheating and affects lifecycles of power equipment, and potentially causes maloperation of protective devices [6]. Furthermore, the PV generation can be either connected to transmission or distribution network, and the severity of corresponding problems also vary. For instance, from statistics in the Greek power system, 97.8% of PV systems are connected at the voltage levels of 20 kV and 0.4 kV, and the lack of control schemes like active power curtailment indicates PV generation is more problematic in the distribution network [7]. Research work in this paper focuses on the distribution network with a maximum of 1000 kW of PV installation capacity. This range is classified as medium to small scale, based on classifications made in [8].
Energy storage is a promising technology for work with renewables to mitigate intermittency and enhance controllability of REG, especially under the trend of decreasing manufacturer costs. Its basic functions include load shifting and grid balancing during unavailability of renewable energy, as well as smoothing REG outputs [9]. For example, a combined PV-battery storage system using appropriate control strategies based on voltage measurement is capable of regulating bus voltage [10]. The authors in [11] developed the battery control strategy using State of Charge (SoC) information, which can reduce short-term fluctuations from PV caused by weather conditions and maximize the usage of battery capacity. However, the frequent usage of a battery can possibly reduce its lifecycle. To accommodate more PV generation and mitigate fluctuations of power balancing, authors in [12] evaluated optimal battery capacity to achieve a flat power profile.
The direct benefits of using a hybrid PV and storage system are power balancing and voltage regulations. Batteries are more frequently used due to their robustness and relatively low cost. Proper scheduling and sizing of a battery system are major obstacles in relevant applications. In this paper, a hybrid PV battery system is built to investigate and improve the whole process.
Furthermore, cost is another constraint in limiting storage applications, and many researchers have endeavored to prove profitability of using energy storage. Under eight possible scenarios of a German residential PV system, the profitability of battery storage was assessed using a techno-economic model developed in [13], with net present value (NPV) as the objective function. Electricity market information plays a significant role in profitability. Authors in [14] predicted that feed-in tariffs are phasing out in coming years and the evaluated economic viability of PV storage system. Results show that a small-scale PV-battery system with enough self-sufficiency is profitable even without feed-in tariffs. Thus, economic feasibility of applying storage with PV system depends on factors such as costs, incentives like feed-in-tariffs (FIT) and electricity prices; therefore, the associated economic analysis of the PV-battery system is also performed in this paper.
The aim of this paper is to evaluate the role of energy storage to maximize PV pervasiveness based on realistic test scenarios. Both technical and economic aspects are investigated and evaluated using a generic hybrid PV storage model which is designed and built using MATLAB/Simulink for a residential power network. To appreciate the optimal dispatch, sizing process and economic feasibility, a practical PV-Battery is modeled and investigated using the System Advisor Model (SAM).
2. System Modeling
To understand interactions between a PV system, distribution network and energy storage system, as well as assess economic values, three test models were proposed, simulated and analyzed. A block diagram is presented in Figure 1 to explain the logic sequence of developing three test models in this paper. Specific methodologies are explained separately in this section.
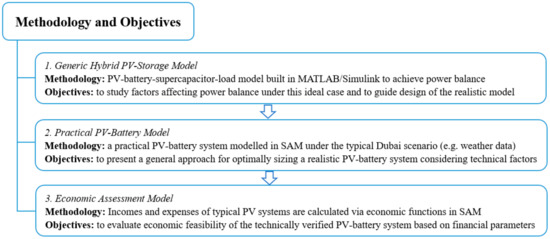
Figure 1.
The logic sequence of developing three test models.
2.1. Generic Hybrid PV-Storage Model
The intermittency of PV generation can be either short-term caused by cloud cover, or long-term due to unavailability of solar at night. Like in [15] and [16], many researchers are investigating the hybrid PV storage system using a battery-supercapacitor to optimize the overall performance, which utilizes the high power density of a supercapacitor (SC), and the high energy density of battery.
The microgrid model studied in this paper was implemented in MATLAB/Simulink [17]. Instead of achieving zero energy balance, the objective was to obtain a constant load profile through the hybrid system design. Its generic schematic is presented in Figure 2.
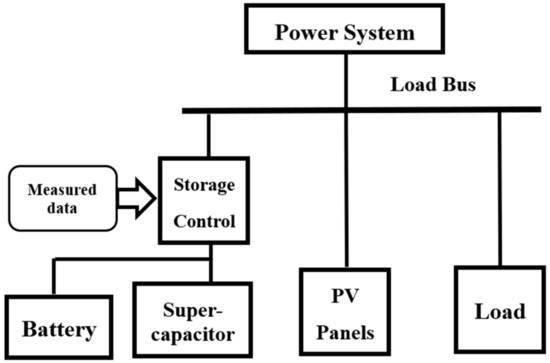
Figure 2.
Generic schematic of ideal hybrid photovoltaic (PV)-storage system.
The corresponding Simulink model is presented in Figure 3, which is adapted based on the microgrid model in [17]. To simplify analysis, in this generic model, all components, like solar panel, battery, supercapacitor and load are modelled as controlled current sources, where input current works as control signals. The model’s objective is to maintain constant load current via hybrid storage system.
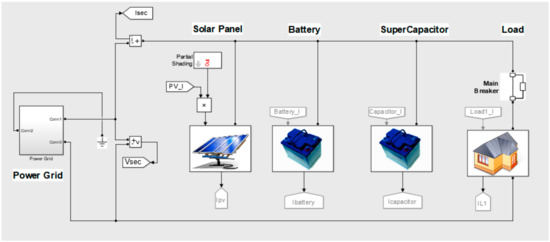
Figure 3.
Simulink model of generic hybrid PV-storage system.
The implementation of a storage control block is shown in Figure 4. Based on the moving average algorithm [18], the power dispatch between the battery and the supercapacitor is implemented using a low-pass filter, which separates out high frequency signals. Batteries only react to long-term power gaps, whilst supercapacitors react to mitigate short and instant fluctuations. The processed signals are fed back into Figure 3 to achieve power balance after fluctuations from the load side.
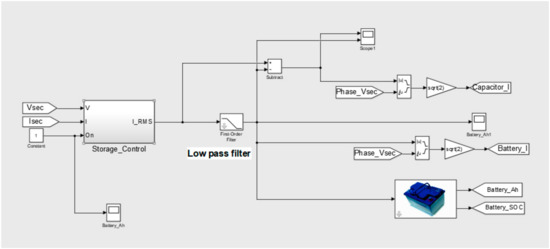
Figure 4.
Simulink model of storage control block.
The effective application of this hybrid system depends on the optimal sizing of storage system because of high component costs. The whole system then had to be simulated, and basic sizing criteria are discussed using residential data.
2.2. Practical PV-Battery Model
A typical residential PV system is modelled in the System Advisor Model to understand interactions between the PV system and battery. SAM is excellent at evaluating system performance and expenses for grid-connected renewable projects. It is used to simulate practical scenarios using local weather inputs and equipment data from manufacturers [19]. Model parameters are based on the typical Dubai scenario, which can be adapted to any scenario.
2.2.1. Weather Data
Typical meteorological year (TMY) weather data for Dubai was used with 8760 hourly samples [20].
2.2.2. PV Modules and Inverter
The module type was LG320N1C-G4, manufactured by LG with the DC capacity of 320 W [21]. The total capacity of PV array was 5.12 kW with 16 modules. A compatible inverter of 5 kW manufactured by Schneider Electric. Annual PV generation is about 9000 kWh.
2.2.3. Load Model
Load profile estimator is an embedded function in SAM. The typical load profile of Dubai was modelled [22]. The annual peak load was 4.8 kW and the annual demand was 18,000 kWh.
2.2.4. Battery Model and Controller
Lead-acid batteries were used because of their low capital costs in kWh and mature technologies [23]. It is stated in [13], that lead-acid is the most commonly applied battery technology in the distributed PV system. Technical parameters of battery bank are computed by default in SAM. Meanwhile, battery controllers are available in SAM for optimizing battery usage and two modes are mainly studied in this paper [24]:
- One-day look ahead mode: The 24-h prediction of PV and load is performed at the start of each day during annual simulation. A target power from the grid is calculated, and the battery is dispatched to meet this hourly target.
- One-day look behind mode: This mode is like look-ahead mode. Rather than predictions for 24-h ahead though, the previous 24-h data are used in this mode.
Figure 5 shows the hourly grid target power plotted on a yearly scale. The power profile is updated daily, and the required power is higher in summer months, like September, than winter months in January.
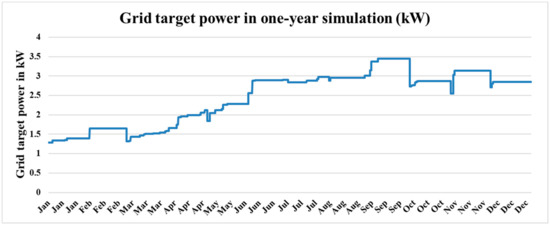
Figure 5.
Example of grid target power in a one-year simulation.
Excluding economic factors, two technical criteria are proposed to identify optimal battery capacity in kWh and kW regarding this residential PV system:
• Number of Excursions
In this paper, the excursion is defined as the case when actual electricity required from the grid is higher than 1.05 times the targeted grid power, which indicates the failure of the dispatch controller. As explained in the previous section, the targeted grid power is calculated in SAM as the energy schedule updated in the timeframe of 24 h. Since there are 8760 samples in a one-year simulation, the number of excursions is the number of hourly samples having the abovementioned case. Figure 6 shows an example of excursion, where red circles indicate samples when actual power is greater than the target.
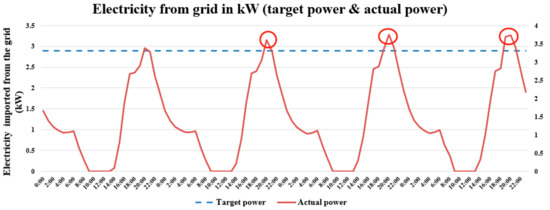
Figure 6.
Electricity from grid in kW—example for excursion.
The corresponding math definition for annual excursion number is given by.
where Pactual is actual active power drawn from the grid in kW, and Ptarget is the targeted power from the grid set by dispatch controller in kW.
Obviously, a smaller number of excursions indicates better controller performance.
• Average target power (ATP)
ATP is derived by averaging all hourly target samples in kW, as presented in Figure 5. Its mathematical expression is presented as:
For this specific model, a net import from the grid is around 9000 kWh annually. Ideally, the target power from the grid should meet this gap with a flat profile, hence the ideal ATP is evaluated as:
where Pload is the consumed power from the grid in kW, and PPV are the PV outputs in kW. However, due to factors like daily and seasonal differences between generation and load, actual ATP is much greater than the ideal ATP value. A well-designed controller can make this value close to the ideal case, which means enhanced controllability from a network planning point of view.
Both criteria are applied to identify a suitable battery size for the PV-battery combination from the technical side.
2.3. Economic Assessment
A basic financial model was set up to investigate the feasibility of PV system from the economic side. Table 1 summarizes the equipment costs relevant to the PV system based on state-of-the-art resources.

Table 1.
Summary of cost items relevant to a PV system.
Meanwhile, electricity tariffs for residential customers in Dubai shown in Table 2 were used for analysis [30]. Local currency was converted to US dollars to facilitate analysis.
Table 2.
Residential electricity tariff in Dubai.
Level G stands for green; level Y stands for yellow; level O stands for orange; level R stands for red; slab tariff is regulated by Dubai Electricity and Water authority (DEWA) which is adjustable in real-time to promote energy efficiency.
Three financial indicators were used to evaluate the economic feasibility:
- Net present value (NPV): The indicator that compares costs and incomes whilst considering values varying with time [26]. Both costs and revenues in each year are incorporated in NPV in the form of cash flow, thus a positive NPV value means the overall project is lucrative. The expression for NPV used is given in Equation (4):where N is number of years, Cn is cash flow in year n, and dnominal is the nominal discount rate. According to the International Energy Agency, dnominal is considered to be 3%, since residential PV systems are low-risk [31].
- Payback period: The number of years that takes revenue exceeds the initial cost. The project is not feasible if the payback period is longer than the project lifetime.
- Levelized cost of electricity (LCOE): It estimates the unit cost of electricity of this PV system, which converts and compares total revenues and costs in the form of present values. The simplified form of LCOE is given by [31].where: Electricityt: Electricity production in year “t”; (1 + r)−t: The discount factor for year “t”. Investmentt: Investment costs in year “t”. O and Mt: Operations and maintenance costs in year “t”.
The economic assessment ran for different cases, and those indicators were used to judge the financial viability and effectiveness.
3. Results
3.1. Generic Hybrid PV Storage Model
The prototype of the generic hybrid model was simulated in Simulink within one-day scale. Data for PV generation and load were imported from the 5 kW residential system in SAM. The total PV generation was 27 kWh, while the total demand was 67 kWh. The power deficiency in this day was 40 kWh. Ideally the hybrid storage can maintain a constant load profile of 1.67 kW (40 kWh/24 h = 1.67 kW). Randomly selected samples in PV generation were reduced by 70% to model cloud covers in the day. The resultant power profiles are shown in Figure 7.
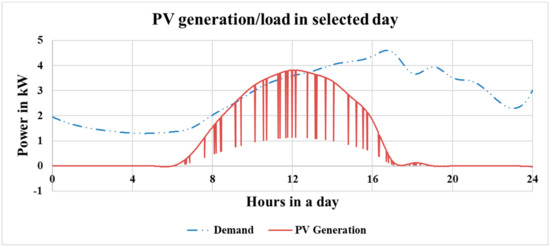
Figure 7.
PV generation and load profile in selected day.
The corresponding power profiles of the supercapacitor and battery are presented separately in Figure 8 and Figure 9, respectively. To maintain constant a power profile from the grid, it was assumed that enough capacity was provided for the battery and supercapacitor.
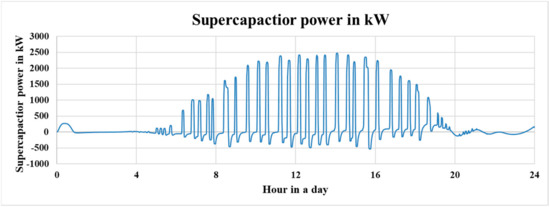
Figure 8.
Power profile of supercapacitor in kW.
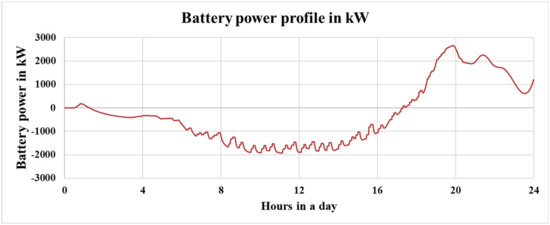
Figure 9.
Power profile of battery in kW.
Simulation results show that supercapacitor successfully mitigates high-frequency fluctuations caused by cloud covers. Meanwhile, the battery is charged during the day and discharges at night to meet the power difference. The charge-discharge cycle of battery is limited to once in a day, which greatly enhances battery lifetime.
Due to high costs for storage devices, optimal sizing is required. For this specific model, the power density of the supercapacitor in kW depends on the maximum power discrepancy between generation and load. The battery capacity in kWh should meet the net difference between PV generation and load within one day. The accuracy of prediction for generation and load data is essential, since it determines power dispatch of the battery. Moreover, time resolution for the prediction window is another important factor. The selected window in this model was one day. A 15-min interval of power forecast is suggested by operation standards in Spain [15]. Smaller forecast windows also reduce capacity requirements for storage devices. Finally, as suggested in [12], the capacity requirement for a flat load target is regarded to the worst-case scenario. If a flat load profile can be realized by storage sizing, any desired load profile can be achieved, which further reduces complexities in network management.
3.2. Practical PV Battery System in SAM
The practical residential system described in the methodology, was in part simulated in SAM with only PV and load, and 8760 hourly samples were obtained in the one-year simulation. In Figure 10, large fluctuations are observed upon electricity exchange between the PV-load system and the grid. PV panels inject more electricity in winter months, with the annual peak export of 3 kW. Meanwhile, the PV system is not sufficient to support the load in summer; the peak demand from the grid was almost 5 kW.
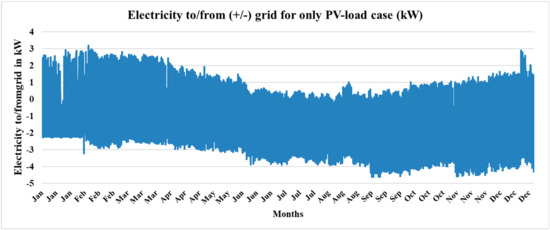
Figure 10.
Electricity to/from (+/−) grid for only the PV-load case (kW).
Due to the proliferation of residential PV systems, the aggregated impact is not negligible. It adds extra difficulty to network operations in terms of power dispatch to meet variations from both PV and demand. Hence, a battery bank is essential to mitigate this intermittency. Based on criteria of excursion number and ATP, a series of simulations were performed under different combinations of power (between 1–10 kW) and capacity (between 1–10 kWh) of the battery bank. Numerical results are presented in Appendix A. Three points can be obtained from Figure 11 and Figure 12.
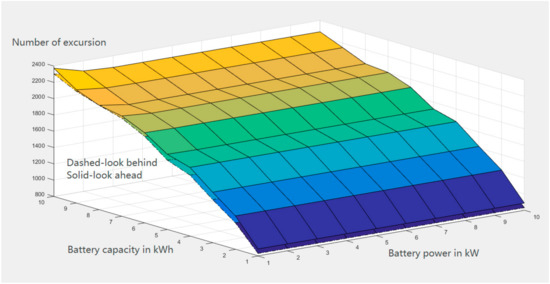
Figure 11.
3D plot of number of excursions against battery power and capacity.
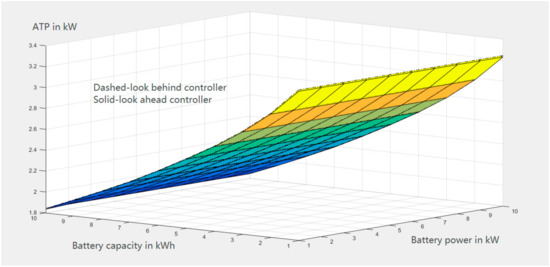
Figure 12.
3D plot of average target power (ATP) against battery power and capacity.
- Battery power doesn’t affect the result of ATP but battery capacity in kWh does;
- Performance of a look-ahead controller and a look-behind controller are similar;
- Increasing battery capacity can reduce ATP, but the number of excursions also increases.
From Figure 11 and Figure 12, the number of excursions is positively related to the increase of battery capacity, whilst ATP negatively relates with the increasing capacity. However, variations of battery power do not significantly affect either ATP, nor excursion numbers. Hence optimal battery capacity should be decided by balancing between the number of excursions and ATP. Obviously, the two criteria are independent and contradictory, which leaves customers or network operators to decide which criterion is more valuable.
Utilizing the property of independency between two criteria, one simple approach to determine the optimal capacity is proposed by plotting obtained data points within a double-axis graph. An assumption is made that an equal weighting is applied to both criteria, which means the scale of both ATP and number of excursions should be truly reflected and evenly expanded. To simplify analysis, the maximum scale of two y-axes is around 1.2 times the highest sampled data point. Figure 13 illustrates two criteria plotted against battery capacity alone under the scenario of equal weighting. Specifically, the scale of excursion number was selected as 2500, which is 1.2 times the maximum excursion number obtained at 1 kWh. The same methodology is applied to determine the scale of ATP. Linear extrapolation is adopted to connect data samples and a cross-point is identified in Figure 13. Although this point has no physical meaning, since the two experiments were run independently, it is an important indication as a balanced outcome under equally weighted scales. In this case, the optimal capacity is around 5 kWh. According to [26] the installed storage capacity (average discharge power over two-hour period) should be less than PV capacity. Therefore, maximum battery power is 2.5 kW. Overall, technical parameters of optimal battery were selected as 5 kWh and 2.5 kW.
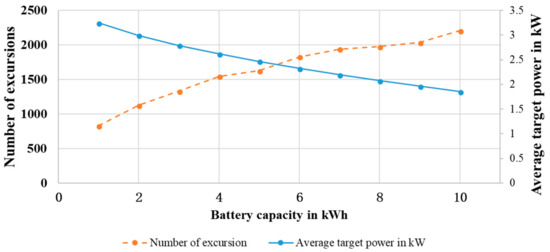
Figure 13.
Number of excursions and ATP against battery capacity.
For extended analysis, scales in Figure 13 can be adjusted according to different weighting factors. For instance, a larger scale of excursion numbers can suppress the dashed curve in Figure 13, where a higher battery capacity is reached at cross-point. That means a larger number of excursions corresponds to a lower weighting factor, which further indicates that ATP is more highly valued than the excursion. Thus, a larger battery capacity is required to deal with relatively significant ATP. The effectiveness of weighting factors and alternative optimization process, including more data samples with advanced extrapolation methods can be further explored in the future research work.
The effectiveness of the selected PV-battery system from Figure 13 in mitigating fluctuations in Figure 10 is presented from a statistical perspective in Table 3. Statistical analysis is applied to better illustrate large quantities of data. From this table, both the maximum import and export power from the grid are reduced by applying the battery system. Meanwhile, fluctuations are also reduced as the standard deviation decreases.
Table 3.
Electricity to/from grid in kW.
3.3. Economic Assessment for PV-Battery System
Using the practical SAM model, the project costs for PV-only and PV-battery system are estimated in Table 4, where unit costs are based on the data presented in Table 1. The cost for balance of system accounts for the largest proportion, which generally covers costs of electronic systems, wiring, mounting structure, labor, and other miscellaneous expenses. The average cost in $/W matches the latest weighted data from IRENA Renewable Cost Database [25].
Table 4.
Summary of project costs.
Since a feed-in-tariff is a common approach to encourage PV installation, a simple tariff structure is designed in Figure 14, based on the existing Dubai tariff in Table 2. For residential customers, the electricity tariff between 12:00–16:00 is doubled. This period is coincident with both maximum PV generation and maximum demand locally in Dubai. More PV generation and switching off unnecessary load are encouraged under this tariff structure. Furthermore, a 50% compensation for battery installment and replacement cost is provided for customers, since a battery helps to mitigate network fluctuations. In summary, the assumed FIT package includes updated tariff and battery compensation.
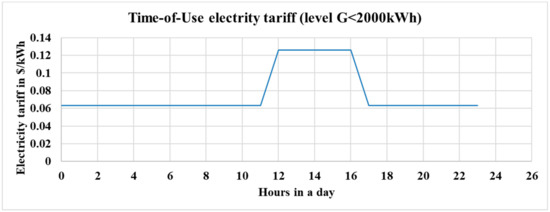
Figure 14.
Updated electricity tariff for a feed-in tariff (FIT) scenario.
Different cases are evaluated, and corresponding financial indicators are summarized in Table 5. Assumptions include:
Table 5.
Financial assessment for cases with/without battery and FIT.
- Simulation life period is 25 years. For cases with battery, replacement occurs every five years with the same price;
- The O and M cost is the same for all cases, which is 20$/kW-year.
NPV values in all four cases are positive, which indicates revenues exceed overall costs (e.g., initial costs, yearly O and M costs and battery replacement costs) under the given lifetime. Results show that application of a battery diminishes financial returns of PV system. However, under the designed FIT package, the profits of PV-battery system are equivalent to cases with only PV. Therefore, proper financial incentives should be provided by network operators to facilitate both PV and battery installations. Furthermore, the technical value of batteries is an added benefit for network operators, as shown in previous discussion.
4. Discussion
Energy storage is frequently used in off-grid PV systems to obtain power balance. Driven by economic incentives, more grid-connected PV systems are adopting storage devices. The combined battery–supercapacitor storage model demonstrates the technical value of the hybrid PV-storage system in mitigating PV intermittency and non-linear load. However, the high equipment cost of supercapacitor stops this application at the demonstration stage. The design of a dispatch controller is the key element in practical PV-battery system models. However, the specified power target cannot be met throughout the year, due to factors like unpredictable weather and battery malfunction. Optimal sizing for a battery system in the residential levels to follow the power target is shown by assessing two contradictory criteria—the number of excursions and ATP, which demonstrates the performance of the proposed hybrid system. Statistical results show that the PV-battery system can attenuate fluctuations, as well as reduce the maximum power exchange with the grid. Statistical indicators like standard deviation and mean are used for better illustration.
Economic feasibility of the PV-battery system was also investigated. Recent market data shows the competitiveness of battery applications in grid-connected systems, where no significant difference is observed regarding project costs between only PV and a PV-battery system (shown in Table 4). Based on the existing tariff structure in Dubai, feed-in-tariffs are recommended to encourage more applications of PV and a battery, which further reduces network stress under high-loading afternoons, as well as ancillary reserves. Meanwhile, these benefits can be generalized to other parts of the world by customizing incentive packages.
Furthermore, the impact of an inverter should not be ignored in realistic applications. Authors in [32] capture the clipping effects when inverters reach the limit of converting DC power based on fuzzy logic. More harmonic components are generated in line with clipping effects, which further diminishes the performance overall of a PV system. This reason drives more researchers to identify optimal sizes of inverters. For instance, a genetic algorithm is employed in [33] to assess the NPV of PV arrays under various inverter capacities to achieve maximum economic benefits. Cloud enhancement is used as another criterion in the process of inverter sizing in [34].
Therefore, inverter sizing procedures will be studied in the future research work. A possible correlation between inverter sizing and battery sizing can be further investigated. Meanwhile, harmonic generation is a common problem in practical PV systems, which could possibly be another decisive parameter for designing PV-storage systems.
Finally, under the present decreasing trend of costs for PV related renewable projects, more technical and financial value from energy storage will be appreciated in the near future, even without incentives.
5. Conclusions
To mitigate intermittency and fluctuations brought on by PV installations, and further improve maximum PV popularity, energy storage is identified as one promising solution. In this paper, three different models were developed in sequence to assess the effectiveness of introducing energy storage into residential PV systems from different perspectives.
Firstly, a generic PV-battery-supercapacitor model was built in Simulink, and a flat load profile was proven achievable. Power density, power capacity and dispatch controllers are three key factors to reduce power fluctuations. However, in practical implementation, the functionality of dispatch controller and the high material cost of supercapacitor limits the practical implementation of this ideal model.
Inspired by outcomes from the generic model, a practical PV-battery model was built in SAM, which was based on residential household data in Dubai. Optimal sizing of the battery system was achieved by evaluating technical parameters which can effectively mitigate network variations.
In the third model, economic assessment results showed that grid-connected PV system with the optimized battery size can be profitable with reasonable incentives.
To summarize, a generalized approach for optimizing battery size in PV systems is proven to be both technically and economically feasible. Future work will focus on inverter sizing and minimization of harmonics in PV system design.
Author Contributions
This research article is the outcome of L.X.’s MSc dissertation, and M.N. supervised him through his research work. The conceptualization and methodology were developed by both authors. L.X. developed the main parts of the research, including system modeling and analysis of the obtained results. M.N. provided supervision at all stages of the research, and contributed to the writing and editing of the paper.
Funding
This research received no external funding.
Conflicts of Interest
The authors declare no conflict of interest.
Abbreviations
| ATP | average target power |
| DEWA | Dubai Electricity and Water Authority |
| FIT | feed-in-tariff |
| IRENA | International Renewable Energy Agency |
| LCOE | levelized cost of electricity |
| O&M | Operations and Maintenance |
| PV | Photovoltaic |
| REG | Renewable Energy Generation |
| SC | Supercapacitor |
| SoC | State of Charge |
| TMY | Typical Meteorological Year |
Appendix A
In the practical PV-battery model, results of ATP and number of excursions for a look-ahead controller are shown in Table A1 and Table A2. Results for a look-behind controller are presented in Table A3 and Table A4.
Table A1.
Average target power in kW for look-ahead controller.
Table A1.
Average target power in kW for look-ahead controller.
| Average Target Power in kW for Look-Ahead Controller | |||||||||||
|---|---|---|---|---|---|---|---|---|---|---|---|
| Battery Power in kW | |||||||||||
| 1 | 2 | 3 | 4 | 5 | 6 | 7 | 8 | 9 | 10 | ||
| Battery capacity in kWh | 1 | 3.23 | 3.23 | 3.23 | 3.23 | 3.23 | 3.23 | 3.23 | 3.23 | 3.23 | 3.23 |
| 2 | 2.98 | 2.98 | 2.98 | 2.98 | 2.98 | 2.98 | 2.98 | 2.98 | 2.98 | 2.98 | |
| 3 | 2.78 | 2.78 | 2.78 | 2.78 | 2.78 | 2.78 | 2.78 | 2.78 | 2.78 | 2.78 | |
| 4 | 2.61 | 2.61 | 2.61 | 2.61 | 2.61 | 2.61 | 2.61 | 2.61 | 2.61 | 2.61 | |
| 5 | 2.46 | 2.46 | 2.46 | 2.46 | 2.46 | 2.46 | 2.46 | 2.46 | 2.46 | 2.46 | |
| 6 | 2.32 | 2.32 | 2.32 | 2.32 | 2.32 | 2.32 | 2.32 | 2.32 | 2.32 | 2.32 | |
| 7 | 2.19 | 2.19 | 2.19 | 2.19 | 2.19 | 2.19 | 2.19 | 2.19 | 2.19 | 2.19 | |
| 8 | 2.06 | 2.07 | 2.07 | 2.07 | 2.07 | 2.07 | 2.07 | 2.07 | 2.07 | 2.07 | |
| 9 | 1.95 | 1.95 | 1.95 | 1.95 | 1.95 | 1.95 | 1.95 | 1.95 | 1.95 | 1.95 | |
| 10 | 1.83 | 1.85 | 1.85 | 1.85 | 1.85 | 1.85 | 1.85 | 1.85 | 1.85 | 1.85 | |
Table A2.
Average target power in kW for look-behind controller.
Table A2.
Average target power in kW for look-behind controller.
| Average Target Power in kW for Look-Behind Controller | |||||||||||
|---|---|---|---|---|---|---|---|---|---|---|---|
| Battery Power in kW | |||||||||||
| 1 | 2 | 3 | 4 | 5 | 6 | 7 | 8 | 9 | 10 | ||
| Battery capacity in kWh | 1 | 3.24 | 3.24 | 3.24 | 3.24 | 3.24 | 3.24 | 3.24 | 3.24 | 3.24 | 3.24 |
| 2 | 2.99 | 2.99 | 2.99 | 2.99 | 2.99 | 2.99 | 2.99 | 2.99 | 2.99 | 2.99 | |
| 3 | 2.79 | 2.79 | 2.79 | 2.79 | 2.79 | 2.79 | 2.79 | 2.79 | 2.79 | 2.79 | |
| 4 | 2.62 | 2.62 | 2.62 | 2.62 | 2.62 | 2.62 | 2.62 | 2.62 | 2.62 | 2.62 | |
| 5 | 2.47 | 2.47 | 2.47 | 2.47 | 2.47 | 2.47 | 2.47 | 2.47 | 2.47 | 2.47 | |
| 6 | 2.32 | 2.32 | 2.32 | 2.32 | 2.32 | 2.32 | 2.32 | 2.32 | 2.32 | 2.32 | |
| 7 | 2.19 | 2.19 | 2.19 | 2.19 | 2.19 | 2.19 | 2.19 | 2.19 | 2.19 | 2.19 | |
| 8 | 2.07 | 2.07 | 2.07 | 2.07 | 2.07 | 2.07 | 2.07 | 2.07 | 2.07 | 2.07 | |
| 9 | 1.95 | 1.96 | 1.96 | 1.96 | 1.96 | 1.96 | 1.96 | 1.96 | 1.96 | 1.96 | |
| 10 | 1.84 | 1.85 | 1.85 | 1.85 | 1.85 | 1.85 | 1.85 | 1.85 | 1.85 | 1.85 | |
Table A3.
Number of excursions for look-ahead controller.
Table A3.
Number of excursions for look-ahead controller.
| Number of Excursion for Look-Ahead Controller | |||||||||||
|---|---|---|---|---|---|---|---|---|---|---|---|
| Battery Power in kW | |||||||||||
| 1 | 2 | 3 | 4 | 5 | 6 | 7 | 8 | 9 | 10 | ||
| Battery capacity in kWh | 1 | 887 | 887 | 887 | 887 | 887 | 887 | 887 | 887 | 887 | 887 |
| 2 | 1211 | 1211 | 1211 | 1211 | 1211 | 1211 | 1211 | 1211 | 1211 | 1211 | |
| 3 | 1421 | 1421 | 1421 | 1421 | 1421 | 1421 | 1421 | 1421 | 1421 | 1421 | |
| 4 | 1644 | 1644 | 1644 | 1644 | 1644 | 1644 | 1644 | 1644 | 1644 | 1644 | |
| 5 | 1724 | 1718 | 1718 | 1718 | 1718 | 1718 | 1718 | 1718 | 1718 | 1718 | |
| 6 | 1907 | 1901 | 1901 | 1901 | 1901 | 1901 | 1901 | 1901 | 1901 | 1901 | |
| 7 | 2031 | 2003 | 2003 | 2003 | 2003 | 2003 | 2003 | 2003 | 2003 | 2003 | |
| 8 | 2080 | 2028 | 2028 | 2028 | 2028 | 2028 | 2028 | 2028 | 2028 | 2028 | |
| 9 | 2189 | 2150 | 2145 | 2145 | 2145 | 2145 | 2145 | 2145 | 2145 | 2145 | |
| 10 | 2373 | 2277 | 2258 | 2258 | 2258 | 2258 | 2258 | 2258 | 2258 | 2258 | |
Table A4.
Number of excursions for look-behind controller.
Table A4.
Number of excursions for look-behind controller.
| Number of Excursions for Look-Behind Controller | |||||||||||
|---|---|---|---|---|---|---|---|---|---|---|---|
| Battery Power in kW | |||||||||||
| 1 | 2 | 3 | 4 | 5 | 6 | 7 | 8 | 9 | 10 | ||
| Battery capacity in kWh | 1 | 831 | 831 | 831 | 831 | 831 | 831 | 831 | 831 | 831 | 831 |
| 2 | 1126 | 1126 | 1126 | 1126 | 1126 | 1126 | 1126 | 1126 | 1126 | 1126 | |
| 3 | 1329 | 1329 | 1329 | 1329 | 1329 | 1329 | 1329 | 1329 | 1329 | 1329 | |
| 4 | 1548 | 1543 | 1543 | 1543 | 1543 | 1543 | 1543 | 1543 | 1543 | 1543 | |
| 5 | 1651 | 1628 | 1628 | 1628 | 1628 | 1628 | 1628 | 1628 | 1628 | 1628 | |
| 6 | 1862 | 1827 | 1827 | 1827 | 1827 | 1827 | 1827 | 1827 | 1827 | 1827 | |
| 7 | 2002 | 1939 | 1939 | 1939 | 1939 | 1939 | 1939 | 1939 | 1939 | 1939 | |
| 8 | 2080 | 1976 | 1976 | 1976 | 1976 | 1976 | 1976 | 1976 | 1976 | 1976 | |
| 9 | 2170 | 2043 | 2036 | 2036 | 2036 | 2036 | 2036 | 2036 | 2036 | 2036 | |
| 10 | 2303 | 2220 | 2205 | 2205 | 2205 | 2205 | 2205 | 2205 | 2205 | 2205 | |
References
- Luque, A.; Hegedus, S. Handbook of Photovoltaic Science and Engineering, 2nd ed.; Wiley: Hoboken, NJ, USA; John Wiley Distributor: Chichester, UK, 2011. [Google Scholar]
- IRENA. Solar Energy Data; IRENA: Abu Dhabi, UAE, 2018; Available online: http://www.irena.org/solar (accessed on 23 March 2018).
- The World Bank. Electric Power Consumption (kWh Per Capita); The World Bank: Washington, DC, USA, 2019; Available online: https://data.worldbank.org/indicator/EG.USE.ELEC.KH.PC (accessed on 23 March 2018).
- Karimi, M.; Mokhlis, H.; Naidu, K.; Uddin, S.; Bakar, A.H.A. Photovoltaic penetration issues and impacts in distribution network—A review. Renew. Sustain. Energy Rev. 2016, 53, 594–605. [Google Scholar] [CrossRef]
- Thomson, M.; Infield, D.G. Impact of widespread photovoltaics generation on distribution systems. Iet Renew. Power Gener. 2017, 1, 33–40. [Google Scholar] [CrossRef]
- Martin, D.; Goodwin, S.; Krause, O.; Saha, T. The effect of PV on transformer ageing: University of Queensland’s experience. In Proceedings of the Australasian Universities Power Engineering Conference, Perth, WA, Australia, 28 September–1 October 2014; pp. 1–6. [Google Scholar]
- Kyritsis, A.; Voglitsis, D.; Papanikolaou, N.; Tselepis, S.; Christodoulou, C.; Gonos, I.; Kalogirou, S.A. Evolution of PV systems in Greece and review of applicable solutions for higher penetration levels. Renew. Energy 2017, 109, 487–499. [Google Scholar] [CrossRef]
- Katiraei, F.; Aguero, J.R. Solar PV Integration Challenges. IEEE Power Energy Mag. 2011, 9, 62–71. [Google Scholar] [CrossRef]
- Jamal, T.; Urmee, T.; Calais, M.; Shafiullah, G.M.; Carter, C. Technical challenges of PV deployment into remote Australian electricity networks: A review. Renew. Sustain. Energy Rev. 2017, 77, 1309–1325. [Google Scholar] [CrossRef]
- Zillmann, M.; Yan, R.; Saha, T.K. Regulation of distribution network voltage using dispersed battery storage systems: A case study of a rural network. In Proceedings of the 2011 IEEE Power and Energy Society General Meeting, Detroit, MI, USA, 24–28 July 2011; pp. 1–8. [Google Scholar]
- Alam, M.J.E.; Muttaqi, K.M.; Sutanto, D. Mitigation of Rooftop Solar PV Impacts and Evening Peak Support by Managing Available Capacity of Distributed Energy Storage Systems. IEEE Trans. Power Syst. 2013, 28, 3874–3884. [Google Scholar] [CrossRef]
- Bass, R.B.; Carr, J.; Aguilar, J.; Whitener, K. Determining the Power and Energy Capacities of a Battery Energy Storage System to Accommodate High Photovoltaic Penetration on a Distribution Feeder. IEEE Power Energy Technol. Syst. J. 2016, 3, 119–127. [Google Scholar] [CrossRef]
- Hoppmann, J.; Volland, J.; Schmidt, T.S.; Hoffmann, V.H. The economic viability of battery storage for residential solar photovoltaic systems—A review and a simulation model. Renew. Sustain. Energy Rev. 2014, 39, 1101–1118. [Google Scholar] [CrossRef]
- Weniger, J.; Tjaden, T.; Quaschning, V. Sizing of Residential PV Battery Systems. Energy Procedia 2014, 46, 78–87. [Google Scholar] [CrossRef]
- Miñambres-Marcos, V.M.; Guerrero-Martínez, M.Á.; Barrero-González, F.; Milanés-Montero, M.I. A Grid Connected Photovoltaic Inverter with Battery-Supercapacitor Hybrid Energy Storage. Sensors 2017, 17, 1856. [Google Scholar] [CrossRef] [PubMed]
- Watanabe, R.; Ito, Y.; Hida, Y.; Yokoyama, R.; Iba, K.; Tsukada, T. Optimal capacity selection of hybrid energy storage systems for suppressing PV output fluctuation. In Proceedings of the IEEE PES ISGT ASIA, Tianjin, China, 21–24 May 2012; pp. 1–5. [Google Scholar]
- MathWorks. Simplified Model of a Small Scale Micro-Grid; MathWorks: Natick, MA, USA, 2018; Available online: https://goo.gl/M4MuKJ (accessed on 6 February 2018).
- Shwetha, D.; Ramya, S. Comparison of smoothing techniques and recognition methods for online Kannada character recognition system. In Proceedings of the International Conference on Advances in Engineering & Technology Research (ICAETR-2014), Unnao, India, 1–2 August 2014. [Google Scholar]
- SAM. System Advisor Model (SAM) Models and Databases. 2018. Available online: https://sam.nrel.gov/ (accessed on 6 February 2018).
- EU. Photovoltaic Geographical Information System (PVGIS); EU: Brussels, Belgium, 2018; Available online: http://re.jrc.ec.europa.eu/pvgis.html (accessed on 3 February 2018).
- LG. LG NeON2 Module Cells; LG: Seoul, Korea, 2018; Available online: http://www.lg.com/us/business/solar-panel/all-products/lg-LG320N1C-G4 (accessed on 6 February 2018).
- DEWA. Annual Statistics 2017; DEWA: Dubai, UAE, 2017; Available online: https://goo.gl/ps1oLg (accessed on 1 July 2018).
- Akbari, H.; Browne, M.C.; Ortega, A.; Huang, M.J.; Hewitt, N.J.; Norton, B.; McCormack, S.J. Efficient energy storage technologies for photovoltaic systems. Sol. Energy 2018, in press. [Google Scholar] [CrossRef]
- DiOrio, N. An Overview of the Automated Dispatch Controller Algorithms in the System Advisor Model (SAM); National Renewable Energy Lab. (NREL): Golden, CO, USA, 2017. Available online: www.nrel.gov/docs/fy18osti/68614.pdf (accessed on 6 July 2018).
- IRENA. Renewable Power Generation Costs in 2017; IRENA: Abu Dhabi, UAE, 2018; Available online: https://goo.gl/MA2m1F (accessed on 28 March 2018).
- DiOrio, N.; Dobos, A.; Janzou, S. Economic Analysis Case Studies of Battery Energy Storage with SAM; NREL: Golden, CO, USA, 2015. Available online: https://www.nrel.gov/docs/fy16osti/64987.pdf (accessed on 15 July 2018).
- IRENA. Electricity Storage Technology Brief; IRENA: Abu Dhabi, UAE, 2012; Available online: https://www.irena.org/publications/2015/Oct/Electricity-storage (accessed on 21 July 2010).
- IRENA. Renewable Energy Technologies: Cost Analysis Series; IRENA: Abu Dhabi, UAE, 2012; Available online: https://goo.gl/C9ewDS (accessed on 9 March 2018).
- Das, A.B. A Guide to Solar Power Generation in the United Arab Emirates; Middle East Solar Industry Association MESIA: Dubai, UAE, 2014; Available online: www.mesia.com/wp-content/uploads/2017/09/Solar-for-Students.pdf (accessed on 20 July 2018).
- DEWA. Slab Tariff; DEWA: Dubai, UAE, 2018; Available online: https://goo.gl/zxxMvF (accessed on 6 July 2018).
- IEA. Projected Costs of Generating Electricity; IEA: Paris, France, 2015; Available online: https://www.iea.org/Textbase/npsum/ElecCost2015SUM.pdf (accessed on 21 July 2010).
- Fernandez, F.S.; Muñoz-García, M.A.; Saminger-Platz, S. Detecting clipping in photovoltaic solar plants using fuzzy systems on the feature space. Sol. Energy 2016, 132, 345–356. [Google Scholar] [CrossRef]
- Bakhshi, R.; Sadeh, J.; Mosaddegh, H.R. Optimal economic designing of grid-connected photovoltaic systems with multiple inverters using linear and nonlinear module models based on Genetic Algorithm. Renew. Energy 2014, 72, 386–394. [Google Scholar] [CrossRef]
- Luoma, J.; Kleissl, J.; Murray, K. Optimal inverter sizing considering cloud enhancement. Sol. Energy 2012, 86, 421–429. [Google Scholar] [CrossRef]
© 2019 by the authors. Licensee MDPI, Basel, Switzerland. This article is an open access article distributed under the terms and conditions of the Creative Commons Attribution (CC BY) license (http://creativecommons.org/licenses/by/4.0/).