Abstract
The continuous, non-intermitted service of electrical grids relies on the reliability of their assets, e.g., power transformers. Local insulation defects can result in serve failures such as breakdowns with severe subsequent costs. The prevention of such events is crucial. Hence, partial discharge (PD) activity at power transformers is evaluated directly in the factory before shipment. Additionally, PD activity can be monitored during service using the ultra-high frequency (UHF) method. In this contribution, a calibration procedure is proposed for the UHF method. The calibration process is required to ensure both, reproducibility and comparability of UHF measurements: Only a calibrated UHF measurement procedure can be introduced supplementary to IEC 60270 in acceptance tests of power transformers. The proposed calibration method considers two factors: The influence of the UHF-antenna’s sensitivity and the PD recorder characteristics including accessories such as cable damping, pre-amplifier, etc. The former is addressed by a characterization of UHF sensors using the standard antenna factor (AF) in a gigahertz transverse electromagnetic (GTEM) cell. The PD recorder’s influence is corrected by using a defined, invariable test signal as reference for all recording devices. A practical evaluation of the proposed calibration procedure is performed in a laboratory setup using different UHF recording devices and UHF sensors using artificial PD signals and real voltage-driven PD sources.
Keywords:
power transformers; partial discharge; PD; UHF; calibration; monitoring; acceptance tests; IEC 60270; PD sensors; antenna factor 1. Introduction
Power transformers represent a crucial asset to ensure the reliability of power grids. Transformer failures can result in severe damages and costs, which illustrates the fundamental need for their reliable operation in terms of general service security. Therefore, evolving insulation degradation in power transformers, especially local defects, must be detected as early as possible [1]. Different established diagnostic methods are available to meet the requirements for both, onsite and factory measurements. There are three different basic methods for continuous partial discharge (PD) monitoring at power transformers: Indirect detection by dissolved gas analysis (DGA), detection by the electrical PD measurement method according to IEC 60270 [2], and by electromagnetic measurements [3,4] in the ultra-high frequency range (UHF: 300 MHz–3 GHz). Measurements of acoustic PD emissions are mainly a supplement to diagnostic PD localization [5]. Clamp-on high-frequency current transformers (HFCTs) are mostly used for diagnostic purposes if no bushing tap measurement or coupling capacitors are available. Furthermore, emission of light and ionizing radiation [6,7] can be used for PD diagnostic purposes. Usually, in the case of power transformers, the structure and the available measurement devices limit the application of these measurement techniques. Because DGA is an indicator of the PD activity in the transformer, an increasing number of transformers is equipped with PD monitoring. The relevance of PD measurements reflects in the standard for electrical measurements (IEC 60270) [2], which is mandatory for acceptance at routine factory testing. Due to the standard, the apparent charge, QIEC, today is an essential factor regarding the insulation quality at transformers.
The UHF method is based on the measurement of electromagnetic waves radiated by PD. At first, UHF measurements were used for gas insulated switchgears (GIS) [8]. In GIS, UHF PD measurement is well established, and still evolving, e.g., for high voltage DC (HVDC) GIS [9,10]. When applied on transformers, the UHF method requires antennas inside the tank. Hence, Cigré recommends DN50 valves or dielectric windows for the fitting of UHF probes in technical brochure 343 [11]. The generalized propagation paths of both PD measurement methods are shown in Figure 1.
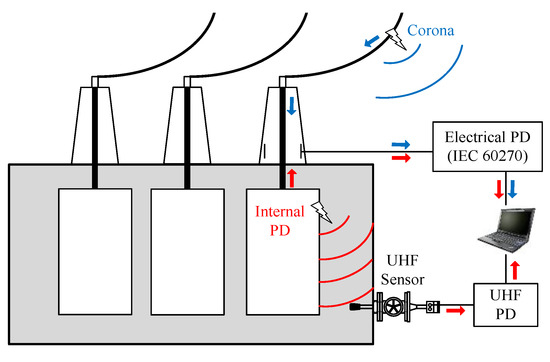
Figure 1.
Propagation of ultra-high frequency (UHF) signals, and measurement methods of partial discharge (PD) at a power transformer for both, internal PD (red) and external PD (blue) [12].
PD signals propagate due to the galvanic and capacitive coupling along the winding and can be detected at the measurement capacity either of a bushing (online monitoring) or with a standard coupling capacitor (not drawn). In contrast, electromagnetic signals of PD radiate in the oil-space of a power transformer. Usually, UHF PD measurements can be considered shielded against external electromagnetic disturbances, e.g., corona, by the grounded transformer tank, which acts as a Faraday cage [3,13] and the low-pass filter provided by capacitive graded bushings. Therefore, low-noise UHF measurements have been established for onsite/online diagnostic PD measurements [14], as a trigger for acoustic PD localization [5] and seem to be suitable for online PD monitoring [15,16,17] and UHF-only PD localization [18,19]. Combined UHF and acoustic sensors have been investigated to reduce the negative effect of the stiff structure of the transformer tank on acoustic signals and, therefore, increase the accuracy of PD localization [20,21]. Experimental investigations showed that the UHF method can detect small PD levels with good sensitivity [22,23], even when they are buried within insulation layers [24]. In contrast, the acoustic method can detect small PD levels only when the PD is in direct line of sight of the sensor [24]. To become an accepted quality verification factor, the UHF technology must be reliable so it can supplement electrical PD measurements. To achieve this, a standardized calibration procedure, which makes UHF measurement results of different systems comparable to each other, is lacking so far. Hence, the current UHF technology is not applied as acceptance criteria for type or routine tests. Nevertheless, UHF method was already used during acceptance tests for diagnostic purpose, e.g., to localize PD sources [25].
The comparability of electrical PD measurement systems is associated with their standardized calibration procedure. This enabled the introduction of acceptance levels using the apparent charge [2] at transformer routine tests using the apparent charge level, even though the actual PD charge remains unknown and the significance is limited.
Both, the measurable electrical and the UHF PD levels, are influenced by
- (1)
- type and magnitude of the PD source,
- (2)
- position of the PD and the related signal attenuation of the individual coupling path inside the transformer,
- (3)
- sensor sensitivity (the UHF antenna or the coupling capacitor and the quadrupole, respectively),
- (4)
- attenuation of measurement cables and the sensitivity of the particular measurement device.
For both PD measurement methods, the coupling path (2) inside the transformer cannot be calibrated. Which is why the actual PD source level remains unknown in both cases. The goal of calibration is to ensure comparability between different measurement devices, which can be achieved by eliminating the influences of sensors (3) and recording device (4).
2. UHF Calibration Proposal
The target of any calibration is to ensure a general comparability and reproducibility of measurements independent of used devices and setup conditions. It has to be noted, that the UHF calibration might not be misinterpreted as an attempt to correlate the readings of the UHF method (mV or mV/m) with the electrical method according IEC 60270 in terms of pico-Coulomb (pC).
There are two main factors that must be addressed by UHF calibration. The particular measurement device including accessories such as cables, filters, attenuators, pre-amplifiers, etc. is addressed in the first step of the calibration by introducing the correction factor K1, see Section 2.1. The influence of the UHF sensor, essentially its sensitivity and its conversion from an electric field strength to a voltage signal, is included using correction factor K2, see Section 2.2. Using the proposed UHF calibration method, different UHF measurement systems (including UHF sensors, cables, amplifiers, attenuators, filters, and measuring devices) become comparable when used at the same measurement position.
2.1. Calibration Method for Cables and Measurement Device (K1-Factor)
The measurement setup consisting of the recorder and connected cables (Figure 2) is exposed with a defined calibration impulse, see Figure 3.
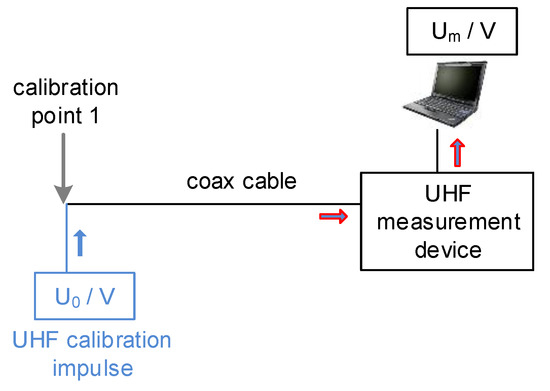
Figure 2.
Calibration setup for measurement device and cables to derive K1 factor [26].
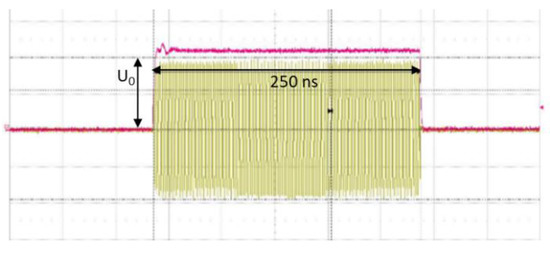
Figure 3.
Calibration impulse used: fsin = 500 MHz sinusoidal signal with Ton = 250 ns duration and defined amplitude U0.
This type of waveform is called pulse-modulated radio frequency (PuM RF) and consists of a sinusoidal signal with fsin = 500 MHz and a duration of Ton = 250 ns repeated two times per phase period (100 times per sec for 50 Hz systems). A minimum time, Ton, allows the input state of UHF measurement devices to tune on the correct signal amplitude. The signal is injected directly into the connector between antenna and cable/pre-amplifier without the antenna being attached, see Figure 2. Hence, all effects of cables and accessories are included.
From this device calibration, the factor K1 can be calculated:
: Sinusoidal reference amplitude.
: Voltage reading provided by device.
By introducing the K1 calibration factor, comparability between different measurement devices using arbitrary cables accessories can be achieved. The point of calibration is represented by the connection between cable connector and the UHF sensor.
2.2. Calibration Method for the UHF Sensor (K2-Factor)
The sensor’s characteristic is included into the calibrated system using its frequency-dependent antenna factor AF(f). The AF describes the conversion between the applied electric field strength and the resulting output voltage of a UHF sensor. Due to its definition, a low AF yields a high antenna sensitivity:
: Voltage at the antenna terminals.
: Electrical field strength at the antenna.
As previous investigations [27] show, highest sensitivity for drain valve UHF sensors is achieved at a minimum insertion depth of d = 50 mm, which is used in this contribution (side note: The insertion depth d has to be the identical during both, the AF determination and the UHF measurement in the transformer). The known transfer function provided by the AF allows to incorporate the sensor into the calibration, which is transferring the point of calibration into the transformer. Hence, the AF needs to be specified for any UHF sensor, which shall be used for UHF measurements.
2.2.1. AF Determination in GTEM Cell
The AF of UHF sensors has been determined within an air-filled transverse Electromagnetic (TEM) cell in previous investigations using a frequency range up to fmax = 950 MHz [3]. Because of the difference in permittivity (εr,air = 1, εr,oil ≈ 2,2), the AF of air measurements does not apply to transformer oil. Its frequency range needs to be recalculated (shifted) to meet the signal propagation speeds of oil. Note: Different oils may have different relative permittivities. The entire bandwidth of UHF sensors cannot be evaluated using only TEM cells. Hence, the correct AF evaluation requires an oil-filled measurement setup [28], which operates in the entirely used UHF frequency range or the usage of an air-filled gigahertz-TEM (GTEM) cell with factor times higher frequency range and subsequent conversion [29] to in-oil measurements. As a result, this contribution uses an oil-filled gigahertz transverse electromagnetic setup (GTEM cell) for K2 evaluation. An appropriate, specially designed oil-filled GTEM cell [12,28], as shown in Figure 4, is used to obtain the AF from the UHF antennas considered for the following calibration test. Note: As the real part of the relative permittivity is not temperature dependent [30], for AF(f) no oil temperature correction is needed.
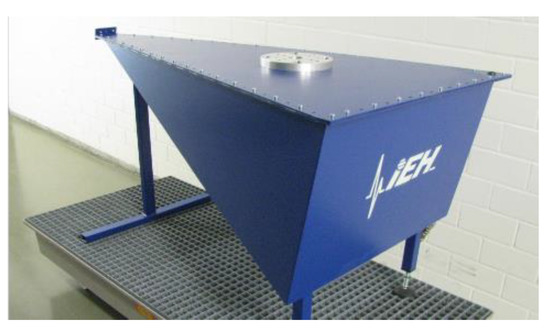
Figure 4.
Oil-filled gigahertz transverse electromagnetic (GTEM) cell with mounting plate for different types of UHF sensors [26].
Generally, in GTEM cell, a homogeneous electromagnetic field can be generated without ambient or environmental interferences. A test volume in the cell is defined for equipment under test (EUT) installation. A homogeneous electric field distribution, Ehom, and an orthogonal magnetic field of the TEM wave can be provided in this volume. This known Ehom is used for AF calculation.
The AF of an UHF sensor is measured by transmission factors derived from scattering parameter (S21) measurements, see Figure 5. The measurement setup contains the oil-filled GTEM cell, the installed UHF sensor and a vector network analyzer (VNA) as measurement device. The sensor insertion depth for drain valve sensors is set constant to d = 50 mm.
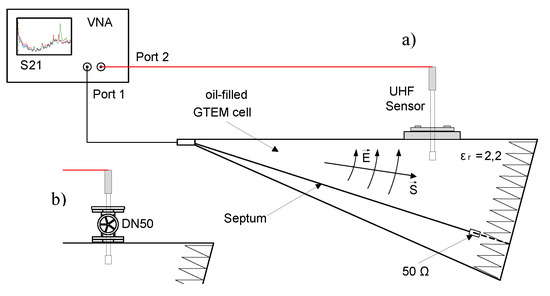
Figure 5.
Using scattering parameter (S21) measurements (transmission factor) for antenna factor, AF, determination [26]. (a) UHF sensor installed into the cell (direct mount). (b) UHF sensor mounted using an additional DN50 standard oil valve.
The UHF setup consists of the oil-filled GTEM cell as waveguide and a 2-port VNA for both, sinusoidal sweep source and measurement device from 300 kHz up to 3 GHz . Hereby, port 1 one of the VNA is connected to the cell's input. Port 2 simultaneously measures the UHF sensors' resulting antenna voltage using Scattering-Parameters (S-Parameters). By using the defined electric field in the cell, the transmission factor S21 is converted to the AF of the tested UHF sensor. Exemplarily, two different AF of a UHF drain valve sensor with and without oil valve are presented in Figure 6.
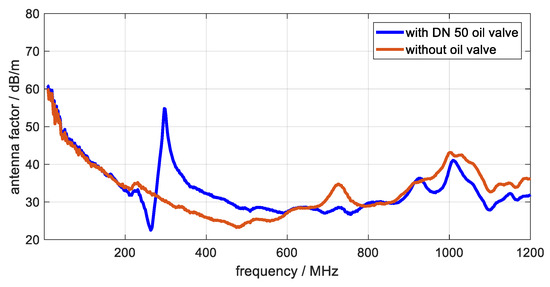
The used UHF sensor provides the best (meaning highest) sensitivity in the frequency range of 200 MHz up to 900 MHz (400 MHz to 900 MHz, respectively, with drain valve), where their AF is lowest. As Figure 6 illustrates, the oil valves have a noticeable influence on sensor’s AF. The valve’s influence peaks at approx. 300 MHz, see blue plot. Comparison of AF(f) and heff(f) measurements of commercially available UHF sensors show similar behavior for most sensors in this commonly used frequency range. As PD excitation is considered broadband, the measurable signal frequencies are mainly dependent on the path inside the device under test [31] and the frequency behavior of the measurement system itself (mainly the AF in this case).
2.2.2. Simplification of AF
In order to simplify the calibration procedure for broadband measurement systems, the frequency dependent AF(f) is reduced to a constant correction factor K2, which is valid with sufficient accuracy for most commonly used UHF PD frequency ranges. Based on the experience of the authors with commercially available UHF sensors and practical considerations, it is proposed to calculate the constant factor as the mean value of AF(f) from 300 to 750 MHz. In a first step, the AF(f) is calculated in its linear form, AFlin(f). For simplification and better comparability, the used UHF frequency range for all used devices should be set to 300–750 MHz. This can be provided either by internal filters or by the application of appropriate commercially available passive low-pass and high-pass filters at the input terminals of the measurement devices.
In a second step, the mean value in the corresponding frequency range is calculated, which yields correction factor K2.
Note: Often the effective antenna height is given for UHF sensors instead of the . can be transferred to by [29]:
As is mostly measured in air-filled arrangements, the results need to be corrected for in-oil measurements. This two-step procedure is described in [29].
Figure 7 shows a general example of the correlation between frequency-dependent AF(f) and the calculated simplified antenna factor AFs = K2.
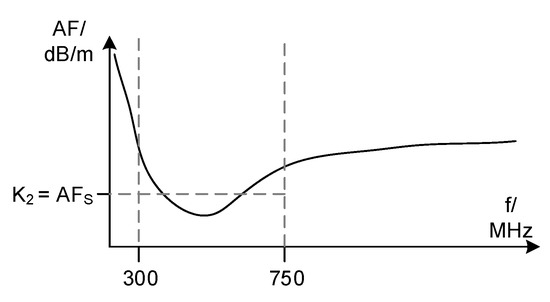
Figure 7.
Example of simplifying the AF to derive K2 [26].
Using K2 of the sensor, the new point of calibration is moved inside the transformer to the UHF antenna, see Figure 8. Hence, the measurement results of UHF PD systems become calibrated and comparable values of electric field strength at the sensor are measured in V/m.
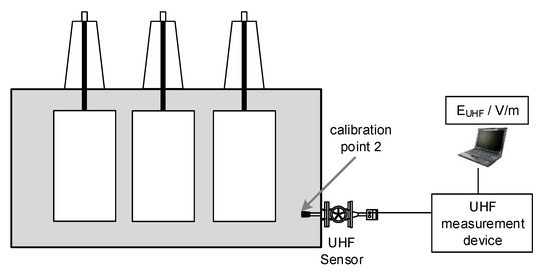
Figure 8.
Calibration point of the UHF sensor [26].
As the structure inside the specific transformer cannot be considered when defining K2 for the UHF sensor by measurement in a GTEM cell, it is only an approximation. This approximation seems quite good, because UHF waves mostly travel perpendicular to the transformer tank wall, which is the same in the GTEM cell setup, where AF is measured.
Furthermore, it has to be noted, that the proposed K2 calculation is valid only for UHF (broadband) systems. For narrowband measurement systems, the linear AFlin at the center frequency AFlin (fcenter) should be used for K2.
2.3. Calibration Method for the Entire UHF Measurement System
The complete UHF calibration factor KUHF is calculated by:
Using KUHF, an impulse, Ui, measured with the UHF measurement system can be recalculated and results in a value correlated to the incident electrical field strength at the UHF sensor.
This value is named “measured UHF electrical field strength” EUHF and is measured in mV/m.
Because this procedure incorporates only the measurement system, it is independent of any transformer it is applied to. Hence, it would be sufficient to calibrate a dedicated measurement system (UHF sensor, recorder, and cable setup) only once. The comparability to other calibrated systems is maintained, as long as no components of the dedicated system are changed (e.g., cables, etc.).
It has to be noted, that a performance check (explained later) is additionally recommended to demonstrate the functionality of the measurement chain on a case-by-case basis.
2.4. Comparison of Electrical and UHF Calibration Procedure—Differentiation
Preamble: Numerous publications use calibration of UHF sensors as a synonym for the correlation between measured UHF antenna voltage (in mV, dBm, etc.) and the apparent charge (in pC) of the electrical measurement. This correlation is considered as being not possible in general, because the signal propagation of electrical measurement and UHF measurement inside a transformer is intrinsically unknown for both and, hence, not comparable. As a result, many publications conclude subsequently, that UHF calibration is not possible [32]. It is important to emphasis (again), that correlation and calibration represent two entirely independent issues and must not be mistaken. Calibration only aims to eliminate influences of measurement devices and accessories for one specific type of measurement. It does not yield any connections between two different measurement techniques.
Both values, the apparent charge (qapparent) of the electrical PD measurement and the electrical field strength, EUHF, are influenced by their individual unknown propagation paths inside the transformer. This generally prohibits a direct conclusion from the measured PD reading to the actual PD source level in both cases.
A general consideration of calibration methods for UHF and electrical measurements is determined in the following. Figure 9 shows both calibration procedures and all transfer functions (TF) necessary for the individual calibration. The propagation of electric vs. electromagnetic signals in transformers fundamentally differs. Hence, the individual attenuation will differ. The winding serves as a conducting propagation path for the electrical PD measurement and therefore the acquired frequency band may be reduced to a few 100 kHz and even below in order to prevent unacceptable attenuation [2]. Electromagnetic signal propagation within the UHF range can be interpreted as a radiated emission through the space of the transformer, in oil and pressboard. During its propagation, the electromagnetic wave can be attenuated along its path or reflected by metallic parts. The TF inside the transformer remains unknown in any case. Because it is part of the tested device (the transformer) and not of the measurement setup, it cannot be included in a calibrated path.
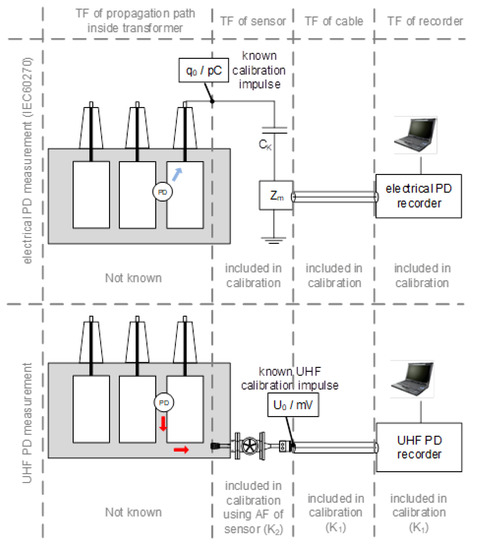
Figure 9.
Comparison of PD measurement setups and their individual calibration methods [26].
3. Performance Check
As the proposed calibration method incorporates the measurement devices, but does not show general sensitivity towards electromagnetic signals emitted inside the transformer, a performance check is required, at least for drain valve sensors. The performance check can be achieved by using a second UHF sensor as active device sending test signals. Assuming a UHF sensor is installed at a drain valve that is electromagnetically shielded e.g., by tubes or metal plates from the inside of the transformer, the performance check will fail and indicate, that the sensor position cannot be used for UHF PD measurements.
A performance check on the individual sensor position at a transformer complements the calibration of the measurement setup. In other words: Only a calibrated UHF PD measurement with a subsequent performance check ensures the comparability and sensitivity of the individual setup, see Figure 10.

Figure 10.
Performance-check setup [33].
For the current state-of-the-art performance check, it is important to document the used impulse form for the emission, the amplitude of emitting signal, and setup information such as distance of probes, make and model of probes, lengths of cables, amplification, etc. The authors are working on a documentation spreadsheet, which might be used in the future.
It has to be noted, that the proposed performance check can only be done when two or more sensors are installed at a transformer. In contrast, the so-called “single-port performance check” at a single UHF sensor, which is also incorporated in IEC TS 62478 [34] cannot show whether the sensor is installed with or without shielding against the inside of the transformer. It can only show, that the cabling between recorder and sensor is correct.
4. Laboratory Test of UHF Calibration Proposal
The proposed calibration procedure is tested in a laboratory setup for different measurement devices. For simplification and better comparability, the used UHF frequency range for all used devices is set to 300–750 MHz. The frequency band is provided by the application of appropriate commercially available passive low-pass and high-pass filters, which are connected between the signal cable and the measuring devices at any time.
4.1. Calibration of Measurement Device and Cables
The measurements follow the proposed procedure in Section 2.1 in order to determine the calibration factor K1. The introduced signal (PuM RF) from Figure 2 with known amplitude, U0, is injected directly into the four different measuring devices including the bandpass filters and cables.
The specifications of the determined measurement systems are as following:
- DSO:
- Digital sampling oscilloscope (DSO) with 4 GHz analog bandwidth, 40 GS/s sampling rate and eight-bit vertical resolution
- MS1:
- Test system A: Six-channel UHF PD monitoring system with 12-bit vertical resolution.
- MS2:
- Test system B: Four-channel UHF module of a transformer monitoring system with 12-bit vertical resolution.
- Spec:
- Spectrum analyser with 2.9 GHz bandwidth.
All devices are equipped with an RG 214 coaxial cable of 20 m length. Only the “DSO 40 m” measurement is measured with the same cable type, but of 40 m length. The results are shown in Figure 11.
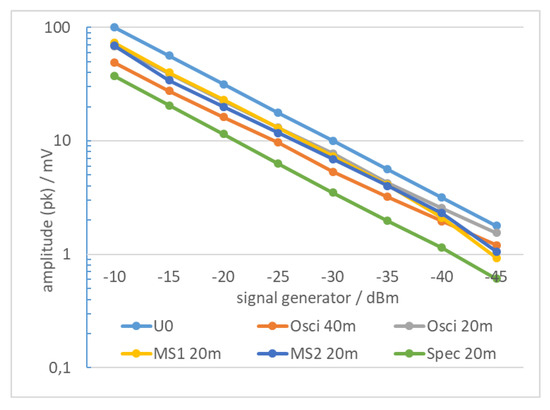
Figure 11.
Comparison of measurement systems.
The x-axis represents the output power of the PuM RF signal in dBm. The y-axis represents the measured peak amplitude of the different devices in mV. Plot U0 gives the calculated reference value from the signal generators in dBm. When comparing the results, the expected influence of an additional cable length of 20 m can be seen between the DSO 20 m and DSO 40 m results. At identical signal generator output, the measuring reading is slightly lower due to cable attention over the entire input range. All systems show a good linearity over the entire input range. Hence, a calibration using a constant K1-factor is possible to correct the constant offset. The spectrum analyzer settings are the following: 500 MHz, zero span, 2 MHz receiver bandwidth (RBW), 3 MHz video bandwidth (VBW). The power measured at 500 MHz was used to calculate the corresponding peak voltage at 50 Ω.
For the actual K1 calibration, the measured value at −25 dBm is used. Resulting K1 calibration factors are displayed in Table 1.

Table 1.
Measured voltage, used K factors, and calibrated UHF reading of all devices.
4.2. Calibration of UHF Sensors
Exemplarily, two drain valve sensors are characterized in a GTEM cell (see Section 2.2.1) and K2 is calculated in the used frequency range at 50 mm insertion depth according to Section 2.2.2, see Figure 12.
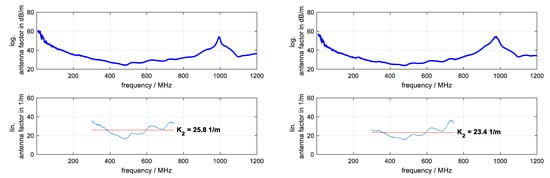
Figure 12.
AF(f) and corresponding K2 of UHF sensors no 1 and no 2.
4.3. Laboratory Setup Using an Artificial UHF Signal (PuM RF)
For a valid calibration, the same cables (for correct K1) and the same insertion depth of the UHF sensor (for correct K2) must be used. Measurements are performed in a steel tank (Figure 13) equipped with an active part of a 1350 kVA distribution transformer.
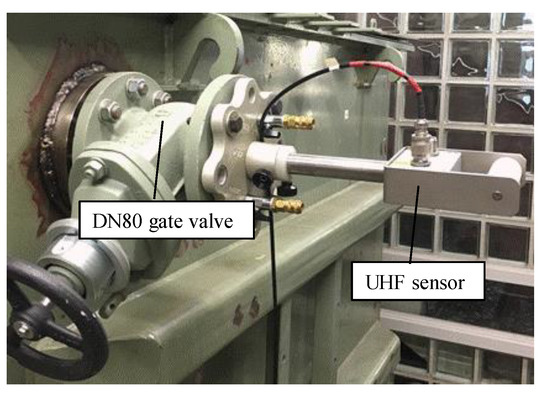
Figure 13.
UHF drain valve sensor mounted with a DN80 gate valve.
Inside dimensions of the transformer tank are 1720 mm length, 760 mm width, and 1550 mm height, respectively. On the tank wall, there are two DN50 and two DN80 gate valves. In Figure 13 the installed drain valve sensor no 1 with K2 = 25.8 1/m is shown. For the measurements, a second UHF sensor is used with the signal generator to get a stable impulse, which is identical for all measurement devices, see Figure 14. In Figure 15, a phase resolved partial discharge (PRPD) pattern of MS1 exemplarily shows the stable impulse of the excitation using the signal generator in this laboratory setup.
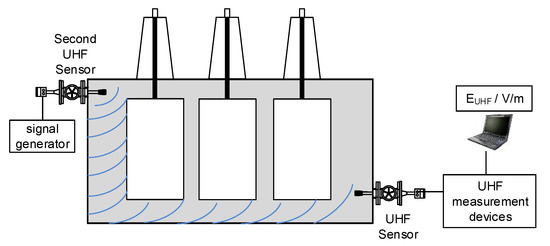
Figure 14.
Schematic of the laboratory setup with two UHF sensors on a transformer tank [33].
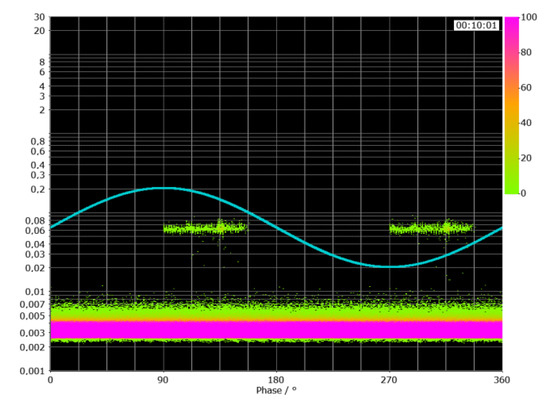
Figure 15.
PRPD of measured pulse-modulated (PuM) RF signal.
4.4. Laboratory Results Using an Artificial UHF Signal (PuM RF)
Measurements for the described devices are performed at fixed sensor positions for both, sending (as artificial PD source) and receiving UHF sensor, as seen in Figure 14. Table 1 shows the measured Ui values (peak) and the corresponding calibrated EUHF values using K1 and K2 calibration factors according Formulas (5) and (6).
All calibrated values are at approximately EUHF = 395 mV/m with standard deviation approx. ±20 mV/m and a maximum deviation below ±10%. Taking into account the various sources of errors, such as manual readings of measurement values form the screens of all devices, this deviation is considered acceptable for that first investigation.
Further work is necessary to focus on reducing the various sources of errors by defining measurement procedures, measurement equipment, and measurement evaluation such as e.g., defined in IEC 60270 [2].
4.5. Measurement of a Real PD Source with Different Calibrated UHF PD Measuring Systems
An AC voltage in the range of approx. 12 kV is applied to the active part inside the laboratory steel tank at different bushings and internal real PD sources are triggered/activated. To demonstrate that all calibrated measuring systems result in the same or comparable electrical field strength, EUHF, the applied voltage is kept higher than the PD inception voltage (PDIV) and the source is tried to be kept constant to guarantee a constant PD reading while the measuring systems are exchanged.
Figure 16 shows the challenge, to identify a measurement reading for comparison by manually evaluating UHF PRPD values. The screenshots show the PRPDs from different measuring systems, which are not calibrated, representing the variety of different visualization approaches and the reason, why UHF PD measurements have been regarded as not comparable in the past. The various visualizations of PRPDs consist of:
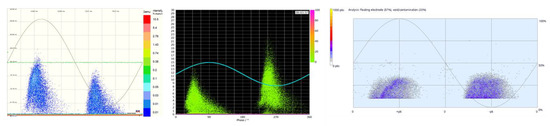
Figure 16.
UHF PRPDs of the same PD source with different visualizations: Left: MS3 scaled in nV linear; middle: MS2 scaled in mV linear (phase shifted); right: MS4 scaled in % logarithmic.
- -
- different scaling (logarithmic vs. linear)
- -
- different y-axis values (nV, mV, dBm, dBµV, %, and even pC have been seen falsely)
- -
- different color bar accumulation for PDs/sec (scaling, used colors, logarithmic vs. linear)
- -
- etc.
Note: The systems have been synchronized either to the applied test voltage, by their voltage supply, or using the light inside the laboratory. Therefore, phase shifts are obvious between the systems.
The specifications of the determined measurement systems are as following:
- MS2:
- Four-channel UHF module of a transformer monitoring system.
- MS3:
- UHF converter for electrical PD measurement device.
- MS4:
- Mobile UHF measurement device.
After calibration and applying a comparable plotting setup, these PRPDs should look the same and give the same EUHF reading on the y-axis. e.g., for the two linear scaled PRPDs, phase shifts are corrected and their y-axes are rescaled (which can be considered as applying the proposed UHF calibration procedure). Figure 17 shows the result, which yields high comparability.
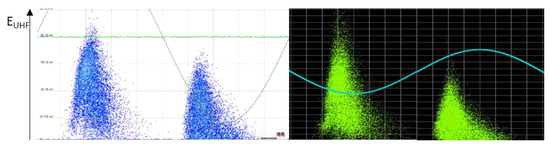
Figure 17.
UHF PRPDs of real PD source 1 after rescaling (calibration) with linear y-axis on MS3 and MS2.
The results of two measuring systems are summarized in Table 2 for the measurement of PD source 1 shown in Figure 17.
Table 2.
Measured voltage, used K factors, and calibrated UHF reading at sensor 1 for PD source 1.
As a second example, the same process (scaling on y-axis and phase correction) was performed for a second PD source, which is activated when appling voltage to a different bushing at the test tank. Again, this source is measured using different UHF measurement devices. In this case, the PRPDs are plotted with logarithmic scaling, see Figure 18.
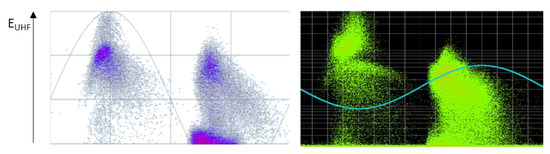
Figure 18.
PRPDs of the second real PD source 2 after rescaling (calibration) with logarithmic y-axis on MS4 and MS2.
In both cases, the color bar could not be changed, therefore the patterns can not look exactly the same. However, to derive a calibrated UHF value, scaling in y-axis is of sufficient accuaracy.
The results of the second measured real PD source are summarized in Table 3.
Table 3.
Measured voltage, used K factors, and calibrated UHF reading at sensor 2 for PD source 2.
The larger deviation of the calibrated UHF values in Table 2 and Table 3 compared to the results using a stable artificial impulse in Table 1 can be explained mainly by the error in manual reading of the values out of the real PRPDs. Figure 17 and Figure 18 show an expected similar PRPD shape after rescaling the y-axis. These results indicate, that a general calibration of the UHF method is possible if calibration is done correctly and the various errors, which occurred during this first test setup can be reduced to a minimum.
One major issue to address is the manual reading of UHF peak values out of PRPDs. Like for the electrical PD measurement method, an algorithm similar to the algorithm described in IEC 60270 to display the “largest repeatedly occurring (UHF) PD magnitude” could be applied to minimize erroneous manual readings. Moreover, all manufacturers need to incorporate the facility to perform calibration in their software and rescale the visualization accordingly.
5. Conclusions
Like any other comparable measurement method, the UHF method requires a calibration process. Otherwise, reproducibility is not provided, meaning measurements of different systems or from different dates cannot be compared to each other. Regarding high-voltage assets, this comparability is an essential requirement for a PD measurement method for acceptance tests.
The standardization of UHF PD measurement can be achieved using calibration. Whereas for electrical PD measurements is comparatively easy, the proposed UHF calibration consists of two steps, because the specific antenna-characteristics of the UHF sensor must be included separately into the entire calibration path, like for any other field measurement system (such as conventional EMC measurements). These characteristics have to be obtained in a separate step and then be included into the system calibration. Therefore, the proposed calibration is a two-step process: The first step results in calibration factor K1 and eliminates the influence of the signal recorder and additional accessories such as cable damping. This is achieved by the use of a defined impulse, which is injected into the UHF measurement system (no UHF sensor used). Hence, all deviations in the measurement can be corrected. The second step results in calibration factor K2 and includes the individual sensor’s characteristics, namely its antenna factor (AF) into the calibration. The AF represents the ability of a sensor to convert the electric field strength into a voltage signal. It can be measured, e.g., by using a reproducible setup, such as, the discussed GTEM cell filled with oil.
It is important to note, that calibration provides comparability and reproducibility between different UHF measurement systems, but does not state any information about signal quality inside the transformer. Hence, an additional performance check is proposed. It uses a second installed sensor and an impulse generator as artificial signal source, which enables a first estimation of UHF signal damping inside the transformer. It has to be noted that calibration must not be confused with correlation between UHF and conventional electrical measurements.
The basic feasibility of the proposed calibration method is demonstrated in a laboratory setup by using different UHF PD measurement devices, which reveals a total measuring inaccuracy of just approximately 10% with four different measurement systems in a setup with artificial stable “PD source”. In the same laboratory setup, two real PD sources are triggered using high voltage. With five different measurement devices and two different sensors, the calibration proposal is tested, again. The evaluation of the results shows higher errors than when using the artificial source, which can be explained by different scaling of the systems, manual reading of the values out of PRPDs, etc. These errors need to be reduced in the future.
6. Outlook
Like for the electrical PD measurement method, an algorithm similar to the algorithm described in IEC 60270 to display the “largest repeatedly occurring (UHF) PD magnitude” should be applied. Additionally, all manufacturers need to incorporate the facility to perform K1 and K2 calibration in their software and rescale the visualization accordingly to mV/m.
With UHF measurement systems that have incorporated the proposed UHF calibration procedure and the automatic output of the “largest repeatedly occurring (UHF) PD magnitude”, a measurement campaign similar to the presented laboratory test needs to be done.
With these systems, the community can then gain experiences in calibrated UHF measurements and may identify criteria for UHF PD testing. With some years of experience using calibrated UHF measurement at power transformers, it may become possible to define acceptance levels for factory and site acceptance tests (FAT and SAT) in the future.
The performance check can be further evaluated if it could be used as a kind of sensitivity estimation of the following measurements or characterization of the unknown transformer internal traveling path.
Author Contributions
Conceptualization, M.S.; data curation, M.S., S.C., and M.B.; investigation, M.S., S.C., M.B., S.T., M.W., P.F., S.M.H., U.K., R.S., T.L., and J.F.; supervision, S.T.; visualization, M.S.; writing—original draft, M.S. and S.C.; writing—review and editing, M.S., S.C., M.B., S.T., M.W., P.F., S.M.H., U.K., R.S., T.L., and J.F.
Funding
This research received no external funding.
Conflicts of Interest
The authors declare no conflict of interest.
References
- Fuhr, J. Procedure for identification and localization of dangerous PD sources in Power transformers. IEEE Trans. Dielectr. Electr. Insul. 2005, 12, 1005–1014. [Google Scholar] [CrossRef]
- International Electrotechnical Commission IEC 60270 High Voltage Test Techniques—Partial Discharge Measurements; IEC Central Office: Geneva, Switzerland, 2000.
- Coenen, S. Measurements of Partial Discharges in Power Transformers using Electromagnetic Signals; Books on Demand GmbH: Stuttgart, Germany, 2012. [Google Scholar]
- Jahangir, H.; Akbari, A.; Werle, P.; Akbari, M.; Szczechowski, J. UHF characteristics of different types of PD sources in power transformers. In Proceedings of the Iranian Conference on Electrical Engineering (ICEE), Tehran, Iran, 2–4 May 2017. [Google Scholar]
- Coenen, S. UHF and acoustic partial discharge localization in power transformers. In Proceedings of the International Symposium on High Voltage Engineering (ISH), Hannover, Germany, 22–26 August 2011. [Google Scholar]
- Zmarzly, D.; Nagi, L.; Borucki, S.; Boczar, T. Analysis of ionizing radiation generated by partial discharges. In Proceedings of the 8th International Conference NEET 2013, Zakopane, Poland, 18–21 June 2013. [Google Scholar]
- Nagi, L.; Zmarzły, D.; Boczar, T.; Fracz, P. Detection of high-energy ionizing radiation generated by electrical discharges in oil. IEEE Trans. Dielectr. Electr. Insul. 2016, 23, 2036–2041. [Google Scholar] [CrossRef]
- CIGRE TF 15/33.03.05 PD Detection Systems for GIS: Sensitivity Verification for the UHF Method and the Acoustic Method; No. 183; CIGRE Electra: Paris, France, 1999.
- Xiong, J.; Wang, Y.; Ma, G.M.; Zhang, Q.; Zheng, S.S. Field applications of ultra high frequency techniques for defect detection in GIS. Sensors 2018, 18, 2425. [Google Scholar] [CrossRef] [PubMed]
- Wenger, P.; Beltle, M.; Tenbohlen, S.; Riechert, U.; Behrman, G. Combined characterization of free-moving particles in HVDC-GIS using UHF PD, high-speed imaging, and pulse-sequence analysis. IEEE Trans. Power Deliv. 2019, 34, 1540–1548. [Google Scholar] [CrossRef]
- CIGRE WG A2.27, Recommendations for Condition Monitoring and Condition Assessment Facilities for Transformers; CIGRE Technical Brochure TB 343; CIGRE: Paris, France, 2008.
- Tenbohlen, S.; Siegel, M.; Beltle, M.; Reuter, M. Suitability of ultra high frequency partial discharge measurement for quality assurance and testing of power transformers. In Proceedings of the CIGRE SC A2 & C4 Joint Colloquium, Zurich, Switzerland, 8–14 September 2013. [Google Scholar]
- Judd, M.D.; Yang, L.; Hunter, I.B. Partial discharge monitoring of power transformers using UHF sensors Part I: Sensors and signal interpretation. IEEE Electr. Insul. Mag. 2005, 21, 5–14. [Google Scholar]
- CIGRE WG D 1.33, Guidelines for Unconventional Partial Discharge Measurements; CIGRE Technical Brochure TB 444; CIGRE: Paris, France, 2010.
- Judd, M. Power transformer monitoring using UHF sensors: Installation and testing. In Proceedings of the IEEE International Symposium on Electrical Insulation, Anaheim, CA, USA, 5 April 2000. [Google Scholar]
- Drexler, P.; Cáp, M.; Fiala, P.; Steinbauer, M.; Kadlec, R.; Kaška, M.; Kociš, L. A sensor system for detecting and localizing partial discharges in power transformers with improved immunity to interferences. Sensors 2019, 19, 923. [Google Scholar] [CrossRef] [PubMed]
- Li, J.; Li, X.; Du, L.; Cao, M.; Qian, G. An Intelligent sensor for the ultra-high-frequency partial discharge online monitoring of power transformers. Energies 2016, 9, 383. [Google Scholar] [CrossRef]
- Dukanac, D. Application of UHF method for partial discharge source location in power transformers. IEEE Trans. Dielectr. Electr. Insul. 2018, 25, 2266–2278. [Google Scholar] [CrossRef]
- Tang, Z.; Li, C.; Huang, X.; Li, Z.; Fu, S. The feasibility of locating PD source in transformer using the UHF technology. In Proceedings of the 17th Annual Meeting of the IEEE Lasers and Electro-Optics Society (LEOS), Boulder, CO, USA, 20 October 2004. [Google Scholar]
- Sikorski, W. Active dielectric window: A new concept of combined acoustic emission and electromagnetic partial discharge detector for power transformers. Energies 2019, 12, 115. [Google Scholar] [CrossRef]
- Beltle, M.; Siegel, M.; Tenbohlen, S. Investigations of in-oil methods for PD detection and vibration measurement. In Proceedings of the International Symposium on High voltage Engineering (ISH), Seoul, Korea, 25–30 August 2013. [Google Scholar]
- Jung, J.R.; Hwang, K.R.; Kim, Y.M.; Lyu, E.T.; Yang, H.J. Sensitivity verification and application of UHF sensor for partial discharge measurement in high voltage power transformer. In Proceedings of the IEEE International Conference on Condition Monitoring and Diagnosis, Bali, Indonesia, 23–27 September 2012. [Google Scholar]
- Kunicki, M. Variability of the UHF signals generated by partial discharges in mineral oil. Sensors 2019, 19, 1392. [Google Scholar] [CrossRef] [PubMed]
- Kuppuswamy, R.; Lelaidier, S. Experience with UHF partial discharge measurements. In Proceedings of the IEEE 14th International Conference on Dielectric Liquids (ICDL), Graz, Austria, 12 July 2002. [Google Scholar]
- Meijer, S.; Agoris, P.D.; Smit, J.J.; Judd, M.D.; Yang, L. Application of UHF diagnostics to detect PD during power transformer acceptance tests. In Proceedings of the IEEE International Symposium on Electrical Insulation, Toronto, Canada, 11–14 June 2006. [Google Scholar]
- Siegel, M.; Tenbohlen, S. Calibration of UHF partial discharge measurement for power transformers and a comparison to the calibration of electrical PD measurement. In Proceedings of the Electrical Insulation Conference (EIC), Montreal, QC, Canada, 19–22 June 2016. [Google Scholar]
- Siegel, M.; Beltle, M.; Tenbohlen, S.; Coenen, S. Application of UHF sensors for PD measurement at power transformers. Trans. Dielectr. Electr. Insul. 2017, 24, 331–339. [Google Scholar] [CrossRef]
- Siegel, M.; Tenbohlen, S. Design of an oil-filled GTEM cell for the characterization of UHF PD sensors. In Proceedings of the International Conference on Condition Monitoring and Diagnosis (CMD), Jeju, Korea, 21–25 September 2014. [Google Scholar]
- Judd, M.; Siegel, M.; Coenen, S. UHF PD sensor characterisation using GTEM cells. In Proceedings of the ETG Conference, Berlin, Germany, 12–14 November 2018. [Google Scholar]
- Pattanadech, N.; Maneerot, S.; Jariyanurat, K.; Nimsanong, P. Electrical characteristic comparison of mineral oil and natural ester for transformer applications. In Proceedings of the IEEE International Electrical Engineering Congress (iEECON), Pattaya, Thailand, 8–10 March 2017. [Google Scholar]
- Mitchel, S.D.; Siegel, M.; Beltle, M.; Tenbohlen, S. Discrimination of partial discharge sources in the UHF domain. IEEE Trans. Dielectr. Electr. Insul. 2016, 23, 1068–1075. [Google Scholar] [CrossRef]
- Jahangir, H.; Akbari, A.; Werle, P.; Szczechowski, J. Possibility of PD calibration on power transformers using UHF probes. IEEE Trans. Dielectr. Electr. Insul. 2017, 24, 2968–2976. [Google Scholar] [CrossRef]
- Coenen, S.; Hässig, M.; Siegel, M.; Fuhr, J.; Neuhold, S.; Brügger, T.; Hoek, S.M.; Linn, T. Placement of UHF sensors on power transformers. In Proceedings of the VDE High Voltage Technology 2018 ETG-Symposium, Berlin, Germany, 12–14 November 2018. [Google Scholar]
- International Electrotechnical Commission (IEC). IEC TS 62478:2016, High Voltage Test Techniques—Measurement of Partial Discharges by Electromagnetic and Acoustic Methods; International Electrotechnical Commission (IEC): Geneva, Switzerland, 2016. [Google Scholar]
© 2019 by the authors. Licensee MDPI, Basel, Switzerland. This article is an open access article distributed under the terms and conditions of the Creative Commons Attribution (CC BY) license (http://creativecommons.org/licenses/by/4.0/).