1. Introduction
Power transformers are among the fundamental elements of the energy system. Reliable and trouble-free operation of transformers determines a stable supply of energy to consumers, which is why the constant monitoring of the internal condition of these units is necessary. The increasing age of the transformer population has the effect of reducing the reliability and availability of the energy system and, as a consequence, increasing distribution costs and reducing the value of energy sales. Hence, a reliable assessment of their technical condition is becoming more and more important.
There are several generally accepted and standardized technical condition assessment technics for transformers [
1]. Online diagnostic is commonly used, because this allows detection of various types of defects and stresses without disconnecting the units from the electrical grid. Technological developments enable the continuous onsite monitoring of the transformers’ condition, which provides automatic evaluation, trending and early detection of oncoming failures. Major failures of transformers, leading to their removal from service, generates high costs related to necessary remedial work (sometimes away from the installation site, e.g., back in the factory) and decreases the reliability of the energy system.
Not less important for maintaining the good technical condition of transformers are offline diagnostic methods. In contrast to online methods, offline ones require disconnecting the transformer from the electrical grid; thus, they are performed during planned inspections once every few years and, ultimately, are more expensive.
The evaluation of the technical condition of power transformers is carried out using many technical methods, both online and offline, which in combination with economic methods give a complete picture of the most efficient maintenance strategy.
Accurate knowledge about the major failures of power transformers and their equipment is essential not only for manufacturers to improve the quality of their products, but also for electric utilities when planning purchases, organizing maintenance and benchmarking their performance. The worldwide transformer reliability survey was performed by The International Council on Large Electric Systems (CIGRE) work group A2.37. The working group collected 964 major failures that occurred in the period from 1996 to 2010 in transformers with a voltage class of 69kV and above. The survey has shown that the main failure modes across all voltage classes are dielectrical (36.6%), mechanical (20%), electrical (16.5%) and thermal (10.9%). Taking into consideration the damage location, the main contributors were winding (36.6%), tap changer (23.2%) and bushing (14.4%) related failures. Failures initiated in the core and magnetic circuit represent about 4% [
2].
Mechanical damage to the active parts of transformers occur mainly as a result of short circuits, but also during overvoltages, seismic events or other shocks (e.g., when transporting the unit) and result in bending, breaking, displacement, loosening and vibration in a winding and in a magnetic circuit.
Frequency Response Analysis (FRA) is used to assess the mechanical condition of the active part of a transformer, mainly the mechanical damage to the windings. The FRA test is currently one of the standard post-production and periodic power transformers measurements. It is recommended to test the frequency response particularly after the shipment of transformers and after events where high currents have occurred. Several frequency response analyzers are available on the market. Furthermore, the FRA diagnostic method has been standardized and described in IEC 60076-18 [
3] and other documents [
4,
5], which provide the baseline for FRA practice.
FRA is a comparative method and involves the comparison of two measured frequency response curves. Consequently, it needs the reference measurement of the same unit, the so-called fingerprint, measured at the factory on a newly built transformer or in its healthy state (i.e., after installation on the worksite). Differences between the reference curve and the one obtained after an incident may indicate the occurrence of mechanical distortion of the active part of the tested transformer.
FRA measurement is typically based on applying a low voltage sinusoidal signal to the one of the transformer terminals and measuring the response signal on the impedance connected to the other terminal. Measurement of the frequency response can be performed in several configurations, but according to the standard [
3], the main one is an end-to-end open configuration, which consists of injecting the signal at the beginning of the winding and measuring it at the end. This test is simple, takes only the tested winding into consideration, with some influence of the capacitances of other windings, and allows each winding to be examined separately. The remaining windings stay open during the measurement, which results in a visible influence of the core characteristics on FRA diagrams, especially at low frequencies. Therefore, this makes it suitable for magnetic core assessment [
4,
6].
The results of FRA measurements are usually presented as Bode plots, where the magnitude is the scalar ratio of the output (
U2) and input (
U1) signal evaluated as a signal damping in dB. The magnitude is usually denoted as FRA. The phase angle shift of the frequency response in degrees is also evaluated:
The frequency response (FR) curves are usually presented on a logarithmic scale, which allows analysis of the results in all frequency ranges, from low to high.
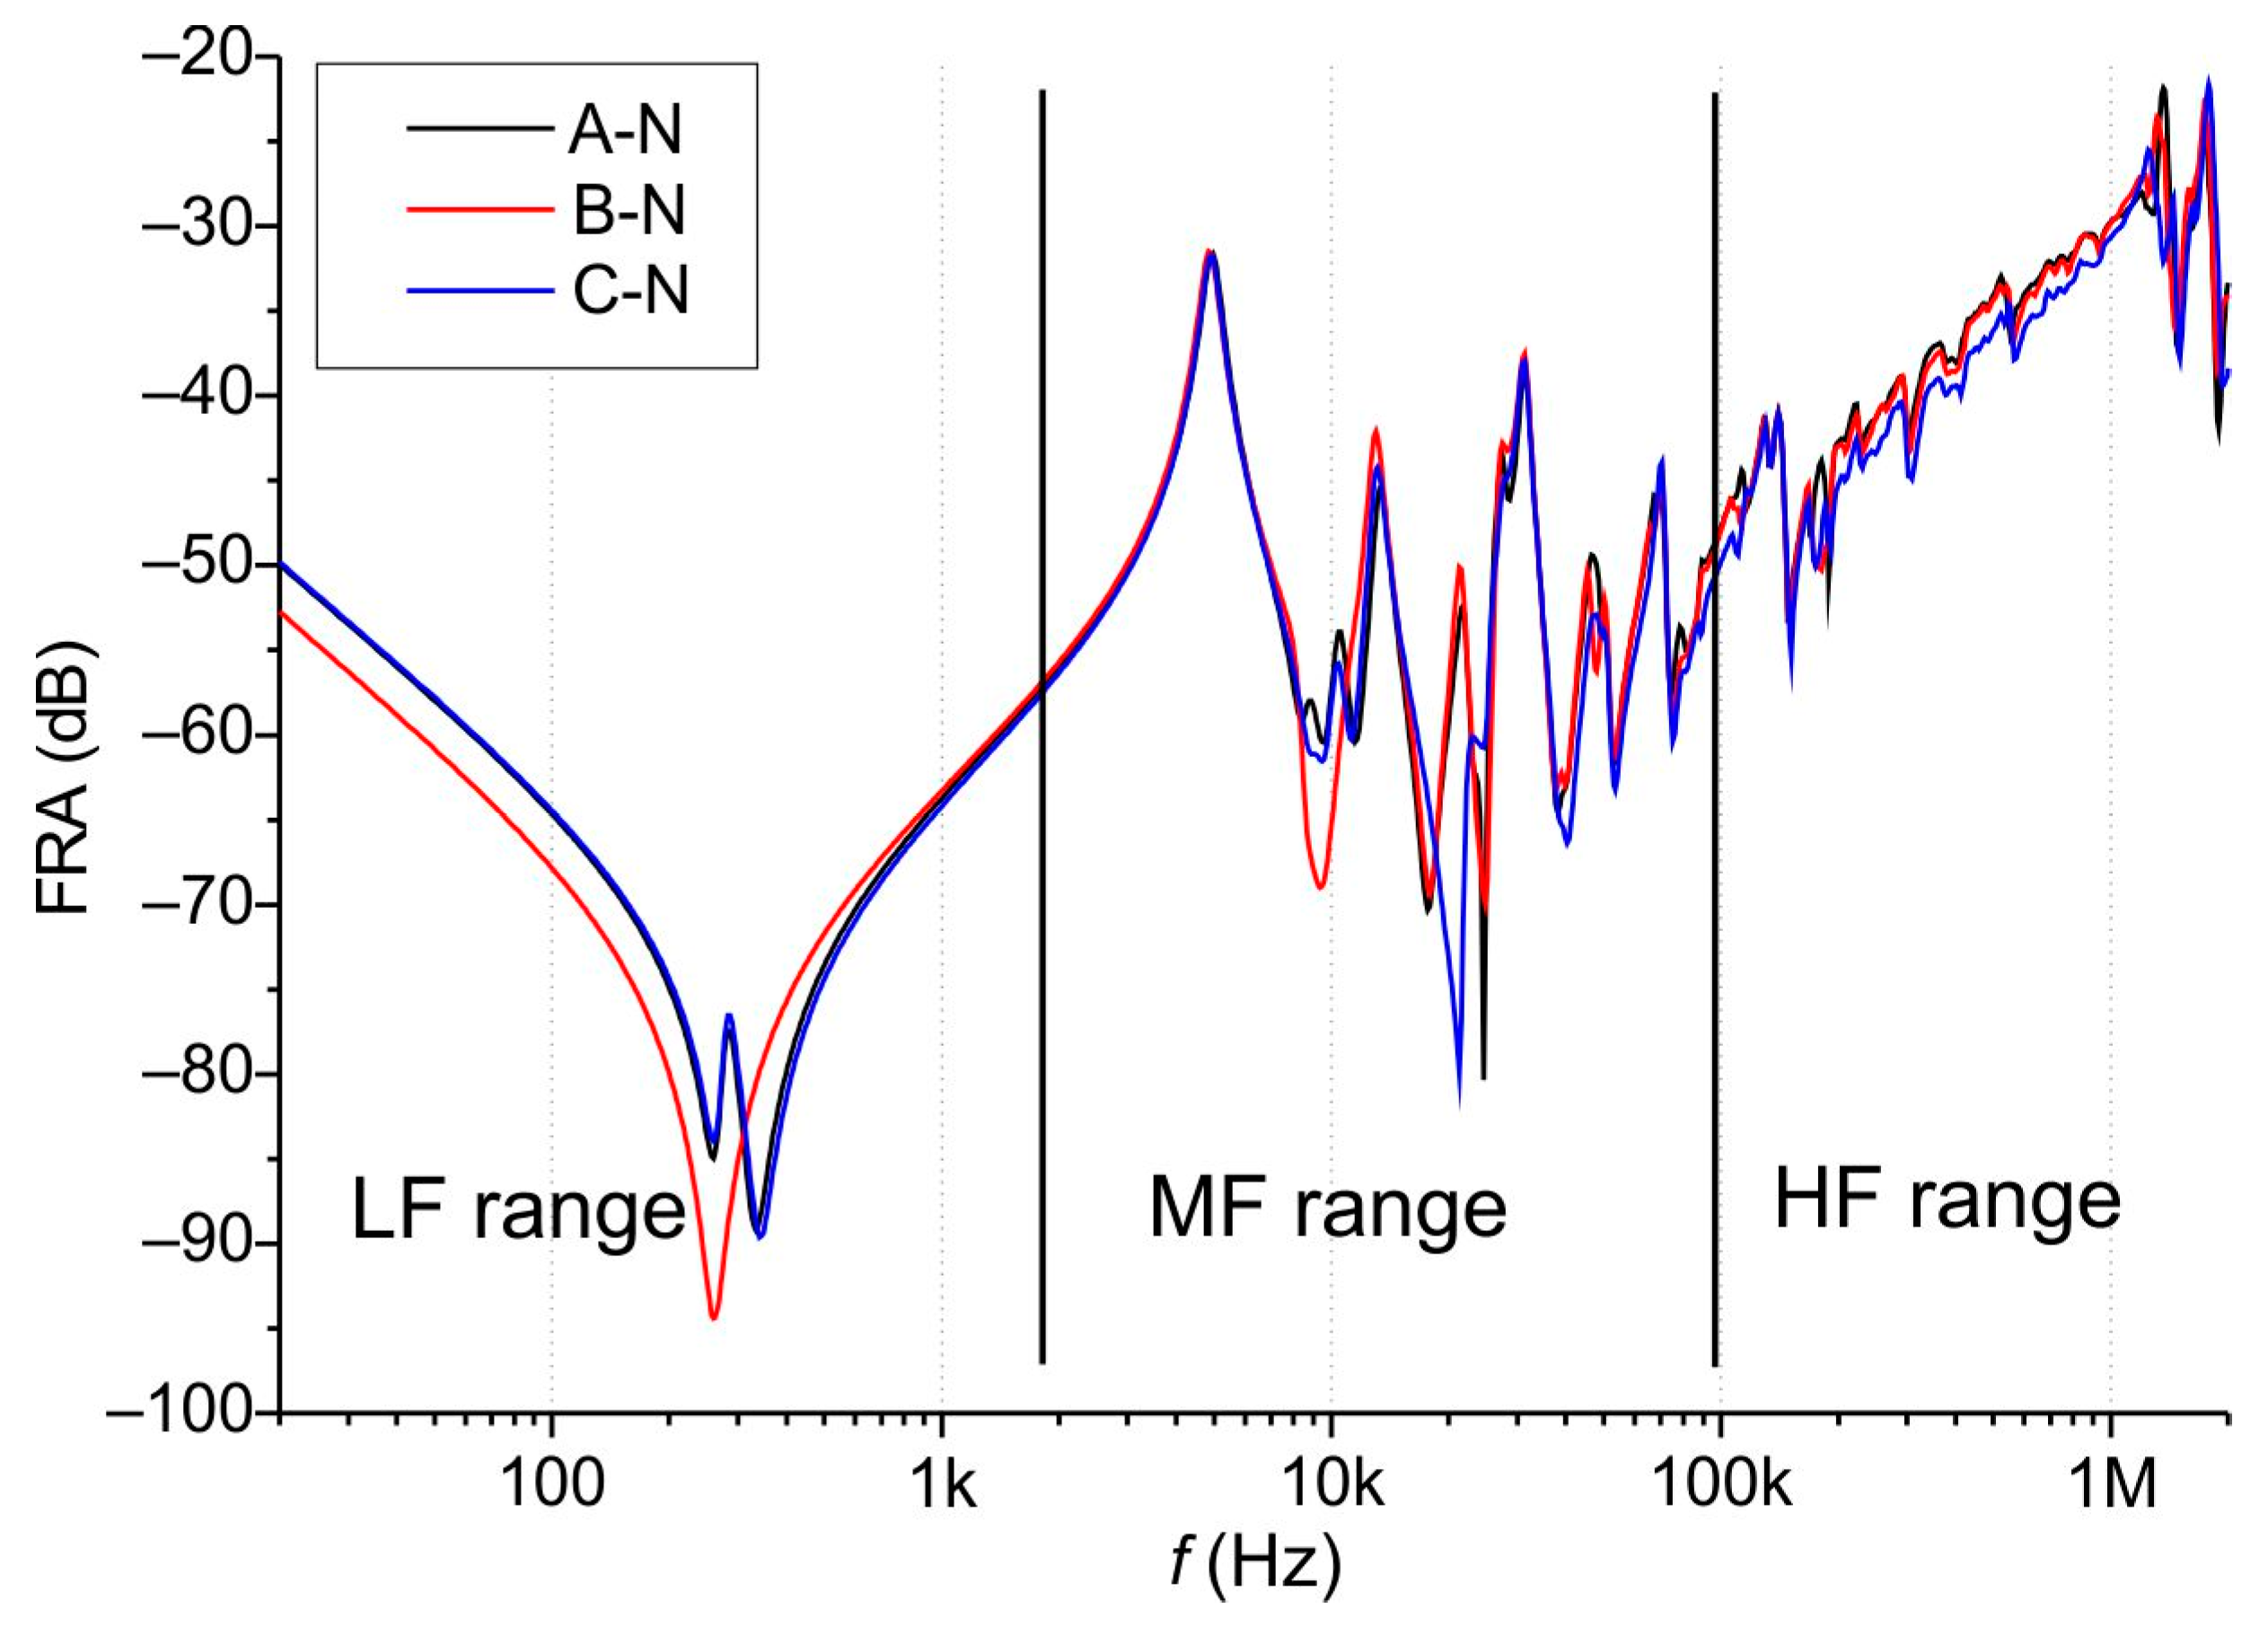
The example of a frequency response amplitude curve is shown in
Figure 1. The shape of this curve is determined mainly by winding inductances and capacitances, which in turn are dependent on the mechanical condition of the active part of the transformer [
7]. Frequency response is usually divided into three frequency subranges: low, medium and high. The division is not strict, depending on the transformer’s size and power rate. Moreover, the division is related to the source of the deformations. The behavior of the FR curve in the low frequency (LF) range is related to the magnetizing inductance and bulk capacitance of the measured winding. The curve characteristically decreases at the low frequencies due to the domination of the winding inductance. The FR curve in the LF range is vulnerable to short circuits between coils and wires. This frequency range ends at the inflection point after the first parallel resonance [
8]. In the medium subrange (MF), the influence of the magnetic circuit disappears and the behavior of the FR is determined by the interaction of local inductances and capacitances. Therefore, MF allows the detection of deformations in the transformer winding and is the most important in the interpretation of results. Above approximately 200 kHz, the high frequency (HF) range is influenced by the test setup, the connection quality, the wave phenomena in the windings, etc. [
4,
8,
9,
10].
Currently, research related to FRA focuses on the correct interpretation of the measured frequency responses of the windings. When performing an analysis of the results, one should take into consideration several factors, such as the connection system, the winding geometry or the history of failures and repairs. In practice, this means that only a very experienced diagnostician can perform the correct analysis of the FRA results. Therefore, researchers and specialists strive to develop tools that support the correct interpretation of results and automatize the analysis process itself by developing a database of a unit’s defects and the corresponding changes in FRA curves [
11]. Furthermore, not every difference in compared curves indicates damage or deformations in the tested winding. Even between phases of the same transformer there are always visible differences in the low frequency range, which are related with a magnetic flux distribution in the ferromagnetic core [
12]. In addition, small differences are also easy to see between two phases in the middle frequency range [
6]. The correct comparison of two curves requires not only measurements on the same (or sister/twin) unit, but also under the same operating conditions. A curve shift caused by the position of the tap changer, core magnetization (changes in inductance parameters), bushing replacement (changes in capacitive parameters), the type of FRA configuration, etc. can lead to misinterpretation of the FR results [
4,
11,
12,
13]. Numerous experiments and modeling techniques for finding the correlation between the shift of the frequency response curve and the mechanical (or the electrical) windings’ faults have been described in literature (see for instance [
10] and [
13,
14,
15,
16]).
The active part of the transformer, like every other electrical machine, can be represented by an equivalent
RLC circuit. Even small physical changes in the active part of the transformer have a great influence on its
RLC network. Precise knowledge about the resistance (
R) of the winding, the inductance (
L) of the coils and the capacitance (
C) of the insulation layers, between the wires, to the ground, to the tank, etc. allows analysis of the mechanical condition of the transformer, especially of the transformer winding. Changes in the value of the
RLC parameters caused by faults occurring in the winding results in changes in its frequency response [
7]. Furthermore, the reversal of this approach leads to development of recognition techniques for the various transformer faults corresponding to changes in the values of particular parameters of the
RLC networks [
10].
Different models have been developed to simulate the behavior of transformer windings [
10,
15,
16,
17]; however, models based on lumped
RLC parameters together with electromagnetic field studies allow reproduction of the same frequency response as the actual tested unit. The simulation of mechanical faults, such as axial displacement, a short circuit fault, the loss of clamping pressure, an inter-turn fault, etc., helps to understand and identify the problem inside the transformer without the need to make expensive experiments on real units. Eventually, simulation of the influence of the transformer winding faults on its frequency response will lead to the establishment of a standard code for FRA results identification [
14].
The main aim of this paper is to present the method for obtaining the equivalent parameters of the laminated core material in order to determine the frequency-dependent inductance of the transformer winding. The analysis of the influence of the core properties on the inductance is performed with computer models created using FEM software and with reference to FRA measurement. The values of the winding inductance obtained during the simulations are compared to the inductances obtained from the FRA measurements of the physical coil model. The article provides a way to equalize the results obtained from two-dimensional (2D) and three-dimensional (3D) models, which is significant for simplifying and reducing the computation time of the electromagnetic field models. In addition, the novel approach to simulation of the resonance caused by the influence of mutual inductances and capacitances associated with the windings remaining on the other columns of the physical model [
13] is presented.
5. Conclusions
The survey conducted in this paper explains utilizing the equivalent parameters for the laminated core in order to simulate the variations of the inductance of the transformer winding in a wide frequency bandwidth. The knowledge put across this paper can be helpful for simulating the simulated frequency response on the basis of the RLC parameters obtained from the electromagnetic field model of the transformer, which will be exactly the same as the frequency response of the real transformer winding. Nowadays, the FRA method is one of the standard post-production and periodic transformer diagnostic measurements. The main problem of this comparative method is the interpretation of the frequency response curves obtained. The modeling of the various mechanical transformer faults by changing the values of particular parameters of the RLC transformer network helps to understand and identify the problem inside the transformer without the need to make expensive measurements on real units and, consequently, provides standardization for the classification of FRA signatures.
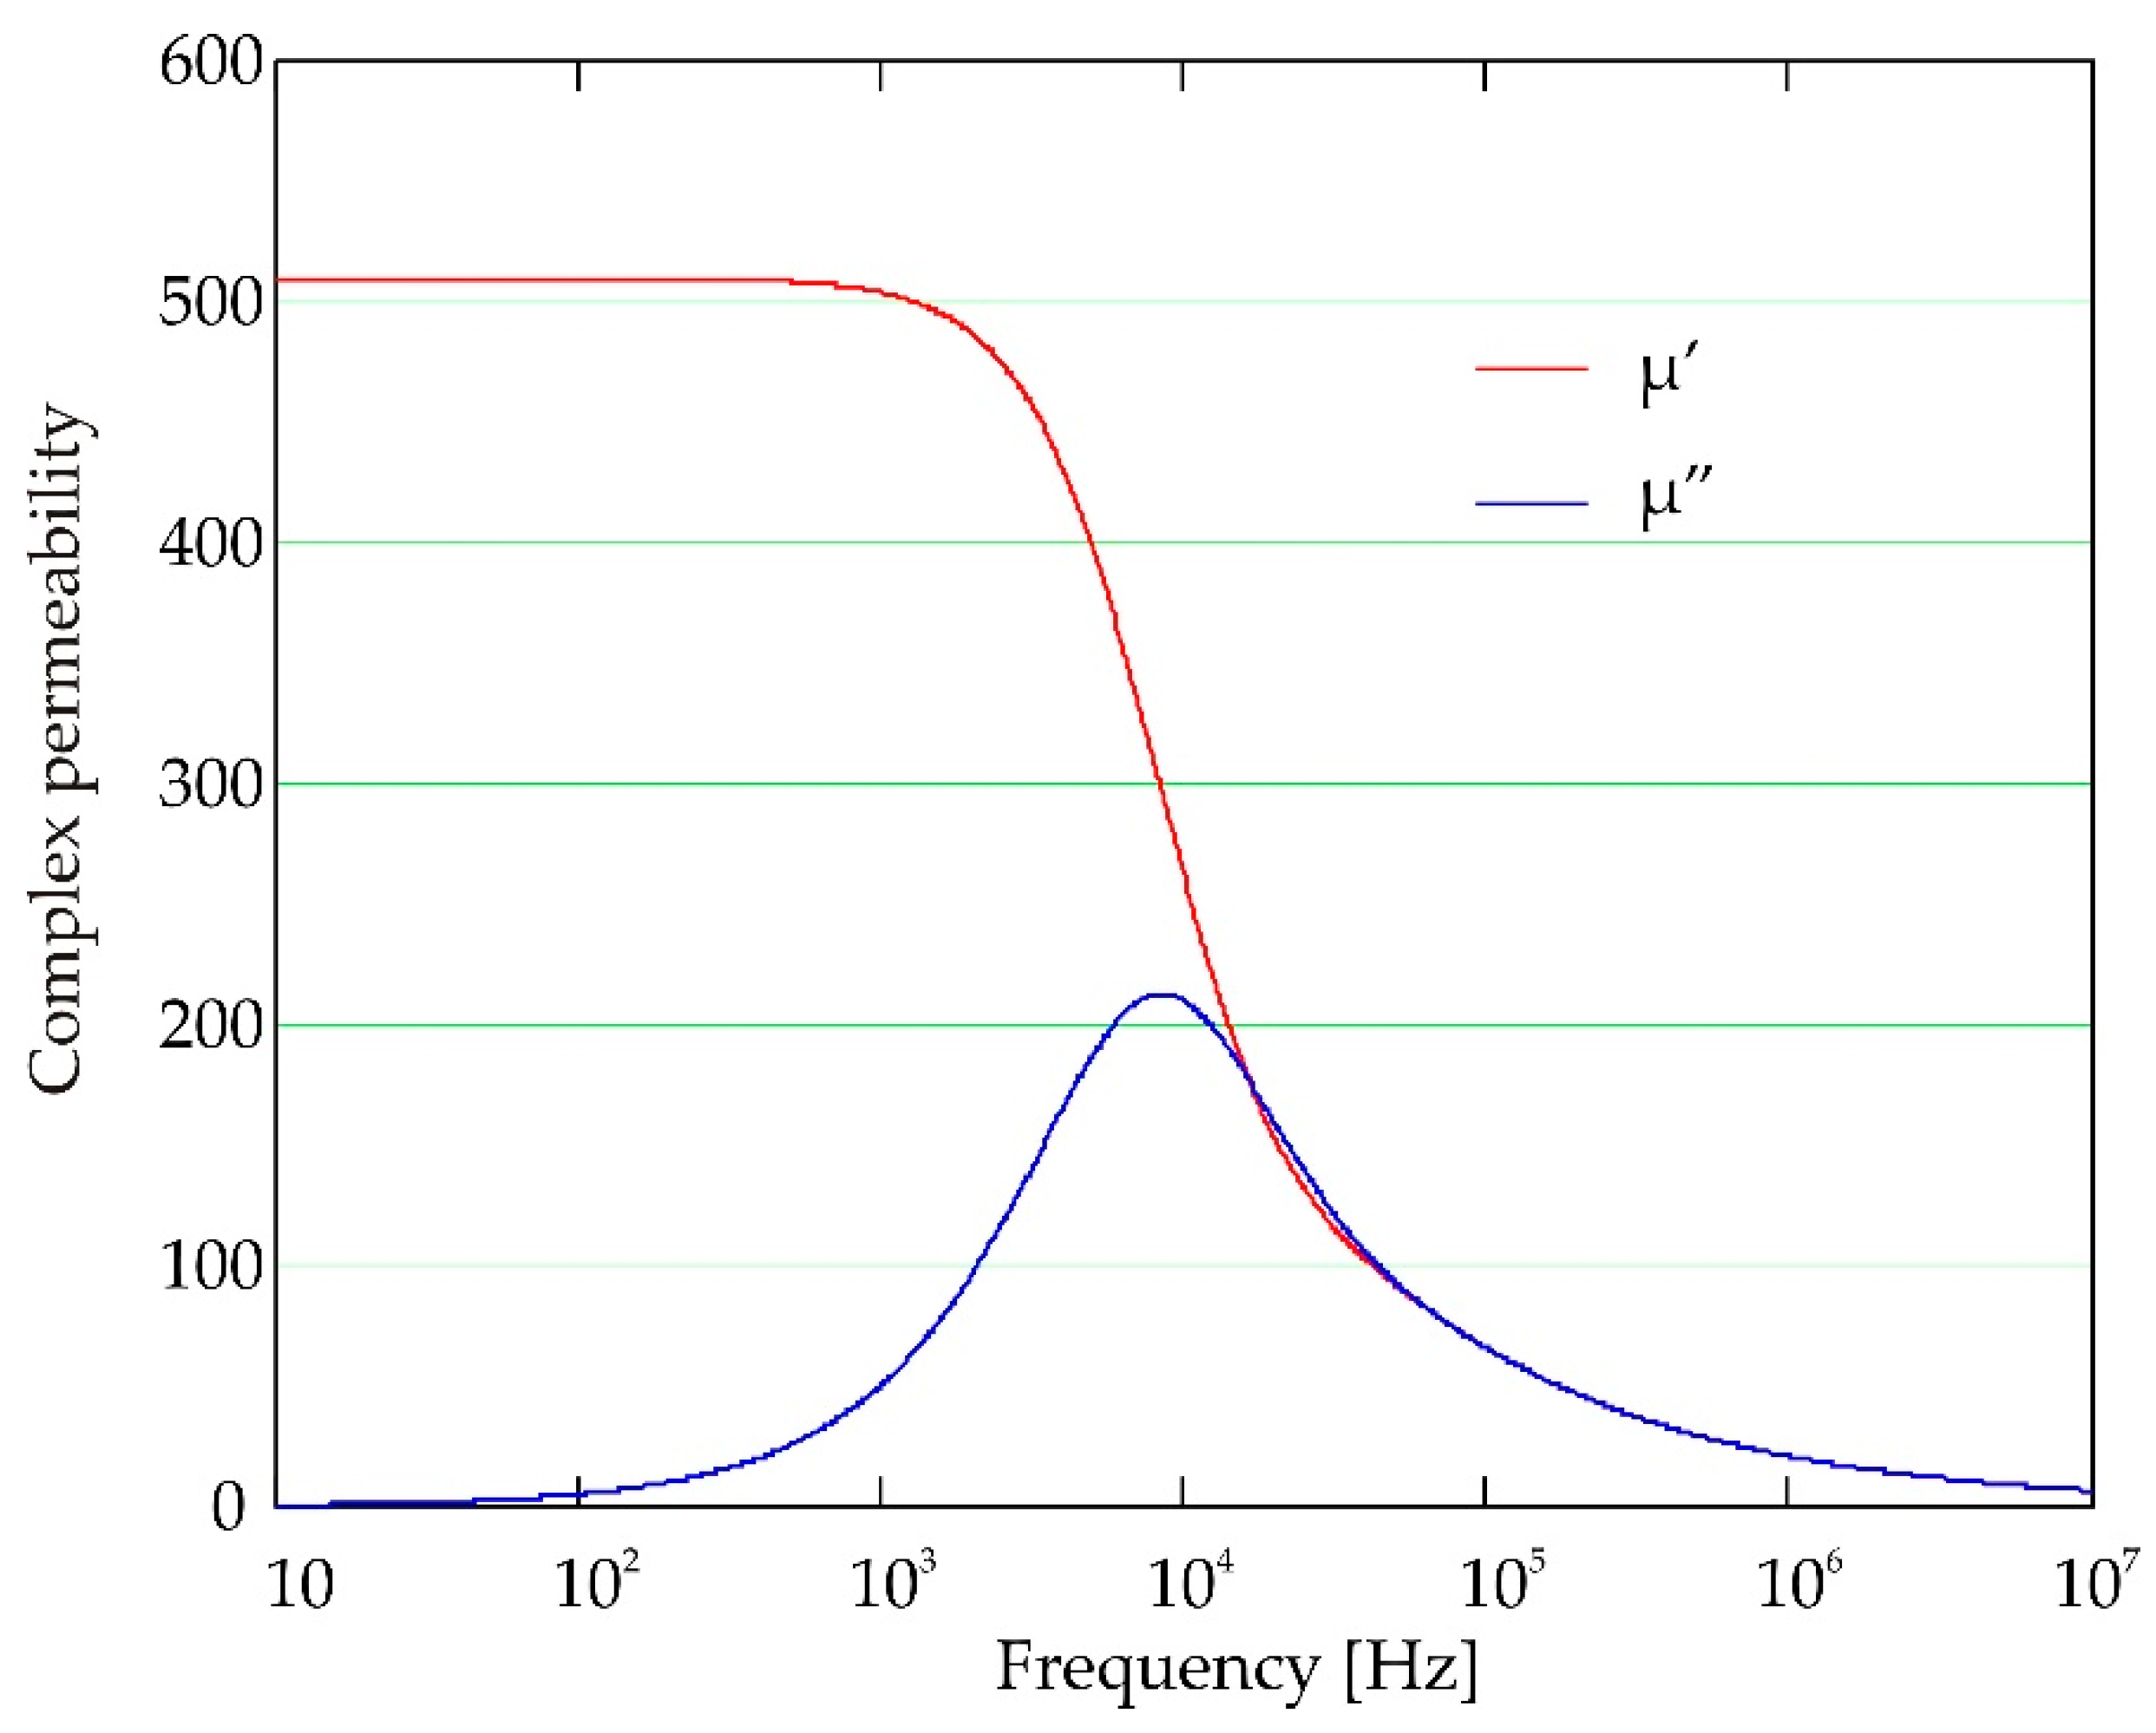
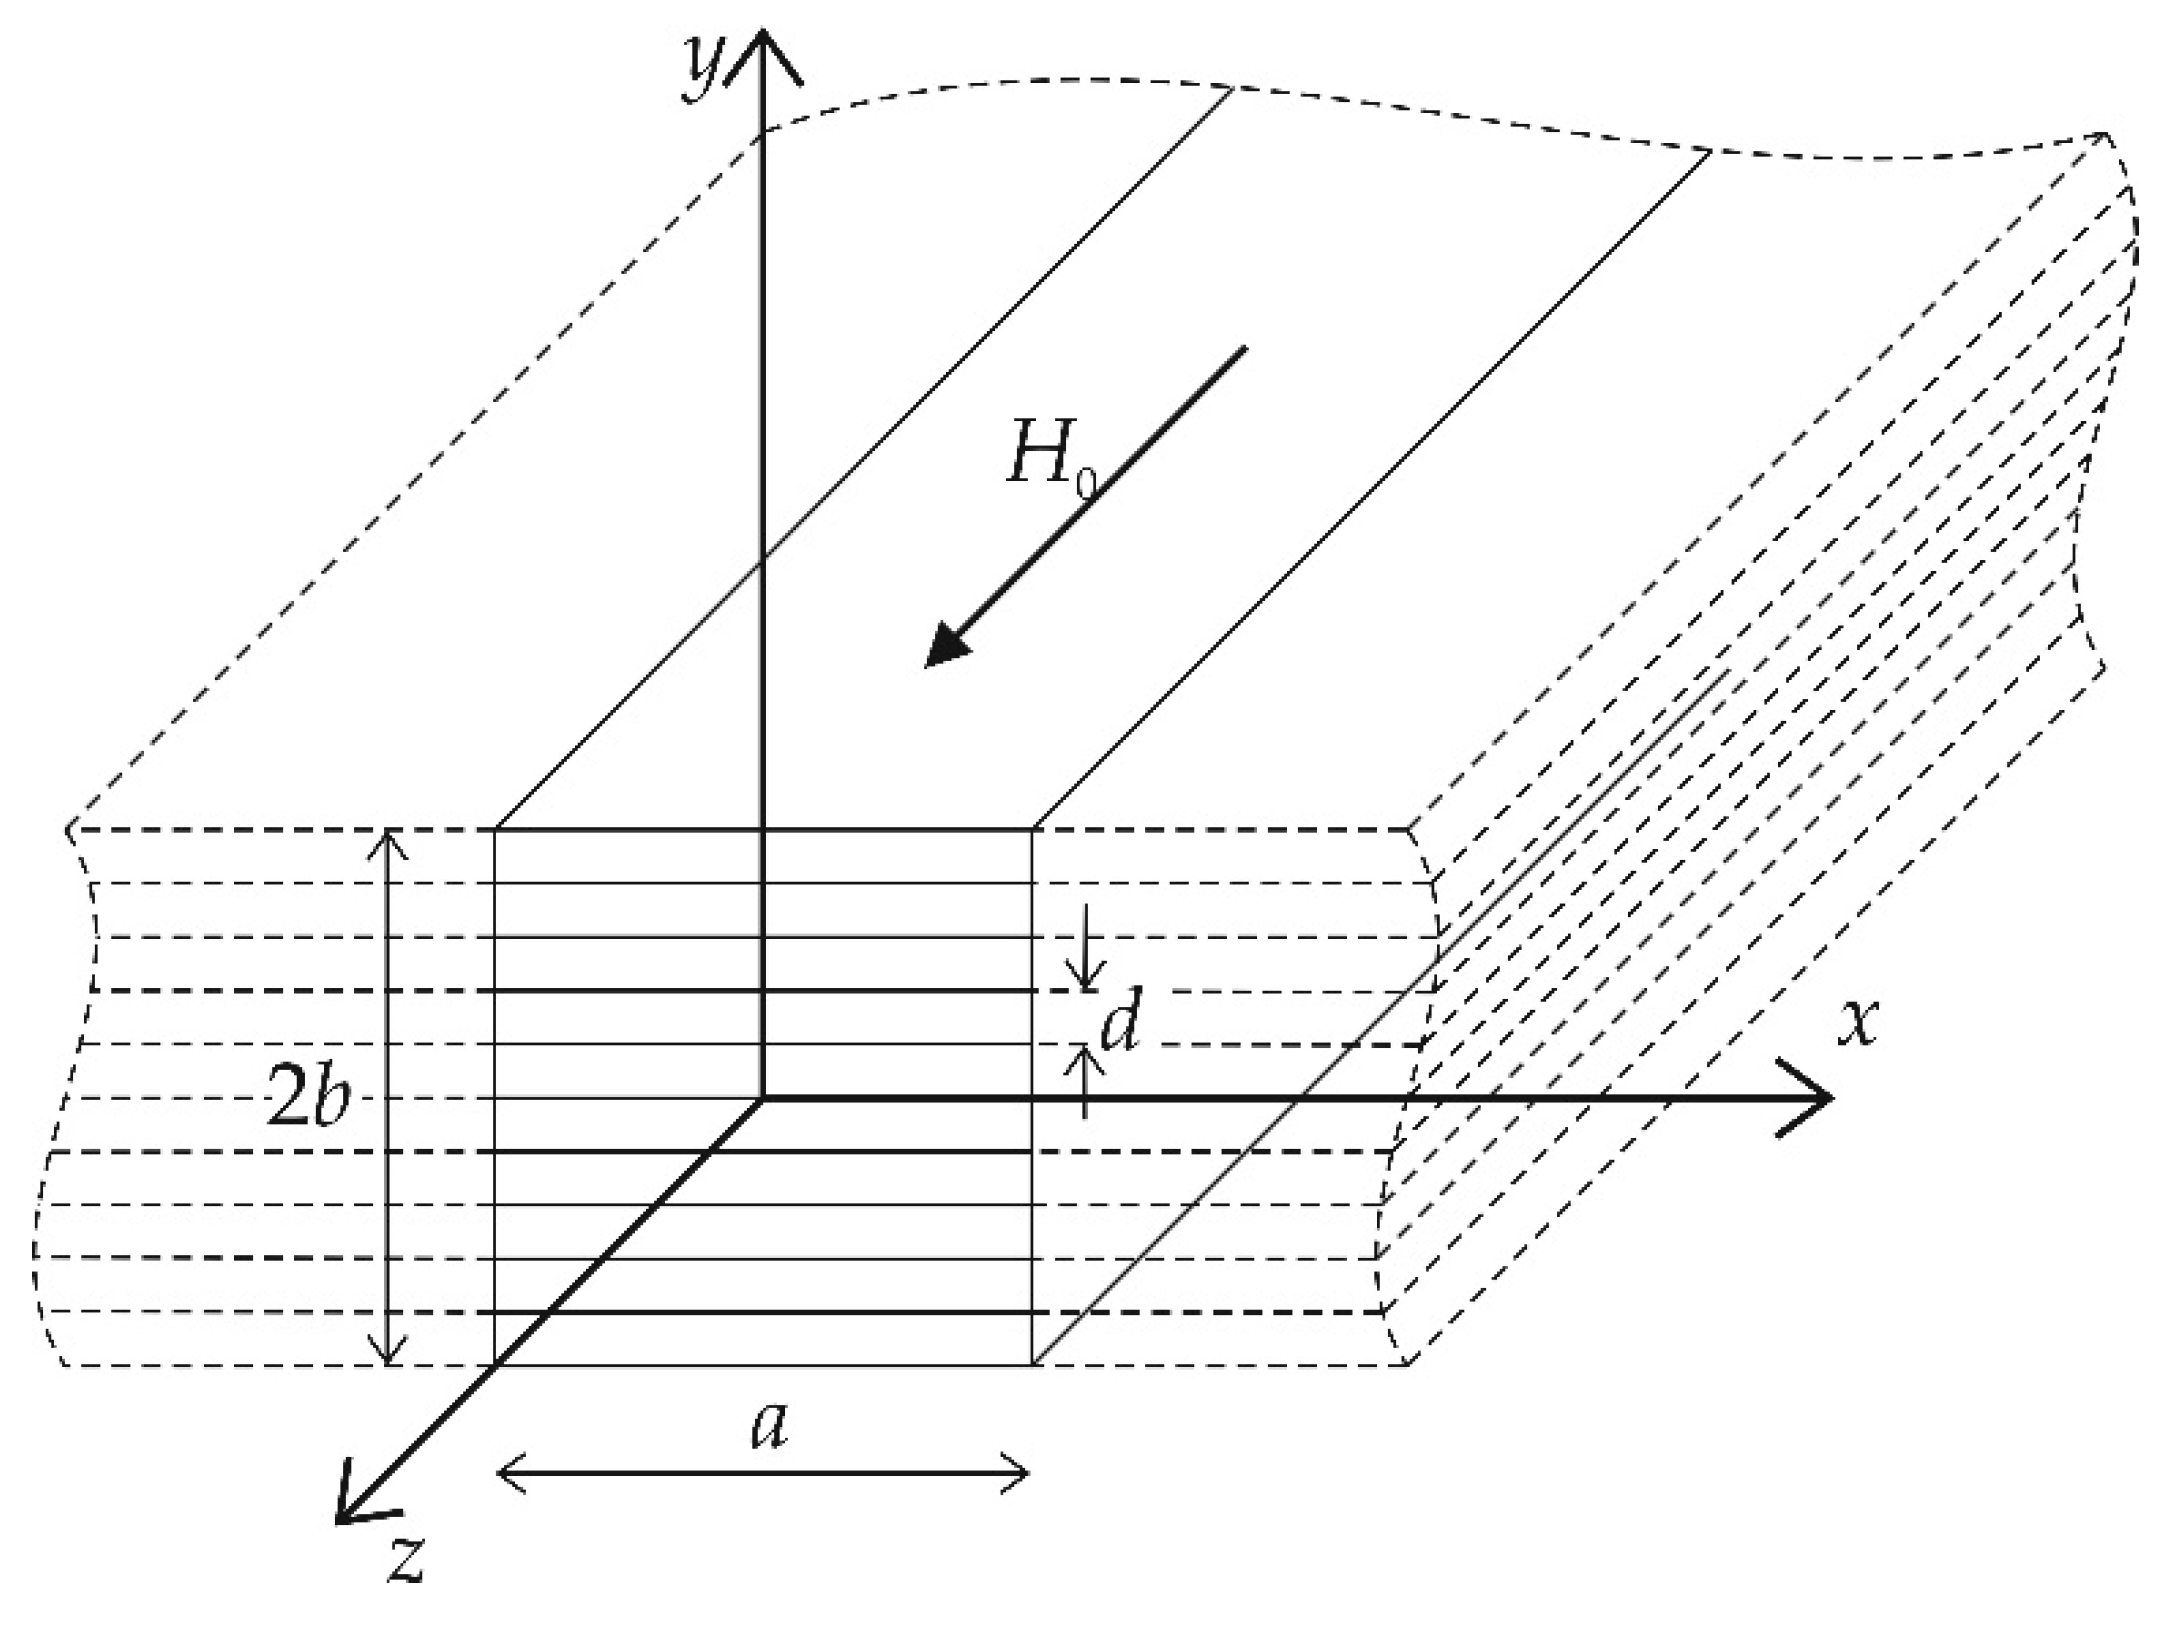
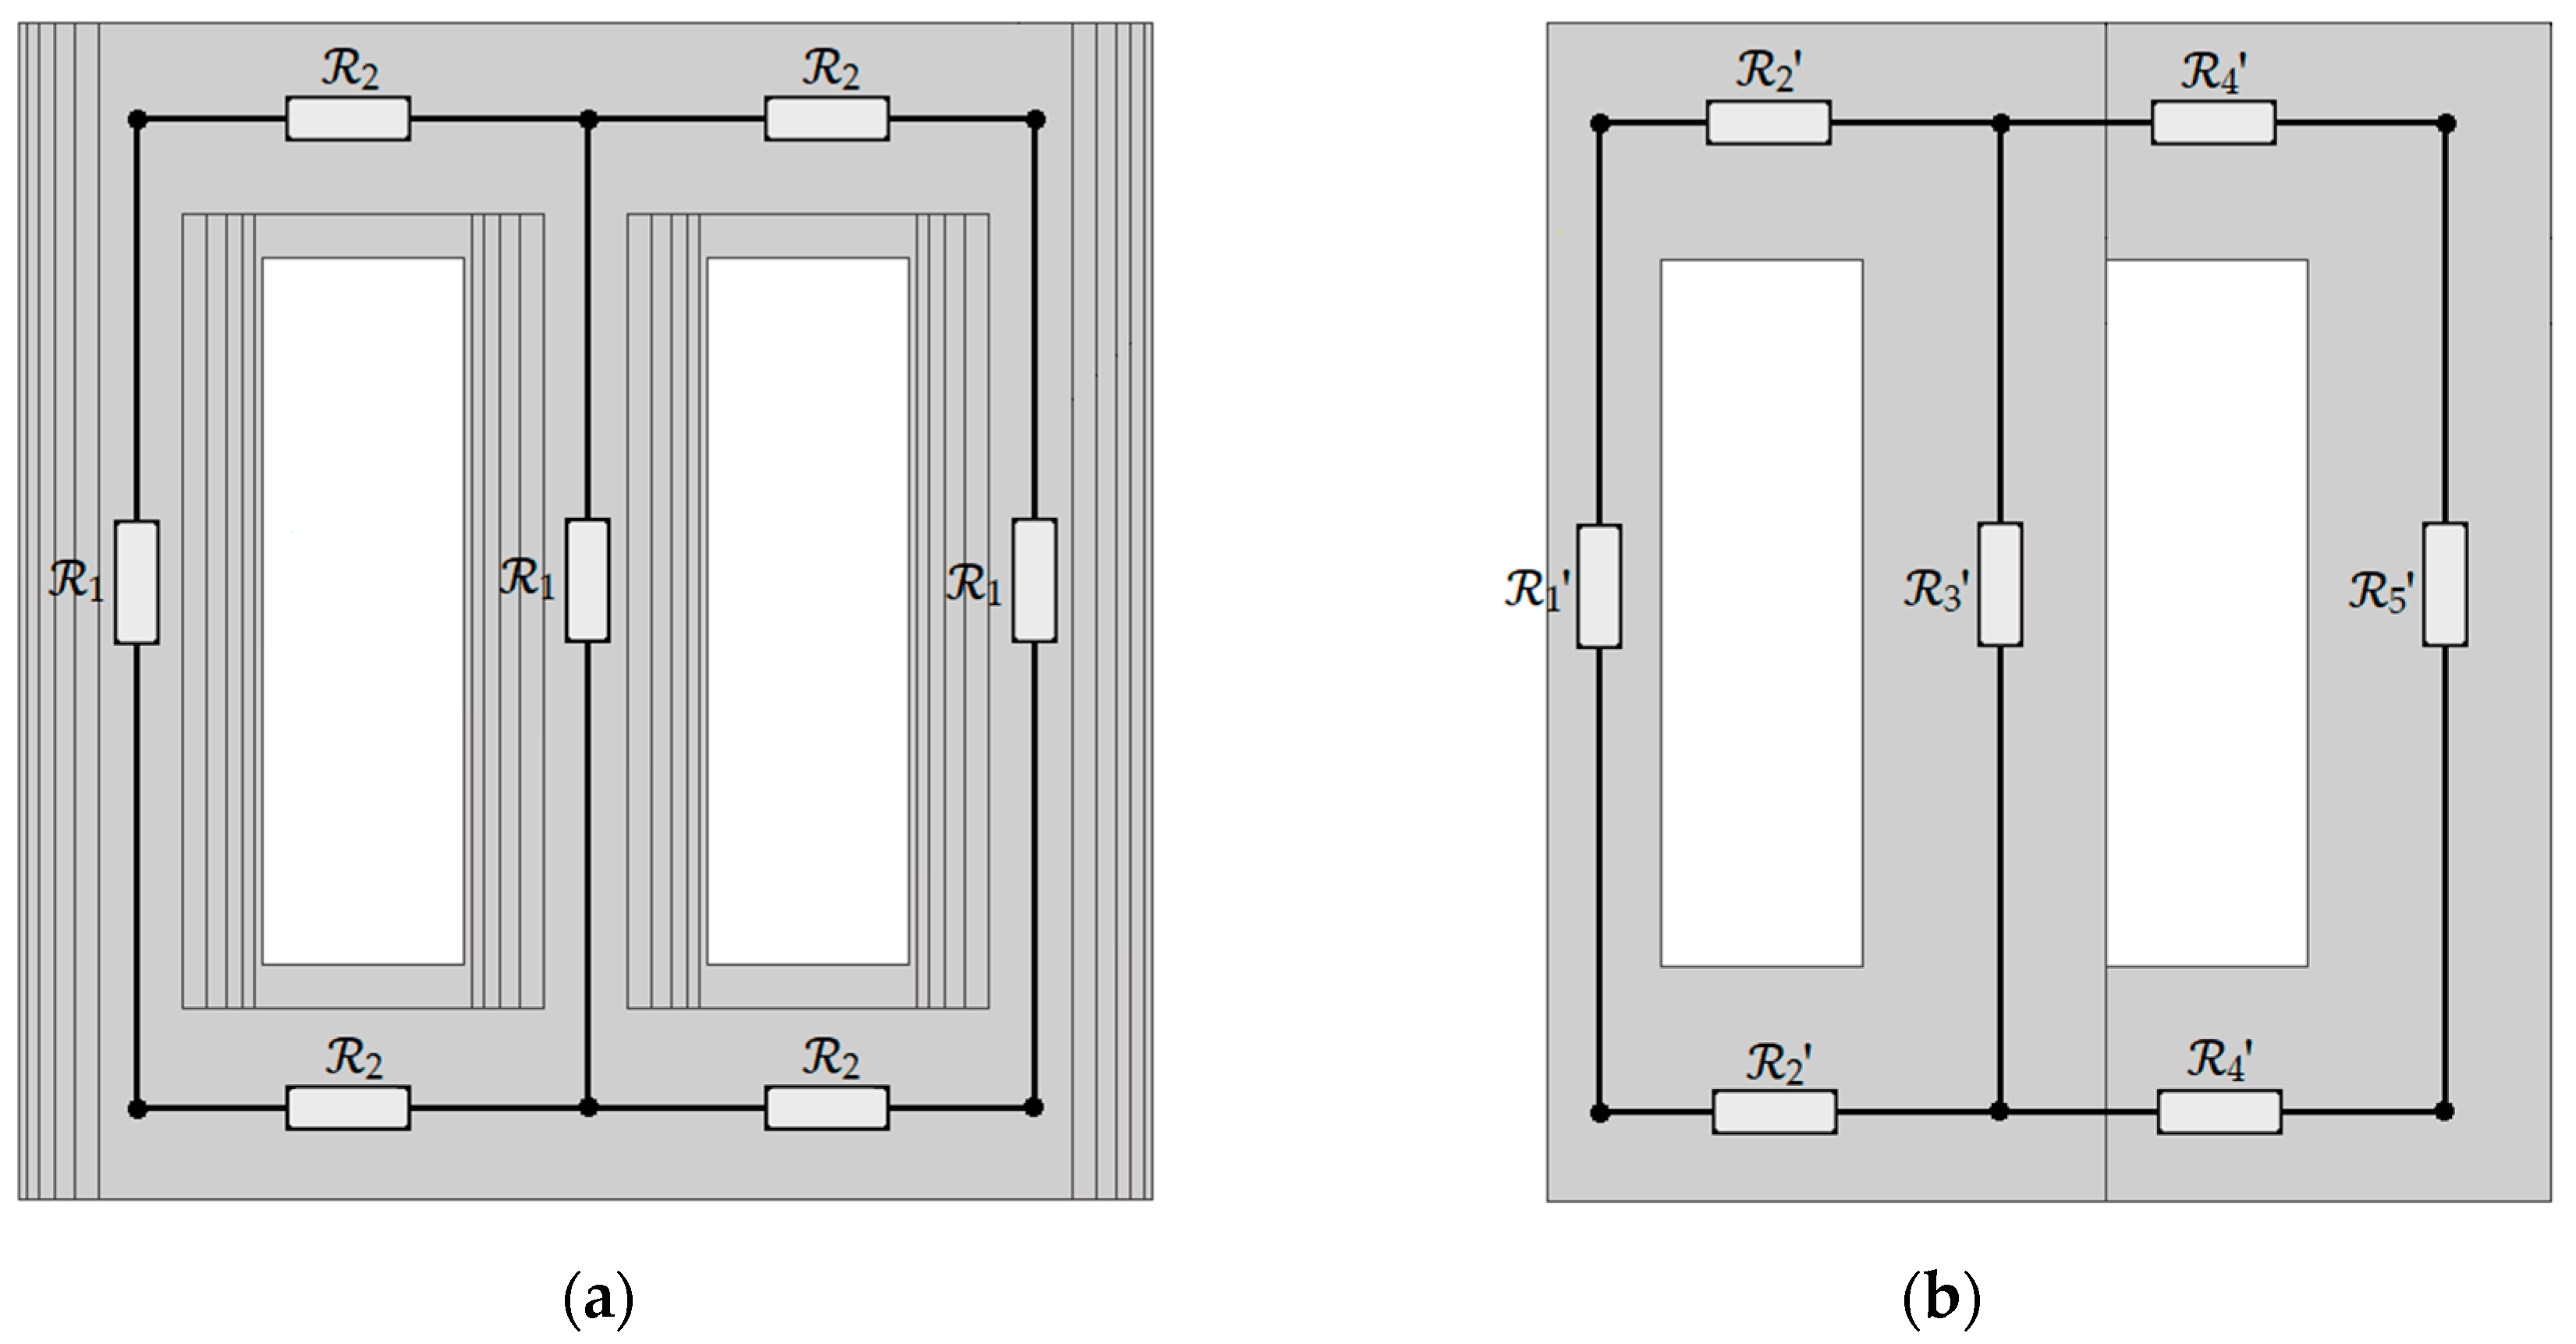
The first aim of the paper was to provide the equivalent parameters of the transformer core, especially the complex magnetic permeability and equivalent conductivity and to use these quantities in the 2D and 3D field models for the active part of the transformer. In order to balance the values of the magnetic flux in the 2D and 3D models, equality of the total reluctance of both models has been assumed. As a result, equivalent 2D and 3D models in a wide frequency range were obtained (
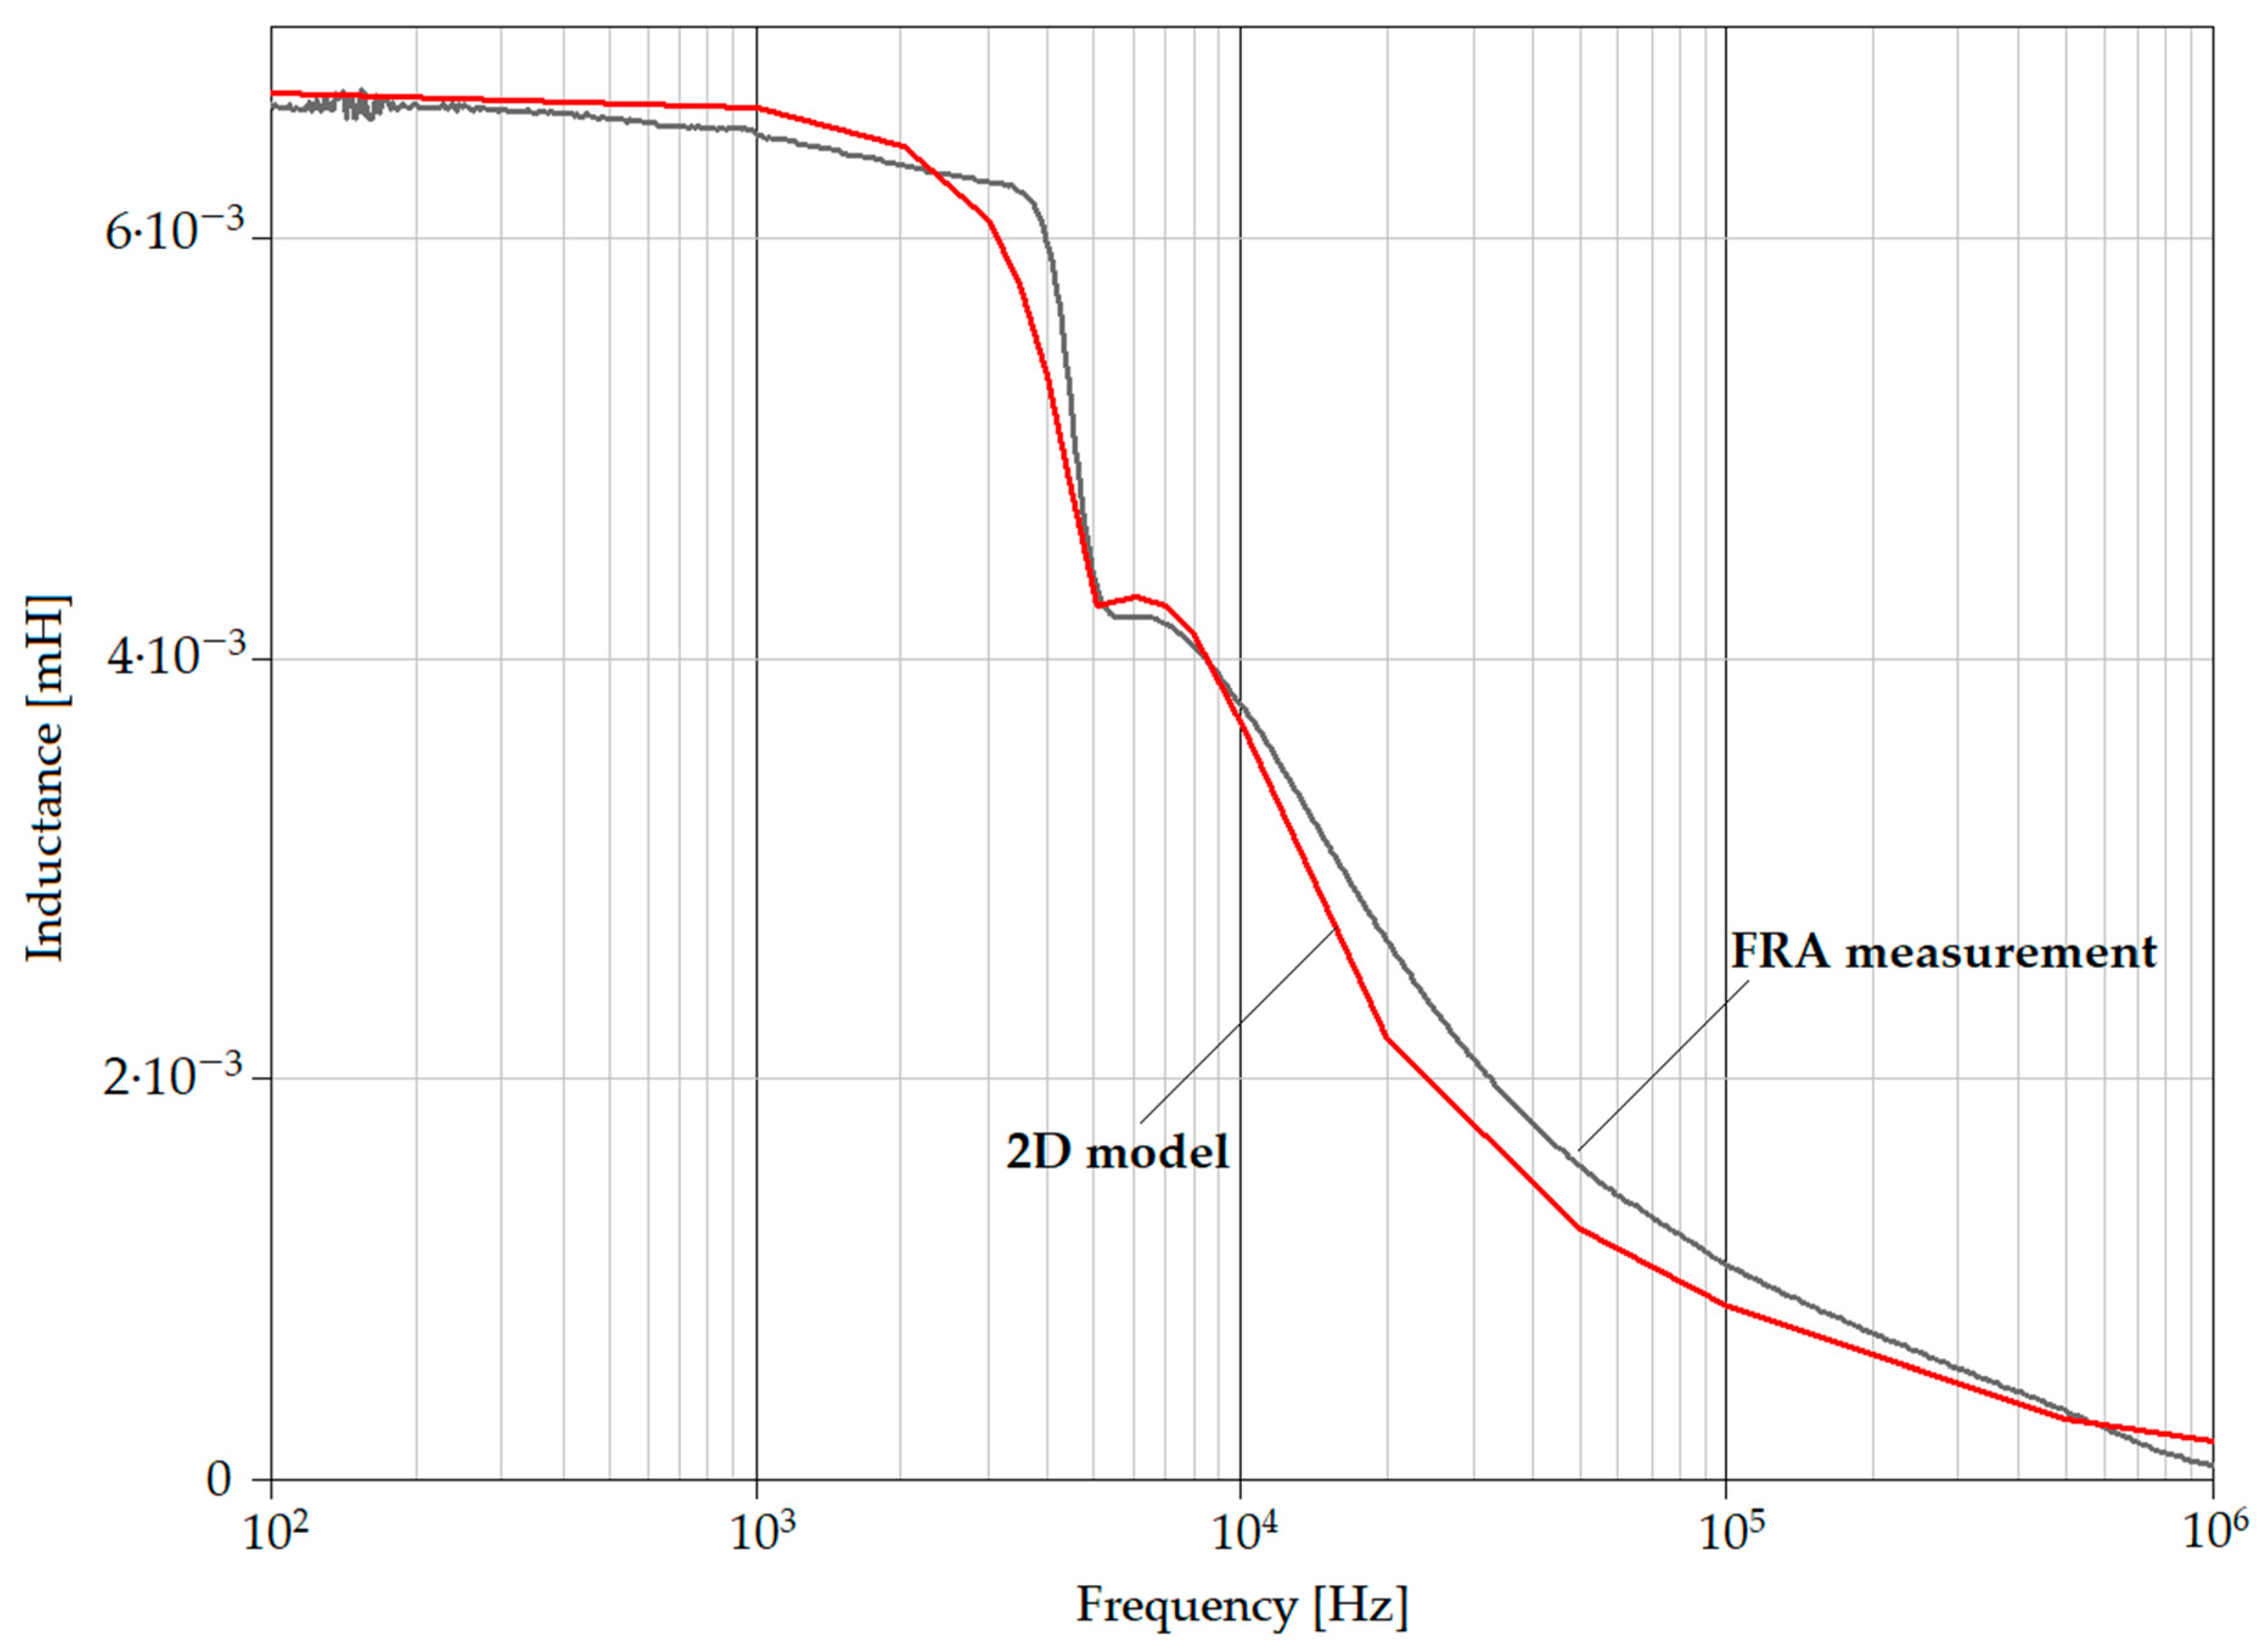
Figure 8). At this stage, the simulated models did not take into account the influence of other windings on the inductance curve; thus, in the range from 3 kHz to 10 kHz, the simulated curves diverge from the measured one.
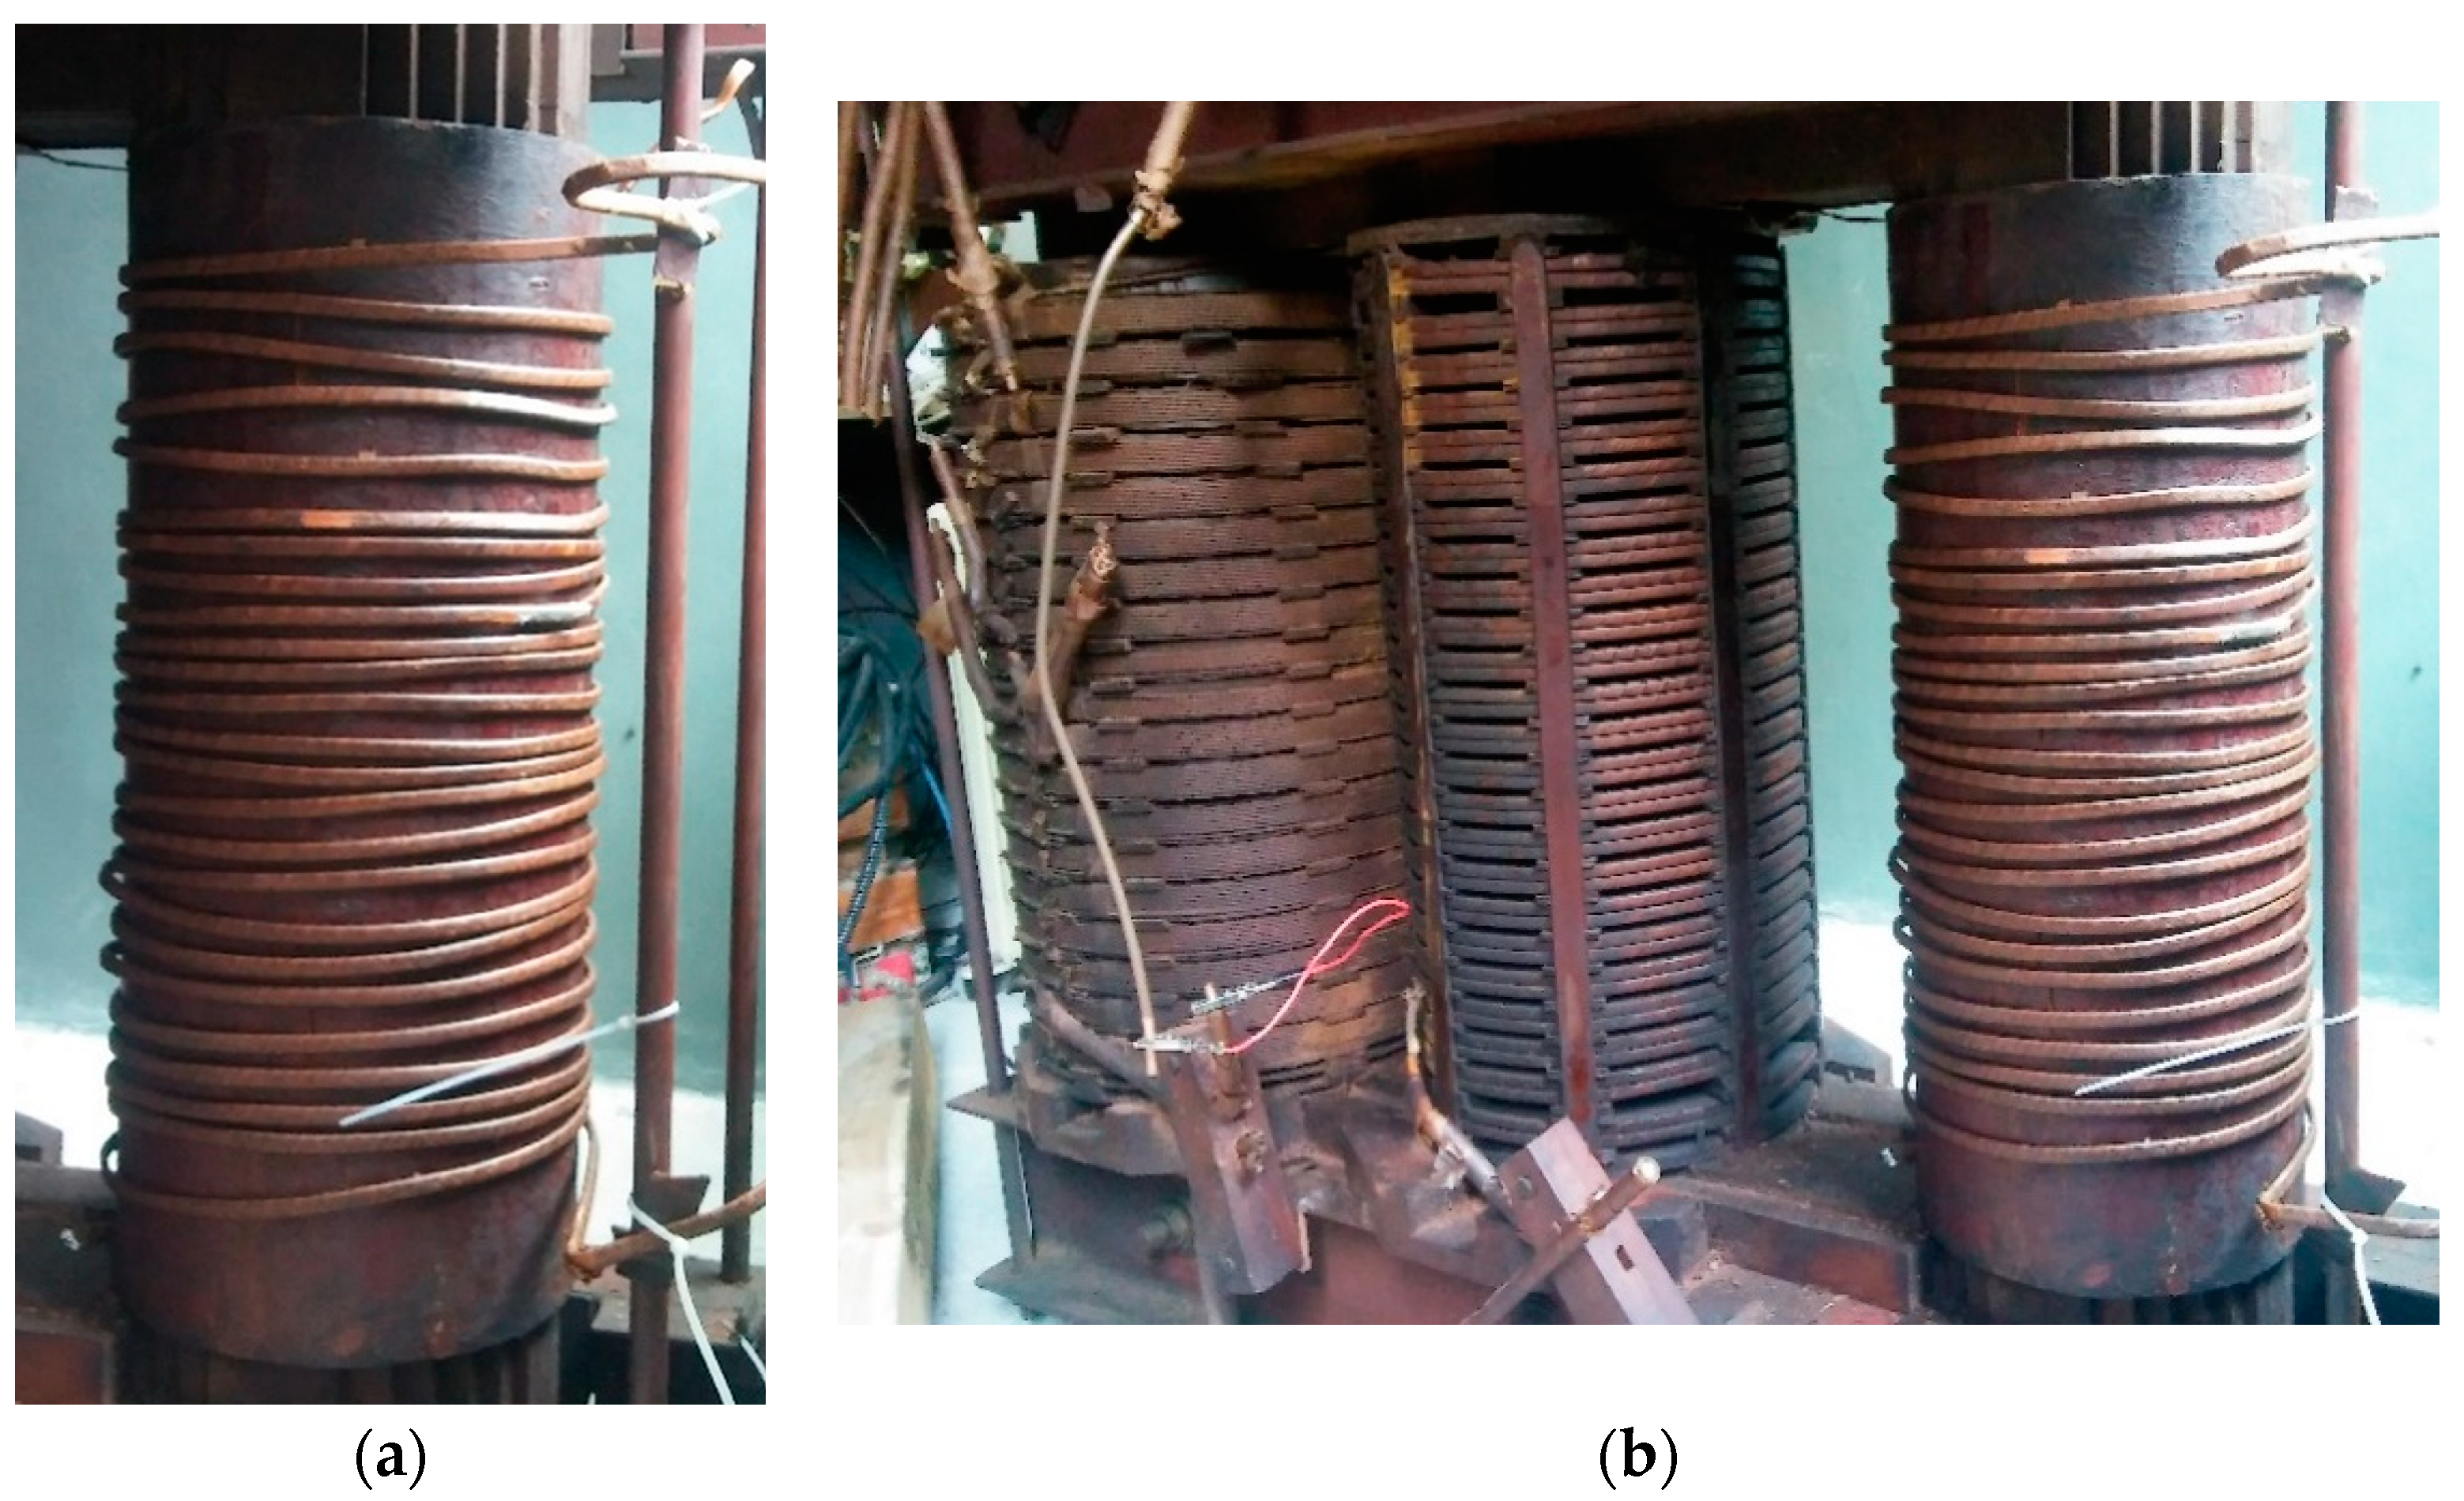
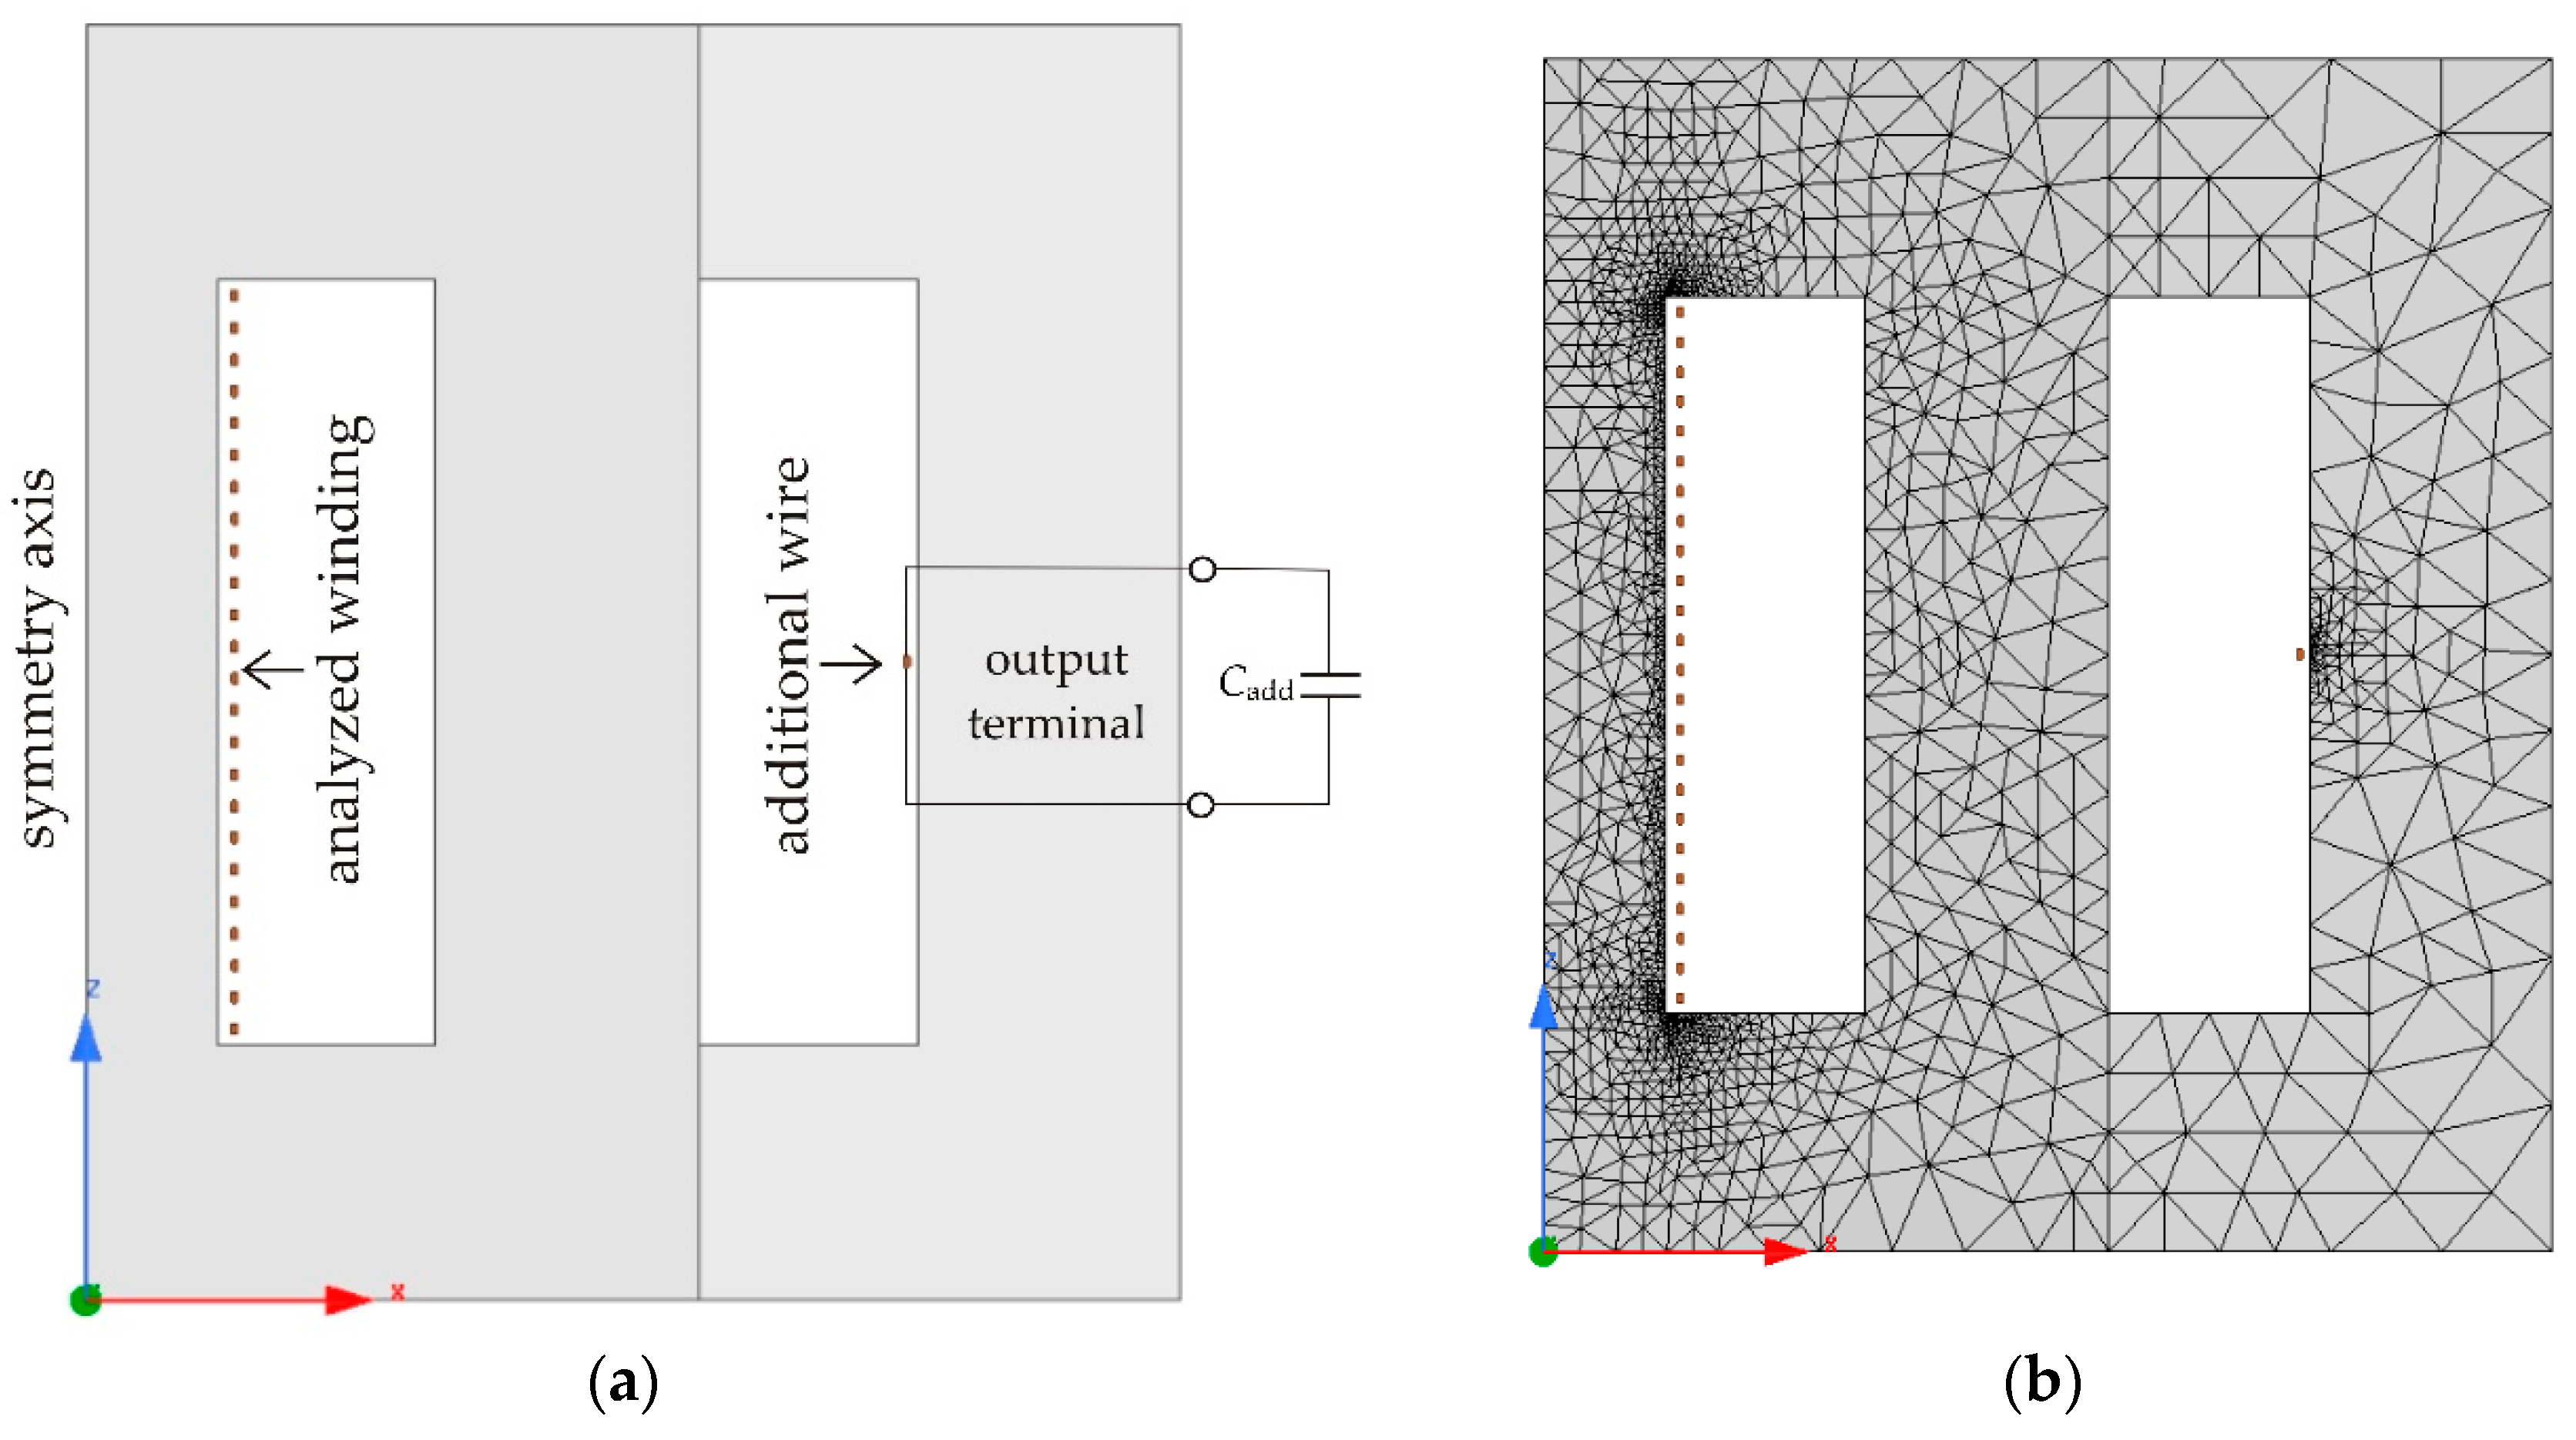
Another aim of the article was to explain the occurrence of the so-called first resonance, which is easy to see on the frequency response of the tested winding. The resonance, also visible on the inductance curve, is caused by the influence of the mutual inductance and capacitances associated with the windings remaining on the other columns of the physical model (
Figure 2). This influence was simulated by adding an additional wire to the 2D model, whose output was connected to the external capacitance
Cadd (
Figure 4). This simple approach allowed simulation of the resonance with satisfactory accuracy (
Figure 9) and the construction of a simplified numerical field model of the actual coil in two‑dimension cylindrical geometry.
The research in this article can be used in assessment of the FRA signature, especially for simulations of various windings faults and, consequently, for FRA measurement standardization.

