1. Introduction
Wind energy emerged as the most promising renewable energy source (RES) in the world over the past few years. Since 2014, annual wind power installations have surpassed 50 GW each year on a global scale, bringing the total cumulative capacity up to 591 GW at the end of 2018 [
1]. China is leading the global market with 206 GW of installed capacity, followed by the US (127 GW) and several EU countries. With a total installed capacity of 179 GW in the EU at the end of 2018, wind power had installed more capacity than any other type of electricity generation in the EU in that year [
2], positioning itself as the second largest type of power generation capacity in the region.
In addition to the installed capacity, wind power plays a key role in electricity demand coverage. In the EU, wind power met 14% of the electricity demand in 2018 [
2], which is 2% higher than in 2017. Denmark presents the highest share of wind energy in its electricity demand (41%) in the EU. Ireland, Portugal, Germany and Spain also exhibited a considerable contribution of wind power to demand coverage in 2018: 28%, 24%, 21% and 19%, respectively.
Network operators, either transmission system operators (TSOs) or distribution system operators (DSOs), perform transient stability analysis to correctly integrate the increasing penetration of wind power into the energy mix of current power systems. Dynamic wind turbine (WT) simulation models are required for this purpose [
3]. However, in contrast to traditional synchronous generators, most WT models are not standardized or validated [
4]. In this sense, the models developed by WT manufacturers are able to reproduce the behavior of their WTs with the greatest accuracy [
5]. Nevertheless, the use of WT vendor models for transient stability analysis presents the following challenges: (i) they require specific simulation software [
6], (ii) each vendor model is commonly subject to a non-disclosure agreement [
7], (iii) each WT has specific controls depending on the manufacturer [
8], (iv) increased accuracy is provided at the expense of increased complexity and number of parameters and, as a consequence, high computation time [
9].
In light of the above considerations, the International Electrotechnical Commission published the Standard International Electronic Commission (IEC) 61400-27-1 in February 2015 [
10]. IEC 61400-27-1 defined four generic WT models to conduct dynamic simulations of power system disturbances such as short-circuits. These generic models, also known as standard or simplified models, involve several assumptions and have several key properties, as follows:
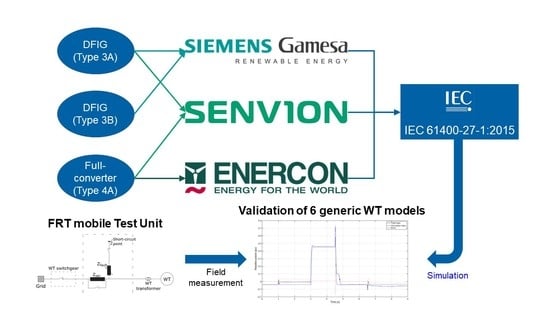
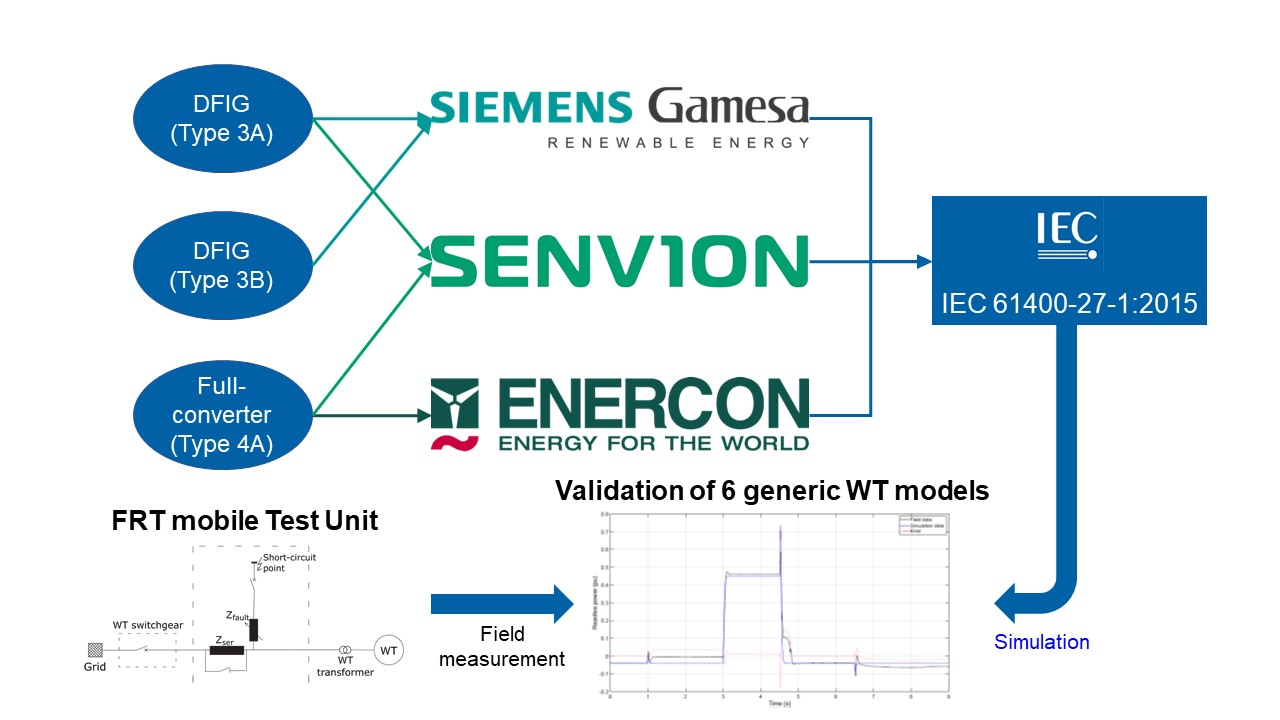
Under this framework, the present paper performs the validation of six generic WT models based on the guidelines imposed by IEC 61400-27-1. For the first time in the literature, field campaigns conducted by three WT manufacturers, Siemens–Gamesa, Senvion and ENERCON, are used for the validation of three different WT technologies. Specifically, the variable-speed WT topologies, i.e., the doubly-fed induction generator (DFIG) and the full-scale converter, which represent the largest market share in current power systems, were submitted to voltage dips of different magnitude and duration. The validation methodology defined by the IEC 61400-27-1 was implemented to evaluate the accuracy of the generic WT models.
Following this introduction, the rest of the paper is structured as follows:
Section 2 provides an overview of the current state of the art regarding variable-speed WTs, where the lack of field validation works is highlighted.
Section 3 describes the methodology and testing procedure implemented in the present work, the results of which are provided in
Section 4. Finally,
Section 5 summarizes the main conclusions of the paper.
2. Overview of Generic Variable-Speed WTs and Previous Field Validation Works
MW-range WTs may be operated in two different ways: either fixed-speed or variable-speed operation. Fixed rotor speed is the oldest WT technology [
15], while variable-speed is the most advanced technology and hence the current choice for every WT manufacturer [
16]. Two different WT topologies are identified as variable-speed operation,
Figure 1: the DFIG, also known as type 3 (
Figure 1a), and the full-scale converter, also known as type 4 (
Figure 1b).
As shown in
Figure 1, both of these variable-speed WT technologies include a bi-directional AC-DC/DC-AC converter. The main difference between them is the converter rated power: the converter is rated to 25–30% of the WT rated power for type 3 [
17]; while the converter evacuates all the energy produced by the generator (either an induction generator, IG, or a synchronous generator, SG) in type 4. Hence, the type 4 generator is completely decoupled from the grid by the converter [
18]. The power converter is composed of a machine (or rotor) side converter (MSC), a grid side converter (GSC) and the dc-link. Depending on the fault-ride trough (FRT) capability of the WT, the generic type 3 WT model is divided into two subtypes [
10]: type 3A for WTs where the MSC and the chopper are sufficiently dimensioned for FRT without disconnecting the converter; and the type 3B, which is equipped with a crowbar device connected to the MSC in order to short-circuit the rotor when over-currents and over-voltages voltages are detected [
19]. In fact, the type 3B WT is transformed into an induction generator with a rotor-connected resistance during crowbar activation [
20]. In a similar way, two subtypes are also defined for the generic type 4 WT model: type 4A, which omits the aerodynamic and mechanical components due to the addition of a chopper in the dc-link; and type 4B, where choppers are not included and hence post-fault power oscillations are present.
Due to the complex behavior of variable-speed WTs, and taking into account the particular features of the generic IEC WT models listed in
Section 1, there is little previous literature on the validation of these models. Two of the first contributions are found in [
20,
21], where both generic type 3 models, type 3B and type 3A, respectively, were validated with a 2 MW based WT operating at full-load conditions against one voltage dip test case. A generic type 4B model was validated against one voltage dip in [
22], where the post-fault power oscillations were clearly observed. Generic type 3B and type 4A models, both from the same vendor, were validated in [
5,
8,
12] based on the field results obtained from several test cases. It should be noted that the authors of the present work collaborated in most of the previously cited contributions, as well as being members of Working Group 27 of the IEC Technical Committee 88 in charge of the development of IEC 61400-27.
Under this framework, it can be clearly observed that the field validation of generic WT models is a current topic of interest in the wind power industry. Nevertheless, the number of contributions found in the literature is limited. Furthermore, there is a lack of contributions with the involvement of several WT manufacturers and this is the gap the present paper aims to fill. Since each WT vendor has specific controls, the FRT response of each actual WT is different. Hence, the validation of several WT topologies provided by different manufacturers is the key contribution of the present paper.
3. Description of the Validation Methodology and Testing Procedure
Validating a model consists of comparing the emulated response with the measured data from field tests, both referring to the same wind turbine terminals (WTT). According to IEC 61400-27-1 [
10], the measured and simulated data should be represented in per unit (pu) values based on the nominal active power and the nominal voltage at the WTT. The results of the validation procedure will include the following parameters:
Three different fault windows (
W) are considered for the estimation of each key validation error, as represented with different colors in
Figure 2: (i) a pre-fault window lasting 1000 ms before the fault occurs at
(this is the first time the voltage dip occurs in one of the phases); (ii) a fault-window that covers a time period from
to the fault clearance,
; (iii) a post-fault window lasting 5000 ms after
. As observed in
Figure 2, two quasi-steady state (QS) sub-windows were defined during both fault and post-fault periods. These QS sub-windows are used to avoid a misunderstanding of the validation errors due to electromagnetic transients that could appear in the field but are outside the scope of root mean square (RMS) simulations. The calculation of the final validation errors at each window is summarized in
Table 1.
Furthermore, the validation methodology defined by IEC 61400-27-1 includes two different approaches to represent the grid model. On the one hand, the full system simulation approach considers the modeling of the whole system composed of the equivalent grid, the interface between the grid and the WT and the generic WT model [
23]. On the other hand, the play-back approach involves only the WT being modeled and the measured voltage being directly played-back into the generic WT model. Therefore, the play-back validation methodology is recommended for assessing the accuracy of the generic WT model as the uncertainties related to grid and test equipment models are reduced.
FRT mobile test units were used to perform the field tests and measurements of the actual WTs.
Figure 3 shows several photos of the different field campaigns carried out by the manufacturers involved in the present work: Siemens–Gamesa (
Figure 3a), Senvion (
Figure 3b) and ENERCON (
Figure 3c), to perform the field tests used for the validation of the generic IEC WT models.
The validation methodology previously described, as well as the FRT mobile units, were used to perform six different field tests for the validation of the generic WT models, as shown in
Table 2. Three different WT topologies (Type 3A, Type 3B and Type 4A) from three WT manufacturers were considered. Siemens–Gamesa implemented the play-back validation methodology, while Senvion and ENERCON deployed the full system simulation approach. A wide range of voltage dip characteristics (residual voltage and dip duration) were also considered. It should be noted that the residual voltage shown in
Table 2 is based on the measurement guidelines defined by IEC 61400-21-1 [
24]. This means that the field test is defined by a voltage dip without a WT and, subsequently, when the WT is connected and the test is performed, the final residual voltage may increase due to the actual reactive current injection.
4. Results
This section, which presents the main results obtained in this work, is divided into two subsections in order to differentiate between type 3 and type 4 validation test cases. For each field test shown in
Table 2, results will be addressed in two different ways: (i) three figures with the time series of the three measured (in black) and simulated (in blue) key parameters (
u,
p and
q), as well as the error time series (in red); (ii) one table summarizing the three validation errors (
,
and
) at each validation window.
4.1. Type 3 WT Validation Test Cases
This subsection discusses the validation results for the DFIG field tests: test ID 1, test ID 2 and test ID 3.
4.1.1. Test ID 1
Figure 4 shows the results of test ID 1, which was performed on a DFIG WT with a dc-link chopper as active protection device, i.e., a type 3A WT. The measured voltage profile shown in
Figure 4a was obtained through the connection of a series impedance at the FRT mobile test unit before the measurement starts, which is disconnected at
s.
Regarding the active power response,
Figure 4b, a considerable constant deviation is observed between field and simulation when the fault was cleared (
s) and the active power recovery ramp has finished. This deviation is due to the far greater complexity found in the pitch model and torque controller in the actual WT compared to the simplified generic IEC WT model. Therefore, a significant validation error was found for the average value during the post-fault period, as observed in
Table 3,
pu. This active power oscillation also occurs because the drive-train model of the real WT is more complex than the two-mass model considered for the generic WT model. Nevertheless, it can be observed that the oscillation frequency fits properly.
Regarding the reactive power response,
Figure 4c, the IEC generic WT model generally emulates the behavior of the actual WT with great accuracy. However, a negative reactive power peak appears in the field at the fault clearance due to the transformer inrush current, which is a non-linear effect that cannot be properly represented by transformer RMS models. Therefore, as observed in
Table 3, mean reactive power errors are considerably low (≤0.01pu), while the maximum error is large (
pu) due to the disconnection of the series impedance of the FRT test unit.
4.1.2. Test ID 2
Test ID 2 presents the second field case performed by the vendor Siemens–Gamesa.
Figure 5 shows the results of this test, while
Table 4 provides the calculation of the validation errors. It is worth noting that the voltage dip characteristics of test ID 2 were quite similar to those of test ID 1, with the main difference being the loading condition of the WT and the WT topology.
Firstly, regarding the voltage profile,
Figure 5a, the identical response between simulation and field, as also found in
Figure 4a, should be highlighted. This is due to the implementation of the play-back validation approach.
The active power response,
Figure 5b, shows a slight deviation between field and simulation due to the difficulties of representing exactly the same active power delivery during the voltage dip. This is because the actual WT integrates a particular active power limitation algorithm that cannot be represented with the generic WT model. In addition, the power dynamic in the actual WT during the voltage dip is slower than in continuous operation and this different dynamic behavior cannot be represented by the IEC model. This also has an impact on the ramp-up once the fault is cleared. Furthermore, the real WT absorbs active power at the fault clearance (
s), which cannot be properly emulated by the generic WT model due to the simplification in terms of transients. Therefore, the active power validation errors have a significant value during both fault and post-fault periods, as shown in
Table 4.
Furthermore, reactive power validation errors also present a larger value in comparison to test ID 1, which is directly related to the crowbar dynamics, as observed in
Figure 5c at both fault inception and fault clearance.
4.1.3. Test ID 3
Figure 6 shows the results of the last field test performed on a DFIG WT. Specifically, this WT is a Senvion MM series WT that implements the same IEC model type as that used for test ID 1, i.e., Type 3A. In addition, both the WT loading condition and the residual voltage were almost identical.
Table 5 summarizes the validation of test ID 3.
In this field test, the grid was modeled by the full system simulation approach of IEC 61400-27-1, as commented in
Section 3.
Figure 6a compares both the measured and the simulated voltage at the wind turbine terminals, where the three-phase voltage dip occurs at
s. Due to the reactive current infeed of the WT during the dip, the voltage level rises. In contrast to tests ID 1 and ID 2, a small hysteresis was observed in the measured voltage at voltage dip clearance (
s), which cannot be represented by the simulated voltage due to the lack of hysteresis in the transformer model.
The eigenfrequency between active power measurement and simulation shown in
Figure 6b is quite similar during both the fault and post-fault period. Specifically, the simulated response is almost identical to the measured one during the fault period, which causes a notably reduced validation error:
pu. However, a delay was identified in the measurement at fault clearance, which is caused by the power converter operation (further details are provided in [
16]). This power converter effect was not considered in the generic IEC WT model.
4.2. Type 4 WT Validation Test Cases
This subsection discusses the validation results for the full-scale converter WT topology: tests ID 4, ID 5 and ID 6.
4.2.1. Test ID 4
The WT used for the test ID 4 was model 3.4M ( MW), belonging to the manufacturer Senvion. It is represented by IEC 61400-27-1 as a Type 4A WT model. The grid was the same as that used for test ID 3, which was modeled by the full system simulation approach.
Figure 7 shows the results of validation test ID 4. A three-phase voltage dip with a residual voltage of
pu occurred at
s and ends at
s,
Figure 7a. As previously mentioned, this residual voltage was increased by the reactive current infeed during the voltage dip. In addition, a small hysteresis effect of the transformer is observed on the measured voltage (in black) at fault clearance. However, the hysteresis was not implemented in the transformer model and, hence, this effect cannot be reproduced by the simulation (in blue).
The measured active power,
Figure 7b, fluctuates according to the wind speed variations. However, the simulated active power is set to rated power because the wind speed was assumed to be constant, according to IEC 61400-27-1, as stated in
Section 1. The fit of the active power during the fault period was reasonably accurate:
pu. However, a small deviation in the active power ramp is observed once the fault is cleared. This was caused by the simplifications included in the generic WT model, which should be neglected for power system stability studies.
Furthermore, the reactive power,
Figure 7c, which was controlled according to the voltage level, also presents quite an accurate adjustment between field and simulation. There was a small deviation in the reactive power at fault clearance due to the already mentioned hysteresis effect in the measurement, which was not represented in the generic WT model. This effect was not considered in the IEC validation methodology because it was a question of transients, which were outside the scope of system stability studies, as commented in
Section 2.
Finally,
Table 6 summarizes the validation errors estimated for test ID 4, where it can be observed that the representation of the generic IEC type 4A model is reasonably accurate before, during and after the voltage dip.
4.2.2. Test ID 5
Figure 8 shows the validation results for test ID 5, which are provided by an ENERCON E-82 WT model with 2 MW rated power. For the simulation case, the generic IEC type 4A model was used, implementing a full system validation approach.
Figure 8A shows a three-phase voltage dip down to 25% of the nominal voltage. The WT was operating at rated active power and zero reactive power. As can be observed, the series impedance of the FRT container was switched on at
s. The short-circuit impedance was switched on at
s and the fault duration was 1.5 s (
s).
Once the FRT series impedance is connected, a small deviation is found in the reactive power response,
Figure 8c. This is caused by an additional voltage regulation of the actual WT, which is not represented by IEC 61400-27-1 type 4A model. When the fault occurs, the WT starts injecting reactive power according to the adjusted factor
, as detailed in Equation (
5), where
represents the reactive current,
the nominal current,
the positive sequence voltage,
the nominal voltage and
the reference voltage.
As observed in
Figure 8b,c, quite an accurate fit between the simulation and the measurements was observed during the fault period. This implies that the current limitation model was well represented by the generic type 4A model. However, a transient transformer effect is shown when the fault is cleared, which cannot be accurately emulated. In summary, considerably accurate validation results were obtained for both active and reactive power, as summarized in
Table 7.
4.2.3. Test ID 6
Test ID 6 provides the validation results of an ENERCON E-126 WT with 6 MW rated power, as shown in
Figure 9. As for test ID 5, the generic IEC type 4A model was used in a full system validation approach.
Figure 9a shows a three-phase voltage dip down to 75% of the rated voltage. The WT was operating at partial active power and zero reactive power. As observed in
Figure 9a, the series impedance of the FRT container was switched on at
s, the short-circuit impedance is switched on at
s and the fault duration is 3 s. In fact, ID 6 was the test with the longest dip duration.
Once the short-circuit occurred, quite an accurate response of both active and reactive power was observed,
Figure 9b,c, respectively. As in test ID 5, the WT turbine starts injecting reactive power when the fault occurs according to the adjusted factor
, as detailed in Equation (
6), where
defines an additional dead band for the reactive current calculation and the other parameters are the same as those defined for Equation (
5).
A small constant deviation between the simulation and the reactive power measurements is found during the fault period,
Figure 9c. In contrast, higher deviations are observed for active power,
Figure 9b. These deviations were due to the current injection method of the actual WT, which was based on a regulation algorithm that includes the dc-link voltage. In fact, the dc-link part and the regulation algorithm were not represented by the generic IEC type 4A model. Once the fault is cleared, some saturation effects are observed in the measurements, which were not represented by the generic transformer model.
Finally,
Table 8 summarizes the key validation errors for test ID 6. As observed, very low validation errors were found for active and reactive power during both fault and post-fault periods.
5. Conclusions
Given the increased penetration of wind power in the energy mix of current power systems, the need for public standard (i.e., generic) WT models to perform transient stability analysis is growing. IEC 61400-27-1, published in February 2015, defined four generic WT dynamic models able to be adapted to any particular WT vendor’s commercial model. As it was published relatively recently, very few validation works with field data have been performed. Hence, TSO, DSOs, WT manufacturers and other stakeholders do not currently have evidence of the generic WTs’ accurate response. The present work has validated three different generic WT topologies (type 3A, type 3B and type 4A) with six different actual variable-speed WTs from three manufacturers (Siemens–Gamesa, Senvion and ENERCON).
First, both IEC validation approaches, the play-back and the full system, were implemented, finding that when the play-back approach is used, the simulated voltage is identical to the measured voltage. In fact, when using the full system approach, the measured voltage experiences a slight hysteresis at voltage dip clearance, which cannot be represented by the simulations due to the lack of hysteresis in the transformer model.
Regarding the DFIG WT model validations, type 3B presented larger validation errors than type 3A, which is due to the crowbar protection system. In fact, the generic crowbar model implemented in type 3B is a simplification of a quite complex model.
Furthermore, the type 4 WT models provided a highly accurate response, for both active and reactive power, with respect to the three different type 4A WTs considered. In the case of the ENERCON E-126 WT, a larger deviation between field and simulation was found, which was based on the particular representation of the current injection for this WT. In this sense, if a deeper voltage dip occurs, the active power results will be affected by the current limitation, which would yield a more accurate validation result.
Author Contributions
Conceptualization, A.H.-E., P.E.S. and E.G.-L.; methodology, A.H.-E., F.J.-B., P.G., S.F. and J.F.; software, J.L.S.-A., P.G. and S.F.; validation, A.H.-E., F.J.-B., P.G., S.F. and E.G.-L.; writing—original draft preparation, A.H.-E.; supervision, J.F., P.E.S. and E.G.-L.
Funding
This research was funded by the Spanish Ministry of Economy and Competitiveness and European Union FEDER, which supported this work under Project ENE2016-78214-C2-1-R, as well as the Agreement signed between the UCLM and the Council of Albacete to foster Research in the Campus of Albacete.
Acknowledgments
The authors would like to express their appreciation to the wind turbine manufacturers Enercon, Senvion and Siemens–Gamesa for their technical support, as well as to the rest of the members of Working Group 27 of IEC Technical Committee 88 in charge of the development of IEC 61400-27.
Conflicts of Interest
The authors declare no conflict of interest. The funders had no role in the design of the study; in the collection, analyses, or interpretation of data; in the writing of the manuscript, or in the decision to publish the results.
Abbreviations
The following abbreviations are used in this manuscript:
| AC | Alternating current |
| DC | Direct current |
| DFIG | Doubly-fed induction generator |
| DSO | Distribution system operator |
| EU | European Union |
| FRT | Fault-ride through |
| GB | Gearbox |
| GSC | Grid side converter |
| IEC | International Electrotechnical Commission |
| IG | Induction generator (also known as asynchronous generator) |
| MSC | Machine (or rotor) side converter |
| pu | per unit |
| QS | quasi-steady state |
| RES | Renewable energy source |
| RMS | Root mean square |
| SG | Synchronous generator |
| TSO | Transmission system operator |
| US/USA | United States of America |
| W | Window |
| WECC | Western Electricity Coordinating Council |
| WT | Wind turbine |
| WTR | Wind turbine rotor |
| WTT | Wind turbine terminal |
References
- GWEC. Global Wind Report. Annual Market Update 2015; Technical Report; Global Wind Energy Council: Brussels, Belgium, 2016. [Google Scholar]
- WindEurope. Wind Energy in Europe in 2018; Technical Report; WindEurope: Brussels, Belgium, 2019. [Google Scholar]
- Trilla, L.; Gomis-Bellmunt, O.; Junyent-Ferre, A.; Mata, M.; Sánchez Navarro, J.; Sudria-Andreu, A. Modeling and Validation of DFIG 3-MW Wind Turbine Using Field Test Data of Balanced and Unbalanced Voltage Sags. IEEE Trans. Sustain. Energy 2011, 2, 509–519. [Google Scholar] [CrossRef]
- Zhao, S.; Nair, N.K. Assessment of wind farm models from a transmission system operator perspective using field measurements. IET Renew. Power Gener. 2011, 5, 455–464. [Google Scholar] [CrossRef]
- Honrubia-Escribano, A.; Jiménez-Buendía, F.; Gómez-Lázaro, E.; Fortmann, J. Validation of Generic Models for Variable Speed Operation Wind Turbines Following the Recent Guidelines Issued by IEC 61400-27. Energies 2016, 9, 1048. [Google Scholar] [CrossRef]
- Lorenzo-Bonache, A.; Honrubia-Escribano, A.; Fortmann, J.; Gómez-Lázaro, E. Generic Type 3 WT models: Comparison between IEC and WECC approaches. IET Renew. Power Gener. 2019, 13, 1168–1178. [Google Scholar] [CrossRef]
- Zhao, H.; Wu, Q.; Margaris, I.; Bech, J.; Sørensen, P.E.; Andresen, B. Implementation and validation of IEC generic Type 1A wind turbine generator model. Int. Trans. Electr. Energy Syst. 2014, 25, 1804–1813. [Google Scholar] [CrossRef]
- Lorenzo-Bonache, A.; Honrubia-Escribano, A.; Jiménez-Buendía, F.; Gómez-Lázaro, E. Field Validation of Generic Type 4 Wind Turbine Models Based on IEC and WECC Guidelines. IEEE Trans. Energy Convers. 2019, 34, 933–941. [Google Scholar] [CrossRef]
- Lorenzo-Bonache, A.; Honrubia-Escribano, A.; Jiménez-Buendía, F.; Molina-García, A.; Gómez-Lázaro, E. Generic Type 3 Wind Turbine Model Based on IEC 61400-27-1: Parameter Analysis and Transient Response under Voltage Dips. Energies 2017, 10, 1441. [Google Scholar] [CrossRef]
- International Electrotechnical Commission. IEC 61400-27-1: Electrical Simulation Models-Wind Turbines; IEC: Geneva, Switzerland, 2015. [Google Scholar]
- Goksu, O.; Sørensen, P.; Morales, A.; Weigel, S.; Fortmann, J.; Pourbeik, P. Compatibility of IEC 61400-27-1 Ed 1 and WECC 2nd Generation Wind Turbine Models. In Proceedings of the 15th International Workshop on Large-Scale Integration of Wind Power into Power Systems as well as on Transmission Networks for Offshore Wind Power Plants, Vienna, Austria, 15–17 November 2016. [Google Scholar]
- Honrubia-Escribano, A.; Jiménez-Buendía, F.; Gómez-Lázaro, E.; Fortmann, J. Field Validation of a Standard Type 3 Wind Turbine Model for Power System Stability, According to the Requirements Imposed by IEC 61400-27-1. IEEE Trans. Energy Convers. 2018, 33, 137–145. [Google Scholar] [CrossRef]
- Das, K.; Hansen, A.D.; Sørensen, P.E. Understanding IEC standard wind turbine models using SimPowerSystems. Wind Eng. 2016, 40, 212–227. [Google Scholar] [CrossRef]
- Flynn, D.; Rather, Z.; Ardal, A.; D’Arco, S.; Hansen, A.; Cutululis, N.; Sorensen, P.; Estanquiero, A.; Gómez, E.; Menemenlis, N.; et al. Technical impacts of high penetration levels of wind power on power system stability. Wiley Interdiscip. Rev. Energy Environ. 2017, 6, e216. [Google Scholar] [CrossRef]
- Honrubia Escribano, A.; Gomez-Lazaro, E.; Fortmann, J.; Sørensen, P.; Martín-Martínez, S. Generic dynamic wind turbine models for power system stability analysis: A comprehensive review. Renew. Sustain. Energy Rev. 2018, 81, 1939–1952. [Google Scholar] [CrossRef]
- Fortmann, J. Modeling of Wind Turbines with Doubly Fed Generator System. Ph.D. Thesis, Department for Electrical Power Systems, University of Duisburg-Essen, Duisburg, Germany, 2014. [Google Scholar]
- Justo, J.J.; Mwasilu, F.; Jung, J.W. Doubly-fed induction generator based wind turbines: A comprehensive review of fault ride-through strategies. Renew. Sustain. Energy Rev. 2015, 45, 447–467. [Google Scholar] [CrossRef]
- Hu, Y.L.; Wu, Y.K.; Chen, C.K.; Wang, C.H.; Chen, W.T.; Cho, L.I. A Review of the Low-Voltage Ride-Through Capability of Wind Power Generators. Energy Procedia 2017, 141, 378–382. [Google Scholar] [CrossRef]
- Luna, A.; Lima, F.; Santos, D.; Rodriguez, P.; Watanabe, E.; Arnaltes, S. Simplified Modeling of a DFIG for Transient Studies in Wind Power Applications. IEEE Trans. Ind. Electron. 2011, 58, 9–20. [Google Scholar] [CrossRef]
- Jiménez Buendía, F.; Barrasa Gordo, B. Generic Simplified Simulation Model for DFIG with Active Crowbar. In Proceedings of the 11th International Workshop on Large-Scale Integration of Wind Power into Power Systems as well as on Transmission Networks for Offshore Wind Power Plants, Lisbon, Portugal, 13–15 November 2012; p. 6. [Google Scholar]
- Fortmann, J.; Engelhardt, S.; Kretschmann, J.; Feltes, C.; Erlich, I. New Generic Model of DFG-Based Wind Turbines for RMS-Type Simulation. IEEE Trans. Energy Convers. 2014, 29, 110–118. [Google Scholar] [CrossRef]
- Bech, J. Siemens Experience with Validation of Different Types of Wind Turbine Models. In Proceedings of the IEEE Power and Energy Society General Meeting, Washington, DC, USA, 27–31 July 2014. [Google Scholar]
- Goksu, O.; Altin, M.; Fortmann, J.; Sorensen, P. Field Validation of IEC 61400-27-1 Wind Generation Type 3 Model with Plant Power Factor Controller. IEEE Trans. Energy Convers. 2016, 31, 1170–1178. [Google Scholar] [CrossRef]
- International Electrotechnical Commission. IEC 61400-21-1: Wind Energy Generation Systems. Part 21-1: Measurement and Assessment of Electrical Characteristics-Wind Turbines; IEC: Geneva, Switzerland, 2019. [Google Scholar]
© 2019 by the authors. Licensee MDPI, Basel, Switzerland. This article is an open access article distributed under the terms and conditions of the Creative Commons Attribution (CC BY) license (http://creativecommons.org/licenses/by/4.0/).

 ,
, 


