Pathways for Germany’s Low-Carbon Energy Transformation Towards 2050

 ,
,  , ,
, ,  and
and
Abstract
1. Introduction
1.1. German Climate Policy
1.2. Energy System
1.3. Literature Review
1.4. Research Question
2. Methodology
2.1. Description of the Model
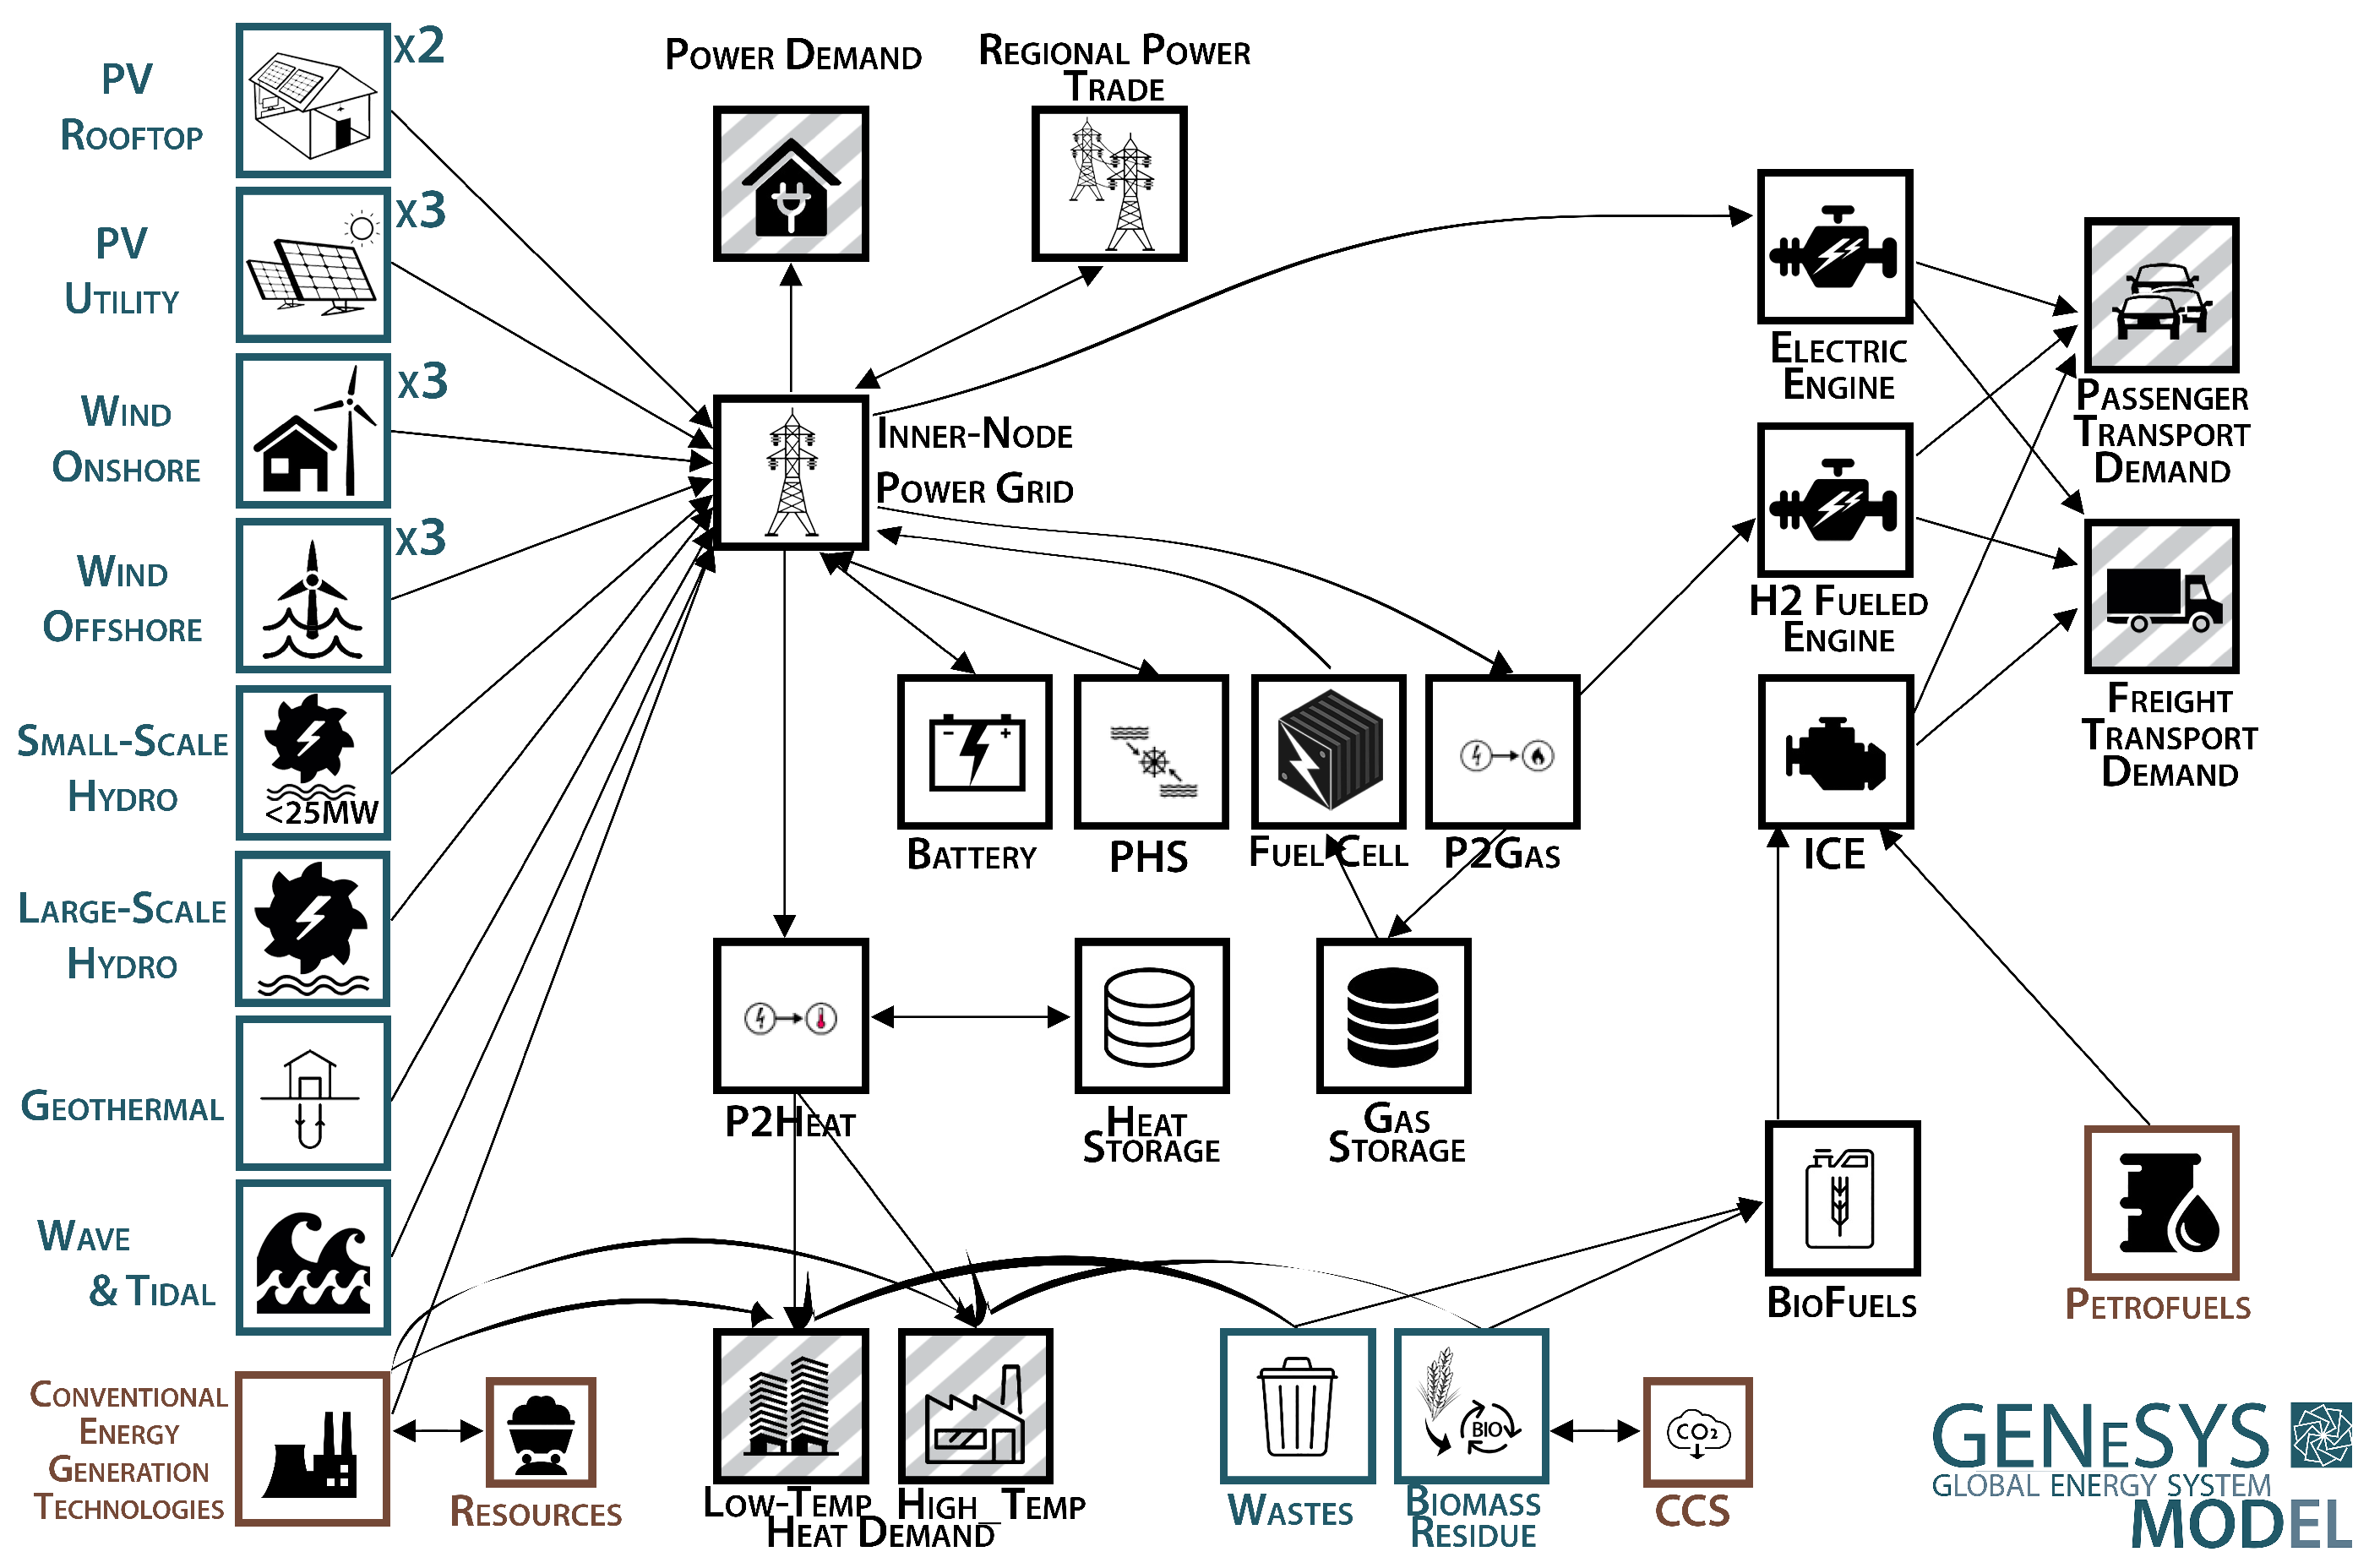
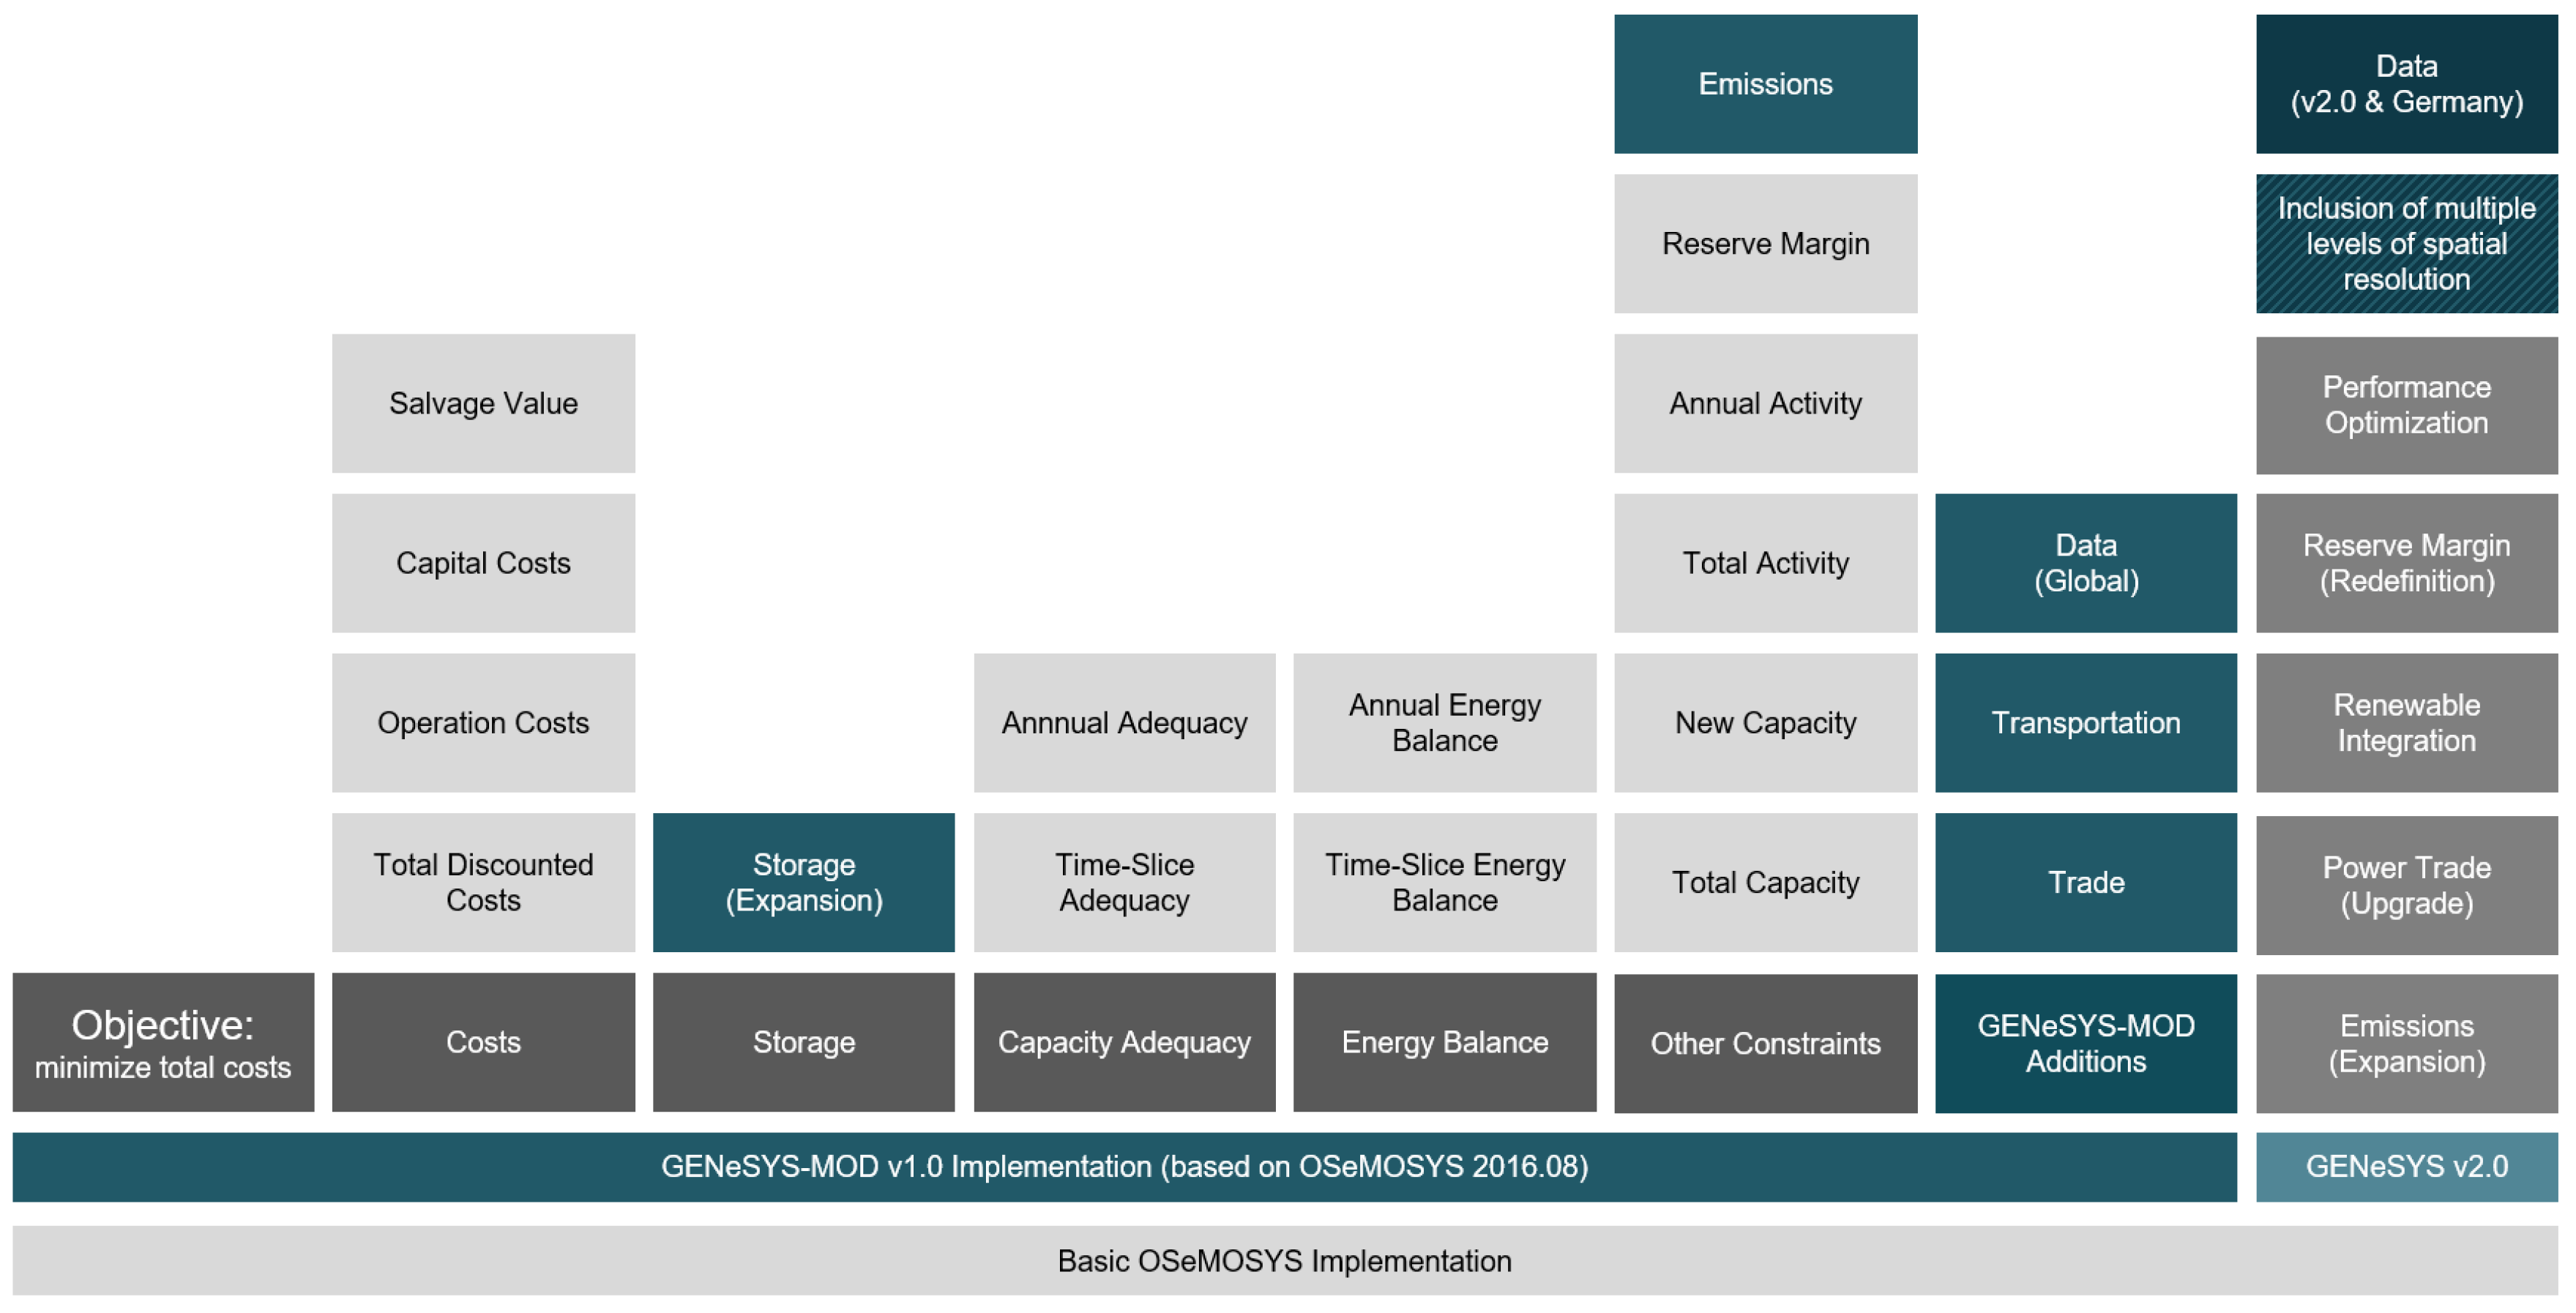
2.1.1. Summary of GENeSYS-MOD
2.1.2. Basic Structure of the Model
2.1.3. Node Split
2.2. Elaboration of the Scenarios
2.2.1. European Island Scenario
2.2.2. Green Democracy Scenario
2.2.3. Survival of the Fittest
3. Results
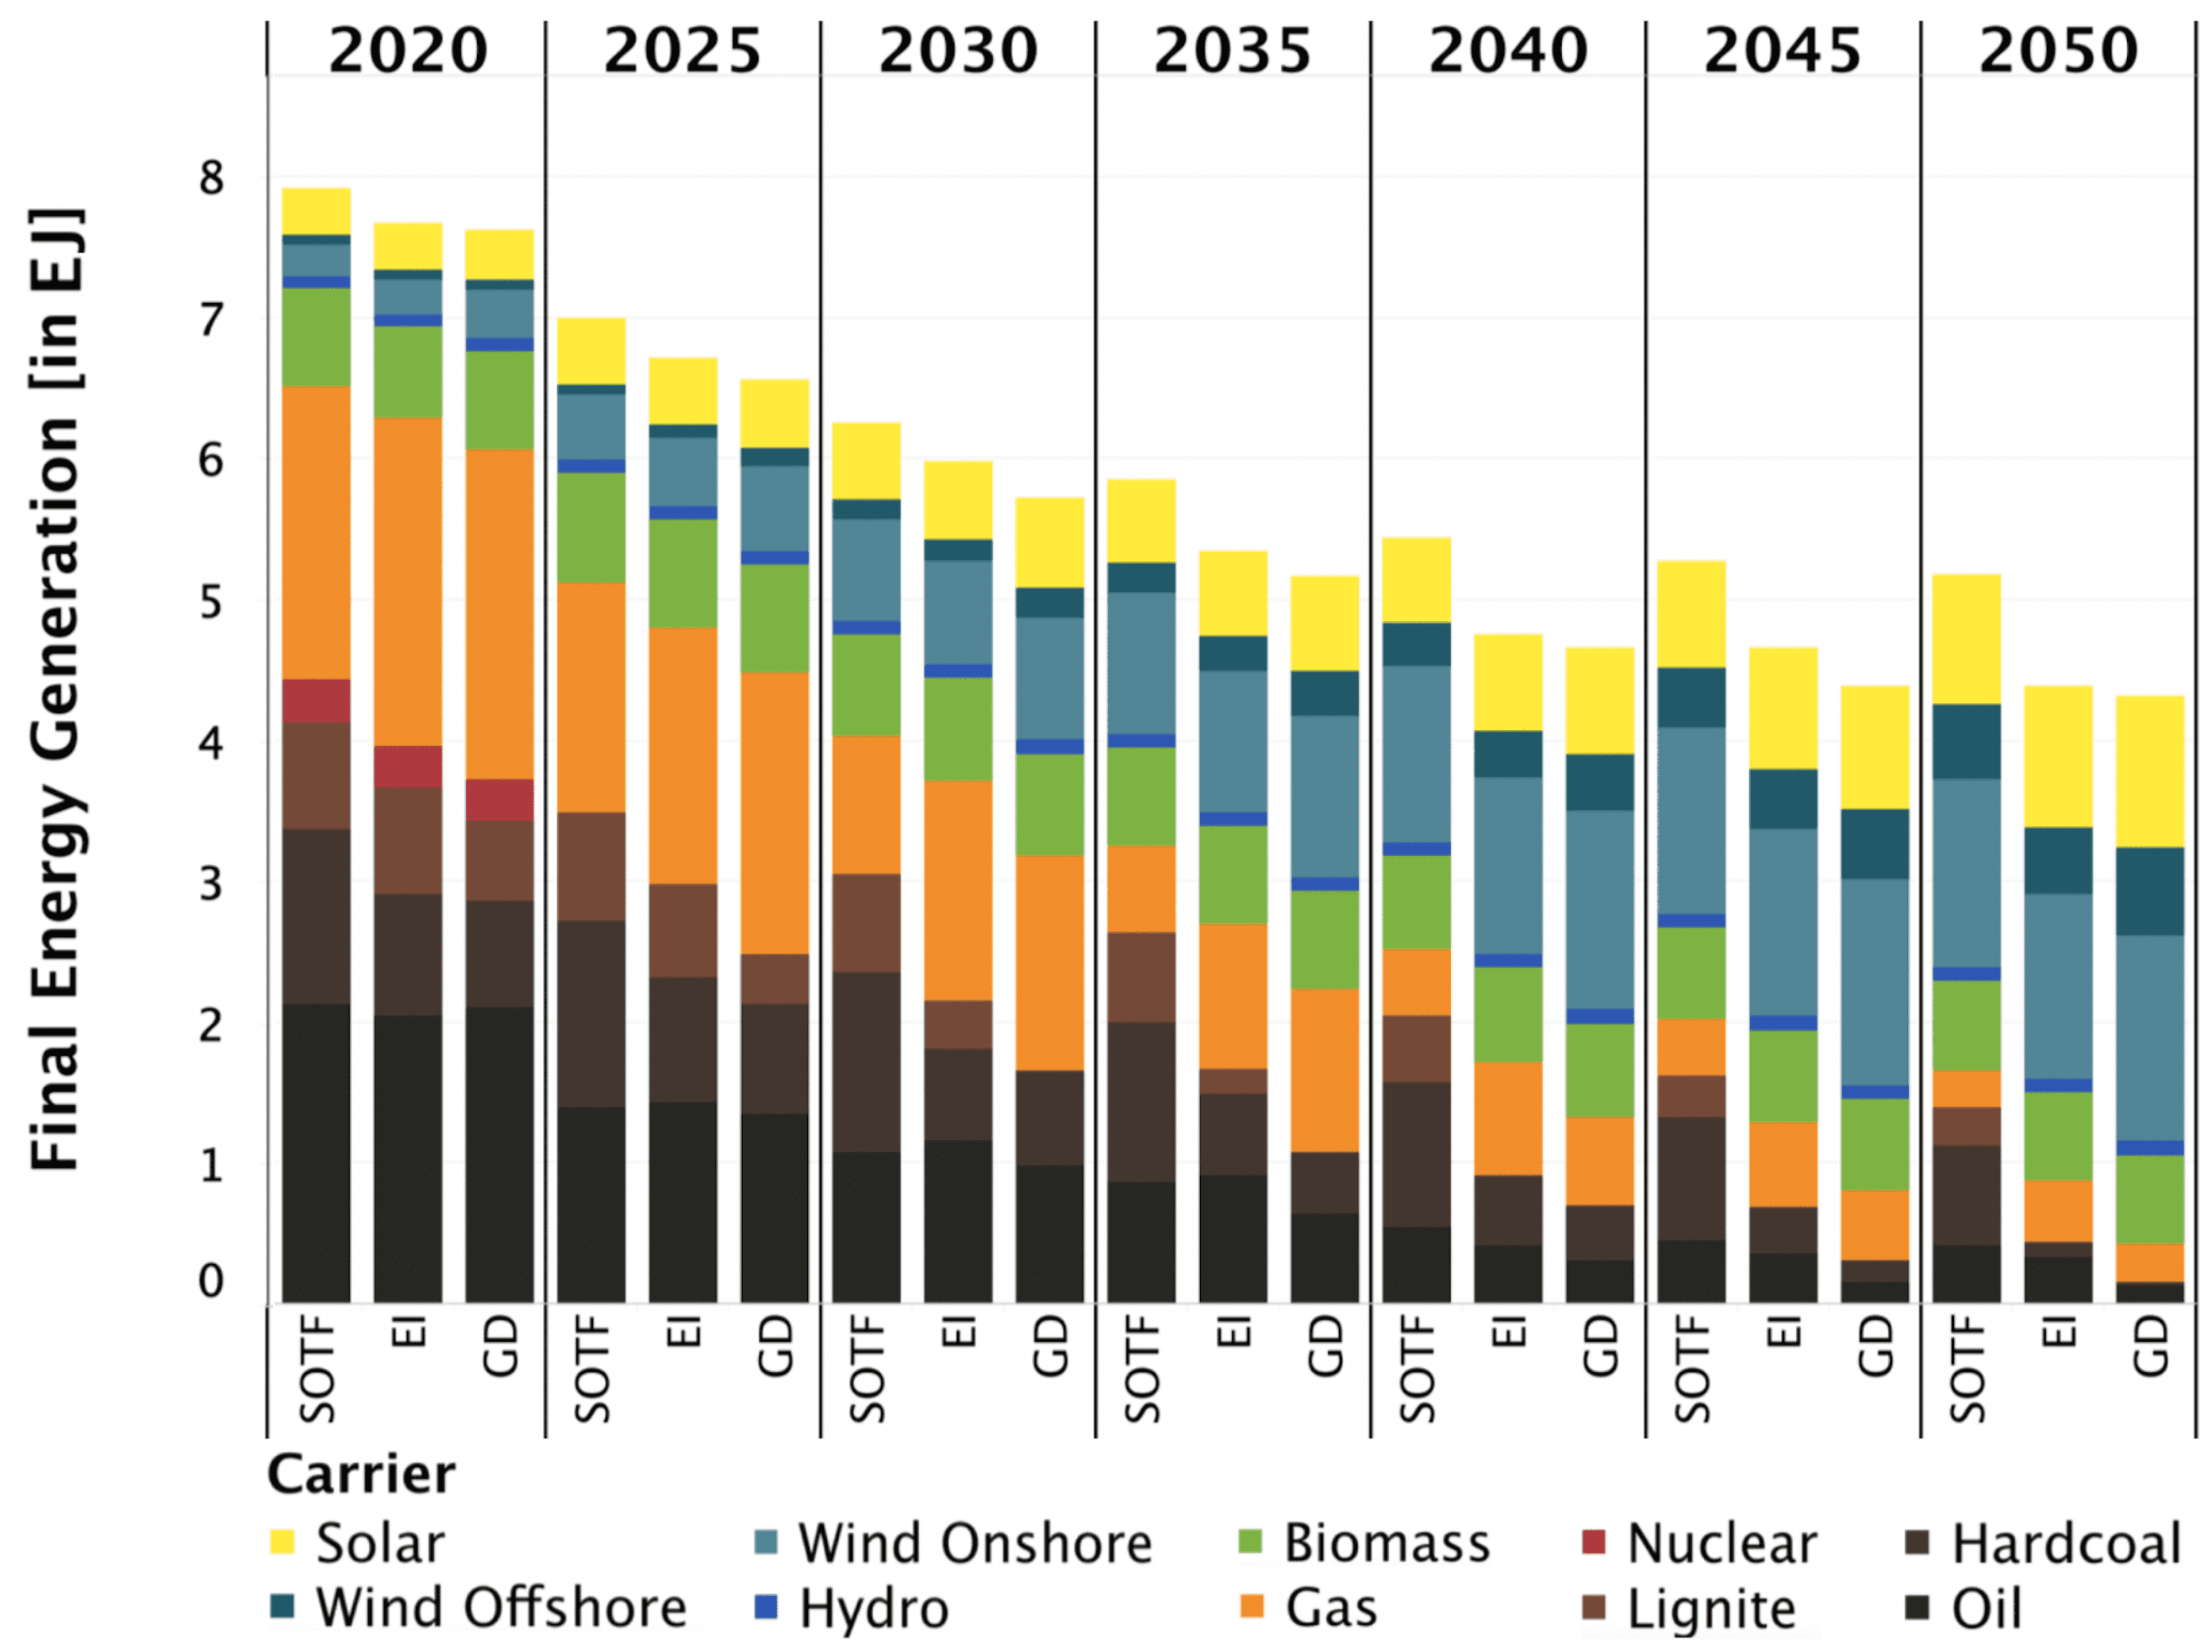
3.1. Final Energy
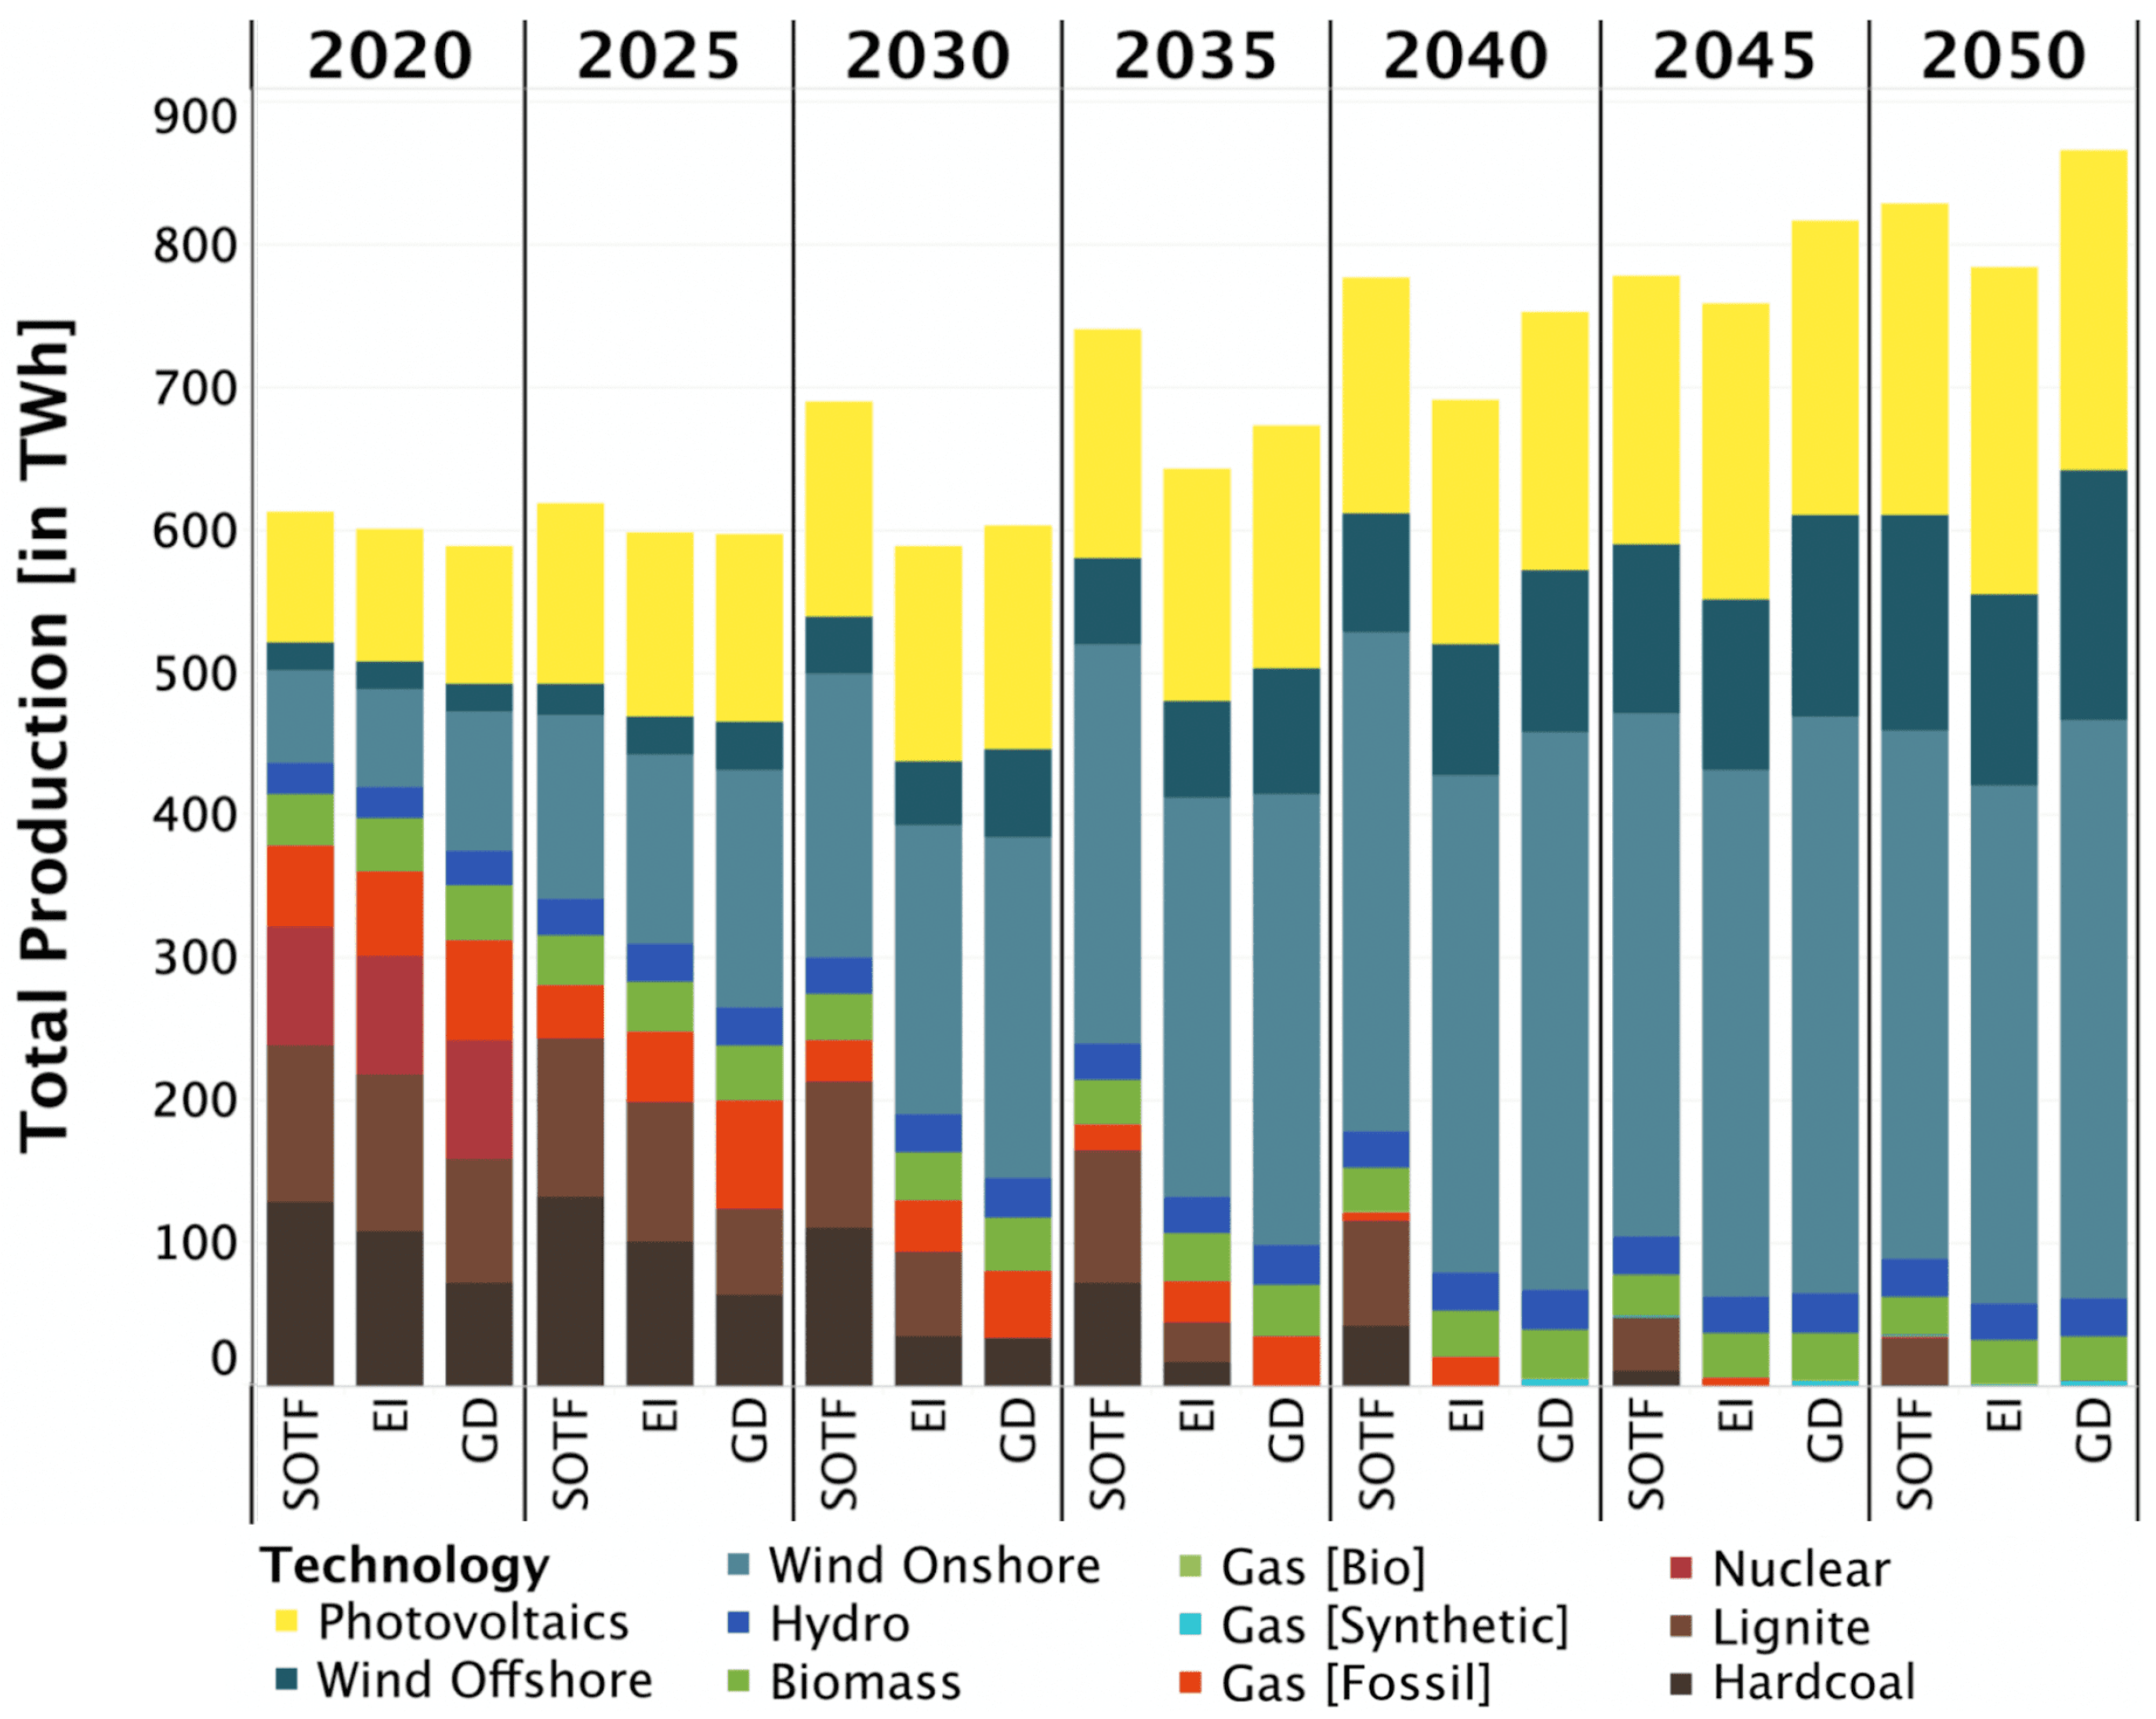
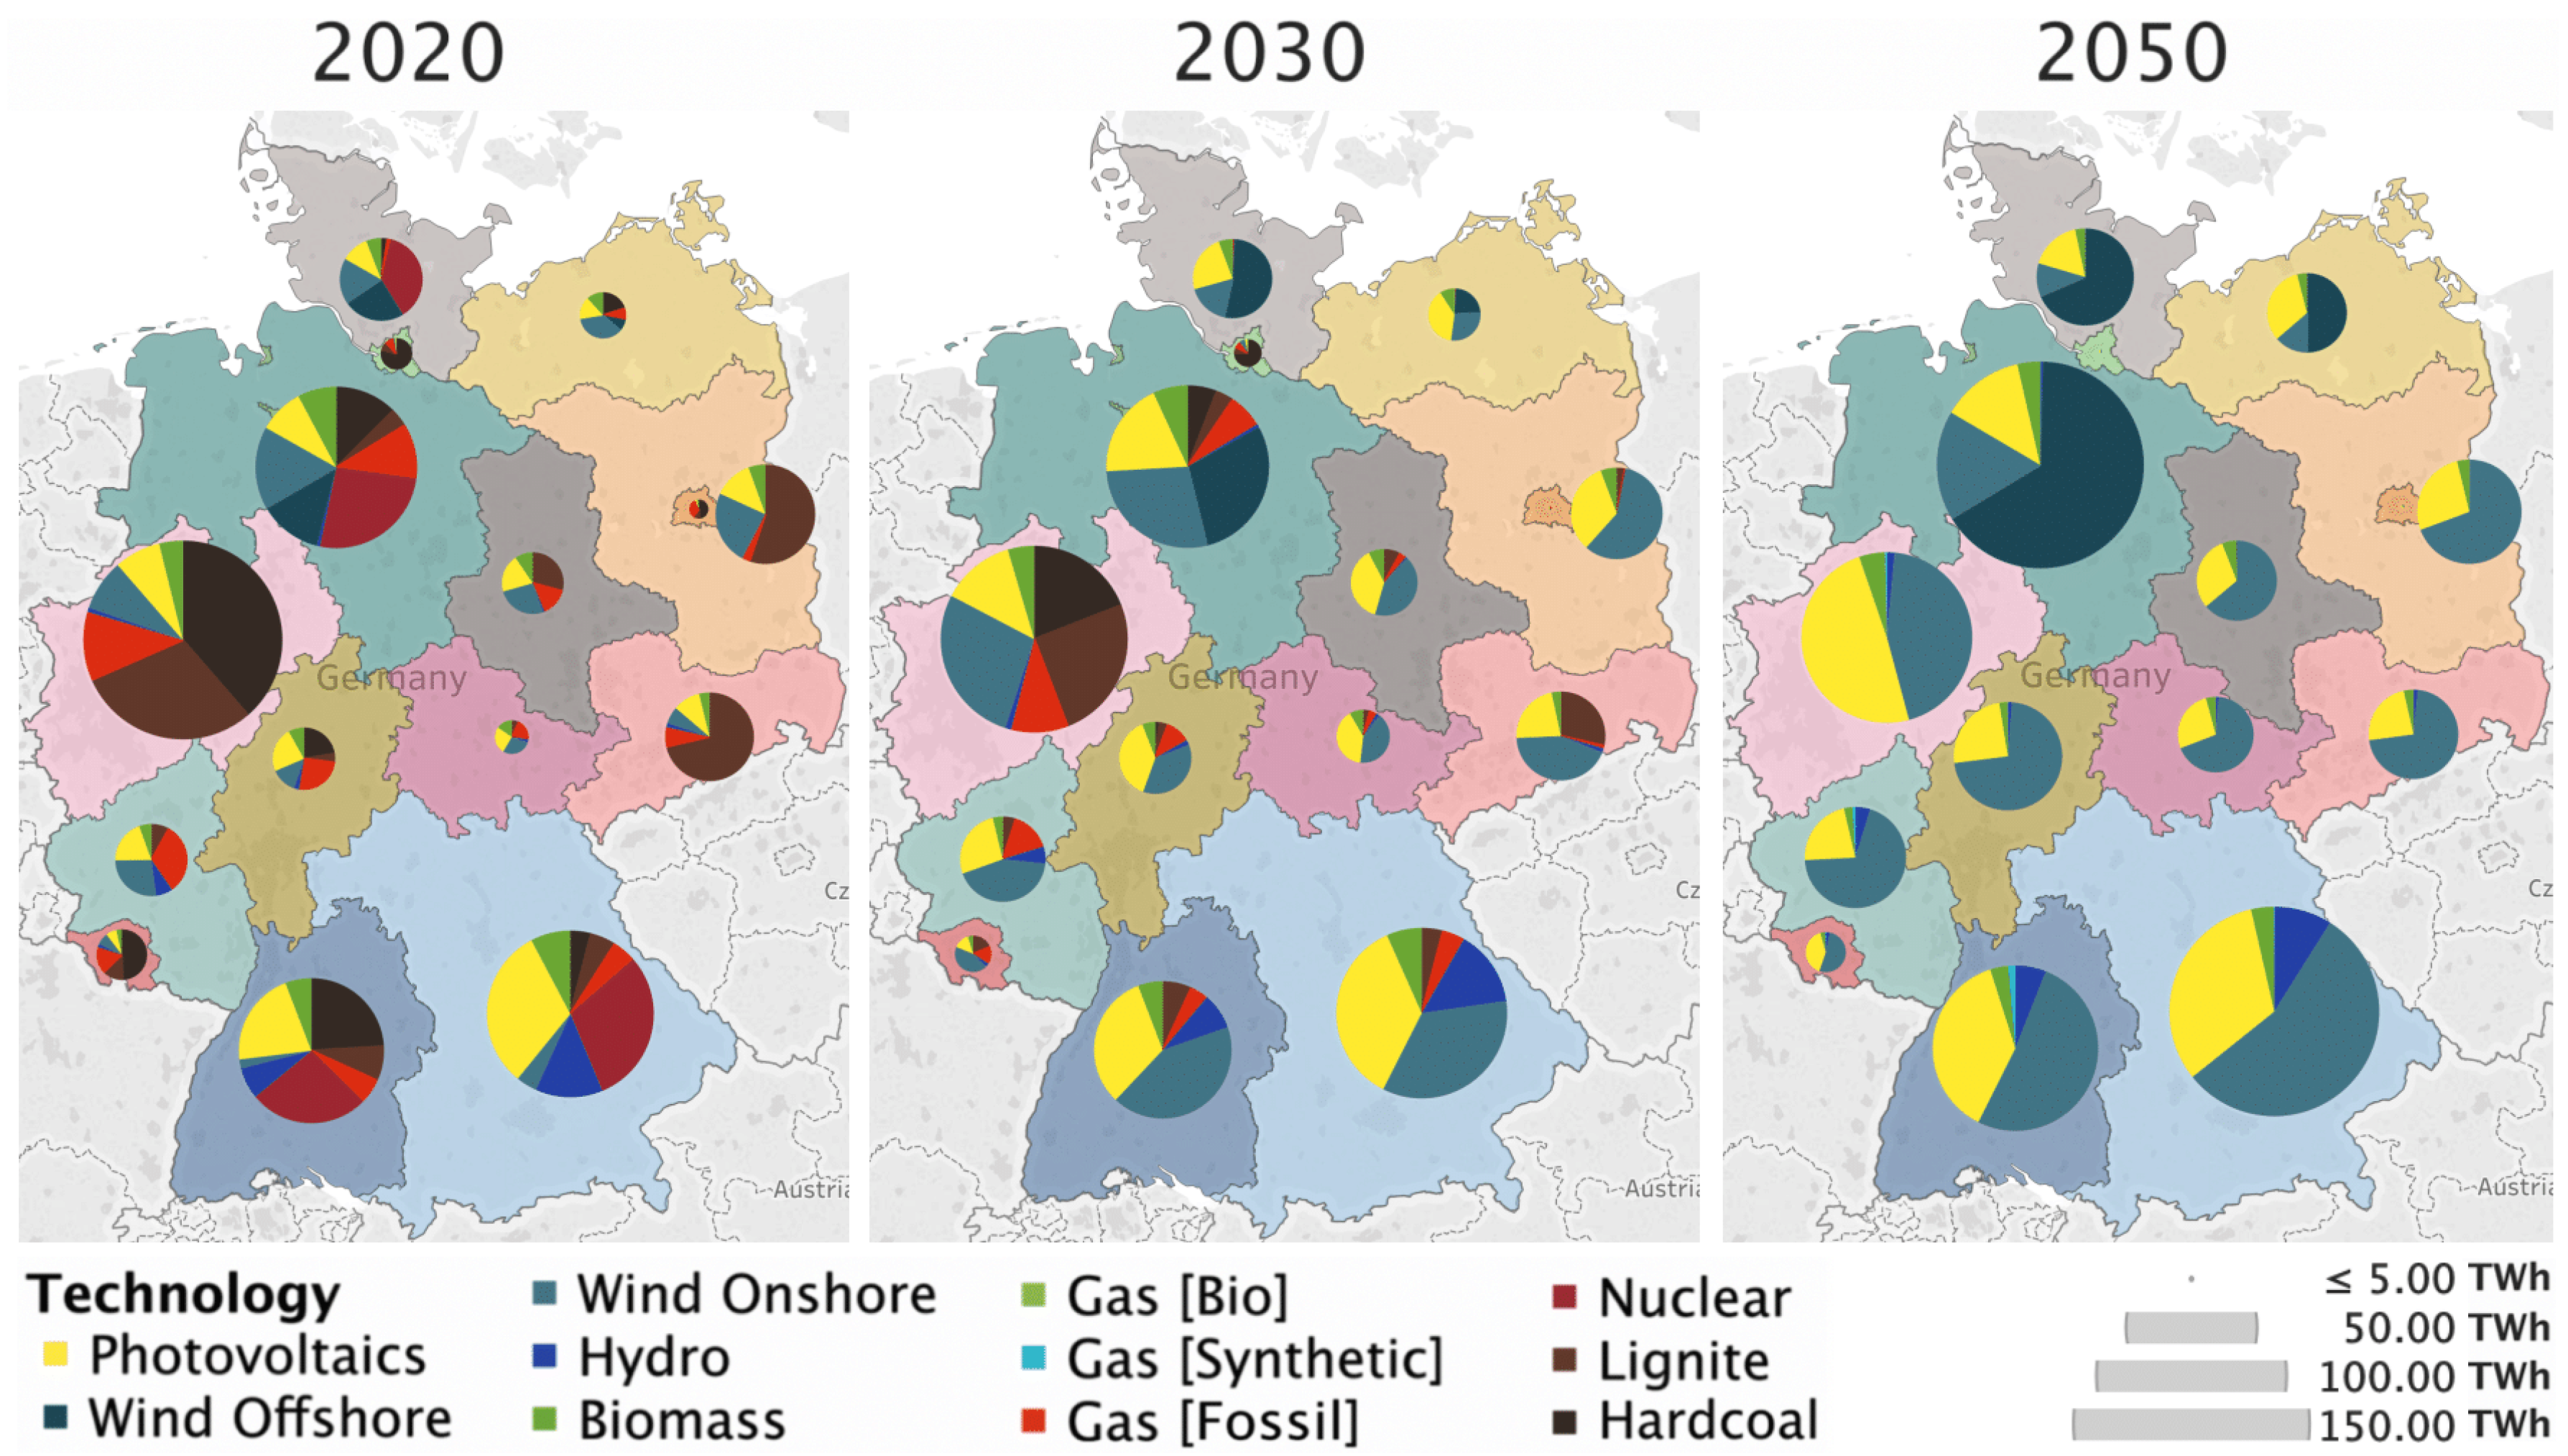
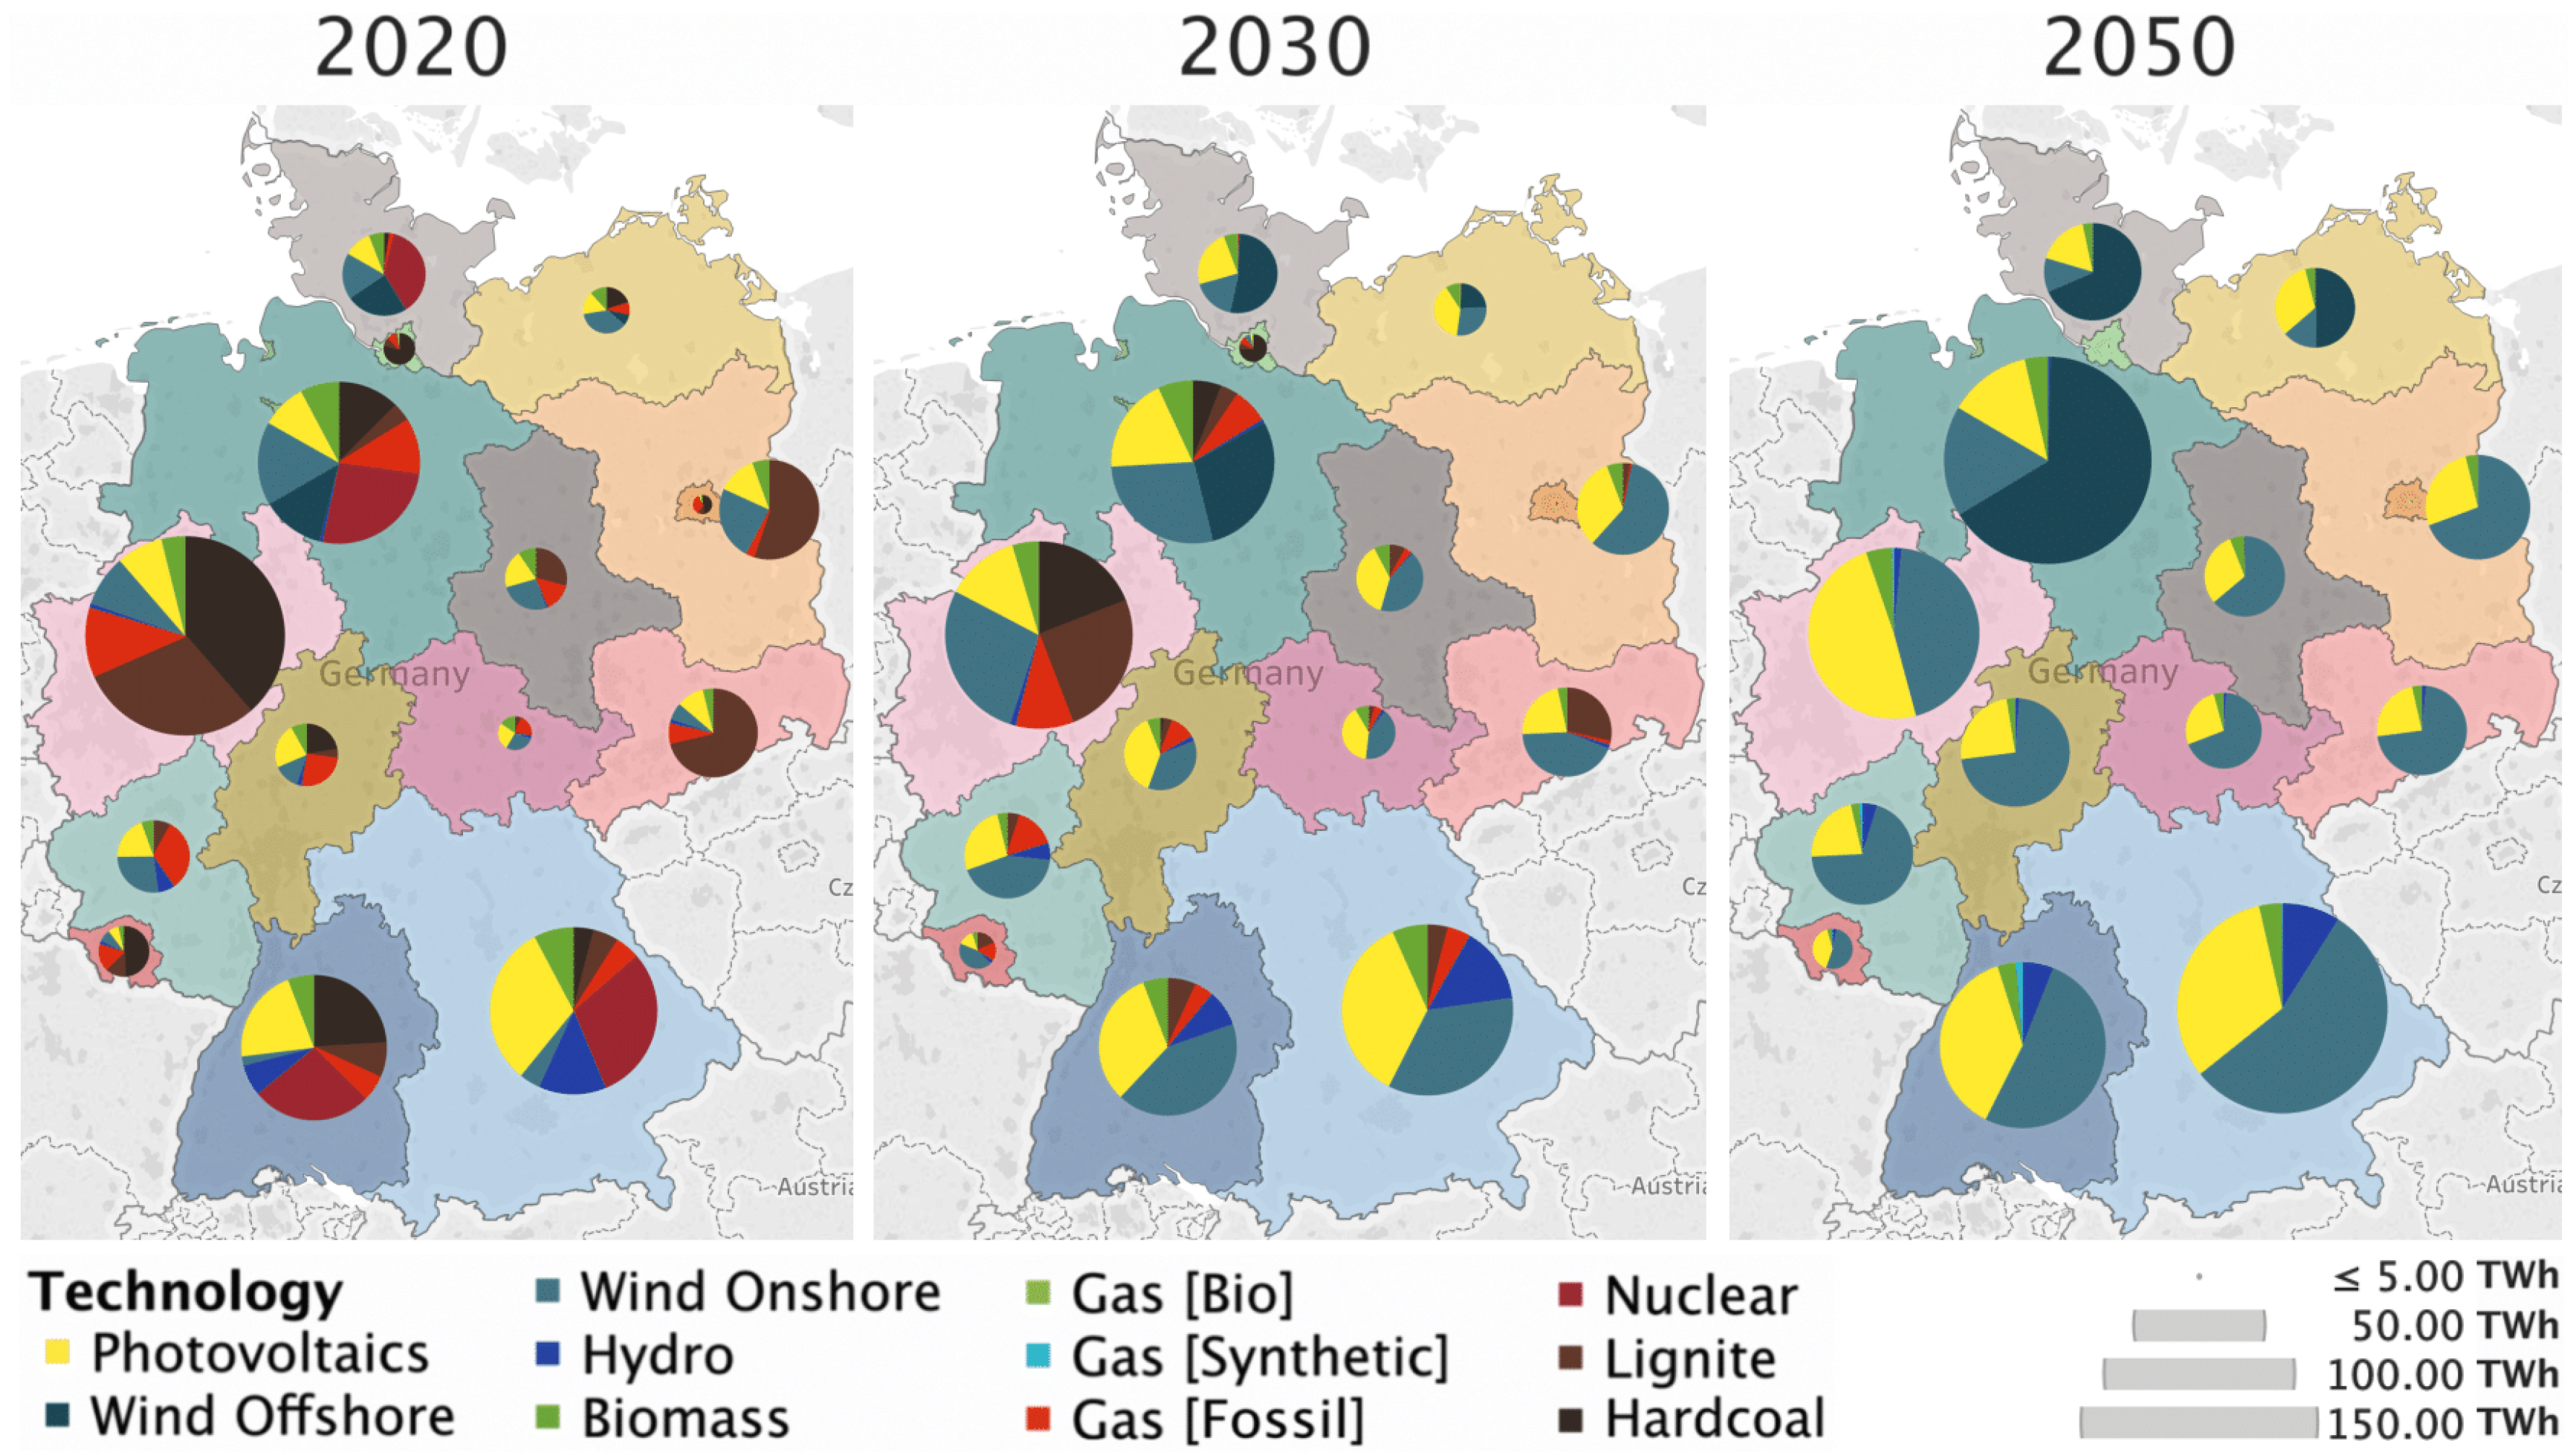
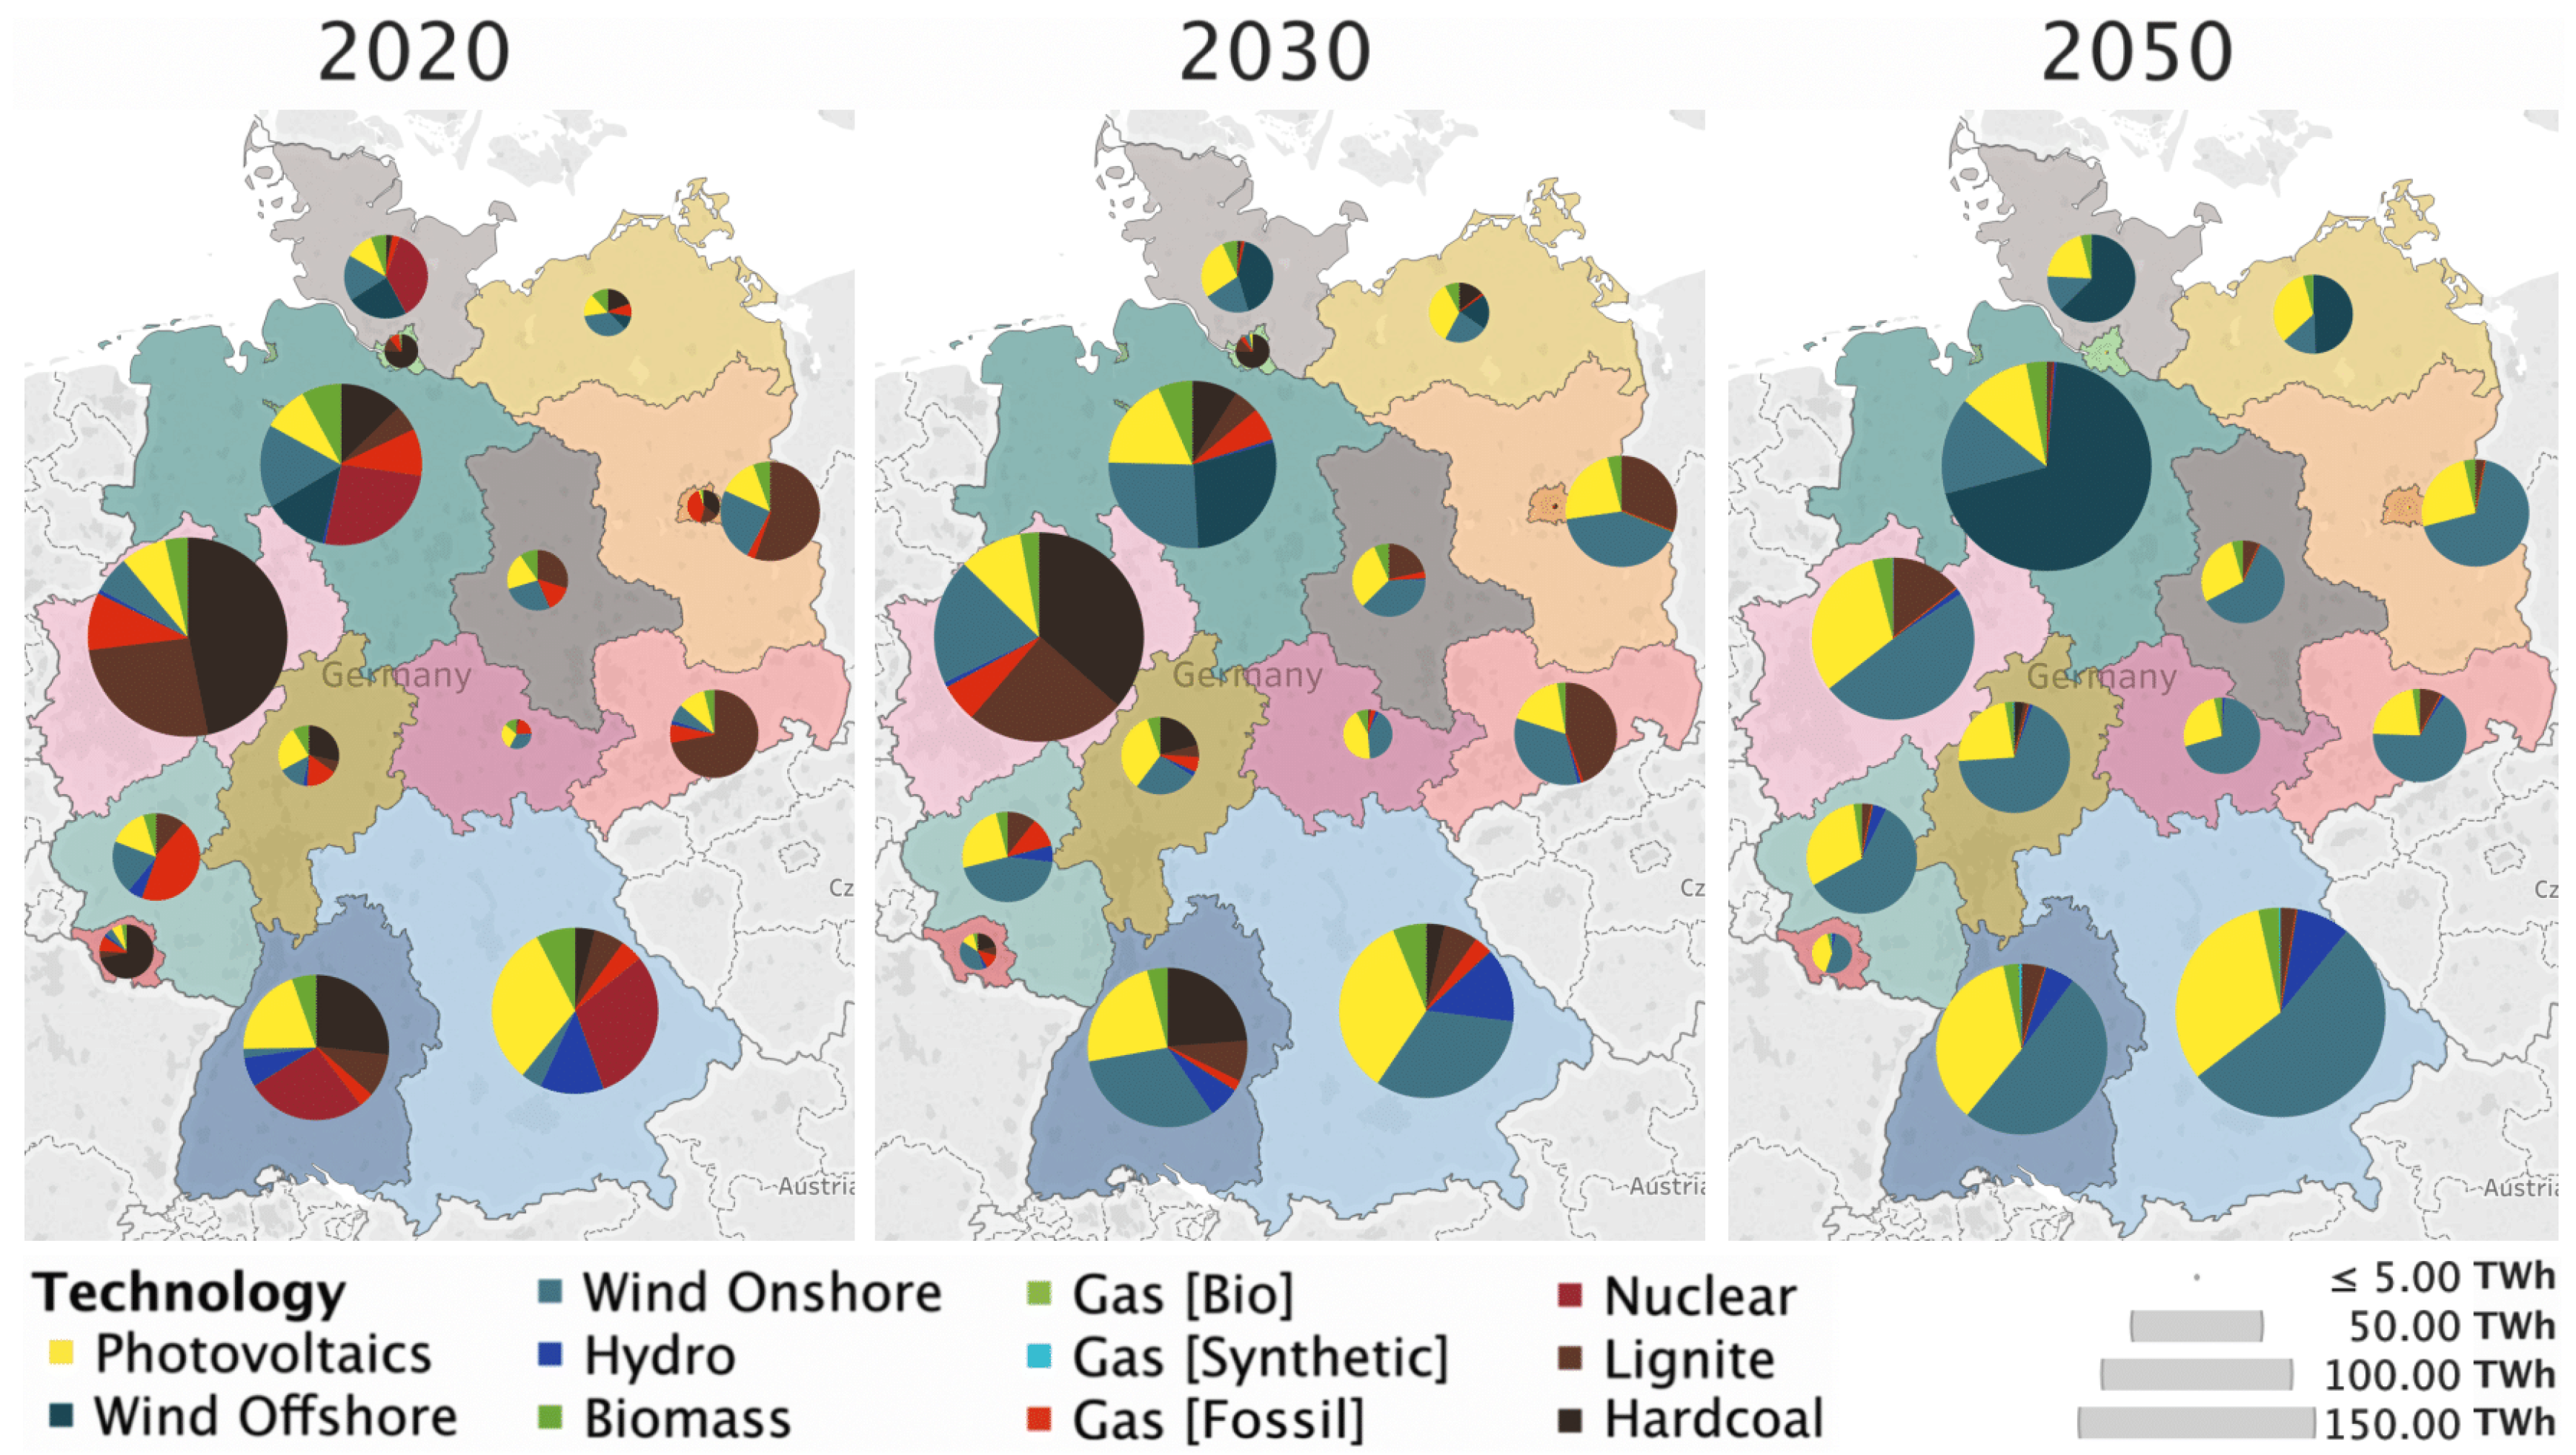
3.2. Power Sector
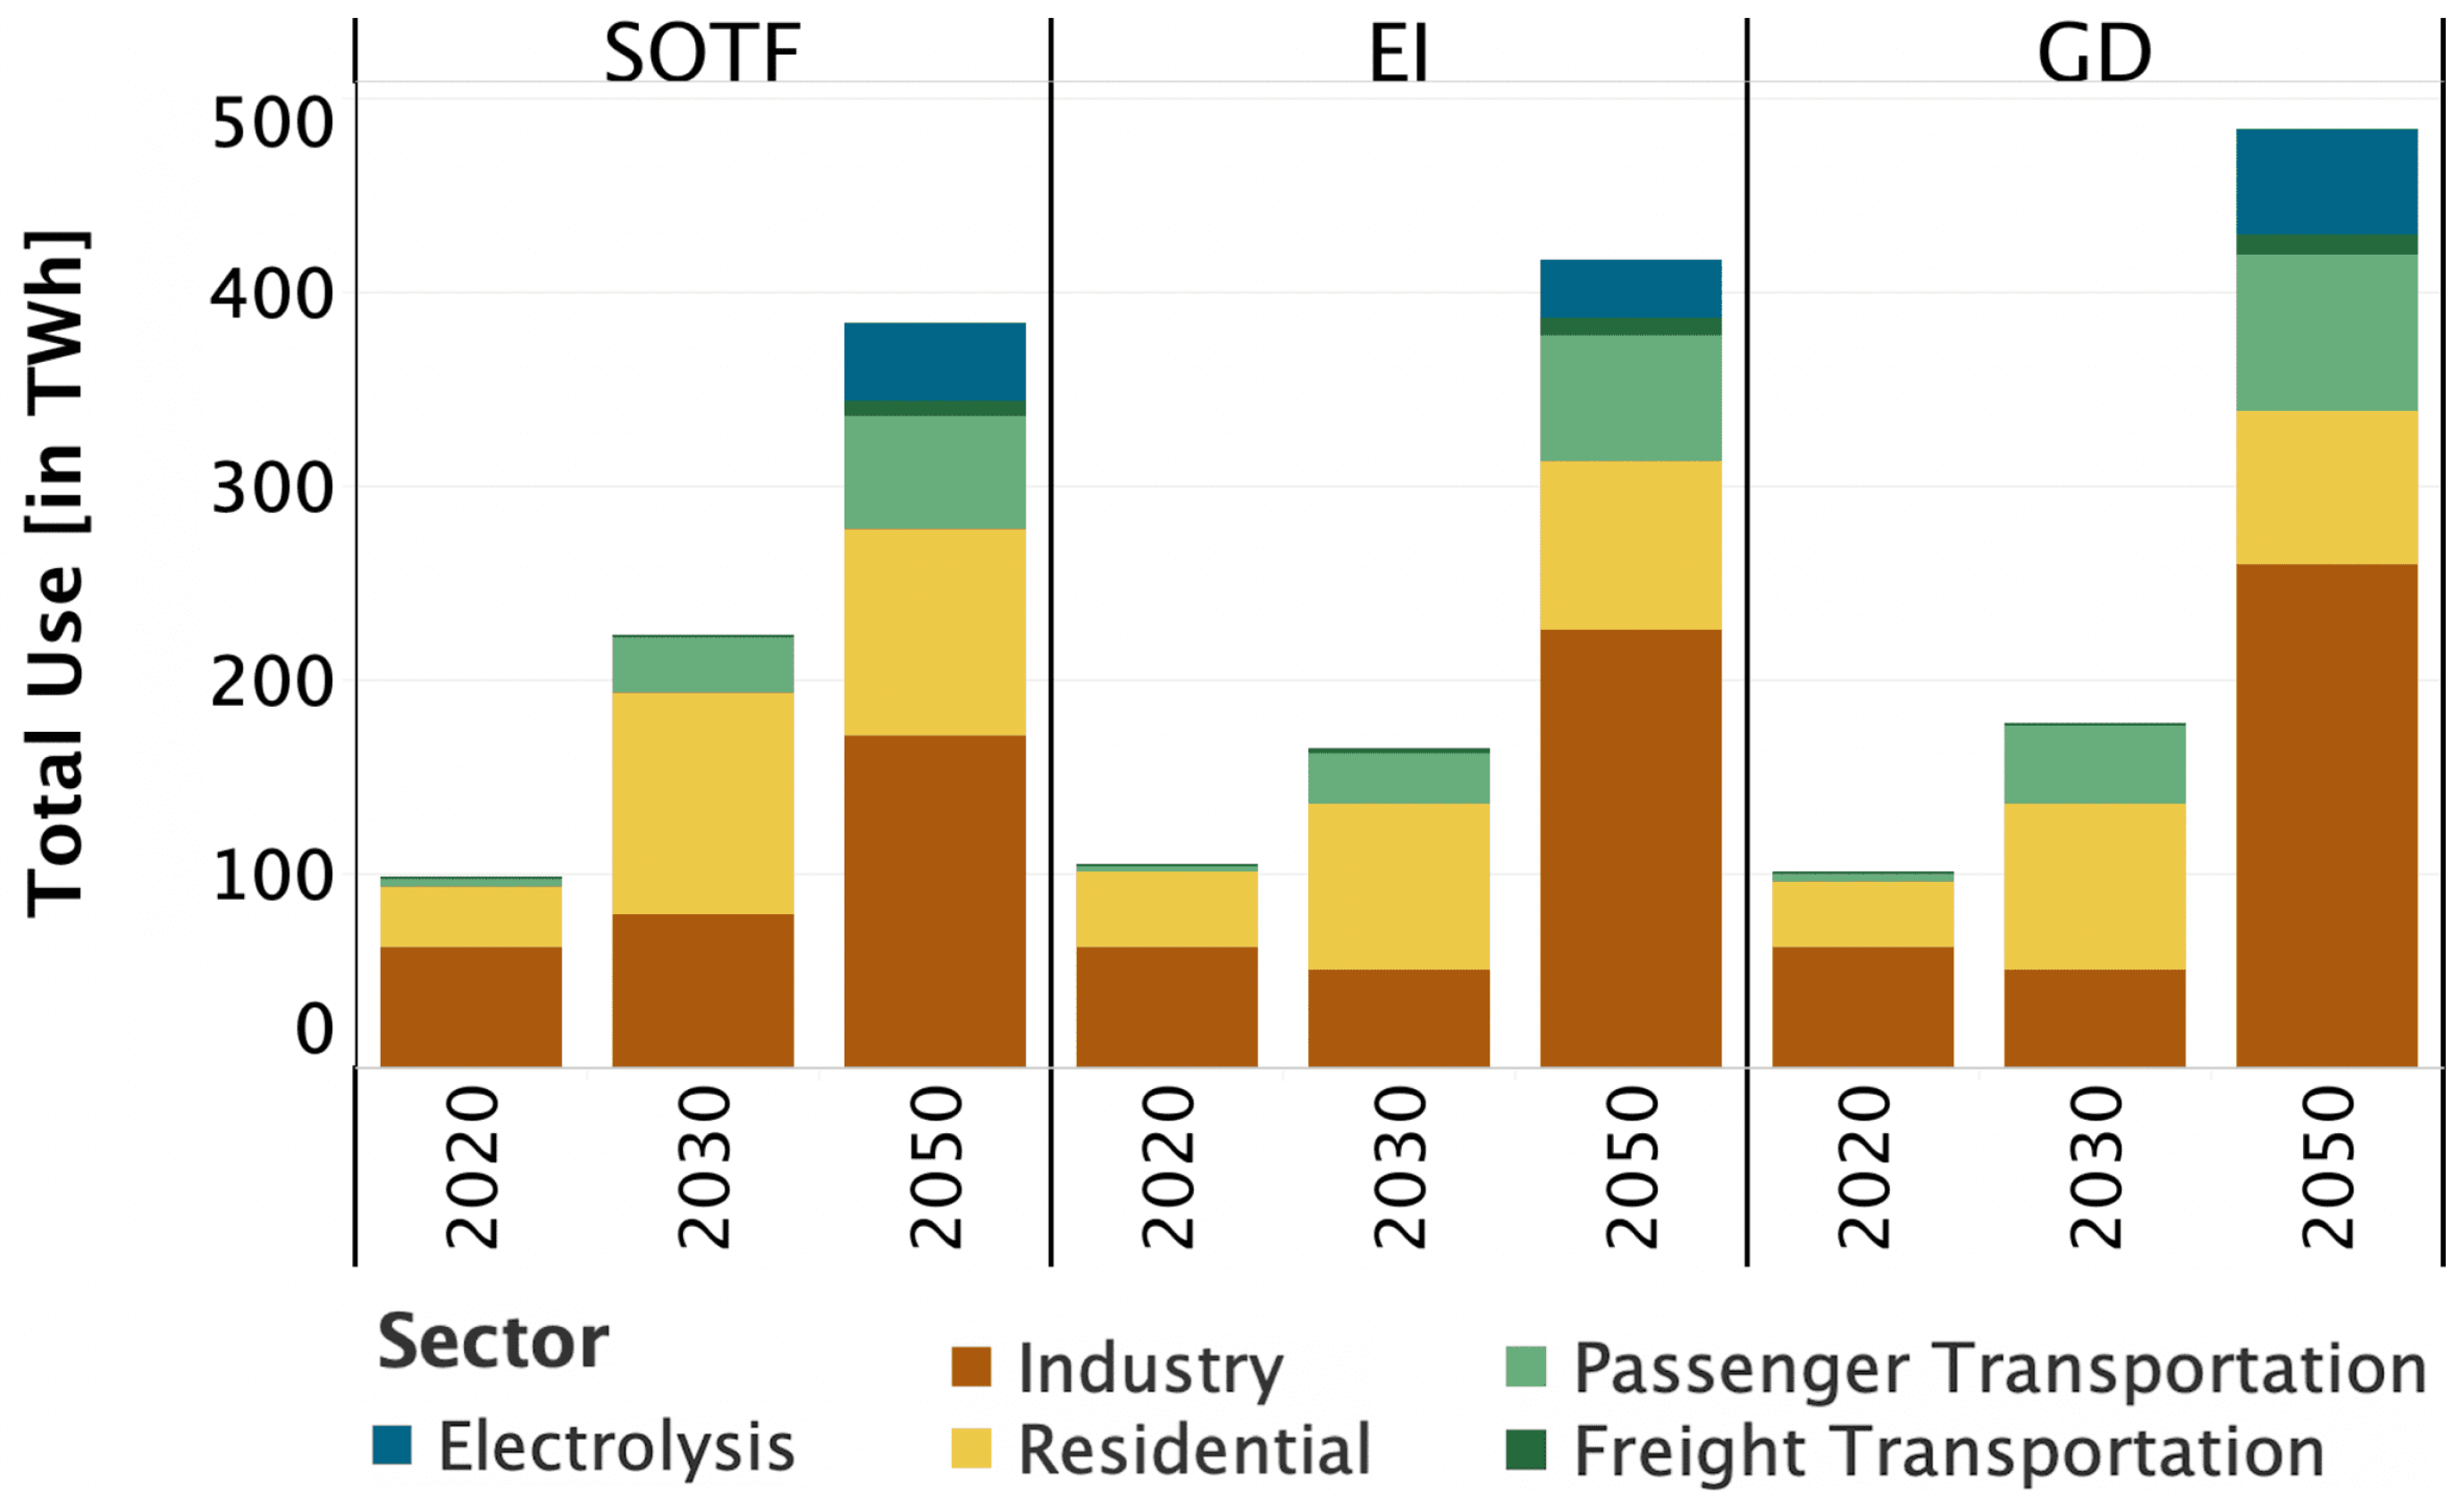
3.3. Sector Coupling
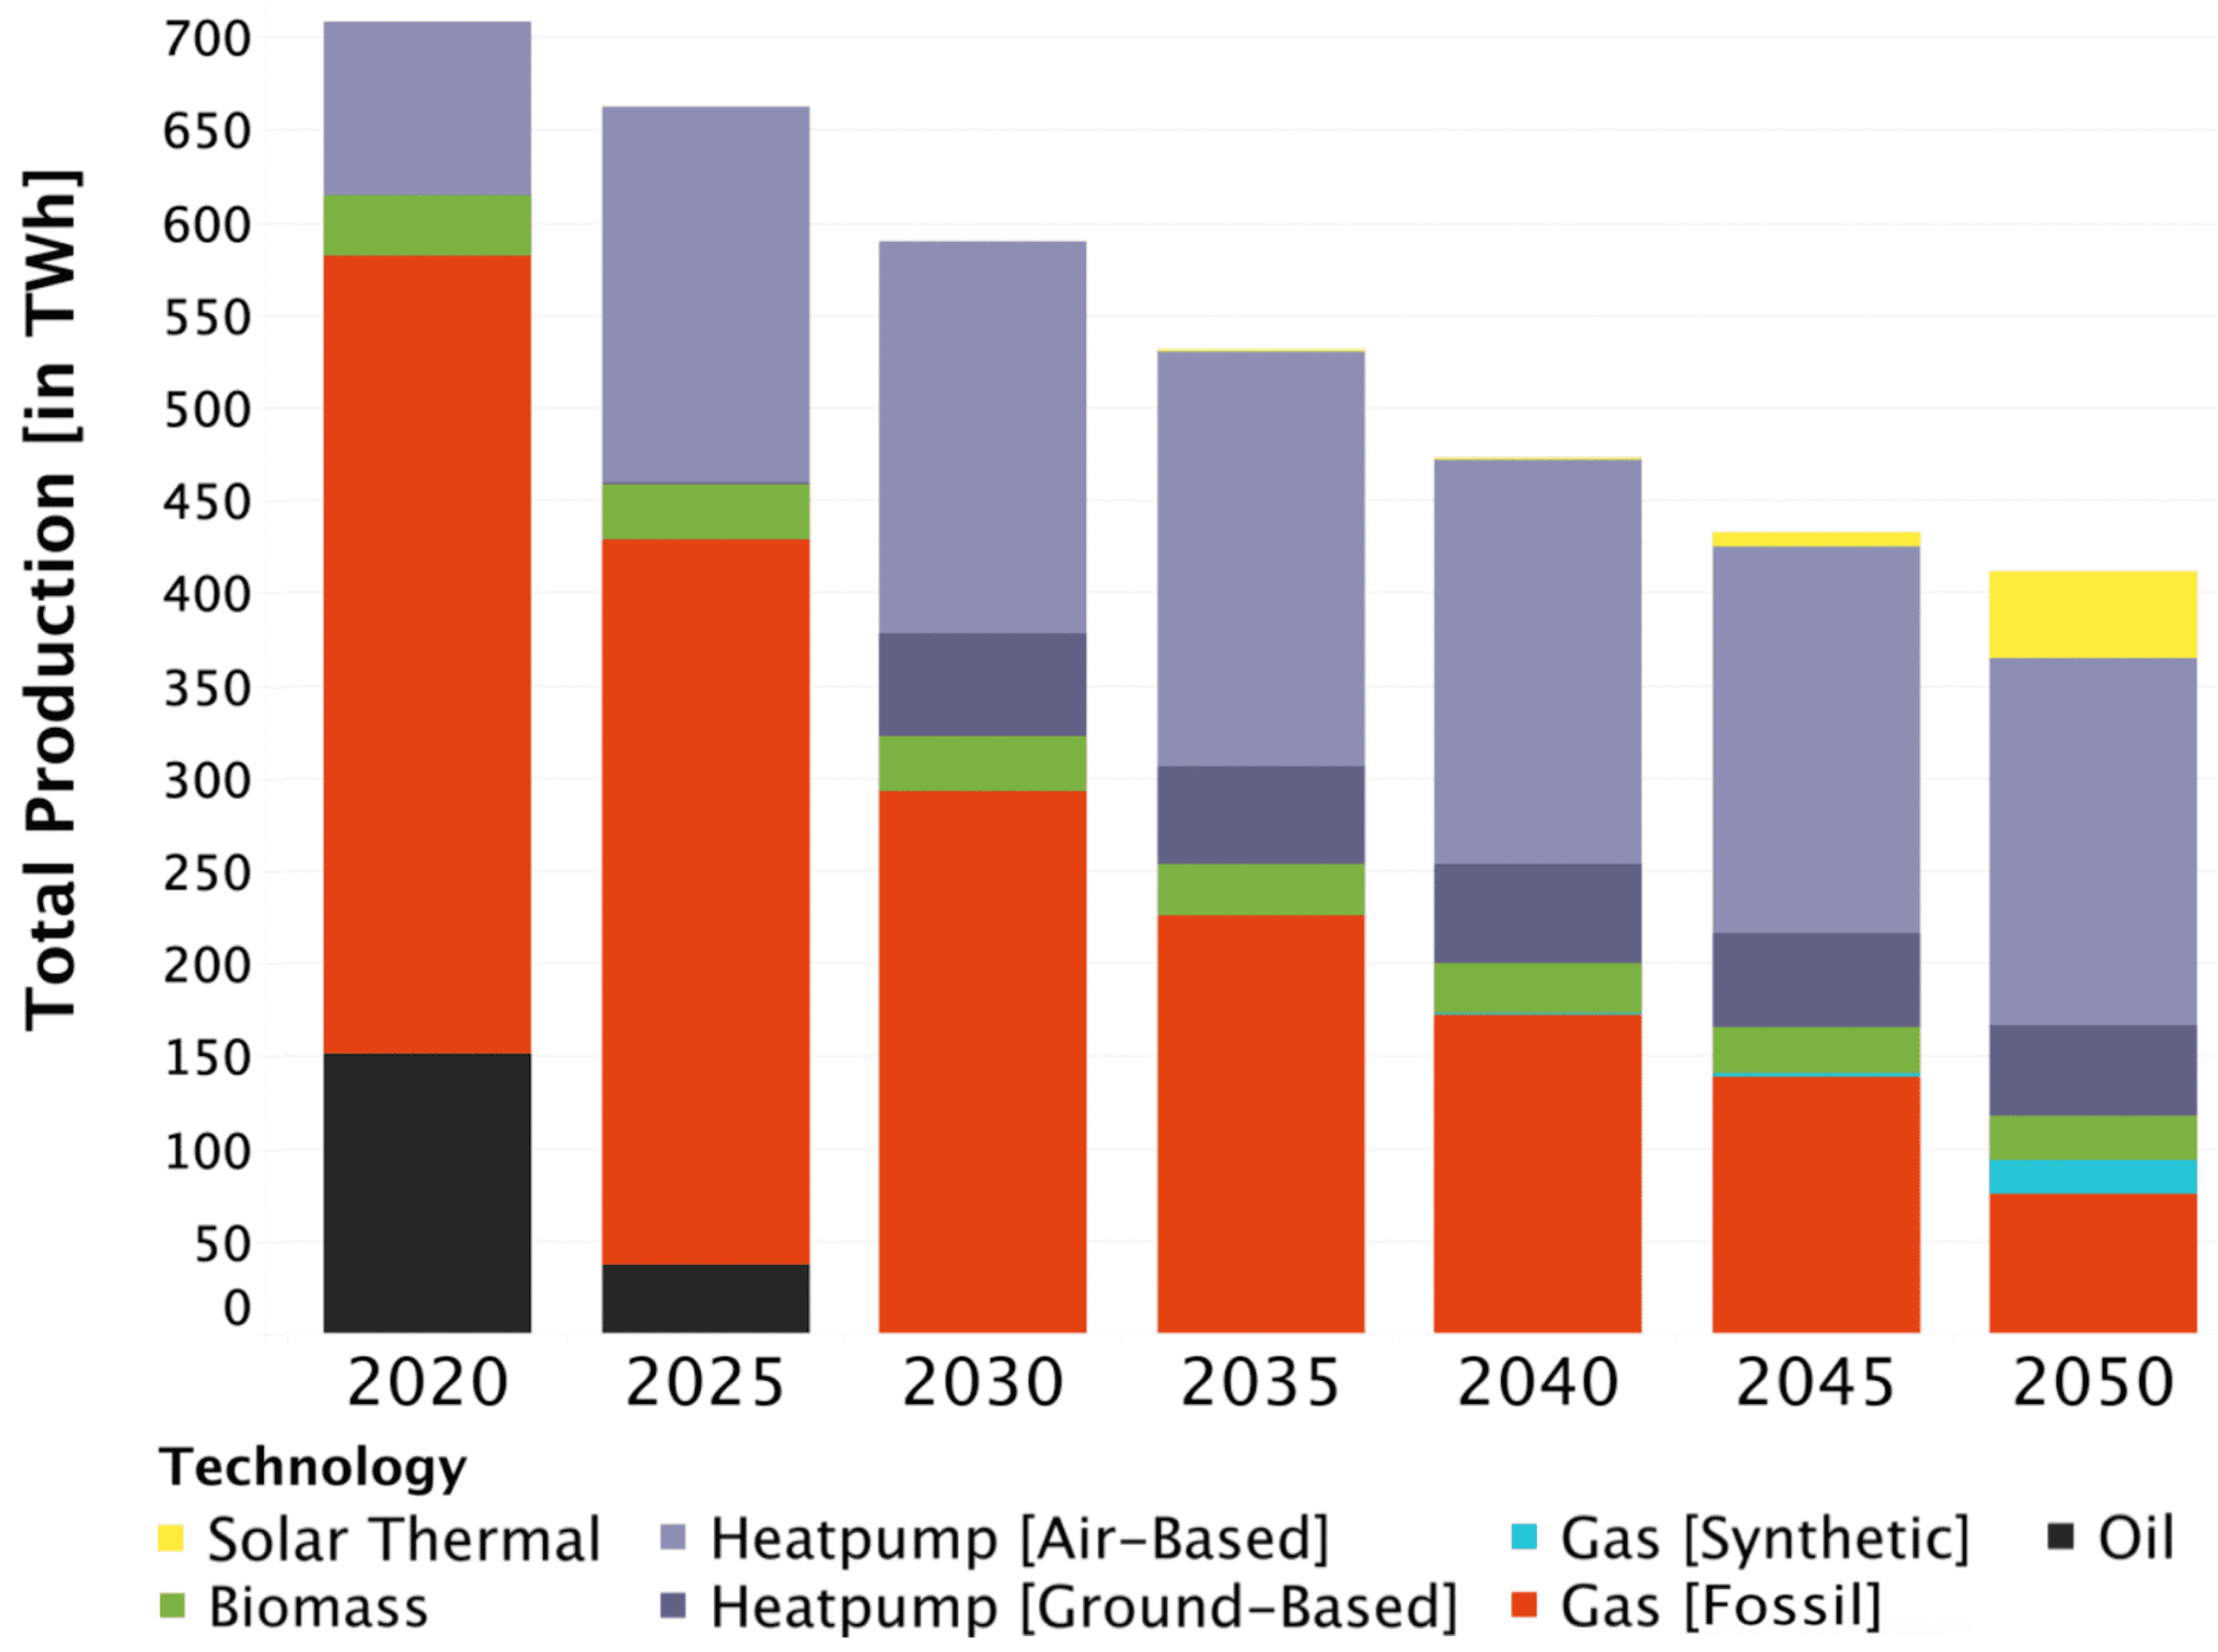
3.4. Heat Production
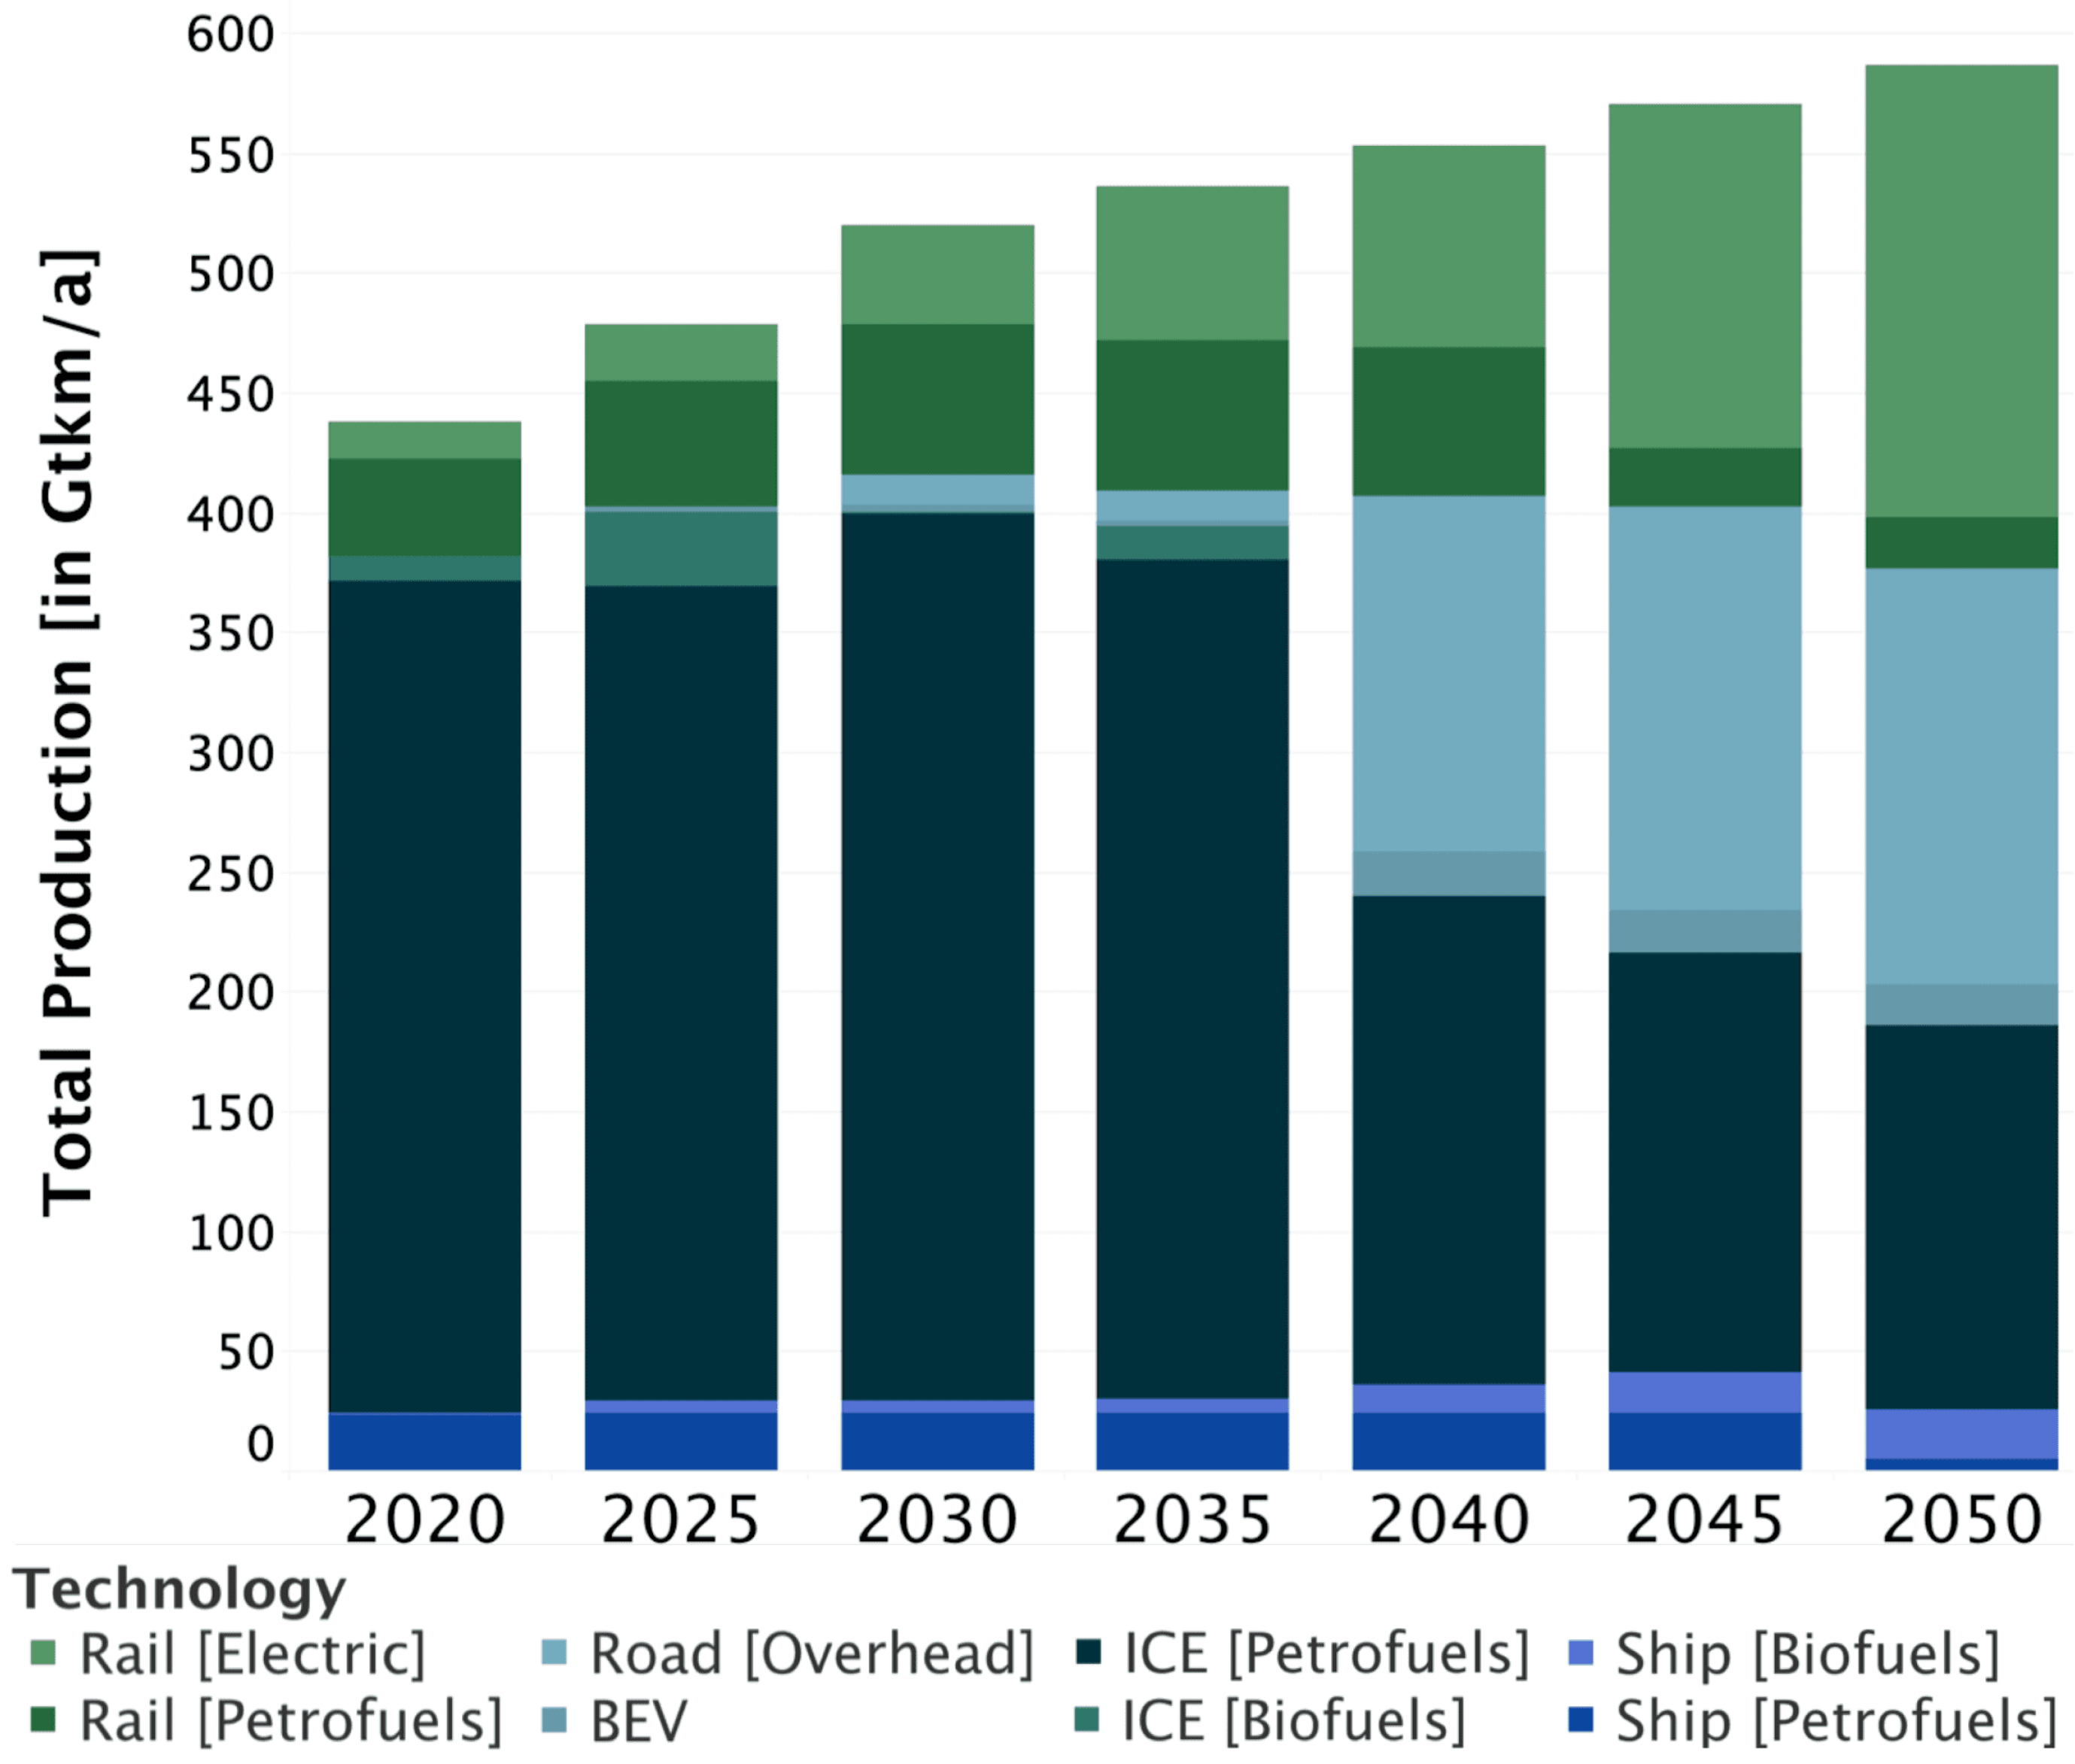
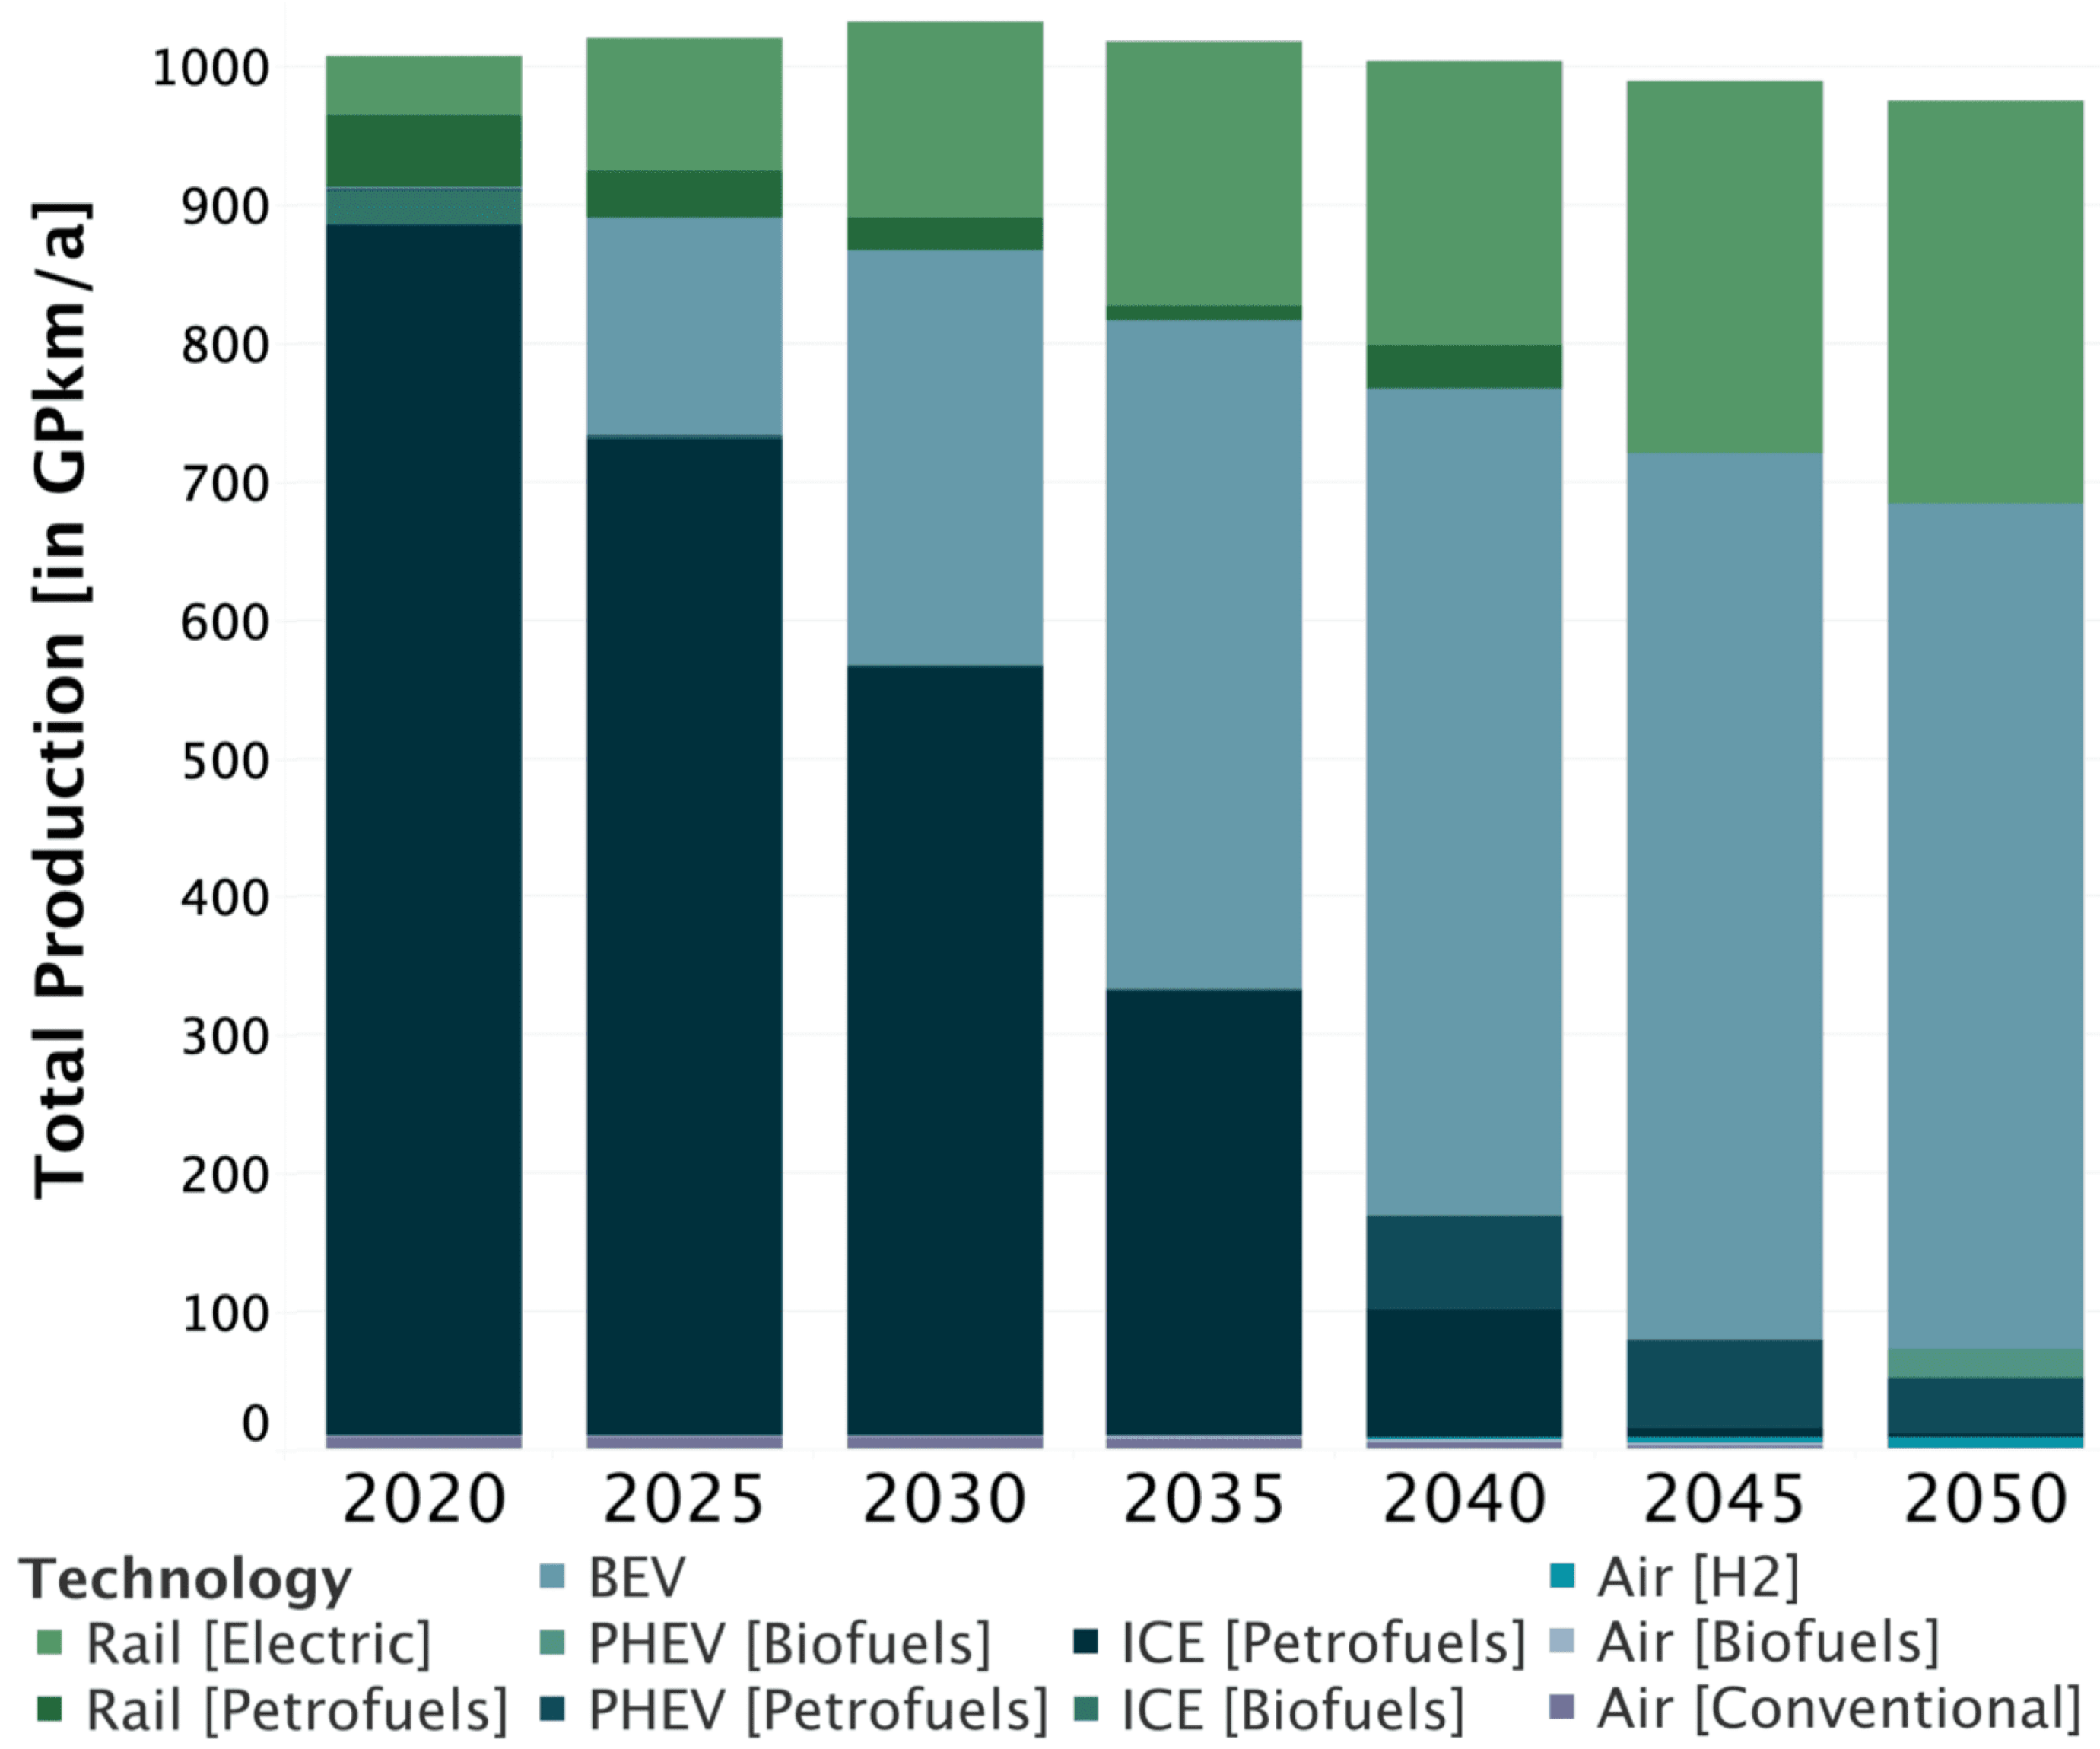
3.5. Transportation
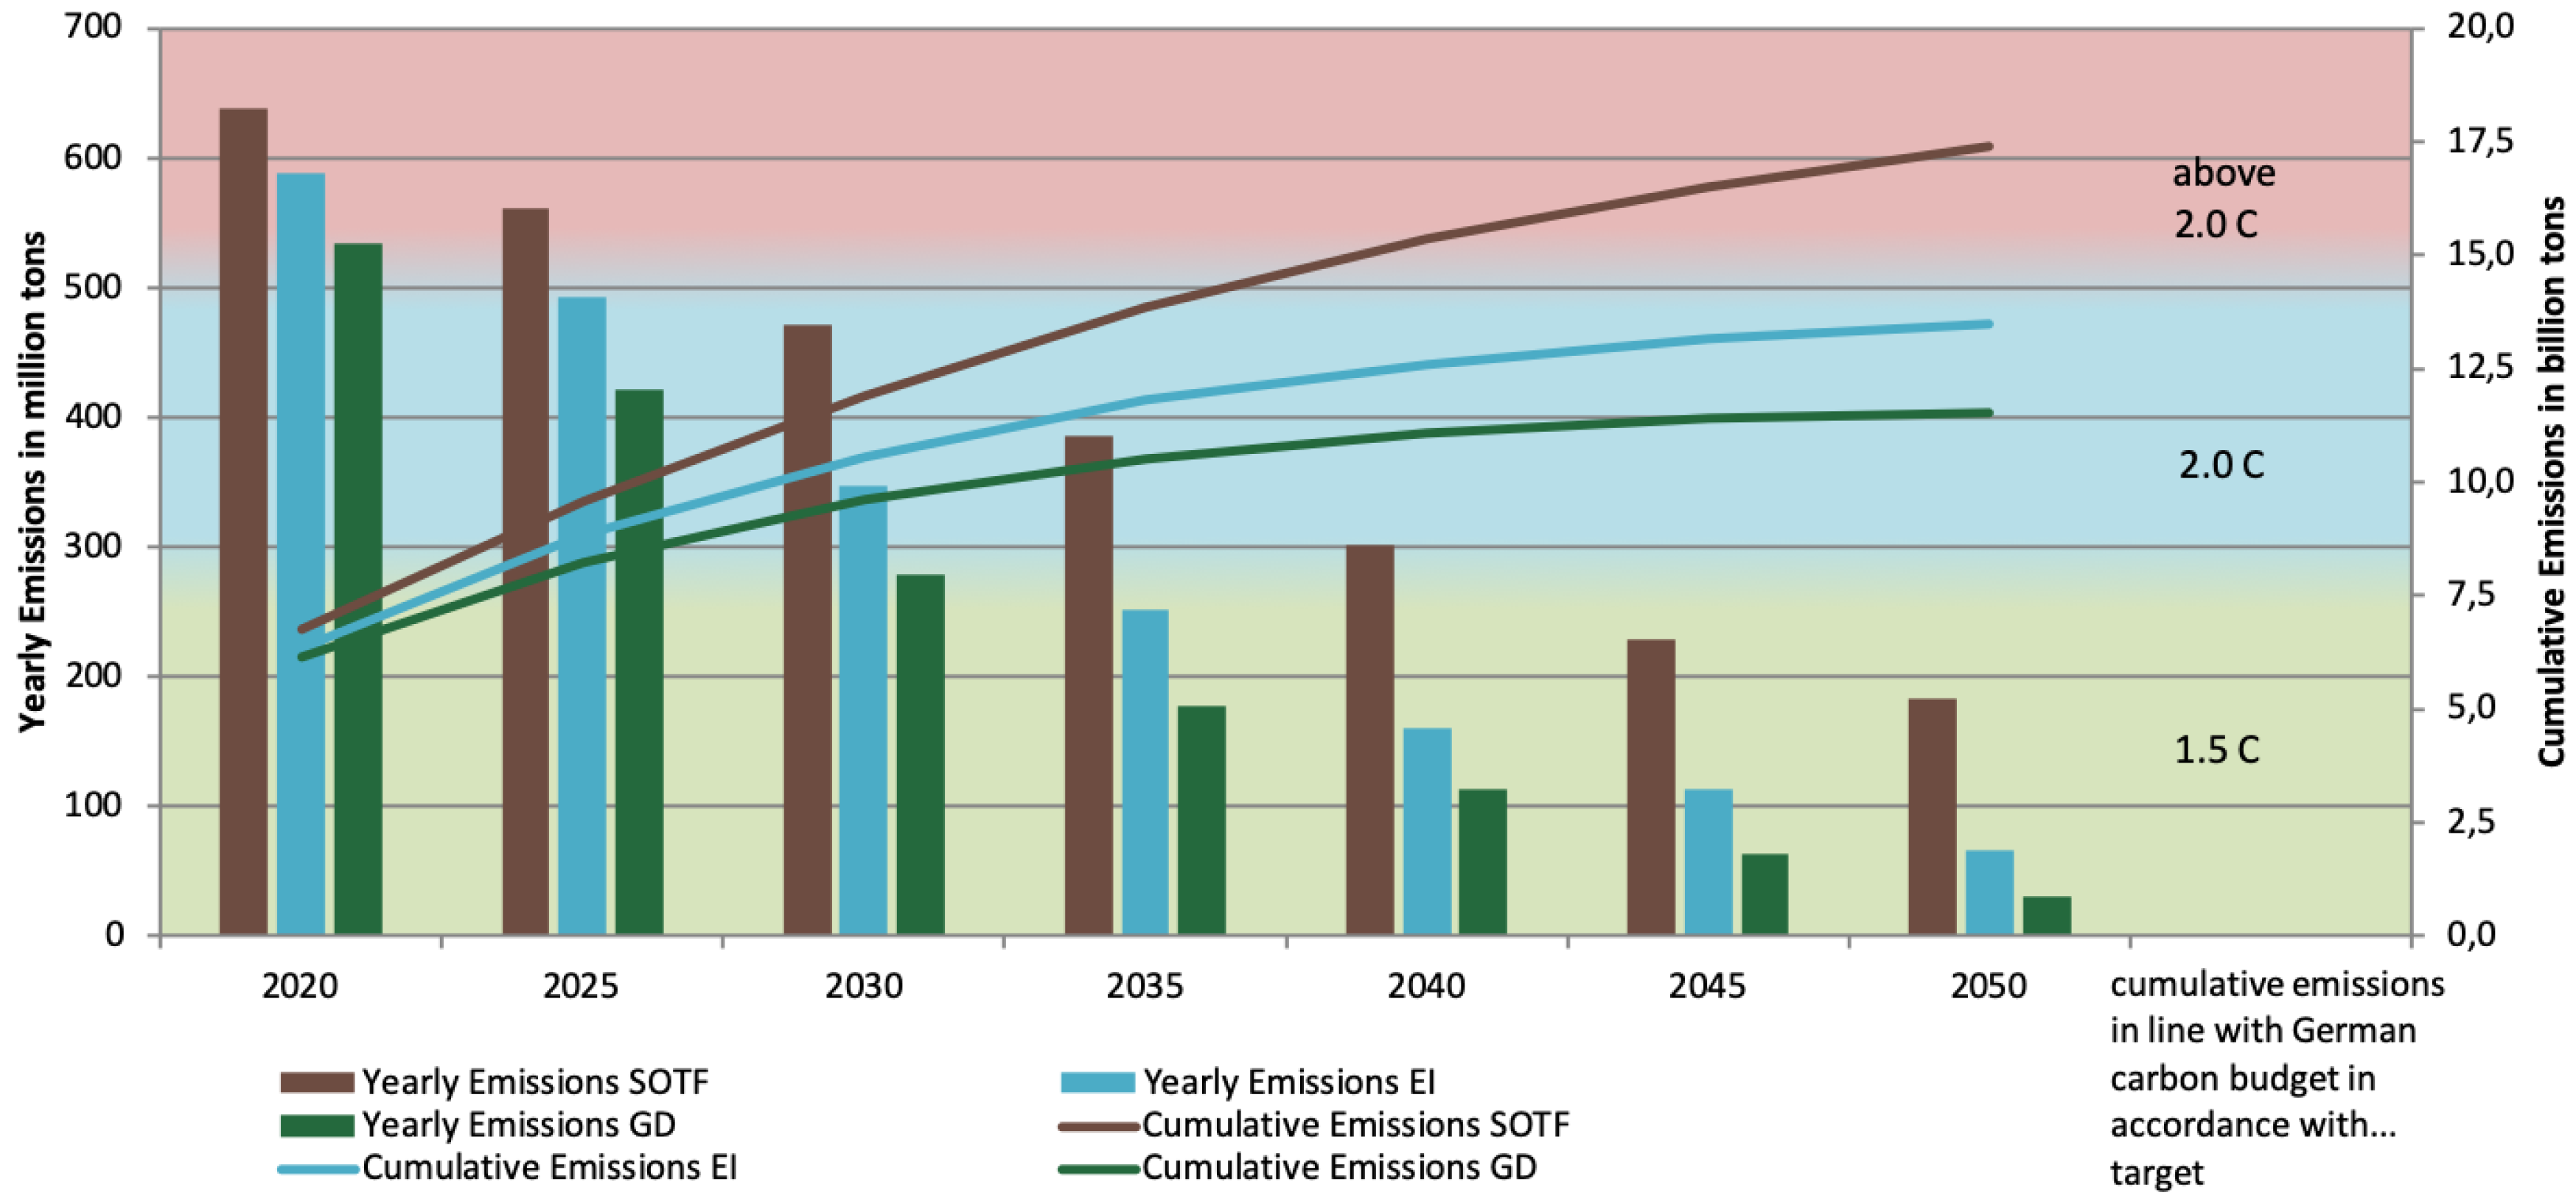
3.6. Emissions
3.7. Model Limitation and Further Research
4. Conclusions
Author Contributions
Funding
Acknowledgments
Conflicts of Interest
Abbreviations
| BDEW | German Association of Energy and Water Industries |
| BDI | Federation of German Industries |
| BEE | German Renewable Energy Federation |
| BEV | Battery-Electric Vehicle |
| BMBF | German Ministry for Education and Research |
| BMU | German Ministry of the Environment, Nature Conservation, and Nuclear Safety |
| BMWi | Germany Ministry for Economic Affairs and Energy |
| CHP | combined heat and power |
| COP | Conference of the Parties |
| CSU | Christian Social Union in Bavaria |
| DSO | Distribution System Operator |
| DUH | Deutsche Umwelthilfe e.V. |
| dynELMOD | Dynamic, Investment and Dispatch, Model, for the Future European Electricity Market |
| EEG | German Renewable Green Energy Act |
| EI | European Island |
| EJ | Exajoule |
| EnWG | Energy Industry Act |
| ETS | Emission Trading System |
| EU | European Union |
| GD | Green Democracy |
| GDP | Gross Domestic Product |
| GENeSYS-MOD | Global Energy System Model |
| GHG | Greenhouse Gas |
| GPkm | billion person-kilometers |
| GW | Gigawatt |
| IGBCE | Labour Union of the Mining, Chemical and Energy Industries |
| IPCC | Intergovernmental Panel on Climate Change |
| km | kilometer |
| LCOE | Levelized Costs of Electricty |
| LULUCF | Land Use, Land Use Change and Forestry |
| NDC | Nationally Determined Contribution |
| NIMBY | “Not in my Backyard” |
| OSeMOSYS | Open Source Energy Modelling System |
| PHEV | Plug-In Hybrid Electric Vehicle |
| PJ | Petajoule |
| ppm | parts per million |
| PV | Photovoltaics |
| SOTF | Survival of the Fittest |
| TSO | Transmission Grid Operator |
| TW | Terawatt |
| TWh | Terawatt Hour |
| UN | United Nations |
| UNFCCC | United Nations Framework Convention on Climate Change |
| V2G | Vehicle to Grid |
| VDA | German Association of the Automotive Industry |
| VDMA | Mechanical Engineering Industry Association |
| WACC | Weighted Average Cost of Capital |
Appendix A. Stakeholder of the German Energiewende
Appendix B. Model Description

Appendix C. Relevant Input Data
Appendix C.1. Technology Costs

| 2015 | 2020 | 2025 | 2030 | 2035 | 2040 | 2045 | 2050 | |
|---|---|---|---|---|---|---|---|---|
| Utility PV | 1000 | 580 | 466 | 390 | 337 | 300 | 270 | 246 |
| Onshore Wind | 1250 | 1150 | 1060 | 1000 | 965 | 940 | 915 | 900 |
| Offshore Wind Deep | ||||||||
| Offshore Wind Shallow | ||||||||
| Offshore Wind Transitional | 3500 | 2637 | 2200 | 1936 | 1800 | 1710 | 1642 | 1592 |
| Geothermal | 5250 | 4970 | 4720 | 4470 | 4245 | 4020 | 3815 | 3610 |
| Coal-Fired Thermal Plant | 1600 | 1600 | 1600 | 1600 | 1600 | 1600 | 1600 | 1600 |
| Gas-Fired Thermal Plant | 650 | 636 | 621 | 607 | 593 | 579 | 564 | 550 |
| Oil-Fired Thermal Plant | 650 | 627 | 604 | 581 | 559 | 536 | 513 | 490 |
| Coal-Fired CHP | 2030 | 2030 | 2030 | 2030 | 2030 | 2030 | 2030 | 2030 |
| Gas-Fired CHP | 977 | 977 | 977 | 977 | 977 | 977 | 977 | 977 |
Appendix C.2. Fuel Costs
| 2015 | 2020 | 2025 | 2030 | 2035 | 2040 | 2045 | 2050 | ||
|---|---|---|---|---|---|---|---|---|---|
| Oil [Import] | EI/GD | 7.12 | 10.18 | 11.02 | 11.86 | 11.37 | 10.88 | 10.39 | 9.91 |
| SOTF | 7.12 | 10.91 | 12.60 | 14.40 | 14.62 | 14.77 | 14.85 | 14.86 | |
| Coal [Import] | EI/GD | 1.52 | 1.54 | 1.53 | 1.52 | 1.44 | 1.36 | 1.28 | 1.20 |
| SOTF | 1.52 | 1.65 | 1.75 | 1.84 | 1.85 | 1.84 | 1.82 | 1.80 | |
| Fossil Gas [Import] | EI/GD | 6.63 | 6.54 | 7.72 | 8.91 | 9.15 | 9.38 | 9.62 | 9.86 |
| SOTF | 6.63 | 7.01 | 8.83 | 10.82 | 11.76 | 12.73 | 13.74 | 14.79 | |
| Lignite [Domestic] | EI/GD | 1.09 | 1.11 | 1.14 | 1.17 | 1.13 | 0.99 | 0.72 | 0.42 |
| SOTF | 1.09 | 1.19 | 1.39 | 1.73 | 2.17 | 2.56 | 2.68 | 2.33 |
Appendix C.3. Renewable Potentials
| Onshore Wind | Offshore Wind | Utility PV | |
|---|---|---|---|
| DE_BB [Brandenburg] | 13 | 0 | 19.2 |
| DE_BE [Berlin] | 0.3 | 0 | 0.6 |
| DE_BW [Baden-Württemberg] | 23 | 0 | 23.1 |
| DE_BY [Bavaria] | 41 | 0 | 45.6 |
| DE_HB [Bremen] | 0.2 | 0 | 0.3 |
| DE_HE [Hesse] | 14 | 0 | 13.6 |
| DE_HH [Hamburg] | 0.3 | 0 | 0.5 |
| DE_MV [Mecklenburg-Western Pomerania] | 11 | 6.6 | 15 |
| DE_NI [Lower Saxony] | 26 | 49.8 | 30.8 |
| DE_NRW [North Rhine-Westphalia] | 20 | 0 | 22 |
| DE_RP [Rhineland-Palatinate] | 12 | 0 | 12.8 |
| DE_SH [Schleswig-Holstein] | 9 | 28.6 | 10.2 |
| DE_SL [Saarland] | 2.4 | 0 | 1.7 |
| DE_SN [Saxony] | 10 | 0 | 11.9 |
| DE_ST [Saxony-Anhalt] | 7.4 | 0 | 13.2 |
| DE_TH [Thuringia] | 7.5 | 0 | 10.5 |
Appendix D. Additional Result Graphs
Appendix D.1. Transport


Appendix D.2. Regional Power Development for the EI and SOTF Scenarios


References
- Rogelj, J.; Shindell, D.; Jiang, K.; Fifita, S.; Forster, P.; Ginzburg, V.; Handa, C.; Kheshgi, H.; Kobayashi, S.; Kriegler, E.; et al. Mitigation pathways compatible with 1.5 C in the context of sustainable development. In Global Warming of 1.5 C. An IPCC Special Report on the Impacts of Global Warming of 1.5 C Above Pre-Industrial Levels and Related Global Greenhouse Gas Emission Pathways, in the Context of Strengthening the Global Response to the Threat of Climate Change, Sustainable Development, and Efforts to Eradicate Poverty; Masson-Delmotte, V., Zhai, P., Pörtner, H.-O., Roberts, D., Skea, J., Shukla, P., Pirani, A., Moufouma-Okia, W., Péan, C., Pidcock, R., et al., Eds.; IPCC: Geneva, Switzerland, 2018; Chapter 2. [Google Scholar]
- IPCC. Climate Change 2014: Mitigation of Climate Change: Working Group III Contribution to the Fifth Assessment Report of the Intergovernmental Panel on Climate Change; Cambridge University Press: New York, NY, USA, 2014. [Google Scholar]
- IPCC. Climate Change 2013: The Physical Science Basis: Working Group I Contribution to the Fifth Assessment Report of the Intergovernmental Panel on Climate Change; Cambridge University Press: New York, NY, USA, 2014. [Google Scholar]
- IPCC. Climate Change 2014: Synthesis Report. Contribution of Working Groups I, II and III to the Fifth Assessment Report of the Intergovernmental Panel on Climate Change; Intergovernmental Panel on Climate Change: Geneva, Switzerland, 2015. [Google Scholar]
- Stern, N. The Economics of Climate Change: The Stern Review; Cambridge University Press: Cambridge, UK; New York, NY, USA, 2007. [Google Scholar]
- UNFCCC. Paris Agreement; Technical Report; United Nations Framework Convention on Climate Change: Paris, France, 2015. [Google Scholar]
- UNFCCC. Adoption of the Paris Agreement; Technical Report; United Nations Framework Convention on Climate Change: Paris, France, 2015. [Google Scholar]
- Von Hirschhausen, C.; Gerbaulet, C.; Kemfert, C.; Lorenz, C.; Oei, P.Y. Energiewende “Made in Germany”: Low Carbon Electricity Sector Reform in the European Context; Springer Nature Switzerland AG: Cham, Switzerland, 2018. [Google Scholar]
- Heard, B.; Brook, B.; Wigley, T.; Bradshaw, C. Burden of proof: A comprehensive review of the feasibility of 100% renewable-electricity systems. Renew. Sustain. Energy Rev. 2017, 76, 1122–1133. [Google Scholar] [CrossRef]
- Brown, T.; Bischof-Niemz, T.; Blok, K.; Breyer, C.; Lund, H.; Mathiesen, B. Response to ‘Burden of proof: A comprehensive review of the feasibility of 100% renewable-electricity systems’. Renew. Sustain. Energy Rev. 2018, 92, 834–847. [Google Scholar] [CrossRef]
- Sinn, H.W. Buffering volatility: A study on the limits of Germany’s energy revolution. Eur. Econ. Rev. 2017, 99, 130–150. [Google Scholar] [CrossRef]
- Schill, W.P.; Zerrahn, A.; Kemfert, C.; von Hirschhausen, C. Die Energiewende wird nicht an Stromspeichern scheitern. DIW Aktuell 2018, 2018, 1–10. [Google Scholar]
- Ansari, D.; Holz, F.; Tosun, H.B. Global futures of energy, climate, and policy: Qualitative and quantitative foresight towards 2055. DIW Berl. Discuss. Paper 2019, 1782, 1–33. [Google Scholar] [CrossRef]
- Löffler, K.; Hainsch, K.; Burandt, T.; Oei, P.Y.; Kemfert, C.; von Hirschhausen, C. Designing a model for the global energy system—GENeSYS-MOD: An application of the open-source energy modeling system (OSeMOSYS). Energies 2017, 10, 1468. [Google Scholar] [CrossRef]
- Burandt, T.; Löffler, K.; Hainsch, K. GENeSYS-MOD v2.0—Enhancing the Global Energy System Model: Model Improvements, Framework Changes, and European Data Set; DIW Data Documentation 94; Deutsches Institut für Wirtschaftsforschung (DIW): Berlin, Germany, 2018. [Google Scholar]
- Montreal Protocol. Montreal Protocol on Substances that Deplete the Ozone Layer; US Government Printing Office: Washington, DC, USA, 1987; Volume 26, pp. 128–136.
- United Nations. Kyoto Protocol to the United Nations Framework Convention on Climate Change; Technical Report; United Nations: New York, NY, USA, 1998. [Google Scholar]
- Ellerman, A.D.; Buchner, B.K. The European Union emissions trading scheme: Origins, allocation, and early results. Rev. Environ. Econ. Policy 2007, 1, 66–87. [Google Scholar] [CrossRef]
- European Commission. Decision 406/2009/EC of the European Parliament and of the Council of 23 April 2009 on the effort of Member States to reduce their greenhouse gas emissions to meet the Community’s greenhouse gas emission reduction commitments up to 2020. Off. J. Eur. Union 2009, 140, 136–148. [Google Scholar]
- European Commission. Regulation (EU) 2018/842 of the European Parliament and of the Council of 30 May 2018 on binding annual greenhouse gas emission reductions by Member States from 2021 to 2030 contributing to climate action to meet commitments under the Paris Agreement and amending Regulation (EU) No 525/2013 (Text with EEA relevance). Off. J. Eur. Union 2018, 61, 26–42. [Google Scholar]
- Deutsch, M.; Buck, M.; Patrick Graichen, P.; Vorholz, F. Die Kosten von unterlassenem Klimaschutz für den Bundeshaushalt; Agora Energiewende; Agora Verkehrswende: Berlin, Germany, 2018. [Google Scholar]
- BMUB. Klimaschutzplan 2050—Klimaschutzpolitische Grundsätze und Ziele der Bundesregierung; Bundesministerium für Umwelt, Naturschutz und nukleare Sicherheit: Berlin, Germany, 2016. [Google Scholar]
- AG Energiebilanzen e.V. Bruttostromerzeugung in Deutschland ab 1990 nach Energieträgern; Deutsches Institut für Wirtschaftsforschung (DIW) and DEBRIV: Berlin/Bergheim, Germany, 2019. [Google Scholar]
- BMWi. Abschlussbericht Kommission “Wachstum, Strukturwandel und Beschäftigung”; Technical Report; Bundesministerium für Wirtschaft und Energie: Berlin, Germany, 2019. [Google Scholar]
- Matthey, D.A.; Bünger, D.B. Methodenkonvention 3.0 zur Ermittlung von Umweltkosten—Kostensätze; Technical Report; Umweltbundesamt: Dessau-Roßlau, Germany, 2018. [Google Scholar]
- Prahl, A.; Umpfenbach, K.; Oei, P.Y.; Brauers, H.; Herpich, P.; von Hirschhausen, C.; Lorenz, C.; Teichmann, I.; Kemfert, C.; Wehnert, T.; et al. Die Beendigung der energetischen Nutzung von Kohle in Deutschland—Ein Überblick über Zusammenhänge, Herausforderungen und Lösungsoptionen; Technical Report; DIW: Berlin, Germany; Wuppertal Institut für Klima, Umwelt, Energie and Ecologic Institut gemeinnützige GmbH: Wuppertal, Germany, 2018. [Google Scholar]
- UBA. National Trend Tables for the German Atmospheric Emission Reporting; Technical Report; Umweltbundesamt: Dessau, Germany, 2018. [Google Scholar]
- Lüers, S.; Wallasch, A.K.; Vogelsang, K. Status des Offshore-Windenergieausbaus in Deutschland; Technical Report; Deutsche WindGuard GmbH: Varel, Germany, 2017. [Google Scholar]
- Henning, H.M.; Palzer, A. 100% Erneuerbare Energien für Strom und Wärme in Deutschland; Technical Report; Fraunhofer-Institut für Solare Energiesysteme ISE: Freiburg im Breisgau, Germany, 2012. [Google Scholar]
- Bofinger, S.; Callies, D.; Scheibe, M.; Saint-Drenan, Y.M.; Rohrig, K. Potenzial der Windenergienutzung an Land; Technical Report; Bundesverband WindEergie e.V.: Berlin, Germany, 2011. [Google Scholar]
- Braun, M.; van Oehsen, A.; Saint-Drenan, Y.M.; Stetz, T. Vorstudie zur Integration großer Anteile Photovoltaik in die elektrische Energieversorgung. In Studie im Auftrag des BSW-Bundesverband Solarwirtschaft eV Ergänzte Fassung vom 29.05.2012; Fraunhofer Institut für Windenergie und Energiesystemtechnik (IWES): Kassel, Germany, 2012. [Google Scholar]
- BMJV. Erneuerbare-Energien-Gesetz-EEG 2017. 2014. Available online: https://www.bmwi.de/Redaktion/DE/Gesetze/Energie/EEG.html (accessed on 2 August 2019).
- Von Hirschhausen, C.; Herold, J.; Oei, P.Y.; Haftendorn, C. CCTS-Technologie ein Fehlschlag—Umdenken in der Energiewende notwendig. DIW Wochenbericht 2012, 79, 3–10. [Google Scholar]
- Hirschhausen, C.V.; Herold, J.; Oei, P.Y. How a “Low Carbon” Innovation Can Fail—Tales from a “Lost Decade” for Carbon Capture, Transport, and Sequestration (CCTS). Econ. Energy Environ. Policy 2012, 1, 115–124. [Google Scholar] [CrossRef]
- Oei, P.Y.; Mendelevitch, R. European scenarios of CO2 infrastructure investment until 2050. Energy J. 2016, 37, 171–194. [Google Scholar] [CrossRef]
- BDEW. Beheizungsstruktur des Wohnungsbestandes in Deutschland 2018; Technical Report; Bundesverband der Energie- und Wasserwirtschaft: Berlin, Germany, 2019. [Google Scholar]
- Prognos; EWI-Köln; GWS. Entwicklung der Energiemärkte—Energiereferenzprognose; Studie im Auftrag des Bundesministeriums für Wirtschaft und Technik; BMWi: Berlin, Germany, 2014. [Google Scholar]
- Arbeitsgruppe Erneuerbare Energien-Statistik. Zeitreihen zur Entwicklung der erneuerbaren Energien in Deutschland; Technical Report; UBA: Dessau, Germany, 2019. [Google Scholar]
- Agentur für Erneuerbare Energien. Erneuerbare Energien für die Industrie: Prozesswärme aus Bioenergie sorgt für Unabhängigkeit und Klimaschutz; Agentur für Erneuerbare Energien (AEE): Berlin, Germany, 2018. [Google Scholar]
- Naegler, T.; Simon, S.; Klein, M.; Gils, H.C. Quantification of the European industrial heat demand by branch and temperature level. Int. J. Energy Res. 2015, 39, 2019–2030. [Google Scholar] [CrossRef]
- Fachagentur Nachwachsende Rochstoffe e.V. (FNR); Landwirtschaft und Verbraucherschutz (BMELV). Nachhaltige Nutzung von Biomassepotenzialen—Projektförderung des Bundesministeriums für Ernährung, Landwirtschaft und Verbraucherschutz; BMELV: Berlin, Germany, 2013. [Google Scholar]
- E-Bridge; IAEW; OFFIS. Moderne Verteilernetze für Deutschland; Abschlussbericht Forschungsprojekt Nr. 44/12; BMWi: Bonn/Aachen/Oldenburg, Germany, 2014. [Google Scholar]
- Agricola, A.C.; Seidl, H.; Mischinger, S.; Rehtanz, C.; Greve, M.; Häger, U.; Hilbrich, D.; Kippelt, S.; Kubis, A.; Liebenau, V.; et al. Dena Studie—Systemdienstleistungen 2030. Voraussetzung für eine sichere und zuverlässige Stromversorgung mit hohem Anteil erneuerbarer Energien; Endbericht, Dena: Berlin, Germany, 2014. [Google Scholar]
- Ecofys; Fraunhofer IWES. SmartMarket-Design in deutschen Verteilnetzen. Studie im Auftrag von Agora Energiewende; Technical Report; Agora Energiewende: Berlin, Germany, 2017. [Google Scholar]
- AG Energiebilanzen e.V. Auswertungstabellen zur Energiebilanz Deutschland 1990–2017; Technical Report; AG Energiebilanzen e.V.: Berlin, Germany, 2018. [Google Scholar]
- REN21. Global Status Report—Renewables 2019; Technical Report; REN21 Secretariat: Paris, France, 2019; ISBN 978-3-9818911-7-1. [Google Scholar]
- Pleßmann, G.; Erdmann, M.; Hlusiak, M.; Breyer, C. Global energy storage demand for a 100% renewable electricity supply. Energy Procedia 2014, 46, 22–31. [Google Scholar] [CrossRef]
- Ram, M.; Bogdanov, D.; Aghahosseini, A.; Gulagi, A.; Oyewo, A.; Child, M.; Caldera, U.; Sadovskaia, K.; Farfan, J.; Barbosa, L.; et al. Global Energy System based on 100% Renewable Energy—Power, Heat, Transport and Desalination Sectors; Technical Report; Lappeenranta University of Technology, Lappeenranta: Berlin, Germany, 2019; ISBN 978-952-335-339-8. [Google Scholar]
- Hainsch, K.; Burandt, T.; Kemfert, C.; Löffler, K.; Oei, P.Y.; von Hirschhausen, C. Emission pathways towards a low-carbon energy system for Europe—A model-based analysis of decarbonization scenarios. DIW Berlin Discussion Paper 2018, 1745, 1–34. [Google Scholar]
- Gerbaulet, C.; von Hirschhausen, C.; Kemfert, C.; Lorenz, C.; Oei, P.Y. European electricity sector decarbonization under different levels of foresight. Renew. Energy 2019, 141, 973–987. [Google Scholar] [CrossRef]
- Child, M.; Kemfert, C.; Bogdanov, D.; Breyer, C. Flexible electricity generation, grid exchange and storage for the transition to a 100% renewable energy system in Europe. Rene. Energy 2019, 139, 80–101. [Google Scholar] [CrossRef]
- Zappa, W.; Junginger, M.; van den Broek, M. Is a 100% renewable European power system feasible by 2050? Appl. Energy 2019, 233–234, 1027–1050. [Google Scholar] [CrossRef]
- Connolly, D.; Lund, H.; Mathiesen, B. Smart Energy Europe: The technical and economic impact of one potential 100% renewable energy scenario for the European Union. Renew. Sustain. Energy Rev. 2016, 60, 1634–1653. [Google Scholar] [CrossRef]
- European Commission. EU Reference Scenario 2016: Energy, Transport and GHG emissions—Trends to 2050; Technical Report; European Commission: Brussels, Belgium, 2016. [Google Scholar]
- Pregger, T.; Nitsch, J.; Naegler, T. Long-term scenarios and strategies for the deployment of renewable energies in Germany. Energy Policy 2013, 59, 350–360. [Google Scholar] [CrossRef]
- Palzer, A.; Henning, H.M. A comprehensive model for the German electricity and heat sector in a future energy system with a dominant contribution from renewable energy technologies—Part II: Results. Renew. Sustain. Energy Rev. 2014, 30, 1019–1034. [Google Scholar] [CrossRef]
- Henning, H.M.; Palzer, A. What will the Energy Transformation Sost? Technical Report; Fraunhofer ISE: Freiburg, Deutschland, 2015. [Google Scholar]
- Samadi, S.; Lechtenböhmer, S.; Prantner, M.; Nebel, A. Vollständig auf erneuerbaren Energien basierende Stromversorgung Deutschlands im Jahr 2050 auf Basis in Europa großtechnisch leicht erschließbarer Potentiale—Analyse und Bewertung anhand von Studien; Technical Report 27/2014; Wuppertal Institut for Climate, Environment and Energy: Dessau, Germany, 2014. [Google Scholar]
- Hansen, K.; Mathiesen, B.V.; Skov, I.R. Full energy system transition towards 100% renewable energy in Germany in 2050. Renew. Sustain. Energy Rev. 2019, 102, 1–13. [Google Scholar] [CrossRef]
- Oei, P.Y.; Brauers, H.; Kemfert, C.; Kittel, M.; Göke, L.; von Hirschhausen, C.; Walk, P. Kohleausstieg in NRW im deutschen und europäischen Kontext—Energiewirtschaft, Klimaziele und wirtschaftliche Entwicklung; Deutsches Institut für Wirtschaftsforschung (DIW), Politikberatung Kompakt: Berlin, Germany, 2018; Volume 129, pp. 1–80. [Google Scholar]
- Cebulla, F.; Haas, J.; Eichman, J.; Nowak, W.; Mancarella, P. How much electrical energy storage do we need? A synthesis for the U.S., Europe, and Germany. J. Clean. Prod. 2018, 181, 449–459. [Google Scholar] [CrossRef]
- Hartmann, N. Rolle und Bedeutung der Stromspeicher bei hohen Anteilen erneuerbarer Energien in Deutschland: Speichersimulation und Betriebsoptimierung; Technical Report; University of Stuttgart: Stuttgart, Germany, 2013. [Google Scholar] [CrossRef]
- Zsiborács, H.; Baranyai, N.H.; Vincze, A.; Zentkó, L.; Birkner, Z.; Máté, K.; Pintér, G. Intermittent renewable energy sources: The role of energy storage in the european power system of 2040. Electronics 2019, 8, 729. [Google Scholar] [CrossRef]
- Figgener, J.; Haberschusz, D.; Kairies, K.P.; Wessels, O.; Tepe, B.; Sauer, D.U. Wissenschaftliches Mess- und Evaluierungsprogramm Solarstromspeicher 2.0—Jahresbericht 2018; Jahresbericht, Institut für Stromrichtertechnik und Elektrische Antriebe RWTH Aachen: Aachen, Germany, 2018. [Google Scholar]
- Müller, C.; Hoffrichter, A.; Wyrwoll, L.; Schmitt, C.; Trageser, M.; Kulms, T.; Beulertz, D.; Metzger, M.; Duckheim, M.; Huber, M.; et al. Modeling framework for planning and operation of multi-modal energy systems in the case of Germany. Appl. Energy 2019, 250, 1132–1146. [Google Scholar] [CrossRef]
- Müller, C.; Falke, T.; Hoffrichter, A.; Wyrwoll, L.; Schmitt, C.; Trageser, M.; Schnettler, A.; Metzger, M.; Huber, M.; Küppers, M.; et al. Integrated planning and evaluation of multi-modal energy Systems for Decarbonization of Germany. Energy Procedia 2019, 158, 3482–3487. [Google Scholar] [CrossRef]
- Hanemann, P.; Behnert, M.; Bruckner, T. Effects of electric vehicle charging strategies on the German power system. Appl. Energy 2017, 203, 608–622. [Google Scholar] [CrossRef]
- Schill, W.P.; Gerbaulet, C. Power system impacts of electric vehicles in Germany: Charging with coal or renewables? Appl. Energy 2015, 156, 185–196. [Google Scholar] [CrossRef]
- Loisel, R.; Pasaoglu, G.; Thiel, C. Large-scale deployment of electric vehicles in Germany by 2030: An analysis of grid-to-vehicle and vehicle-to-grid concepts. Energy Policy 2014, 65, 432–443. [Google Scholar] [CrossRef]
- Bloess, A. Impacts of heat sector transformation on Germany’s power system through increased use of power-to-heat. Appl. Energy 2019, 239, 560–580. [Google Scholar] [CrossRef]
- Howells, M.; Rogner, H.; Strachan, N.; Heaps, C.; Huntington, H.; Kypreos, S.; Hughes, A.; Silveira, S.; DeCarolis, J.; Bazillian, M.; et al. OSeMOSYS: The open source energy modeling system: An introduction to its ethos, structure and development. Energy Policy 2011, 39, 5850–5870. [Google Scholar] [CrossRef]
- European Commission. Technical Note Results of the EUCO3232.5 Scenario on Member States; Technical Report; European Commission: Brussels, Belgium, 2019. [Google Scholar]
- E3Mlab; IIASA. Technical Report on Member State Results of the EUCO Policy Scenarios; Technical Report; European Commission: Brussels, Belgium, 2016. [Google Scholar]
- E3Mlab. Technical Report on Macroeconomic Member State Results of the EUCO Policy Scenarios; Technical Report; European Commisssion: Brussels, Belgium, 2016. [Google Scholar]
- IEA. World Energy Outlook 2016; International Energy Agency: Paris, France, 2016. [Google Scholar]
- SPD; Die Linke; Bündnis90/Die Grünen. Vereinbarung zur Zusammenarbeit in einer Regierungskoalition für die 20. Wahlperiode der Bremischen Bürgerschaft 2019–2023; SPD Land Bremen: Bremen, Germany, 2019. [Google Scholar]
- Welsch, M.; Deane, P.; Howells, M.; O Gallachoir, B.; Rogan, F.; Bazilian, M.; Rogner, H. Incorporating flexibility requirements into long-term energy system models—A case study on high levels of renewable electricity penetration in Ireland. Appl. Energy 2014, 135, 600–615. [Google Scholar] [CrossRef]
- UBA. Submission under the United Nations Framework Convention on Climate Change and the Kyoto Protocol 2019; Technical Report 24; Umweltbundesamt: Dessau, Germany, 2019. [Google Scholar]
- Agentur für Erneuerbare Energien. Bundesländer mit neuer Energie; Technical Report 5; Agentur für Erneuerbare Energien: Berlin, Germany, 2018. [Google Scholar]
- Hildebrandt, A.; Wolf, F. Die Politik der Bundesländer: Zwischen Föderalismusreform und Schuldenbremse, 2nd ed.; Springer VS: Wiesbaden, Germany, 2016. [Google Scholar]
- Wolsink, M. Undesired reinforcement of harmful ‘self-evident truths’ concerning the implementation of wind power. Energy Policy 2012, 48, 83–87. [Google Scholar] [CrossRef]
- Bayerische Staatskanzlei. Bayerische Bauordnung; Bayerisches Staatsministerium für Wirtschaft, Landesentwicklung und Verkehr: Munich, Germany, 2017. [Google Scholar]
- Agentur für Erneuerbare Energien. Politik und Gesetze zur Energiewende in den Bundesländern. 2018. Available online: https://www.foederal-erneuerbar.de/auf-einen-blick-detailseite/items/politik-und-gesetze-zur-energiewende-in-den-bundeslaendern (accessed on 2 August 2019).
- Maubach, K.D. Energiewende: Wege zu Einer Bezahlbaren Energieversorgung, 2nd ed.; Springer VS: Wiesbaden, Germany, 2014. [Google Scholar]
- Gründinger, W. Lobbyismus im Klimaschutz: Die Nationale Ausgestaltung des Europäischen Emmissionshandelssystems; Springer VS: Wiesbaden, Germany, 2012. [Google Scholar]
- BMWi. Die Energiewende: Unsere Erfolgsgeschichte; Bundesministerium für Wirtschaft und Energie: Berlin, Germany, 2017. [Google Scholar]
- BMWi. Zentrale Vorhaben Energiewende für die 18. Legislaturperiode; Bundesministerium für Wirtschaft und Energie: Berlin, Germany, 2018. [Google Scholar]
- BMWi. Sechster Monitoringbericht zur Energiewende; Bundesministerium für Wirtschaft und Energie: Berlin, Germany, 2018. [Google Scholar]
- Haas, T. Die politische Ökonomie der Energiewende; Springer Fachmedien Wiesbaden: Wiesbaden, Germany, 2017. [Google Scholar] [CrossRef]
- Seibt, A. Lobbying für erneuerbare Energien; Springer Fachmedien Wiesbaden: Wiesbaden, Germany, 2015. [Google Scholar] [CrossRef]
- VDMA. Die Energiepolitischen Kernforderungen des VDMA. 2017. Available online: https://www.vdma.org/v2viewer/-/v2article/render/16246640 (accessed on 2 August 2019).
- Töller, A.E.; Böcher, M. Wirtschaftsverbände in der Umweltpolitik. In Handbuch Arbeitgeber- und Wirtschaftsverbände in Deutschland; Springer VS Handbuch; Springer VS: Wiesbaden, Germany, 2017; pp. 531–564. [Google Scholar]
- Eichenauer, E.; Reusswig, F.; Meyer-Ohlendorf, L.; Lass, W. Bürgerinitiativen gegen Windkraftanlagen und der Aufschwung rechtspopulistischer Bewegungen. In Bausteine der Energiewende; Kühne, O., Weber, F., Eds.; Springer Fachmedien Wiesbaden: Wiesbaden, Germany, 2018; pp. 633–651. [Google Scholar]
- Reusswig, F.; Braun, F.; Heger, I.; Ludewig, T.; Eichenauer, E.; Lass, W. Against the wind: Local opposition to the German Energiewende. Util. Policy 2016, 41, 214–227. [Google Scholar] [CrossRef]
- Weber, F.; Kühne, O. Räume unter Strom: Eine diskurstheoretische Analyse zu Aushandlungsprozessen im Zuge des Stromnetzausbaus. Raumforschung und Raumordnung 2016, 74, 323–338. [Google Scholar] [CrossRef]
- Hübner, G. Die Akzeptanz von erneuerbaren Energien. Einstellungen und Wirkungen. In Erneuerbare Energien: Ambivalenzen, Governance, Rechtsfragen; Ekardt, F., Hennig, B., Unnerstall, H., Eds.; Number Bd. 1 in Beiträge zur sozialwissenschaftlichen Nachhaltigkeitsforschung; Metropolis-Verlag: Marburg, Germany, 2012. [Google Scholar]
- Wolsink, M. Planning of renewables schemes: Deliberative and fair decision-making on landscape issues instead of reproachful accusations of non-cooperation. Energy Policy 2007, 35, 2692–2704. [Google Scholar] [CrossRef]
- Wolsink, M. Wind power implementation: The nature of public attitudes: Equity and fairness instead of ‘backyard motives’. Renew. Sustain. Energy Rev. 2007, 11, 1188–1207. [Google Scholar] [CrossRef]


| European Island [EI] | Green Democracy [GD] | Surfival of the Fittest [SOTF] | |
|---|---|---|---|
| linear increase of the CO2 tax from €5 per t in 2015 | to €35 in 2030 | to €130 in 2050 | to €15 in 2035 |
| and to €85 in 2050 | to €50 in 2050 | ||
| limit the CO2 emissions compared to 1990 by | 40% in 2030 | 55% in 2030 | no limit |
| 80% in 2050 | 95% in 2050 | ||
| phase-out in the electricity sector | Lignite in 2035 | Lignite in 2025 | no phase-outs |
| hard coal in 2035 | hard coal in 2030 | ||
| gas/oil in 2045 | gas/oil in 2035 |
© 2019 by the authors. Licensee MDPI, Basel, Switzerland. This article is an open access article distributed under the terms and conditions of the Creative Commons Attribution (CC BY) license (http://creativecommons.org/licenses/by/4.0/).
Share and Cite
Bartholdsen, H.-K.; Eidens, A.; Löffler, K.; Seehaus, F.; Wejda, F.; Burandt, T.; Oei, P.-Y.; Kemfert, C.; Hirschhausen, C.v. Pathways for Germany’s Low-Carbon Energy Transformation Towards 2050. Energies 2019, 12, 2988. https://doi.org/10.3390/en12152988
Bartholdsen H-K, Eidens A, Löffler K, Seehaus F, Wejda F, Burandt T, Oei P-Y, Kemfert C, Hirschhausen Cv. Pathways for Germany’s Low-Carbon Energy Transformation Towards 2050. Energies. 2019; 12(15):2988. https://doi.org/10.3390/en12152988
Chicago/Turabian StyleBartholdsen, Hans-Karl, Anna Eidens, Konstantin Löffler, Frederik Seehaus, Felix Wejda, Thorsten Burandt, Pao-Yu Oei, Claudia Kemfert, and Christian von Hirschhausen. 2019. "Pathways for Germany’s Low-Carbon Energy Transformation Towards 2050" Energies 12, no. 15: 2988. https://doi.org/10.3390/en12152988
APA StyleBartholdsen, H.-K., Eidens, A., Löffler, K., Seehaus, F., Wejda, F., Burandt, T., Oei, P.-Y., Kemfert, C., & Hirschhausen, C. v. (2019). Pathways for Germany’s Low-Carbon Energy Transformation Towards 2050. Energies, 12(15), 2988. https://doi.org/10.3390/en12152988