Article

Cooling and Energy-Saving Performance of Different Green Wall Design: A Simulation Study of a Block

1
School of Architecture and Art, Central South University, Changsha 410083, China
2
College of Sports and Art, Hunan Agricultural University, Changsha 410128, China
*
Authors to whom correspondence should be addressed.
Energies 2019, 12(15), 2912; https://doi.org/10.3390/en12152912
Submission received: 10 June 2019 / Revised: 7 July 2019 / Accepted: 23 July 2019 / Published: 29 July 2019
(This article belongs to the Special Issue Building Renewable Energy and Thermal Energy Storage System 2019)

Abstract

:
To mitigate the urban heat island (UHI) and release the low carbon potential of green walls, we analyzed the cooling and energy-saving performance of different green wall designs. Envi-met was applied as the main simulation tool, and a pedestrian street named Yuhou Street was selected as the study object. Four designs of walls were summarized and simulated, demonstrating the living wall system (LWS). Super soil had superiority in cooling and energy saving. Outdoor air temperature, indoor air temperature, outside wall surface temperature, and inside wall surface temperature were analyzed. Apart from the outdoor air temperature, the other three temperatures were all significantly affected by the design of green walls. Finally, energy savings in building cavities were determined. The indoor energy saving ratio of the LWS based on super soil reached 19.92%, followed by the LWS based on boxes at 15.37%, and green facades wall at 6.29%. The indoor cooling powers on this typical day showed that the cooling power of the LWS based on super soil was 8267.32 W, followed by the LWS based on boxes at 6381.57 W, and green facades wall at 2610.08 W. The results revealed the difference in cooling and energy-saving performance of different green walls in this typical hot summer area.

Graphical Abstract

1. Introduction

With the advancement of urbanization, many natural areas have become steel forests, bringing a series of problems, such as urban pollution and the urban heat island (UHI) [1,2]. The main contributing factors of heat island are the changes in surface albedo and anthropogenic emissions, especially greenhouse gases [3,4,5]. As a consequence of UHI, the energy demand for the cooling of buildings booms [6], and buildings accounted for 32% of total global energy consumption in 2010, with some counties even reaching up to 40% [7,8]. Many measures have been explored and applied to relieve the UHI [9], such as urban greening, ventilation corridors, and thermal insulation material. The area of the building envelope, particularly the facades, is much larger than that of the urban land surface, especially in high-density cities [10,11], which has a large impact on the thermal environment of cities and energy consumption of buildings [12]. Therefore, facade greening is a potential alternative measure for cooling the city and saving building energy consumption [13]. Apart from alleviating the UHI, facade greening also has the advantages of improving visual comfort and purifying the air [14]. The most common places which can accommodate vegetation are the roof, vertical walls, terrace, and indoor space, especially in the high-density cities [15]. Generally, the greenery system on buildings consists of five concepts, including the green roof (GR), the green wall (GW), the green balcony (GB), the sky garden (SG) and indoor sky garden (ISG) [15]. In particular, the wall area of buildings is larger than that of the roof [16], which hints at the importance of GW systems, specifically for tall buildings. Here, we aimed to study the thermal environment and energy-saving benefits of the GW in different cases.
GWs are classified into green facades and living wall systems (LWS) [17,18]. The green facade is a direct greening system, attaching plants directly to the building surface with the climbers, rooting directly in the ground [19]. Living wall system consists of modular panels, containing soil and growing medium [20].
In this study, we introduced a new growing medium named super soil and analyzed the cooling and energy-saving benefits of LWS with super soil as the growing medium. Super soil was developed by Dr. Zhiyong Qi, a member of our research team, and recognized by the State Intellectual Property Office of China. It is a nurturing soil composed of fibers, perlite, and volcanic ash, which endowed it with the characteristics of high water content ability and lightweight composition, making it possible to overcome the difficulty of load-bearing and to realize the full coverage of all the facades. Super soil is only 0.297 g per cubic centimeter, and the water retention rate can reach 76%. In addition, LWS based on super soil has been used in many cities of China, including Shanghai, Wuhan, Changsha, and so on.
To quantify the cooling and energy-saving performance of the LWS with super soil as substrate, we summarized the common scenarios of facades and compared the performance differences. Yuhou Street, an ancient street in Chenzhou, Hunan province, China that was transformed into a city pedestrian street, was selected as a simulation object. By analyzing the historical meteorological data, we selected 23 July 2016 as the typical weather day of Chenzhou in summer. Four wall scenarios named no greening wall, green facades wall, LWS based on planter boxes, and LWS based on super soil were constructed, and the parameters of each scenario were extracted according to the actual situation. With the aid of the digital-analog technology of envi-met version 4.4.1, the outdoor temperature, the indoor temperature, the outside wall temperature, and the inside wall temperature were obtained, and the energy-saving performance of three GWs was calculated, with the scenario of no green wall as the reference.
Although some studies have discussed the energy saving of facade greening, their researches did not place green walls in the neighborhood environment, ignoring the influences caused by surrounding constructions. Furthermore, no research has systematically summarized different greening design patterns to study their thermal environment benefits and energy-saving performance [21]. Additionally, previous studies did not consider the effects of long-wave and short-wave radiation absorbed by green walls, because this technology was not implemented until Envi-met version 4.4.1 was developed at the end of 2018.
After systematically summarizing the types of GWs and introducing the super soil, we extracted the parameters by their actual characteristics. Then we placed them in the block environment to analyze their effects on the thermal environment and energy-saving with envi-met version 4.4.1.

2. Materials and Methods

2.1. Description of the Simulation Tool

Envi-met vision 4.4.1 was the core tool of the research, which developed the function of facade greening simulation at the end of 2018. Envi-met is used to simulate the interaction between the ground, vegetation, building, and atmosphere. The basic theories of Envi-met are hydrodynamics and thermodynamics [22]. Compared with traditional CFD software, it expanded the function of absorption and reflection of long and short wave radiation by plants [23]. Hence, Envi-met is the preferred technology for facade greening simulation [24]. This tool follows the Reynold Averaged Navier–Stokes equation [22].
υ τ + υ i υ υ x i = ρ x + K m ( 2 υ x i 2 ) + f ( v v g ) ,
v τ + υ i v υ x i = ρ y + K m ( 2 v x i 2 ) + f ( u u g ) ,  
w τ + υ i w υ x i = ρ z + K m ( 2 w x i 2 ) + g θ ( z ) θ r e f ( z ) ,  
u x + v y + w z = 0 .  
In the equation, f is the Coriolis parameter, and the value is 104 sce-1. ρ’ is the local pressure perturbation, and θ is the potential temperature at level z. The reference temperature θref should represent average mesoscale conditions and is provided by a one-dimensional model running parallel to the main model. Equation (4) is used to keep the model mass conserving.
Previous studies have shown that the model tool is very accurate for wind flow, urban microclimate pollutant dispersion, turbulence, and radiation fluxes simulation [25,26]. Moreover, the correlation coefficient between the simulated air temperature and the measured of the canyon street with Envi-met was 0.956, surpassing Solweig with the values of 0.866 and Rayman with the values of 0.867 [27]. Furthermore, The R2 value between Envi-met simulated and experimental data indicates a strong correlation [28]. Hence, Envi-met has been widely recognized by researchers as a practical and scientific research tool. The principles of Envi-met can be seen in detail in Bruse’s paper [29]. And the Envi-met tool is available on its official website.

2.2. Description of the Scenarios

According to the actual scale and spatial layout of Yuhou Street of Chenzhou, Hunan, China (See Figure 1), a 100 × 200 m block with the main streets and environmental buildings was modeled with Envi-met version 4.4.1 (See Figure 2).
We summarized the common types of wall, which were no greening wall (scenario 1), green facade wall (scenario 2), LWS based on boxes (scenario 3), LWS based on super soil (scenario 4). The abstract pictures of the four scenarios of walls are shown in Figure 3.
Scenario 1 was set as the reference case, which consisted of the concrete wall, without substrate or plant. The thickness of the wall was 0.3 m, and roughness length value was 0.02 [30]. Scenario 2 was planted with wire-drawing facade greening. We selected Lvy (Hedera helix) as facade greening plants, which was 0.3 m thick, with leaf area index (LAI) of 1.5 m2/m2, and leaf angle distribution (LAD) value of 0.7 [31]. Scenario 3 was constructed by boxes, which had the same plant parameters as Scenario 2. Additionally, Scenario 3 relied on its substrate system which consisted of loam with a thickness of 0.2 m. The values of emissivity, albedo, and water coefficient were 0.05, 0.18, and 0.18, correspondingly.
Scenario 4 was the LWS based on super soil, which is a new technology developed by Dr. Zhiyong Qi, a member of our team. Super soil is an active fiber soil, composed of fibers, perlite, and volcanic ash according to the nutrient need for plant growth. Super soil has the characteristics of easy solidification, strong plasticity, lightweight, and high moisture retention. The heavy weight caused by substrate or plant boxes in traditional greening technology stifles its application in old buildings with poor load-bearing capacity. Lightweight gives super soil the superiority in load-bearing, and high water retention provides it with better cooling and energy-saving performance [32]. In this study, we selected the minimum water holding capacity (1926 g/kg) as the simulation parameter of super soil. The characteristic of lightweight made it possible to overcome the difficulty of load-bearing and realize the full coverage of the facades, which had great benefits in the areas of building thermal comfort and energy saving. The properties of the commonly seen walls and LWS based on super soil are shown in Table 1.

2.3. Date Selection and Parameter Setting

Meteorological data for this study came from the China standard climate monitoring station (No. 59316) located at 25°48′ N, 113°02′ E and 2.3 m above sea level. To make the research conform to the actual situation of Chenzhou, hour date of air temperature, wind speed, wind direction, and relative humidity were collected from the year 2008 to 2017. The monthly characteristics of the data were analyzed in Figure 4, and the typically hot summer month in Chenzhou is July.
According to the climate characteristics of Chenzhou in July in the past ten years, we selected 23 July 2016 as the typical weather day. In addition, hourly data were used to verify the accuracy of the simulation. The settings of envi-met simulation condition were shown in Table 2.

3. Cooling Performance Results

We selected the 24 h from 6 a.m. on 23 July 2016, to 6 a.m. on 24 July 2016, as a periodic research object. Four types of hourly data were collected. The four types of hourly data were the peak value of the outdoor air temperature, indoor air temperature, outside wall temperature, and inside wall temperature. We systematically compared the values of indoor and outdoor air temperatures and the values of the inner and outer wall temperatures in each of the four scenarios. Stem-leaf chart was adopted to show the distribution characteristics of the 24-h data for 16 types of simulated value (see Figure 5).
To compare the cooling and energy-saving laws of different green walls, we compared and analyzed four types of hourly temperature data in different situations one by one.

3.1. Cooling Performance on Air Temperature Outdoors

To compare the cooing performances of the four types of walls, the air temperatures at an altitude of 1.8 m above the ground from 6 a.m. to 5 a.m. on the next day were collected. The chart was used to show the impacts of the different green walls on outdoor air temperature. In the figure, abscissa represented the time, and the vertical axis represented the peak temperature occurred. The cooling performance of the four types of green walls is shown in Figure 6.
Compared to the reference scenario, the three green walls all had a cooling effect on the outdoor space. In addition, the cooling performance of the three green walls experienced a slow decrease to nearly 0.2 °C at 4 p.m. and then increased gradually. The conclusion which can be drawn from Figure 6 is as follows. First, the peak air temperatures of the four walls all occurred at 4 p.m. Second, with the increase of air temperature, the gap of cooling performances between the three green walls narrowed. Third, the green facades wall system had little effect on reducing the outdoor air temperature. Fourth, LWS based on super soil has the best cooling performance.
The maximum outdoor temperature lessened by LWS based on super soil was only 0.25 °C, indicating that green walls had little effect on the cooling of outdoor air. Distribution of outdoor temperature at 8 a.m. affected by different walls is shown in Figure 7.

3.2. Cooling Performance on the Air Temperature inside

To clarify the influence of different green walls on indoor air temperature, the air temperatures inside from 6 a.m. to 6 a.m. the following day of Yuhou Street were collected and analyzed. At 10 p.m., the indoor temperatures of the four green walls reached their peak values. However, different building chambers had different temperatures. The indoor temperature simulated of the four kinds of walls at 10 p.m. is shown in Figure 8.
Then, we collected the peak inside temperatures from 6 a.m. to 6 a.m. on the following day of the four scenarios and charted them in Figure 9. The following features can be seen. The indoor cooling performances of the three green walls witnessed a gradual rise to the top point at 10 p.m., before a very slow decline. LWS based on super soil showed superiority in cooling indoor air by cooling 4.5 °C, followed by LWS based on boxes cooling 3.5 °C and green facades wall cooling 1.5 °C.
Generally, the green wall design has great significance for improving indoor thermal comfort. The gap of cooling performance between LWS based on super soil and green facades wall reached roughly 3 °C, and the gap between LWS based on boxes and green facades wall approached to 3 °C.

3.3. Cooling Performance on the outside Wall Surface Temperature

Another effect of the green wall is the reduction of outside wall temperature by the transpiration and shading effect. We simulated the outside wall surface temperature of different green wall designs, which are affected by solar radiation, air temperature, wall material, wind speed, and other factors [33]. The concrete wall was selected as a typical representative. The four models do not have windows, which will have a certain impact on the simulated results, compared to the actual situation. The influences caused by windows are discussed in the last paragraph. The following research was based on the situation without windows and doors.
The peak outside wall surface temperatures from 6 a.m. to 6 a.m. on the following day of the four scenarios were counted and charted in Figure 10.
The following features are obtained from Figure 10. The outside wall temperatures of the reference scenario underwent a quick rise from around 20.5 °C at 6 a.m. to 61.6 °C at 4 p.m., before a sharp decrease to 37.6 °C at 7 p.m., with the following 10 h seeing a slow drop to 24 °C at 5 a.m. on the following day. However, the cooling performance of green walls on outside wall surface temperature varied greatly. LWS based on super soil reduced the temperature of nearly 2 °C at 4 p.m., but the other two green walls only dropped the temperature less than 0.5 °C in the daytime. In the nighttime, the three green walls all witnessed a rise in diminishing the surface wall temperature from an average of 1.3 °C at 7 p.m. to 2.56 °C at 5 a.m. of the next day.
The peak surface temperatures of the four scenarios at 4 p.m. were shown in Figure 11. Surface temperatures of the four greening walls were all very hot, approaching 60 °C. Except for the LWS based on super soil, the others were almost ineffective in cooling the outside wall.
In summary, the outside wall temperature varied greatly, even reaching up to roughly 60 °C. Comparing with the out wall temperature, the cooling performance of any green walls were negligible.

3.4. Cooling Performance on inside Wall Surface Temperature

We compared the inside wall hourly temperature of different green wall design from 6 a.m. to 6 a.m. on the next day of Yuhou Street. At 10 p.m., the inside wall surface temperature of the four walls all reached their peak values. However, different building chambers had different temperatures. The temperature distributions of the four kinds of walls at 10 p.m. are shown in Figure 12.
The daily variation of the inside wall surface temperatures in four cases are shown in Figure 13. The following conclusions can be drawn from the figure. First, the indoor surface temperature of the reference scenario rose gradually from 20.3 °C at 6 a.m. to the top point of 32.9 °C at 10 p.m., before a slow fall to 30.6 °C at 5 a.m. on the next day. Second, comparing to the reference scenario, LWS based on super soil showed the best cooling performance by cooling by 3.9 °C at 10 p.m., followed by LWS based on boxes with the value of 3.1 °C, and green facades wall with the value of 0.9 °C.
Generally, green wall design has practical significance on the cooling of inside wall surface temperature, since the reduced temperature accounted for a significant proportion. By the design of green walls, proper green walls can additionally reduce the inside wall surface temperature by 1 to 3 °C, which has an obvious influence on indoor temperature comfort [34].
Comparisons were made from four perspectives, which were the cooling performance on outdoor air temperature, indoor air temperature, outside wall surface temperature, and inside wall surface temperature. Apart from the outdoor air temperature, the other three temperatures were all significantly affected by the type of green walls. In addition, the best cooling performances all occurred in the LWS based on super soil (scenario 4) followed by LWS based on boxes (scenario 3), and green facades wall (scenario 2). But, the times the peak temperature occurred, and the cooling ranges are different.

4. Energy Saving Results

4.1. Cavity Volume and Green Wall Area

To calculate the indoor energy savings from different greening wall designs, we calculated the atmospheric energy in the building chamber of Yuhou Street. We calculated the volumes of indoor space, represented by the symbol V. The green wall area of each building was counted out, represented by the symbol S (see Figure 14).
The peak inside air temperatures of the four green walls was at 10 p.m. According to the simulation results in Figure 8, the volumes of building cavities at different temperatures were counted as follow: The scenario of LWS based on super soil had 28,139.28 m3 air of 24.5 °C, 25,386.31 m3 air of 23.5 °C, and 4386.89 m3 air of 22.5 °C. The scenario of no green wall, the referencing scenario, has 53,525.59 m3 air of 30 °C, 2640.49 m3 air of 28.5 °C, and 1746.4 m3 air of 27.5 °C. Similarly, we calculated the air volumes of different temperatures in the other two scenarios.

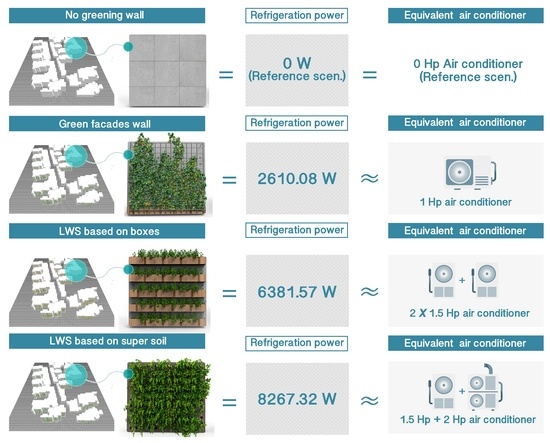
4.2. Energy Calculation and Conversion

We used the following function equation to calculate the total temperature difference of the building cavities under different green walls.
Δ T s ( i ) = g ( i ) f ( i ) ,
where f(i) represents the inside air temperature of room i in scenario 1, and g(i) represents the inside air temperature of room i in scenario s. S is a constant, representing the number of scenarios. Hence, ΔTs(i) stands for the reduced indoor temperature due to greening in cavity i of scenario s.
The indoor energy reduction by scenario s of the whole block was calculated by the following equation [35].
Δ Q ( s ) = 1 n c m ( i ) Δ t s ( i ) = 1 n [ c ρ v ( i ) Δ t s ( i ) ] .
Δ Q ( s ) stands for the indoor energy saving from scenario s. n is a constant with the value of 25, representing the number of cavities in the block. c is the specific heat capacity value, where we adapt 1.005 kJ/(kg·°C). The symbol m(i) means the weight of the air in the room i of scenario s. The symbol of Δ t s ( i ) indicates the indoor temperature reduced in cavity i of scenario s due to green wall. m(i) equals the product of v(i) and ρ, where v(i) represents the volume of cavity i, and ρ is the air density with the value of 1.29 kg/m3.
The values of ΔQ(4), ΔQ(3), and ΔQ(2) were −446,435.1439 kJ, −344,604.9470 kJ, and −140,944.5533 kJ, respectively. In a percentage, the percentages of energy-saving were 19.92% for scenario 4, 15.37% for scenario 3, and 6.29% for scenario 2, compared to the reference scenario. By the first law of thermodynamics, namely the law of conservation of energy [36], the air internal energy was converted into kilowatt-hour units of electricity [37], demonstrating that energies saved by scenario 4, scenario 3, and scenario 2 were 124.01 kw·h, 95.72 kw·h, and 39.15 kw·h in the simulated day. To compare the cooling efficiency of green walls with an air conditioner, the power calculation formula was used [38].
P ( s ) = W ( S ) / T ,
where P(s) is the energy-saving power of Scenario s. W(s) is the indoor energy saving of scenario s, which is Δ Q ( s ) in Equation (4). T is the effective time.
From Figure 9, it is clear that the temperatures of air in each chamber were the same before 7:00, because of no influence from sunshine. Once the sunlight shone, the cooling performances of different green walls varied and the temperature in the chamber kept rising until 10 p.m. Δ Q ( s ) is the total indoor energy reduced from 7 a.m. to 10 p.m. Therefore, the average cooling power of different greening is the quotient of Δ Q ( s ) and the time T, where T equaled 15 h, or 54,000 s.
P(4), P(3), and P(2) were 8267.32 W, 6381.57 W, and 2610.08 W. According to the law of conservation of energy, we converted the air internal energy power reduced by green walls into air-conditioner refrigeration power [39]. Referring to the 2300 W cooling power of a common air conditioner [40], the refrigeration powers of scenario 2, 3, and 4 were equal to 1.1, 2.8, and 3.6 air conditioners, respectively (see Figure 15).
According to the refrigeration power of household air conditioners, the equivalent conversion of refrigeration power for four kinds of walls was carried out. The refrigeration power of the green facades wall system in Yuhou Street was similar to that of an air conditioner with 1 Hp. Similarly, the LWS based on boxes was equal to two 1.5 Hp air conditioners, and the LWS based on super soil corresponded to a combination of one 1.5 Hp and one 2 Hp.

5. Discussion

Nowadays, the urban heat island is becoming more and more serious. Passive cooling technology for buildings is the focus of research for addressing UHI. However, most existing researches on cooling and energy saving of green wall are studied from the perspective of architectural units, without considering the impact of surrounding construction. In addition, they are limited to the calculation of long and short waves absorbed by green walls, and the research findings on this area are still scarce, because the technology was not implemented until the end of 2018.
We systematically summarized the form of green wall designs and introduced our LWS based on super soil. In the block environment, we studied the cooling and energy-saving performance of different green walls with the latest technology. The main conclusions are as below.
The cooling performances of different green walls indicated that the measured temperatures, except for the outdoor air temperature, were all significantly affected by the type of green wall. The LWS based on super soil showed the best performance in cooling followed by the LWS based on boxes and green facades wall. Furthermore, the energy-saving performance of the three green walls varied considerably, with better cooling performance shown by the LWS based on super soil and the LWS based on boxes.
Although our research has added the influencing factors of the surrounding constructions and plant photosynthesis, improving the accuracy of the results, our study still has some limitations, and further investigations are still necessary.
(1)
The simulated scenarios were created according to the actual scale and spatial layout, but there were no doors and windows on the facade wall, which had a certain influence on the simulated temperatures, especially the time when the peak value appeared.
(2)
This paper studied the influence of different green walls on the temperatures of Yuhou Street. The temperatures referred to the highest temperatures at different times in different scenarios. Except for the cooling performance of peak temperature in this study, it is necessary to conduct a study to explore the cooling effect of different greening walls on the average temperature of blocks.
(3)
Our study only explored the cooling and energy-saving performance of green walls on a typical summer day. Heat preservation and energy savings in winter of the three green walls will be studied further.

Author Contributions

Conceptualization, J.L.; Methodology, J.L. and B.Z.; Validation, B.Z.; Software, W.S. and Y.X.; Data analysis and visualization, X.C.; Super soil date, Z.Q.; Writing—original draft preparation, J.L.; Writing—review and editing, J.L.; Supervision, B.Z.; Funding acquisition, B.Z.

Funding

This research was funded by the National Natural Science Foundation of China, grant no. 51478470. And the APC was funded by the above foundation.

Acknowledgments

Authors would like to thank Yanping Yuan (School of Mechanical Engineering, Southwest Jiaotong University, Chengdu, China) for the “1st international Chinese conference on energy and built environment” he lunched inspired us in the research. And we thank “agricultural science and technology company of super soil” for providing the samples of super soil in our study.

Conflicts of Interest

The authors declare no conflict of interest.

References

  1. Grover, A.; Singh, R. Analysis of urban heat island (uhi) in relation to normalized difference vegetation index (ndvi): A comparative study of delhi and mumbai. Environments 2015, 2, 125–138. [Google Scholar] [CrossRef]
  2. Varotsos, C.; Ondov, J.; Efstathiou, M.; Cracknell, A. The local and regional atmospheric oxidants at athens (greece). Environ. Sci. Pollut. Res. 2014, 21, 4430–4440. [Google Scholar] [CrossRef] [PubMed]
  3. Mohajerani, A.; Bakaric, J.; Jeffrey-Bailey, T. The urban heat island effect, its causes, and mitigation, with reference to the thermal properties of asphalt concrete. J. Environ. Manag. 2017, 197, 522–538. [Google Scholar] [CrossRef] [PubMed]
  4. Varotsos, C.; Melnikova, I.; Cracknell, A.; Tzanis, C.; Vasilyev, A. New spectral functions of the near-ground albedo derived from aircraft diffraction spectrometer observations. Atmos. Chem. Phys. 2014, 14, 6953–6965. [Google Scholar] [CrossRef] [Green Version]
  5. Kondratyev, K.Y.; Varotsos, C. Atmospheric greenhouse effect in the context of global climate change. LL Nuovo Cimento C 1995, 18, 123–151. [Google Scholar] [CrossRef]
  6. Roman, K.K.; O’Brien, T.; Alvey, J.B.; Woo, O. Simulating the effects of cool roof and pcm (phase change materials) based roof to mitigate uhi (urban heat island) in prominent us cities. Energy 2016, 96, 103–117. [Google Scholar] [CrossRef]
  7. Kammen, D.M.; Sunter, D.A. City-integrated renewable energy for urban sustainability. Science 2016, 352, 922–928. [Google Scholar] [CrossRef] [Green Version]
  8. Berardi, U. A cross-country comparison of the building energy consumptions and their trends. Res. Conserv. Recycl. 2017, 123, 230–241. [Google Scholar] [CrossRef]
  9. De Groot-Reichwein, M.; Van Lammeren, R.; Goosen, H.; Koekoek, A.; Bregt, A.; Vellinga, P. Urban heat indicator map for climate adaptation planning. Mitig. Adapt. Strateg. Glob. Chang. 2018, 23, 169–185. [Google Scholar] [CrossRef]
  10. Morakinyo, T.E.; Lai, A.; Lau, K.K.-L.; Ng, E. Thermal benefits of vertical greening in a high-density city: Case study of hong kong. Urban For. Urban Green. 2019, 37, 42–55. [Google Scholar] [CrossRef]
  11. Yang, F.; Yuan, F.; Qian, F.; Zhuang, Z.; Yao, J. Summertime thermal and energy performance of a double-skin green facade: A case study in shanghai. Sustain. Cities Soc. 2018, 39, 43–51. [Google Scholar] [CrossRef]
  12. Halawa, E.; Ghaffarianhoseini, A.; Ghaffarianhoseini, A.; Trombley, J.; Hassan, N.; Baig, M.; Yusoff, S.Y.; Azzam Ismail, M. A review on energy conscious designs of building façades in hot and humid climates: Lessons for (and from) Kuala Lumpur and Darwin. Renew. Sustain. Energy Rev. 2018, 82, 2147–2161. [Google Scholar] [CrossRef]
  13. Kolokotsa, D. Smart cooling systems for the urban environment. Using renewable technologies to face the urban climate change. Sol. Energy 2017, 154, 101–111. [Google Scholar] [CrossRef] [Green Version]
  14. Abdul-Wahab, S.; Fadlallah, S.; Al-Rashdi, M. Evaluation of the impact of ground-level concentrations of so2, nox, co, and pm10 emitted from a steel melting plant on muscat, oman. Sustain. Cities Soc. 2018, 38, 675–683. [Google Scholar] [CrossRef]
  15. Raji, B.; Tenpierik, M.J.; van den Dobbelsteen, A. The impact of greening systems on building energy performance: A literature review. Renew. Sustain. Energy Rev. 2015, 45, 610–623. [Google Scholar] [CrossRef] [Green Version]
  16. Takebayashi, H.; Ishii, E.; Moriyama, M.; Sakaki, A.; Nakajima, S.; Ueda, H. Study to examine the potential for solar energy utilization based on the relationship between urban morphology and solar radiation gain on building rooftops and wall surfaces. Sol. Energy 2015, 119, 362–369. [Google Scholar] [CrossRef]
  17. Manso, M.; Castro-Gomes, J. Green wall systems: A review of their characteristics. Renew. Sustain. Energy Rev. 2015, 41, 863–871. [Google Scholar] [CrossRef]
  18. Giridharan, R.; Emmanuel, R. The impact of urban compactness, comfort strategies and energy consumption on tropical urban heat island intensity: A review. Sustain. Cities Soc. 2018, 40, 677–687. [Google Scholar] [CrossRef] [Green Version]
  19. Perini, K.; Ottelé, M.; Haas, E.M.; Raiteri, R. Greening the building envelope, facade greening and living wall systems. Open J. Ecol. 2011, 1, 1–8. [Google Scholar] [CrossRef] [Green Version]
  20. Charoenkit, S.; Yiemwattana, S. Living walls and their contribution to improved thermal comfort and carbon emission reduction: A review. Build. Environ. 2016, 105, 82–94. [Google Scholar] [CrossRef]
  21. Hunter, A.M.; Williams, N.S.G.; Rayner, J.P.; Aye, L.; Hes, D.; Livesley, S.J. Quantifying the thermal performance of green façades: A critical review. Ecol. Eng. 2014, 63, 102–113. [Google Scholar] [CrossRef]
  22. Acero, J.A.; Arrizabalaga, J. Evaluating the performance of envi-met model in diurnal cycles for different meteorological conditions. Theor. Appl. Climatol. 2018, 131, 455–469. [Google Scholar] [CrossRef]
  23. Salata, F.; Golasi, I.; Vollaro, A.d.L.; Vollaro, R.d.L. How high albedo and traditional buildings’ materials and vegetation affect the quality of urban microclimate. A case study. Energy Build. 2015, 99, 32–49. [Google Scholar] [CrossRef]
  24. Huttner, S. Further Development and Application of the 3D Microclimate Simulation Envi-Met; Mainz University: Mainz, Germany, 2012. [Google Scholar]
  25. Yang, X.; Zhao, L.; Bruse, M.; Meng, Q. Evaluation of a microclimate model for predicting the thermal behavior of different ground surfaces. Build. Environ. 2013, 60, 93–104. [Google Scholar] [CrossRef]
  26. Lahme, E.; Bruse, M. Microclimatic effects of a small urban park in densely built-up areas: Measurements and model simulations. In Proceedings of the 5th International Conference on Urban Climate, Lodz, Poland, 1–5 September 2003. [Google Scholar]
  27. Szucs, Ã.; Gál, T.; Andrade, H. Comparison of measured and simulated mean radiant temperature. Case study in Lisbon (Portugal). Finisterra-Revista Portuguesa de Geografia 2014, 53, 95–111. [Google Scholar] [CrossRef]
  28. Lee, H.; Mayer, H.; Chen, L. Contribution of trees and grasslands to the mitigation of human heat stress in a residential district of freiburg, southwest germany. Landsc. Urban Plan. 2016, 148, 37–50. [Google Scholar] [CrossRef]
  29. Bruse, M.; Fleer, H. Simulating surface–plant–air interactions inside urban environments with a three dimensional numerical model. Environ. Model. Softw. 1998, 13, 373–384. [Google Scholar] [CrossRef]
  30. Nasir, D.S.N.M.; Hughes, B.R.; Calautit, J.K. A cfd analysis of several design parameters of a road pavement solar collector (rpsc) for urban application. Appl. Energy 2017, 186, 436–449. [Google Scholar] [CrossRef]
  31. Perini, K.; Ottelé, M.; Giulini, S.; Magliocco, A.; Roccotiello, E. Quantification of fine dust deposition on different plant species in a vertical greening system. Ecol. Eng. 2017, 100, 268–276. [Google Scholar] [CrossRef]
  32. De Carvalho Gomes, S.; Zhou, J.L.; Li, W.; Long, G. Progress in manufacture and properties of construction materials incorporating water treatment sludge: A. review. Res. Conserv. Recycl. 2019, 145, 148–159. [Google Scholar] [CrossRef]
  33. Akeiber, H.; Nejat, P.; Majid, M.Z.A.; Wahid, M.A.; Jomehzadeh, F.; Famileh, I.Z.; Calautit, J.K.; Hughes, B.R.; Zaki, S.A. A review on phase change material (pcm) for sustainable passive cooling in building envelopes. Renew. Sustain. Energy Rev. 2016, 60, 1470–1497. [Google Scholar] [CrossRef]
  34. Enescu, D. A review of thermal comfort models and indicators for indoor environments. Renew. Sustain. Energy Rev. 2017, 79, 1353–1379. [Google Scholar] [CrossRef]
  35. Gao, Y.; Liu, J.; Yuan, X.; Zhang, K.; Yang, Y.; Wang, Y. Air-conditioning system with underfloor air distribution integrated solar chimney in data center. Procedia Eng. 2017, 205, 3420–3427. [Google Scholar] [CrossRef]
  36. Ortigosa, R.; Gil, A.J. A new framework for large strain electromechanics based on convex multi-variable strain energies: Conservation laws, hyperbolicity and extension to electro-magneto-mechanics. Comput. Method Appl. Mech. Eng. 2016, 309, 202–242. [Google Scholar] [CrossRef] [Green Version]
  37. Dutton, S.M.; Fisk, W.J. Energy and indoor air quality implications of alternative minimum ventilation rates in california offices. Build. Environ. 2014, 82, 121–127. [Google Scholar] [CrossRef]
  38. Fossati, J.P.; Galarza, A.; Martín-Villate, A.; Fontan, L. A method for optimal sizing energy storage systems for microgrids. Renew. Energy 2015, 77, 539–549. [Google Scholar] [CrossRef]
  39. Ahmad, M.W.; Mourshed, M.; Mundow, D.; Sisinni, M.; Rezgui, Y. Building energy metering and environmental monitoring-a state-of-the-art review and directions for future research. Energy Build. 2016, 120, 85–102. [Google Scholar] [CrossRef]
  40. Hajidavalloo, E.; Eghtedari, H. Performance improvement of air-cooled refrigeration system by using evaporatively cooled air condenser. Int. J. Refrig. 2010, 33, 982–988. [Google Scholar] [CrossRef]
Figure 1. Envi-met model of Yuhou Street.
Energies 12 02912 g001
Figure 2. Layout of Yuhou Street.
Energies 12 02912 g002
Figure 3. Abstract picture of four green walls.
Energies 12 02912 g003
Figure 4. Meteorological statistics.
Energies 12 02912 g004
Figure 5. Distribution characteristics of the 24-h data.
Energies 12 02912 g005
Figure 6. Cooling performance on air temperature of the four scenarios.
Energies 12 02912 g006
Figure 7. Outdoor air temperature of the four scenarios at 8 a.m.
Energies 12 02912 g007
Figure 8. Air temperature inside of the four scenarios at 10 p.m.
Energies 12 02912 g008
Figure 9. Air temperature inside of four scenarios in the day.
Energies 12 02912 g009
Figure 10. The outside wall surface temperature of the four scenarios in the day.
Energies 12 02912 g010
Figure 11. The outside wall surface temperature of the four scenarios at 4 p.m.
Energies 12 02912 g011
Figure 12. Inside wall surface temperature of the four scenarios at 10 p.m.
Energies 12 02912 g012
Figure 13. Inside wall surface temperature of the four scenarios in a day.
Energies 12 02912 g013
Figure 14. Building cavity volume and green wall area.
Energies 12 02912 g014
Figure 15. Refrigeration power of scenario 2 to 4.
Energies 12 02912 g015
Table 1. Parameters of four facade green walls.
ComponentsParameterScen.1Scen.2Scen.3Scen.4
WallSubstrateConcreteConcreteConcreteConcrete
Thickness (m)0.30.30.30.3
Roughness Length0.020.020.020.02
PlantSpecies-LvyLvyLvy
Thickness-0.30.30.3
LAI-1.51.51.5
LAD-0.70.70.7
SubstrateSpecies--LoamSuper soil
Thickness--0.20.2
Emissivity--0.050.03
Albedo--0.180.15
Water coefficient of substrate for plant--0.180.7
Air Gap between substrate and wall (m)--00
Table 2. Configuration data applied in the Envi-met simulation models.
Positiondata
Longitude (°) 113.02
Latitude (°)25.48
Start and Duration of the Modeldata
Date of simulation23 July 2016
Start time3:00
Total simulation time (h)30
Initial Meteorological Conditionsdata
Wind speed measured at 10 m height (m/s)3
Wind direction (deg)158°
Roughness length at measurement site0.01
Min relative humidity at 2 m height (%)50
Max relative humidity at 2 m height (%)70
Min air temperature (Night)22
Min air temperature (Day)34
Solar Radiation and Cloudsdata
Adjustment factor for solar radiation0.85
Cover of low clouds (octas)3
Cover of medium clouds (octas)4
Cover of high clouds7
Soil Datadata
Initial temperature in all layers: 0–0.2 m; 0.2–0.5 m; >0.5 m (k)293
Relative humidity upper layer (0–20 cm)70
Relative humidity middle layer (20–50 cm)75
Relative humidity deep layer (below 50 cm)75

