Abstract
Exhaust gases from internal combustion engines contain fine carbon particles. If a biofuel is used as the engine fuel for low-carbon emission, the exhaust gas still contains numerous carbon particles. For example, the ceramic filters currently used in automobiles with diesel engines trap these carbon particles, which are then burned during the filter regeneration process, thus releasing additional CO2. Electrostatic precipitators are generally suitable to achieve low particle concentrations and large treatment quantities. However, low-resistivity particles, such as carbon particles, cause re-entrainment phenomena in electrostatic precipitators. In this study, we develop an electrostatic precipitator to collect fine carbon particles. Woodceramics were used for the grounded electrode in the precipitator to collect carbon particles on the carbon electrode. Woodceramics are eco-friendly materials, made from sawdust. The electrical resistivity and surface roughness of the woodceramics are varied by the firing temperature in the production process. Woodceramics electrodes feature higher resistivity and roughness as compared to stainless-steel electrodes. We evaluated the influence of woodceramics electrodes on the electric field formed by electrostatic precipitators and calculated the corresponding charge distribution. Furthermore, the particle-collection efficiency of the developed system was evaluated using an experimental apparatus.
1. Introduction
In the interest of realizing a low carbon emission society, internal combustion engines powered by biofuels have been developed; however, the combustion of biofuels generates carbon particles similar to those generated from conventional fuels. Filters made from porous cordierite, silicon carbide, steel mesh are often used to collect carbon particles suspended in the exhaust gases of boilers and internal combustion engines [1]. The ceramic filters used in diesel engines called diesel particulate filters (DPFs) are regenerated by burning the collected carbon particles with the help of the diesel engine control, thus generating CO and CO2. However, if the collected particles are gathered but not burned, the carbon density is higher than in the gas phase and the CO2 emission can be efficiently reduced.
In an electrostatic precipitator, the particles are charged and collected on an electrode by the Coulomb force. Electrostatic precipitators offer advantages of limited pressure loss and highly effective particle collection. When the target gases have low particle concentration and high flow rates, electrostatic precipitators are suitable for particle collection [2]. Electrostatic precipitators have wide-ranging applications in, for example, thermal power plants, cement factories, and home air cleaners. The performance of an electrostatic precipitator is strongly influenced by the physical properties of the particles. The particle resistivity also affects the collection performance as particles with high resistivity remain charged for a long time. As the collected particles are charged to an inverse polarity relative to the polarity between the surface and the contacted grounded electrode, high particle resistivity results in a breakdown in the electric field across the layer of collected particles as the generated ions and charges arising from the charged particles are diminished. However, when the particle resistivity is low, charged particles are collected on the grounded electrode, and the electric charge is released; thus the collected particles are charged to the opposite polarity. The collected particles are agglomerated on the electrode surface move into the gas flow [3,4].
In general, particles in diesel exhaust feature low resistivity. In previous studies, electrostatic precipitators were attached to the diesel engines; the influence of re-entrainment phenomena was avoided by improving electrode structure and by using electrohydrodynamics [5,6], however, re-entrainment was not prevented. In another study, water or a surfactant solution was sprayed into the gas stream upstream of the electrostatic precipitator because of the addition of the liquid bridge force by the Coulomb force; this bridge force prevented the agglomerated particles on the collection electrode from moving into the gas flow. Because of the effects of the liquid bridge force with the surfactant, the agglomerated particles formed a lump-like shape rather than a pearl-chain-like structure [7]. Additionally, in another study, the polarity of the high voltage applied to the electrode were changed after a constant time interval. As a result, the collecting electrode area increased and the agglomeration particles on the electrode did not grow because of the change in the electric field direction [8]. As the collected particles remain charged, researchers have investigated the use of insulating sheets on the collector electrode [9]. In this method, the collection efficiency decreased with increasing operation time because of charging the surface of the insulating sheets.
In this study, carbon particles were collected on carbon electrodes made of woodceramics. Stainless-steel or aluminum are generally used as the electrode materials in the electrostatic precipitator. The woodceramics whose electric resistance and surface roughness were high compared with stainless-steel were used as the electrode materials. This woodceramics was formed using sawdust charcoal and phenol resin powder under specific pressure and temperature conditions; the formed pieces were then fired under a vacuum [10,11]. Woodceramics are eco-friendly materials. The electrical resistivity and pore distribution were modified by varying the firing temperature. At a firing temperature of approximately 600 °C, the wood fiber remained and the resistivity was high. When the firing temperature was above 900 °C, the carbon content was high, and the resistivity was low. The woodceramics electrodes are porous media with large surface areas on which particles may be collected. Also, woodceramics electrodes offer higher electrical resistance than stainless-steel electrodes. The electric potential near the surface of the grounded electrode might be high, thus decreasing the Coulomb force. In the present study, the electric field and charge distribution around the woodceramics electrodes are calculated and compared with those around the stainless-steel electrodes [12,13]. Furthermore, the particle collection efficiency of the proposed electrode is evaluated experimentally.
2. Calculation of the Corona Discharge Model
2.1. Calculation Model
The space charge and electrical field distributions were calculated by the finite-element method (FEM) using COMSOL Multiphysics FEM software [14,15]. The calculation model is shown in Figure 1. The air gap between the high voltage wire electrode and the grounded electrode was 9 mm the voltage supplied to the wire electrode was +8 kV, and the grounded electrode was assumed to be 0.1 mm thick in the case of stainless steel and 10 mm thick in the case of woodceramics. The electrical potential at the bottom of each electrode was 0 V. The overall mesh size was 0.4 mm or less, and the mesh above the grounded electrode was further divided of 0.08 mm in width or less. In this model, it was assumed that the woodceramics electrode was a solid material. The stainless-steel material was not defined in this model but, as a substitute a boundary condition between d and c in Figure 1 was set as 0 V. In the woodceramics, the gas-flow velocity was set to zero, other parameters of the woodceramics are shown in Table 1 [16,17,18,19]. The diffusion constant of the woodceramics was calculated using the Einstein’s equation for Brownian motion as follows:
where D is the diffusion constant, µ is the mobility, k is the Boltzmann constant (1.380662 × 10⁻²³ J/K), e is the elementary charge (1.602 × 10⁻¹⁹ C), and T is the temperature (278 K).
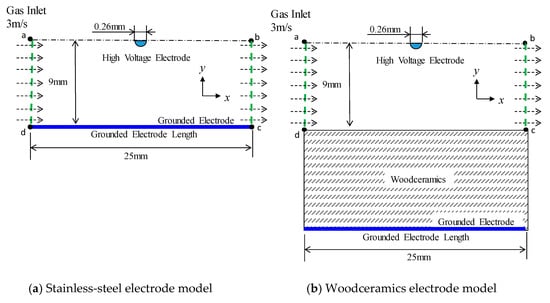
Figure 1.
Calculation models for (a) the grounded electrode with a stainless-steel electrode and (b) the grounded electrode with a woodceramics electrode (which is defined as a solid substance of 10 mm thickness).

Table 1.
Calculation parameters in the air and woodceramics domains.
The space charge was analyzed by the FEM with reference to [14,15]. The spatial electric field was calculated by the following Poisson equation:
where ε0 is the dielectric constant, V is the electric potential, and εr is the relative permittivity of air (1.0). The space charge density, r, is expressed by the following equation:
where Np is the number density of positive ions (in Num/m3) and e is the elementary charge (in C). The applied voltage and number density of charges were multiplied by tanh (105 t) (where t is the time in seconds) to obtain 90% of the applied voltage at 15 μs and 99.5% of the number density at 30 μs. The charge density Np is given around the wire. However, the calculations revealed that there was a gap between high density and zero density in the unmodified model. Hence, given the central position of the wire was x = 0, Np was multiplied by the following parameter:
where x is the position in the horizontal direction, and l is half of the wire radius. It should be noted that this calculation method does not result in attenuation compared with the real charge density. The number density of positive ions, Np, was calculated as follows:
where Id is the corona discharge current, Vap is the applied voltage, Lw is the length of each wire electrode (88 mm × 2), and μp is the mobility of the positive ions (2.34 × 10⁻⁴ m2/V·s).
The transport equation for positive ions, including the ion wind and the gas flow, is given in Equation (6).
where Dp is the diffusion constant of the positive ions in the air (2.89 × 10⁻⁶ m2/s), Ug is the gas flow (in m/s), and E is the electric field strength (in V/m):
Note that this equation does not account for thermal diffusion.
The Navier–Stokes equation is used to model the gas flow and ion wind as follows:
where P is the pressure (in Pa), rg is the air density (1.205 kg/m3), μg is the dynamic coefficient of air viscosity (1.822 × 10⁻⁵ Pa·s), and F is the external Coulomb force (in N), which is the product of the space charge density, ρ and the electric field E.
2.2. Numerical Results
The potential distributions are shown in Figure 2. The contour lines represent the equipotential line from 500 to 4000 V. With the woodceramics electrode, the potential is high near the grounded electrode. In addition, the ion distributions over 2.0 × 10¹⁴ Num/m3 are shown in Figure 3. The two graphs are similar in shape demonstrating that the ion distribution area in the corona discharge has not changed. Due to the influence of the electrode material, the electric field and ion number distribution were evaluated directly below the wire electrode. The electric fields between the wire and the grounded electrode are shown in Figure 4a. The electric field at the surface of the woodceramics electrode was approximately 10% less than that at the surface of the stainless-steel electrode. The ion distribution between the wire and the grounded electrode is shown in Figure 4b. This curve was smoothed with a moving average algorithm over an averaging distance of 0.48 mm for approximately 20 sampling points. With the stainless-steel electrode, the ion density slightly fluctuated. The ion density increased close to the electrodes but remained comparable for the two types of electrodes.
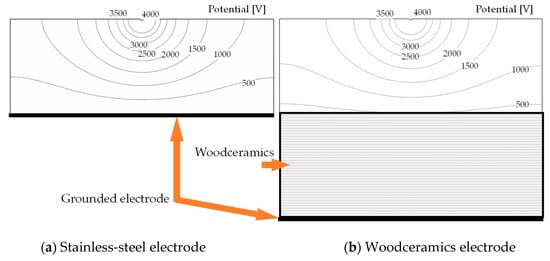
Figure 2.
Electrical potential of the corona electrode structure with the (a) stainless-steel grounded electrode and (b) woodceramics grounded electrode. The bottom side of the woodceramics was grounded, so, the potential near the woodceramics surface was approximately 480 V because of the current flow in the woodceramics.
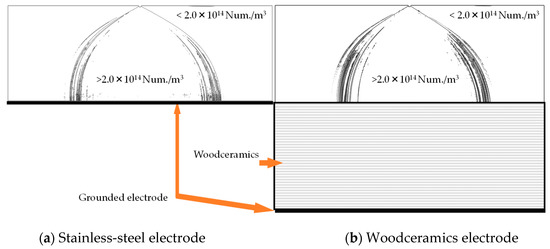
Figure 3.
Illustration of the charge number densities of charges at the (a) stainless-steel grounded electrode and (b) the woodceramics electrode. These distributions are similar in shape to the charge distribution. It can be seen that the resistivity of the grounded electrode does not have strong influence on the overall charge distribution.
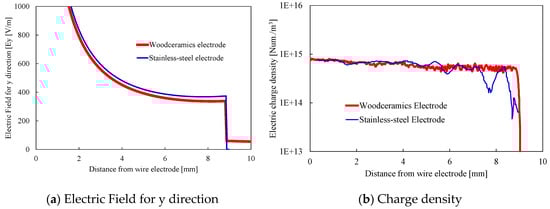
Figure 4.
(a) Electric field in the y direction and (b) charge density between the wire electrode and grounded electrode. The horizontal axes represent the distance from the wire electrode. With the woodceramics electrode, the electric field decreased by 10% and the charge density was slightly lower than that with the stainless-steel electrode.
These results shed light on the particle-collection process; the particle charge and immigration velocity decrease when using a woodceramics electrode, unlike with a stainless-steel electrode, because of the decrease in the electric field.
3. Experimental Methods
3.1. Woodceramics
Figure 5 shows the process of manufacturing woodceramics by molding charcoal powder or a part of a plywood board. In this study, sawdust charcoal was used as the charcoal powder; it was pulverized to a particle size of less than 1 mm and mixed with phenol resin powder (Kanebo, Bellpearl S899) at a weight ratio of 8:2 using a ball mill. The mixed powder was placed in a mold temporarily while degassing at 200 °C and 4.0 MPa. Thereafter, the samples were compressed at 160 °C and 20 MPa and cooled from 160 °C to 40 °C for 10 min. The samples were then molded elsewhere. Under a vacuum of less than 50 Pa, the molded samples were fired at 300 °C or 600 °C for 3 h to complete the woodceramics manufacturing process. Microscopic photographs were taken using a digital still microscope (KEYENCE, VH-5000) (see Figure 6). In the woodceramics, the wood fibers remained on the surface, which was rougher than that of the stainless-steel electrode.
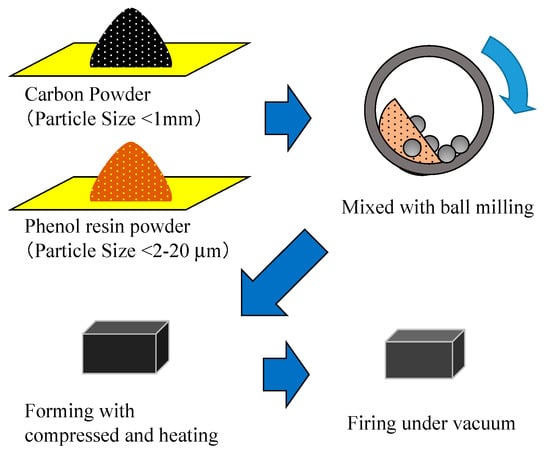
Figure 5.
The process of manufacturing woodceramics. First, the carbon powder was made by mixing sawdust charcoal and phenol resin powder by ball milling. Then, the mixed powder was compressed and heated. Finally, the formed test piece was fired under a vacuum.
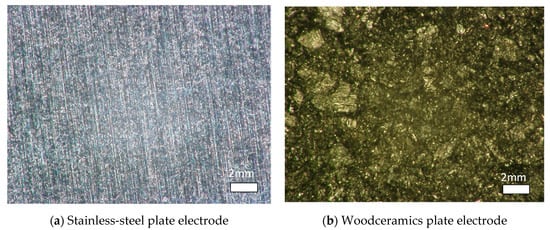
Figure 6.
(a) Stainless-steel surface and (b) woodceramic surface. On the stainless-steel surface, the marks of the grinder are seen. On the woodceramic surface, the wood fiber appears dotted.
The electric resistivities of the woodceramics and stainless-steel electrodes were measured according to the Japanese Industrial Standard (JIS K7194 Testing method for resistivity of conductive plastics with a four-point probe array) using the measurement probe is shown in Figure 7. The needles were sewing needles with radii of curvature of R = 70 μm and diameters of Φ = 0.71 mm. Woodceramics and stainless-steel electrodes were prepared for each of three samples, and five points were measured on each sample. A current of 1 or 10 mA was flowed between A and D while the voltage between B and C was measured with a source measure unit (Yokogawa GS610). The contacts at the tips of the needles and the test piece were adjusted to a minimum voltage between B and C. The resistivity was calculated as follows:
where r is the resistivity (in Ω·cm), t is the thickness (in cm) of the test piece, and R is the resistance (in Ω) obtained from the current and voltage measurements. The thickness, t was in the range of 0.106–0.138 mm for the stainless-steel electrodes and in the range of 11.4–11.9 mm for the woodceramics electrodes. Thus, the correction factor for the thickness, F was 4.2353 for the stainless-steel electrodes and in the range of 2.3693–2.4014 for the woodceramics electrodes.
ρ = F∙t∙R,
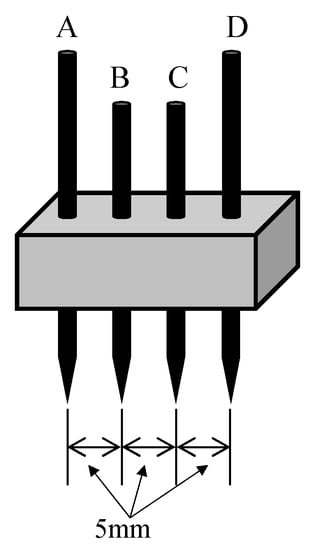
Figure 7.
Four terminal probes used for measuring resistivity. Terminals A to D are needles of the same shape. Current flowed from A to D or from D to A, while the voltage was measured between B and C.
The average resistivities are shown In Table 2. The resistivity of the woodceramics material was 98.2 Ω·cm, which was 4400 times higher than that of stainless steel which was measured as 0.0281 Ω·cm.
Table 2.
Resistivities of woodceramics and stainless-steel.
3.2. Experimental Setup and Conditions
A schematic diagram of the experimental apparatus is shown in Figure 8. The test particles were generated by the combustion of vegetable oil. Particle-laden gas was introduced via the experimental duct with the updraft, and the gas was diffused by a diffusion fan. Then, the sample gas was absorbed into the electrostatic precipitator and treated with a positive corona discharge and diffused by the fan. The treated gas then resided in the downstream test duct. The number density of particles in this gas was measured with a particle counter (RION, KC-01E + diluter KD-01); the number densities of the room air and target gas are shown in Table 3. The concentration of 0.3–0.5 μm particles in the target gas was 1.2 × 10⁵ Num/L and over 80% of these particles originated from the combustion. To verify the particle concentration, the sampling position was moved to upstream of the electrostatic precipitator before and after each test was completed. Thus the particle-collection efficiency was calculated as follows:
where Nin indicates the upstream particle number concentration, and Nout is the downstream particle number concentration of the electrostatic precipitator. Instead of Nin, the averaged particle concentration measured downstream of the electrostatic precipitator without an applied voltage was used.
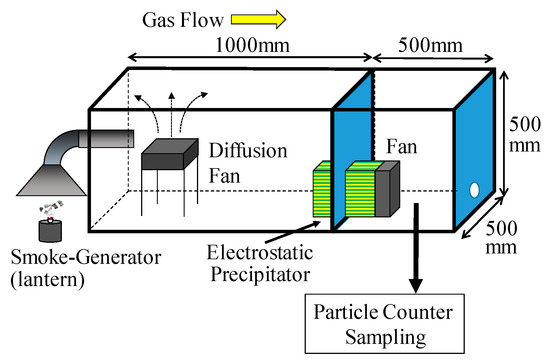
Figure 8.
Schematic diagram of the experimental apparatus. An oil lantern was used as the particle generator. The particle concentration was measured downstream of the electrostatic precipitator.
Table 3.
Average concentrations of particles in various size ranges in the room air and target gas.
3.3. Electrostatic Precipitator
A top-down view of the electrostatic precipitator is shown in Figure 9. The gas treated with corona discharge passed through the strainer with the perforated metal plate and was channeled to the downstream exhaust duct. The gas-flow velocity was adjusted by varying the fan speed. The fan and the gas flow were stopped when measuring the discharge current. The mean gas velocity was kept at 3 m/s when evaluating the particle collection.
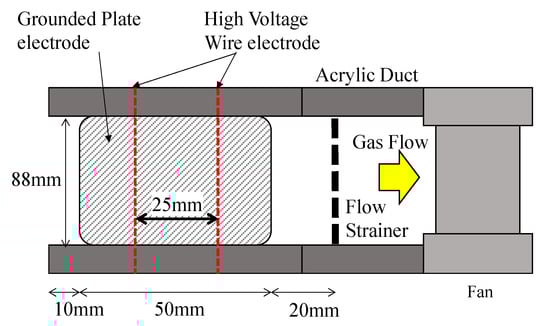
Figure 9.
Top view of the electrostatic precipitator. The gas flow is from the left to the right. The treated gas propelled the fan, and the exhaust gas flows into the downstream duct.
The electrode structures of the corona discharge with the woodceramics grounded electrode and stainless-steel grounded electrode are shown in Figure 10. The two grounded electrodes were placed parallel to each other at a distance of 18 mm apart, and the two wire electrodes for the applied high voltage were set at the midpoint between the grounded electrodes. The electrostatic precipitator duct was 88 mm in total width and 18 mm high. The wire electrode was connected to a DC + high-voltage power supply (Matsusada Precision, HAR-20R15), and the discharge current was measured with an ammeter attached to the power supply. In each grounded electrode, the distance between the wire electrode and grounded electrode was 9 mm. In addition, the thickness of the woodceramics was approximately 10 mm, and a copper grounded electrode was attached behind the woodceramics.
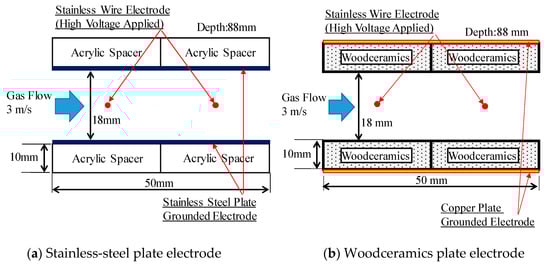
Figure 10.
Side view of each electrode structure. In the corona discharge electrode configuration, the grounded electrode was either a (a) stainless-steel grounded electrode or (b) woodceramics grounded electrode. Each grounded plate electrode structure was placed such that its surface was the same distance from the wire electrode.
4. Results and Discussion
Figure 11 shows the discharge current as a function of the applied voltage. The corona on-set voltage was approximately 6.0 kV. The current-voltage curves for the woodceramics and stainless-steel grounded electrodes were very similar.
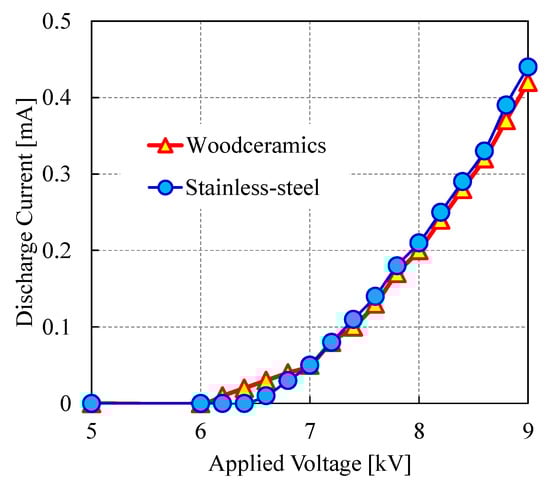
Figure 11.
Corona discharge current as a function of the applied voltage for various electrodes. The discharge current characteristics of the two electrodes follow similar trends.
Figure 12 shows the collection efficiencies using woodceramics and stainless-steel grounded electrodes for operating times of 0–5 min, 5–10 min, 10–15 min, and 15–20 min. The particle-collection efficiency with the woodceramics electrode was high and remained constant over the entire operating period. On the other hand, when using the stainless-steel electrode, the particle-collection efficiency was constant for particles smaller than 1 μm during the operating time, but that for particles larger than 1 μm decreased over the operating period. This decrease can be attributed to the particle agglomeration on the electrode surface and the occurrence of particle re-entrainment phenomena. However, such particle re-entrainment phenomena were prevented by using the woodceramics electrode. Thus, the surface roughness and the electrical resistivity of woodceramics improve the collection efficiency. In future studies, we will investigate the mechanism underlying the agglomeration of the collected particles and the effect of improving the particle collection using a woodceramics electrode.
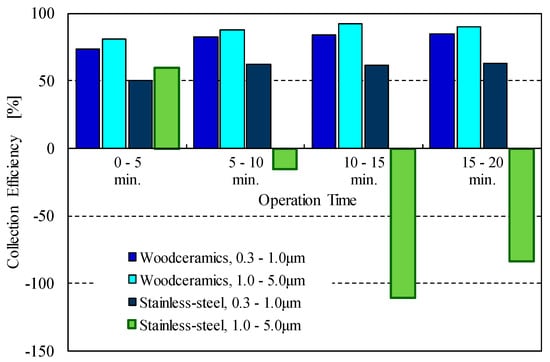
Figure 12.
Particle-collection efficiencies over time for various electrode types and particle size ranges. With the woodceramics electrode, the collection efficiency for large particles remained high while that with the stainless-steel electrode decreased with the operating time.
5. Conclusions
Stainless-steel or aluminum are generally used as electrode materials in the electrostatic precipitator. In this study, we utilized a novel electrostatic precipitator to collect carbon particles on a carbon electrode based on charged particles and the Coulomb force. A woodceramics made from sawdust charcoal which has an electrical resistivity 4400 times higher than stainless steel was used as the carbon electrode. Because the woodceramics material has a porous surface, it was expected to improve the particle collection. The electric field and charge distribution were calculated and the actual particle collection was evaluated experimentally.
The calculation results showed that, using woodceramics electrodes, the electric field near the electrode surface was reduced by approximately 10%, and the particle-collection efficiency was reduced accordingly. However, the adhesion force of the particles after contact with the electrode depended on the intermolecular force and not the Coulomb force. Therefore, the only concern was the reduction in the migration speed.
Our experimental results showed that, with the use of the woodceramics electrode, the particle-collection efficiency improved in all particle size ranges while the re-entrainment phenomenon decreased. However, the present study serves only as a feasibility study. In future research, the applied voltage characteristics and flow velocity characteristics should be further tested.
Author Contributions
Conceptualization, Y.K. and H.S.; Methodology, Y.K.; Software, Y.K.; Validation, Y.K.; Formal Analysis, Y.K.; Investigation, Y.K. and H.S.; Resources, Y.K. and H.S.; Data Curation, Y.K.; Writing-Original Draft Preparation, Y.K.; Writing-Review & Editing, Y.K.; Visualization, Y.K.; Supervision, H.S.; Project Administration, Y.K.; Funding Acquisition, Y.K. and H.S.
Funding
This research received no external funding.
Acknowledgments
The authors would like to thank Enago for the English language review.
Conflicts of Interest
The funders had no role in the design of the study; in the collection, analyses, or interpretation of data; in the writing of the manuscript, and in the decision to publish the results.
References
- Pajdowski, P.; Puchałka, B. The Process of Diesel Particulate Filter Regeneration under Real Driving Conditions. IOP Conf. Ser. Earth Environ. Sci. 2019, 214, 012114. [Google Scholar] [CrossRef]
- Godish, T. Indoor Air Pollution Control, 3rd ed.; Lewis Publishers: Chelsea, MI, USA, 1991; pp. 247–263. [Google Scholar]
- White, H.J. Industrial Electrostatic Precipitation; Addison-Wesley Publishing: Reading, MA, USA, 1963; pp. 319–329. [Google Scholar]
- Takahashi, T.; Zukeran, A.; Ehara, Y.; Ito, T.; Takamatsu, T.; Kawakami, H. Influence of Re-entrainment Phenomena on Particle Deposit in Electrostatic Precipitator. IEEJ Trans. Fundam. Mater. 1999, 119, 254–260. [Google Scholar] [CrossRef][Green Version]
- Yamamoto, T.; Abe, T.; Mimura, T.; Otsuka, N.; Ito, Y.; Ehara, Y.; Zukeran, A. Electrohydrodynamically Assisted Electrostatic Precipitator for the Collection of Low-Resistivity Dust. IEEE Trans. Ind. Appl. 2009, 45, 2178–2184. [Google Scholar] [CrossRef]
- Masuda, S.; Moon, J.-D. Electrostatic Precipitation of Carbon Soot from Diesel Engine Exhaust. IEEE Trans. Ind. Appl. 1983, 19, 1104–1111. [Google Scholar] [CrossRef]
- Kawada, Y.; Jindai, W.; Zukeran, A.; Ehara, Y.; Ito, T.; Kawakami, H.; Takahashi, T. Influence of Lyphophile on Preventing Re-entrainment in Spraying Surfactant Type Electrostatic Precipitator. In Proceedings of the 7th International Conference of Electrostatic Precipitation, Kyonju, Korea, 20–25 September 1998. [Google Scholar]
- Kubo, T.; Kawada, Y.; Takahashi, T.; Ehara, Y.; Ito, T.; Zukeran, A.; Takamatsu, T. The relation between shape of particles and collection efficiency by electrostatic precipitators. J. Aerosol Sci. 2000, 31, 452–453. [Google Scholar] [CrossRef]
- Takahashi, T.; Kawada, Y.; Zukeran, A.; Ehara, Y.; Ito, T. Inhibitory effect of coating electrode with dielectric sheets on re-entrainment in electrostatic precipitator. J. Aerosol Sci. 1998, 29, S485–S486. [Google Scholar] [CrossRef]
- Shibata, K.; Kasai, K.; Okabe, T.; Saito, K. Development of Porous Carbon Material “Woodceramics”—Electrical Properties with in Low-Temperature Region. J. Soc. Sci. Jpn. 1995, 44, 284–287. (In Japanese) [Google Scholar] [CrossRef]
- Kawada, Y.; Shimizu, H. C-H Bonds and Phenol Resin Contents in Woodceramics under Fabrication. In Proceedings of the 25th Annual Meeting of MRS-J, Yokohama, Japan, 8–10 December 2015. [Google Scholar]
- Kawada, Y.; Shimizu, H.; Ohkawa, M.; Mori, S.; Kakishita, K. Elect of Woodceramics Grounded Electrode on Electrostatic Precipitation with Positive Corona Discharge. Trans. Mater. Res. Soc. Jpn. 2018, 43, 187–190. [Google Scholar] [CrossRef]
- Kawada, Y.; Shimizu, H.; Ohkawa, M.; Mori, S.; Kakishita, K. A Study on Woodceramics Collector in Electrostatic Precipitator. In Proceedings of the Annual Meeting of IESJ, Osaka, Japan, 11–12 September 2017; pp. 27–30. (In Japanese). [Google Scholar]
- Takeuchi, N. Simulation of Ionic Wind Induced by Corona Discharge Using COMSOL Multiphysics. J. Inst. Electrost. Jpn. 2016, 40, 168–171. (In Japanese) [Google Scholar]
- Kawada, Y.; Shimizu, H.; Zukeran, A. Numerical Study of the Suitable Precharger Grounded Electrode Length in Two-Stage-Type Electrostatic Precipitators. IEEE Trans. Ind. Appl. 2019, 55, 833–839. [Google Scholar] [CrossRef]
- The Institute of Electrostatics Japan (Ed.) Handbook of Electrostatics; Ohmsha, Ltd.: Tokyo, Japan, 1980. (In Japanese) [Google Scholar]
- Chang, J.S.; Kelly, A.J.; Crowley, J.M. (Eds.) Handbook of Electrostatic Processes; Marcel Dekker, Inc.: New York, NY, USA, 1995. [Google Scholar]
- Waker, P.L., Jr.; Thrower, P.A. (Eds.) Chemistry and Physics of Carbon, Volume 16; Marcel Dekker, Inc.: New York, NY, USA, 1981; p. 141. [Google Scholar]
- Okabe, T. (Ed.) Woodceramics; Uchida Rokakuho Publishing: Tokyo, Japan, 1996; p. 65. (In Japanese) [Google Scholar]
© 2019 by the authors. Licensee MDPI, Basel, Switzerland. This article is an open access article distributed under the terms and conditions of the Creative Commons Attribution (CC BY) license (http://creativecommons.org/licenses/by/4.0/).