Article

Effects of High Sludge Cycle Frequency on Performance and Syntrophic Metabolism of Anaerobic Membrane Bioreactor for Treating High-Lipid Kitchen Waste Slurry

1
School of Environmental and Civil Engineering, Jiangnan University, Wuxi 214122, China
2
Jiangsu Key Laboratory of Anaerobic Biotechnology, Jiangnan University, Wuxi 214122, China
*
Author to whom correspondence should be addressed.
Energies 2019, 12(14), 2673; https://doi.org/10.3390/en12142673
Submission received: 30 May 2019 / Revised: 5 July 2019 / Accepted: 8 July 2019 / Published: 12 July 2019

Abstract

:
The performance and syntrophic metabolism of the Anaerobic Membrane Bio-reactor (AnMBR) treating high-lipid kitchen waste slurry under different sludge cycle frequencies were investigated in this study. When the sludge cycle frequencies were 3.6 cycles/h, 9.0 cycles/h and 14.4 cycles/h, the obtained Organic Loading Rates (OLRs) were 10.3 kg-COD/m3d, 12.4 kg-COD/m3d and 18.1 kg-COD/m3d, while the corresponding biogas productions were 190 L/d, 310 L/d and 520 L/d. Moreover, with an increase of sludge cycle frequency, the Chemical Oxygen Demand (COD) removal efficiency improved from 86.2% to 90.4% and 96.3%. Additionally, the higher sludge cycle frequency did not break up the sludge flocs and further affect the syntrophic degradation of the toxic Long-Chain Fatty Acids (LCFAs). Conversely, the higher sludge cycle frequency enhanced LCFA degradation and decreased LCFA accumulation. Meanwhile, under higher sludge cycle frequencies, the abundance of syntrophic Methanobacterium, Syntrophomonas and Clostridium increased and favored the syntrophic metabolism of LCFAs.

Graphical Abstract

1. Introduction

Many processing industries, for example, bioethanol production from corn, dairy foods processing, animal slaughtering and meat processing, produce a large amount of high strength waste waters/slurries which are characterized by high lipid contents [1,2,3,4]. In addition to these industrial processes, a new emerging kitchen waste treatment process in China also generates a lipid-rich stream called kitchen waste slurry. The specific integrated system for kitchen waste disposal is as follows: kitchen waste is collected and transported to the treatment plant and then pretreated for sorting, removal of impurities and crushing. After that, temperature steaming and three-phase separation is undertaken to obtain three substances: raw oil, solid waste and waste slurry. The raw oil is further refined into biodiesel and the solid waste is used for humus soil cultivation [5]. In this process, the produced kitchen waste slurry, together with these high lipid waste waters/slurries encourage the growth of microorganisms and promote the spread of diseases if they enter the environment, since they contain high concentrations of organic matter [6,7]. Anaerobic digestion is a promising way to dispose of these high-strength waste slurries for energy recovery, as the abundant organic matters (such as carbohydrates, proteins, lipids, etc.) contained in them can be used as substrates for anaerobes [1,2,3,4]. Special attention should be focused on the component of lipids, which exhibit higher methane yields compared with carbohydrate and protein [8,9]. However, their hydrolysis products, Long-Chain Fatty Acids (LCFAs), present an acute toxic effect on anaerobe, resulting a decrease in microbial activity [10,11,12]. In addition, they can be absorbed through the surface of the microbe, forming a light LCFA layer around biomass particles and causing biomass flotation and wash-out [13]. Conventional high rate anaerobic digestion technology (Expanded Granular Sludge Bed (EGSB) and Up-flow Anaerobic Sludge Bed (UASB) technologies) for treating the high lipid waste waters/slurries have faced problems of operation failures due to biomass retention problems. Fortunately, Anaerobic Membrane Bioreactors (AnMBRs) can effectively solve these problems thanks to the complete interception ability of the membrane for the biomass. With the AnMBR, high loading rates, excellent effluent quality, robust stability and better anaerobic digestion performance are obtained [14]. This makes AnMBRs a very attractive alternative for the treatment of high concentration waste waters/slurries, although they suffer from costly equipment investments and high energy consumption in pumping in order to pressurize the membranes, as well as the extra cost of cleaning the membrane [15].
So far, the main challenge described for AnMBRs is membrane fouling with pore blocking and cake layers forming on the membrane surface. The methods of controlling fouling mainly include substrate pretreatment, operation condition changes, coagulant addition, membrane modification, etc. [16,17,18,19]. Notably, for a side-stream tubular AnMBR, maintaining a high cross flow velocity from 1.0 m/s to 5 m/s on the membrane surface is an effective method to slow down the cake layer forming rate and reduce membrane fouling. This would need an oversized circulation pump to maintain a high cycle volume for the sludge mixture. However, according to research reported by Brockmann and Seyfried [20], the high sludge cycle flow resulting from the oversized circulation pump may lead to the breakup of microbial flocs and affect the interrelationship between microbes, as it produces a high shear stress for the sludge flocs. It was reported that in the digestion process of lipids-rich waste slurries, lipid hydrolysate (LCFAs) degradation requires syntrophic interactions between proton-reducing acetogenic bacteria and H2-utilizing methanogens [21,22,23]. Thus, the high sludge cycle supplied by the sludge recycle pump of the side-stream tubular AnMBR may have a negative impact on LCFA degradation, resulting in LCFA accumulation and reactor performance deterioration. According to existing knowledge, few studies about the influence of the high sludge cycle on LCFA syntrophic degradation and reactor performance have been reported. Therefore, for the treatment of high lipid kitchen waste slurry with side-stream tubular AnMBRs, further investigation is required. In the current work, a side-stream tubular AnMBR system was operated under different sludge cycle frequencies; the objectives were to: (1) evaluate the effects of different sludge cycle frequencies on the anaerobic digestion performance and stability for treating kitchen waste slurry containing high lipids; (2) investigate variations in sludge characteristics when the shear stress was changed; (3) analyze the LCFAs syntrophic degradation and accumulation under different sludge cycle frequencies; and (4) detect the shift of the syntrophic microbial community structures with increased shear stress.

2. Materials and Methods

2.1. Kitchen Waste Slurry Characterization

The specific components of the kitchen waste slurry are summarized in the references of Xiao et al. [5]. The slurry contained high concentration organic matter with average Total Chemical Oxygen Demand (TCOD) and Total Suspended Solids (TSS) concentrations of 90.2 g/L and 18.5 g/L, respectively. The lipid content in the slurry was very high; the average value was up to 5.95 g/L. The Ammonia Nitrogen (NH4), Total Nitrogen (TN) and Total Phosphorus (TP) concentrations were 325 mg/L, 1848 mg/L and 83.5 mg/L, respectively. The slurry presented a low pH of 3.9 and a high level of salinity, with conductivities of 10.6 ms/cm.

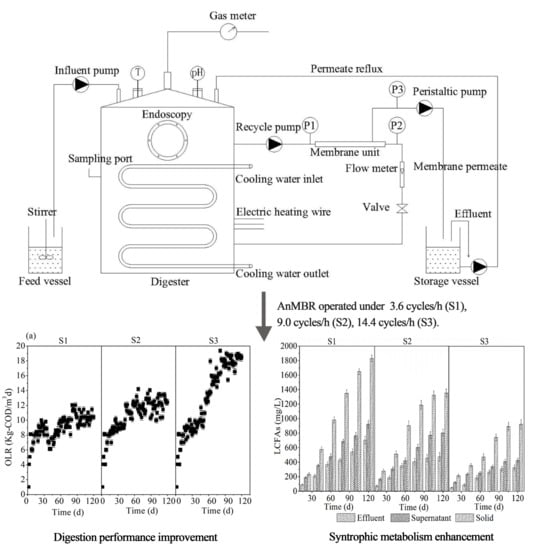
2.2. AnMBR Configuration and Parameters

The basic configuration of the AnMBR (showed in Figure 1) and the external Ultrafiltration Membrane (UF) used in this study were the same as those used in our previous study [5]. The main difference was that the anaerobic digester volume was 60 L and the total filtering surface area was 0.01808 m2. The recycle pump (20QY-1SS, Nanfang pump industry Co., Ltd., Hangzhou, China) provided the cross-flow velocity and operation pressure for the tubular membrane modules. The membrane permeate flux rate kept at 14 L/m2h, and the excessive permeate was recycled back to the digester to maintain the working volume of the anaerobic reactor at 50 L. The biogas production was measured with a gas meter and the pH was on-line monitored. The digestion temperature was maintained at 39 ± 1 °C by automatically controlling the electric heating system and cooling system.

2.3. Operation Strategy

Three identical AnMBRs, as described in Section 2.2, named as S1, S2 and S3 respectively, started simultaneously with 50 L (V) of inoculated anaerobic sludge, which was the same as that in the literature [5]. They were operated under different cross flow velocities (F), i.e., about 1.0 m/s, 2.5 m/s and 4.0 m/s respectively, under the same average operation pressure (p = (pl + p2)/2) (Figure 1), which was achieved by adjusting the speed of recycle pumps and the opening of the values (Figure 1). The concentrate after filtration was continuously returned to the digester with a recirculation rate (Q, Q = FΠ(D2/4)) of 0.18 m3/h, 0.45 m3/h and 0.72 m3/h, which produced different sludge cycle frequencies (S, S = Q/V) of 3.6 cycles/h, 9.0 cycles/h, and 14.4 cycles/h for the sludge mixture in the three reactors, respectively (resulting in different shear stress of S1, S2 and S3). This sludge cycle frequency supplied a mixing of substrates and anaerobes without additional mechanical stirring. The three reactors started with the same OLR, i.e., 1.0 kg-COD/m3d. Then, the OLRs were gradually elevated by increasing the influent flow rate, with no sludge discharge. After operating for 25 d, the concentration of TSS reached 25 g/L, and then 2.5 L/d of sludge mixture was discharged (half of the volume discharged every 12 h, twice a day) from the sampling port of each digestion reactor to control the Sludge Retention Time (SRT) at 20 d. During the 120 d operation period, the membrane flux was fixed at 14 L/m2 h by adjusting the effluent peristaltic pump on a daily basis in the all three AnMBRs, and the excess permeate was returned to the digestion reactor. When the TransMembrane Pressure (TMP, TMP = p − p3) (Figure 1) reached 0.15 MPa, the membrane was cleaned by a chemical method proposed by Xiao et al. [5].

2.4. Physicochemical Analysis

The COD, TSS, Volatile Fatty Acids (VFAs), pH and alkalinity were analyzed according to standard methods [24]. The methane (CH4) content was determined by gas chromatography [25]. The acetate, propionate and butyrate were analyzed and the total VFAs could be shown according to the reports [26,27].
The method of the extraction and determination of LCFAs referred to the research of Neves et al. [28]. First, 1.5 mL HCl, 1.5 mL methanol, 2 mL dichloromethane and 2 mL ultra-pure water were prepared in a glass vial, then a defined amount of the sample was added and vortex-mixed. After that, the mixture was methyl-esterified at 100 °C for 3.5 h, and then another 2 mL ultra-pure water was added. The vial was kept in an inverted position for 30 min, after which the organic phase was analyzed by gas chromatography (GC-2010, Shimadzu, Kyoto, Japan), equipped with a flame ionization detector and a capillary column.
The sludge particle size distribution of sludge suspension was determined by BT-2003 Laser Particle Size Analyzer (Bettersize Instruments Ltd., Dan Dong, China). The Bound Extracellular Polymeric Substances (BEPS) were extracted as described in the literature [29], and the carbohydrate and protein in the BEPS were measured by the phenol-sulfuric acid method and the Lowry method, respectively [30,31].

2.5. Microbial Community Analysis

To investigate variations in the microbial community structure of the AnMBR under different sludge cycle frequencies, the high-throughput 16S rRNA sequencing was conducted with bacteria primer pairs of forward 319F (5′-ACTCCTACGGGAGGCAGCAG-3′) and reverse 806R (5′-GGACTACHVGGGTWTCTAAT-3′) [32], and archaea primer pairs of forward 349F (5′-GYGCASCAGKCGMGAAW-3) and reverse 806R (5′-GGACTACHVGGGTWTCTAAT-3′) [14]. The sequence analysis proceeded according to the method described in the reference of Xiao et al. [14]. After filtering out low-quality reads and trimming the adapters, barcodes and primer, high-quality and credible sequence reads for the bacteria and archaea were obtained for data processing. The pre-processed reads of sequence similarity 97% were identified as operational taxonomy units (OTUs), and the longest sequence reads were selected as the representative sequences of each OTU. The representative sequences were aligned against the Greengenes core set reference database using the PyNAST program. A representative sequence for each OTU was classified using RDP (Ribosomal Database Project classifier) and the Greengenes OTU database.

3. Results and Discussion

3.1. Reactors Performance and Stability

Reactor performances and stability under different sludge cycle frequencies (S1, S2 and S3) were compared by the obtained OLR, VFAs concentrations, pH value, biogas production, percentage of methane in the biogas, effluent COD and the parameter value VFAs/alkalinity [33]. Generally, it could be determined whether the reactor was stable and the OLR could be improved according to the value of VFAs/alkalinity. When the VFAs/alkalinity ratio is below 0.3, the reactor had robust stability and could continue to increase its OLR. In contrast, when the ratio was above 0.5, the digester was at risk of acidification and breakdown [34]. The results of the performances and stability under different sludge cycle frequencies (S1, S2 and S3) are shown in Figure 2 and Table 1. For reactor S1 operating under a sludge cycle frequency of 3.6 cycles/h, when the OLR gradually increased from 1.0 kg-COD/m3d to 8.2 kg-COD/m3d in the initial stage (0–15 d) (Figure 2a), the biogas production elevated accordingly, and the methane percentage was at a stable level of 66.5% (Figure 2b). In addition, the effluent COD kept below 2100 mg/L and COD removal efficiency was above 96.0%, based on the effluent quality (Figure 2c). The pH was around 7.6, the VFA concentration was under 200 mg/L, and the VFAs/alkalinity was less than 0.02 (Figure 2d). These data show that the system S1 presented promising digestion performance and stability at low OLR. However, when the OLR continued to increase to about 10.3 kg-COD/m3d on the 30th day, the reactor performance deteriorated gradually, with a gradual decrease of methane percentage and COD removal efficiency and an increase in VFAs concentration. Keeping the AnMBR operating under the OLR of 10.3 kg-COD/m3d until the end for S1, the biogas production was 190 L/d and methane percentage dropped to 50.3%, effluent COD increased to 13,400 mg/L and COD removal efficiency decreased to 86.2% (Figure 2b,c and Table 1). Further, VFAs accumulated to 6860 mg/L, VFAs/alkalinity raised to 0.68, and the pH was below 7.0 (Figure 2d). This suggested that the deteriorated digestion performance and acidification risk were observed for the reactor S1 with lower cross flow velocity when the OLR increased to about 10.3 kg-COD/m3d.
As the sludge cycle frequency increased by 2.5 times for reactor S2, the same good digestion performance and stability as that of S1 were obtained at the initial operation stage (0–20 d), when the OLR increased from 1.0 kg-COD/m3d to 9.0 kg-COD/m3d. As the OLR continued to elevate to 12.4 kg-COD/m3d on the 60th day, a slight decrease of digestion performance was noticed. The biogas production remained at 310 L/d and methane percentage was 55.2% (Figure 2a,b and Table 1). Effluent COD was 7300 mg/L and COD removal efficiency was above 90.4% (Figure 2c and Table 1). Moreover, from the 60th day to the end, VFAs was gradually accumulated to 4780 mg/L, VFAs/alkalinity was approximately 0.45 and pH was about 7.4 (Figure 2d and Table 1), which indicated that the reactor was in an unstable state.
When the reactor S3 was operating at the highest sludge cycle frequency, 14.4 cycles/h, it exhibited excellent performance and stabilityThis It can afford higher OLR peaking, i.e., 18.1 kg-COD/m3d, compared with S1 and S2 (Figure 2a and Table 1). Under this OLR, the reactor still presented unexpected digestive performance, with a highest biogas production of 520 L/d containing methane percentage of 58.4% (Figure 2b and Table 1). More importantly, the effluent COD remained below 5200 mg/L and COD removal efficiency was above 96.3% throughout the whole operation (Figure 2c and Table 1). Further, reactor S3 also showed robust stability, with a stable pH of 7.6, a low VFA concentration below 1690 mg/L, and a small ratio of VFAs/alkalinity, i.e., less than 0.17 (Figure 2d and Table 1).
From the above description, it was concluded that as the sludge cycle frequency increased, higher OLR and biogas production, better effluent quality and COD removal efficiency, and more robust stability were attained. This conclusion is inconsistent with other reports that high shears in the AnMBR lead to poor reactor performance [20]. In their research, it was proposed that higher shear conditions may cause the breakup of flocs and the disruption of the spatial juxtaposition relationship between hydrogen-producing syntrophic bacteria and their methanogenic partners, resulting in poor syntrophic metabolism, especially for the conversion of propionate and butyrate, requiring microbe syntrophic degradation. It is well known that in anaerobic process, the conversion of reduced organic compounds is energetically unfavorable under standard conditions [35]. They need the methanogens to keep the concentrations of the reaction products, acetate and hydrogen, low enough to create a situation in which all partners involved gain energy. Therefore, the spatial juxtaposition relationship directly affects the propionate and butyrate degradation efficiency and accumulation rate. In order to further understand the effects of different shears on the syntrophic metabolism of propionate and butyrate, the specific VFA composition were determined throughout the operation; the results are shown in Figure 2e. When the reactor S1, S2 and S3 operated under 10.3 kg-COD/m3d, 12.4 kg-COD/m3d and 18.1 kg-COD/m3d respectively, the acetate concentrations in the three reactors were about 3100 mg/L, 2800 mg/L and 1140 mg/L, accounting for 56.4%, 70.0% and 76.0% of the their own total VFAs. In addition, the propionate and butyrate concentrations were about 1150 mg/L, 580 mg/L, 172 mg/L and 1250 mg/L, 620 mg/L, 188 mg/L, and their proportions were 20.9%, 14.5%, 11.5% and 22.7%, 15.5%, 12.5% for S1, S2 and S3, respectively. These data showed that the percentages of propionate and butyrate concentrations in the S3 were lower than those in S1 and S2, which indicated that the propionate and butyrate degradation rate increased under higher sludge cycle frequencies. This may be ascribed to that the syntrophic relationship between syntrophic bacteria and their methanogenic partners degrading the propionate and butyrate was enhanced under higher sludge cycle frequency. Therefore, in this research, the syntrophic metabolism was not affected by the higher sludge cycle frequency; specific reason for this is described in Section 3.2 and Section 3.3.
In addition, variations of membrane fouling under different sludge cycle frequencies were also investigated, as shown in Figure 2f. The average flux of the three reactors was controlled at about 14 L/m2h, and the fouling rate was evaluated by the TMP variation and cleaning frequency. Under the lower sludge cycle frequency (i.e., lower cross flow velocity) in S1, a cake layer rapidly developed on the membrane surface due to the weaker shear force, resulting in severe fouling. Thus, the TMP increased rapidly in a short period and the cleaning frequency reached 11 times during the 120-day operation. With the increased sludge cycle frequencies (also increased cross flow velocities) of S2 and S3, the enhanced shear force on the membrane surface could remove the cake layer efficiently and relieve fouling, as demonstrated by the decreased cleaning frequency of 6 times and 4 times during the 120-day operation for S2 and S3, respectively. In summary, a higher sludge cycle frequency can both reduce membrane fouling and enhance digestion performance.

3.2. Sludge Characteristics

The distance between hydrogen -producing and -consuming microorganisms becomes critical for syntrophic interactions to work effectively, as the small distance between cells facilitates hydrogen diffusion and transfer [36]. The large flocs can decrease the distance between syntrophic acetogenic bacteria and H2-utilizing methanogen and improve hydrogen transfer efficiency. Therefore, floc size was monitored over time to evaluate whether the increased shear was sufficient to lead to the breakup of microbial flocs; the results are shown in Figure 3 and Table 2. For S1, S2 and S3, the average particle size decreased rapidly from 22.8 μm, 22.4 μm and 22.9 μm to 7.0 μm, 6.8 μm and 6.1 μm in the initial shear period of 70 d, 50 d and 30 d, respectively (Figure 3a). This indicated that the higher sludge cycle frequency of S2 and S3 could produce a worse effect on the sludge flocs in a short period. However, in the following operation stage, the average particle sizes of the S1, S2 and S3 were 6.9 μm, 7.1 μm, 7.0 μm, respectively (Figure 3a and Table 2), which showed that the flocs of the three reactors could almost maintain the same size, as the microbes gradually adapted to their new environment. According to the report of Zhang et al. [37], floc size was connected to the Protein (PN) and Polysaccharide (PS) contents in the BEPS. The high ratio of PN/PS could make the flocs more resistant to the shear stress. Thus, the contents of the PN and PS under different under sludge cycle frequencies were determined throughout the whole operation; the results are shown in Figure 3b and Table 2. With the increase of the sludge cycle frequency, the content of PN gradually increased while that of PS remained about the same, which resulted in an increase of PN/PS. This increase of the ratio made the flocs more resistant to the high shear stress, and the sludge average particle size decreased slightly under a higher sludge cycle frequency.
Thus, under a higher sludge cycle frequency, the syntrophic metabolism was not affected and the reactor performance was also not deteriorated. On the contrary, the higher sludge cycle frequency produced a higher up-flow velocity in the reactor and accelerated the mixing intensity of the system, giving the flocs more chance to come into contact with each other. This would probably further enhance the interspecies hydrogen transfer rate and improve syntrophic metabolism efficiency. Thus, better degradation efficiency and digestion performance were observed under a higher sludge cycle frequency.

3.3. Syntrophic Metabolism of LCFAs

3.3.1. LCFAs Accumulation in the Reactor

The kitchen waste slurry included a high lipid content (5.95 g/L), although it was pretreated by oil extraction. Lipids are an interesting substrate for biogas production because of their high methane yield potential. However, their hydrolysis products, i.e., the LCFAs, are known to inhibit the microbial activity by adsorbing onto the microbial surface and affecting the transport of nutrients into the cell [38]. Therefore, it is necessary to determine the LCFA concentration under different sludge cycle frequencies; the results of these calculations are shown in Figure 4. During the whole operation for S1, a rapid accumulation of LCFA contents in the AnMBR was observed. When the OLR increased from 1.0 kg-COD/m3d to 10.3 kg-COD/m3d, the LCFAs contents in the effluent, supernatant and sludge solid accumulated from 89 mg/L, 189 mg/L and 232 mg/L to 705 mg/L, 923 mg/L and 1830 mg/L. Most of LCFAs accumulated in the sludge solid, probably due to the absorption of LCFAs on the surface of the microbe, forming a fat layer. This layer hindered the mass transfer process and inhibited microbial activity, resulting in the deteriorated operation performance of S1. For S2, the LCFA contents in the system were lower than those of S1, and the LCFA concentrations in the effluent, supernatant and sludge solid increased from 69 mg/L, 165 mg/L and 277 mg/L to 474 mg/L, 805 mg/L and 1353 mg/L. Compared with S1 and S2, S3 exhibited the greatest ability to degrade LCFAs. When the OLR of S3 increased to 18 kg-COD/m3d, the LCFAs in the effluent, supernatant and sludge solid maintained low levels of 326 mg/L, 426 mg/L and 924 mg/L, respectively. These data suggested that LCFA metabolism was enhanced under a higher sludge cycle frequency. The decreased LCFA contents with increased sludge cycle frequency diminished its toxicity to the microbe and favored the digestion process, thus contributing to better reactor performance under a higher sludge cycle frequency.
It was reported that LCFA degradation is commonly achieved by proton-reducing acetogenic bacteria that require the syntrophic interactions with H2-utilizing methanogens [22] to lower hydrogen partial pressure, as anaerobic oxidation of LCFAs by proton-reducing acetogenic bacteria is thermodynamically unfavorable (ΔG > 0). Syntrophic interactions between these two kinds of microorganisms are usually associated with interspecies hydrogen transfer; therefore, the efficiency of hydrogen transfer is very important and dictates the strength of syntrophic interactions. As described in Section 3.2, higher sludge cycle frequencies did not affect syntrophic metabolism. On the contrary, they could enhance the mixing intensity and may improve the hydrogen diffusion rate and transfer efficiency, promoting LCFA syntrophic degradation and enhancing the reactor performance.

3.3.2. Microbial Community Structure

In order to evaluate the effects of different sludge cycle frequencies on the performance of the AnMBR system, the microbial community structure, especially the abundance of syntrophic microbe degrading the LCFAs, was analyzed with a specific cross flow velocity using the 16S rRNA high throughput sequencing technique. The results are presented in Figure 5.
For archaea at the genera level (Figure 5a), most of thm were affiliated with the five major genera: Methanobacterium, Methanothrix, Methanosarcina, Methanoculleus and Methanomethylovoranns. Special attention should be paid to the genera Methanobacterium, the main important hydrogenotrophic methanogen in the three digestors. They served to remove the hydrogen and to maintain low hydrogen partial pressure, which ensured syntrophic LCFAs degradation [39]. As shown in Figure 5a, for S1, S2 and S3 from the 30th day to the end of operation, Methanobacterium abundance increased from 15.9%, 22.3%, 28.7% to 23.8%, 35.5%, 60.4%, respectively. The sharp elevation of syntrophic methanogen in S3 was probably due to the enhancement of interspecies H2 transfer rate under a higher mixing intensity, which supplied enough substrates for the Methanobacterium, and thus improved their abundance.
The bacterial community structure was determined over the whole operation period to detect variations of the syntrophic acetogenic abundance; results are shown in Figure 5b. The bacteria existing in the AnMBR system mainly belonged to Paludibacter, Petrimonas, Proteiniphilum, Bacteroidales_unclassified, Candidatus Cloacamonas, Sedimentibacter, Syntrophomonas, Clostridium, Thermovirga, VadinCA02 and Kosmotoga on a genus level. Special attention was paid to the genus Syntrophomonas and Clostridium, two kinds of syntrophic acetogenic bacteria, which play an important role in the β-oxidation process of LCFAs [40]. Their abundances changed significantly over the whole operation period under each sludge cycle frequency. For S1, with the increase of OLR, the Syntrophomonas and Clostridium abundances slowly increased from 2.2% and 0.9% to 4.8% and 1.6%, and then decreased to 3.9% and 1.4% at the end of the operation due to the deteriorated performance. For S2, it presented a faster increase from 2.3% and 1.3% to 5.5% and 2.4%. Compared to that of S1 and S2, a sharp rise of the abundances for the syntrophic acetogenic bacteria from 2.8% and 1.2% to 6.9% and 3.9% was observed in S3. The obvious increase of Syntrophomonas and Clostridium abundances under higher sludge cycle frequencies was probably due to the decreased hydrogen partial pressure resulting from the elevated abundance of the H2-utilizing methanogen Methanobacterium (Figure 5a). In short, the improved abundance of Syntrophomonas, Clostridiums and Methanobacterium enhanced the syntrophic metabolism in the system and decreased the LCFA accumulation rate, making the reactor capable of obtaining higher OLR and operating more steadily.

4. Conclusions

This study investigated the performance and syntrophic metabolism of the AnMBR treating high-lipid kitchen waste slurry under different sludge cycle frequencies, i.e., 3.6 cycles/h, 9.0 cycles/h and 14.4 cycles/h. It was concluded that increasing the sludge cycle frequency can improve the digestion performance, enhance operation stability, and attenuate membrane fouling. When the sludge cycle frequencies changed from 3.6 cycles/h to 9.0 cycles/h and 14.4 cycles/h, the OLR improved from 10.3 kg-COD/m3d to 12.4 kg-COD/m3d and 18.1 kg-COD/m3d, VFA/alkalinity decreased from 0.68 to 0.45 and 0.17, and membrane cleaning frequency reduced from 11 times to 6 and 4 times during the 120-day operation period. Moreover, with the increase of the sludge cycle frequency, the PN/PS gradually increased, which showed that the spatial adjacent relationship and syntrophic interactions were not affected, which may be ascribed to the resistance ability of the flocs to the shear force. Furthermore, LCFA syntrophic degradation was promoted, and its toxicity level to the microbe was reduced as the LCFA accumulation decreased under the high sludge cycle frequency. Finally, the increased abundance of the syntrophic microbe with the hydrogenotrophic methanogen (Methanobacterium) and proton-reducing acetogenic bacteria (Syntrophomonas and Clostridium) under higher sludge cycle frequencies favored syntrophic metabolism and enhanced the digestion performance. This study provides important theoretical knowledge and practical information for the operation of AnMBR treating lipid-rich kitchen waste slurry.

Author Contributions

Conceptualization, X.X. and W.R.; Data curation, X.X.; Formal analysis, X.X.; Funding acquisition, W.R.; Investigation, X.X. and W.S.; Methodology, X.X., W.S. and W.R.; Project administration, X.X.; Resources, W.R.; Supervision, W.R.; Validation, X.X. and W.S.; Visualization, X.X.; Writing—original draft, X.X.; Writing—review & editing, W.S.

Funding

This research was funded by Jiangsu Key Laboratory of Anaerobic Biotechnology, grant number JKLAB201603; the National Natural Science Foundation of China, grant numbers 21276114, and 21506076; the Natural Science Foundation of Jiangsu Province, grant number BK20130126; National Scientific and Technological Support of China, grant number 2012BAC18B01-2 and Scientific and Technological Support of Jiangsu Province, grant number BE2012615.

Conflicts of Interest

The authors declare no conflict of interest.

References

  1. Abdurrahman, N.H.; Rosli, Y.M.; Azhari, N.H. Development of a membrane anaerobic system (MAS) for palm oil mill effluent (POME) treatment. Desalination 2011, 266, 208–212. [Google Scholar] [CrossRef]
  2. Dereli, R.K.; van der Zee, F.P.; Heffernan, B.; Grelot, A.; van Lier, J.B. Effect of sludge retention time on the biological performance of anaerobic membrane bioreactors treating corn-to-ethanol thin stillage with high lipid content. Water Res. 2014, 43, 453–464. [Google Scholar] [CrossRef] [PubMed]
  3. Hawkes, F.R.; Donnely, T.; Anderson, G.K. Comparative performance of anaerobic digesters operating on ice-cream wastewater. Water Res. 1995, 29, 525–533. [Google Scholar] [CrossRef]
  4. Siegrist, H.; Hunziker, W.; Hofer, H. Anaerobic digestion of slaughterhouse waste with UF-membrane separation and recycling of permeate after free ammonia stripping. Water Sci. Technol. 2005, 52, 531–536. [Google Scholar] [CrossRef] [PubMed]
  5. Xiao, X.; Huang, Z.; Ruan, W.; Yan, L.; Miao, H.; Ren, H.; Zhao, M. Evaluation and characterization during the anaerobic digestion of high-strength kitchen waste slurry via a pilot-scale anaerobic membrane bioreactor. Bioresour. Technol. 2015, 193, 234–242. [Google Scholar] [CrossRef] [PubMed]
  6. Zhang, R.; El-Mashad, H.M.; Hartman, K.; Wang, F.; Liu, G.; Choate, C. Characterization of food waste as feedstock for anaerobic digestion. Bioresour. Technol. 2007, 98, 929–935. [Google Scholar] [CrossRef]
  7. Wang, F.; Zhou, C.; He, W.; Zhu, H.; Huang, J.; Li, G. The content variation of fat, protein and starch in kitchen waste under microwave radiation. Proc. Environ. Sci. 2016, 31, 530–534. [Google Scholar] [CrossRef]
  8. Li, Y.Y.; Sasaki, H.; Yamashita, K.; Saki, K.; Kamigochi, I. High-rate methane fermentation of lipid-rich food wastes by a high-solids co-digestion process. Water Sci. Technol. 2002, 45, 143–150. [Google Scholar] [CrossRef]
  9. Pereira, M.A.; Cavaleiro, A.J.; Mota, M.; Mota, M.; Alves, M.M. Accumulation of long chain fatty acids onto anaerobic sludge under steady state and shock loading conditions: Effect on acetogenic and methanogenic activity. Water Sci. Technol. 2003, 48, 33–40. [Google Scholar] [CrossRef]
  10. Hanaki, K.; Matsuo, T.; Nagase, M. Mechanism of inhibition caused by long chain fatty acids in anaerobic digestion process. Biotechnol. Bioeng. 1981, 23, 1590–1610. [Google Scholar] [CrossRef]
  11. Koster, I.W.; Cramer, A. Inhibition of methanogenesis from acetate in granular sludge by long-chain fatty acids. Appl. Environ. Microbiol. 1987, 53, 403–409. [Google Scholar]
  12. Rinzema, A.; Boone, M.; Van Knippenberg, K.; Lettinga, G. Bactericidal effect of long chain fatty acids in anaerobic digestion. Water Environ. Res. 1994, 66, 40–49. [Google Scholar] [CrossRef]
  13. Hwu, S.H.; Lettinga, G. Acute toxicity of oleate to acetate-utilizing methanogens in mesophilic and thermophilic sludges. Enzyme Microb. Technol. 1997, 21, 297–301. [Google Scholar] [CrossRef]
  14. Xiao, X.; Shi, W.; Huang, Z.; Ruan, W.; Miao, H.; Ren, H.; Zhao, M. Process stability and microbial response of anaerobic membrane bioreactor treating high-strength kitchen waste slurry under different organic loading rates. Int. Biodeterior. Biodegrad. 2017, 121, 35–43. [Google Scholar] [CrossRef]
  15. Bohdziewicz, J.; Neczaj, E.; Kwarciak, A. Landfill leachate treatment by means of anaerobic membrane bioreactor. Desalination 2008, 221, 559–565. [Google Scholar] [CrossRef]
  16. Choo, K.H.; Kang, I.J.; Yoon, S.H.; Park, H.; Kim, J.H.; Adiya, S.; Lee, C.H. Approaches to membrane fouling control in anaerobic membrane bioreactors. Water Sci. Technol. 2000, 41, 363–371. [Google Scholar] [CrossRef]
  17. Gong, H.; Jin, Z.; Wang, X.; Wang, K. Membrane fouling controlled by coagulation/adsorption during direct sewage membrane filtration (DSMF) for organic matter concentration. J. Environ. Sci. 2015, 32, 1–7. [Google Scholar] [CrossRef]
  18. Lew, B.; Tarre, S.; Beliavski, M.; Dosoretz, C.; Green, M. Anaerobic membrane bioreactor (AnMBR) for domestic wastewater treatment. Desalination 2009, 243, 251–257. [Google Scholar] [CrossRef]
  19. Sun, J.; Rong, J.; Dai, L.; Liu, B.; Zhu, W. Control of membrane fouling during hyperhaline municipal wastewater treatment using a pilot-scale anoxic/aerobic-membrane bioreactor system. J. Environ. Sci. 2011, 23, 1619–1625. [Google Scholar] [CrossRef]
  20. Brockmann, M.; Seyfried, C.F. Sludge activity and cross-flow microfiltration- a non-beneficial relationship. Water Sci. Technol. 1996, 34, 205–213. [Google Scholar] [CrossRef]
  21. Cirnea, D.G.; Paloumeta, X.; Bjornssona, L.; Alvesb, M.M.; Mattiasson, B. Anaerobic digestion of lipid-rich waste-Effects of lipid concentration. Renew. Energy 2007, 32, 965–975. [Google Scholar] [CrossRef]
  22. Sousa, D.Z.; Pereira, A.A.; Smidt, H.; Stams, A.J.M.; Alves, M.M. Molecular assessment of complex microbial communities degrading long chain fatty acids in methanogenic bioreactors. FEMS Microbiol. Ecol. 2007, 60, 252–265. [Google Scholar] [CrossRef] [PubMed] [Green Version]
  23. Weng, C.N.; Jeris, J.S.S. Biochemical mechanism in the methane fermentation of glutamic and oleic acids. Water Res. 1976, 10, 9–11. [Google Scholar] [CrossRef]
  24. APHA; AWWA; WEF. Standard Methods for the Examination of Water and Wastewater; American Public Health Association: Washington, DC, USA, 2005. [Google Scholar]
  25. Yang, L.; Huang, Y.; Zhao, M.; Huang, Z.; Miao, H.; Xu, Z.; Ruan, W. Enhancing biogas generation performance from food wastes by high-solids thermophilic anaerobic digestion: Effect of pH adjustment. Int. Biodeterior. Biodegrad. 2015, 105, 153–159. [Google Scholar] [CrossRef]
  26. Huang, Z.; Yu, X.; Miao, H.; Ren, H.; Zhao, M.; Ruan, W. Enzymatic dynamics of microbial acid tolerance response (ATR) during the enhanced biohydrogen production process via anaerobic digestion. Int. J. Hydrogen Energy. 2012, 37, 10655–10662. [Google Scholar] [CrossRef]
  27. Thanakoses, P.; Black, A.S.; Holtzapple, M.T. Fermentation of corn stover to carboxylic acids. Biotechnol. Bioeng. 2003, 83, 191–200. [Google Scholar] [CrossRef] [PubMed]
  28. Neves, L.; Pereira, M.A.; Mota, M.; Alves, M.M. Detection and quantification of long chain fatty acids in liquid and solid samples and its relevance to understand anaerobic digestion of lipids. Bioresour. Technol. 2009, 100, 91–96. [Google Scholar] [CrossRef] [Green Version]
  29. Chen, K.; Wang, X.; Li, X.; Qian, J.; Xiao, X. Impacts of sludge retention time on the performance of submerged membrane bioreactor with the addition of calcium ion. Sep. Purif. Technol. 2011, 82, 148–155. [Google Scholar] [CrossRef]
  30. Dubois, M.; Gilles, K.A.; Hamilton, J.K.; Rebers, P.A.; Smith, F. Colorimetric method for determination of sugars and related substances. Anal. Chem. 1956, 28, 350–356. [Google Scholar] [CrossRef]
  31. Frølund, B.; Palmgren, R.; Keiding, K.; Nielsen, P.H. Extraction of extracellular polymers from activated sludge using a cation exchange resin. Water Res. 1996, 30, 1749–1758. [Google Scholar] [CrossRef]
  32. Fadrosh, D.W.; Ma, B.; Gajer, P.; Sengamalay, N.; Ott, S.; Brotman, R.M.; Ravel, J. An improved dual-indexing approach for multiplexed 16S rRNA gene sequencing on the Illumina MiSeq platform. Microbiome 2014, 2, 2049–2618. [Google Scholar] [CrossRef] [PubMed]
  33. Poggi-Varaldo, H.M.; Oleszkiewicz, J.A. Anaerobic composting of municipal solid-waste and waste sludge at high total solids levels. Environ. Technol. 1992, 13, 409–421. [Google Scholar] [CrossRef]
  34. Callaghan, F.J.; Wase, D.A.J.; Thayanithy, K.; Forster, C.F. Continuous co-digestion of cattle slurry with fruit and vegetable wastes and chicken manure. Biomass Bioenergy 2002, 27, 71–77. [Google Scholar] [CrossRef]
  35. Schink, B. Energetics of syntrophic cooperation in methanogenic degradation. Microbiol. Mol. Biol. Rev. 1997, 61, 262–280. [Google Scholar] [PubMed]
  36. de Bok, F.A.M.; Plugge, C.M.; Stams, A.J.M. Interspecies Electron transfer in methanogenic propionate degrading consortia. Water. Res. 2004, 38, 1368–1375. [Google Scholar] [CrossRef] [PubMed]
  37. Zhang, L.; Feng, X.; Zhu, N.; Chen, J. Role of extracellular protein in the formation and stability of aerobic granules. Enzyme Microb. Technol. 2007, 41, 551–557. [Google Scholar] [CrossRef]
  38. Pereira, M.A.; Mota, M.; Alves, M.M. Anaerobic biodegradation of oleic and palmitic acids: Evidence of mass transfer limitations caused by long chain fatty acid accumulation onto the anaerobic sludge. Biotechnol. Bioeng. 2005, 92, 15–23. [Google Scholar] [CrossRef] [PubMed] [Green Version]
  39. Sousa, D.Z.; Smidt, H.; Alves, M.M.; Stams, A.J.M. Syntrophomonas zehnderi sp. nov., an anaerobe that degrades long chain fatty acids in co-culture with Methanobacterium formicicum. Int. J. Syst. Evol. Microbiol. 2007, 57, 609–615. [Google Scholar] [CrossRef]
  40. Ning, Z.F.; Zhang, H.; Li, W.W.; Zhang, R.H.; Liu, G.Q.; Chen, C. Anaerobic digestion of lipid-rich swine slaughterhouse waste: Methane production performance, long-chain fatty acids profile and predominant microorganisms. Bioresour. Technol. 2018, 269, 426–433. [Google Scholar] [CrossRef]
Figure 1. Schematic diagram of the AnMBR reactor.
Energies 12 02673 g001
Figure 2. Reactor performance of the AnMBR reactor under cycle frequencies. (a) The OLRs variation; (b) The biogas production and methane content production; (c) The influent COD, permeate COD and COD removal efficiency variation; (d) VFAs, alkalinity, VFAs/alkalinity and pH variation; (e) The specific VFAs composition; (f) The membrane flux and TMP variation.
Energies 12 02673 g002
Figure 3. Sludge characteristics of the AnMBR under different cycle frequencies. (a) the sludge particle size variation: (b) PN and PS variation in the BEPS.
Energies 12 02673 g003
Figure 4. LCFAs accumulation and distribution of AnMBR reactor under different cycle frequencies.
Energies 12 02673 g004
Figure 5. Relative abundance of bacterial and archaeal communities under different cycle frequencies: (a) genus level of archaea; (b) genus level of bacteria.
Energies 12 02673 g005
Table 1. Performance of the AnMBR at different sludge cycle frequencies (mean ± standard deviation).
ParametersUnitS1S2S3
OLR(kg COD/m3d)10.3 ± 0.712.4 ± 0.918.1 ± 0.5
Permeate COD(mg/L)13,400 ± 13707300 ± 6905200 ± 540
COD removal efficiency(%)86.2 ± 0.890.4 ± 1.396.3 ± 0.6
Biogas production(L/d)190 ± 25310 ± 31520 ± 38
Methane percentage(%)50.3 ± 1.255.2 ± 0.858.4 ± 0.7
VFAs(mg/L)6860 ± 1504780 ± 1101690 ± 130
VFAs/alkalinity-0.68 ± 0.080.45 ± 0.030.17 ± 0.02
pH-6.9 ± 0.17.4 ± 0.17.6 ± 0.1
Acetate(mg/L)3100 ± 1302800 ± 1401140 ± 160
Propionate(mg/L)1150 ± 125580 ± 88172 ± 26
Butyrate(mg/L)1250 ± 90620 ± 96188 ± 35
Table 2. The sludge characteristics of the AnMBR at different sludge cycle frequencies (mean ± standard deviation).
ParametersUnitS1S2S3
average particle sizes(μm)22.8 ± 0.6 a22.4 ± 0.8 a22.9 ± 0.7 a
7.0 ± 0.4 b6.8 ± 0.2 c6.1 ± 0.3 d
6.9 ± 0.3 e7.1 ± 0.1 e7.0 ± 0.2 e
PN(mg/g VSS)31.3 ± 6.549.2 ± 5.464.5 ± 5.9
PS(mg/g VSS)15.2 ± 2.316.8 ± 2.117.1 ± 2.5
PN/PS--2.0 ± 0.212.9 ± 0.303.8 ± 0.28
a at the start-up stage of the three reactors; b,c,d at the 70th day, 50th day, 30th day in the S1, S2, S3, respectively; e at the late operation stage of the three reactors.

