Investigations on Performance Enhancement Measures of the Bidirectional Converter in PV–Wind Interconnected Microgrid System

 ,
,  ,
,  ,
, 
Abstract
1. Introduction
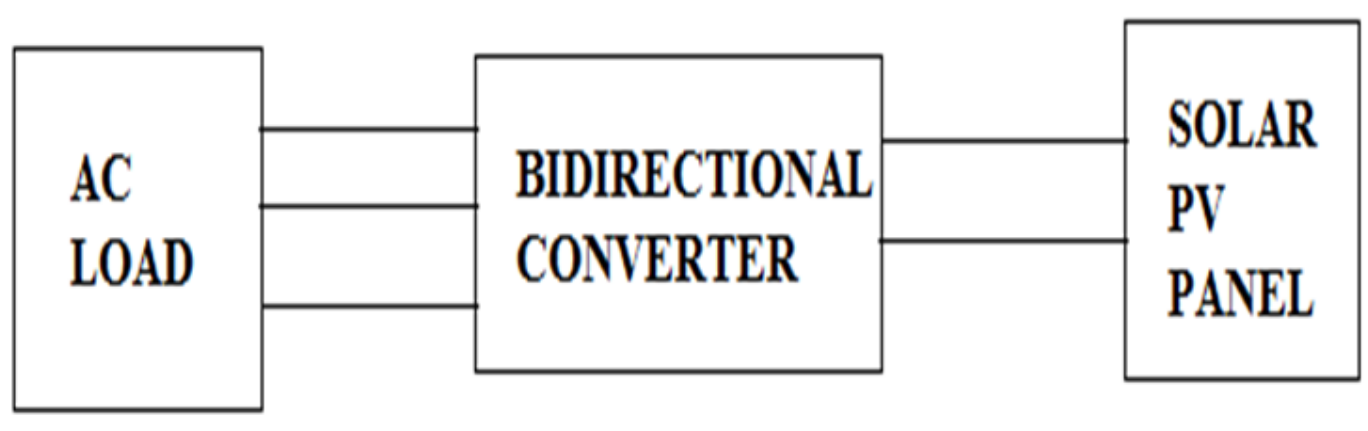
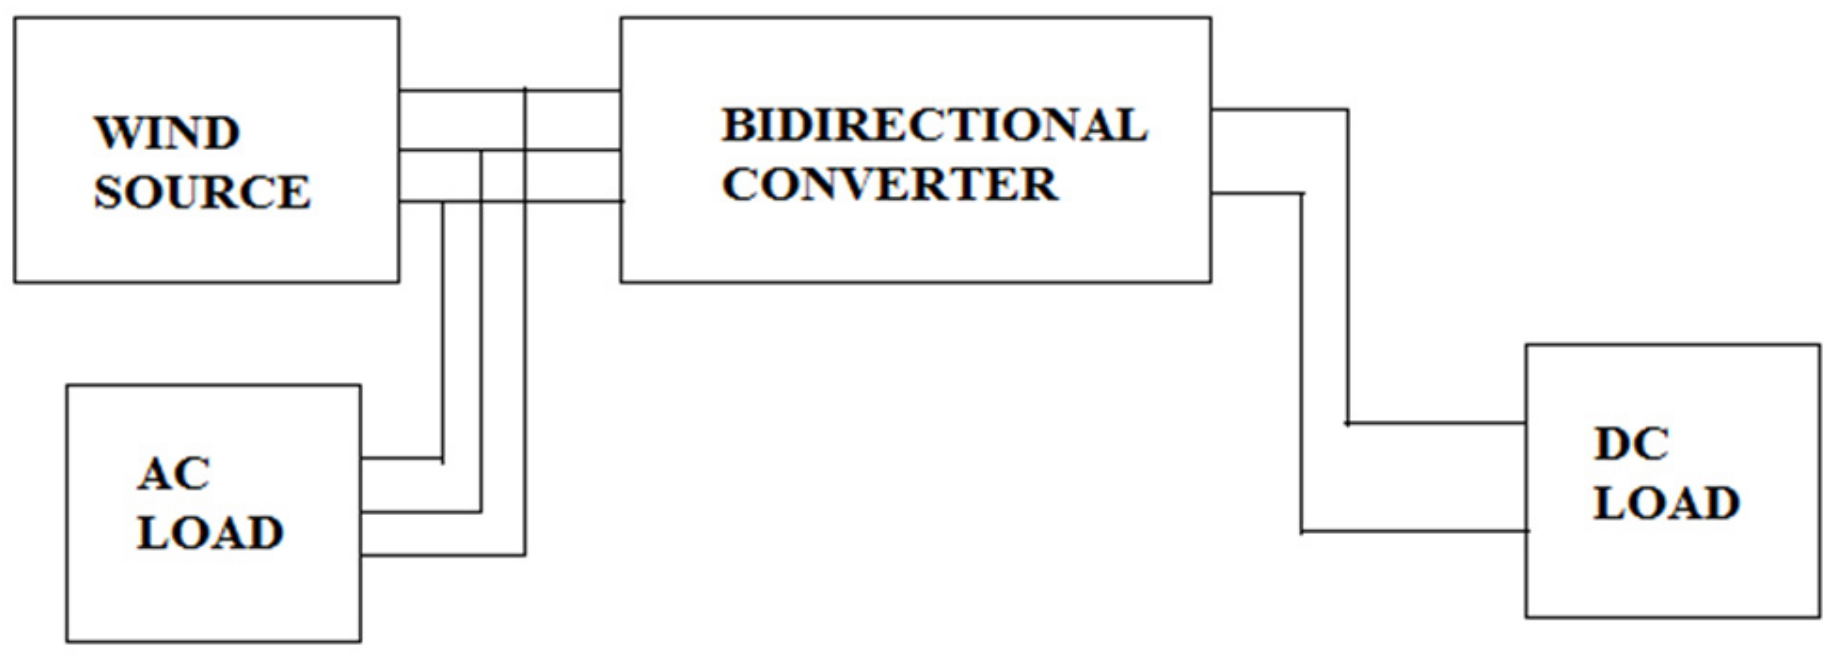
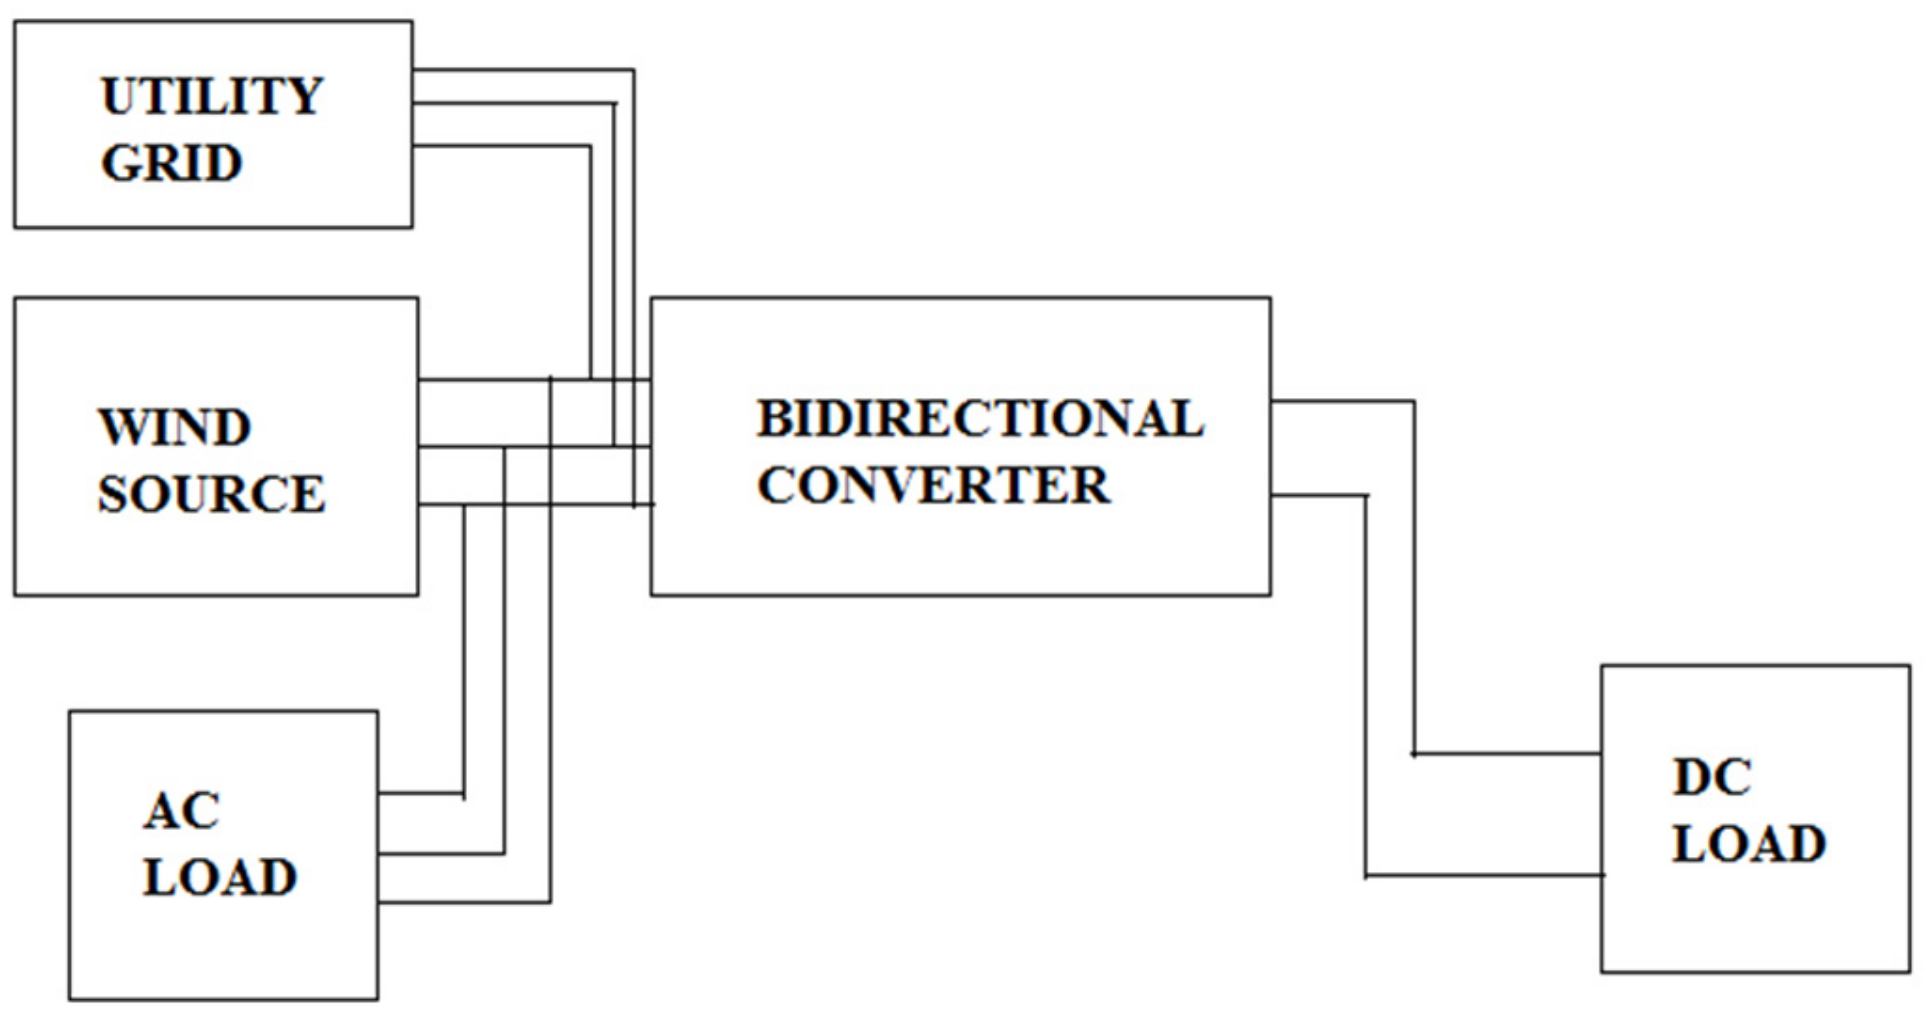
- Build a hybrid AC/DC microgrid along with a low-cost bidirectional converter to counter repetitive conversions and optimal load management strategy. The low-cost bidirectional converter was included to allow the battery to recharge, battery energy infusion into the AC network, and battery energy for AC power control adjustment.
- Develop a novel programmed unified microgrid controller in charge of checking the steady expansion of new loads guaranteeing a highlight, while the AC system was integrated with a permanent magnet synchronous generator (PMSG)-based WT, and the DC system was integrated with a maximum power point tracker (MPPT)-integrated PV system.
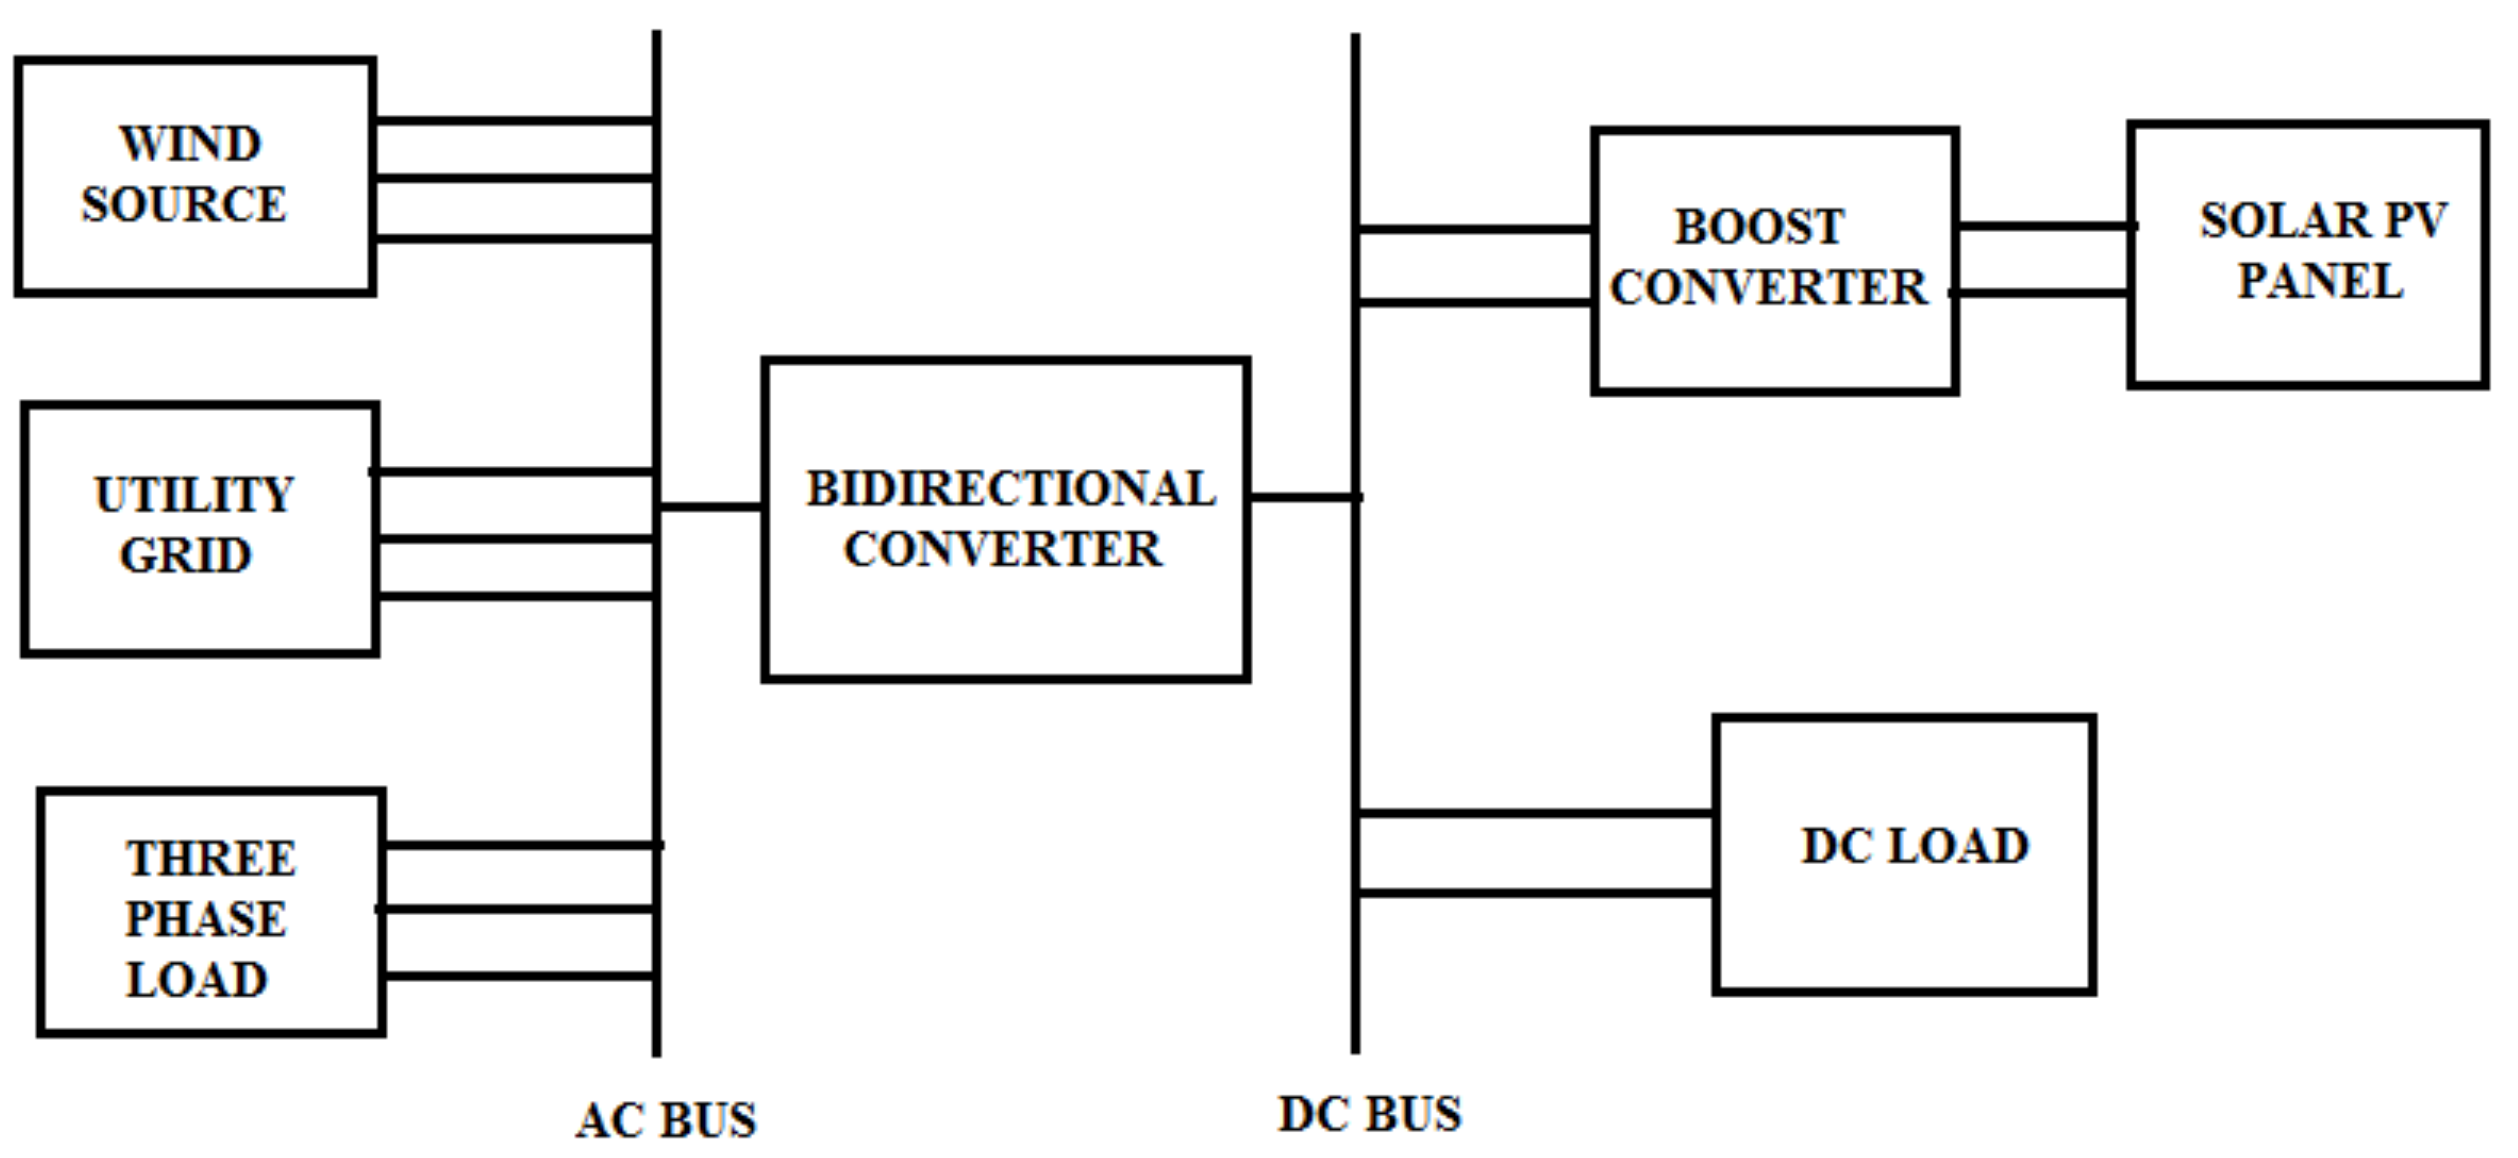
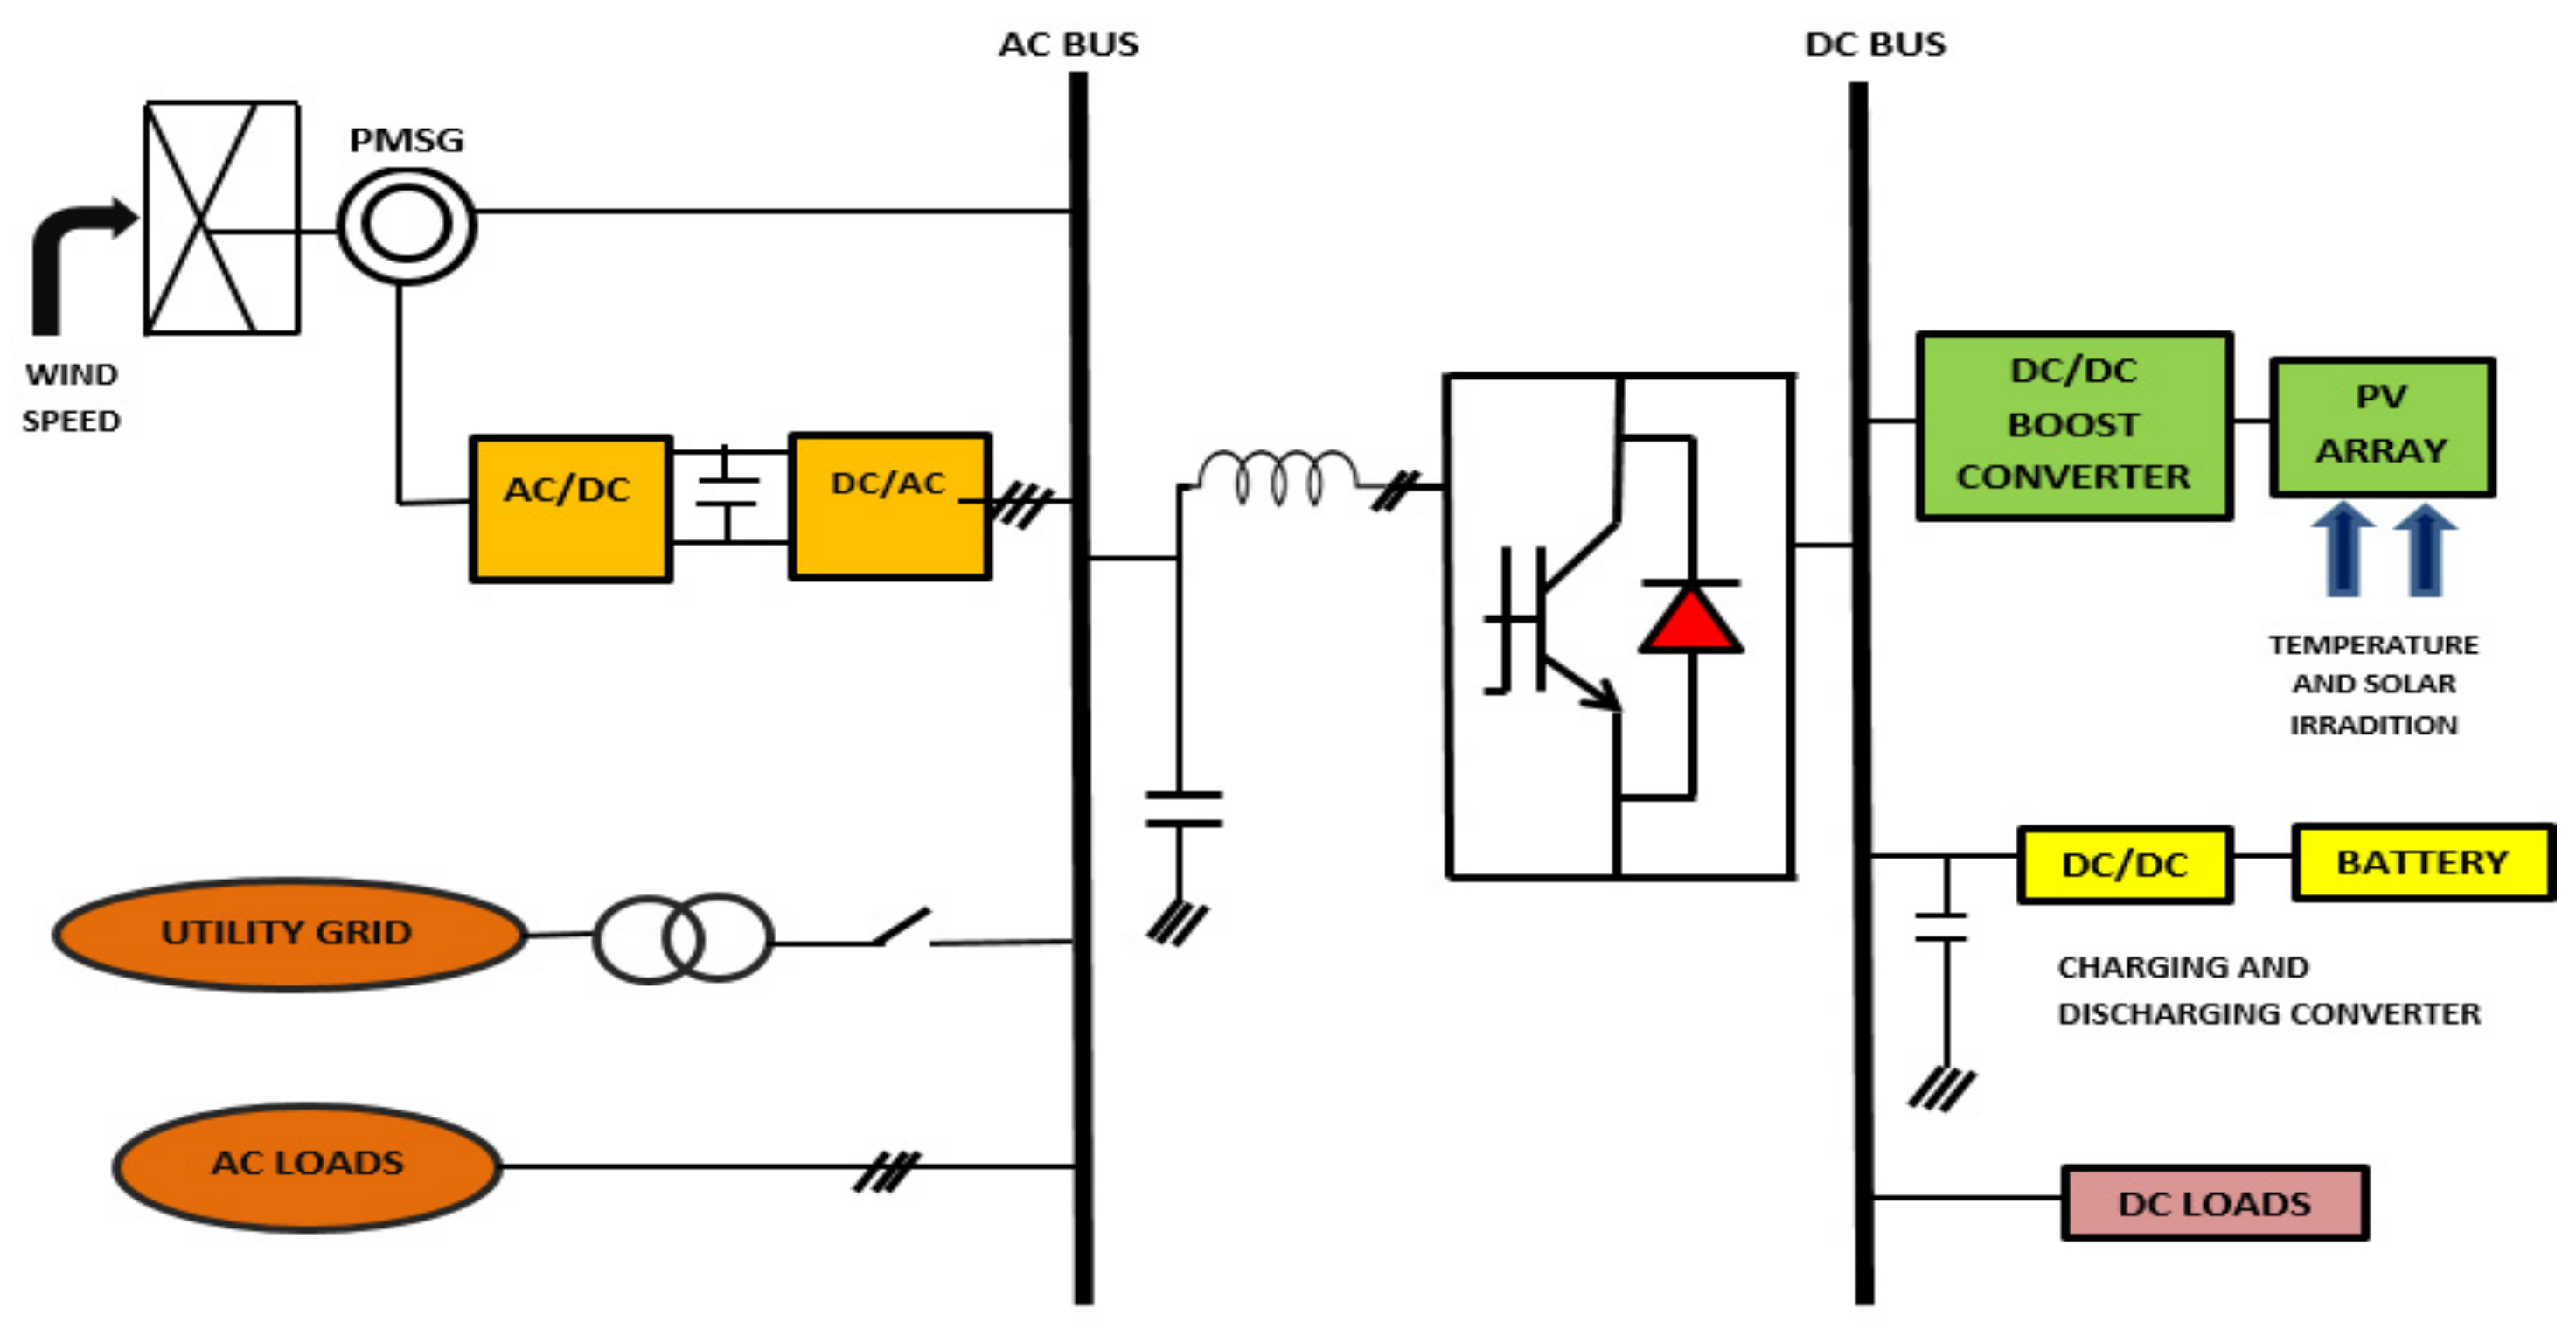
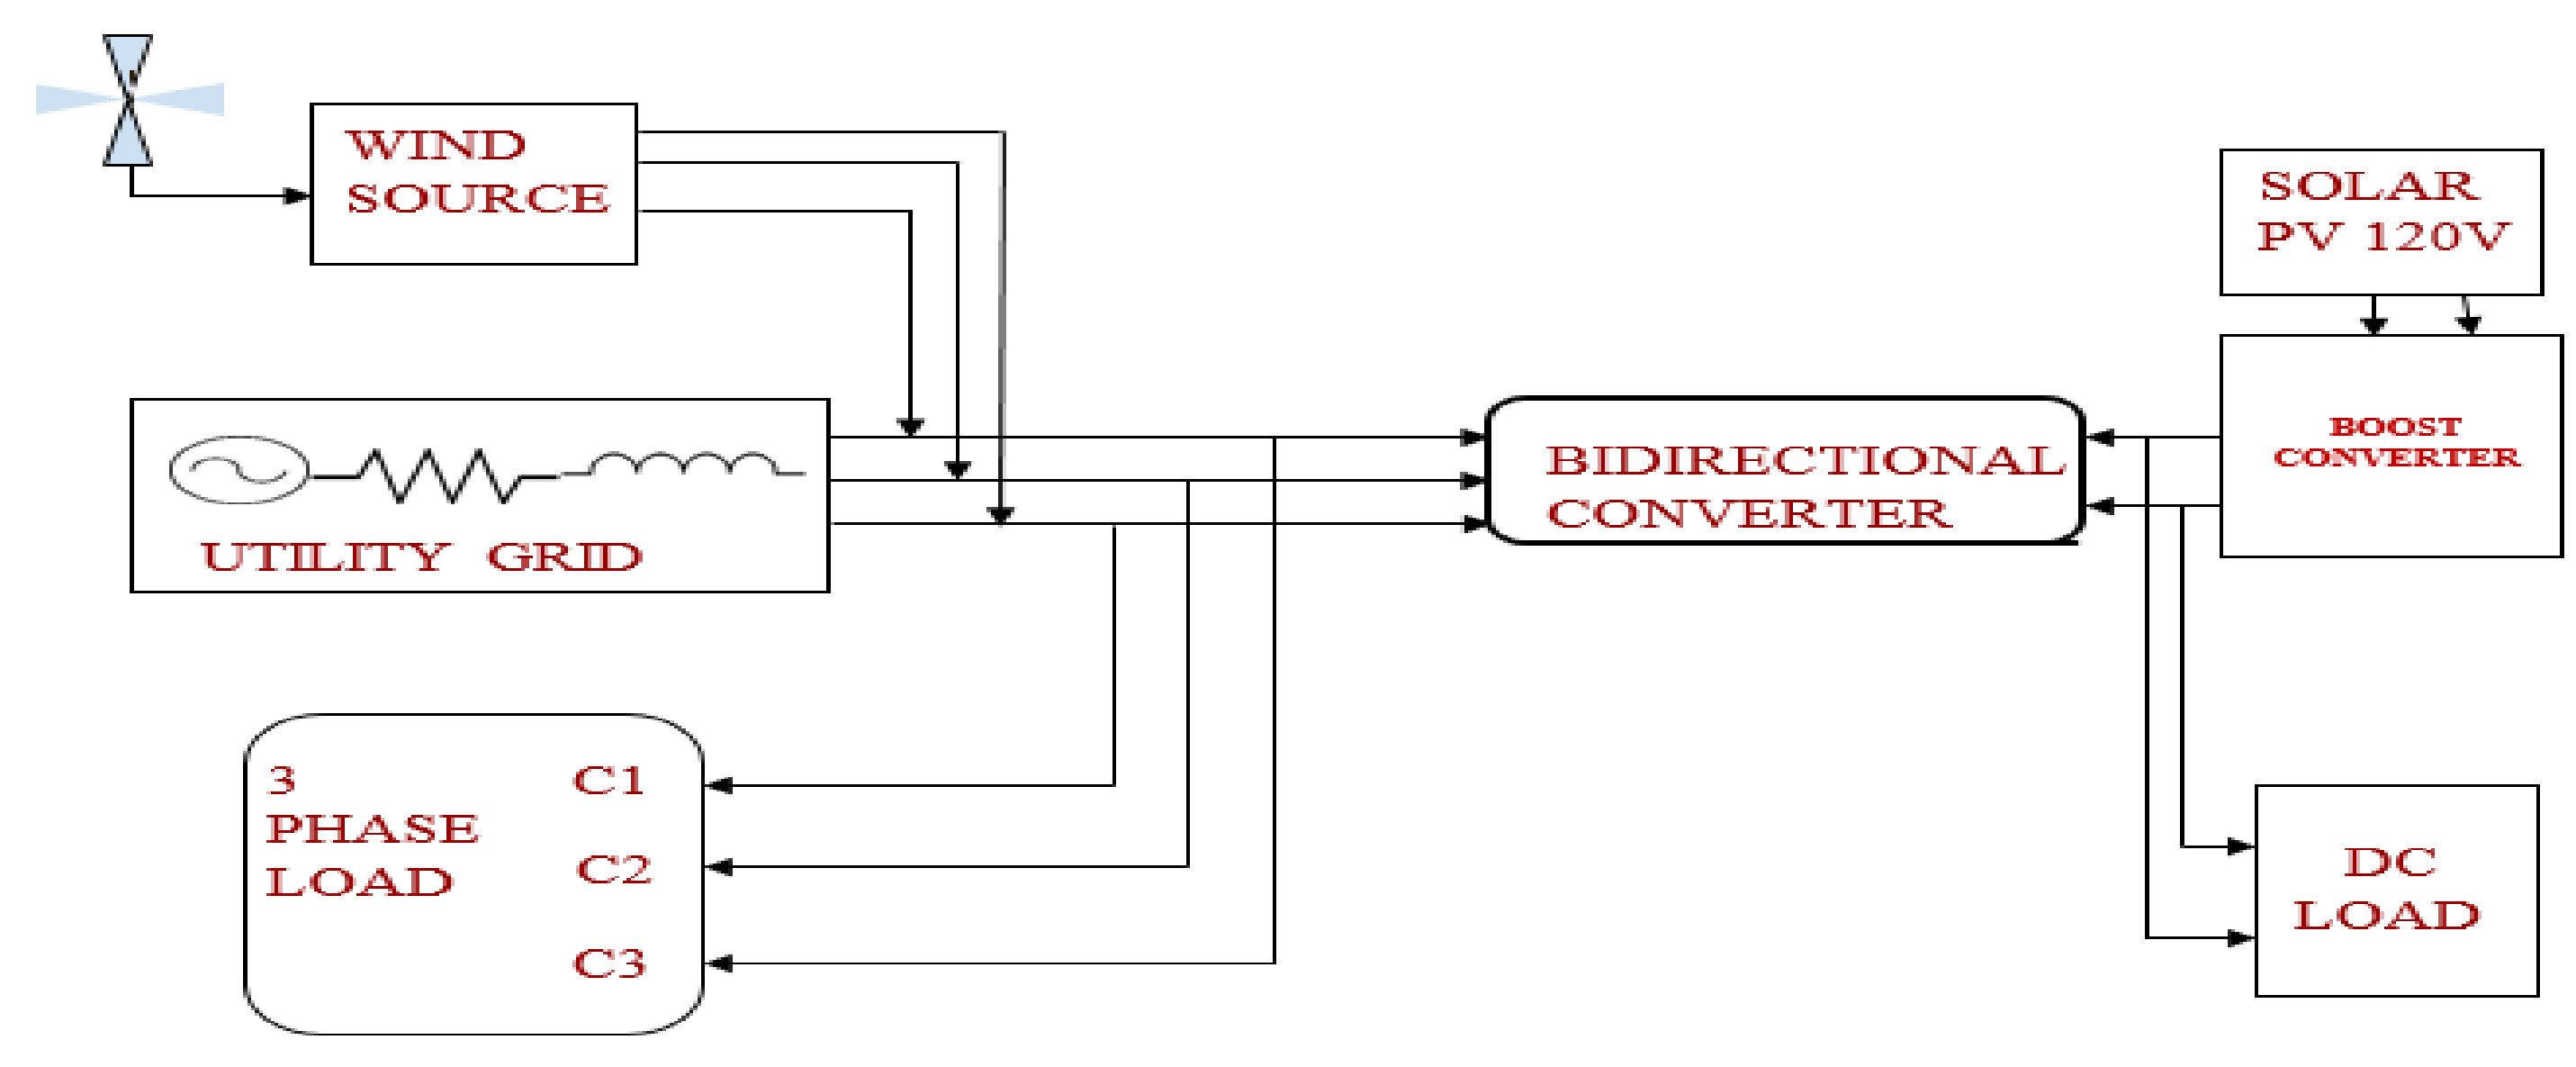
2. Methodology for Hybrid Microgrid Architecture
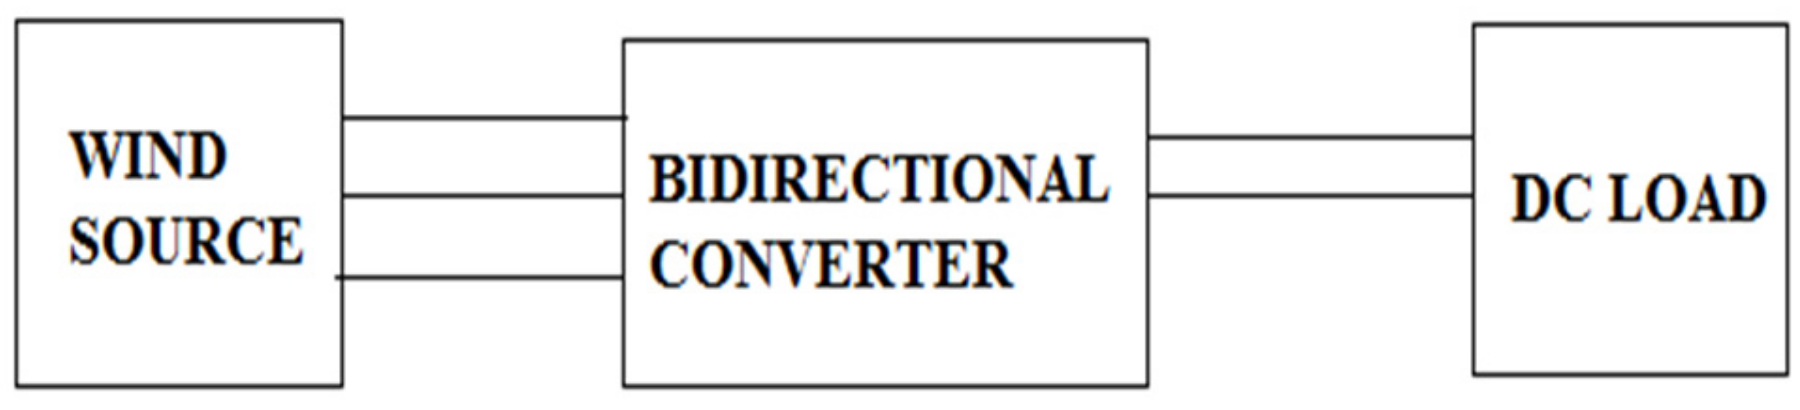
2.1. Renewable Sources and Bidirectional Converter
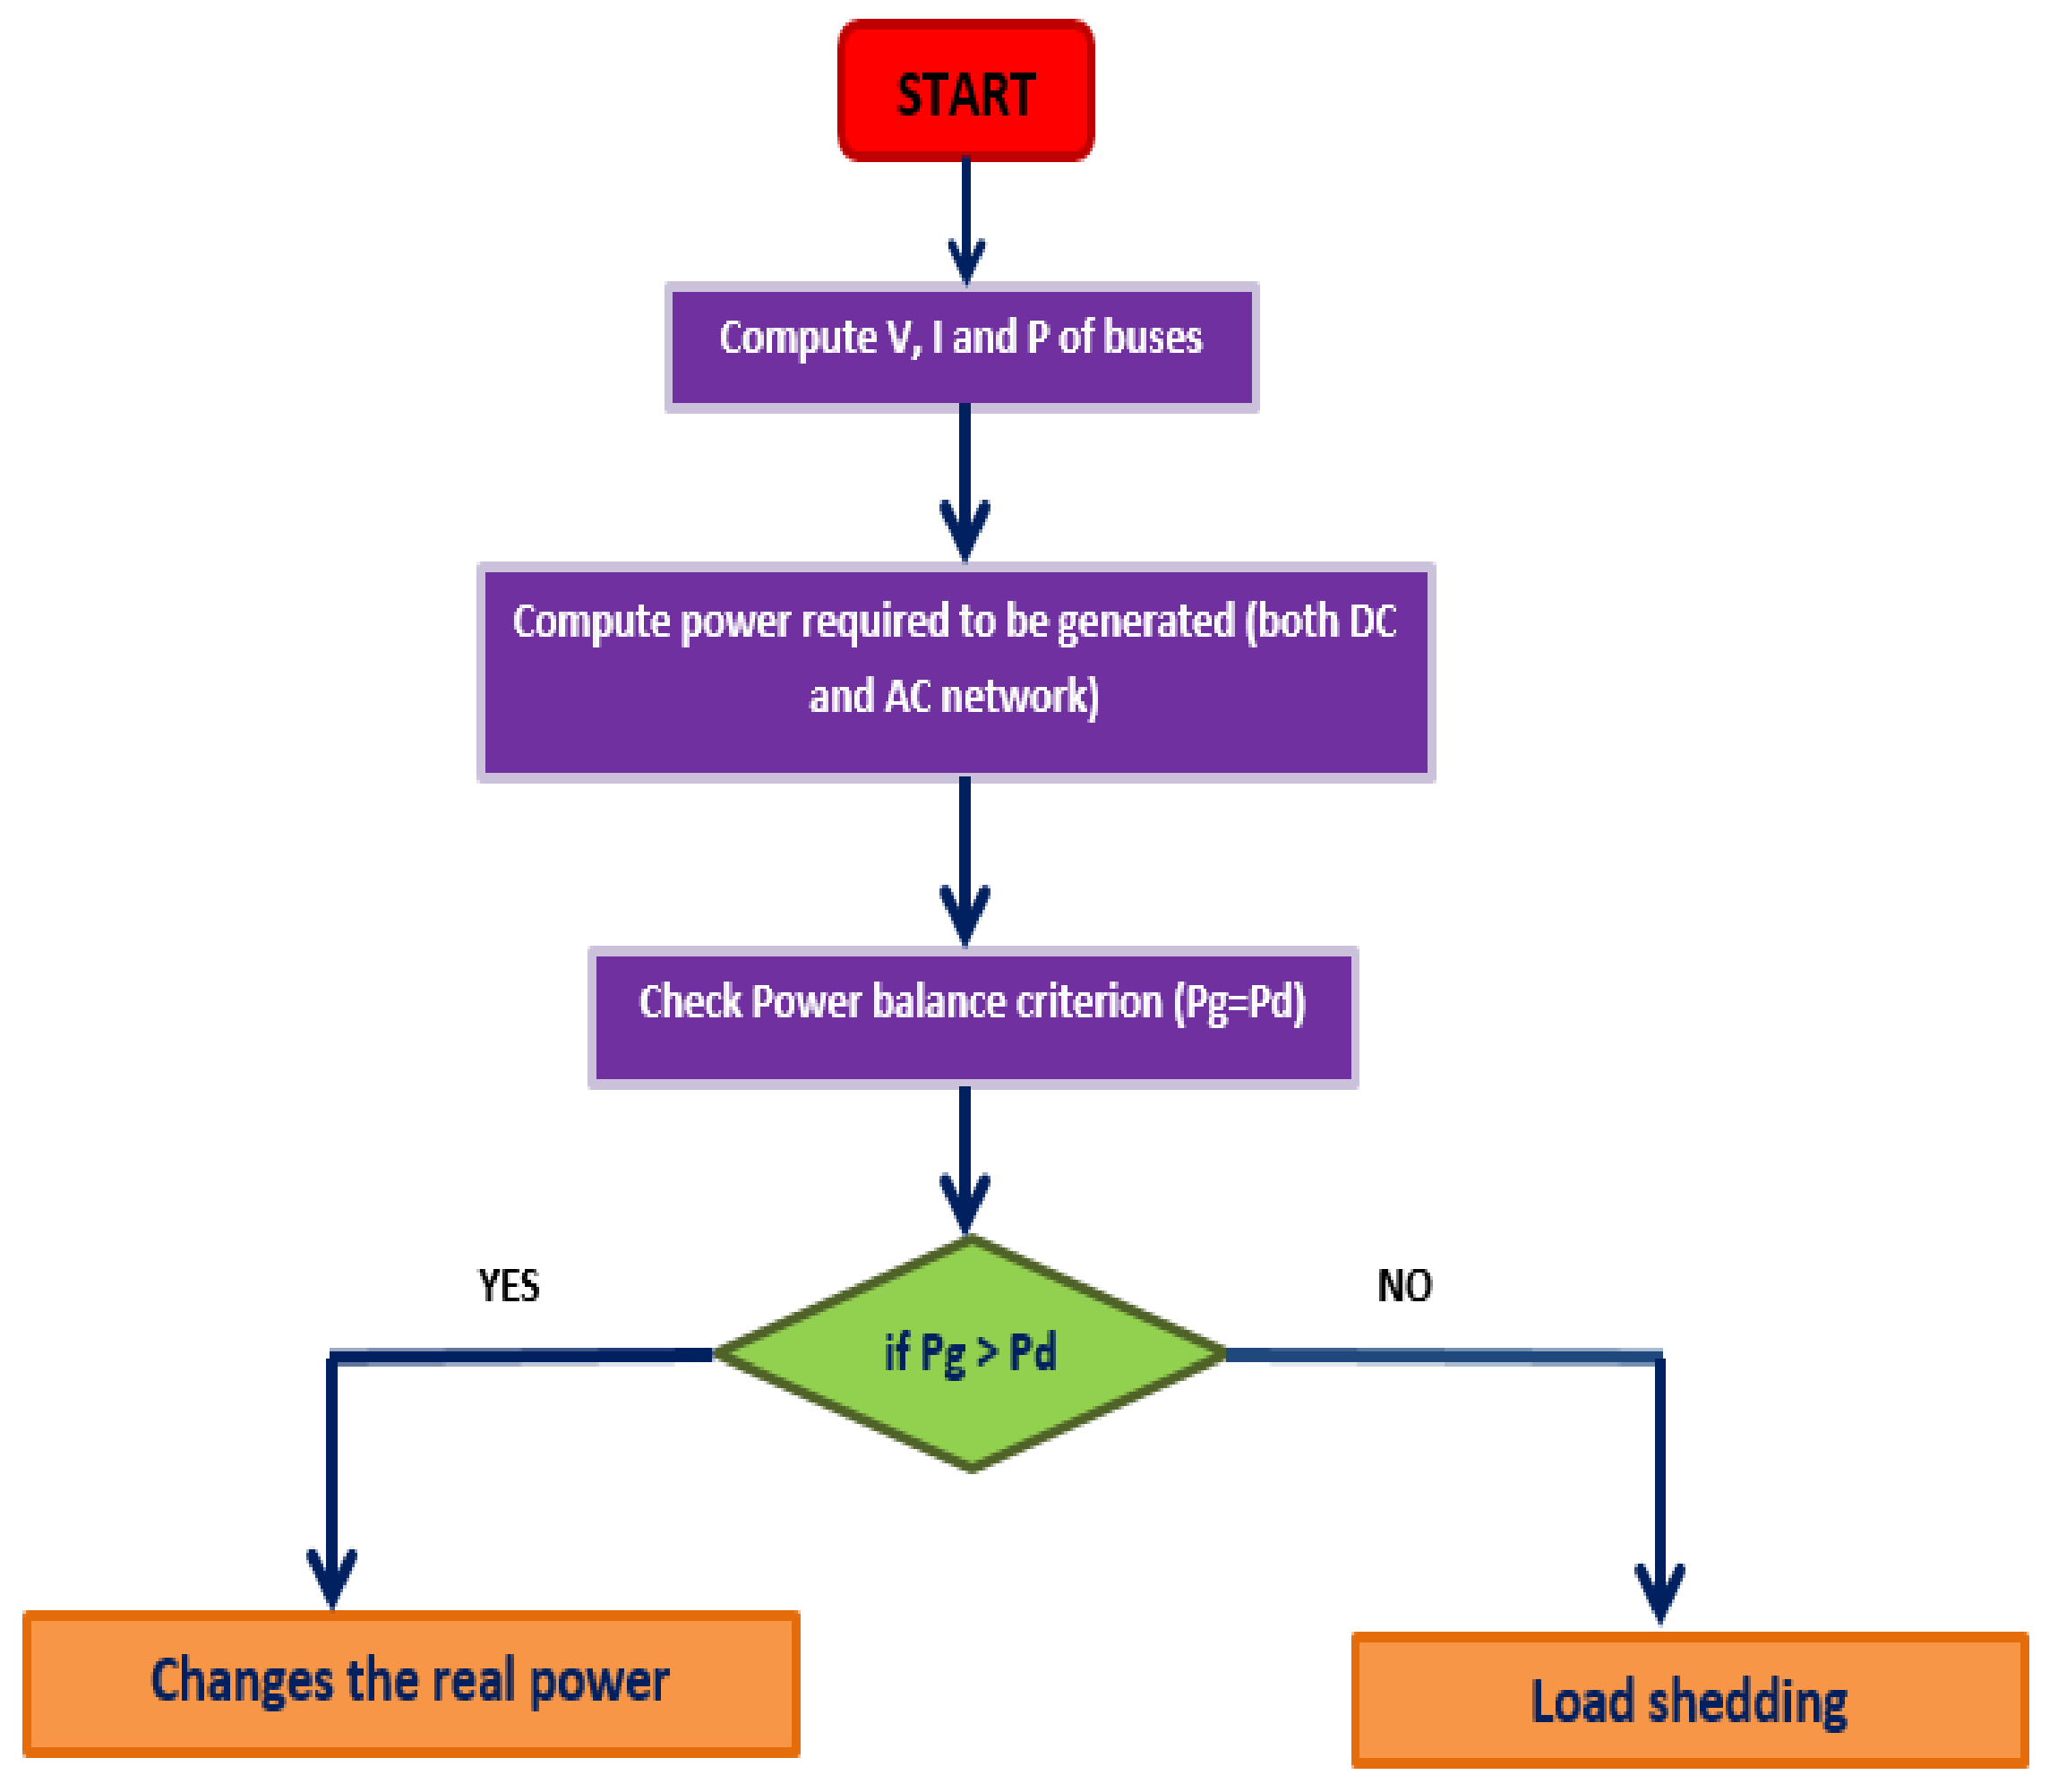
2.2. Optimal Load Management Algorithm
- Step 1
- Start the process of computation.
- Step 2
- Collect the information relating to voltage, current, and power values of both AC and DC bus.
- Step 3
- Compute power required to be generated on both sides of the network.
- Step 4
- Check the power balance criterion.
- Step 5
- If Pg > Pd, then change the real power reference value.
- Step 6
- If Pg < Pd, then load shedding will take place.
- Step 7
- If Pg = Pd, the system is balanced, then jump onto step 8 or else jump on to step 5.
- Step 8
- Stop.
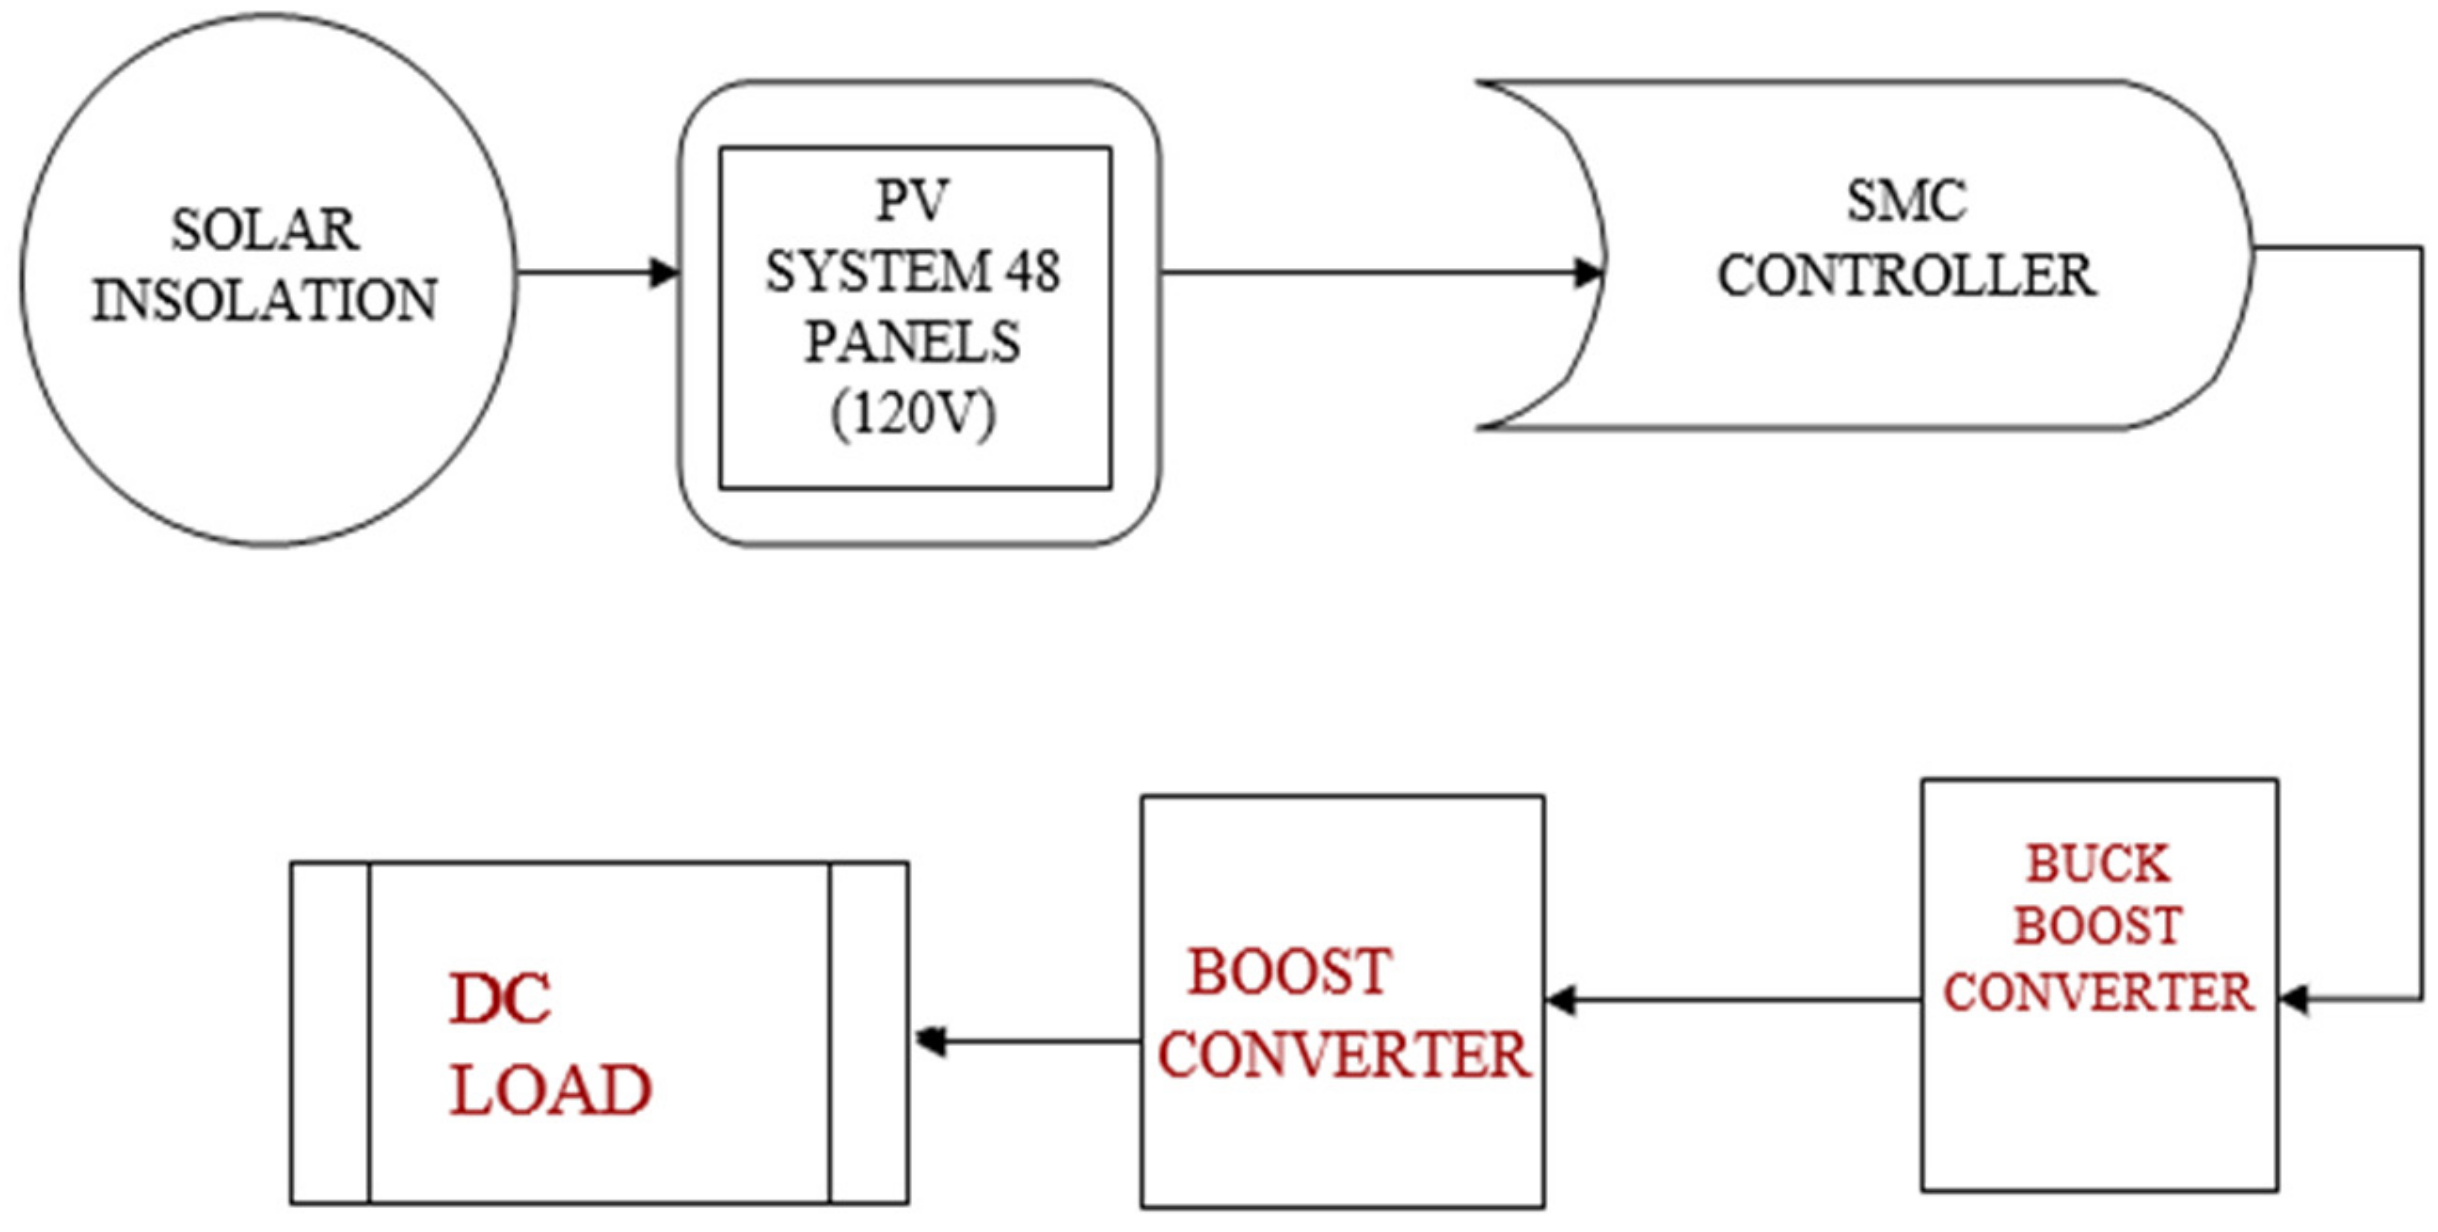
2.2.1. Modelling of PV System
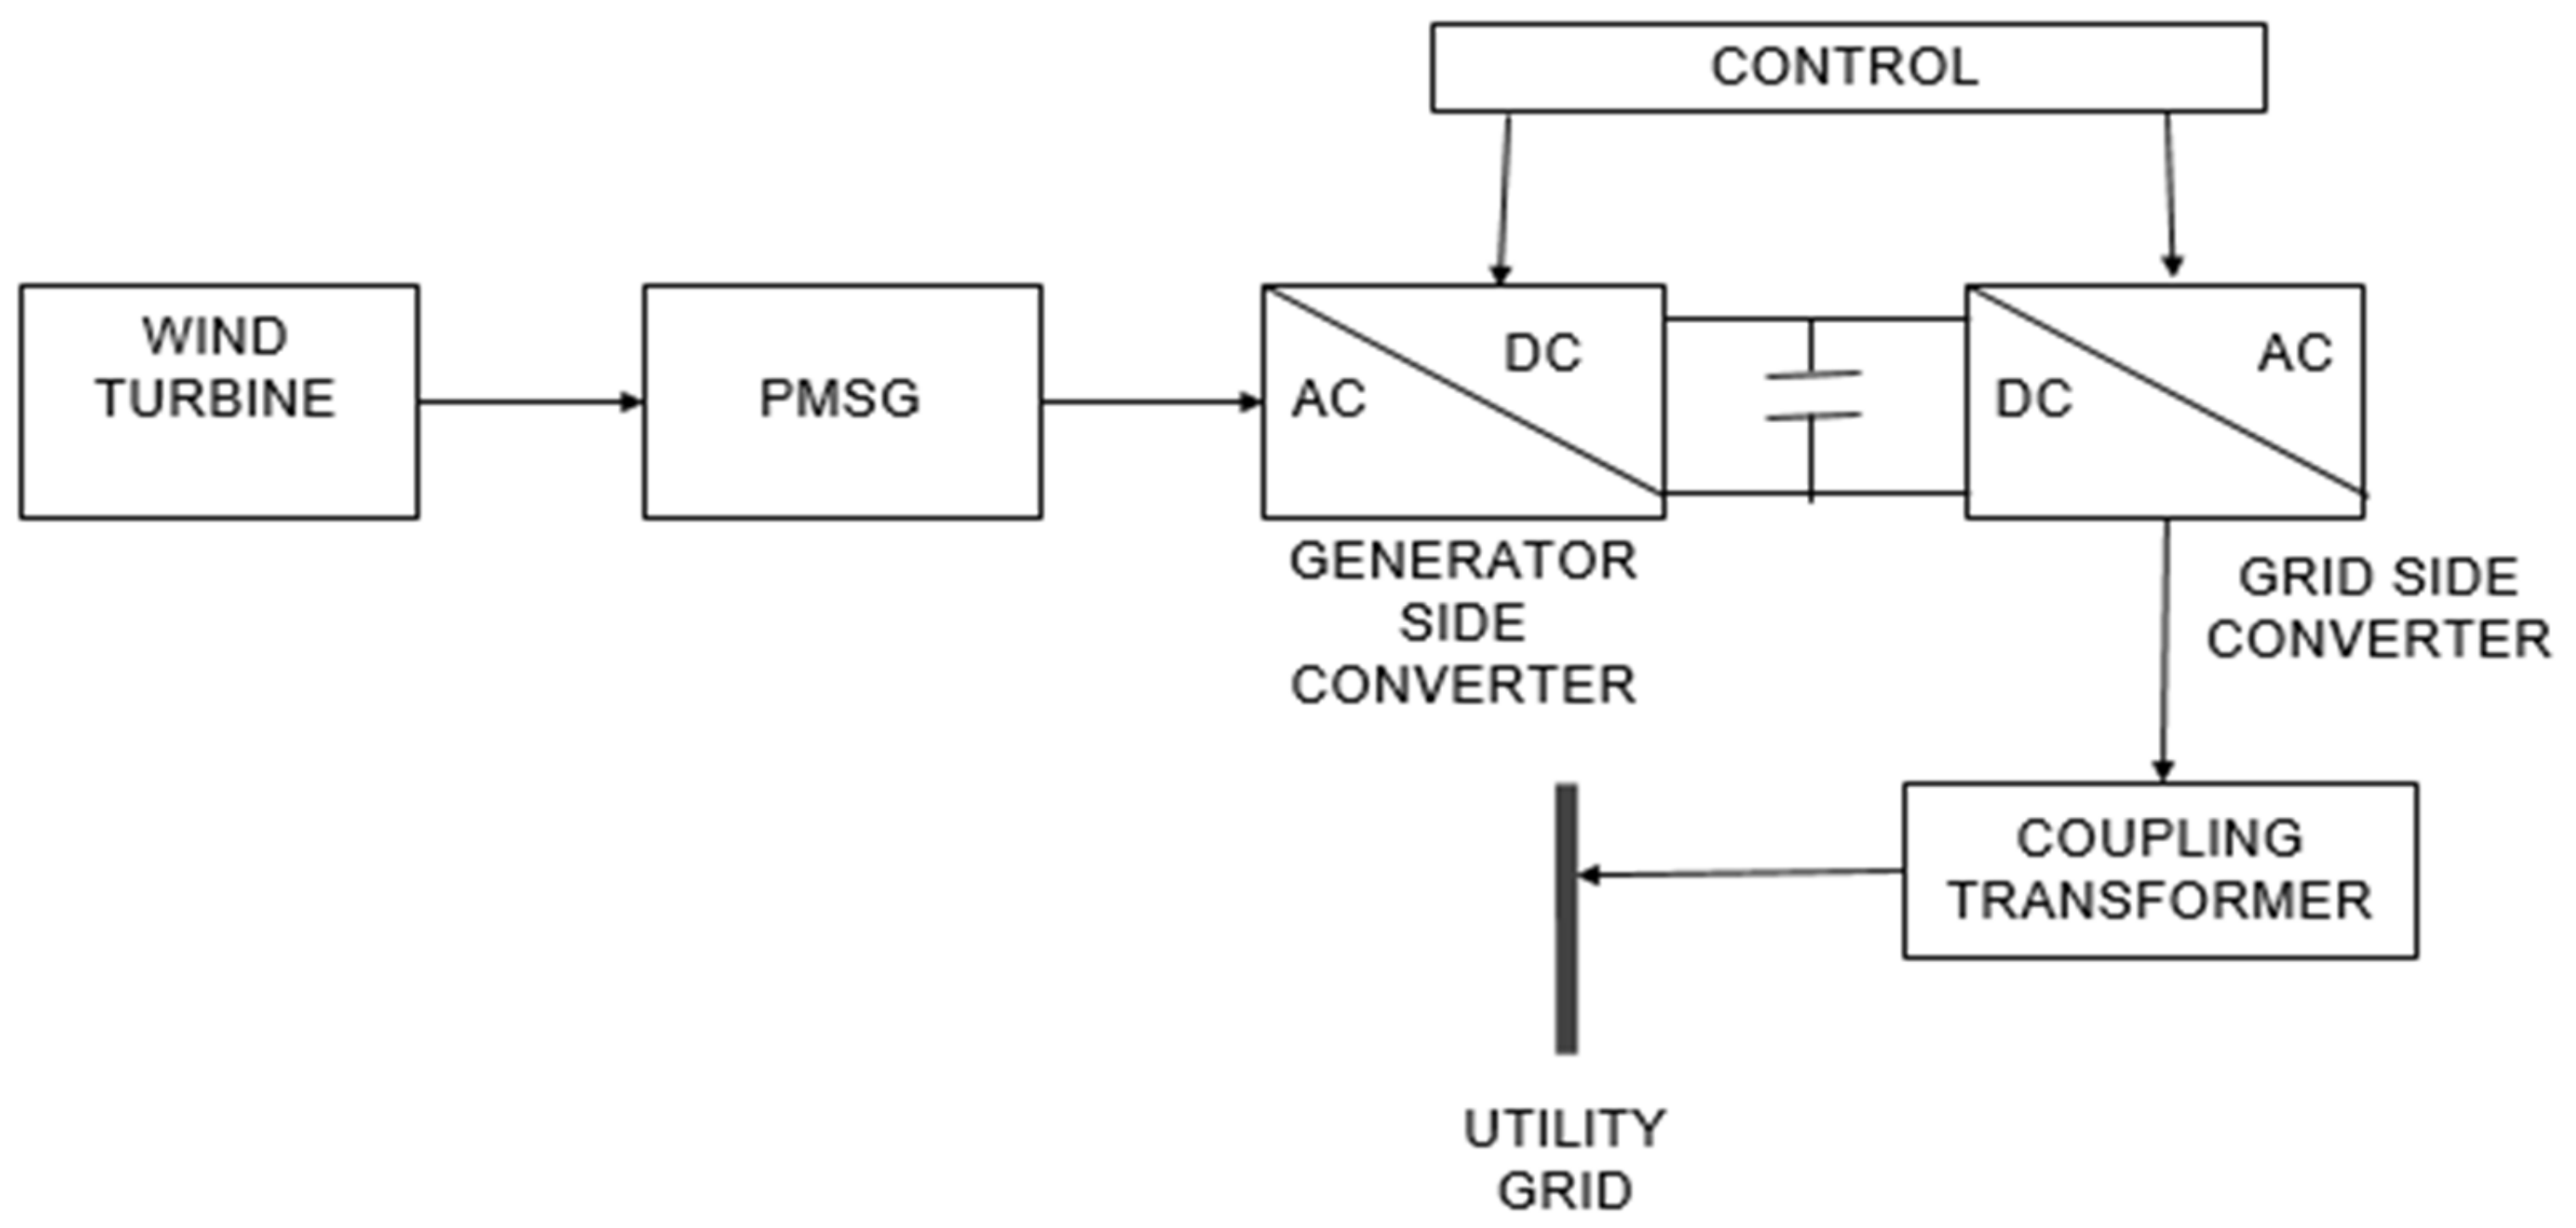
2.2.2. Modelling of Wind Power System
3. Simulation Results and Discussion
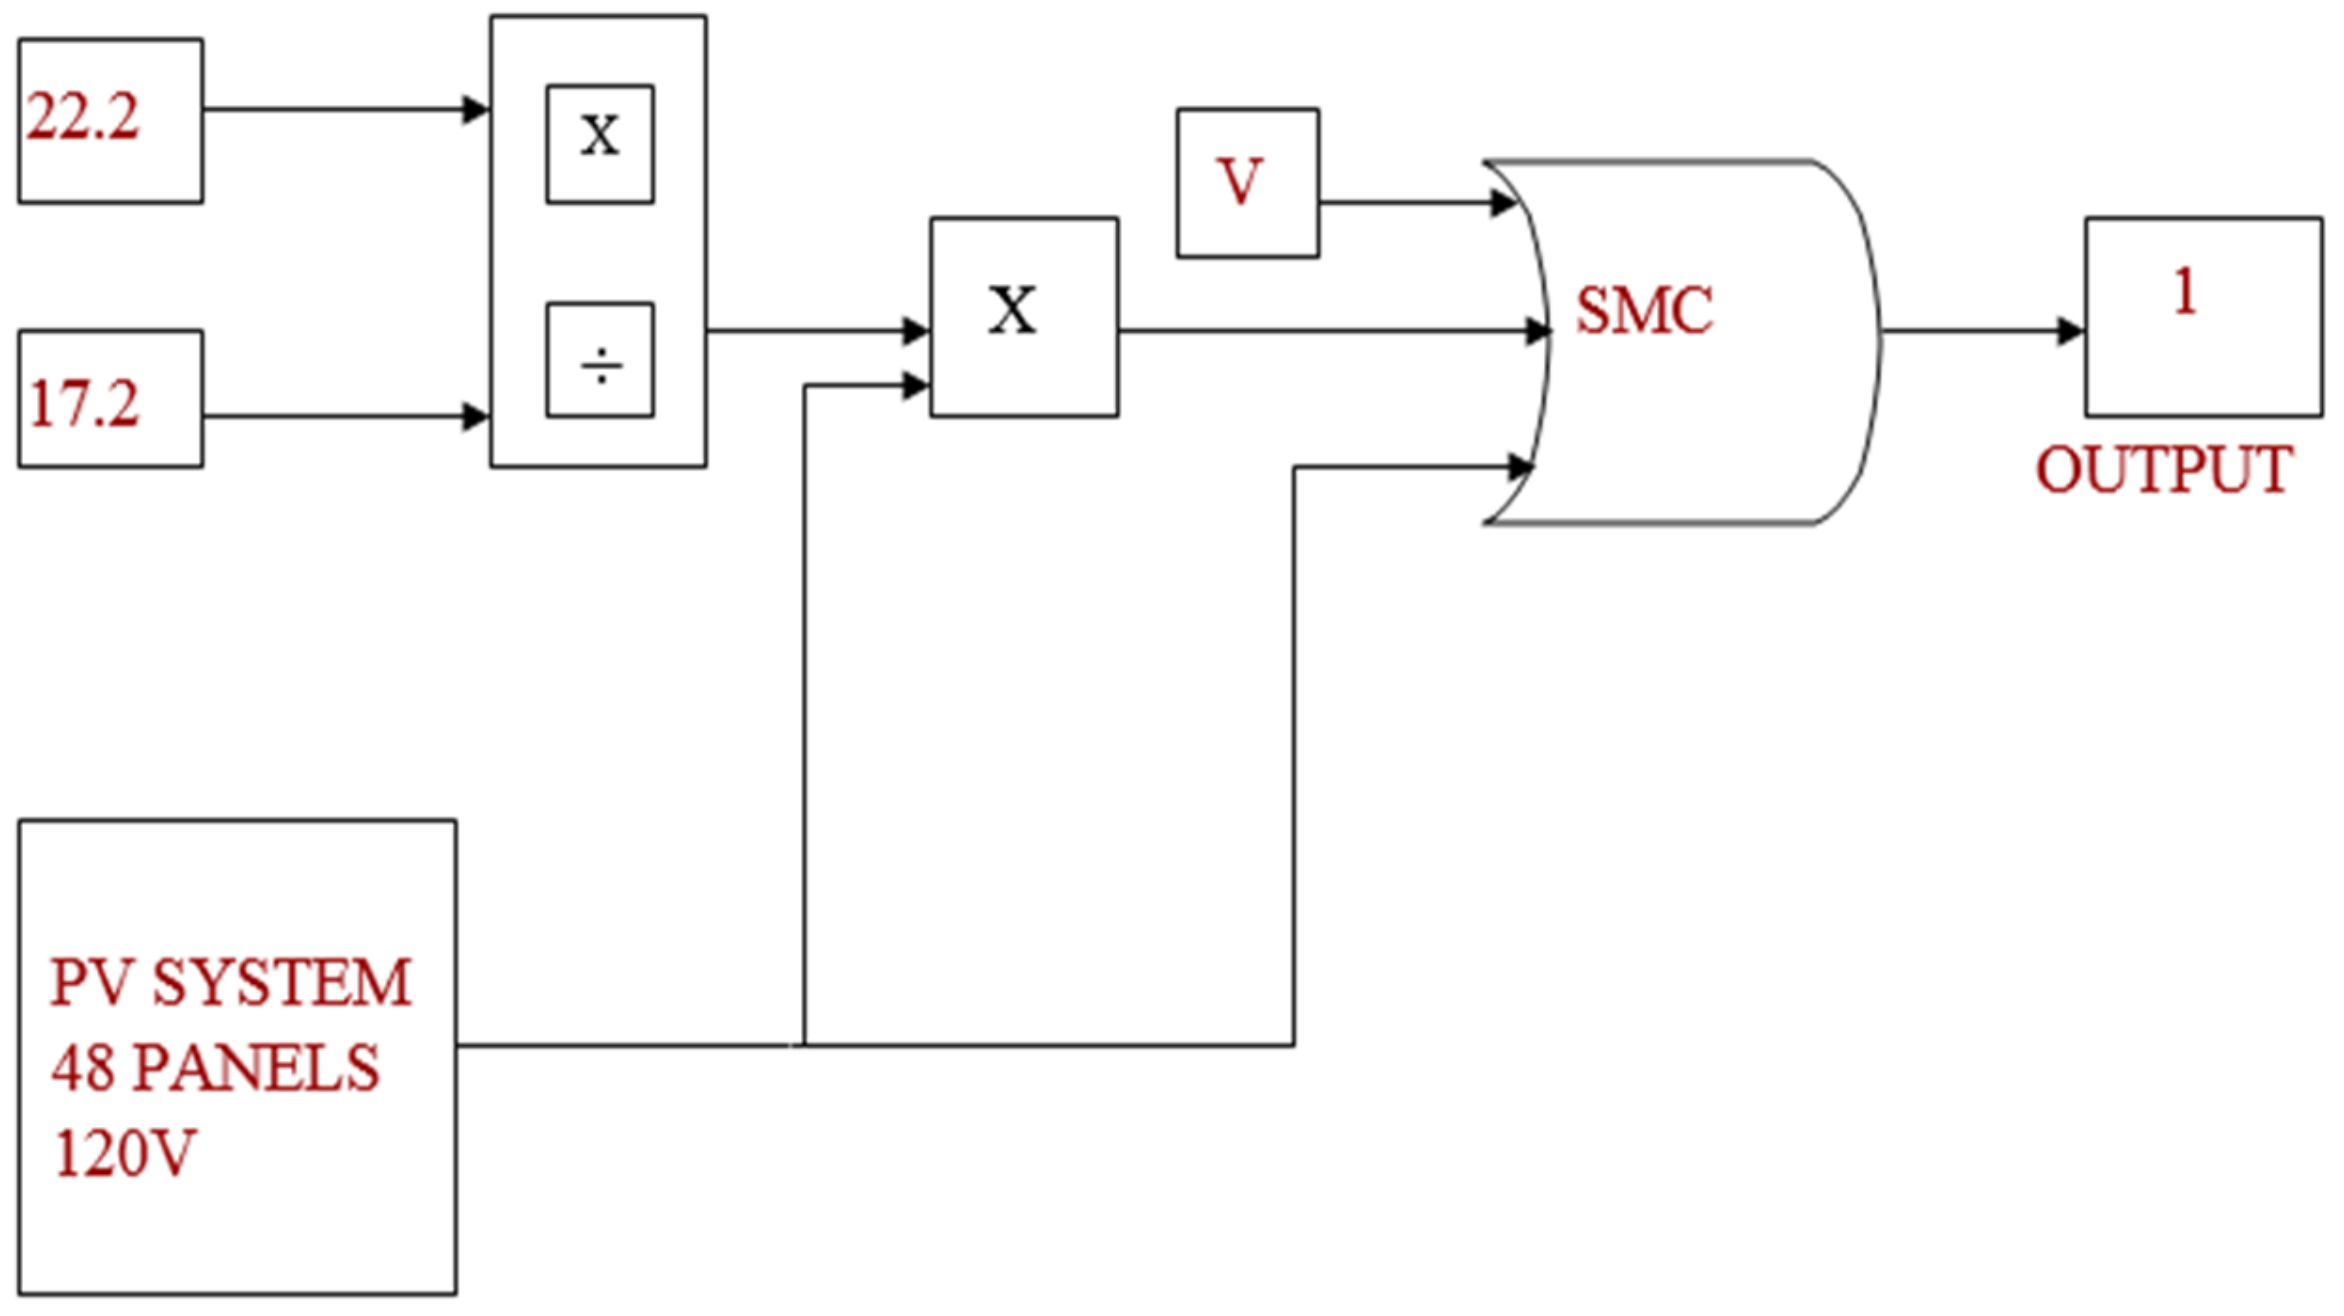
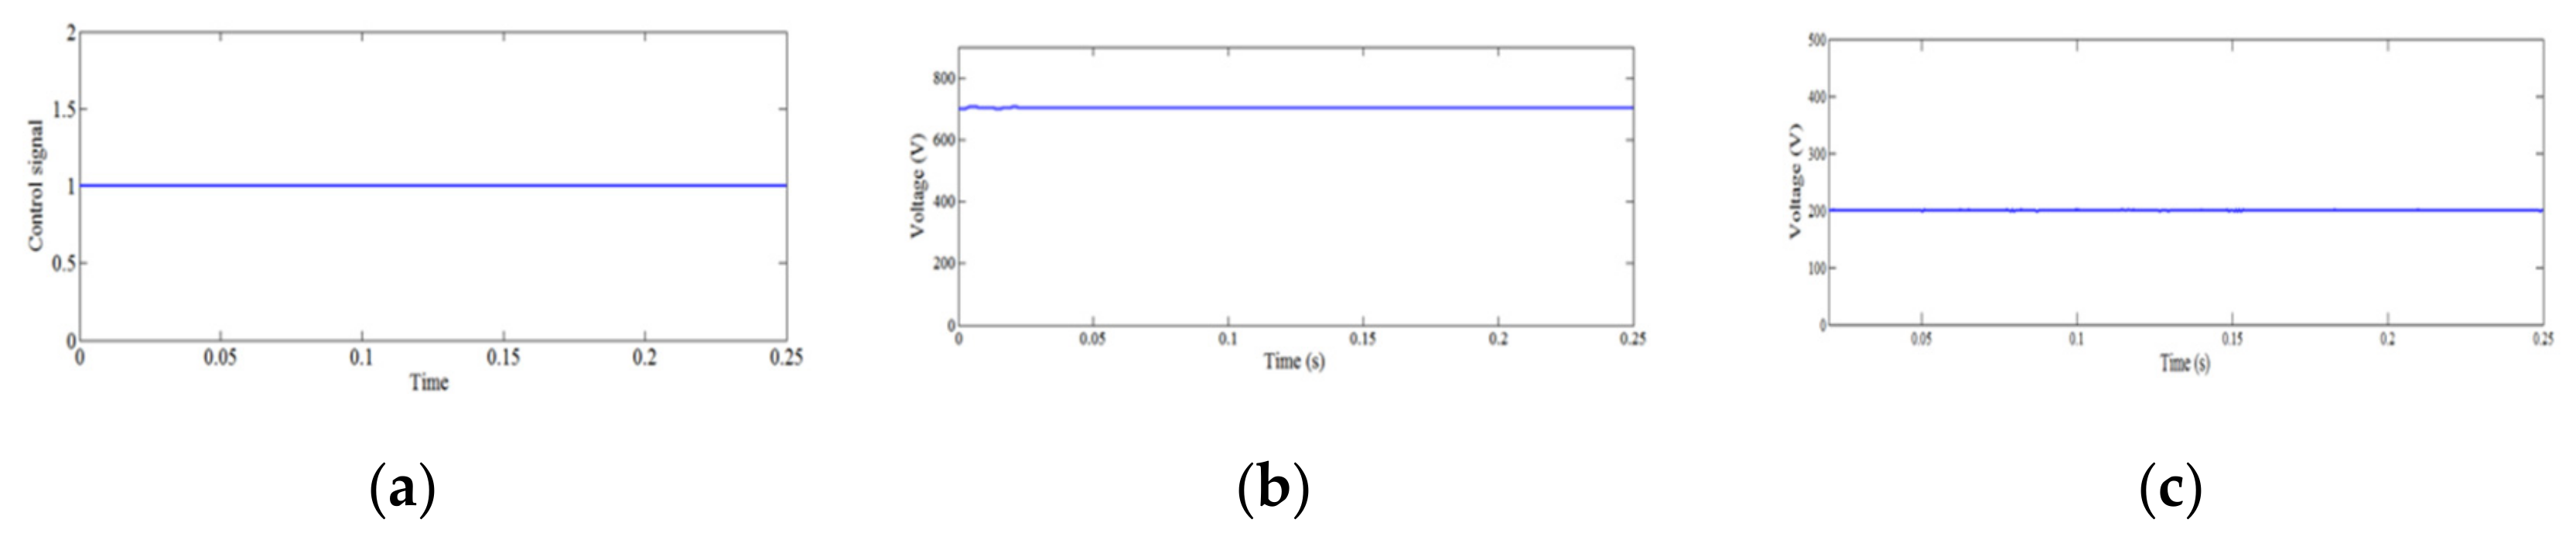
3.1. PV Integrated with Maximum Power Point Tracking
- Inner sliding mode loop (fast loop);
- Outer loop (slow loop).
- Case 1
- If terminal voltage < optimal voltage, then output = 0.
- Case 2
- If terminal voltage > optimal voltage, then output = 1.
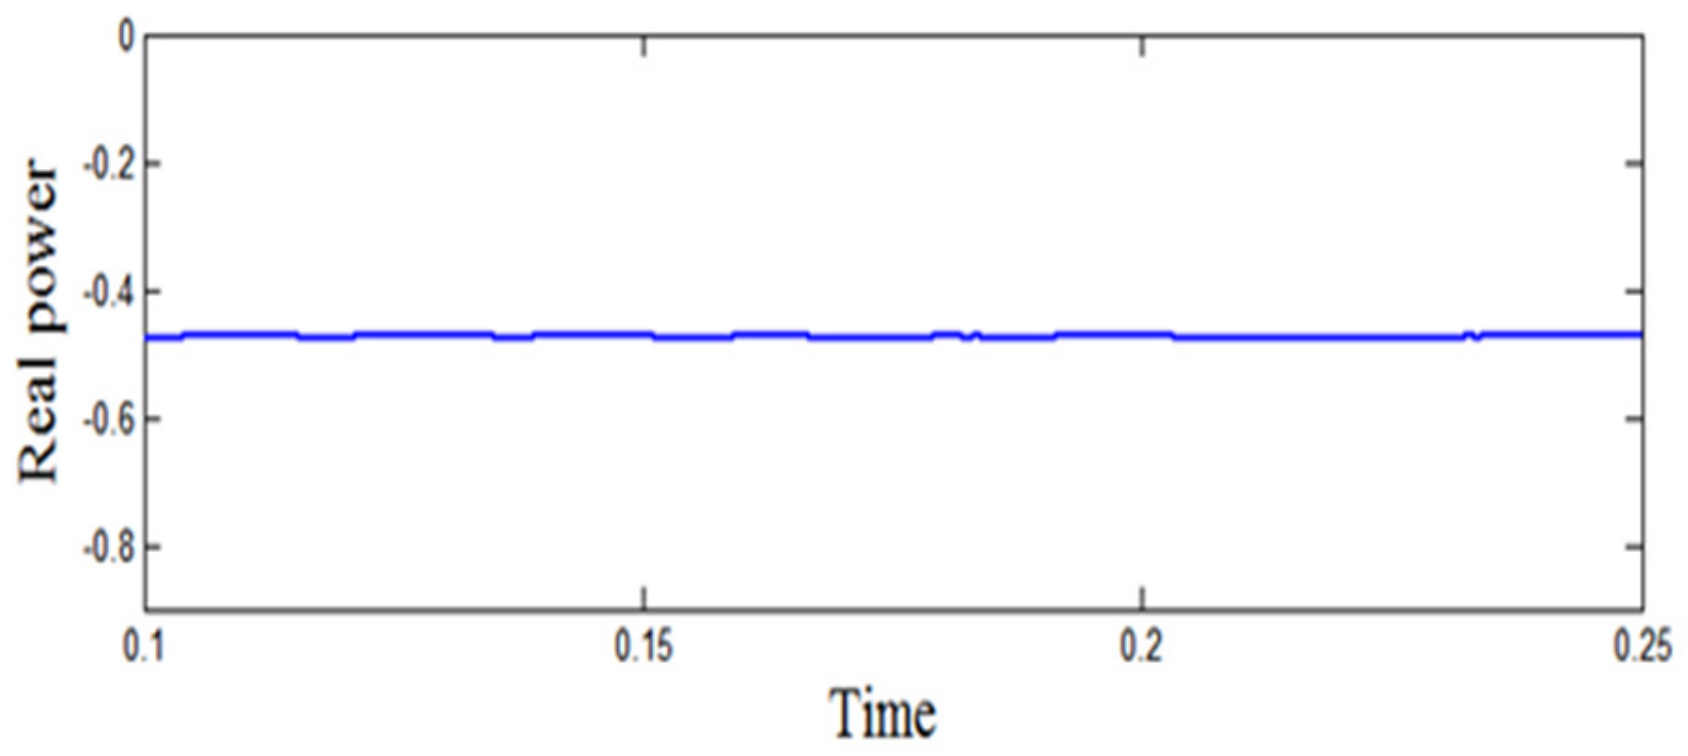
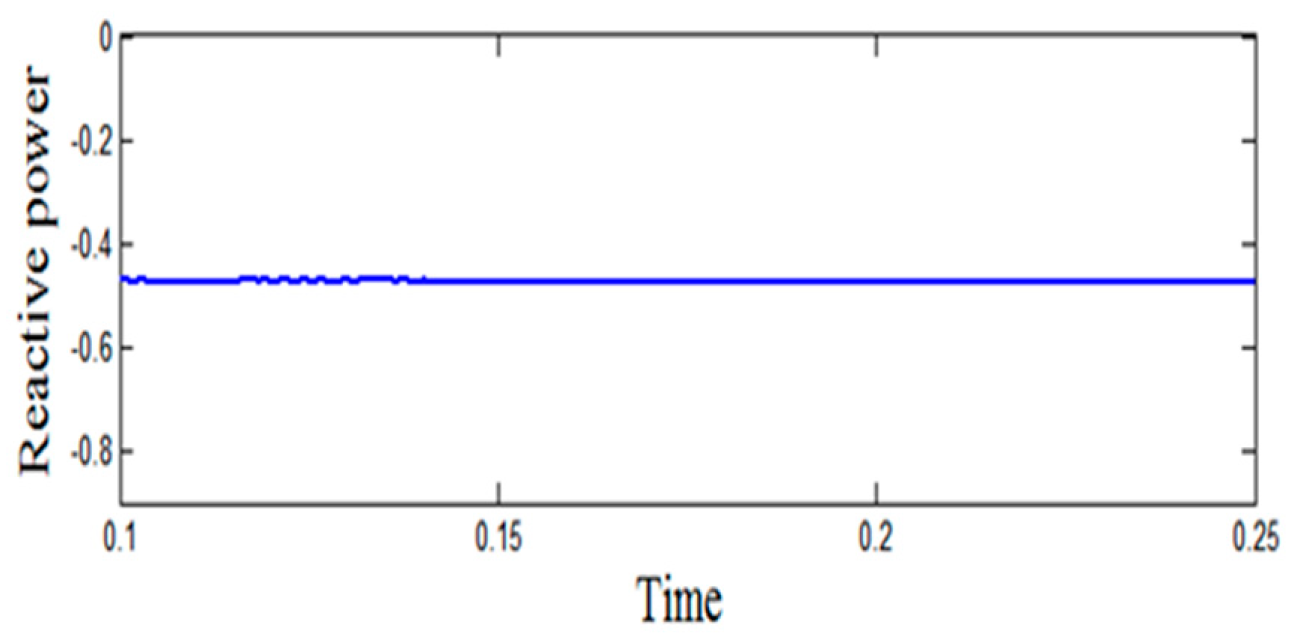
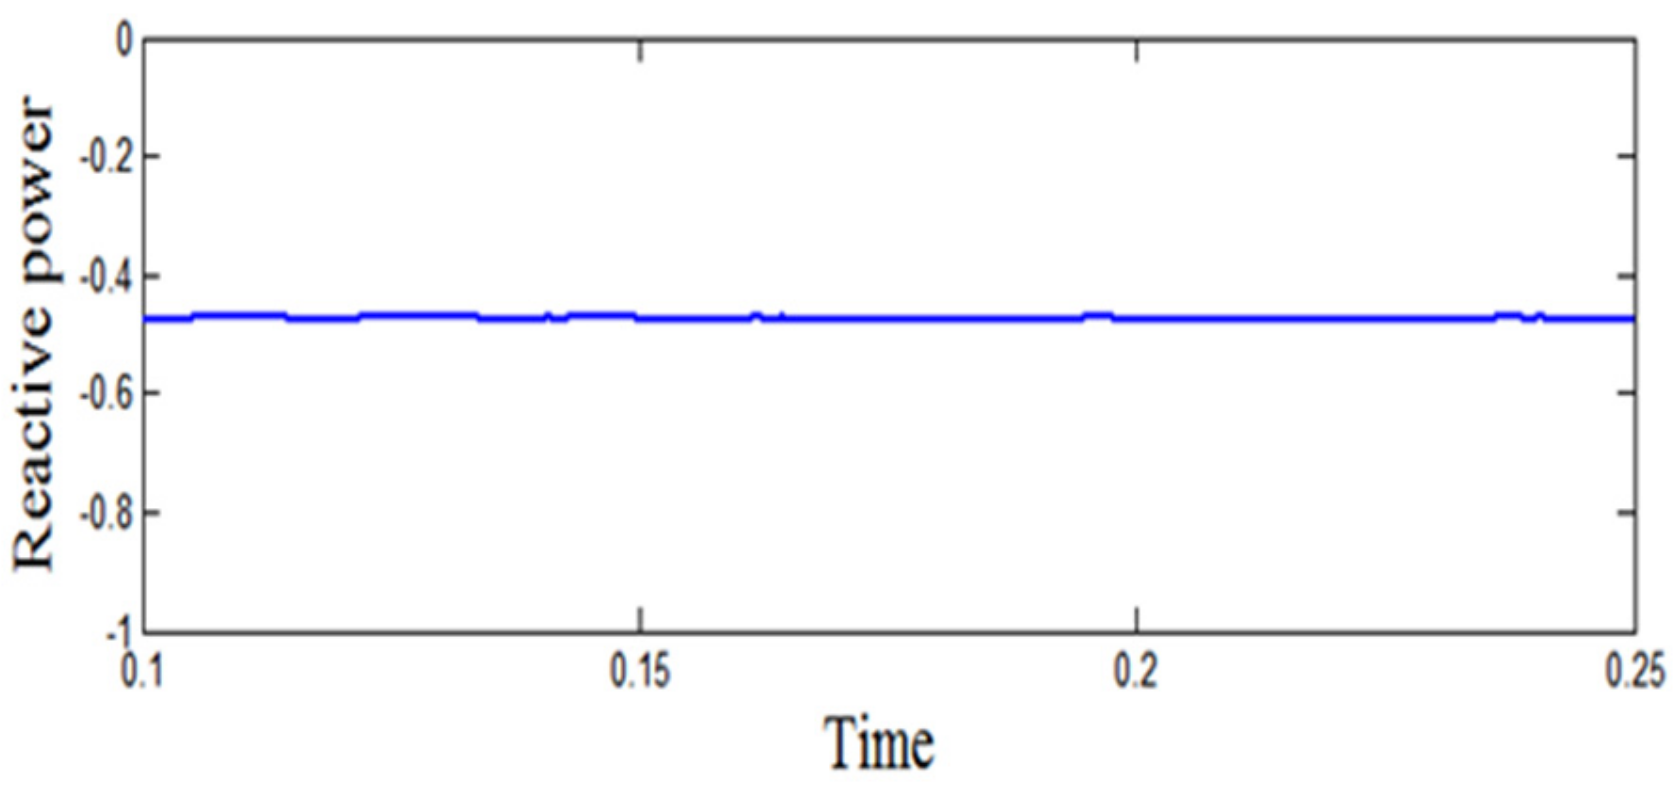
3.2. Wind Energy Conversion System
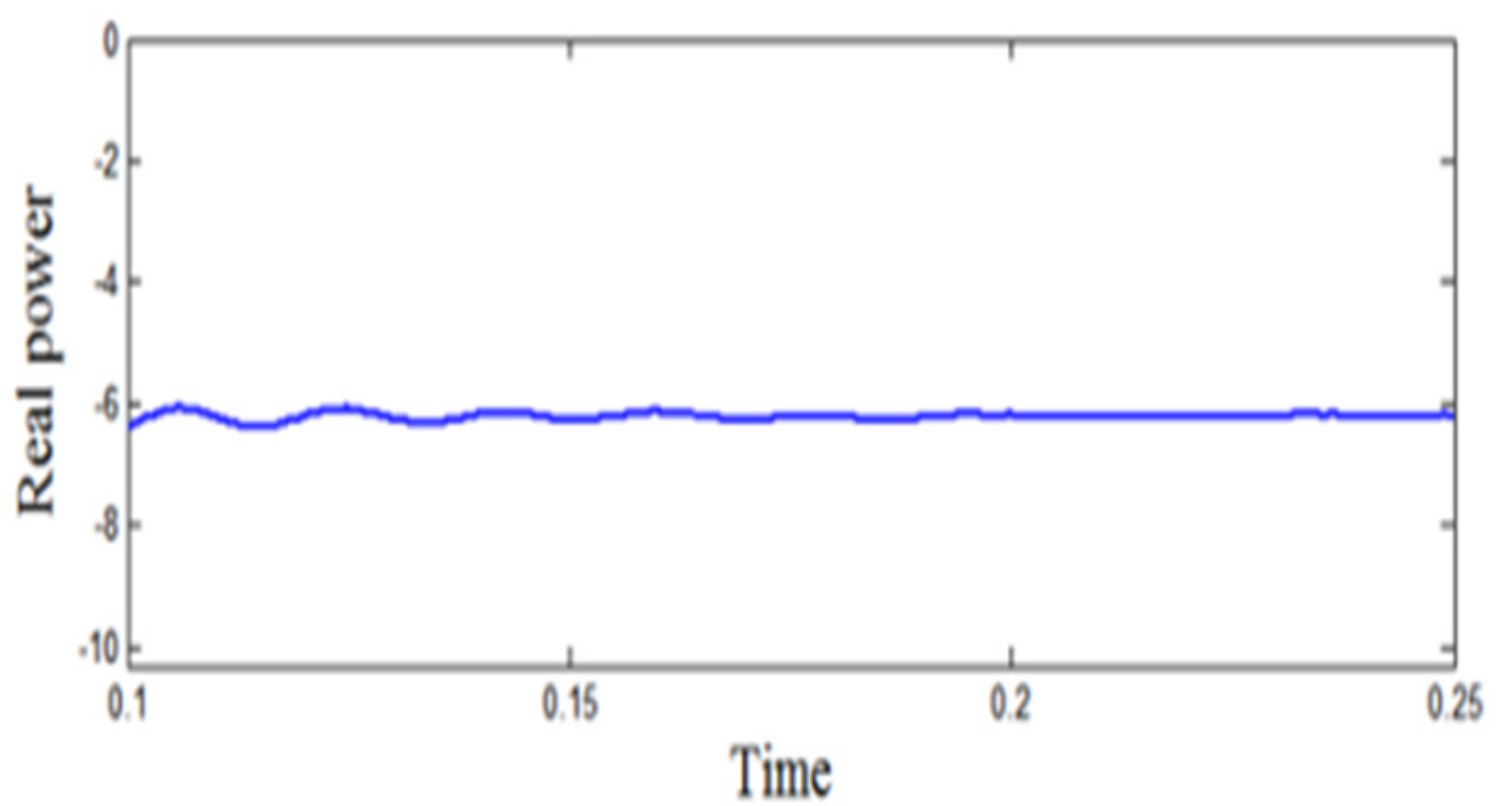
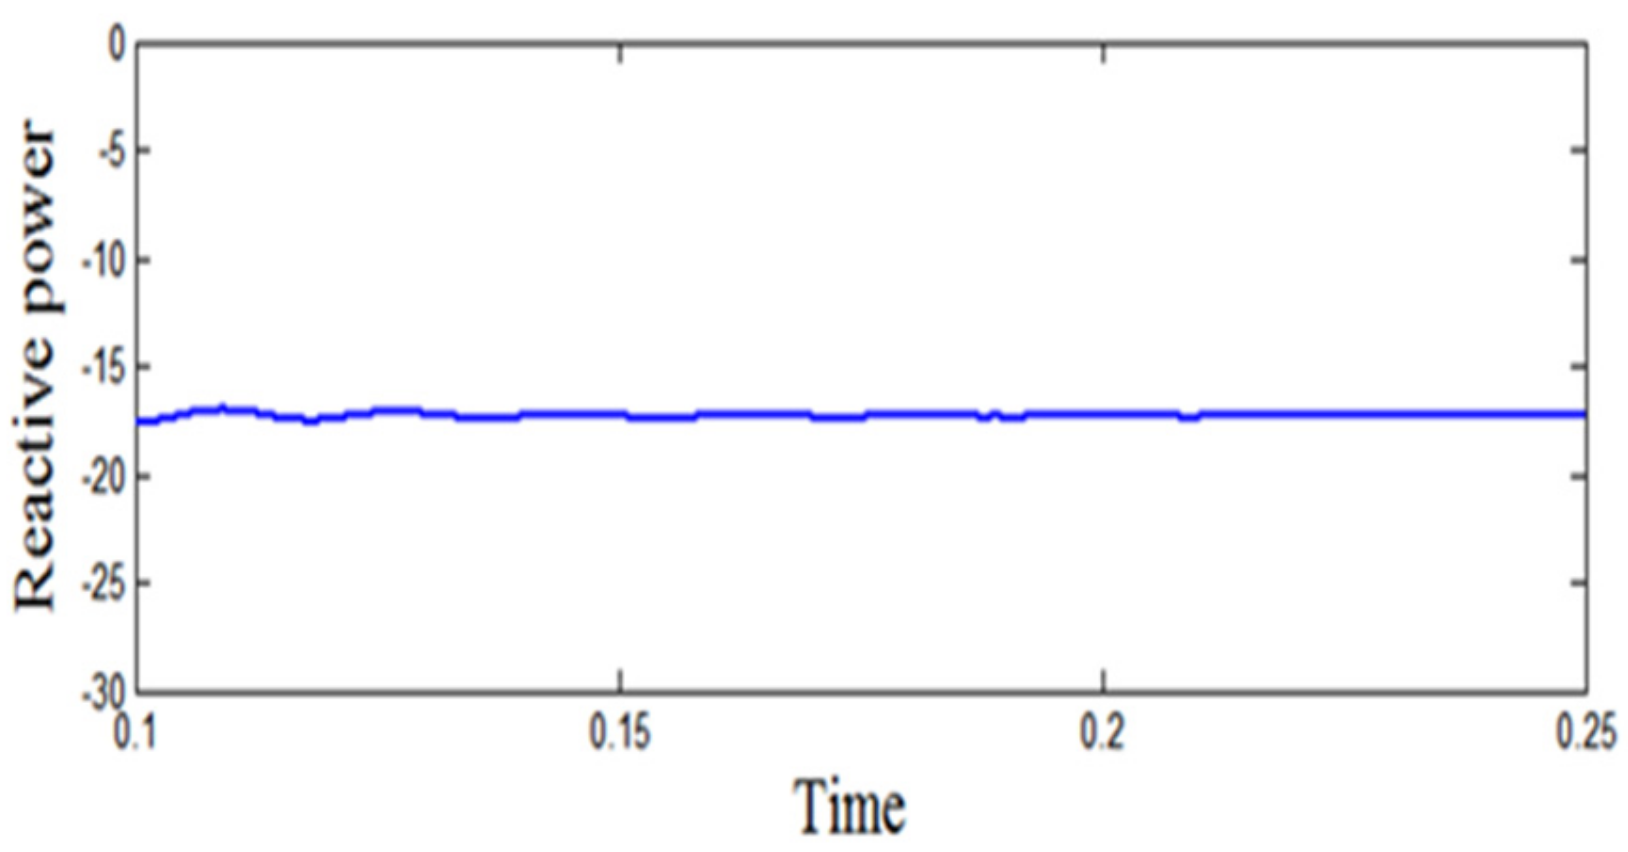
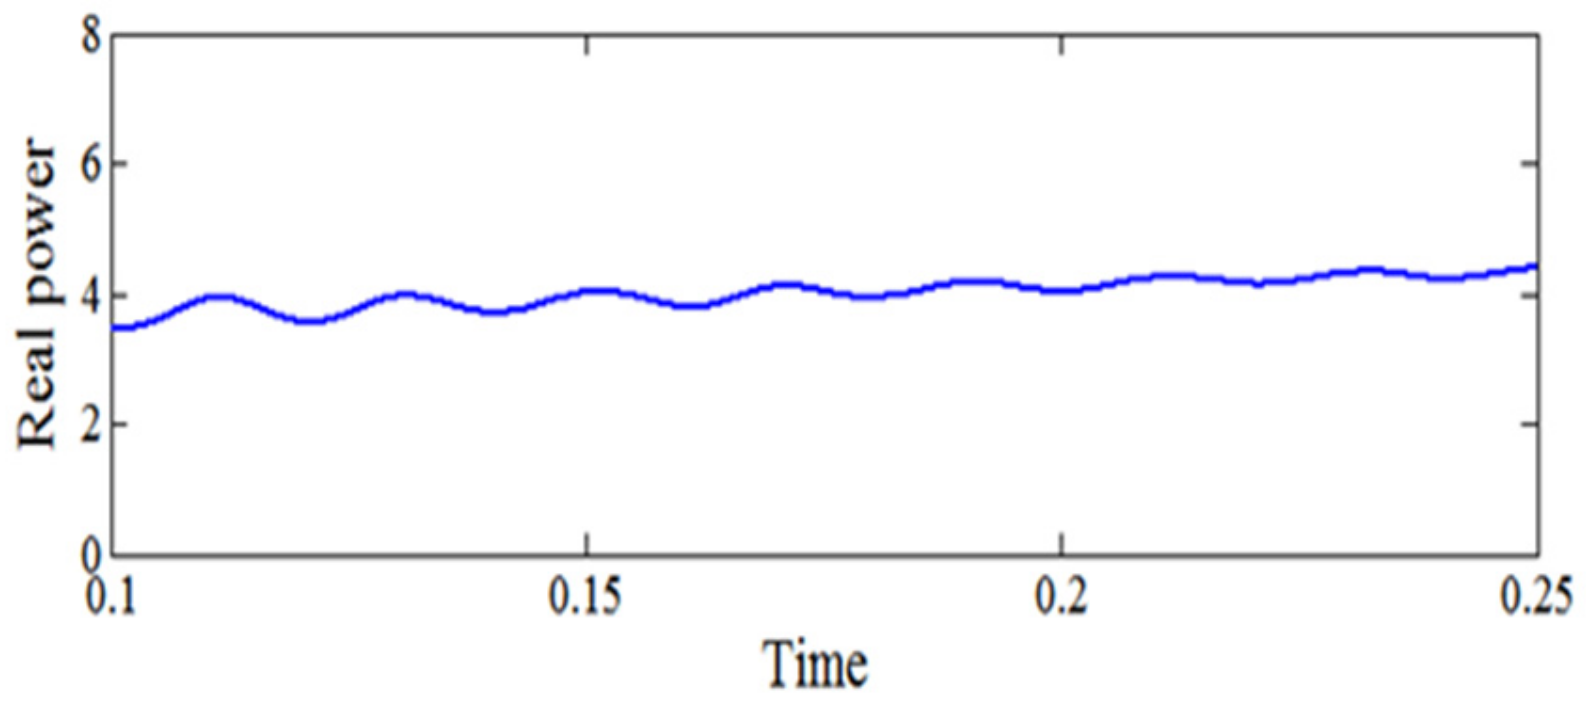
4. Case Studies Having Different Generation and Demand Values
4.1. Case I
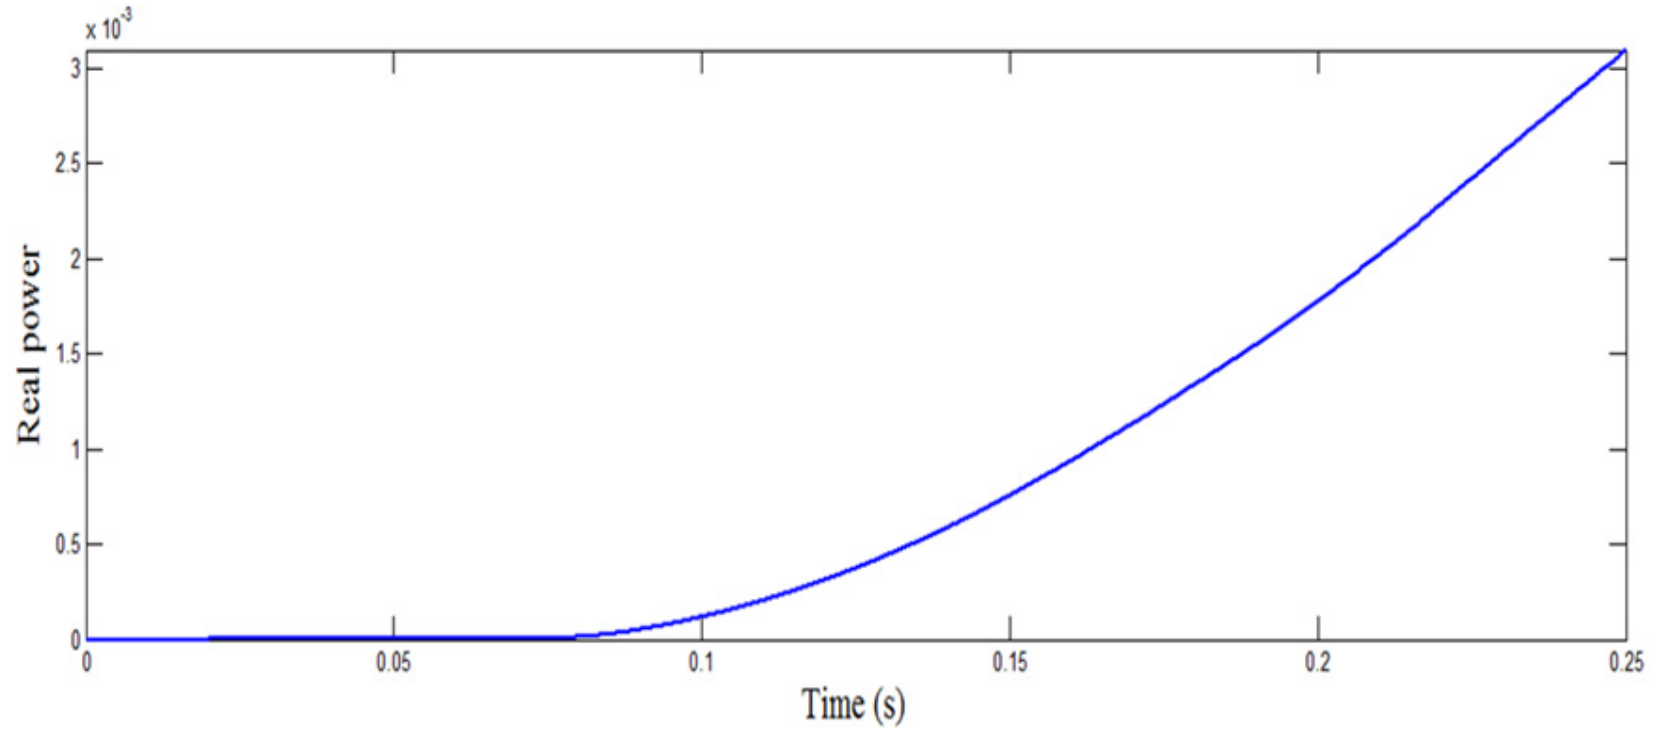
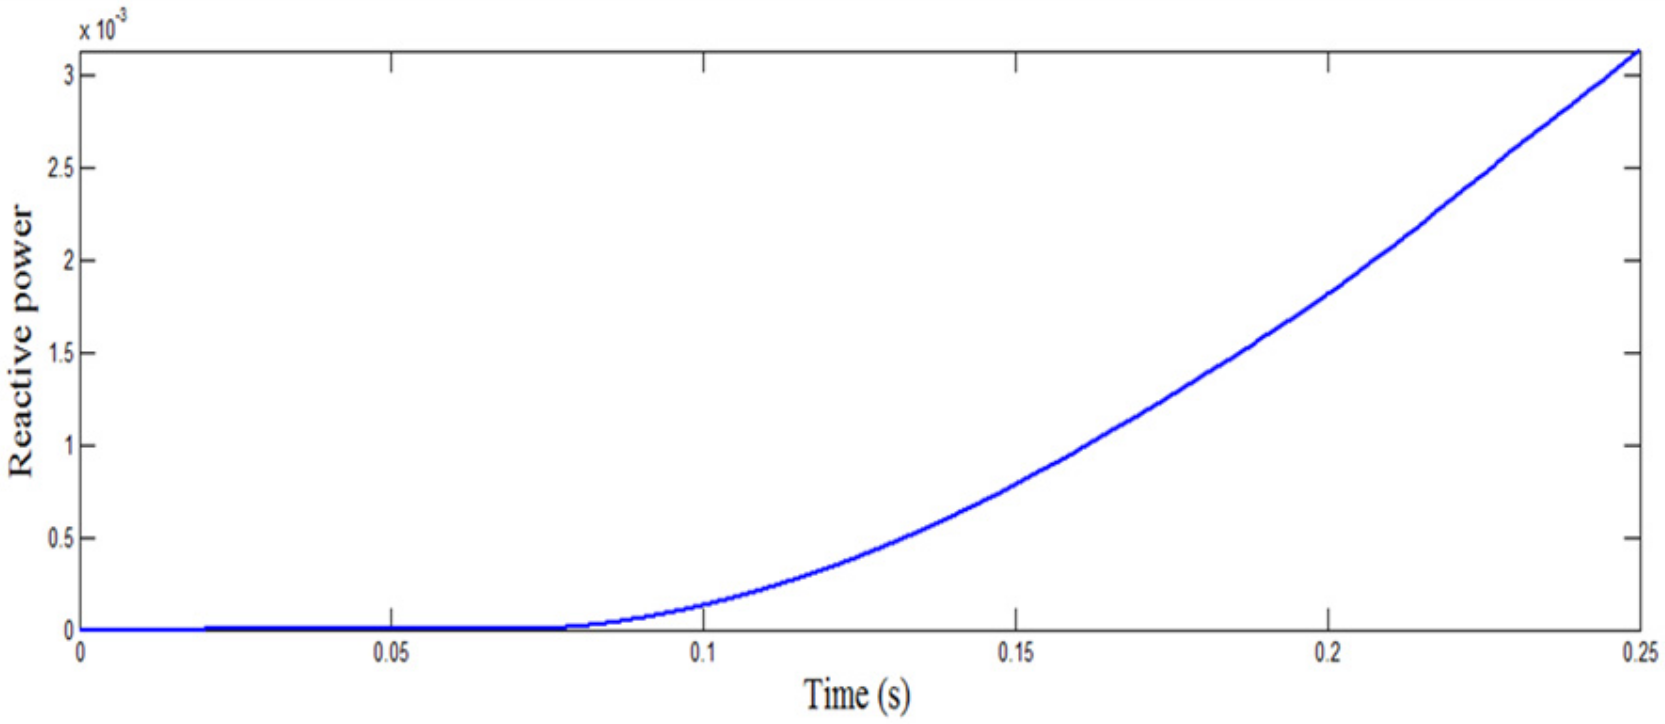
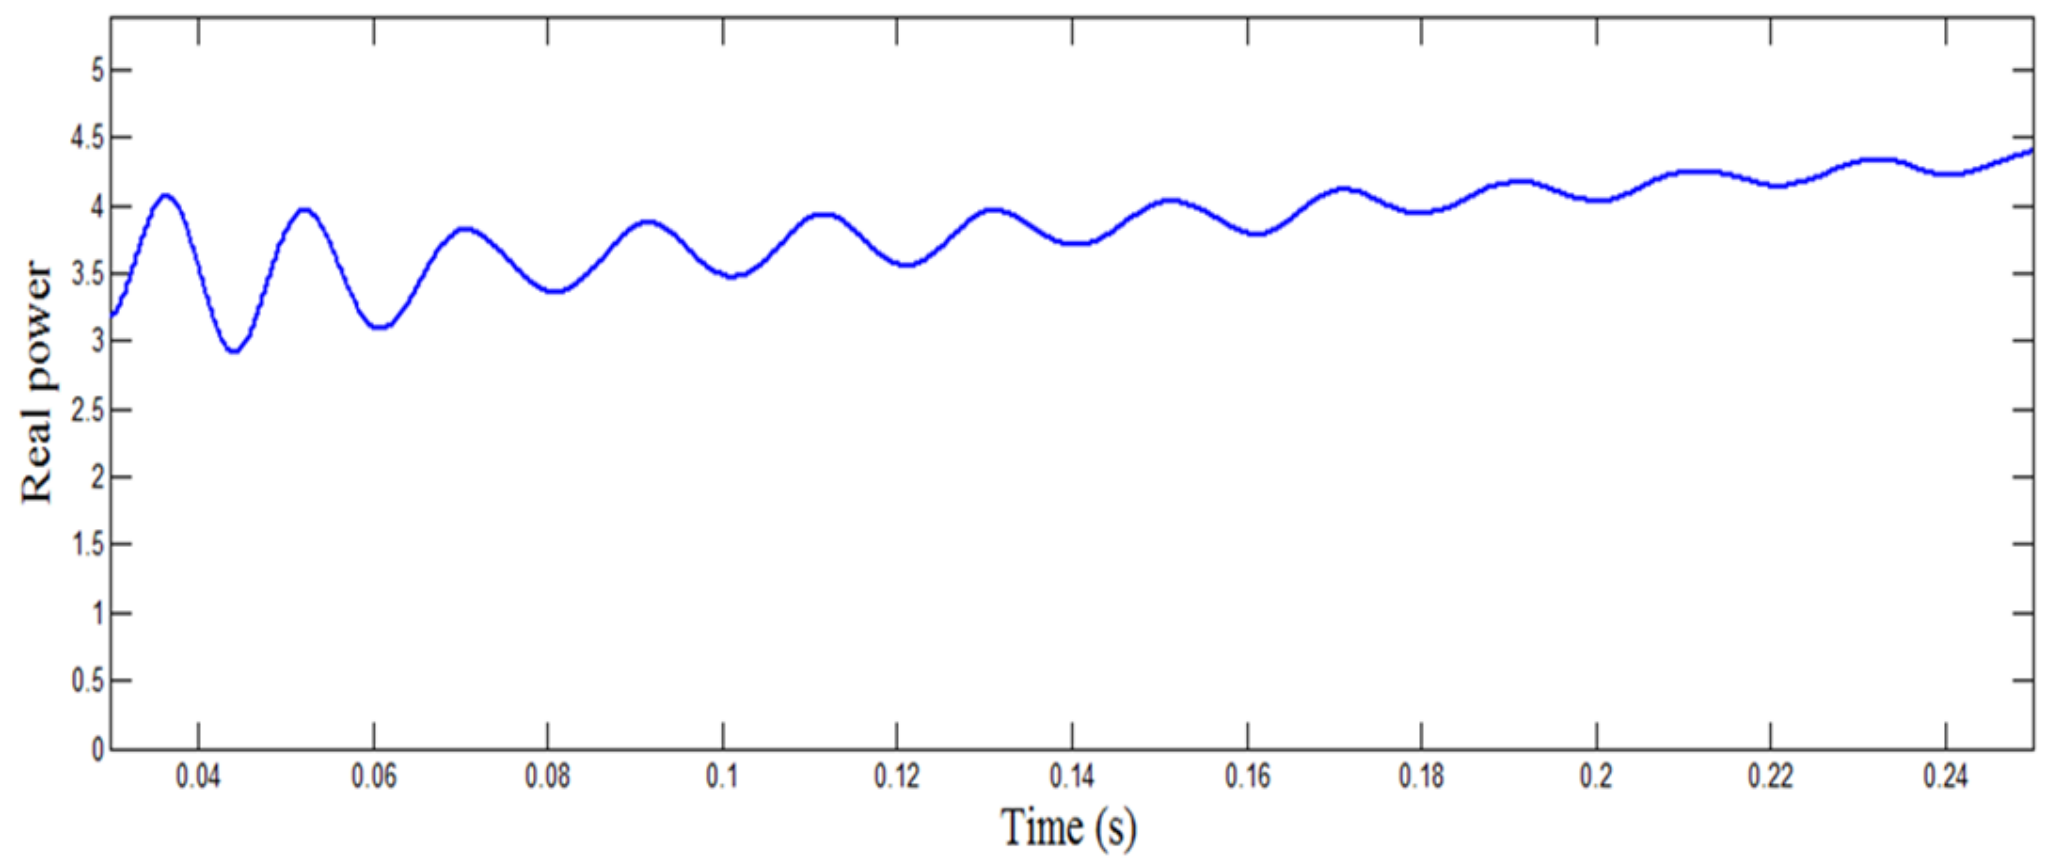
4.2. Case II
4.3. Case III
4.4. Case IV
5. Conclusions
Author Contributions
Funding
Conflicts of Interest
Nomenclature
| Pg | Total power generated (kW) |
| Ppv | Power generated from the solar PV panel (kW) |
| Pw | Power generated from the wind turbine (kW) |
| Ns | Number of cells connected in series |
| Np | The number of cells connected in parallel |
| Pm | The power of each module |
| pvg | The efficiency of PV generation |
| Apvg | Effective surface area of PV generator |
| Gt | Effective solar irradiation (W/) |
| pc | The efficiency of power conditioning (Equals to 1 when MPPT used) |
| B | The temperature coefficient |
| r | The efficiency of the reference module |
| Tcref | The temperature of the reference cell in C |
| Ta | Ambient temperature |
| NOCT | Nominal operating cell temperature |
| WECS | Wind Energy Conversion System |
| SMC | Sliding Mode Control |
| DFIG | Doubly Fed Induction Generator |
| PMSG | Permanent Magnet Synchronous Generator |
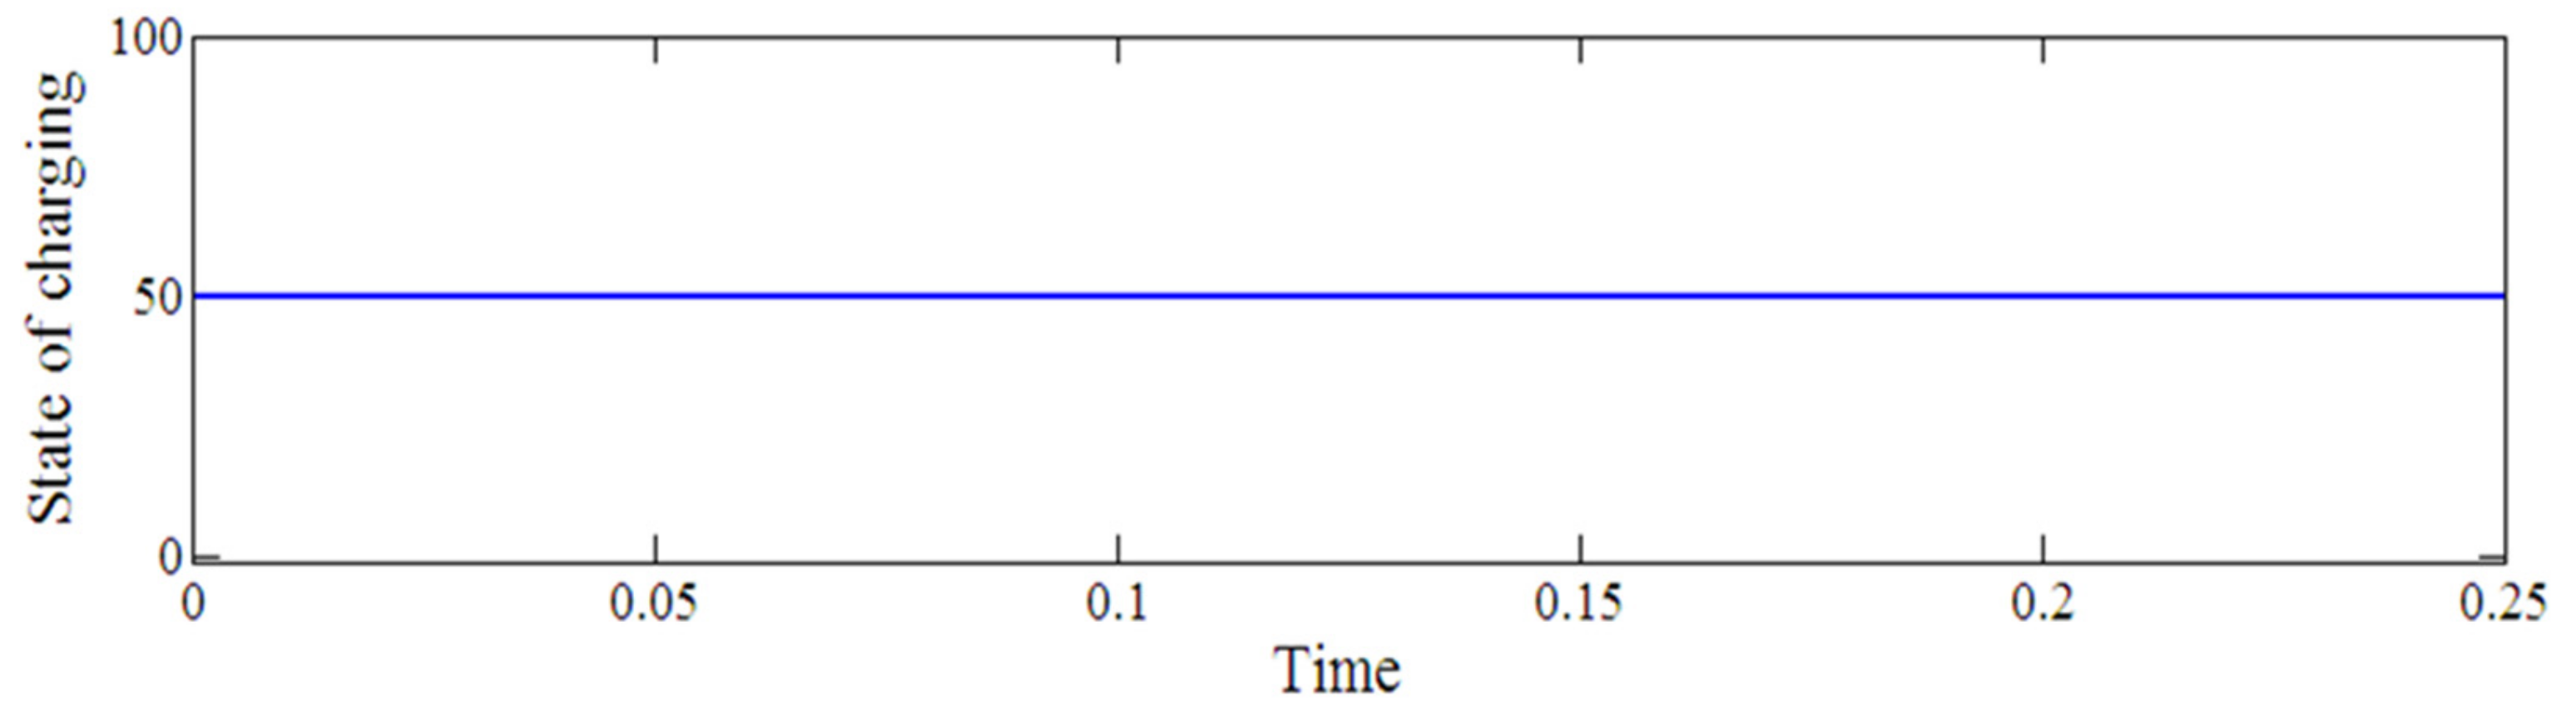
| SOC | State of Charging |
| SVPWM | Space Vector Pulse Width Modulation |
| RL | Resistance Inductance |
| cp | Power coefficient |
| A | Intercepting area of the rotor blades () |
| Air density (kg/) | |
| ω | The angular velocity (rad/s) |
| r | The radius of WTG (m) |
| Vw | Average wind speed (m/s) |
| vc | Cut in wind speed |
| vF | Cut off wind speed |
| vR | Rated wind speed |
| PR | Rated electrical power output |
| p.u | per unit |
References
- Bauer, A.; Menrad, K. Standing up for the Paris Agreement: Do global climate targets influence individuals’ greenhouse gas emissions? Environ. Sci. Policy 2019, 99, 72–79. [Google Scholar] [CrossRef]
- Atwa, Y.M.; El-Saadany, E.F.; Salama, M.M.A.; Seethapathy, R. Optimal renewable resources mix for distribution system energy loss minimization. IEEE Trans. Power Syst. 2010, 25, 360–370. [Google Scholar] [CrossRef]
- Hirsch, A.; Parag, Y.; Guerrero, J. Microgrids: A review of technologies, key drivers, and outstanding issues. Renew. Sustain. Energy Rev. 2018, 90, 402–411. [Google Scholar] [CrossRef]
- Rajvikram, M. The motivation for Renewable Energy and its Comparison with Other Energy Sources: A Review. Eur. J. Sustain. Dev. Res. 2019, 3, em0076. [Google Scholar]
- Justo, J.J.; Mwasilu, F.; Lee, J.; Jung, J.W. AC-microgrids versus DC-microgrids with distributed energy resources: A review. Renew. Sustain. Energy Rev. 2013, 24, 387–405. [Google Scholar] [CrossRef]
- Alam, M.N. Overcurrent protection of AC microgrids using mixed characteristic curves of relays. Comput. Electr. Eng. 2019, 74, 74–88. [Google Scholar] [CrossRef]
- Van den Broeck, G.; Stuyts, J.; Driesen, J. A critical review of power quality standards and definitions applied to DC microgrids. Appl. Energy 2018, 229, 281–288. [Google Scholar] [CrossRef]
- Kumar, J.; Agarwal, A.; Agarwal, V. A review on overall control of DC microgrids. J. Energy Storage 2019, 21, 113–138. [Google Scholar] [CrossRef]
- Correa-Betanzo, C.; Calleja, H.; Aguilar, C. Photovoltaic-based DC microgrid with partial shading and fault tolerance. J. Mod. Power Syst. Clean Energy 2019, 7, 340–349. [Google Scholar] [CrossRef]
- Rajvikram, M.; Leoponraj, S. A method to attain power optimality and efficiency in solar panel. Beni Suef Univ. J. Basic Appl. Sci. 2018, 7, 705–708. [Google Scholar] [CrossRef]
- Elfeqy, H.; Shahin, M.; Al-Rumaihi, A.; Massoud, A.; Gastli, A. A highly efficient PV power system for DC MicroGrids. In Proceedings of the 2016 IEEE Symposium on Computer Applications & Industrial Electronics, Batu Feringghi, Malaysia, 30–31 May 2016; pp. 183–188. [Google Scholar]
- Rajvikram, M.; Leoponraj, S.; Ramkumar, S.; Akshaya, H.; Dheeraj, A. Experimental investigation on the abasement of operating temperature in solar photovoltaic panel using PCM and aluminium 2019. Sol. Energy J. 2019, 188, 327–338. [Google Scholar]
- Loh, P.C.; Li, D.; Chai, Y.K.; Blaabjerg, F. Autonomous control of interlinking converter with energy storage in hybrid AC-DC microgrid. IEEE Trans. Ind. Appl. 2013, 49, 1374–1382. [Google Scholar] [CrossRef]
- Unamuno, E.; Barrena, J.A. Hybrid ac/dc microgrids-Part I: Review and classification of topologies. Renew. Sustain. Energy Rev. 2015, 52, 1251–1259. [Google Scholar] [CrossRef]
- Ahmadi, S.; Abdi, S. Application of the Hybrid Big Bang-Big Crunch algorithm for optimal sizing of a stand-alone hybrid PV/wind/battery system. Sol. Energy 2016, 134, 366–374. [Google Scholar] [CrossRef]
- Kaabeche, A.; Belhamel, M.; Ibtiouen, R. Sizing optimization of grid-independent hybrid photovoltaic/wind power generation system. Energy 2011, 36, 1214–1222. [Google Scholar] [CrossRef]
- Kane, S.N.; Mishra, A.; Dutta, A.K. Preface: International Conference on Recent Trends in Physics (ICRTP 2016). J. Phys. Conf. Ser. 2016, 755. [Google Scholar] [CrossRef]
- Maleki, A.; Rosen, M.A.; Pourfayaz, F. Optimal operation of a grid-connected hybrid renewable energy system for residential applications. Sustainability 2017, 9, 1314. [Google Scholar] [CrossRef]
- Wu, H.; Locment, F.; Sechilariu, M. Experimental Implementation of a Flexible PV Power Control Mechanism in a DC Microgrid. Energies 2019, 12, 1233. [Google Scholar] [CrossRef]
- Sarkar, T.; Bhattacharjee, A.; Samanta, H.; Bhattacharya, K.; Saha, H. Optimal design and implementation of solar PV-wind-biogas-VRFB storage integrated smart hybrid microgrid for ensuring zero loss of power supply probability. Energy Convers. Manag. 2019, 191, 102–118. [Google Scholar] [CrossRef]
- Zhang, W.; Maleki, A.; Rosen, M.A.; Liu, J. Sizing a stand-alone solar-wind-hydrogen energy system using weather forecasting and a hybrid search optimization algorithm. Energy Convers. Manag. 2019, 180, 609–621. [Google Scholar] [CrossRef]
- Shi, W.; Xie, X.; Chu, C.C.; Gadh, R. Distributed Optimal Energy Management in Microgrids. IEEE Trans. Smart Grid 2015, 6, 1137–1146. [Google Scholar] [CrossRef]
- Choudar, A.; Boukhetala, D.; Barkat, S.; Brucker, J.M. A local energy management of a hybrid PV-storage based distributed generation for microgrids. Energy Convers. Manag. 2015, 90, 21–33. [Google Scholar] [CrossRef]
- Yang, L.; Hu, Z.; Xie, S.; Kong, S.; Lin, W. Adjustable virtual inertia control of supercapacitors in PV-based AC microgrid cluster. Electr. Power Syst. Res. 2019, 173, 71–85. [Google Scholar] [CrossRef]
- Arani, A.A.K.; Karami, H.; Gharehpetian, G.B.; Hejazi, M.S.A. Review of Flywheel Energy Storage Systems structures and applications in power systems and microgrids. Renew. Sustain. Energy Rev. 2017, 69, 9–18. [Google Scholar] [CrossRef]
- Hajiaghasi, S.; Salemnia, A.; Hamzeh, M. Hybrid energy storage system for microgrids applications: A review. J. Energy Storage 2019, 21, 543–570. [Google Scholar] [CrossRef]
- Angelopoulos, A.; Ktena, A.; Manasis, C.; Voliotis, S. Impact of a Periodic Power Source on a RES Microgrid. Energies 2019, 12, 1900. [Google Scholar] [CrossRef]
- Gai, X.; Wang, Y.; Chen, R.; Zou, L. Research on Hybrid Microgrid Based on Simultaneous AC and DC Distribution Network and Its Power Router. Energies 2019, 12, 1077. [Google Scholar] [CrossRef]
- Zhang, G.; Wu, B.; Maleki, A.; Zhang, W. Simulated annealing-chaotic search algorithm based optimization of reverse osmosis hybrid desalination system driven by wind and solar energies. Sol. Energy 2018, 173, 964–975. [Google Scholar] [CrossRef]
- Olivares, D.E.; Mehrizi-Sani, A.; Etemadi, A.H.; Cañizares, C.A.; Iravani, R.; Kazerani, M.; Hajimiragha, A.H.; Gomis-Bellmunt, O.; Saeedifard, M.; Palma-Behnke, R.; et al. Trends in microgrid control. IEEE Trans. Smart Grid 2014, 5, 1905–1919. [Google Scholar] [CrossRef]
- Meegahapola, L.G.; Robinson, D.; Agalgaonkar, A.P.; Perera, S.; Ciufo, P. Microgrids of commercial buildings: Strategies to manage mode transfer from grid connected to islanded mode. IEEE Trans. Sustain. Energy 2014, 5, 1337–1347. [Google Scholar] [CrossRef]
- Korkas, C.D.; Baldi, S.; Michailidis, I.; Kosmatopoulos, E.B. Occupancy-based demand response and thermal comfort optimization in microgrids with renewable energy sources and energy storage. Appl. Energy 2016, 163, 93–104. [Google Scholar] [CrossRef]
- Korkas, C.D.; Baldi, S.; Michailidis, I.; Kosmatopoulos, E.B. Intelligent energy and thermal comfort management in grid-connected microgrids with heterogeneous occupancy schedule. Appl. Energy 2015, 149, 194–203. [Google Scholar] [CrossRef]
- Loh, P.C.; Li, D.; Chai, Y.K.; Blaabjerg, F. Hybrid AC-DC microgrids with energy storages and progressive energy flow tuning. IEEE Trans. Power Electron. 2013, 28, 1533–1543. [Google Scholar] [CrossRef]
- Herisanu, N.; Marinca, V.; Madescu, G.; Dragan, F. Dynamic Response of a Permanent Magnet Synchronous Generator to a Wind Gust. Energies 2019, 12, 915. [Google Scholar] [CrossRef]
- Eghtedarpour, N.; Farjah, E. Power control and management in a Hybrid AC/DC microgrid. IEEE Trans. Smart Grid 2014, 5, 1494–1505. [Google Scholar] [CrossRef]
- Huang, C.-C.; Tsai, T.-L.; Hsieh, Y.-C.; Chiu, H.-J. A Bilateral Zero-Voltage Switching Bidirectional DC-DC Converter with Low Switching Noise. Energies 2018, 11, 2618. [Google Scholar] [CrossRef]
- Lin, B.-R.; Huang, Y.-C. Bidirectional DC Converter with Frequency Control: Analysis and Implementation. Energies 2018, 11, 2450. [Google Scholar] [CrossRef]
- Fernández, E.; Paredes, A.; Sala, V.; Romeral, L. A Simple Method for Reducing THD and Improving the Efficiency in CSI Topology Based on SiC Power Devices. Energies 2018, 11, 2798. [Google Scholar] [CrossRef]
- Tricarico, T.; Gontijo, G.; Neves, M.; Soares, M.; Aredes, M.; Guerrero, J.M. Control design, stability analysis and experimental validation of new application of an interleaved converter operating as a power interface in hybrid microgrids. Energies 2019, 12, 437. [Google Scholar] [CrossRef]
- Lin, P.; Wang, P.; Jin, C.; Xiao, J.; Li, X.; Guo, F.; Zhang, C. A Distributed Power Management Strategy for Multi-Paralleled Bidirectional Interlinking Converters in Hybrid AC/DC Microgrids. IEEE Trans. Smart Grid 2019. [Google Scholar] [CrossRef]
- Wang, B.; Xian, L.; Manandhar, U.; Ye, J.; Zhang, X.; Gooi, H.B.; Ukil, A. Hybrid energy storage system using bidirectional single-inductor multiple-port converter with model predictive control in DC microgrids. Electr. Power Syst. Res. 2019, 173, 38–47. [Google Scholar] [CrossRef]
- Rajvikram, M. Solutions for Voltage SAG in a Doubly Fed Induction Generator Based Wind Turbine: A review. Power Res. J. 2018, 14, 73–77. [Google Scholar] [CrossRef]
- Rajvikram, M.; Renuga, P.; Aravind Kumar, G.; Bavithra, K. Fault Ride-through Capability of Permanent Magnet Synchronous Generator Based Wind Energy Conversion System. Power Res. J. 2016, 12, 531–538. [Google Scholar]
- Mousa, M.; Majid, G.; Sumper, A.; Domínguez-García, J.L. Experimental validation of a real-time energy management system using multi-period gravitational search algorithm for microgrids in islanded mode. Appl. Energy 2014, 128, 164–174. [Google Scholar]
- Mousa, M.; Seyedeh, S.G.; Hasan, U.; Terrence, F. A real-time evaluation of energy management systems for smart hybrid home Microgrids. Electr. Power Syst. Res. 2017, 143, 624–633. [Google Scholar]
- Rajvikram, M.; Renuga, P.; Swathisriranjani, M. Fuzzy based MPPT controller’s role in extraction of maximum power in wind energy conversion system. In Proceedings of the International Conference of Control, Instrumentation, Communication and Computational Technologies IEEE, Kumaracoil, India, 16–17 December 2016; pp. 713–719. [Google Scholar]
- Rajvikram, M. Role of Dual Input Fuzzy Controller for the Better Production of Real Power in Wind System. J. Electr. Eng. 2019, 9. Available online: http://www.jee.ro/covers/editions.php?act=art&art=WW1529480547W5b2a056302e88 (accessed on 25 April 2019).
- Esram, T.; Chapman, P.L. Comparison of Photovoltaic Array Maximum Power Point Tracking Techniques. IEEE Trans. Energy Convers. 2007, 22, 439–449. [Google Scholar] [CrossRef]
- Babaa, S.E.; Armstrong, M.; Pickert, V. Overview of Maximum Power Point Tracking Control Methods for PV Systems. J. Power Energy Eng. 2014, 2, 59–72. [Google Scholar] [CrossRef]
- Kollimalla, S.K.; Mishra, M.K. Variable perturbation size adaptive P&O MPPT algorithm for sudden changes in irradiance. IEEE Trans. Sustain. Energy 2014, 5, 718–728. [Google Scholar] [CrossRef]
- Elgendy, M.A.; Zahawi, B.; Atkinson, D.J. Operating characteristics of the P&O algorithm at high perturbation frequencies for standalone PV systems. IEEE Trans. Energy Convers. 2015, 30, 189–198. [Google Scholar] [CrossRef]
- Pathy, S.; Subramani, C.; Sridhar, R.; Thamizh Thentral, T.M.; Padmanaban, S. Nature-inspired MPPT algorithms for partially shaded PV systems: A comparative study. Energies 2019, 12, 1451. [Google Scholar] [CrossRef]
- Chu, C.C.; Chen, C.L. Robust maximum power point tracking method for photovoltaic cells: A sliding mode control approach. Sol. Energy 2009, 83, 1370–1378. [Google Scholar] [CrossRef]
- Wu, X.; Wang, Z.; Ding, T.; Li, Z. Hybrid AC/DC Microgrid Planning with Optimal Placement of DC Feeders. Energies 2019, 12, 1751. [Google Scholar] [CrossRef]
- Kim, I.S. Sliding mode controller for the single-phase grid-connected photovoltaic system. Appl. Energy 2006, 83, 1101–1115. [Google Scholar] [CrossRef]
- Peri, P.G.V.; Paliwal, P.; Joseph, F.C. ACMC-based hybrid AC/LVDC micro-grid. IET Renew. Power Gener. 2016, 11, 521–528. [Google Scholar] [CrossRef]


| Sl. No | Elements | Parameter Value |
|---|---|---|
| 1 | Bus 1 | 380 V |
| 2 | PMSG | 3 kW |
| Sl. No | Elements | Parameters Value |
|---|---|---|
| 1 | Bus 1 | 120 V |
| 2 | Bus 2 | 700 V |
| 3 | PV array 1 | 4 kW, 120 V |
| 4 | Buck-boost converter | 200 V/120 V, 1 kW |
| 5 | Boost converter | 700 V/200 V, 1 kW |
| 6 | Load | 700 V/200 V, 4 kW |
| 7 | DC link bus voltage | 700 V |
| Different Cases | AC Load | DC Load | Total Load | Real Power Generated | Real Power Transferred | Power Factor Enhancement (%) |
|---|---|---|---|---|---|---|
| I: Solar + Bidirectional Converter + AC Load | 3 kW | 0 | 3 kW | 4 kW | 3.13 kW | 71 |
| II: Wind + Bidirectional Converter + DC Load | 0 | 4 kW | 4 kW | 4.395 kW | 3.32 kW | 8 |
| III: Wind + Bidirectional Converter +AC Load + DC Load | 3 kW | 4 kW | 7 kW | 9 kW | 3.462 kW | 41 |
| IV: Wind + Bidirectional Converter + AC Load + DC Load + Utility | 3 kW | 4 kW | 7 kW | 15 kW | 5.204 kW | 9 |
© 2019 by the authors. Licensee MDPI, Basel, Switzerland. This article is an open access article distributed under the terms and conditions of the Creative Commons Attribution (CC BY) license (http://creativecommons.org/licenses/by/4.0/).
Share and Cite
Madurai Elavarasan, R.; Ghosh, A.; K. Mallick, T.; Krishnamurthy, A.; Saravanan, M. Investigations on Performance Enhancement Measures of the Bidirectional Converter in PV–Wind Interconnected Microgrid System. Energies 2019, 12, 2672. https://doi.org/10.3390/en12142672
Madurai Elavarasan R, Ghosh A, K. Mallick T, Krishnamurthy A, Saravanan M. Investigations on Performance Enhancement Measures of the Bidirectional Converter in PV–Wind Interconnected Microgrid System. Energies. 2019; 12(14):2672. https://doi.org/10.3390/en12142672
Chicago/Turabian StyleMadurai Elavarasan, Rajvikram, Aritra Ghosh, Tapas K. Mallick, Apoorva Krishnamurthy, and Meenal Saravanan. 2019. "Investigations on Performance Enhancement Measures of the Bidirectional Converter in PV–Wind Interconnected Microgrid System" Energies 12, no. 14: 2672. https://doi.org/10.3390/en12142672
APA StyleMadurai Elavarasan, R., Ghosh, A., K. Mallick, T., Krishnamurthy, A., & Saravanan, M. (2019). Investigations on Performance Enhancement Measures of the Bidirectional Converter in PV–Wind Interconnected Microgrid System. Energies, 12(14), 2672. https://doi.org/10.3390/en12142672