1. Introduction
The exploration of new energy resources for the production of renewable energy is currently a priority in many government policies. In the last decade, the increase in energy demand and the concerns about global warming have boosted the interest in biofuels production, which offer a more environmentally friendly alternative to fossil fuels [
1,
2].
However, since bioethanol, obtained from sugarcane, sugar beet or cereals, competes with food production and increases land use, the residues from agricultural and/or industrial activities are now regarded as the most promising bioethanol feedstocks [
3].
Fermentation is a crucial step in the production of bioethanol and its performance is highly dependent on the yeast strain, the wort composition (carbon and nitrogen availability), temperature, agitation and pH control [
4].
The criteria for selecting an appropriate yeast strain for fermentation include a high ethanol yield (at least 90%), tolerance to ethanol (40 g·L
−1), ethanol productivity (>1 g·L
−1·h
−1), and tolerance to the inhibitory compounds that can be found in second generation ethanol processes [
3,
5,
6].
High fermentation efficiencies have been reported for both
Saccharomyces cerevisiae strains and non-
Saccharomyces strains isolated from traditional and industrial fermentations (e.g., from sugarcane ethanol distilleries) [
7]. Previous studies also provide important information about the behavior of
S. cerevisiae strains in co-culture fermentation, evidencing their high dominance in comparison to other non-distilling yeast strains. The advantage of using such dominant yeast strains is their higher fermentation performance, understood in terms of high ethanol yields and reduced risks of contamination with wild yeasts, which has a positive impact on the financial aspects of the industrial bioethanol production [
5].
Another crucial factor that has a direct impact on the fermentation process is yeast nutrition, provided that the availability/limitation of nutrients modulates the ecology of yeasts fermentations. Yeast nutritional requirements mainly include sources of carbon (sugars) and assimilable nitrogen, as well as micronutrients and lipids, which together play an important role in yeast cellular physiology. For the cellulosic ethanol industry, the sweet liquor obtained from the enzymatic saccharification of pretreated lignocellulosic biomass provides the main carbon source (glucose from cellulose), but it typically features low nitrogen contents. For instance, hydrolyzed wheat straw yields liquors with a nitrogen content as low as 0.4% on a dry-weight basis [
8]. Therefore, nitrogen supplements are necessary to facilitate yeast growth and enhance fermentation, increasing costs in cellulosic ethanol production [
9]. It is well established that the C/N ratio is a crucial parameter in fermentation processes, since it influences cell growth and metabolite production [
10,
11].
As mentioned above, both the yeast strains and the nutrients available are very important factors in the fermentation process. Thus, the determination of the optimum concentration of nitrogen to be added to the fermentation medium and the screening and selection of the yeast strains that exhibit the most suitable traits may be regarded as key research areas to render the process more profitable and feasible [
11].
The aim of this study was to investigate the appropriate nitrogen sources and doses to supplement the fermentation media, and to select a highly competitive S. cerevisiae strain for ethanol fermentation with emphasis on ethanol yield. The results presented herein may facilitate the selection of “cell factories” for efficient ethanol production.
2. Materials and Methods
2.1. Screening of Yeast Isolates
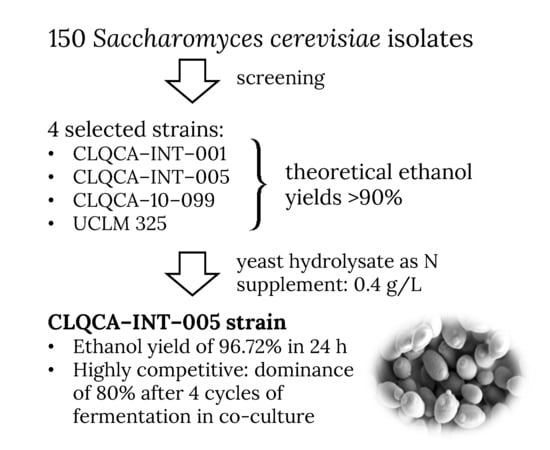
The yeasts selection was conducted according to the assimilation and fermentation of sugars (mainly glucose, in 24 h) and the theoretical ethanol yield (>90%) criteria. A total of 150 different S. cerevisiae isolates—including yeasts isolated from distilleries and natural substrates, as well as commercial ones—were screened. Most of the yeast isolates belong to natural environments in Ecuador; thus, a great majority of the isolates can be considered wild S. cerevisiae strains. All the yeast isolates were identified based on the sequences of their D1/D2 domain of the large-subunit (LSU) rRNA gene and their physiological characteristics. The tests were carried out in 10 mL fermentation tubes (i.e., tubes containing inverted Durham’s tubes to collect the CO2 released during the fermentation). The medium contained 6.7 g·L−1 of Yeast Nitrogen Base (YNB) and 20 g·L−1 of each of the following sugars: glucose, xylose, maltose, galactose, lactose, sucrose, raffinose, and cellobiose. This medium was inoculated with 10 µL of an exponentially growing yeast pre-culture.
The assimilation response was determined based on the turbidity generated by the yeast growth, while the fermentation was determined based on the released CO2. Both assimilation and fermentation of sugars were evaluated for 21 days, classifying the yeasts’ degree of response as positive (+), positive slow (S), positive weak (W), positive delayed (L) or negative (−).
The concentrations of glucose and ethanol were determined by high-performance liquid chromatography (HPLC) with a Rezex ROA-Organic acid H+ ion exchange column (at 79 °C; mobile phase: H2SO4 0.005 N; flow rate: 0.6 mL·min−1).
The ethanol yield (%) was calculated using Equation (1) [
12]:
where C
ethanol represents the ethanol concentration at the end of the fermentation, in g·L
−1, 0.511 is the stoichiometric ethanol yield factor, and C
glucose is the glucose concentration at the beginning of the fermentation, in g·L
−1.
2.2. Yeast Hydrolysate
The yeast hydrolysate used as a nitrogen source was obtained from an autolysis process, performed with yeast suspensions (20% w/w) under incubation at 50 °C and 120 rpm for 96 h. The autolysis mixture was boiled for 5 min and centrifuged at 4000 rpm for 10 min, in agreement with the procedure reported by Mirzaeia et al. [
13]. The total nitrogen content from supernatant during the autolysis process was measured by the Kjeldahl method [
14].
2.3. Nitrogen Source Selection and Optimum Dose Tests
A synthetic medium consisting of 100 g·L−1 of D-glucose and 38.5 g·L−1 of glycerol was prepared for the ethanol fermentations tests.
The fermentation experiments were conducted in triplicate, using pure pre-cultures of the aforementioned strains of S. cerevisiae. Each pre-culture was obtained by inoculating a single colony of yeast on yeast extract/peptone/dextrose medium (YPD) at 34 °C until 1 × 10⁸ cells·mL−1 were reached (24–48 h). The yeast cells were quantified with a Neubauer chamber, using an Olympus phase contrast microscope.
The assays were carried out in 250 mL flasks, containing 100 mL of the fermentation culture medium, supplemented with a single nitrogen source and inoculated with a suspension of yeast at a 1 × 10⁸ cells·mL−1 concentration. The culture was then incubated at 34 °C for 24 h and stirred at 150 rpm.
In order to determine the most adequate nitrogen source for the fermentation process, ammonium phosphate (1 and 2 g N·L
−1), ammonia (1 and 2 g N·L
−1) and yeast hydrolysate (0.5–2.5 g N·L
−1) were first assessed, monitoring glucose consumption. Glucose was determined by the Rebelein method [
15]. Glucose consumption (%) was calculated according to Equation (2):
where Glucose
i and Glucose
f stand for the initial and final glucose concentrations (in g·L
−1), respectively.
To further optimize the nitrogen concentration in the fermentation process, three additional concentrations of the preferred nitrogen source, i.e., yeast hydrolysate (0.2, 0.3 and 0.4 g N·L−1), were then assessed, comparing yeast growth kinetics against a control culture medium without any nitrogen source. Yeast growth kinetics were monitored through spectrophotometric measurements, conducted with a Spectronic Helios Beta (Thermo Fisher Scientific; Waltham, MA, USA) at λ = 630 nm, at different times (viz. 0, 1, 2, 3, 4, 6, 7, 8, 9 and 24 h).
2.4. Co-Fermentation with Cell Recycling
Co-fermentation experiments were carried out—in triplicate—by inoculating a pre-culture medium with 2.5 × 10⁷ cells·mL−1 of each of the S. cerevisiae strains. Assays were performed in flasks containing 100 mL of the culture medium with the optimum nitrogen dose (100 g·L−1 of D-glucose, 38.5 g·L−1 of glycerol and 0.4 g N·L−1 of yeast hydrolysate). Incubation was carried out at 34 °C, with stirring at 150 rpm for 96 h. Every 24 h, i.e., one complete fermentation cycle, the yeast biomass was centrifuged at 7000 rpm, then re-used as the inoculum for a fresh fermentation culture liquid medium, thereby reusing yeast biomass in four consecutive fermentation cycles. Glucose consumption was calculated at the end of each fermentation cycle.
2.5. Dominance of Yeast Strains in Continuous Co-Fermentation
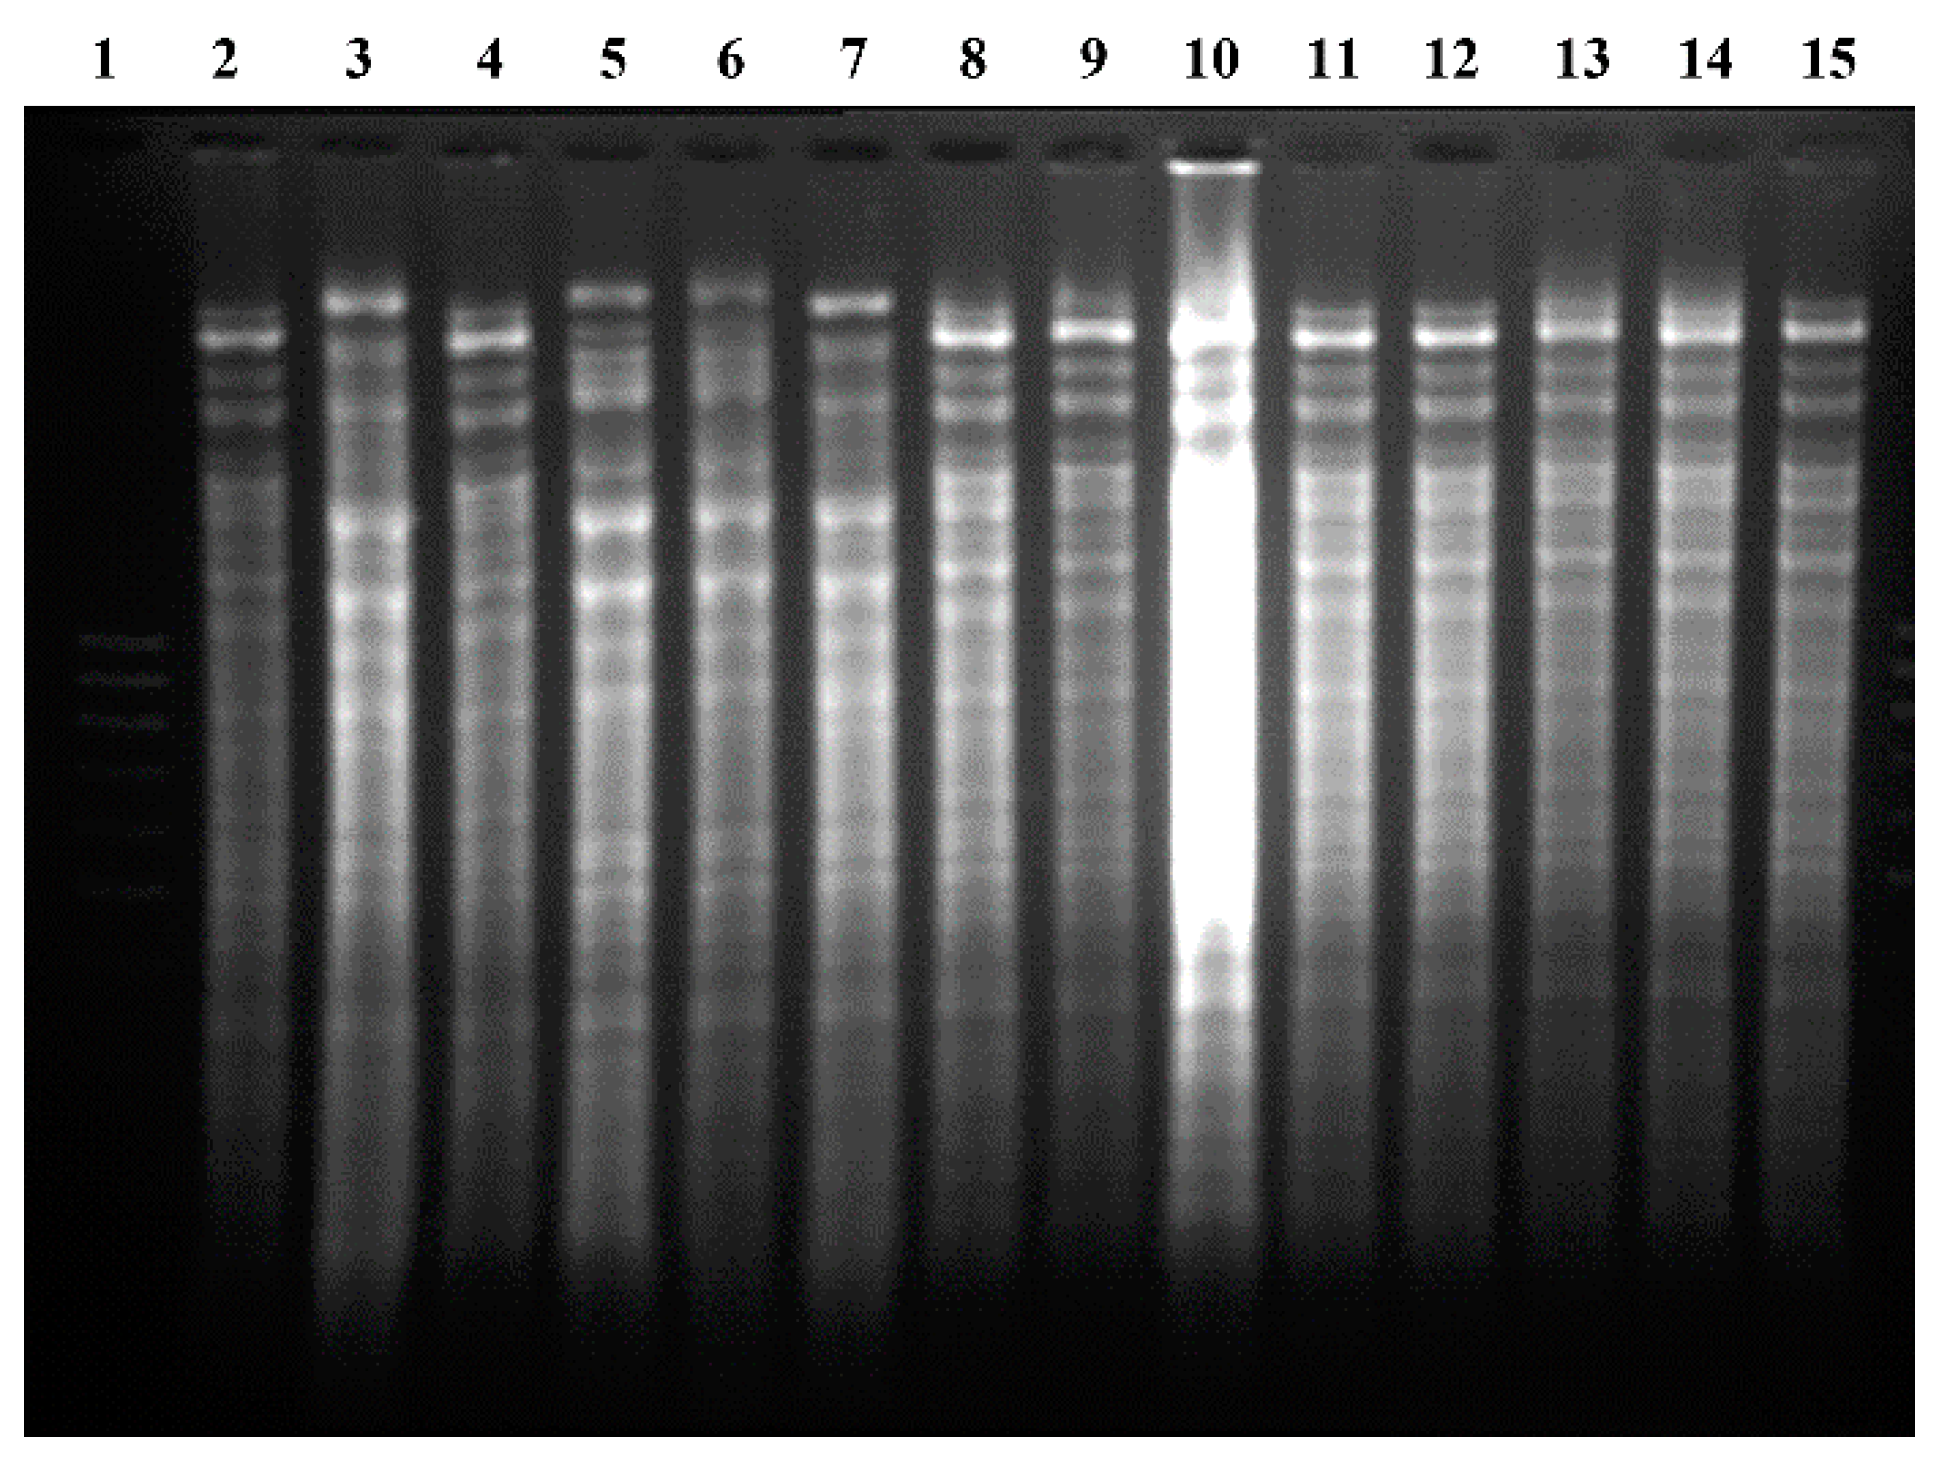
At the end of the four cycles of co-fermentation, fingerprinting profile (mtDNA) for each of the four original strains of
S. cerevisiae was used to match the coincident yeast strains recovered. A total of ten colonies were randomly selected from a Petri dish and then DNA was extracted to obtain the correspondent fingerprinting profile. In order to determine dominance in co-culture, the number of isolates identified as a particular yeast strain was divided by the number of isolates selected from the sample (
n = 10) and then each value was multiplied by 100 to obtain the percentage of dominance of each yeast strain [
16].
For the restriction analysis of mitochondrial DNA (mtDNA), serial dilutions of the co-culture after four cycles of co-fermentation were isolated on yeast malt (YM) agar (0.3% yeast extract, 0.3% malt extract, 0.5% peptone, 1% glucose, 2% agar), followed by incubation at 30 °C for 72 h.
DNA extraction from random yeast colonies on YM agar and restriction analysis of mtDNA was carried out following the method proposed by Querol et al. [
17]. DNA (10 µL) was digested with the HinfHI endonuclease. The restriction products were separated by electrophoresis in 1.5% w/v agarose gel with 0.5 μg·mL
−1 of ethidium bromide. A 1 kb DNA ladder (Promega) was used as a molecular marker. The gels were visualized in a UV transilluminator and processed in a photo-documentation system (Fisher Bioblock Scientific).
2.6. Fermentation Kinetics and Ethanol Yield
In order to study the most effective
S. cerevisiae strain in terms of ethanol production, batch fermentation experiments were performed—in triplicate—in an analogous way to that referred to in
Section 2.3. The kinetics of ethanol production and glucose consumption were monitored at intervals of 0, 1, 2, 3, 4, 5, 7 and 24 h by high-performance liquid chromatography (HPLC), and the ethanol yield (%) was calculated using Equation (1) [
12].
2.7. Design and Statistical Analysis
A statistical design of a completely randomized 4 × 4 factorial structure was used for the simple fermentation tests, in which one of the factors was the S. cerevisiae strain and the other factor was the nitrogen concentration.
The data was statistically processed using IBM (Armonk, NY, USA) SPSS Statistics software v.25, by performing an analysis of variance (ANOVA). Tukey’s honestly significant difference (HSD) test with a significance level of 0.05 was used for the post hoc comparison of means.
3. Results and Discussion
3.1. Screening of Yeast Isolates
The assimilation and fermentation profiles for the 150
Saccharomyces cerevisiae isolates, evaluated for 21 days, are summarized in
Table S1. All isolates were able to utilize glucose, while raffinose could be used by 97.3% of the isolates, sucrose by 96% of the isolates, maltose by 91.3%, and galactose by 88.7% of the isolates. In contrast, cellobiose, xylose and lactose were not utilized as a carbon sources by the yeast isolates. The isolates that were able to assimilate glucose, raffinose, sucrose and galactose were also able to ferment the same sugars in the following percentages: 84%, 62.7%, 83.3% and 84.7% respectively. No direct correlation was observed between the assimilation/fermentation profiles and the substrates from which the yeasts were isolated, since the fermentation/assimilation performance is regarded as strain-dependent, but not substrate-dependent.
The CLQCA-10-099, CLQCA-INT-001, CLQCA-INT-005 and UCLM325 strains showed positive assimilation and fermentation after 24 h. In addition, they showed ethanol yields higher than 90% with respect to the theoretical ethanol yields (0.51 g ethanol·g glucose−1), which made them the most promising candidates to be assayed in the rest of the study.
3.2. Ethanol Fermentation Tests
Ammonium phosphate, ammonia and yeast hydrolysate were evaluated as possible nitrogen sources, assaying different doses. As shown in
Table 1, the former two sources led to low glucose consumptions, with better results (by approximately a factor of 2) for the fermentation medium supplemented with ammonium phosphate (12.7–41.7%) than for the medium with ammonium (5.9–26.2%). In both cases, the increase in the concentration of the nitrogen source led to an increase in glucose consumption. Nonetheless, the four yeast strains under study (CLQCA-10-099, CLQCA-INT-001, INT-005 and UCLM325) showed significantly higher glucose consumptions (>78%) when yeast hydrolysate was chosen as the nitrogen source (
Table 1), with no significant differences among the four tested concentrations, suggesting that lower concentrations than those tested could be appropriate. It is worth noting that the CLQCA-INT-005 strain showed the highest glucose consumption, whereas the UCLM325 strain showed the lowest one.
These results are in agreement with a study by Li et al. [
18], in which yeast extract, urea and ammonium sulfate were investigated as nitrogen sources, evaluating the impact of the choice of an adequate nitrogen supplement and its concentration on fermentative metabolism (glucose consumption, ethanol yield and fermentation efficiency). The authors concluded that yeast extract was an ideal nitrogen source for ethanol production. Likewise, in another study by Bafrncová et al. [
19], it was evidenced that yeast hydrolysate supplementation had a positive impact on assimilation/fermentation and cell viability, stimulating the fermentation rate and ethanol production. This may be ascribed to the fact that the yeast hydrolysate not only supplies nitrogen, but also polysaccharides, nucleic acid components and vitamins that contribute to the enhancement of the fermentation processes.
3.3. Optimum Nitrogen Concentration
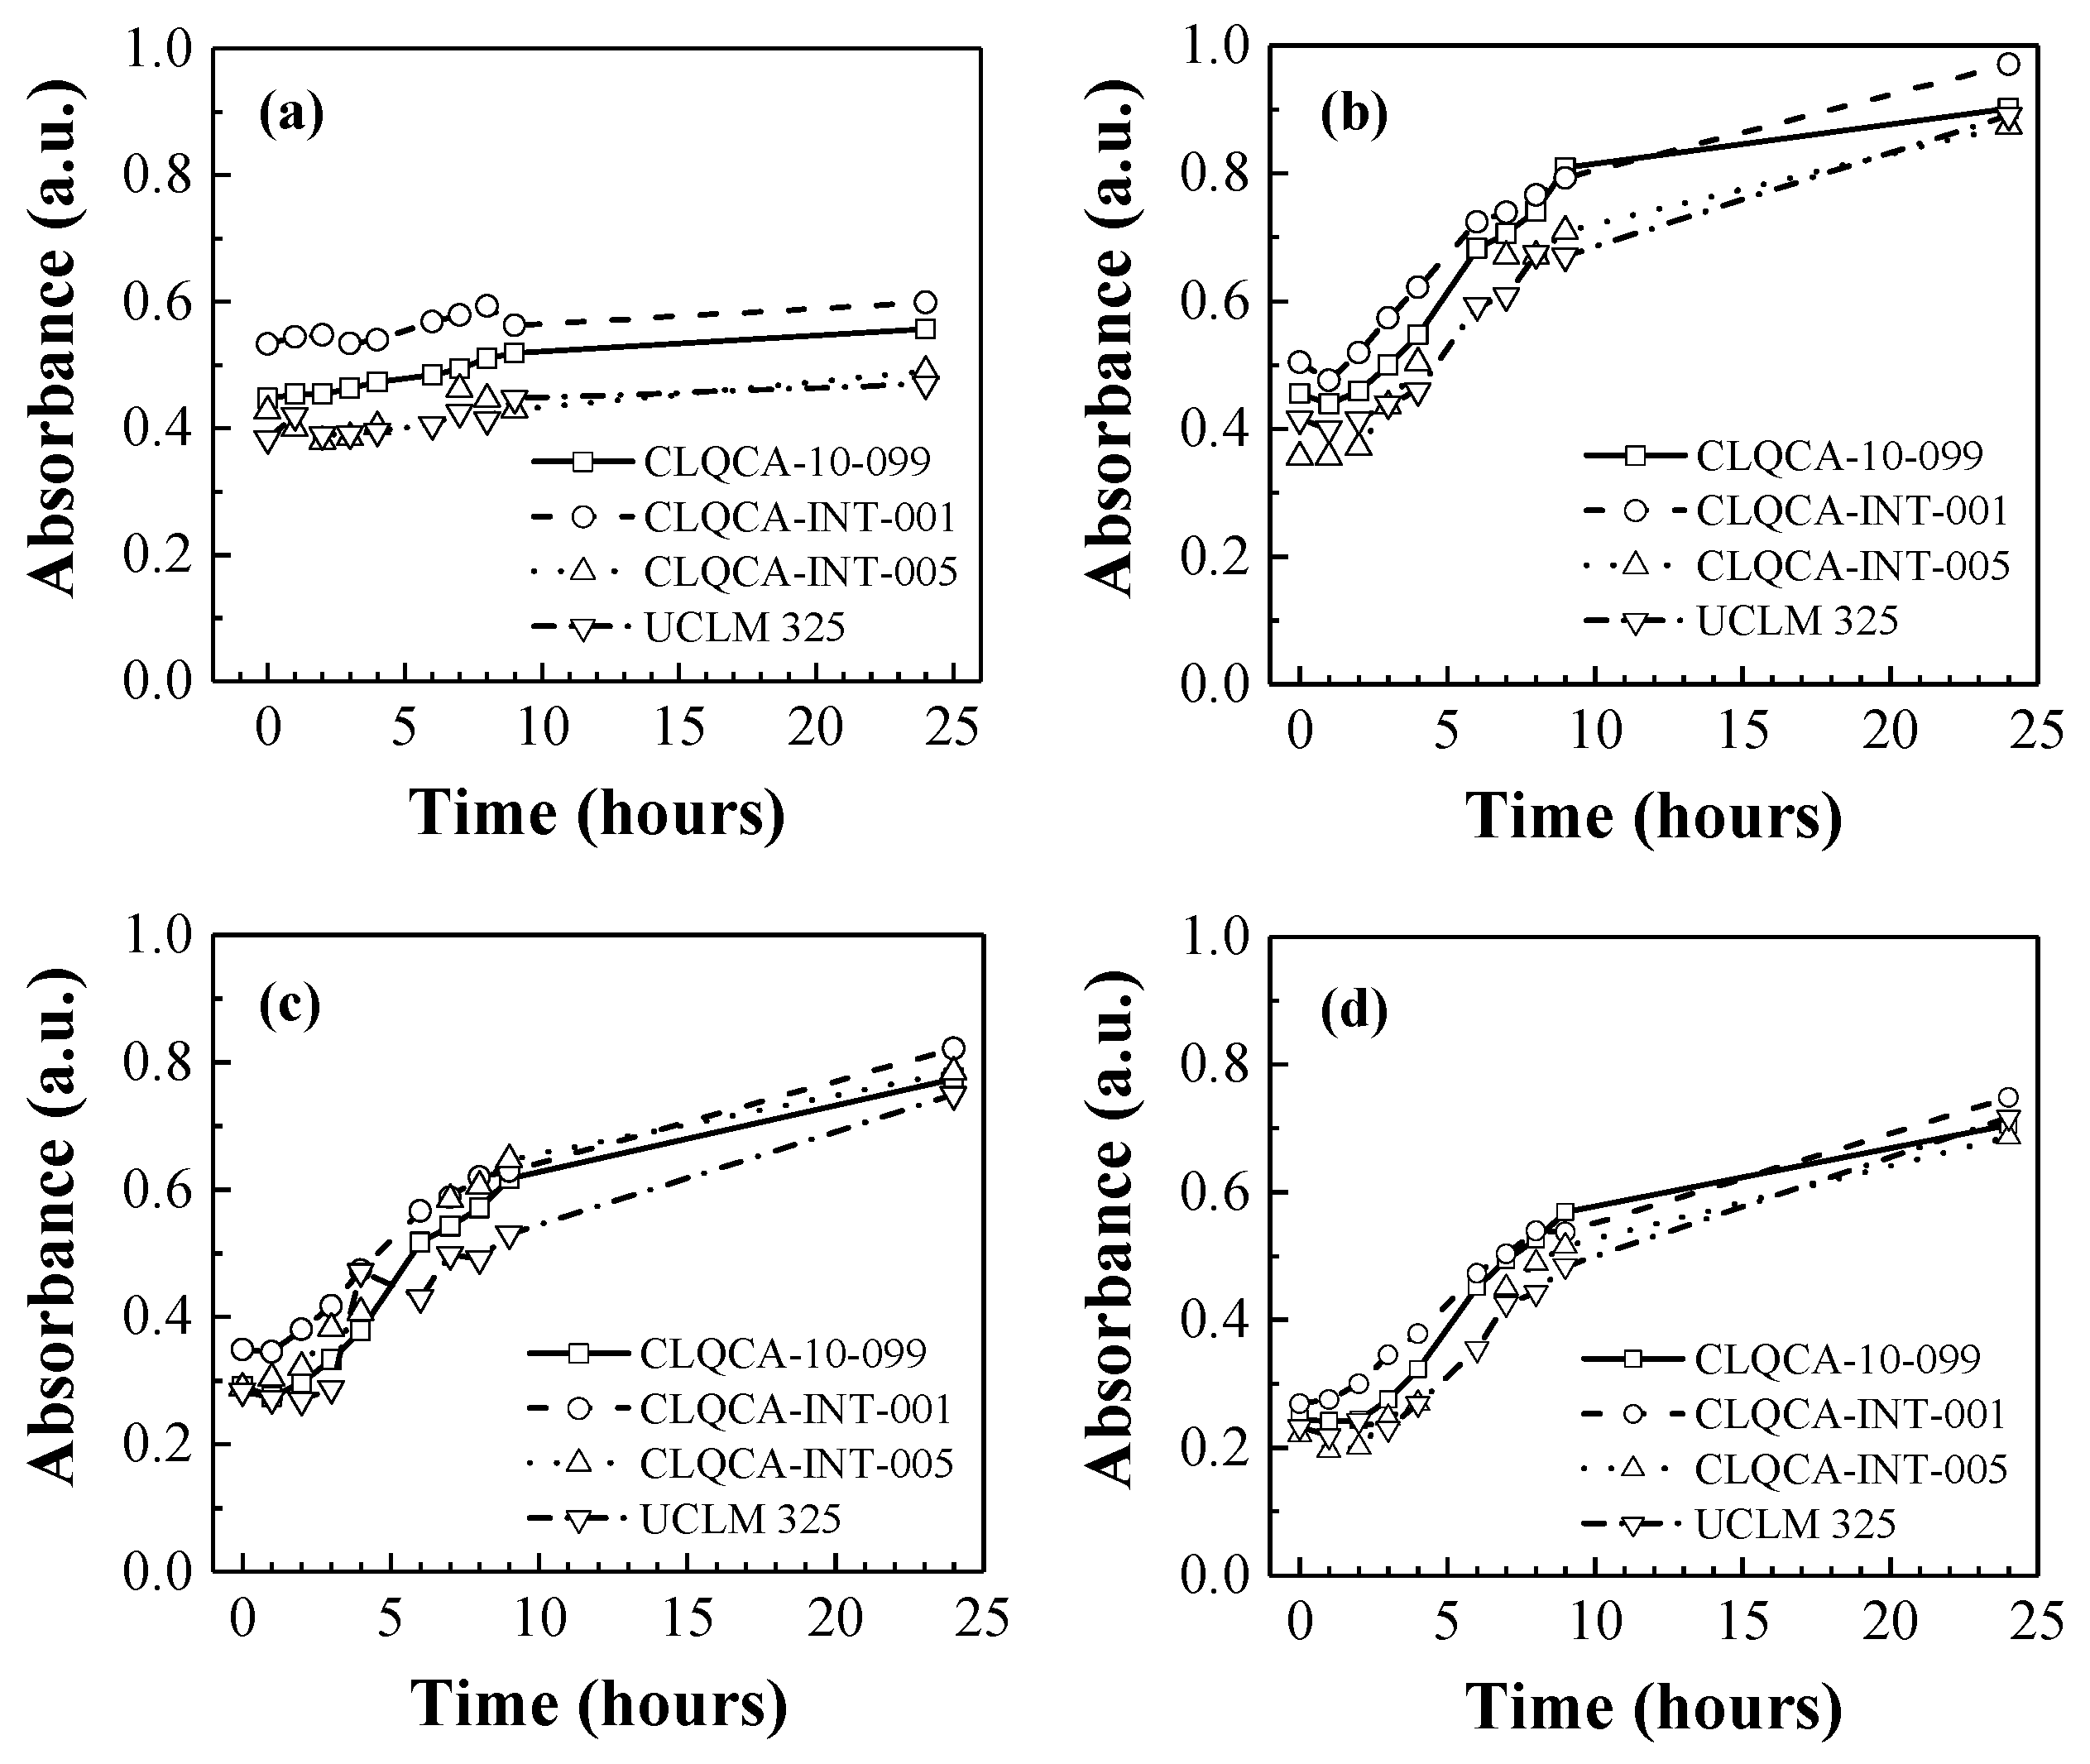
The effect of nitrogen concentration on the fermentation medium (with glucose as the sole carbon source) is shown in
Figure 1.
When no nitrogen source was added to the fermentation medium (see
Figure 1a), the population of the different
S. cerevisiae strains showed only a slight increase in cell growth as well as low glucose consumption values, ranging from 7% to 12% of the total glucose. This may indicate that nitrogen starvation conditions induced a process known as ‘autophagy’ [
20,
21]. Autophagy avoids stalling cell division and yeast cell death, maintaining the yeast’s population survival in conditions of nutrient limitation [
21,
22]. In other studies [
23,
24], it was reported that a lack of nitrogen leads to less yeast biomass production, which in turn increases the risk of sluggish or stuck fermentation, which can remarkably affect the industrial production of ethanol fuel.
Conversely, culture medium supplementation with a nitrogen source (
Figure 1b–d) led to an exponential growth of the yeast population. Glucose consumption increased in response to increasing nitrogen concentrations in the fermentation medium, being more efficient at 0.3 and 0.4 g N·L
−1.
The CLQCA-10-099, CLQCA-INT-001 and CLQCA-INT-005 yeast strains showed a glucose consumption ranging from 96.9% to 98.6%, while the UCLM 325 strain consumed between 75.5% and 88.3% after 24 h of fermentation (
Figure 2). These results indicate that the nitrogen requirements during fermentation were strongly dependent on the yeast strain, i.e., on the degree of susceptibility of each strain to low nitrogen concentrations.
As noted by Manginot et al. [
25], strains with lower nitrogen demand correspond to those with higher glucose consumption rates, resulting in higher fermentation yields. Hence, the CLQCA-10-099, CLQCA-INT-001 and CLQCA-INT-005 strains (which required less nitrogen than UCLM 325) would be able to use nitrogen in a more effective manner.
The ANOVA analysis showed that highly significant differences existed in the results obtained for the various S. cerevisiae strains, as well as for the different nitrogen concentrations tested (p < 0.001). Tukey’s HSD test, set at 0.05, indicated that 0.4 g N·L−1 and CLQCA-INT-005 were the optimum nitrogen concentration and the best yeast strain, respectively.
3.4. Co-Fermentation Culture with Cell Recycling
The glucose consumption in co-fermentation culture of the four
S. cerevisiae strains (CLQCA-10-099, CLQCA-INT-001, CLQCA-INT-005 and UCLM 325) showed that after two fermentation cycles, more than 98% of the glucose was consumed in the fermented broth (
Figure 3). As the yeasts population was recycled in consecutive fermentation cycles, their fermentation ability progressively decreased, showing values of glucose consumption of 96.97% and 95.79% in the third and fourth fermentation cycles, respectively.
According to Basso et al. [
26], cell reuse minimizes the need for initial yeast propagation and less sugar is diverted to biomass formation. Therefore, after each cycle of fermentation, yeast cells (biomass) were recovered and reused for the next cycle of fermentation, in such a way that up to 90–95% of the cells could be recycled, resulting in high cell densities usable for efficient industrial fermentation processes. Taking into consideration that fermentation processes need to be optimized in terms of performance, productivity and capital costs, the use of high densities and cell recycling in both batch and continuous fermentation is deemed as a core strategy in order to enhance the productivity of ethanol and other biotechnological products [
27].
Cell recycling has been reported to increase productivity in continuous fermentation: cellulosic ethanol productivity with yeast cells recycling can be up to 4.6 times higher than that without recycling [
28]. However, the yeast cells’ population performance depends on their viability at the end of each fermentation cycle, provided that industrial strains are subjected to the stress imposed by fermentation processes, which is further intensified by cell recycling. Thus, a research effort needs to be conducted to search for ethanol tolerant yeast strains, which can be used in high ethanol fermentations, more specifically in the case of cell recycling [
26].
3.5. Dominance of Yeast Strains in Co-Fermentation Culture
According to the restriction patterns of mitochondrial DNA (see
Figure 4), it can be inferred that after four cycles of fermentation, 80% of the population corresponded to the CLQCA-INT-005 strain, 10% to the CLQCA-INT-001 strain and 10% to the UCLM 325 strain. It is worth noting that the CLQCA-10-099 strain was completely displaced and that its growth was inhibited at the end of the fermentation, showing a lower competitiveness as compared to the other strains of
S. cerevisiae. These results highlighted the competitive differences between
S. cerevisiae strains, in which CLQCA-INT-005 showed a noticeable dominance.
S. cerevisiae strains in co-fermentation compete from the very beginning of the process, and only the strains better adapted to fermentation conditions prevail [
29]. Pérez-Torrado et al. [
30] showed differences in gene expression between dominant and non-dominant
S. cerevisiae strains in co-culture. They identified over-expressing genes when yeast strains were in competition conditions. The expression of such genes might be key for both attacking and protecting the yeast cell under co-culture-born stress. Thus, it is a determining factor in the dominance of a particular yeast strain over others in co-culture conditions.
The performance of each strain in co-culture may also be attributed to extrinsic factors such as temperature, pH and nutrients availability, as well as to the sensitivity to metabolic products, and to the susceptibility of killer factors excreted by other strains. Finally, the spatial density of yeasts may also play a role [
31].
In our study, the CLQCA-INT-005 strain showed fitness advantages: it was more robust and dominant in co-culture during cell recycling than the other strains assayed, evidencing better traits. Consequently, it may be regarded as a particularly suitable strain for industrial ethanol production.
3.6. Batch Fermentation Kinetics and Ethanol Yield
The batch fermentation kinetics and ethanol yield were evaluated for each of the three S. cerevisiae strains that showed a better performance in terms of glucose uptake (the UCLM 325 strain was not included in the analysis due to its low glucose consumption).
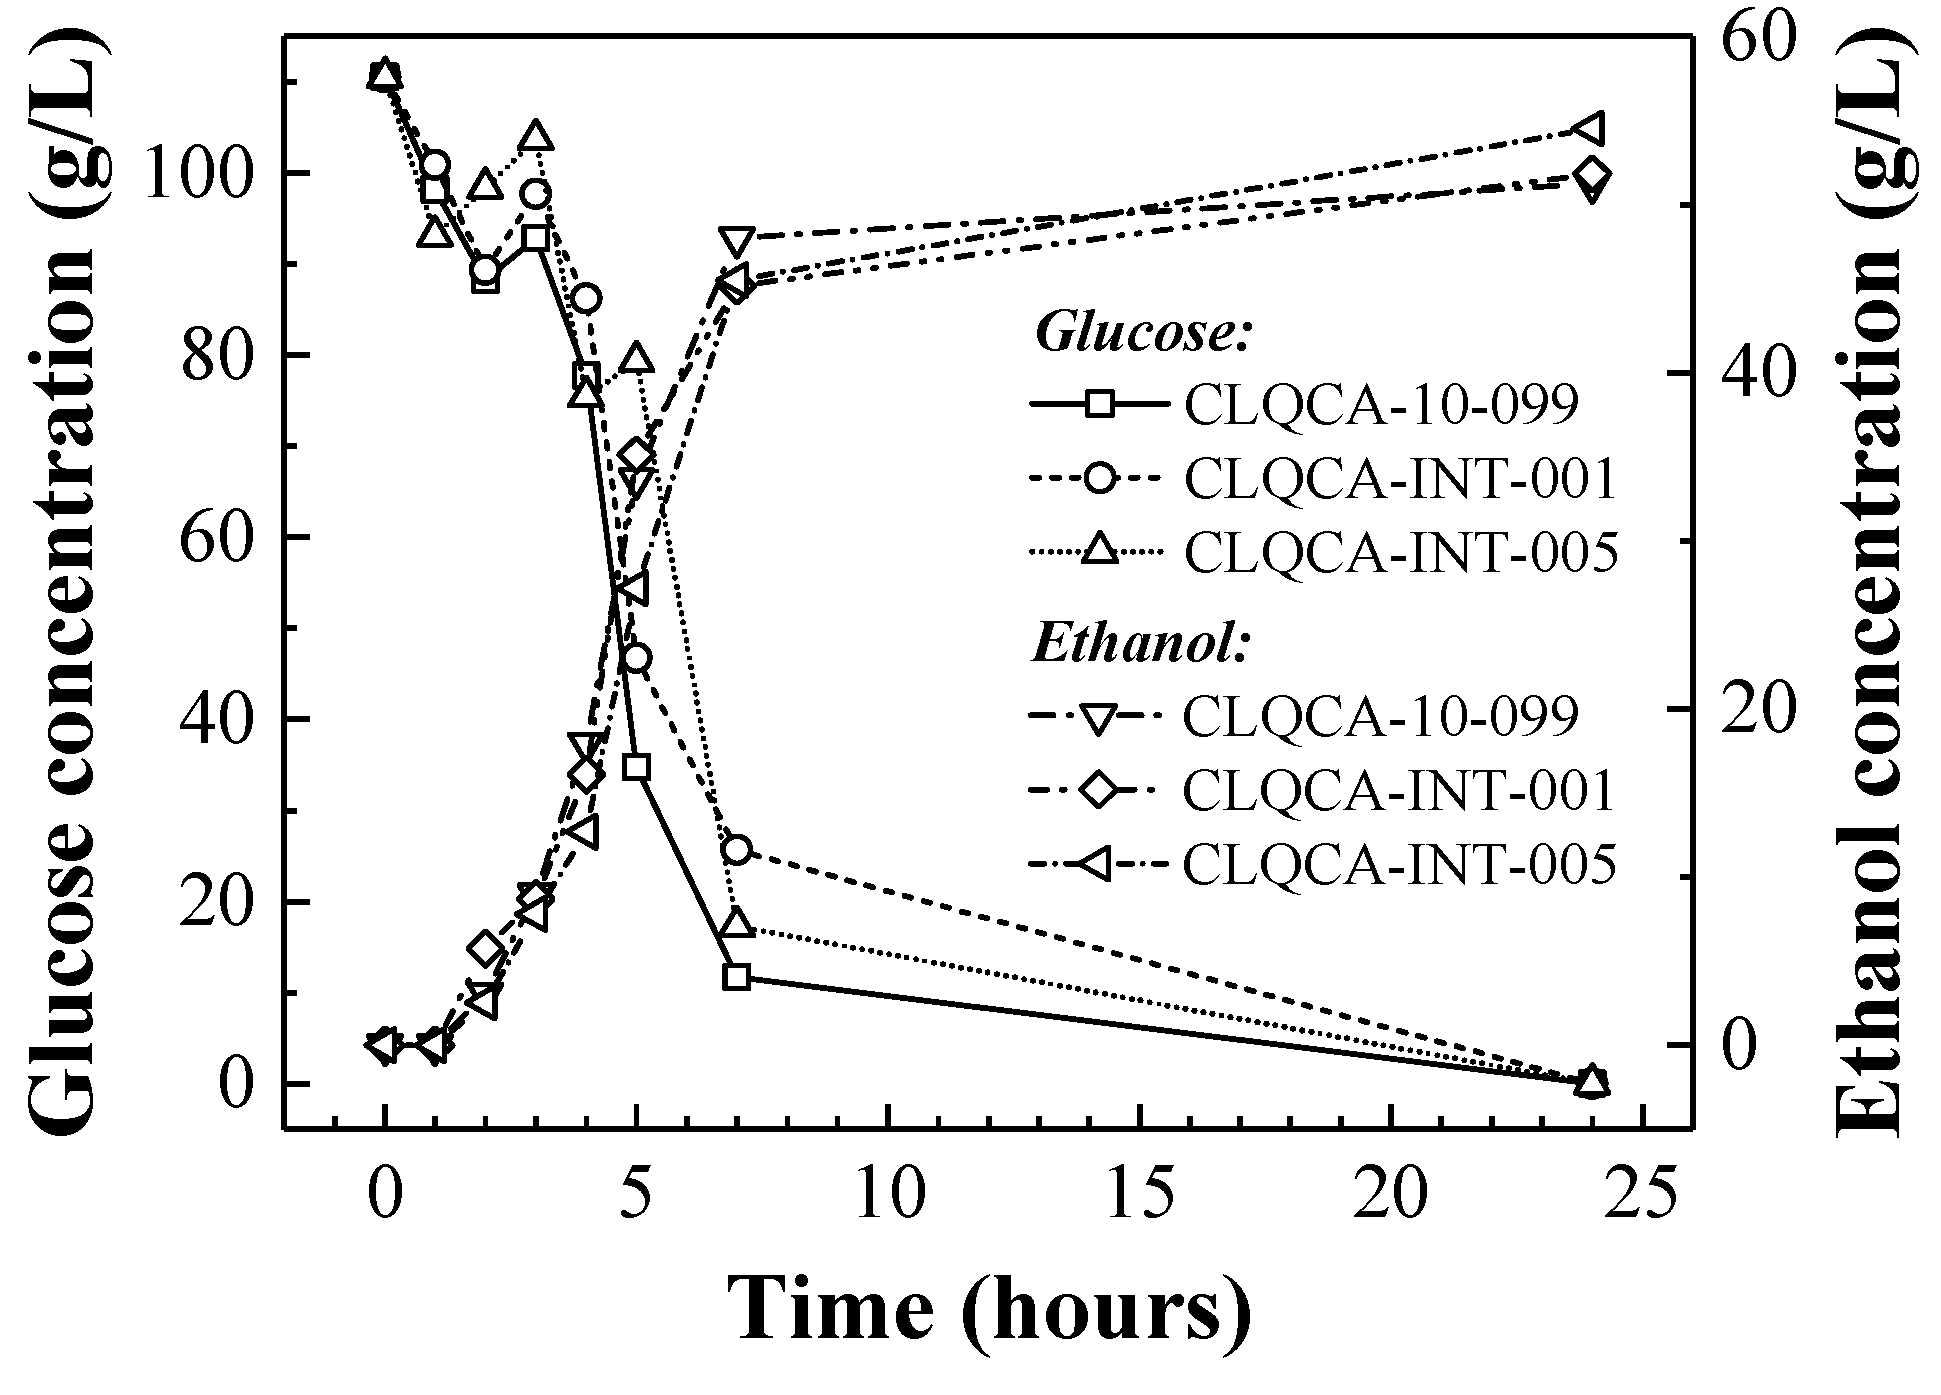
The three strains were incubated in a fermentation medium at the optimum nitrogen concentration (0.4 g N·L
−1), and glucose uptake and ethanol production were monitored for each of them during a 24 h period (
Figure 5). The most remarkable differences between the yeast strains performance were noticeable after 7 h of fermentation. Although the CLQCA-10-099 strain showed the highest rate of sugar uptake, the depletion of glucose was equalized for a 24 h period for all the strains. Therefore, there is a sharp difference between the sugars’ fermentation rate and the ethanol yield of yeast strains. In such case, the attenuation of fermentable sugars is the parameter directly related to ethanol yields and it is independent of the sugar uptake rates.
As expected, the yeast strains exhibited significant differences in terms of ethanol yield, ranging from 0.46 to 0.49 g·g
−1 (in grams of ethanol produced per gram of glucose consumed) after 24 h. In a study by Li et al. [
32] on the glucose-fermenting ability of wild-type
S. cerevisiae strains for second-generation bioethanol production, they found that only 15% of the strains showed ethanol yields between 0.421 and 0.451 g·g
−1, corresponding to ethanol yields of 82.5% and 88.4%, respectively. Similarly, Pereira et al. [
33], who studied the cellulosic fermentation process with
S. cerevisiae and
K. marxianus strains isolated from industrial environments, reported a theoretical ethanol yield of up to 94% (0.48 g ethanol produced per g of glucose consumed). In the present study, the highest ethanol yield, calculated at the end of the fermentation, was attained by the CLQCA-INT-005 strain (0.49 g·g
−1), showing a 96.72% ethanol theoretical yield (
Table 2).
4. Conclusions
The selection of an adequate nitrogen source and concentration for media supplementation, as well as the choice of an appropriate yeast strain, are key factors in efficient fermentation processes. In this study, yeast hydrolysate led to significantly better results than ammonium phosphate and ammonia as a nitrogen source, and 0.4 g N·L−1 was found to be the optimum dose. With regard to the yeast isolates selection, 150 S. cerevisiae isolates from Ecuadorian natural environments that can be considered as non-domesticated yeast strains were screened, and four strains were shortlisted (CLQCA-INT-001, CLQCA-INT-005 and CLQCA-10-099, and UCLM 325) on the basis of their assimilation and fermentation profiles and their high theoretical ethanol yields (>90%). Yeast strain dominance was evaluated in continuous co-fermentation with cellular recycling, and a clear dominance of the CLQCA-INT-005 strain was found after four cycles. Moreover, this strain also showed the best ethanol yield (96.72%). In view of its excellent productivity and ability to adapt to the fermentation process, this strain is put forward as a very promising candidate for the production of industrial ethanol.


 ,
, 


