Abstract
Renewable energy sources can help the countries to achieve some of the Sustainable Development Goals (SDGs) provided from the recent 2030 Agenda, allowing for clean, secure, reliable and affordable energy. Biomass technology is a relevant renewable energy to contribute to reach a clean and affordable energy production system with important emissions reduction of greenhouse gases (GHG). An innovative technological application of biomass energy consisting of a burner coupled with an external fired gas turbine (EFGT) has been developed for the production of electricity. This paper shows the results of the plant modelling by Aspen Plus environment and preliminary experimental tests; the validation of the proposed model allows for the main parameters to be defined that regulate the energy production plant supplied by woodchips.
1. Introduction
In the current worldwide scenario, the limited availability of the fossil fuel reserves and the environmental impact generated by their use, especially the global warming, are implying a constant attention towards the use of renewable sources for energy production.
Thus, the renovation of the energy sector as a result of the European climate targets is playing a key role. In 2015, the Member States of the United Nations decided to implement the 2030 Agenda for sustainable development [1]. Taking into account the main features defined in the previous Millennium Development Goals (MDGs) in the 2000–2015 period [2], the 2030 Agenda considers the economic, social and environmental aspects for the sustainability. The Agenda is based on 17 universal Sustainable Development Goals (SDGs) considering various issues, including the elimination of poverty and hunger, providing education and health services for all, preserving our environment and improving the living conditions basing on the fairness and operative institutions principles [3]. The SDGs on climate action are strongly linked to the Paris Climate Change Agreement, the outcome of the 21st Conference of the Parties (COP21) of the United Nations Conference on Climate Change. The SDGs provide 169 targets that should be obtained by 2030.
In this perspective, renewable power generation can help the countries to achieve their 17 SDGs, through the access to clean, secure, reliable and affordable energy [4]. Various market instruments are used by governments of EU Member States to support energy production from renewable energy sources [5]. To address this change, biomass is considered as one of the most important vectors for the energy request in the electricity and transport fields. Actually, biomass combustion is one of the fundamental technologies followed for bioenergy [6,7]. For these reasons, gasification is considered a fundamental process to achieve an homogeneous gaseous fuel that presents good thermochemical combustion aspects, as knock tendency [8] and flame front speed respect to fossil fuels, and that could be employed, subsequently the specific gas cleaning operations, as fuel in internal combustion engines or gas turbines [9].
Biomass is mainly utilized in cogeneration plants. A high efficiency cogeneration is the consequence of a proper identification of the energy from the used biomass and the delivered useful heat. A proper analysis of the specific operating conditions of the combined heat and power (CHP) plants is a priority to maximize the primary energy savings. Further developments are needed in order to optimize the efficiency of the process and to ensure a reduced environmental impact [10].
In development of biomass gasification technologies, one of the critical aspects is tar formation [11]. With respect to fossil fuels, biomass is difficult to burn in a clean and efficient way. In biomass gasification, main pollutant emissions are represented from nitrogen oxides (NOx), particulate matter (PM), carbon monoxide (CO) and other unburned pollutants [12]. It is known that NOx formation from fuel-bound nitrogen is one of the main sources of NOx production [13]. Emission of unburnt pollutants such as soot, CO and polycyclic aromatic hydrocarbons (PAH) depends on the development of the combustion process, the combustion operating conditions, and the fuel properties [14]. Features such as the air ratio, combustion temperature, mixing quality and residence time could affect the pollutant emissions during energy conversion processes [15,16]. On the other hand, the choice of the burner and the source to be used in the process assumes an important role in biomass applications [17].
Mathematical modelling helps to simulate combustion process and pollutant formation in various furnace geometries. Different approaches have been used to simulate the biomass gasification process, as kinetic modelling, equilibrium modelling, computational fluid dynamics (CFD) analysis. Numerical simulations help to understand and to evaluate the physical and chemical processes involved in the biomass technologies [18]. Yin et al. considered different fixed biomass combustion numerical approaches [19]. They analysed the separation of the simulation of the bed and the freeboard despite their strong coupling. Actually, the output performance of a burner is frequently modelled by means of Aspen Plus code [20,21,22,23].
Han et al. developed a model for a biomass burner using Aspen Plus in order to minimize the Gibbs free energy focusing on the chemical reaction equilibrium [17]. They underlined the importance of temperature in the burner, equivalence ratio, and biomass humidity amount of the syngas obtained.
Gagliano, et al. [24] developed a model considering different operation conditions, amount and different kind of biomasses by means of Aspen Plus. They compared the numerical results obtained from the simulation with experimental measurement for sixteen cases.
There are many variables that influence biomass energy plant performances: cost and quality of the woodchips, possibility of enhancing the generated heat, plant size and personnel costs and maintenance, investment cost of the plant.
In the biomass processes, the local wood is frequently used as fuel.
In this work the used biomass consists of a mixture of woodchips of maritime pine (70% wt) and cypress (30% wt). The mixture average moisture is 7.84%; its average higher heating value is 19.03 MJ/kg. It is a byproduct of biological origin derived from forest management (e.g., waste derived from the processing of forest products, pruning, twigs and residues from the maintenance of public or private green areas). By producing electricity from this product, the incentive tariff established by the Italian regulation 23 June 2016 [25], promotes the “byproduct” supply chain and provides a greater incentive.
In this paper, a multifuel biomass energy plant connected to an external fired gas turbine (EFGT) system is considered. An EFGT cycle is based on a conventional gas cycle, in which the direct combustion is replaced by a heat exchanger that allows the heating of the working fluid, usually air. In an EFGT cycle, the combustion process takes place outside the turbine, in a combustion chamber or furnace and the produced exhaust gases are used to heat, through the heat exchanger at high temperature, the compressed air which evolves in the turbine producing energy. Analyzing the characteristics related to the internal combustion turbogas systems, a certain limitation is evident to their development linked in many ways to the use of the raw material. These, like the internal combustion engines, require clean fuels, since the combustion gases are in direct contact with the moving metal components of the plant. In the following section, the tested biomass plant and its components will be described and the obtained results by the monitoring phase will be analyzed. The authors start from their previous studies of [26] to further investigate the influence of the main parameters involved in a CHP plant on the produced pollutant chemical species. After the description of the considered experimental apparatus, a numerical model is described, developed by means of Aspen Plus simulator. The scientific goal of the paper is to verify and validate the appliance of the proposed Aspen Plus models to the tested CHP multifuel plant supplied by maritime pine and cypress wood chips; the analysis was conducted by comparing experimental data with the simulation results.
2. Experimental Apparatus
The experimental set-up is a multifuel biomass energy plant installed at the Biomass Research Centre of the University of Perugia.
The plant is constituted by:
- -
- a biomass storage and loading section;
- -
- a combustion chamber;
- -
- an air/exhaust gases heat exchanger;
- -
- a gas turbine.
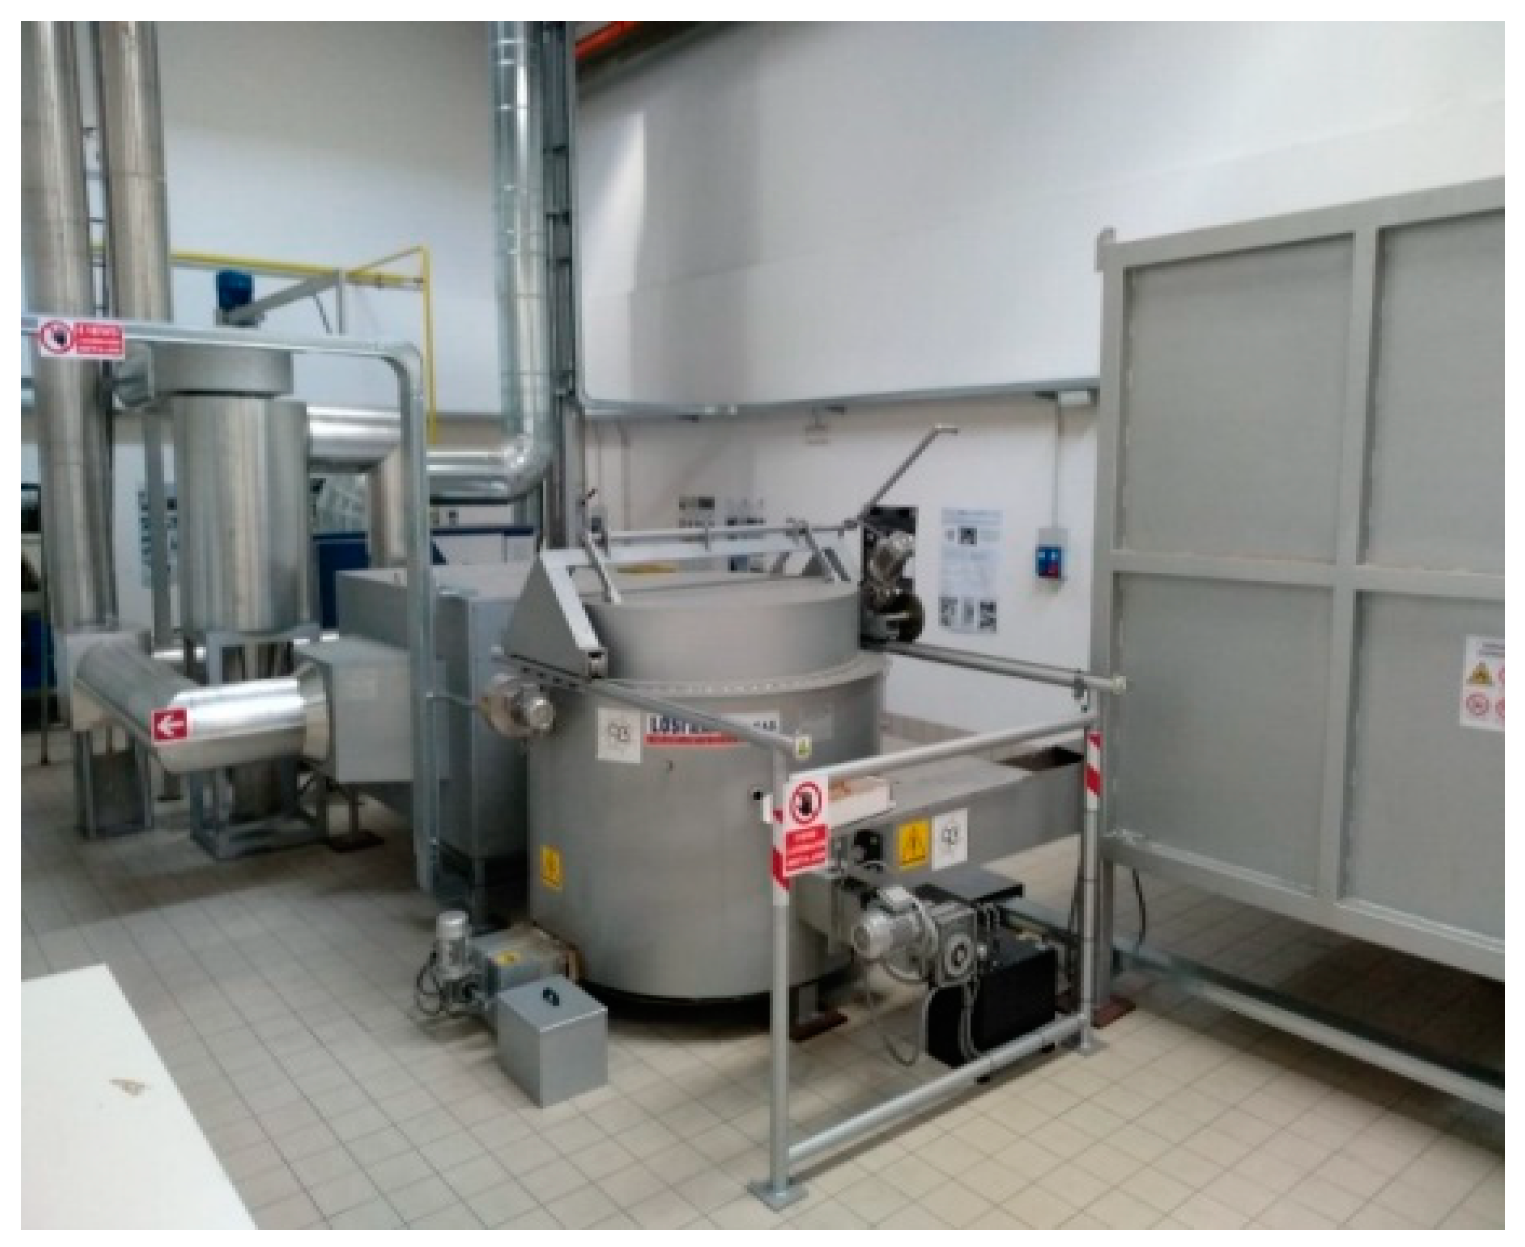
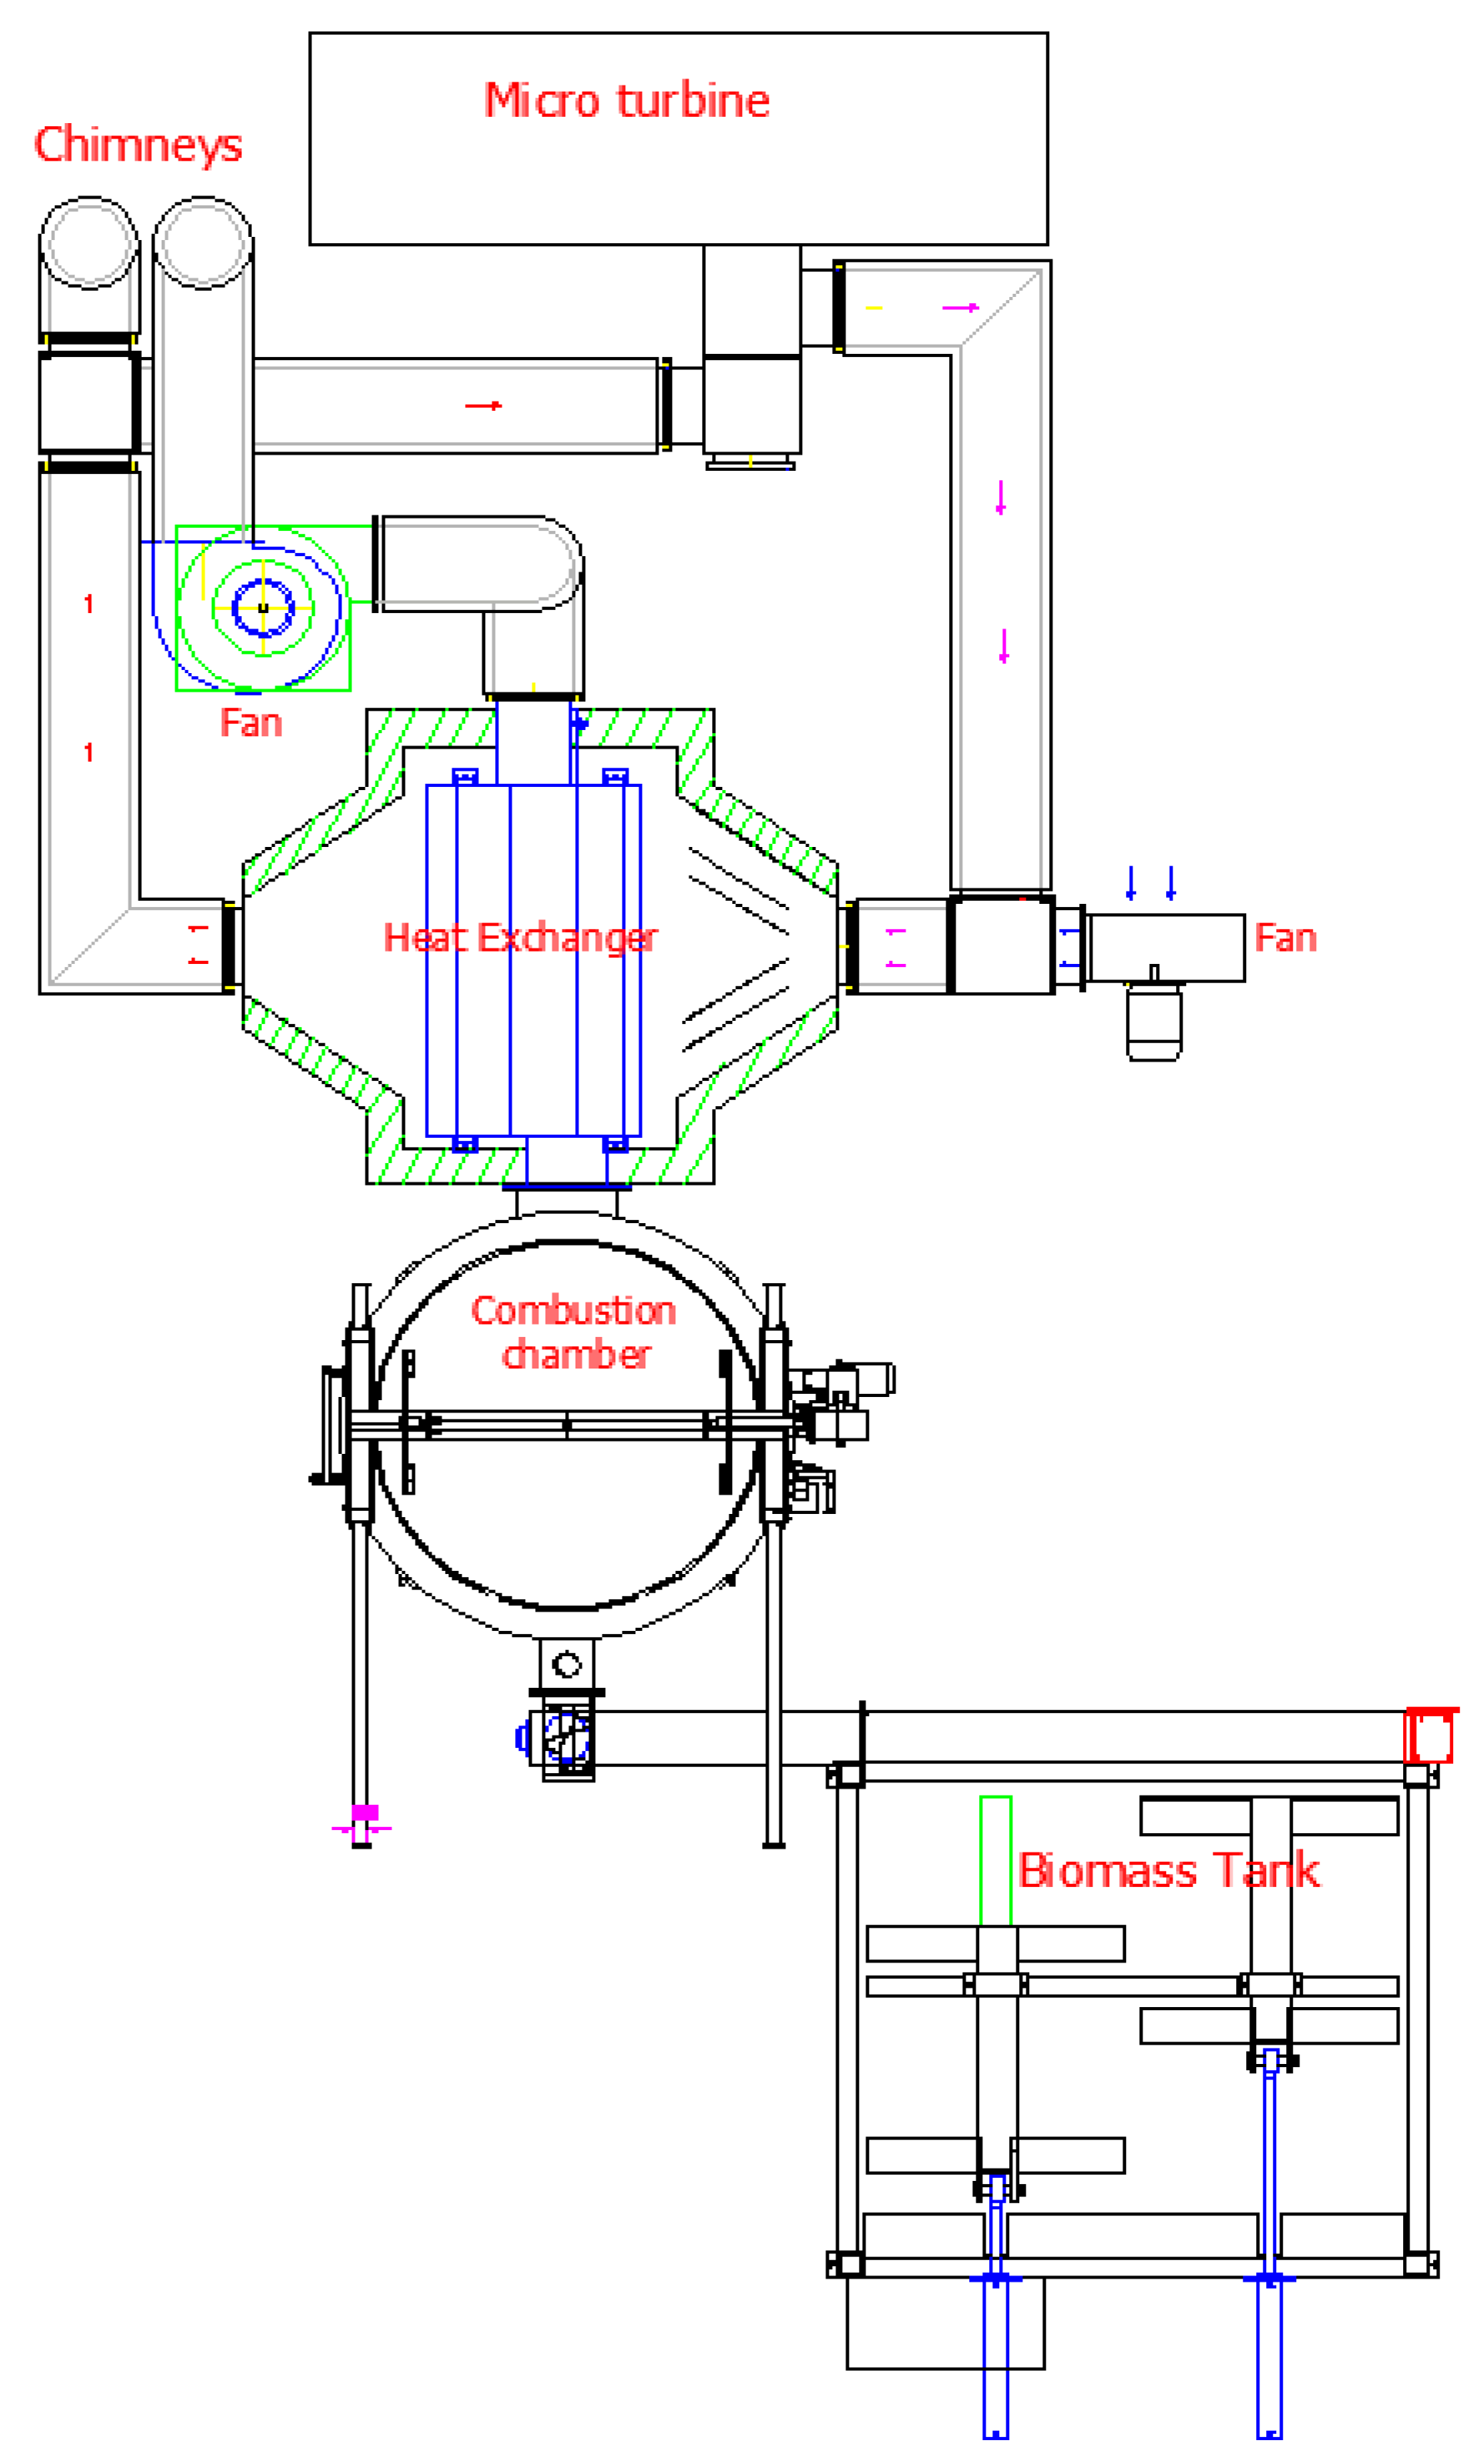
A loading hopper allows to fill the storage tank with wood chips. The wood chips, pushed by a rake system, are moved towards a cochlea, driven by a 1.5 kW power electric motor. Thus, the fuel is supplied to the burner for heat generation through the combustion process. Thermal energy may be exchanged from exhaust gases to air in the heat exchanger section. A cyclone installed at the output of the exhaust gas duct reduces the particulate and fly ash emissions. Subsequently, thanks to a suction fan, the exhaust gases are evacuated through the piping system that leads up to the chimney. The multifuel biomass energy plant is also composed of a microturbine such as to guarantee a 100 kW electric net power, excluding the consumption of the plant. For the microturbine, two operating different configurations are possible: supplied by natural gas or connected to the biomass combustion chamber by the air/exhaust gases heat exchanger (external combustion configuration). An electrical efficiency in operation with natural gas above 25% is guaranteed from the system. The external combustion configuration is the one investigated in this paper. The investigated biomass combustion system has a thermal power of about 1 MWt. The alternator is equipped with the connection system to the parallel panel of the national electricity grid (and/or to a 100 kW resistive load bench). The alternator allows to achieve the minimum energy consumption during the start-up and to have the electronic instrumentation for the adaptation of voltage and frequency of the electric current produced to the three-phase voltage and to the frequency (50 Hz) of the national electricity grid. A control system allows to manage and measure gas and air flow rates and temperatures in different strategic points. The entire plant is shown in Figure 1 (photo) and Figure 2 (plant layout).
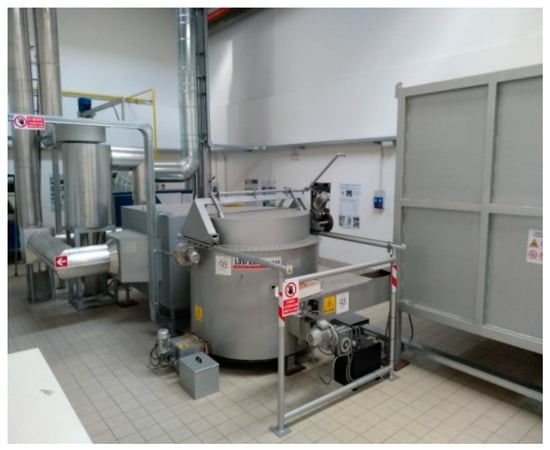
Figure 1.
The investigated combined heat and power biomass plant.
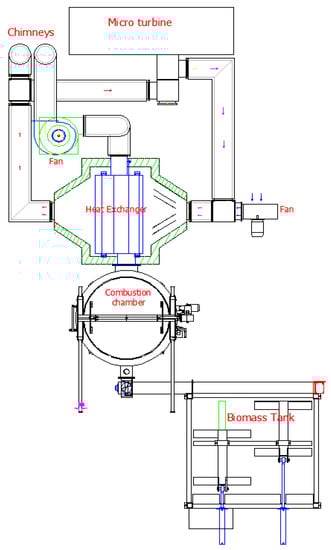
Figure 2.
The layout of the investigated plant.
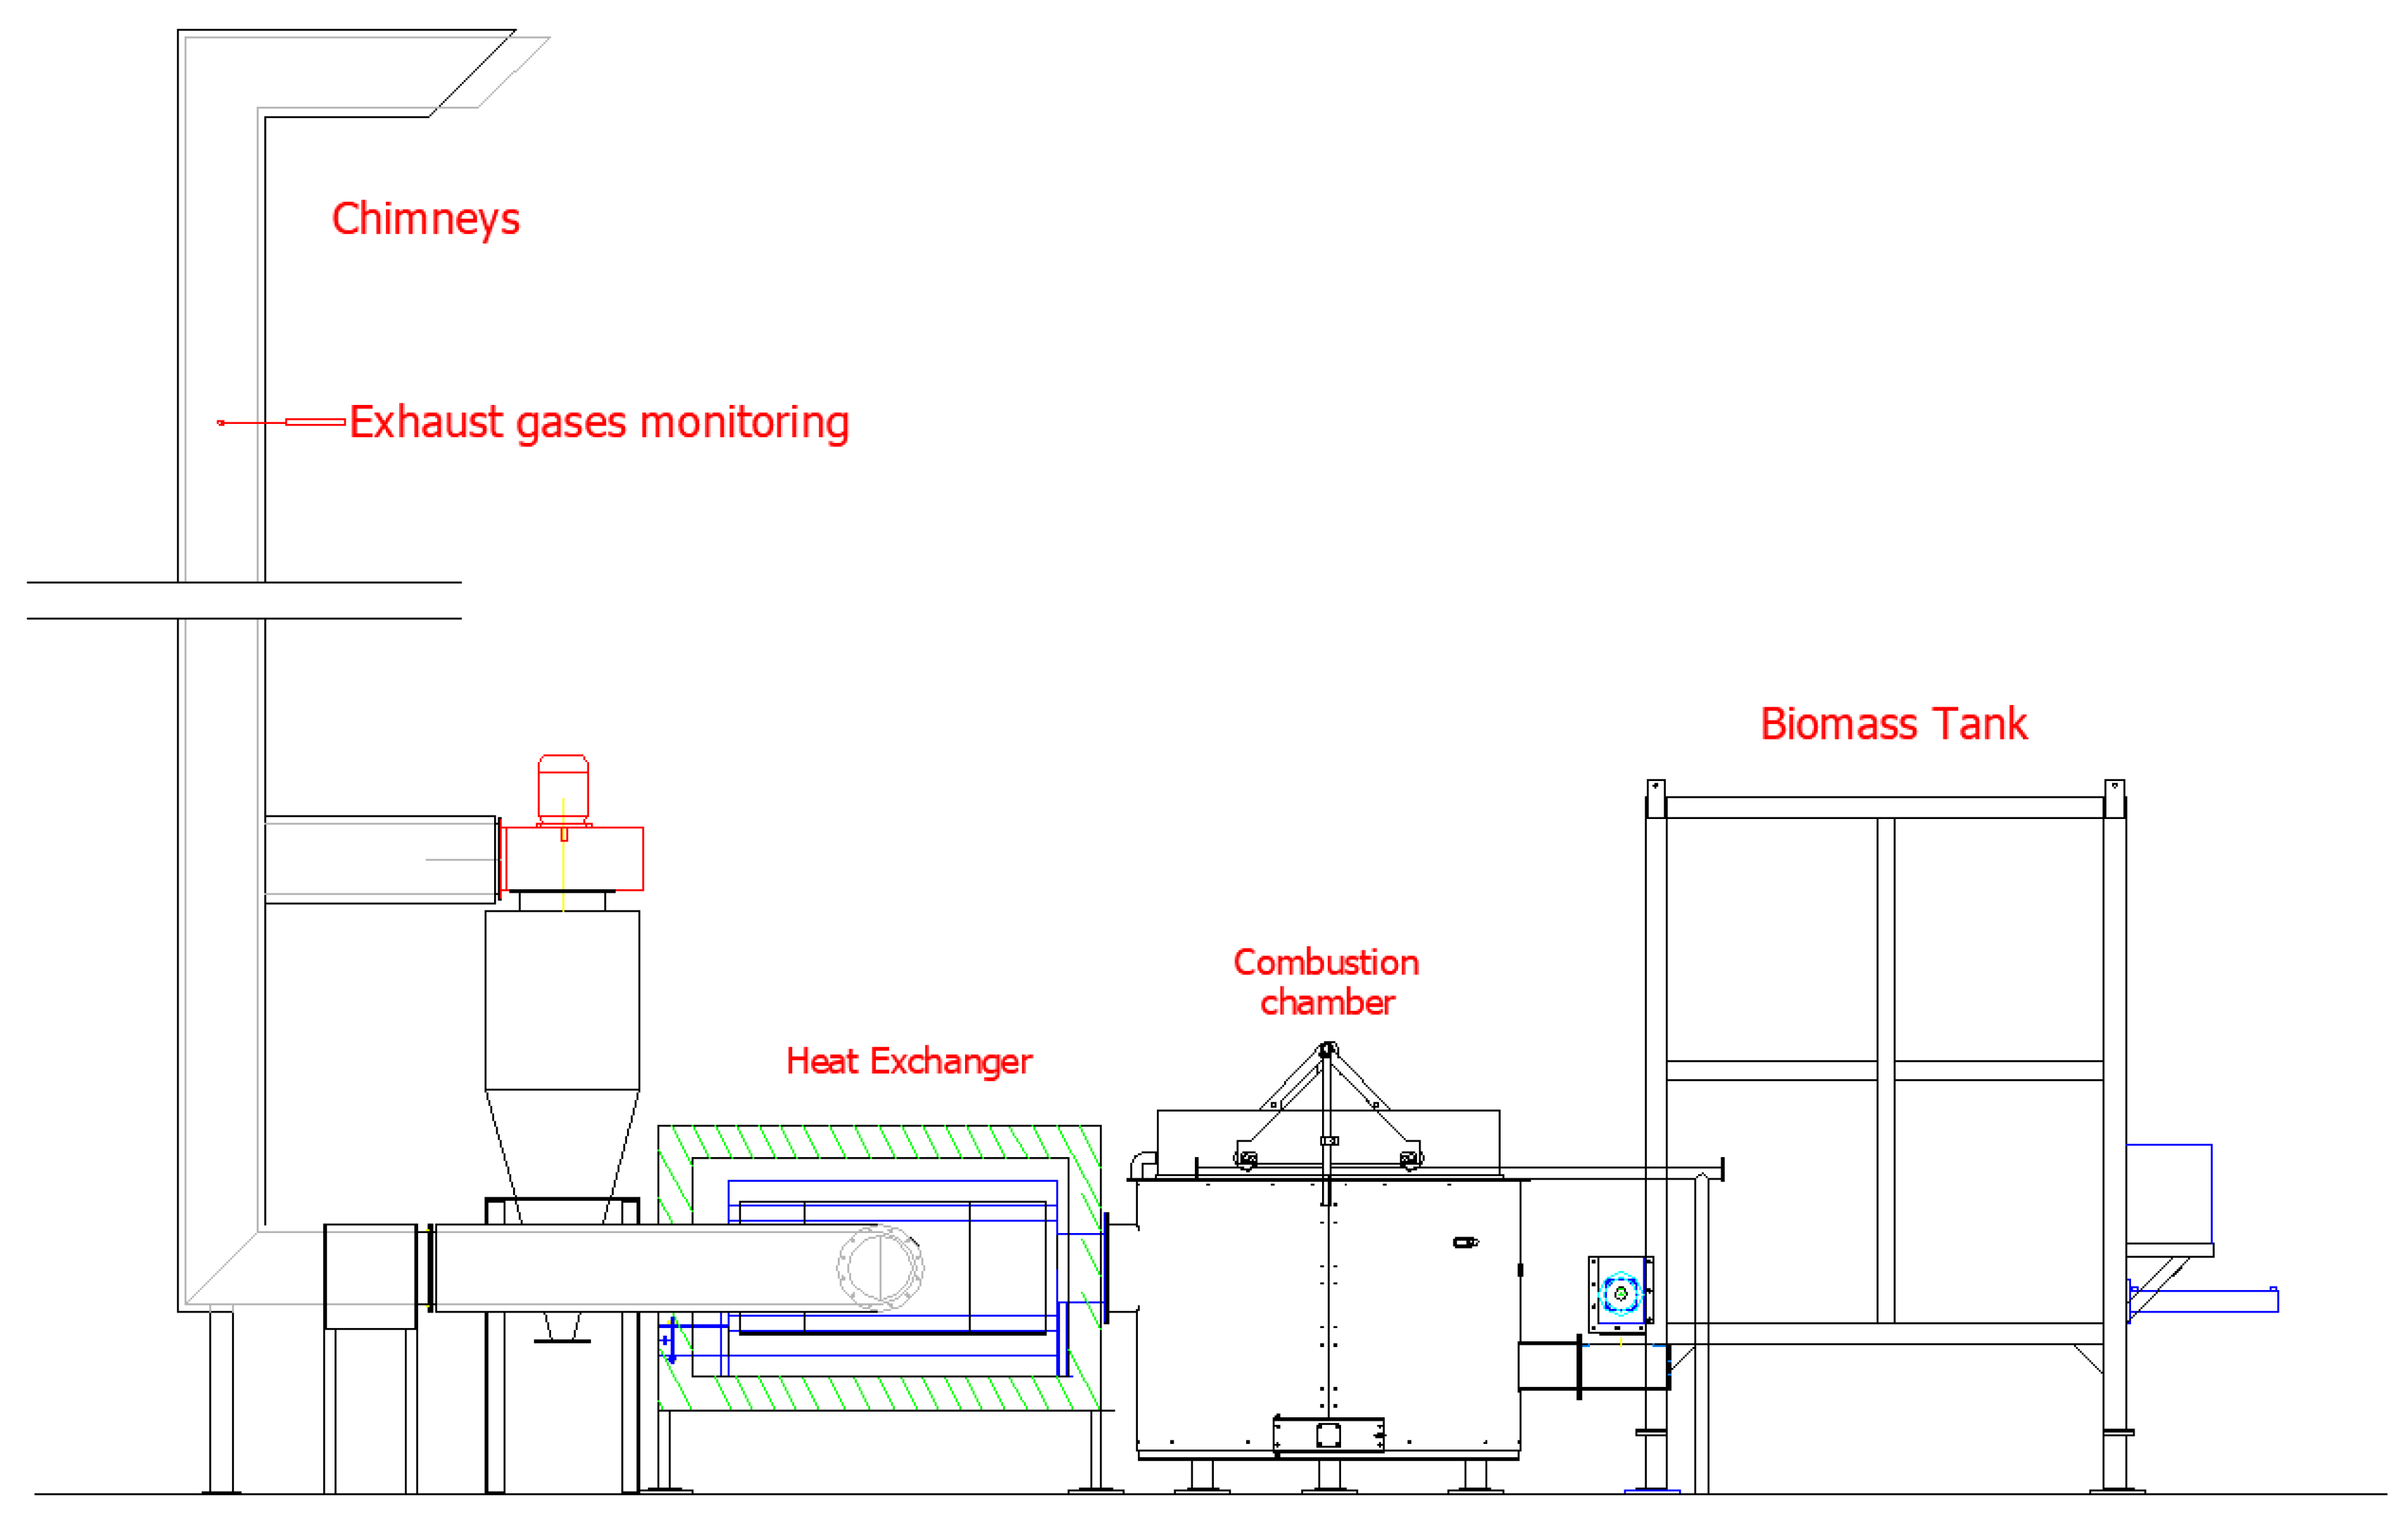
Many thermocouples are installed in the investigated plant to detect temperatures values in different sections: inlet air; combustion chamber; exhaust gases monitoring on the chimney; cement that surrounds the combustion chamber. A monitoring system for exhaust gases analysis is also installed and its position is shown in Figure 3. Furthermore, specific sensors inserted inside the pipelines allow to determine the flow rates of the fluids (exhaust gases, air).
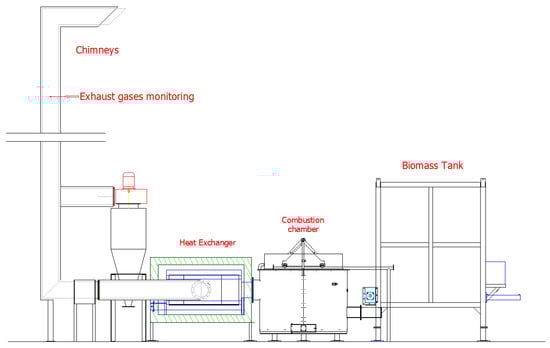
Figure 3.
Front view of the plant and exhaust gases monitoring position.
2.1. Biomass Characterization
A physical, chemical and energy characterization of the used biomass was carried out, by means of specific equipment, manufactured and sourced by technical laboratories from Rome:
- -
- a LECO AC-350 calorimeter for biomass heating value measurement by isoperibolic method;
- -
- a LECO-TGA701 thermogravimetric analyser for biomass moisture content measurement;
- -
- a LECO Truspec carbon hydrogen and nitrogen (CHN) analyser for the determination of biomass carbon, hydrogen and nitrogen concentration.
Ten biomass samples were analysed and the average measured values are the followings:
- -
- higher heating value = 19.03 MJ/kg;
- -
- moisture content = 7.84%;
- -
- C (carbon) = 47.1%, H (hydrogen) = 6.1%, N (nitrogen) = 1.2%.
2.2. Working Cycle
The ignition protocol of the combustion plant powered by solid biomass involves four phases:
- Ignition phase up to a flue gas temperature of 120 °C;
- Heating phase, up to the temperature of the exhaust gases of 300 °C;
- Phase in steady state, up to the leaving air temperature of the exchanger equal to 750 °C (at least);
- Extinguishing phase, up to a flue gas temperature of 100 °C.
The parameters relating to these phases are initially set and depend on the physical–chemical characteristics of the incoming poly-combustible (heating value, size, moisture, hardness), the temperature of the refractory cement, the temperature, speed and moisture of the inlet air involved in the combustion.
The system is started by means of a special control selector located on the control panel. A management software allows to monitor all the parameters of the pilot plant in order to guarantee a correct operation.
The on/off protocol consists of the following steps:
- Automatic cycle start: procedure that enables the hopper rake, the hydraulic hopper pump, the load solenoid valve, the burner loading screw and the hopper screw. This phase lasts 20 min;
- Ignition of the oil burner;
- Loading the biomass up to filling the cochlea;
- Flame ignition of the biomass, checking the presence of the flame from the inspection peephole located in the burner wall. Duration of the phase: 15 min;
- Ignition of the depressor;
- Starting the loading auger after 5 min, with 5 cycles consisting of 2 min of loading and 2 min of pause, checking that the cochlea remains in operation;
- Automatic shutdown of the pilot plant in case the temperature of the exhaust gases decreases up to 100 °C;
- Start of the heating phase and the steady state phase, in which the oxygenators, the rakes of the grid, the fan located downstream of the exchanger, the cochlea to transport the ash from the burner, are activated;
- Start switching off from the control panel; the phase ends when the temperature of the exhaust gases equal to 100 °C is reached.
Therefore, the plant is monitored in all its phases and, starting from the first ignition phase, the first data are acquired, through the software that manages the system, by detecting data from different thermocouples located at various points.
Some thermocouples are located in the burner and in the monolithic refractory cement. Tecora flowtest meter has been used to detect air temperature at the exhaust of the exchanger the.
Testo t350S is used as equipment during the measurement of temperature and for the analysis of combustion exhaust gases through a thermocouple and the pre-calibrated sensors for oxygen and carbon monoxide. The thermometer probe allows to have a measuring range from −200 °C to +1370 °C, with uncertainty ±0.4 °C (range −100 °C to +200 °C) and ±1 °C (range 200.1 °C to +1370 °C), with a resolution of 0.1 °C (range −200 °C to +1370 °C). The oxygen sensor allows to have a measurement range from 0 to +25% in volume with a resolution of 0.01%; the carbon monoxide meter and the nitrogen oxides meter allow a measurement from 0 to 4000 ppm with a resolution of 1 ppm.
The temperature of the combustion exhaust gases versus time is shown in Figure 4.
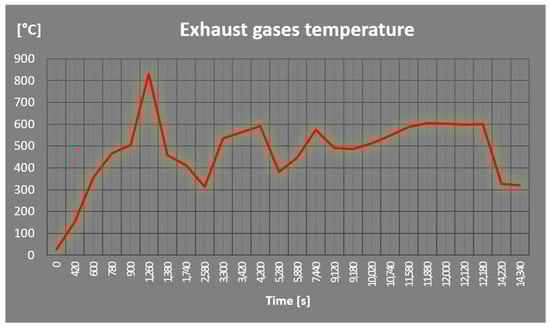
Figure 4.
The temperature of the exhaust gases.
As can be seen from the graph, the temperature has an initially increasing trend up to a maximum value, then it decreases and stabilizes in a range between 400–600 °C.
The purpose is to regulate the flow of incoming biomass and at the same time to limit the maximum temperatures by putting safety blocks. By continuously checking the reached temperature, the rotation speed of the electric motors of the power system has been adjusted. With regard to the safety levels, a maximum flue gas temperature of 600 °C is set (for practical reasons, to avoid further blockages), which, once reached, stopped the fuel supply and consequently the fuel temperature increase.
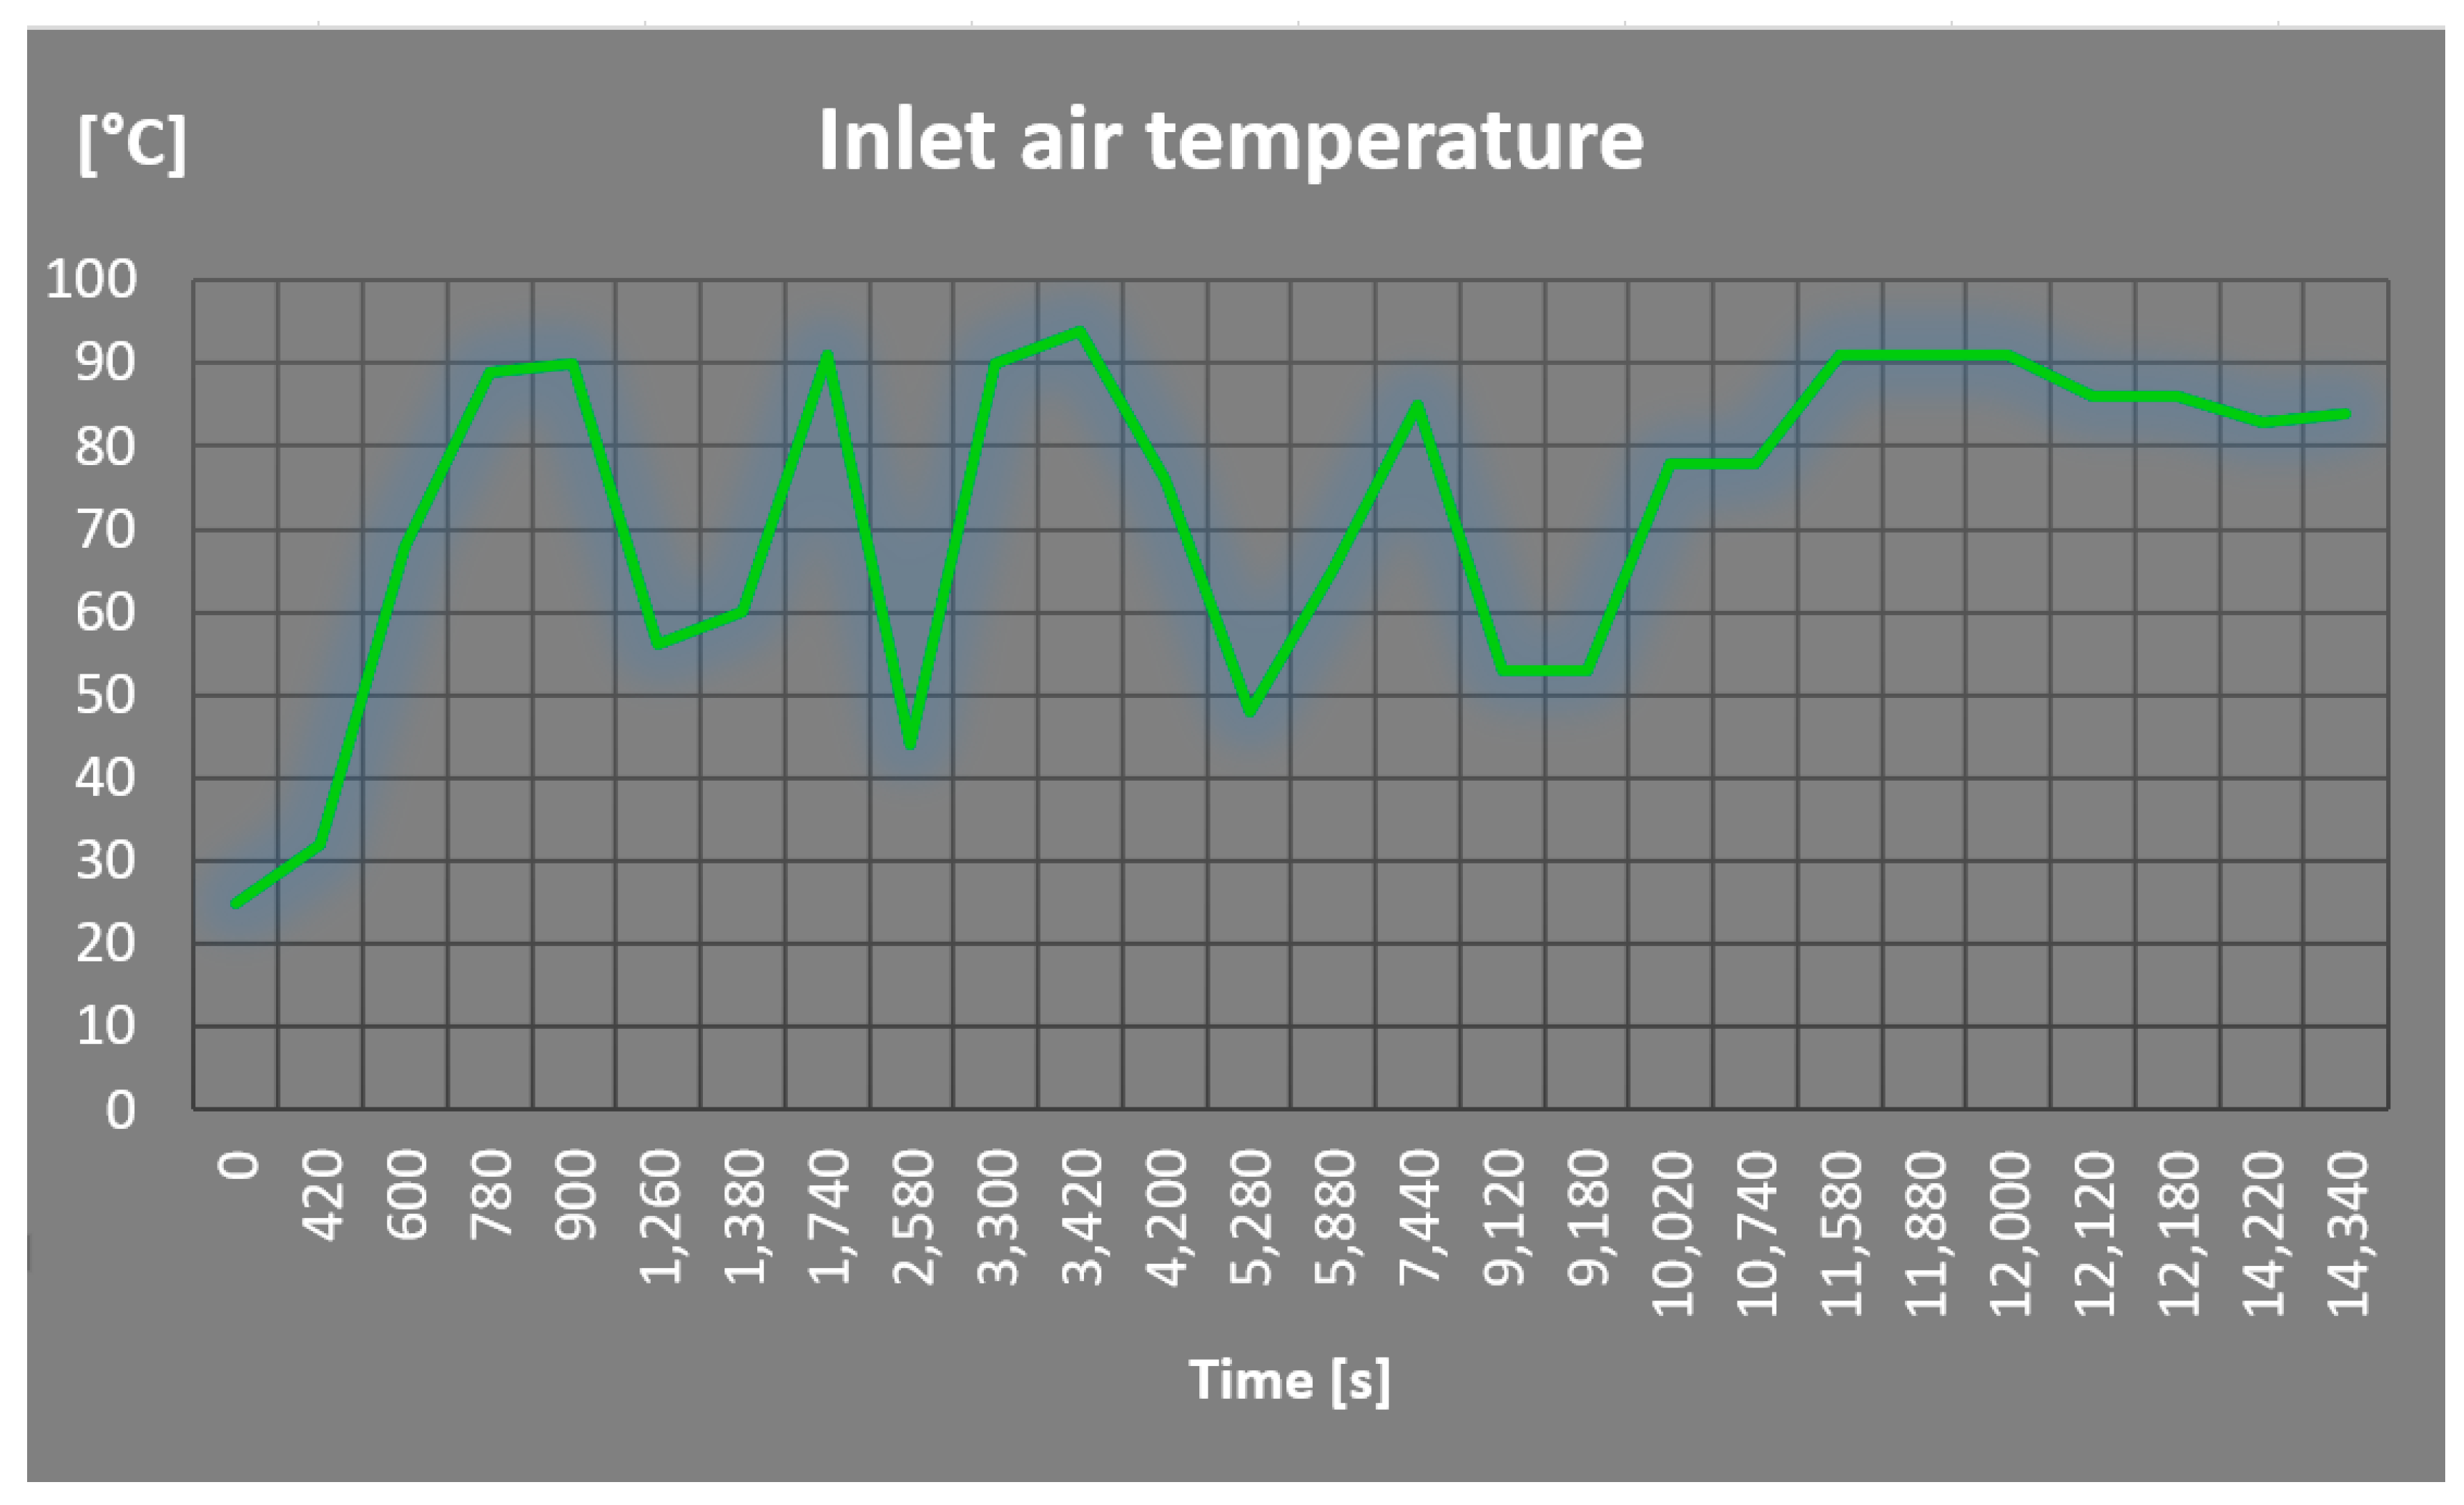
In Figure 5, the temperature of the working fluid (air) versus time is shown. Also this trend is characterized by an initial behavior similar to that of the combustion exhaust gases, remaining cyclic for a long interval; this is due to the fact that the flow rate has been changed during the experimentation to calibrate the data, but also due to the variation of other parameters, including the vacuum imposed by the suction fan and the air speed set by the pressing fan. The values are acquired with the use of a thermocouple already present in the system, which is located near the bypass box (bypass).
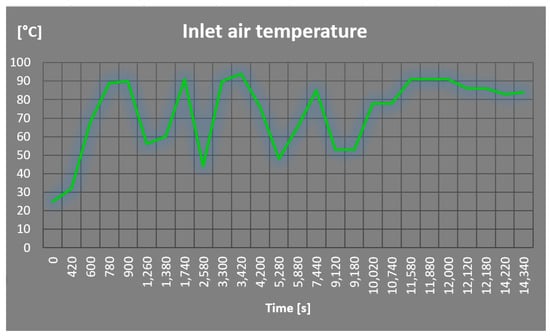
Figure 5.
Trend of the air temperature at the outlet of the exchanger.
The previous graph is very significant: the air temperature is a thermodynamic parameter of primary interest for the turbine and therefore also for the energy objectives to be achieved by the working power plant.
The various attempts to regulate the parameters that manage the system have led to a cyclical trend, up to the analyzed terminal period, whose temperature value stabilizes and remains approximately constant.
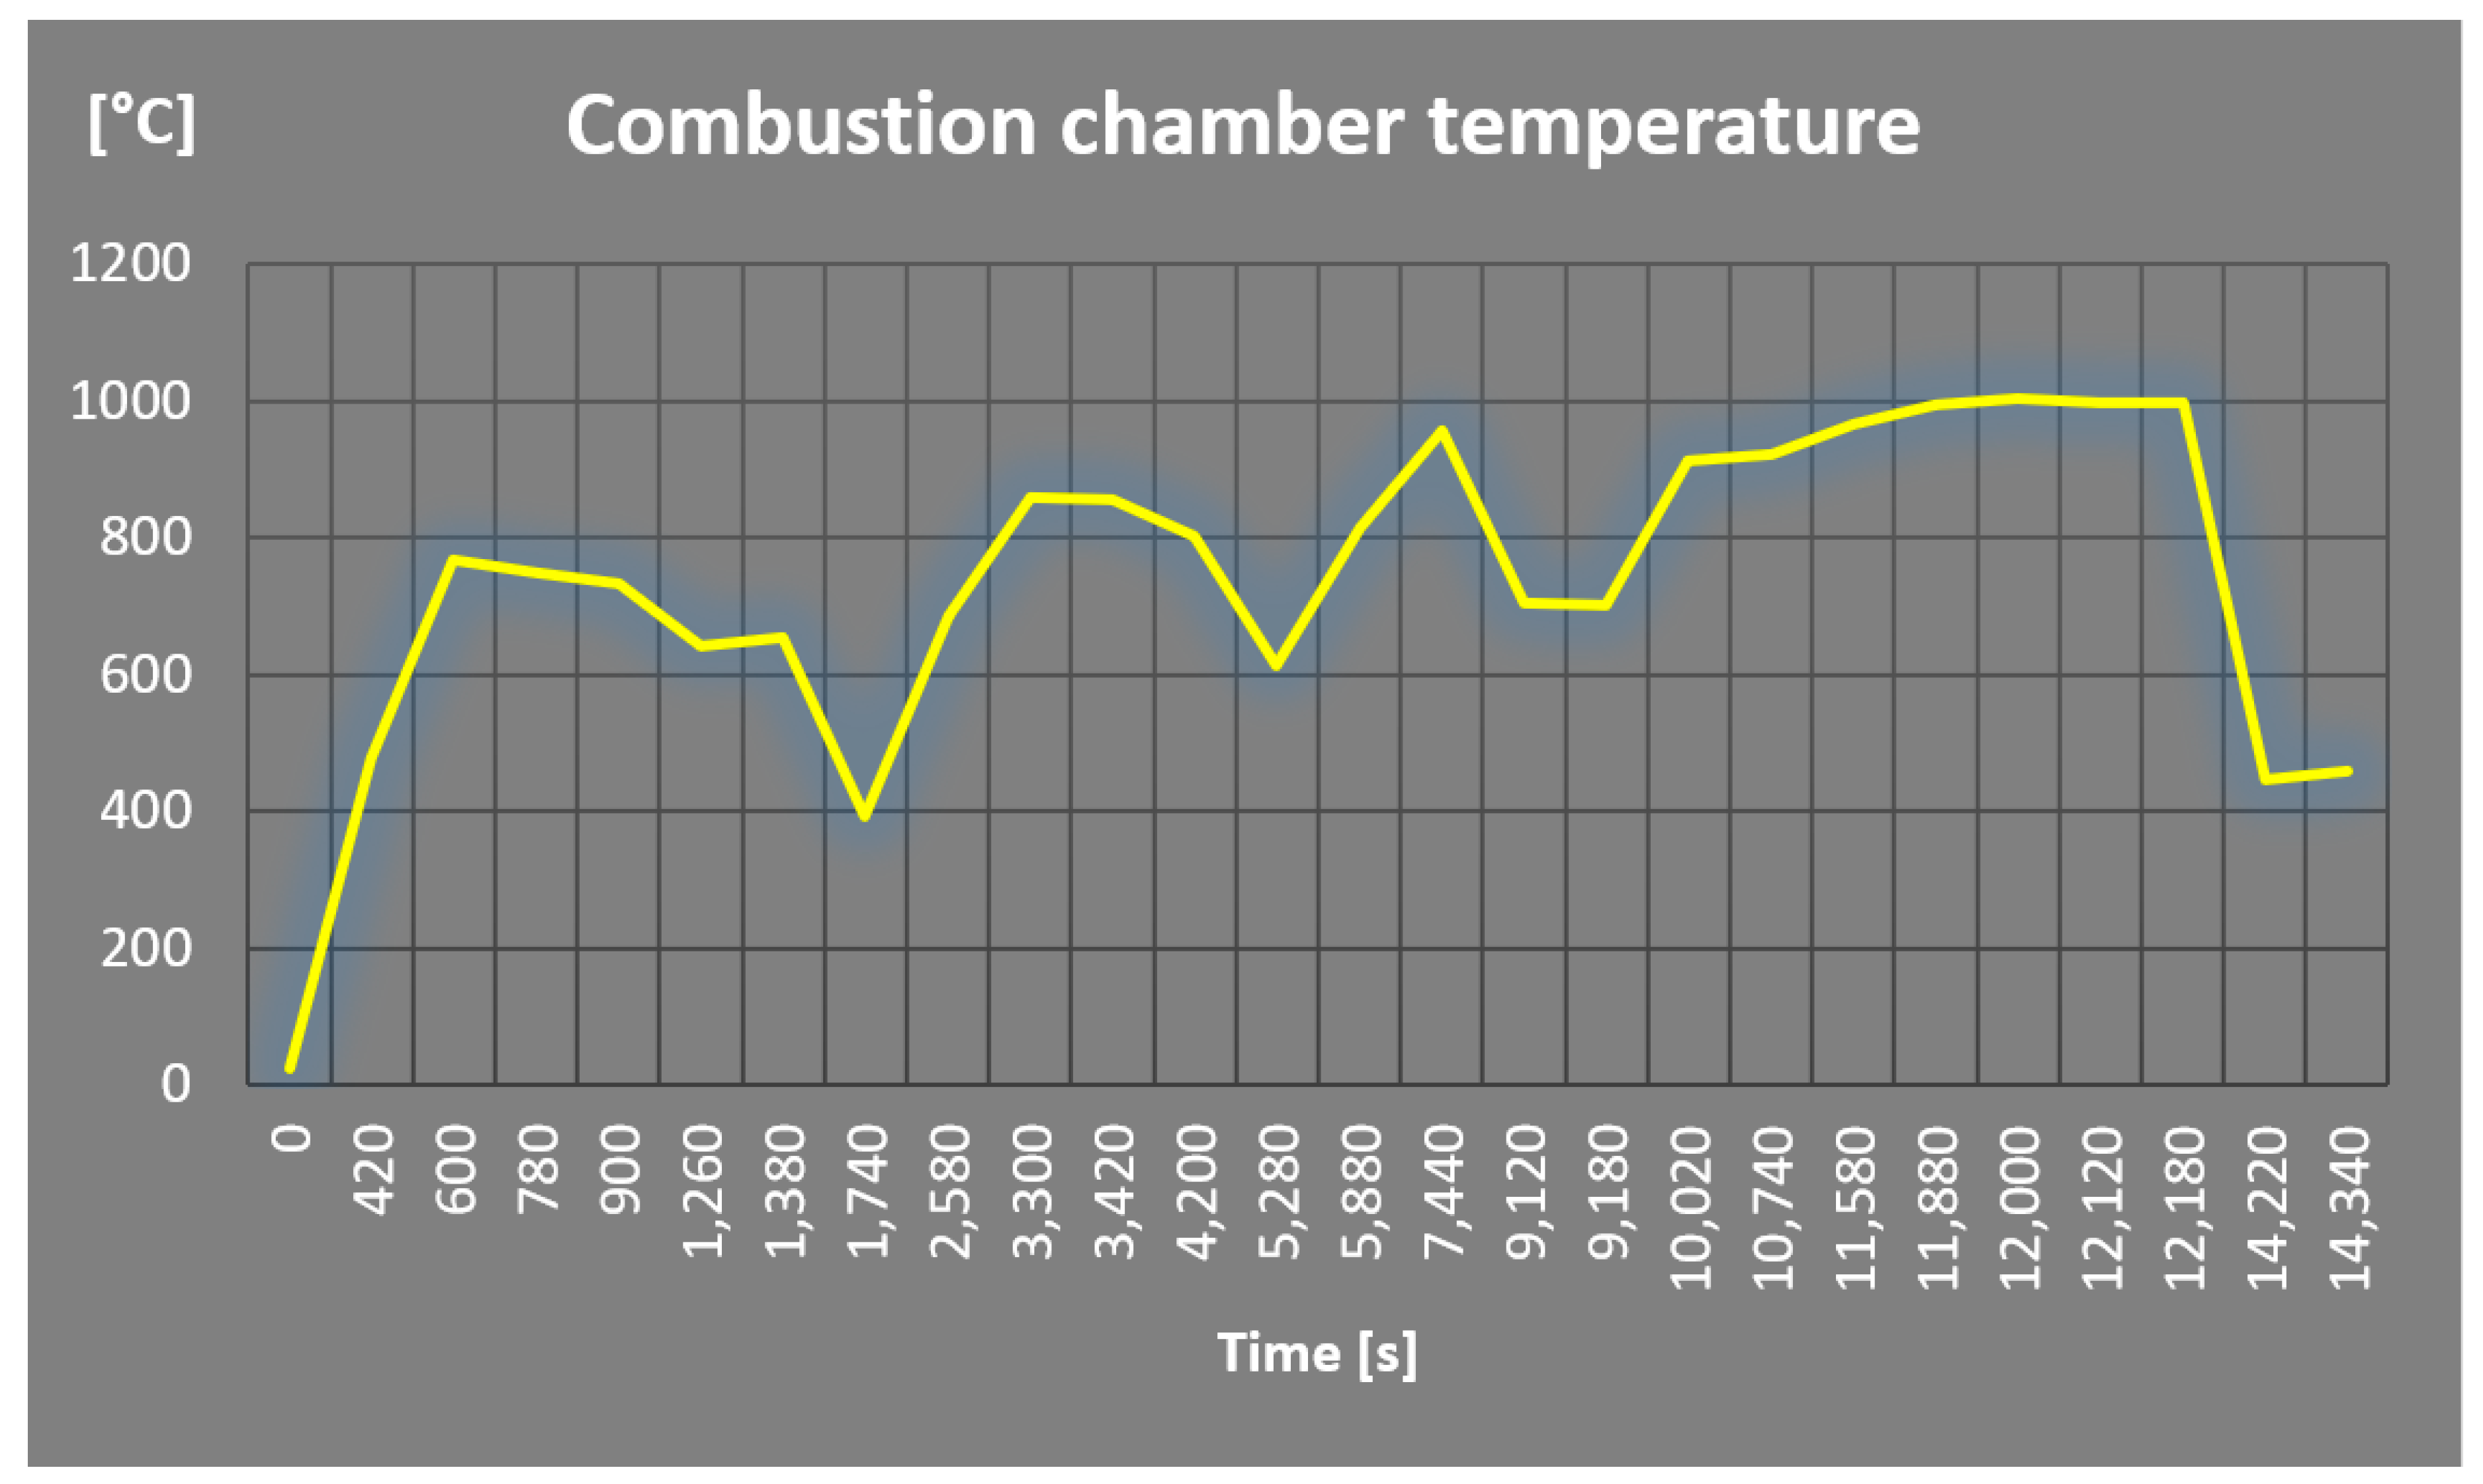
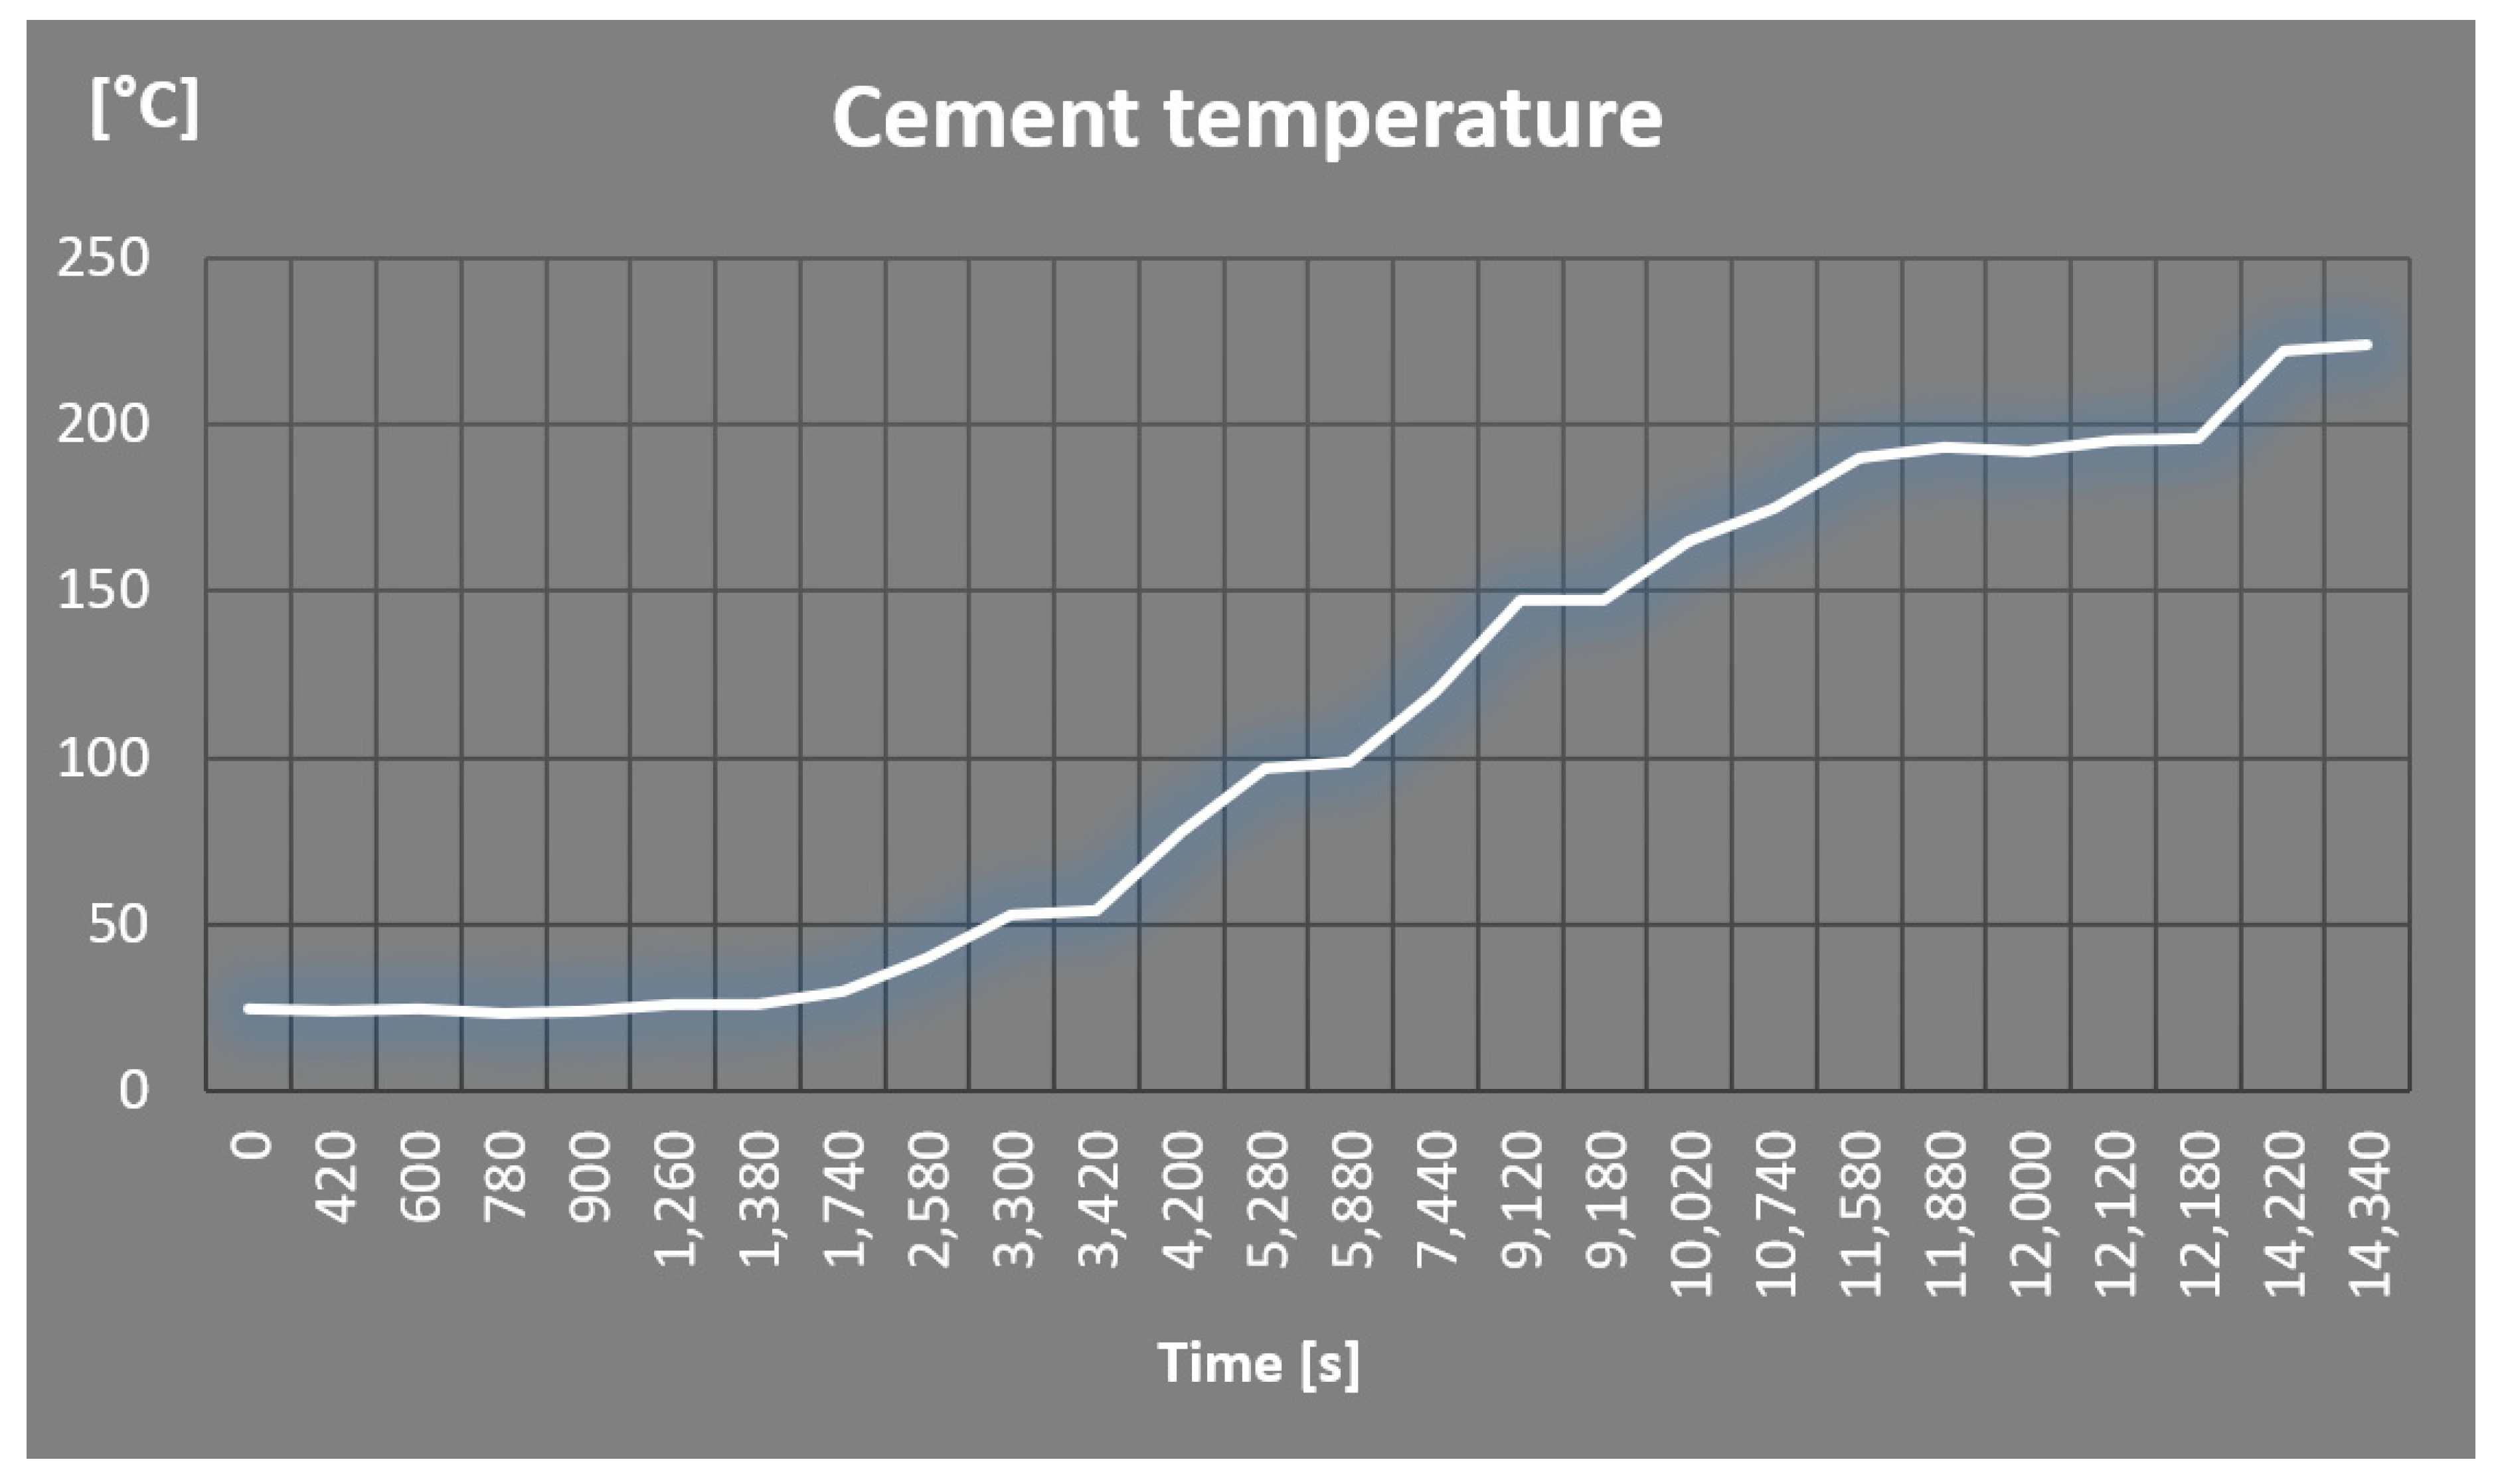
An additional thermocouple is installed in the burner, which is able to supply the approximate value (given that it varies strongly from point to point) of the temperature inside the burner. The values are continuously acquired by the control system that manages the plant and are plotted in the following Figure 6.

Figure 6.
Combustion temperature.
The recorded temperature trend underlines a nonlinear behavior, due to the repeated blocks of the plant to calibrate the power supply and to the various adjustments that are made during the experimentation.
Furthermore:
- -
- The behavior of the temperature of the refractory cement that surrounds the combustion chamber was picked up by a thermocouple embedded in the cement, which has an almost linear growth (Figure 7);
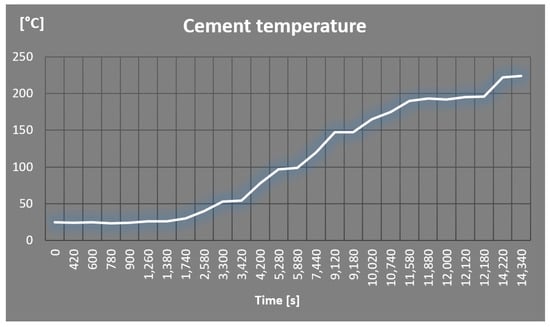 Figure 7. Trend of the temperature of the cement that surrounds the combustion chamber.
 - -
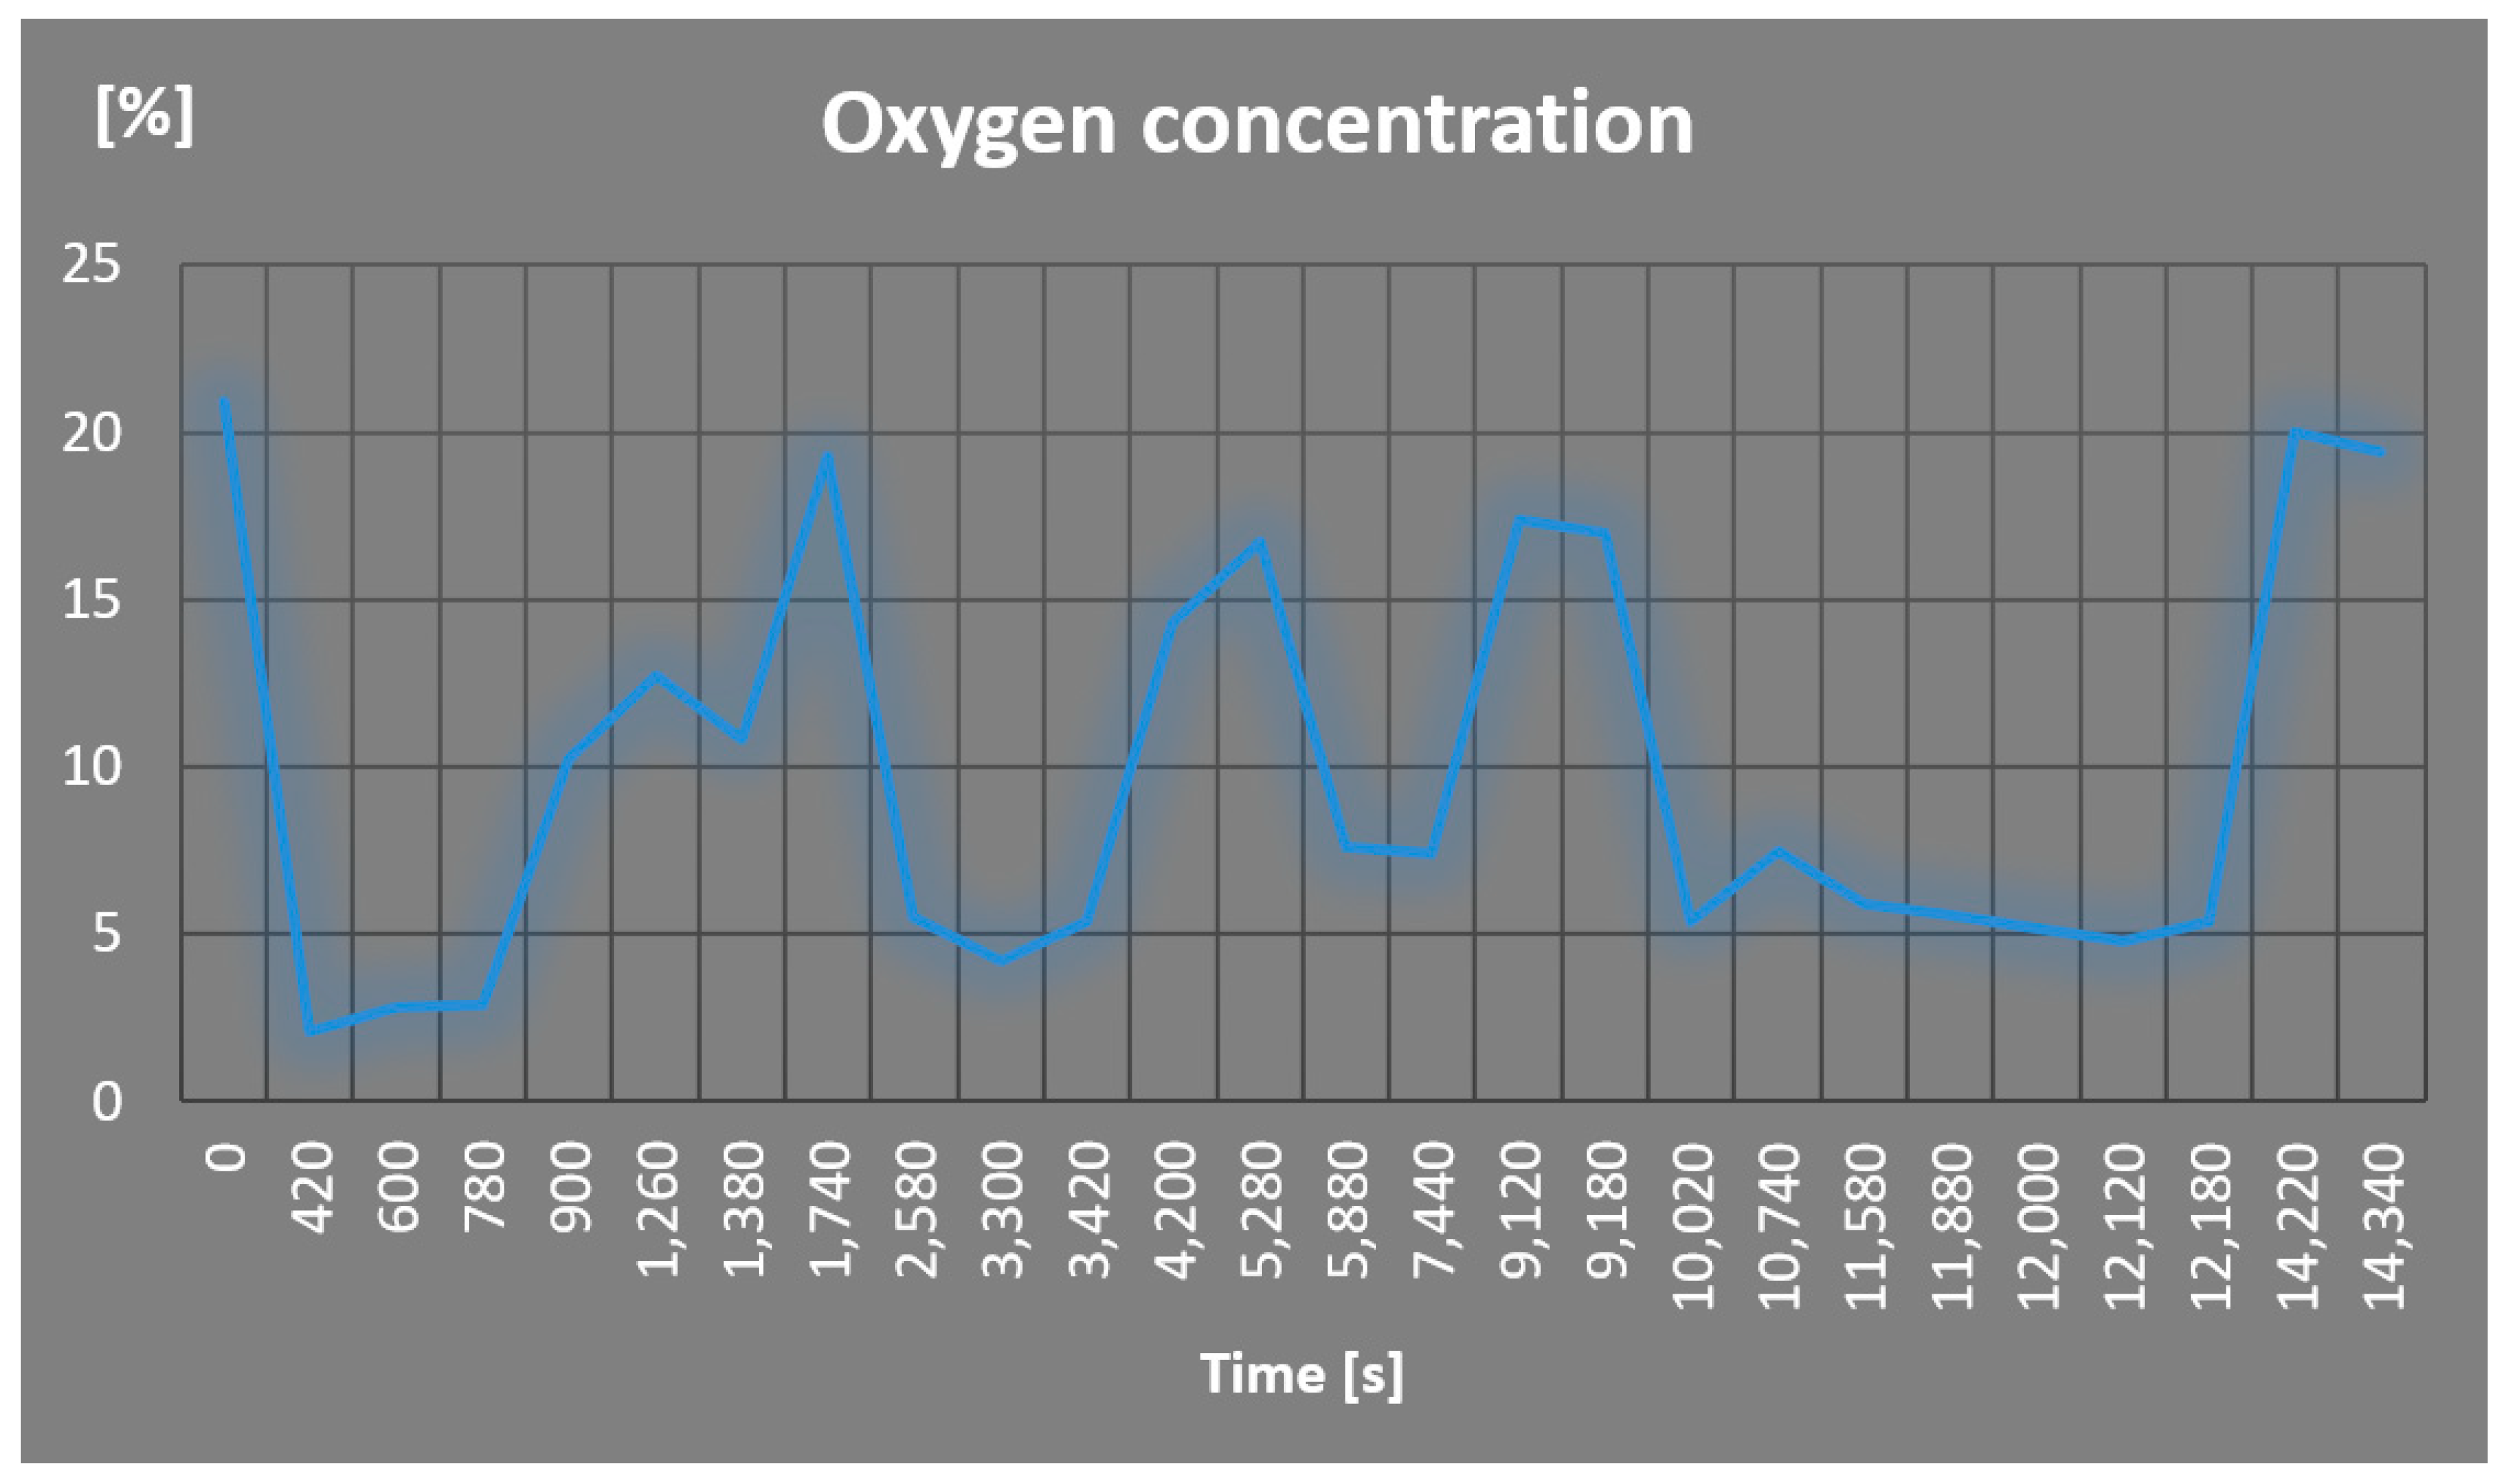
- The concentration of oxygen in the combustion exhaust gases was detected by a lambda probe; it is represented on the ordinate axis of Figure 8 in percentage units;
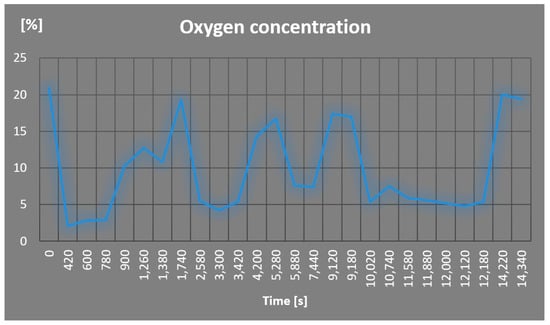 Figure 8. Evolution of the oxygen concentration in the exhaust gases.
 - -
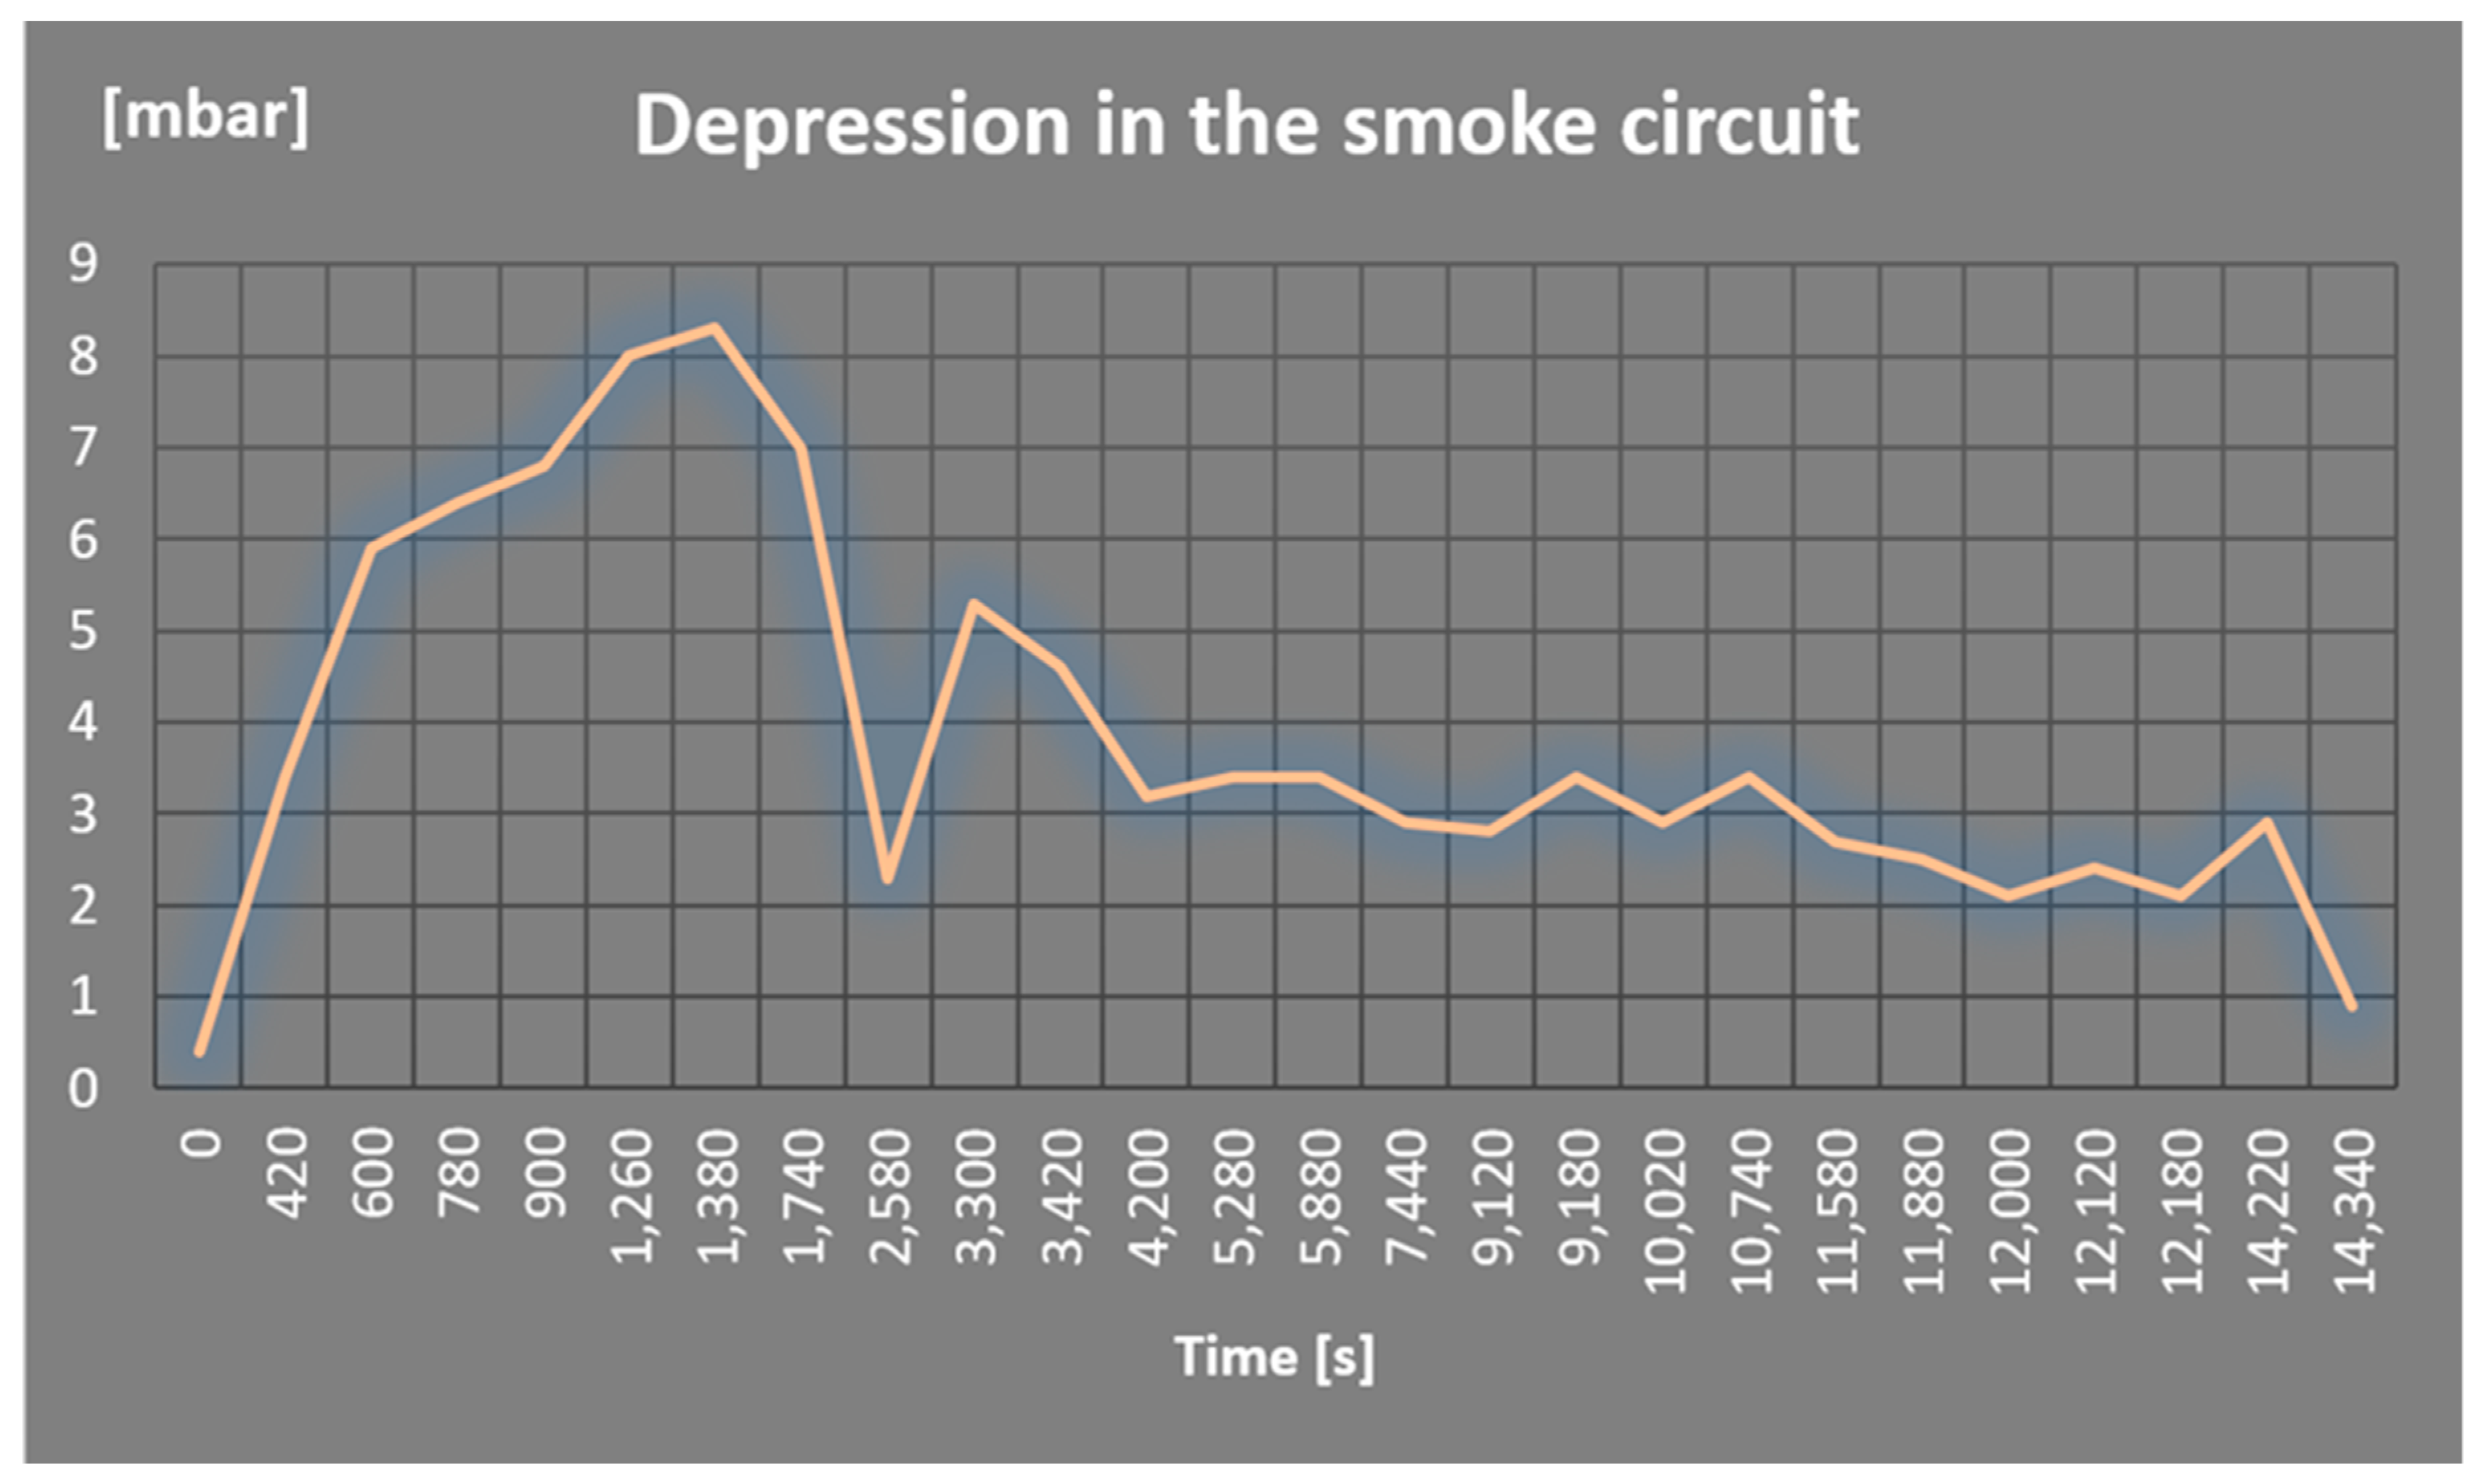
- The depression imposed by the suction fan to the smoke circuit is reported in Figure 9; it is calculated by a specific control software on the basis of an algorithm starting from the speed of the fan itself (this depression is needed to encourage smoke drafting and to overcome load losses, even if minimal).
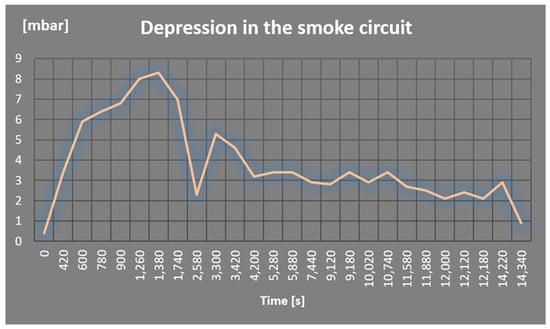 Figure 9. Trend of the depression in the smoke circuit.
The plant is then monitored for as long as it is started and brought to full capacity.
From the above mentioned graphs, it can be seen that the outlet air temperature never exceeds 94 °C, also varying the air flow entering the fan by pressing (acting on the rotation speed), the fuel flow rate, the draft depression with the suction fan (always acting on the rotation speed).
3. Monitoring of the Air Circuit
The air circuit is analysed using the Tecora Flowtest meter. The probe with the Pitot tube is inserted in a special hole, made on the pipe in a zone far from the exchanger, so as to be able to take into account also the pressure drops. The obtained results are shown in Table 1. It is considered that the air speed has maximum and minimum values for each time point in which the measurement is made. This is explained by the fact that the sensor is made to translate from the centre of the duct (where the speed value is higher) to the edges (where the speed value is lower due to friction). Thus, the instrument software calculates the average value automatically. It is also important to take into account that the instrument can have an uncertainty. Indeed, some values can be influenced by small vortices generated around the probe.

Table 1.
Air speed values obtained by Tecora Flowtest.
4. Monitoring of the Smoke Circuit
The gases circuit has been analyzed by Testo t350S. A probe is inserted in a special hole that has been made on the exhaust gas pipe in a position near the chimney, in a straight pipe section far from circuit geometrical singularities, in order to reduce turbulence effects (see Figure 3).
The obtained results are shown in Table 2. The ambient temperature, which is around about 40 °C, is also reported. The instrument is placed near the hot pipes: for this reason, the detected temperature is greater than the effective one. Table 2 reports the concentrations of O2 and CO2, expressed in percentage units, and H2, NO, NO2, NOx, CO expressed in ppm. The detected data allows to determine when the plant is working at steady state. After about 2500 s, the steady state in terms of emissions is reached; concentrations of H2 and NOx keep almost constant values up to about 12000 s, when the biomass feeding rate was stopped.
Table 2.
Exhaust gases concentration and temperature vs. time.
The obtained results are relevant to verify if the pollutant concentrations are within the limits established by emission standards, which are based on concentrations referred to a fixed oxygen content (for example for solid biomasses is 6% by volume).
5. The Proposed Energy Plant Configuration
The temperature measurements in different plant sections, the monitoring of air circuit and the monitoring of smoke circuit described in the previous paragraphs are relevant to define the lay-out plant.
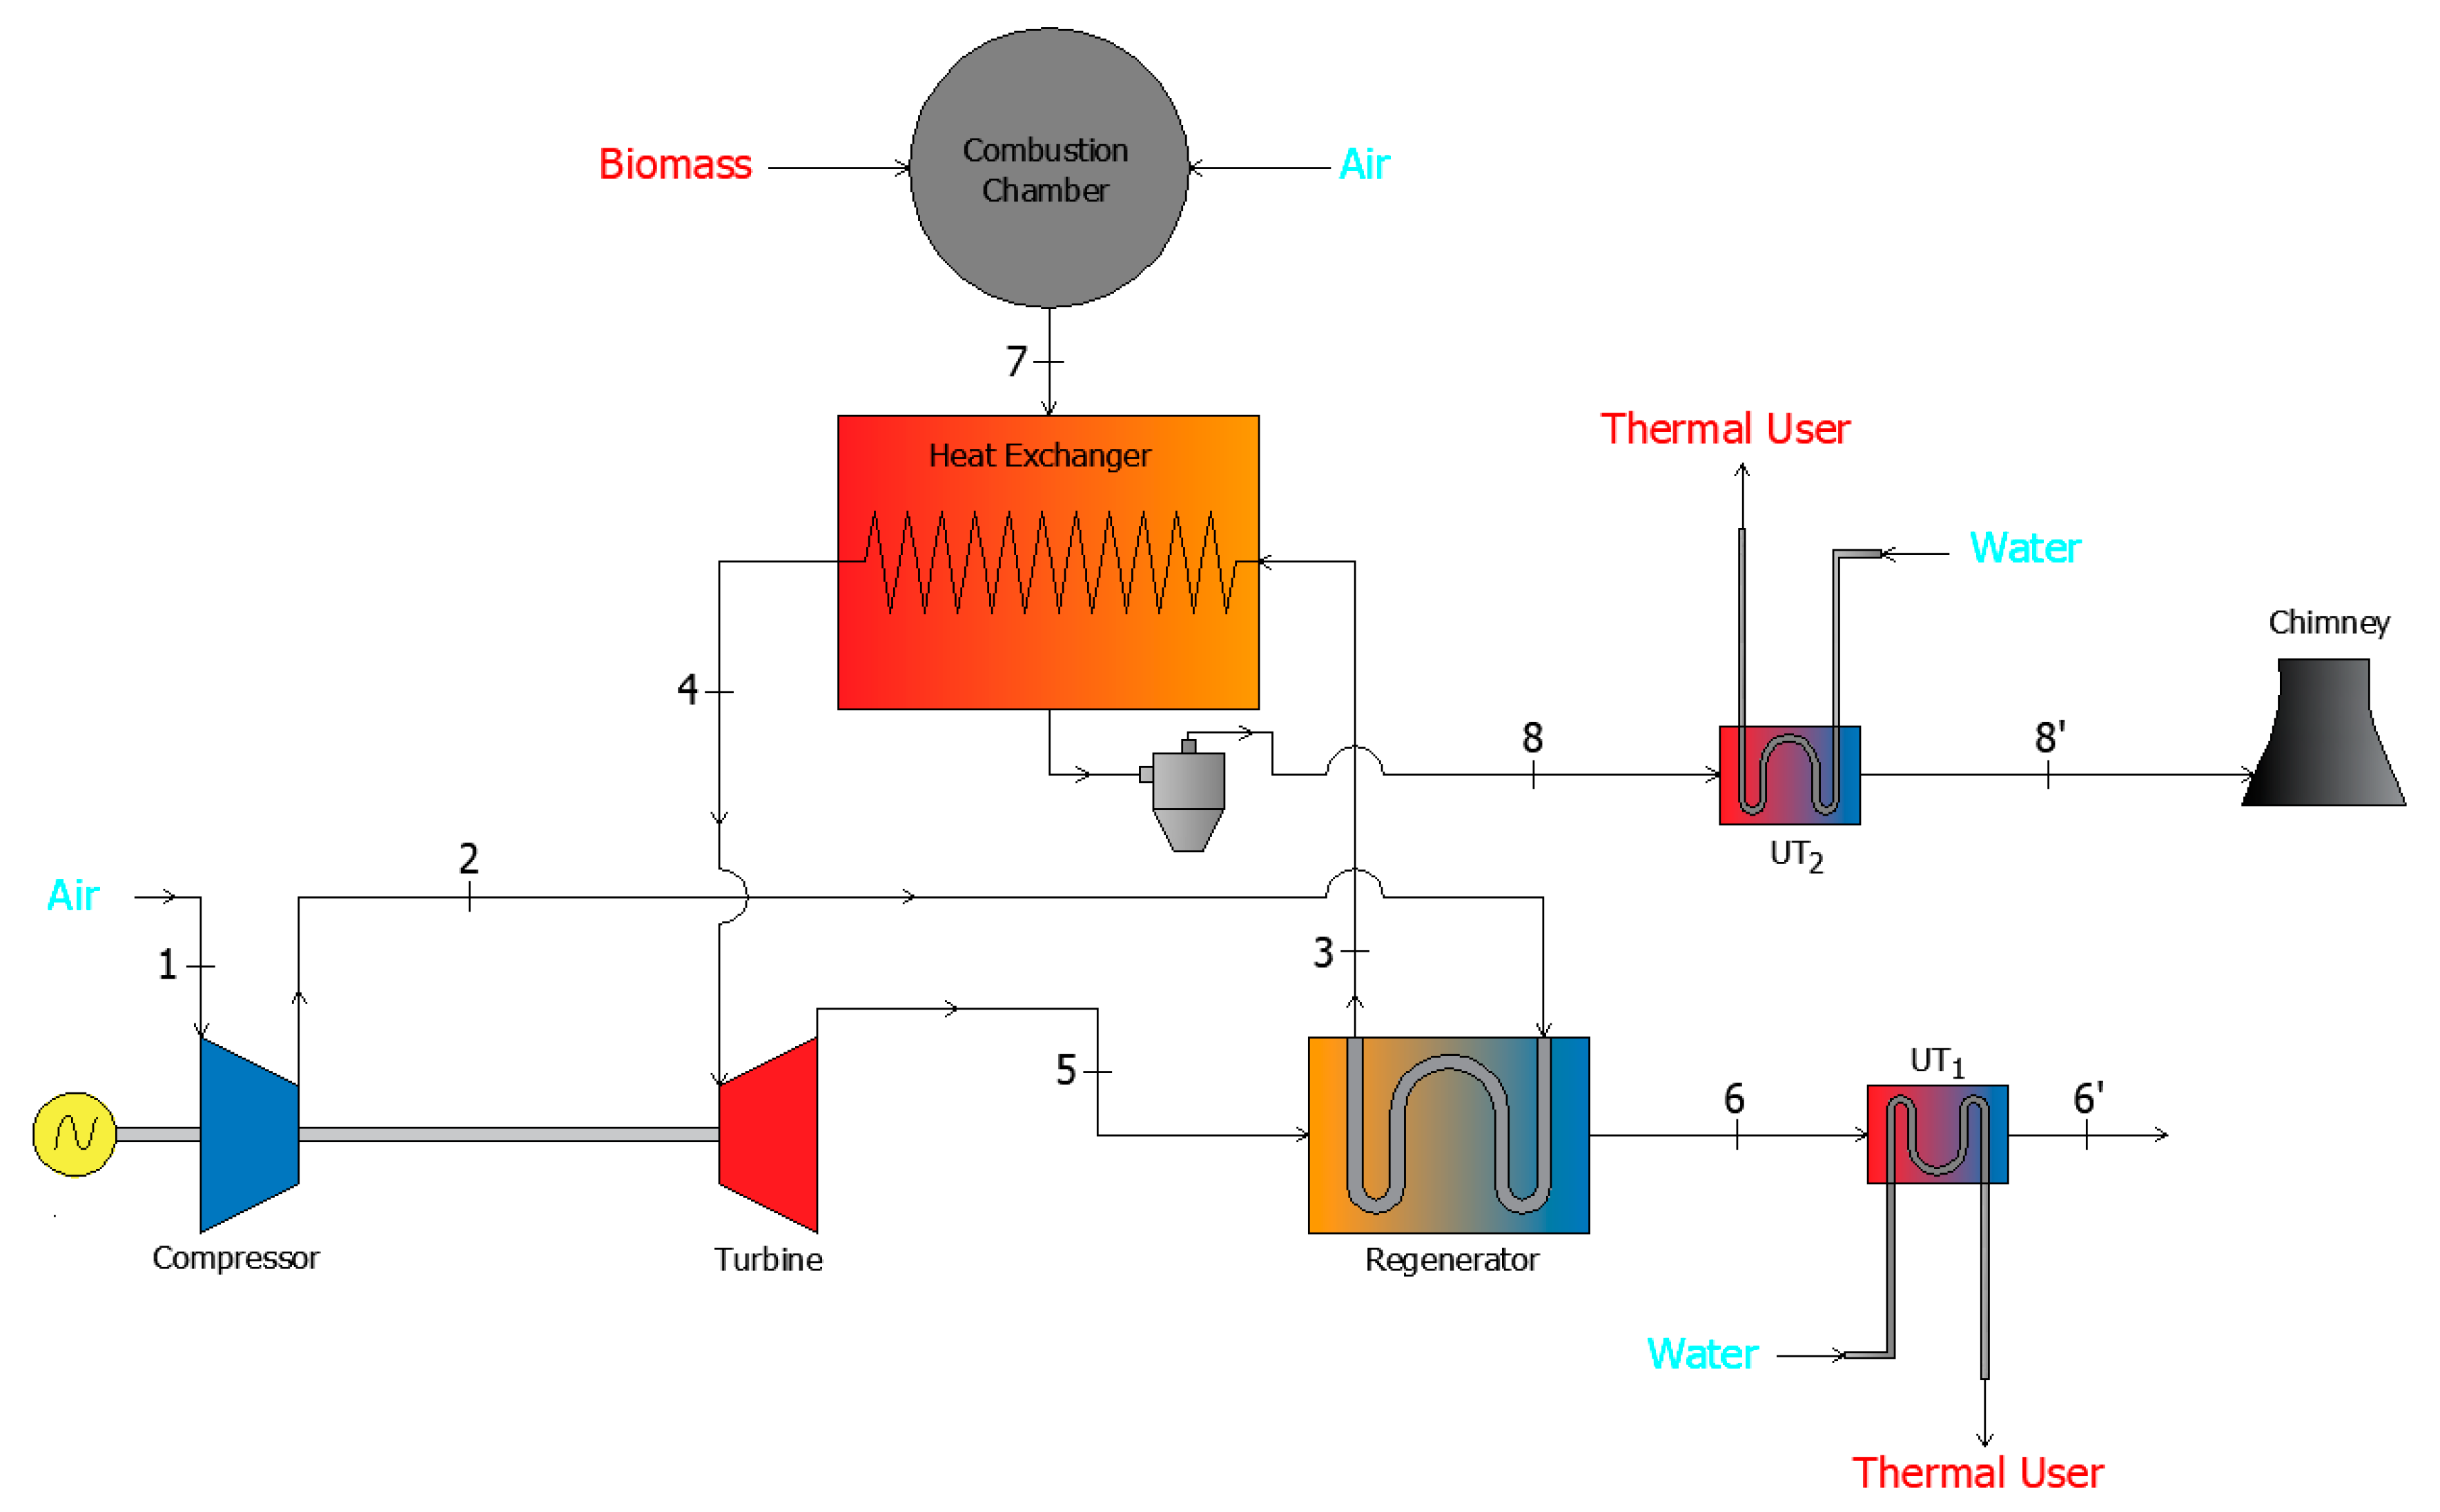
Two air-water heat exchangers (water at the temperature of 55 °C) are considered in the plant design. In Figure 10, the final scheme of the plant is reported, that includes also the two heat exchangers to recover the heat that can be dissipated in external environment. The considered values refer to an example to have an idea of in which way is possible to use the cogeneration plant under study to produce hot water.
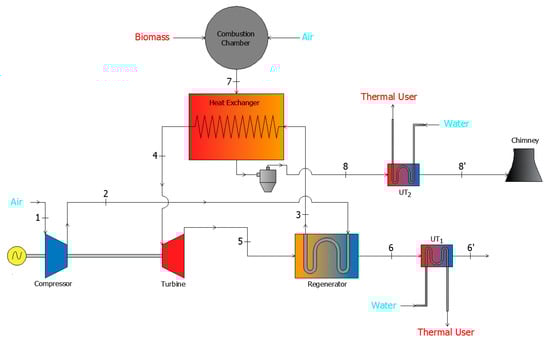
Figure 10.
Scheme of the analysed CHP plant.
The following temperature values for two thermal users (UT1 and UT2) are considered, under the hypothesis to apply cogeneration principle to heat water for civil destination:
The minimal temperature difference between the gases at the heat exchanger outlets and the hot water is 15 K, in order to maximize the heat transfer and the plant efficiency. The considered values are:
The following Equations (7) and (8) are obtained by considering the energy balance of the two air–water heat exchangers for the two thermal users UT1 and UT2:
The heat specific value of water is considered as constant.
From this equation, the values of and may be obtained:
Finally, the thermal power for the two thermal users is obtained as:
These thermal powers are shares of recovered power, because they can be reused by means of cogeneration process. These shares are added to the electric work produced from the turbine, in order to have an improvement in plant efficiency:
where and are the thermal powers of the two users and is the electric power. The obtained efficiency value, is from 13.2% to 68.9%. The final value is increased of five times with respect to the minimum one thanks to the cogeneration process.
The obtained results highlight as this kind of CHP plant can be exploitable in various fields, not only because it uses renewable sources, but also because presents an optimal cogeneration efficiency.
The Electric Index (EI), that is the ratio of the electric energy and the used heat, is calculated as:
The considered biomass () and air flow rates () are calculated as:
And is evaluated from the following equations, where the heat produced in combustion process is :
Furthermore, the specific heat of the exhaust gases is:
The input thermal power is:
which is largely sufficient since a lower heat output is required for the exchanger. The term LHVbio indicates the lower heating value of the considered biomass.
The energy efficiency of the system is then calculated:
The exergy efficiency (or second-principle efficiency), , is given as the ratio between the exergy outlet and the exergy inlet :
The calculated system efficiency is quite low, but in line with reference values for this type of external combustion thermal machines (powered by biomass) which have values around 14–17%. This is explained by the fact that the use of single-stage radial turbomachinery entails, for the purposes of the thermodynamic cycle, significantly lower compression ratios than those commonly used in gas turbine cycles (from 10 to 15, in the case of industrial turbines). In the case of a simple cycle, the use of a low compression ratio leads to a very high gas discharge temperature, a condition incompatible with a good efficiency. Therefore, compression ratios of at least 12–15 would be necessary to obtain reasonable but still limited performances (considering that a single-stage microturbine efficiency is about 20% at typical temperatures). Furthermore, the electrical efficiency of the system is furtherly reduced by the fact that the external combustion systems have higher heat losses compared to the internal combustion systems, given that they consist of one further component than the latter, e.g., the heat exchanger. It should be noted that this value refers exclusively to the electrical efficiency of the plant, for example the ratio between the amount of produced electricity and the thermal input to the system.
6. The Process Simulation Model
A numerical analysis of the entire process is developed by means of Aspen Plus software to compare the obtained results from simulations with those resulting from experimental tests. The implementation of this model is relevant to determine all the thermodynamic and energy parameters of each component in the plant and also to obtain the required biomass flow rate to operate in full regime conditions.
The numerical simulation allows to obtain additional information about the plant electrical efficiency, the total efficiency (considering also the cogenerative working), the exergy efficiency and the electric index. A redesign of the heat exchanger was carried out using the LMDT (logarithmic mean temperature difference) method, since the heat exchange surface of the exchanger currently installed on the system is lower than that obtained by the modelling.
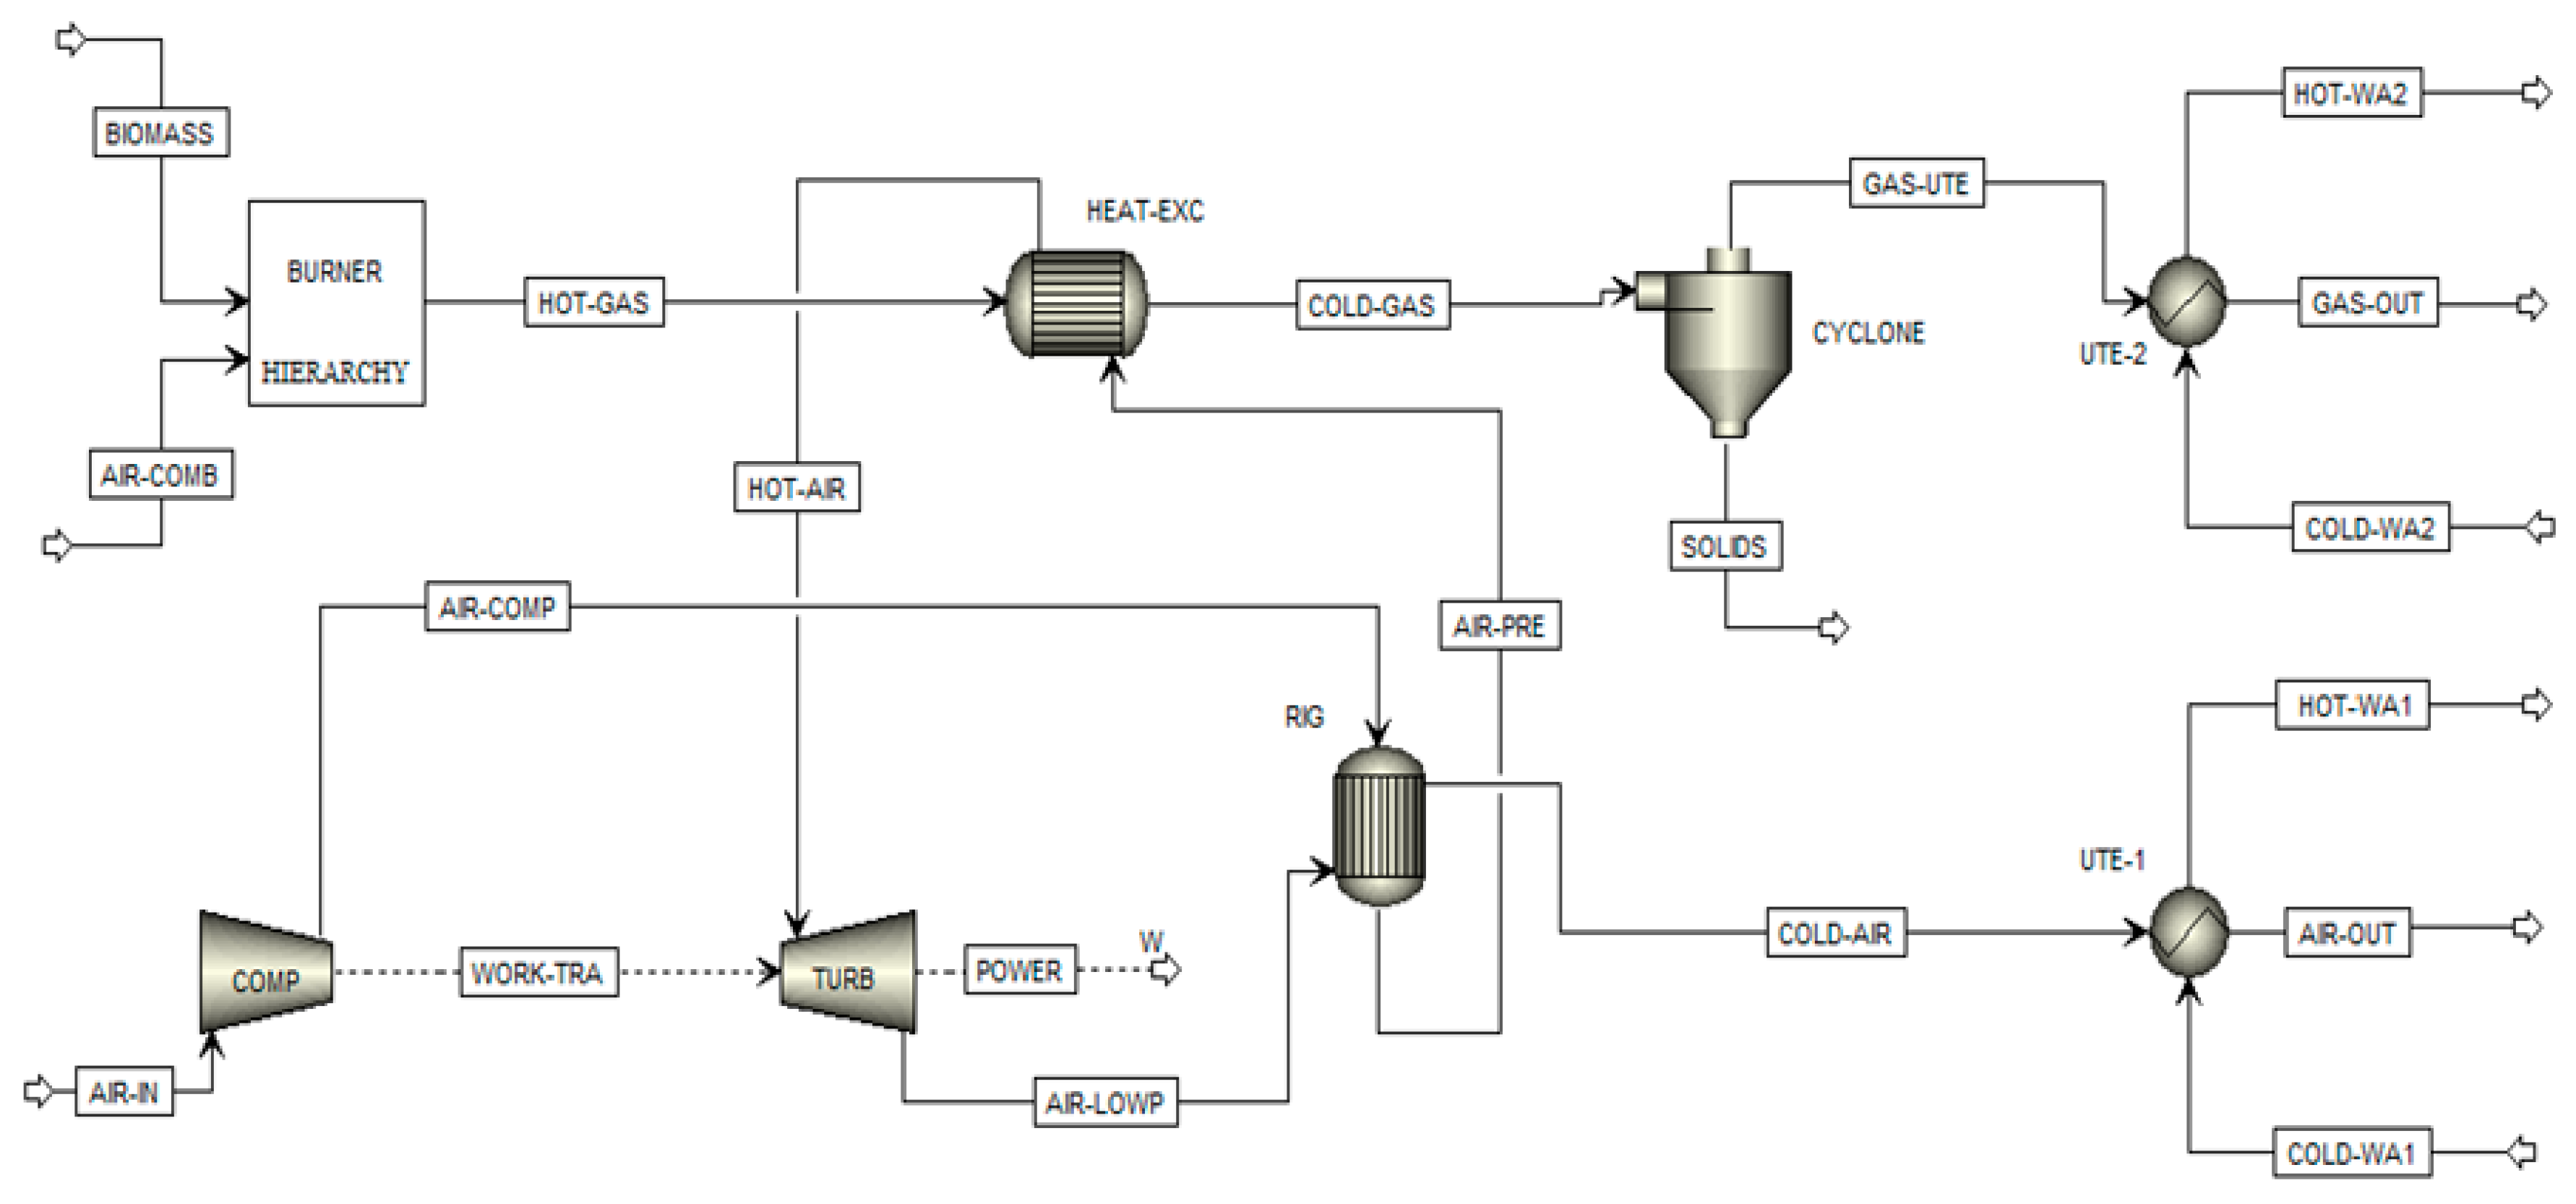
In Figure 11, the main flowsheet developed in Aspen Plus environment is shown. The model reproduces the entire experimental set-up and the connections among its components.
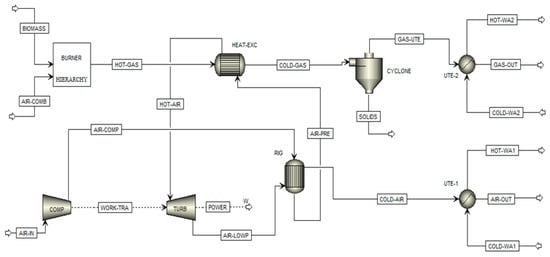
Figure 11.
The main flowsheet of the model developed by Aspen Plus.
It consists of a compressor (COMP) in which air is injected (AIR-IN) that once compressed (AIR-COMP) is sent to the regenerator (RIG) where it undergoes a preheating (AIR-PRE) and then reaches the heat exchanger (HEAT-EXC). The high temperature air (HOT-AIR) reaches the turbine (TURB) and exploiting the enthalpy of the fluid produces work that transmits to the compressor (WORK-TRA) that guarantees its operation, in addition to the useful work (POWER) that is transmitted to the alternator for the electricity production. The expanded air (AIR-LOWP) is at low pressure but at a still high temperature and reaches the regenerator where it releases heat to the compressed air coming from the compressor. After this first cooling phase, the working fluid (COLD-AIR) still has a higher and exploitable temperature from a thermodynamic point of view and is then sent to a heat exchanger (UTE-1) where it releases heat to water (COLD-WA1) by heating it (HOT-WA1) in order to exploit heat for a thermal user. Subsequently, the air is expelled (AIR-OUT).
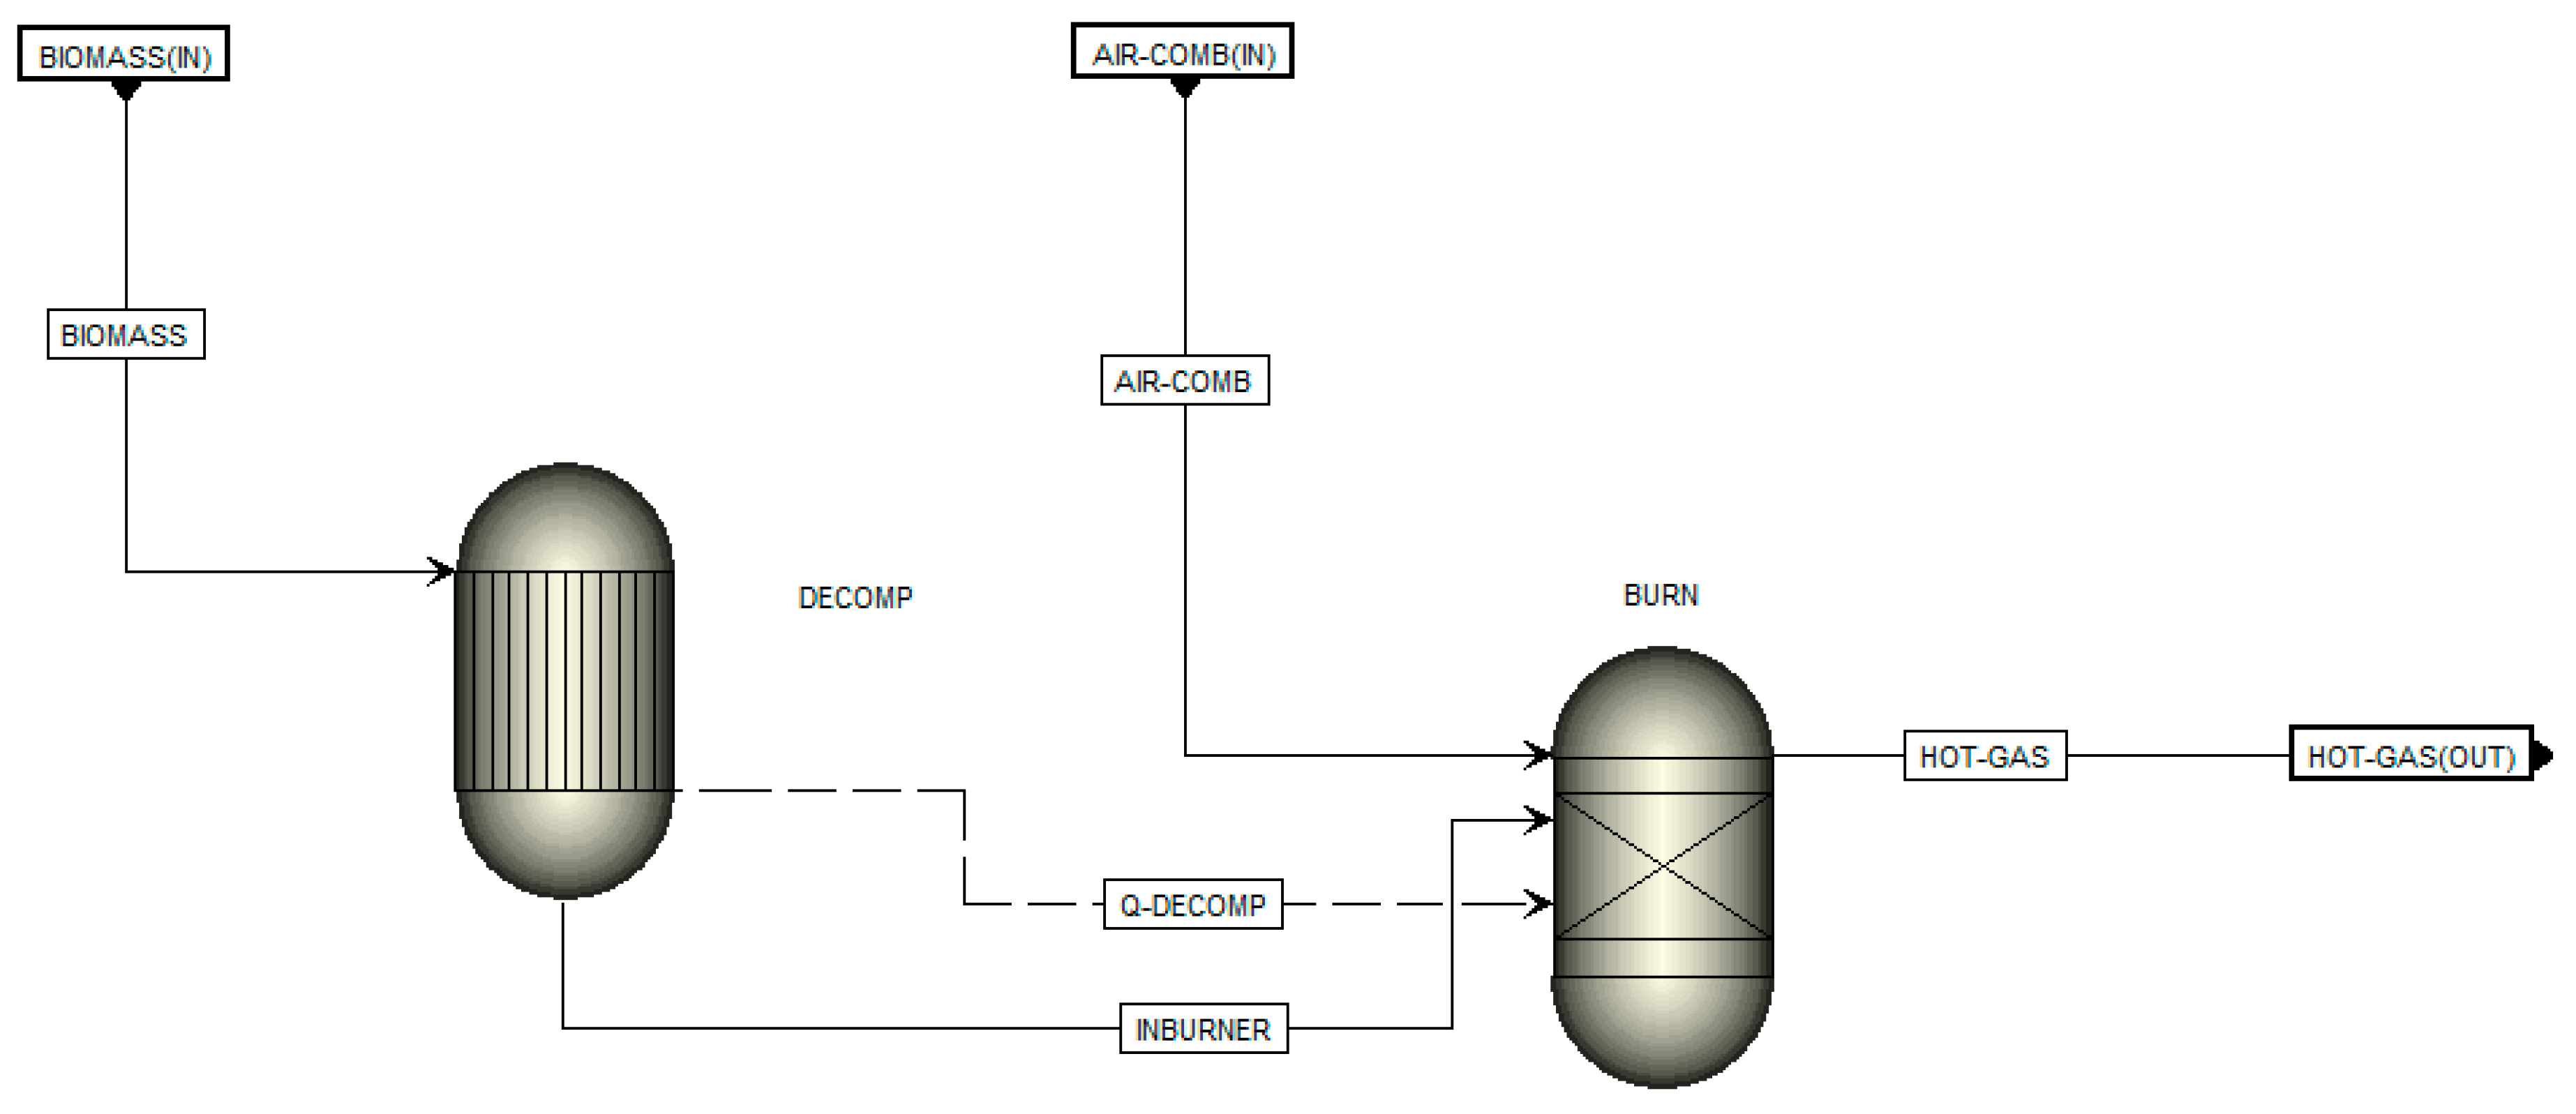
At the same time, about the gases path, the process starts in the burner (BURNER), represented by a Hierarchy block which in turn contains a RYield block and a RGibbs block, where air (AIR-COMB) and fuel-biomass (BIOMASS) are at the burner inlet. Combustion gases (HOT-GAS) at very high temperature reach the heat exchanger, where they raise the temperature of the working fluid, decreasing their own temperature. The outgoing gases (COLD-GAS) enter in a cyclone (CYCLONE) for the separation between particulates (SOLIDS) and gases (GAS-UTE) which still have high temperature. They are then cooled by recovering heat through an exchanger (UTE-2) where water (COLD-WA2) circulates, which is heated (HOT-WA2) in order to exploit it for a thermal user. After that phase, gases are expelled (GAS-OUT).
The solid lines shown in Figure 11 refer to a flow of matter, whose direction is indicated by each respective arrow, while the dotted line indicates a workflow.
Instead, the RGibbs block is used to model reactions that reach the equilibrium, calculating the chemical equilibrium and phase equilibrium while minimizing the Gibbs free energy. Thus, it is not necessary to specify the reaction stoichiometry. By default, RGibbs assumes that all listed components are possible products in vapour or liquid phase. This default value is not appropriate for this simulation, since each carbon after combustion would be in solid phase; thus, for this simulation, all components are potential substream MIXED products, with the exception of carbon, which is a solid indeed.
RYield and RGibbs blocks are implemented in a single Hierarchy block, for example a “hierarchy block” to provide a hierarchical structure to complex simulations, giving priority to the combustion process, since without it the whole plant could not work. Grouping these blocks together in a single Hierarchy has also allowed to represent the complete layout in a much more compact and visually much easier to be understood.
In Figure 12, an example of the Hierarchy block model with the relative flows of matter and heat is shown, by which the gas produced by the combustion process may be obtained.
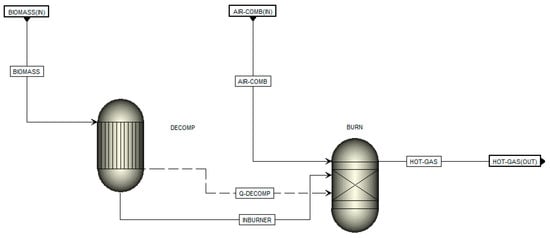
Figure 12.
Flowsheet of Hierarchy block.
In this way, the plant obtained energy efficiency is:
The inlet exergy is represented from the product between the produced heat () and the Carnot factor:
The outlet exergy corresponds to the produced mechanical work:
The exergetic efficiency is:
7. Comparison Between Numerical and Experimental Results
The temperature values in different sections of the investigated biomass multifuel plant strongly affects the system performances and it is fundamental to analyse the pollutants emission production.
Relevant results are obtained from the comparison between the numerical results obtained from the Aspen Plus simulation and the measurements obtained from the experimental set-up and the biomass plant project.
Table 3 shows the comparison between temperatures obtained by Aspen code at the end of simulation and the experimental tests.
Table 3.
Comparison between experimental and numerical results of temperatures values.
Numerical and experimental results show a good agreement for all the points in which the temperatures measurements are evaluated. Only for T4 and T7 different values, but not relevant, are determined because of the possible load losses in the ring circuit.
Table 4 reports the comparison between the obtained values of energy and exergy efficiencies. A good agreement between the proposed model and the experimental analysis is also shown by this comparison.
Table 4.
Comparison between experimental and numerical results of efficiency values.
8. Conclusions and Future Perspectives
Biomass combustion is one of the fundamental energy source actually considered in order to reach SDGs objectives. Energy deriving from biomass can be a valid alternative for the production of electric and thermal energy, with respect to the production by fossil fuels. Thus, a right design and sizing of a biomass powered plant and an evaluation of its environmental sustainability is a relevant topic to be carried out by the scientific community.
The aim of this paper is oriented in this research field by analyzing an experimental apparatus consisting of a multifuel CHP biomass energy plant supplied by a mixture of woodchips of maritime pine (70% wt) and cypress (30% wt).
Biomass plant performances and temperature values in different plant sections were measured by Testo t350S. The air circuit and the exhaust gases were also monitored to further investigate the environmental impact of the analyzed plant. Thus, the experimental tests allowed to detect the pollutant emissions after the combustion process. These data are relevant also to compare the obtained values to the emission standards.
To further investigate the process, a numerical model was developed by Aspen Plus environment. The proposed model may allow to analyse combustion processes carried out by the investigated biomass CHP plants also in order to redesign and optimize the system. This is the main purpose of this work, aimed at validating the proposed model in order to be applied in similar case studies.
The numerical results, in terms of temperatures, energy and exergy efficiencies, show a good agreement with the experiments values; in particular, 0.4% and 0.6% estimation errors were obtained by the application of the proposed model for the energy and exergy efficiency, respectively. Due to the reduced obtained errors, the Aspen Plus proposed model was validated. It can allow for the reduction of the time for the design of a CHP biomass plant, close to the plant that was investigated. Indeed, the design, construction and operation of a biomass plant must not only follow economic considerations, but also the correct and scrupulous management of available resources, which will lead to careful and decisive choices for the protection of the environment.
Author Contributions
Conceptualization, Software and Validation, G.M., F.S.; Supervision, Methodology, Investigation, Resources, A.N.; Data Curation and Writing-Original Draft Preparation, G.M., A.P., C.M.M.; Writing-Review & Editing, A.P.; Project Administration, Coordination of the research project and activities, F.C.
Funding
This research has been partially funded from the Italian Ministry of Environment within the activities of the research project FACEB dealing with the design and experimentation of energy pathways fed by biomass.
Conflicts of Interest
The authors declare no conflict of interest.
References
- Balogh, W.R.; St-Pierre, L.; Di Pippo, S. Towards a results-based management approach for capacity-building in space science, technology and applications to support the implementation of the 2030 agenda for sustainable development. Acta Astronaut. 2017, 139, 385–389. [Google Scholar] [CrossRef]
- United Nations. Millennium Development Goals. Available online: https://www.un.org/millenniumgoals/ (accessed on 7 September 2016).
- United Nations. Sustainable Development Goals. Available online: https://sustainabledevelopment.un.org/sdgs (accessed on 7 September 2016).
- Rieke, C.; Stollenwerk, D.; Dahmen, M.; Pieper, M. Modeling and optimization of a biogas plant for a demand-driven energy supply. Energy 2018, 145, 657–664. [Google Scholar] [CrossRef]
- Poullikkas, A.; Kourtis, G.; Hadjipaschalis, I. An overview of the EU Member States support schemes for the promotion of renewable energy sources. Int. J. Energy Environ. 2012, 3, 553–566. [Google Scholar]
- Panepinto, D.; Viggiano, F.; Genon, G. Analysis of the environmental impact of a biomass plant for the production of bioenergy. Renew. Sustain. Energy Rev. 2015, 51, 634–647. [Google Scholar]
- Hernandez, J.J.; Lapuerta, M.; Monedero, E.; Pazo, A. Biomass quality control in power plants: Technical and economical Implications. Renew. Energy 2018, 115, 908–916. [Google Scholar] [CrossRef]
- Marseglia, G.; Costa, M.; Catapano, F.; Sementa, P.; Vaglieco, B.M. Study about the link between injection strategy and knock onset in an optically accessible multi-cylinder GDI engine. Energy Convers. Manag. 2017, 134, 1–19. [Google Scholar] [CrossRef]
- Lapuerta, M.; Hernandez, J.J.; Pazo, A.; Lopez, J. Gasification and co-gasification of biomass wastes: Effect of the biomass origin and the gasifier operating conditions. Fuel Process. Technol. 2008, 89, 828–837. [Google Scholar] [CrossRef]
- Monteiro Nunes, S.; Paterson, N.; Dugwell, D.R.; Kandiyoti, R. Tar formation and destruction in a simulated downdraft, fixedbed gasifier: Reactor design and initial results. Energy Fuels 2007, 21, 3028–3035. [Google Scholar] [CrossRef]
- Valderrama Rios, M.L.; González, A.M.; Silva Lora, E.E.; Almazán del Olmo, O.A. Reduction of tar generated during biomass gasification: A review. Biomass Bioenergy 2018, 108, 345–370. [Google Scholar] [CrossRef]
- Gambarotta, A.; Morini, M.; Zubani, A. A Model for the Prediction of Pollutant Species Production in the Biomass Gasification Process. Energy Procedia 2017, 105, 700–705. [Google Scholar] [CrossRef]
- Zhuang, X.; Song, Y.; Yin, X.; Wu, X. Insights into the evolution of fuel-N to NOx precursors during pyrolysis of N-rich nonlignocellulosic biomass. Appl. Energy 2018, 219, 20–33. [Google Scholar]
- Wielgosinski, G.; Łechtanska, P.; Namiecinska, O. Emission of some pollutants from biomass combustion in comparison to hard coal combustion. J. Energy Inst. 2017, 90, 787–796. [Google Scholar] [CrossRef]
- Catapano, F.; Costa, M.; Marseglia, G.; Sementa, P.; Sorge, U.; Vaglieco, B.M. An Experimental and Numerical Investigation of GDI Spray Impact over Walls at Different Temperatures. SAE Technical Paper. 2016. [Google Scholar] [CrossRef]
- Farid, M.M.; Jeong, H.J.; Hwang, J. Kinetic study on coal–biomass mixed char co-gasification with H2O in the presence of H2. Fuel 2016, 181, 1066–1073. [Google Scholar] [CrossRef]
- Han, J.; Liang, Y.; Hu, J.; Qin, L.; Street, J.; Lu, Y.; Yu, F. Modeling downdraft biomass gasification process by restricting chemical reaction equilibrium with Aspen Plus. Energy Convers. Manag. 2017, 153, 641–648. [Google Scholar] [CrossRef]
- La Villetta, M.; Costa, M.; Cirillo, D.; Massarotti, N.; Vanoli, L. Performance analysis of a biomass powered micro-cogeneration system based on gasification and syngas conversion in a reciprocating engine. Energy Convers. Manag. 2018, 175, 33–48. [Google Scholar] [CrossRef]
- Yin, C.; Rosendahl, L.; Kaer, S.K.; Clausen, S.; Hvid, S.L.; Hiller, T. Mathematical modelling and experimental study of biomass combustion in a thermal 108 MW gratefired boiler. Energy Fuels 2008, 22, 1380–1390. [Google Scholar] [CrossRef]
- Lan, W.; Chen, G.; Zhu, X.; Wang, X.; Liu, C.; Xu, B. Biomass gasification-gas turbine combustion for power generation system model based on ASPEN PLUS. Sci. Total Environ. 2018, 628–629, 1278–1286. [Google Scholar] [CrossRef]
- Adnan, M.A.; Hossain, M.M. Gasification performance of various microalgae biomass—A thermodynamic study by considering tar formation using Aspen plus. Energy Convers. Manag. 2018, 165, 783–793. [Google Scholar] [CrossRef]
- Kaushal, P.; Tyagi, R. Advanced simulation of biomass gasification in a fluidized bed reactor using ASPEN PLUS. Renew. Energy 2017, 101, 629–636. [Google Scholar] [CrossRef]
- Sadhwani, N.; Li, P.; Eden, M.R.; Adhikari, S. Process Modeling of Fluidized Bed Biomass-CO2 Gasification using ASPEN Plus. Comput. Aided Chem. Eng. 2017, 40, 2509–2514. [Google Scholar]
- Gagliano, A.; Nocera, F.; Bruno, M.; Cardillo, G. Development of an equilibrium-based model of gasification of biomass by Aspen Plus. Energy Procedia 2017, 111, 1010–1019. [Google Scholar] [CrossRef]
- Italian Minister of Economic Development and Italian Minister of Environment. Regulation of 23 Giugno 2016. Incentivazione dell’energia elettrica prodotta da fonti rinnovabili diverse dal fotovoltaico. Available online: https://www.gazzettaufficiale.it/eli/id/2016/06/29/16A04832/sg (accessed on 6 June 2019).
- Vittori, S.; Cotana, F.; Nicolini, A.; Coccia, V.; Petrozzi, A.; Cavalaglio, G.; Marseglia, G. The CRB multifuel biomass energy plant: Description and preliminary modelling. In Proceedings of the 18th CIRIAF National Congress, Sustainable Development, Human Health and Environmental Protection, Perugia, Italy, 5–6 April 2018. [Google Scholar]

© 2019 by the authors. Licensee MDPI, Basel, Switzerland. This article is an open access article distributed under the terms and conditions of the Creative Commons Attribution (CC BY) license (http://creativecommons.org/licenses/by/4.0/).