Article

Thermal Decomposition of a Single AdBlue® Droplet Including Wall–Film Formation in Turbulent Cross-Flow in an SCR System

1
Institute of Energy and Power Plant Technology, Technische Universität Darmstadt, 64287 Darmstadt, Germany
2
Institut für Technische Thermodynamik, Karlsruher Institut für Technologie, 76131 Karlsruhe, Germany
3
Institut für Technische Chemie und Polymerchemie, Karlsruher Institut für Technologie, 76131 Karlsruhe, Germany
*
Author to whom correspondence should be addressed.
Energies 2019, 12(13), 2600; https://doi.org/10.3390/en12132600
Submission received: 23 May 2019 / Revised: 21 June 2019 / Accepted: 1 July 2019 / Published: 6 July 2019

Abstract

:
The selective catalytic reduction (SCR) methodology is notably recognized as the widely applied strategy for NOX control in exhaust after-treatment technologies. In real SCR systems, complex unsteady turbulent multi-phase flow phenomena including poly-dispersed AdBlue® spray evolve with a wide ranging relative velocity between the droplet phase and carrier gas phase. This results from an AdBlue® spray that is injected into a mixing pipe which is cross-flowing by a hot exhaust gas. To reduce the complexity while gaining early information on the injected droplet size and velocity needed for a minimum deposition and optimal conversion, a single droplet with a specified diameter is addressed to mimic a spray featuring the same Sauter Mean Diameter. For that purpose, effects of turbulent hot cross-flow on thermal decomposition processes of a single AdBlue® droplet are numerically investigated. Thereby, a single AdBlue® droplet is injected into a hot cross-flowing stream within a mixing pipe in which it may experience phase change processes including interaction with the pipe wall along with liquid wall–film and possible solid deposit formation. First of all, the prediction capability of the multi-component evaporation model and thermal decomposition is evaluated against the detailed simulation results for standing droplet case for which experimental data is not available. Next, exploiting Large Eddy Simulation features the effect of hot turbulent co- and cross-flowing streams on the dynamic droplet characteristics and on the droplet/wall interaction is analyzed for various droplet diameters and operating conditions. This impact is highlighted in terms of droplet evaporation time, decomposition efficiency, droplet trajectories and wall–film formation. It turns out that smaller AdBlue® droplet diameter, higher gas temperature and relative velocity lead to shorter droplet life time as the droplet evaporates faster. Under such conditions, possible droplet/wall interaction processes on the pipe wall or at the entrance front of the monolith may be avoided. Since the ammonia (NH3) gas generated by urea decomposition is intended to reduce NOX emission in the SCR system, it is apparent for the prediction of high NOX removal performance that UWS injector system which allows to realize such operating conditions is favorable to support high conversion efficiency of urea into NH3.

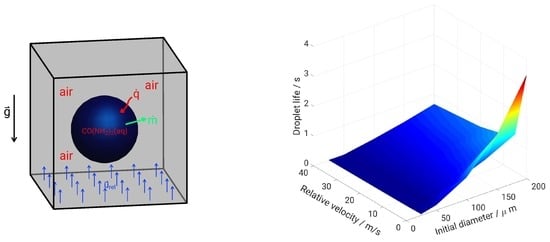
Graphical Abstract

1. Introduction

Emission regulations in the automotive industry have become increasingly stringent, especially for diesel engines for both heavy-duty trucks, passenger cars and off-highway applications for which the limits on NOX content in exhaust gas will be even further tightened [1,2,3]. A viable way to meet these requirements is in combining in-cylinder innovative combustion technologies and accurate exhaust after-treatment strategies [2,4]. Focusing on the exhaust after-treatment, the selective catalytic reduction (SCR) methodology is notably recognized as the widely applied technique for NOX control [3,5,6].
To achieve the suitable high NOX reduction rates, optimal atomization and evaporation of UWS droplets (UWS: urea–water solution), as well as the thermal decomposition of urea and the subsequent mixture formation of the resulting reducing agent ammonia in the exhaust system are crucial [5,7,8,9]. At the same time, the formation of undesirable deposit products on the exhaust duct wall must be avoided to ensure reliable operation. Both processes, NOX reduction and the formation of deposits, are largely determined by the process evolving in the mixing section upstream to the SCR monolith and the positioning and type of UWS injector [10]. Many experimental and numerical investigations have been carried out in order to describe the evaporation process of UWS single droplet along with the thermal decomposition under various operating conditions [7,8,9,10,11].
Focusing on numerical simulations, an accurate way to account for all processes might consist in the use of a detailed simulation of both processes close to the droplet surface and within the droplet for the liquid phase. This art of simulations is unfortunately computationally very costly for turbulent poly-disperse sprays and only suitable for single droplet without complexities related to engineering applications [11,12]. With regards to the UWS binary system, the affect of convective flow around the AdBlue® droplet is neglected to reduce computational costs with over-saturation and crystallization of urea are not considered (e.g., [11]).
The state-of-the art for engineering predictions consists in applying droplet evaporation models mostly in the context of RANS technique in which the droplet phase is tracked by a Lagrange particle approach while the Eulerian framework is adopted to describe surrounding gas phase. In particular, instead of resolving the interface between gas-droplet phase, rather so-called film-based models including the 1/3 or 2/3 rule are used. A review of the various existing evaporation models can be found in [12,13,14,15]. The process within the droplet is captured by so-called droplet models (e.g., Rapid Mixing model [5], conduction limit model [7], effective conductivity model, diffusion model [11], vortex model, etc.). Thermal decomposition mechanisms are diversely implemented and various conversion rates achievements discussed (e.g., [5,7,8,9,16]). However, the complexity of evaporating urea sprays as they are encountered in large-scale exhaust systems does not facilitate the task once urea is sprayed within a mixing pipe configuration and evolves in an unsteady environment. From all these studies, it could be observed that under unfavorable operating conditions the UWS at the entrance of the SCR catalyst is not always fully evaporated or converted. As a result, droplets of UWS can get into the fine channels of the catalyst and interact with them leads to an inefficient NOX reduction and in the worst case to failure of the SCR system due to deposit formation within the fine monolith channels [3,17,18]. This shows that the main issue in SCR system to find out the optimal velocity of urea injection and the UWS spray droplet size remains still unsatisfactory addressed.
Although diverse operating conditions have been considered in the literature as reviewed in [7,8,9,19], it is noteworthy that the effect of turbulence modulation on the evaporation and thermal decomposition process has not yet been really investigated in SCR systems. In [20] only the effect of turbulence on the droplet trajectory by means of a dispersion model within the RANS framework has been reported. It is therefore of great interest to investigate how the turbulent cross-flowing stream conditions may influence the modification of transport in the vicinity of the droplet interface. For single component droplet sprays, the effect of turbulence on vaporization and mixing of liquid-fuel sprays has been experimentally investigated in [14,21,22] and numerically in [14] resulting in the consideration of a so-called evaporation Damkoehler number defined as the ratio of the turbulence time scale to the vaporization time scale [14,21].
In SCR systems, contributions towards the analysis of mixing and evaporation have been reviewed in [5,7,8,20]. However, the most of these works focused solely on retrieving the evaporation and thermal decomposition of UWS along with the ammonia conversion rate in mono-disperse UWS sprays using RANS models without particular consideration of turbulent flow modulation process. Only recently, hybrid LES/RANS (HLR) [19] and full LES [23] approaches have been implied to accurately describe the gas phase processes far around the droplet.
Kaario et al. [19] undertook simulation of single droplet in uniform ambient flow prior to their 3D (3 dimensional) simulations of mono-disperse spray. To get insight into the UWS injection, they used the hybrid LES/RANS (HLR) approach to create phase diagrams that can allow to predict the optimum operation regions for the SCR systems. Thereby, the injection process was primarily characterized as function of the gas velocity (gas velocity U g = 0 , U b u l k , U i n j ) and droplet size (assuming a constant droplet temperature ( T p = 323 K) and gas temperature ( T g = 523 K), as well as as function of the initial droplet diameter ( D p = 10, 20, 30 40 μ m) and the slip velocity. In their study, the UWS is considered as a single component for which the mass transfer during the droplet evaporation is described according to Bird et al. (1966) [24] where the mass transfer coefficient follows the Ranz and Marshall [25] ansatz. Gan et al. [16] pointed out the relation between evaporation time, droplet initial diameter and relative velocity, and found out that droplet with smaller diameter, higher gas temperature and relative velocity likely lead to shorter evaporation time. Operating temperature plays a key role as a determining factor for deposit component while temperature and reaction time strongly affect the deposit yield. However, this investigation was conducted within the RANS context completely missing the effect of turbulence modulation. Nishad et al. [7,23] developed an LES-based Eulerian–Lagrangian framework to study evaporation and thermal decomposition and applied it toAdBlue® single droplet as experimentally investigated in [26] without cross-flowing effect [7] and to AdBlue® spray in hot cross-flowing stream without consideration of turbulence modulation effect and wall–film formation process [23].
With respect to droplet trajectories, most of the studies in the literature have been carried out in the context of gas turbine combustion chamber applications for single component droplets under ambient conditions. Thereby, various semi-empirical correlations could be derived to describe the droplet trajectory [27]. Only few studies have been conducted at elevated pressure and temperature as pointed out by Prakash et al. [28] who suggested a new analytical correlation. This depends not only on the effective magnitude of the liquid-to-air ratio as in ambient conditions, but also on the density ratio of both the carrier phase and the single component liquid fluid. The case of multicomponent droplet with varying compositions during evaporation process as it occurs in SCR systems is not yet addressed.
In real SCR systems, complex unsteady turbulent multi-phase flow phenomena including poly-dispersed AdBlue® spray evolve with a wide ranging relative velocity between droplet phase and carrier gas phase. This results from an AdBlue® spray which is injected into a mixing pipe which is cross-flowing by a hot exhaust gas. To reduce the complexity while gaining early information on the injected droplet size and velocity needed for a minimum deposition and optimal conversion, a single droplet with a specified diameter is investigated in the present paper to mimic a spray featuring the same Sauter Mean Diameter. The LES-based Eulerian–Lagrangian model including a multi-component evaporation model along with a thermal decomposition mechanism as developed by Nishad et al. [7] is extended to include wall–film formation model and subsequent possible deposit formation in order to study the effect of turbulent cross-flowing stream conditions on the dynamic droplet characteristics. The effect is monitored in terms of evaporation time, decomposition efficiency, droplet trajectory and liquid wall–film formation. The objective is to provide early information on the injected droplet size and velocity required for a minimum deposition and optimal conversion.
The paper is organized as follows. In the next section (Section 2), the droplet configurations to be investigated are introduced. In Section 3, the modeling description of the evaporation, thermal decomposition and liquid wall–film formation is shortly introduced, followed by an outline of a detailed simulation model which will provide first reliable comparison data for the evaporation and thermal decomposition processes. The achievements of the LES-based Eulerian–Lagrangian model and the comparison with those obtained by the detailed numerical simulations of a standing droplet case (S1), for which no experimental data are available, are discussed in Section 4. The validated model is then used to retrieve the effects of the turbulent co- and cross-flowing streams (S2–S4) on the evaporating droplet dynamics and on the droplet/wall interaction process in Section 5 and Section 6, respectively. The last section is devoted to concluding remarks.

2. Droplet Configurations under Study

For the specific purpose of this study, four droplet configurations are designed as depicted in Figure 1 mimicking the operating flow conditions in SCR systems. Since SCR systems are in reality streamed by complex unsteady turbulent multi-phase flows that include poly-dispersed AdBlue® droplets and carrier gas phase with non-vanishing relative velocity, the simulation of stagnant droplets with vanishing relative velocity (see Figure 1, case S1) will serve only for validation purposes with detailed numerical simulation data for which experimental data are not available. Note that the characteristics of the depletion process of a single UWS droplet have been reported in [23] based on various experimental temperatures operating conditions investigated by Wang et al. [26] with gravity effect.
In the present paper, the influence of relative velocity on both the evaporation and thermal decomposition will be investigated for various droplet diameters and gas phase temperatures (see Figure 1, cases S2–S4) taking advantage of the LES capabilities of the LES-based Eulerian–Lagrangian module. Case S2 considers a standing droplet, while case S3 depicts a droplet into a convective environment with co-flow characterized by various relative velocities between the carrier phase and the droplet phase. S4 represents an injected droplet into a hot cross-flowing stream within a mixing pipe in which the droplet may experience phase change processes including interaction with the pipe wall along with liquid wall–film and possible solid deposit formation processes. A hex-hedral mesh with 216 grid points is used to investigate the standing droplet cases (case S1-no gravity, and case S2-with gravity). For the case with droplet relative velocity (case S3), the domain with 30 × 30 × 50 mm3 is discretized by a total of 45,000 control volumes (CVs). The case S4 is selected from a generic experimental configuration as reported in [10]. A hex-hedral mesh with ≈3.55 millions CVs is used to spatially discretize the complete domain (see Figure 1d). Since, the present simulations are near wall resolved, the mesh size varies from near wall to the duct core (from 120 μ m at wall to 0.1 mm at flow core). Proper initial and inlet boundary conditions are prescribed by following our previous study [23].

3. Model Formulation

In this section, the LES-based Eulerian–Lagrangian numerical module is concisely described. Then, the mathematical modeling of the detailed simulation tool is outlined.

3.1. LES-Based Eulerian–Lagrangian Numerical Module

This module consists of an Eulerian description of the gas phase in the LES context and a Lagrangian framework for tracking the UWS droplet. It thus includes a multicomponent evaporation model, a thermal decomposition mechanism and a description of liquid wall–film formation.

3.1.1. Description of Carrier Phase and LES Model

In this paper, the flow turbulence is described by the a classical LES model. In this, large flow structures are fully resolved, while sub-grid scale (SGS) models are applied to closed the small scale non-filtered terms. The filtered transport equations read;
Ψ ˜ t + u ˜ j Ψ ˜ x j = F ˜ x F SGS x + Σ ˜ Ψ ˜ + S ˜ Ψ ˜
Thereby the quantity Ψ ˜ is defined as Ψ ˜ = ρ Ψ ¯ ρ ¯ , t expresses the time, x the coordinate vector, x i , ( i = 1 , 2 , 3 ) the coordinate component and u i the velocity component. Overbars and tildes express spatially filtered with a filter width Δ g and density-weighted (Favre-filtered) quantity, respectively. The remaining quantities in Equation (1) are provided in Table 1 for a Newtonian reacting fluid flow under investigation here.
In Table 1 the quantities ρ ¯ and p ¯ are the Favre averaged density and pressure, respectively u i ˜ the gas phase filtered velocity, F ˜ the filtered molecular diffusion term, F SGS the sub grid diffusion part. The quantity Σ ˜ Ψ ˜ represents a supply contribution, and W ˜ h ˜ is an extra source term of enthalpy that may be due to radiation. S ψ ˜ , the so-called phase interaction/source term due to spray droplet ([29]). D ψ ˜ denotes the scalar diffusion coefficient.
Since the turbulent co- and cross-flow features a wall-bounded flow, a Wall-Adapting Local Eddy-Viscosity (WALE) Model [30] is considered appropriate with reasonable computational cost as pointed out in [30,31,32], among others. In which, the term τ i j SGS = u i u j ˜ u i ˜ u j ˜ also called SGS stress tensor is closed as:
τ i j SGS 1 3 τ k k SGS δ i j = 2 μ t S ˜ i j 2 3 δ i j S k k ˜ with μ t = ρ C w Δ g 2 S i j d S i j d 2 / 3 D ¯ i j D ¯ i j 5 / 2 S i j d S i j d 5 / 4 S i j d = 1 2 U ¯ i x j 2 + U ¯ i x j 2 1 3 δ i j U ¯ k x k 2 and D i j = 1 2 U ¯ i x j + U ¯ i x j + 1 3 δ i j U ¯ k x k .
In these equations, S i j d is the deviatoric part of the square of velocity gradient, D i j the symmetric part of the velocity gradient, Δ g the filter width and C w = 0.5 , a model coefficient expressed in terms of Smagorinsky coefficient as C w 2 = 10.6 · C s 2 [32] (for C s = 0.17 ).
Note that in the present study the size of wall mesh is kept close to “ Y + 1.0 ” in order to carry out a wall resolved LES according to [33].
Further, for the filtered scalar (mass fraction, and energy) field, the quantity J j SGS = u j Ψ ˜ u j ˜ Ψ ˜ is closed as:
J j SGS = u j Ψ ˜ u j ˜ Ψ ˜ = D e d Ψ ˜ x j with D e d = ν t S c t ( P r t ) .
where S c t ( P r t ) expresses the turbulent Schmidt (Prandtl) number.
It is worth noting that the two-way coupling for drag, evaporations is realized between the gas and droplet particle phase. Their expressions are provided in [34]. Thereby, both carrier and dispersed phases in this formulation are treated separately and in a non-conservative form following [7,34]. Further, as the LES considered do at least resolve 80% of the instantaneous carrier phase turbulence, the droplet particle dispersion and the fluctuations on the scalars are fairly considered. In LES methodology the state of turbulence at inlet and initial conditions is crucial as reported in many research contributions [23,30,32,33]. Therefore, we follow the method of Nishad et al. [23] to provide realistic initial and inlet conditions for LES in the present paper.

3.1.2. Lagrange Particle Tracking

In this section, a brief overview of the governing equations for the liquid phase is provided. It is based on Lagrangian formulation and provided by a set of ordinary differential equations for droplet position X i and velocity u i as:
d X i d t = u i , d u i d t = C D τ d R e P 24 U i u i + g i
Thereby, the drag and buoyancy forces are only considered as the density ratio of dispersed and gas phase is in the order of 10 3 . Where, R e P = | U i u i | d p ρ g / μ g is the droplet Reynold’s Number, τ d = ρ p d p 2 / 18 μ g the droplet relaxation time, and the droplet drag coefficient C D is given as (see in [7,35]);
C D = 24 R e P 1 + 1 6 R e P 1 / 3 if R e P < 1000 0 . 424 if R e P 1000
Along with the droplet motion, the heating and evaporation processes within the droplet are described by solving a 1D (1 dimensional) heat and mass transport equation to track the species and thermal evolution along the droplet radius according to [7]. In particular, equidistant 11 CVs along the radial coordinate are enough to properly resolve these evolutions. Heat and mass exchanges with the gaseous phase are computed according to the evaporation film-based model as reported in [15]. The evaporation rate is, thus, described as:
m ˙ = d m d d t = i n m ˙ i = i n π d p ρ ¯ D ¯ i , g S h i l n 1 + B M , i ,
while the heat balance is given as:
d T d d t = m ˙ c p , v a p , r e f T g T P / B T H v a p m d C p , d .
where, d p is the droplet diameter, T d the droplet temperature, m ˙ and m ˙ i represents the total evaporation rate of droplet and individual species i, respectively. D i , g the binary vapor/gas diffusion of component i in the gas, H v a p the latent heat, c p , d and c p , v a p , r e f are the specific heat capacity of liquid and vapor phase, respectively. The quantities B T and B M are the Spalding mass and heat transfer numbers, respectively. S h i denotes the modified Sherwood number given by:
S h i = 2 + S h 0 i 2 F B M , i with B M , i = Y i , s Y i , 1 Y i , s , F B M , i = 1 + B M , i 0.7 l n 1 + B M , i B M , i
and S h 0 i = 2.0 + 0.6 R e 1 / 2 S c i 1 / 3 where S c i = μ g ρ g D i g
define the Reynolds and Schmidt numbers, respectively. In particular Y i , and Y i , s are the mass fraction of species i far field and at droplet surface, respectively. Equations (6) and (7) can be combined to deliver the heat transfer correlation as [12];
m ˙ = π d p λ g C p g N u * ln ( 1 + B T )
where, the updated Nusselt number N u * is defined as [12];
N u = 2 + N u 0 2 F B T with B T = C p g T T d L , N u 0 = 2.0 + 0.6 R e 1 / 2 P r 1 / 3 , P r = C p g μ g λ g .
thereby, the Prandtl number P r is expressed as function of specific heat C p g , viscosity μ g , and thermal conductivity λ g of carrier gas, respectively. It should be noted that B T is related to B M by
B T = 1 B M , i ϕ where ϕ = C p l S h C p g N u 1 L e .
In this study, the Lewis number L e is set to value 1. In order consider natural convection, the expressions above have been extended as reported in [23].

3.1.3. Thermal Decomposition

The AdBlue® droplet is a binary mixture of 32.5 wt % urea and 67.5 wt % water which is injected upstream of the SCR monolith into the exhaust duct, where the evaporation process first takes place by utilizing the available exhaust gas heat:
CO ( NH 2 ) 2 ( aq ) CO ( NH 2 ) 2 ( s , l ) + H 2 O ( g ) .
The resulting urea first melts (melting point of 407 K) if it is in solid state and, then starts to decompose thermally. In addition to ammonia production, the urea decomposition of also leads to the formation of ammonium isocyanate, biuret, and triuret. The cyanuric acid and other higher compounds are produced above 453 K. For very fast urea heating, the thermal decomposition processes which include both the thermolysis and hydrolysis follow after most of the water is evaporated. During thermolysis, urea decomposes into ammonia (NH3) and isocyanic acid (HNCO):
CO ( NH 2 ) 2 ( s , l ) NH 3 ( g ) + HNCO ( g ) .
The produced gaseous NH3 thus takes part in the SCR reactions to reduce the engine NOX, while the resulting HNCO will further react with water vapor to produce NH3 through hydrolysis reaction:
HNCO ( g ) + H 2 O NH 3 ( g ) + CO 2 ( g ) .
Following [23] where only the thermolysis has been considered, in the present paper in which both the thermolysis and the hydrolysis are accounted for, the hydrolysis given by the reaction rate of Equation (15) is also described by an Arrhenius-type equation according to [5,20].
As already mentioned above, the SCR performance is greatly hindered by the incomplete thermolysis of urea ahead the SCR catalyst, among others. Which can be attributed to both the incomplete evaporation of water or/and to urea thermolysis process. This may lead to undesirable deposition solid by-products on the SCR duct walls and substrates inlets.

3.1.4. Liquid Wall Film and Deposit Formation

The droplet impingement over the wall may result in a liquid wall–film formation. Since the liquid film may flow along the wall and evaporate, this may evolve to form deposition after a certain characteristic time depending on the temperature and the flow rate in presence. The length scale of wall–film and solid deposit formation can vary from micro to macro scale depending upon the operational stage of SCR system. The rate of chemical reactions for deposit by-product formation can also vary extensively with certain reactions taking minutes to evolve completely. This way temporal and spatial evolution of the deposition features a highly complex phenomenon which is not very well understood. Using both simulations and experiments, Munnannur et al. [36] provided a regime map for droplet-wall interaction with respect to fundamentals of thermal and fluid dynamic properties. Birkhold et al. [5,37] utilized a drop impingement model based on the work by Kuhnke [38]. Obviously, the spray wall-impingement and subsequent deposit formation depends on individual injection system and spray properties and decomposition, configuration of SCR mixing chamber, conditions on the exhaust pipe surface, etc. Given a specific SCR system, the chemistry models must consider some reaction pathways also resulting from incomplete decomposition (e.g., [5,7,8,16]). Nevertheless, the single step global mechanism for urea decomposition into NH3 and HNCO as provided in Equations (14) and (15) is used in the present paper.
Regardless of this limitation, high-fidelity sub-models are generally used to investigate the key processes such as cross-flow turbulence and droplet-wall interaction to allow useful inferences to be drawn on urea deposit formation, especially the likelihood of wall–film development and impingement induced breakup which can influence the overall evaporation and conversion dynamics. The wall/droplet interaction description in the present paper relies on an advanced extension of the approach reported by O’Rourke et al. [39]. This extension includes droplet deposition, spreading of the film owing to impingement pressure/film inertia, rebound, and splashing (see in [40]). In the case of droplet deposition, impacting droplets are treated as so-called wall particles. For these conditions, 2D (2 dimensional) equations for film mass, energy and momentum are solved. The resulting film thickness, which in this case results from the total volume of the deposited droplets, is described by an evolution equation. The various regimes of the drop-wall interaction (breakup/splash, deposition, rebound) are differentiated or determined by means of an effective impact parameter, K , and a suitable dimensionless temperature, T * , given as [37,40].
K = W e 1 / 2 R e 1 / 4 ; T * = T w T s a t with W e = ρ u n 2 d p σ ; R e = ρ u n d p μ
with u n is the normal velocity to the impinging wall. T w and T s a t are the wall and droplet saturation temperature, respectively.

3.1.5. Numerical Procedure

In this study, a KIVA-4mpi CFD code which is open source is used (LANL (Los Alamos National Laboratory), Los Alamos, NM, USA) for its appropriate features recently integrated for LES investigations in [40,41,42]. The code is based on on finite volume formulation, and is also suitable for compressible flow simulations. An arbitrary Eulerian–Lagrangian (ALE) method is applied to track the droplets within an LES framework. More details about the governing equations and respective formulations for the dispersed and gas phase solver is provided in [35]. See also [7,40,41,42] for more details.

3.2. Detailed Mathematical Modelling

To determine the influence of the evaporation model, the chemical kinetics and the ambient conditions on the evaporation and decomposition of UWS, it is numerically suitable to use a detailed numerical simulation. To reduce the computational efforts, the droplet is considered spherical so that a one dimensional models can be formulated [43]. In this subsection we rely on Stein et al. [11]. To avoid repetition, only the essential steps are recalled here.

3.2.1. Governing Equations

The required equations consist of mass, momentum and energy evolution equations as described in [44]. Integrating the convective terms often causes difficulties so the equations are transformed into modified Lagrangian coordinates [43]. For the gas-phase, these are [11]
r ψ t = 1 ρ r 2 ,
w i t + z w i ψ + ψ ( r 2 j i ) = ω ˙ i M i ρ ,
0 = T t 1 ρ c p p t + z T ψ 1 c p ψ ρ r 4 λ T ψ r 2 c p i = 1 n S j i c p , i T ψ + 1 ρ c p i = 1 n S ω ˙ i h i M i ,
ρ = p M ¯ R T ,
z = v ( ψ 0 ) ρ ( ψ 0 ) r D 2 .
The equations of the liquid phase are transformed in the same way and read [11]
r η t = ψ D 0 ρ r 2 ,
w i t 1 ψ D 0 ( η ϑ 0 ) w i η + 1 ψ D 0 η ( r 2 j i ) = 0 ,
0 = T t 1 ψ D 0 ( η ϑ 0 ) T η 1 c p ψ D 0 η ρ r 4 λ 1 ψ D 0 T η r 2 c p i = 1 n S j i c p , i 1 ψ D 0 T η ,
ρ = ρ ( w 1 , , w n S , p , T ) ,
ϑ 0 ( t ) = d ψ D 0 d t = ϕ v a p r D 2 .
In these equations, the quantities r, and ψ are the spatial radial coordinate, and Lagrangian coordinate, respectively. The superscript “ ( ) 0 ” represent gas phase and “ ( ) D 0 ” the liquid phase at droplet surface before second transformation with η the Lagrangian coordinate transformed for the liquid phase. The variables w and x are the mass and molar fraction, respectively. The thermo physical properties c p , p, R, λ , and h represent the constant pressure specific heat capacity, pressure, gas constant, heat conductivity, and enthalpy, respectively. r D the droplet radius, j i the diffusion flux density of species i, j q , c the heat flux density due to conduction, z the mass flux at droplet surface, ϕ the mass flux density, n S the number of species, r d e c the reaction rate of urea decomposition, and ω ˙ the source term due to chemical reaction.
In the gas phase detailed models are applied to describe the transport processes. An approximation by Hirschfelder and Curtiss [24] is used to determine the diffusion coefficients and heat fluxes are calculated using Fourier’s law. As the droplet size is small convection can be neglected as it would only have a limited effect on heat and mass transfer. According to earlier studies, UWS shows only slight deviations from an ideal mixture [45]. It was also found that crystallization and over-saturation of urea show no strong influence on the evaporation process of UWS [46]. Furthermore, after most water has evaporated from an UWS droplet the temperature increases above the urea melting point in a very short time due to the small droplet sizes and thus, crystallized, urea is not expected to be present for a relevant amount of time [5,47,48]. For these reasons, urea is assumed to be liquid and can be modeled as an ideal mixture of liquids with property data taken from Yaws et al. [49]. During the water evaporation stage, the diffusion of urea within UWS is approximated by the diffusion coefficient of solid urea in water. When only a little amount of water is left in the droplet the influence of diffusion in the liquid phase becomes negligible. To ensure consistency, correlations from Reid et al. [50] are used to determine a diffusion coefficient of water in liquid urea during this phase.

3.2.2. Numerical Solution

Finite differences are employed to discretize the spatial coordinates for the gas phase ( ψ ) and for the liquid phase ( η ) on a non-equidistant adaptive grid. In this detailed numerical simulation, a total number of 100 grid points is sufficient to resolve the temperature and the species evolution in the liquid, gas phase and at the droplet interface. In the gas phase near the droplet transient steep gradients are expected. These gradients are resolved by a meshing procedure based on a grid function [51], which is applied during the evaporation process. In the liquid phase the steepest gradients are expected close to the droplet surface and the grid is refined towards this position [52]. At the center of the droplet, symmetry boundary conditions are applied. Neumann boundary conditions with zero gradients are used at the outer boundary of the gas phase. They approximate an adiabatic vessel without mass flow through the boundary, which makes it easier to determine the overall mass and reaction rates of all species in the gas phase after the droplet is evaporated completely. The system of partial differential and algebraic equations for both phases is then integrated using the linearly implicit extrapolation method LIMEX [53].

3.2.3. Interface

The multi-component evaporation model used in the detailed simulations is based on a model from Stauch [43]. It was modified in order to properly handle conditions with a strong difference in vapor pressure of the evaporating species. During the evaporation of one species, the second species is always near the vapor-liquid equilibrium. Such conditions are often found during UWS evaporation, especially when there is a high water content in the exhaust gas. In the resulting model, each species can independently condensate or evaporate irrespective of the overall mass flow. The assumptions of a continuous temperature profile T g = T l as well as a local phase equilibrium at the surface of the droplet were retained from the original model. To calculate the molar fraction of the evaporating species directly above the surface Raoult’s law is invoked. The resulting equation for all evaporating species, transformed for mass fractions, is
w i g = M i M ¯ v g p v a p , i p a m b x i l ,
with
x i l = w i l M ¯ v l M i ,
The mass flux at the surface for each species is [11]
ϕ v a p , i = w i g ϕ v a p + j i g = w i l ϕ v a p + j i l .
The overall vaporization rate is the sum of Equation (29) over all evaporating species. The boundary condition for other non-evaporating species reads
w i g = j i g ϕ v a p .
The system Equation (29) is thus closed by applying it to the liquid side. The equations for the liquid phase and for the gas phase are connected by the interface conditions and solved in a fully coupled way. The energy conservation equation for the interface is given in simplified form as [43]
0 = i ϕ v a p , i Δ h v a p , i + j q , c g j q , c l .
The Equations (17)–(21) thus represents the resulting system of partial differential algebraic equations for the gas phase and Equations (22)–(26) for the liquid phase. They are closed by Equation (27), and Equations (29)–(31) and the boundary conditions given in Section 3.2.2.

4. Assessment of the Multicomponent Evaporation Model: Evaporation Characteristics

In this section, the numerical data for the evaporation and thermal decomposition processes obtained by means of the detailed numerical simulations are used to validate the LES-based Eulerian–Lagrangian model applied to a generic standing droplet case (see Figure 1, case S1), for which experimental data are not available.
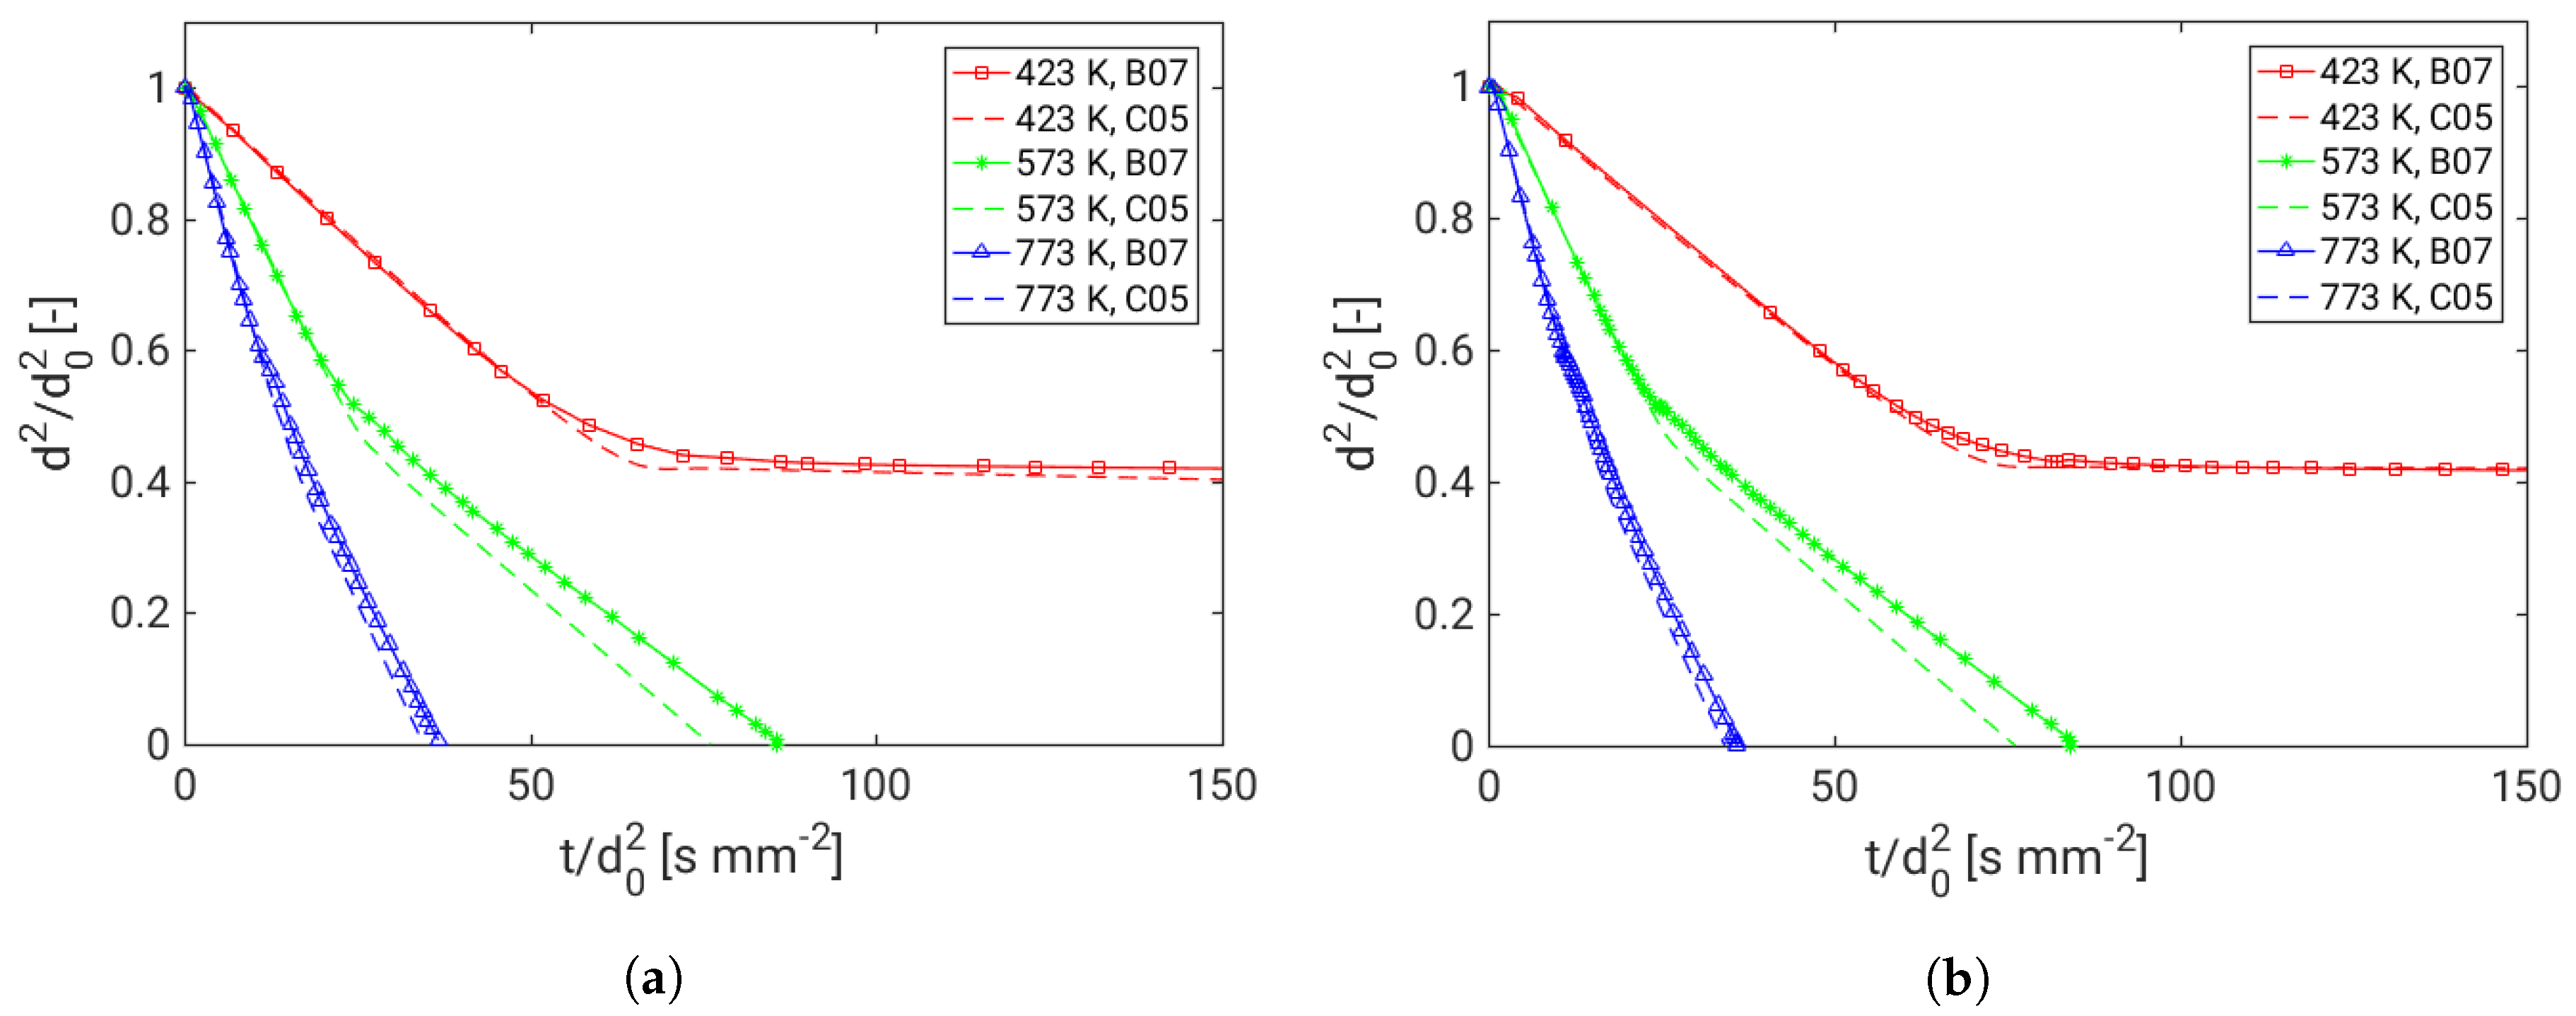
Using the boundary conditions as outlined above for a detailed description and considering the associated computational costs, it is reasonable to analyze the overall mass and reaction rate in the gas phase after the droplet evaporation without convection around the droplet. Thus, a standing AdBlue® droplet similar to that investigated in [23] is considered and relative velocity for which no experimental data is available. The numerical domain is extended to 100 droplet diameters or more so that possible interactions between the evaporation process and the outer boundary are inhibited. The obtained results are employed to assess the prediction capability of the multi-component evaporation model and thermal decomposition description. The properties used for comparisons between detailed simulations and the LES-based Eulerian–Lagrangian model are listed in Table 2. The respective comparisons have been carried out under consideration of chemistry (Equations (15) and (14)) and without chemistry, respectively. Considering both dry air and moist air environmental conditions, the results exhibit a very good agreement, demonstrating the suitability of the designed LES-based Eulerian–Lagrangian model when chemistry is not included. This is shown in Figure 2 for various temperatures (423 K, 573 K, 773 K).
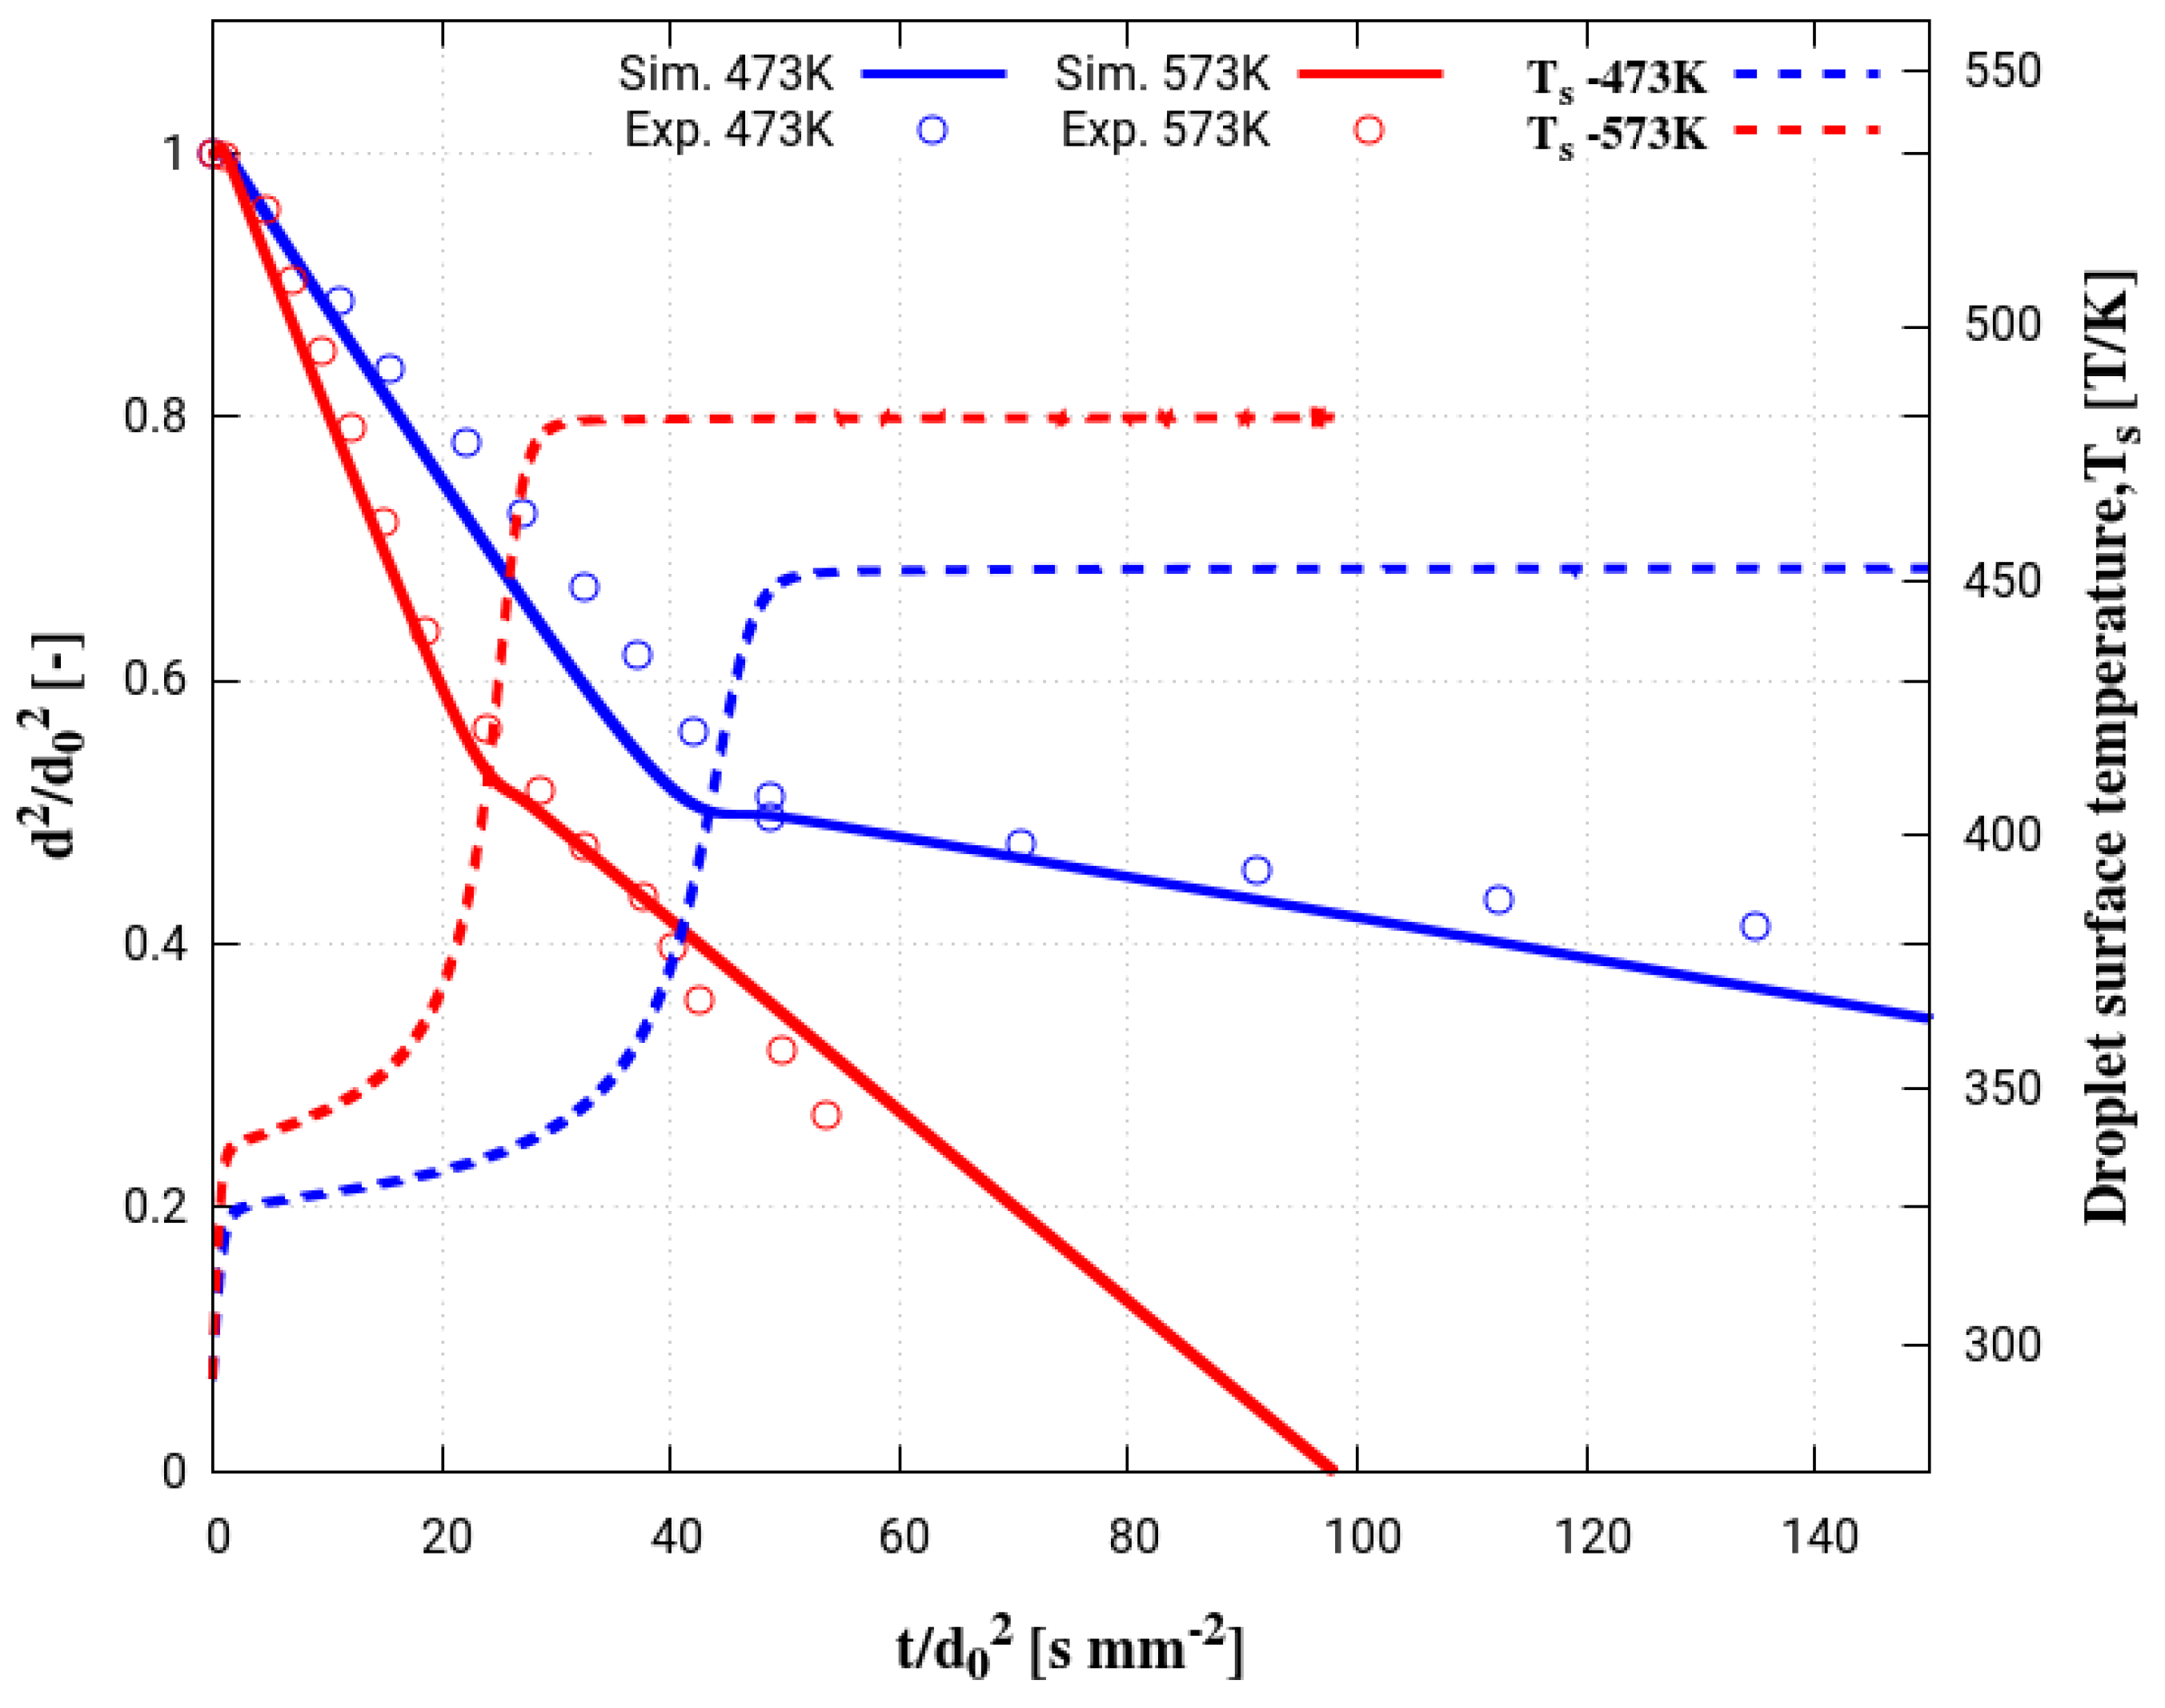
The results from both the simulations clearly capture the two typical slopes for the mass transfer of the AdBlue® droplet. The first slope represents an initial stage of water evaporation while the second slope shows the urea decomposition and mass transfer process. Regarding the temperature evolution within the droplets, this corresponds to a small temperature gradient during the initial stage of evaporation followed by four stages (heating of UWS, constant temperature value until water fully evaporates, heating up of urea, constant temperature value until urea fully evaporates/decomposes) of thermal conditions inside the droplet as pointed out in [7,23]. Subsequently, the predictive capability of the multi-component evaporation model is then appraised against the experimental data reported in [26]. Since the experiment is carried out for a static single droplet, the simulation results only from reduced model are validated (see Figure 3). The comparison shows a good agreement with experiment for two operating gas phase temperatures. The well-known evolution of four stages of the droplet surface temperature (Ts) can be clearly seen as dashed line in Figure 3. More details about experimental configuration and adopted measurement techniques can be found in [26].
After the successful validation of the LES-based Eulerian–Lagrangian module, focus is now put on the impact of relative velocity taking advantage of the LES features on both the evaporation and thermal decomposition examined for various droplet diameters and gas phase temperatures (see Figure 1, cases S2-4).

5. Evaporation and Thermal Decomposition Characteristics: Influence of Droplet Relative Velocity

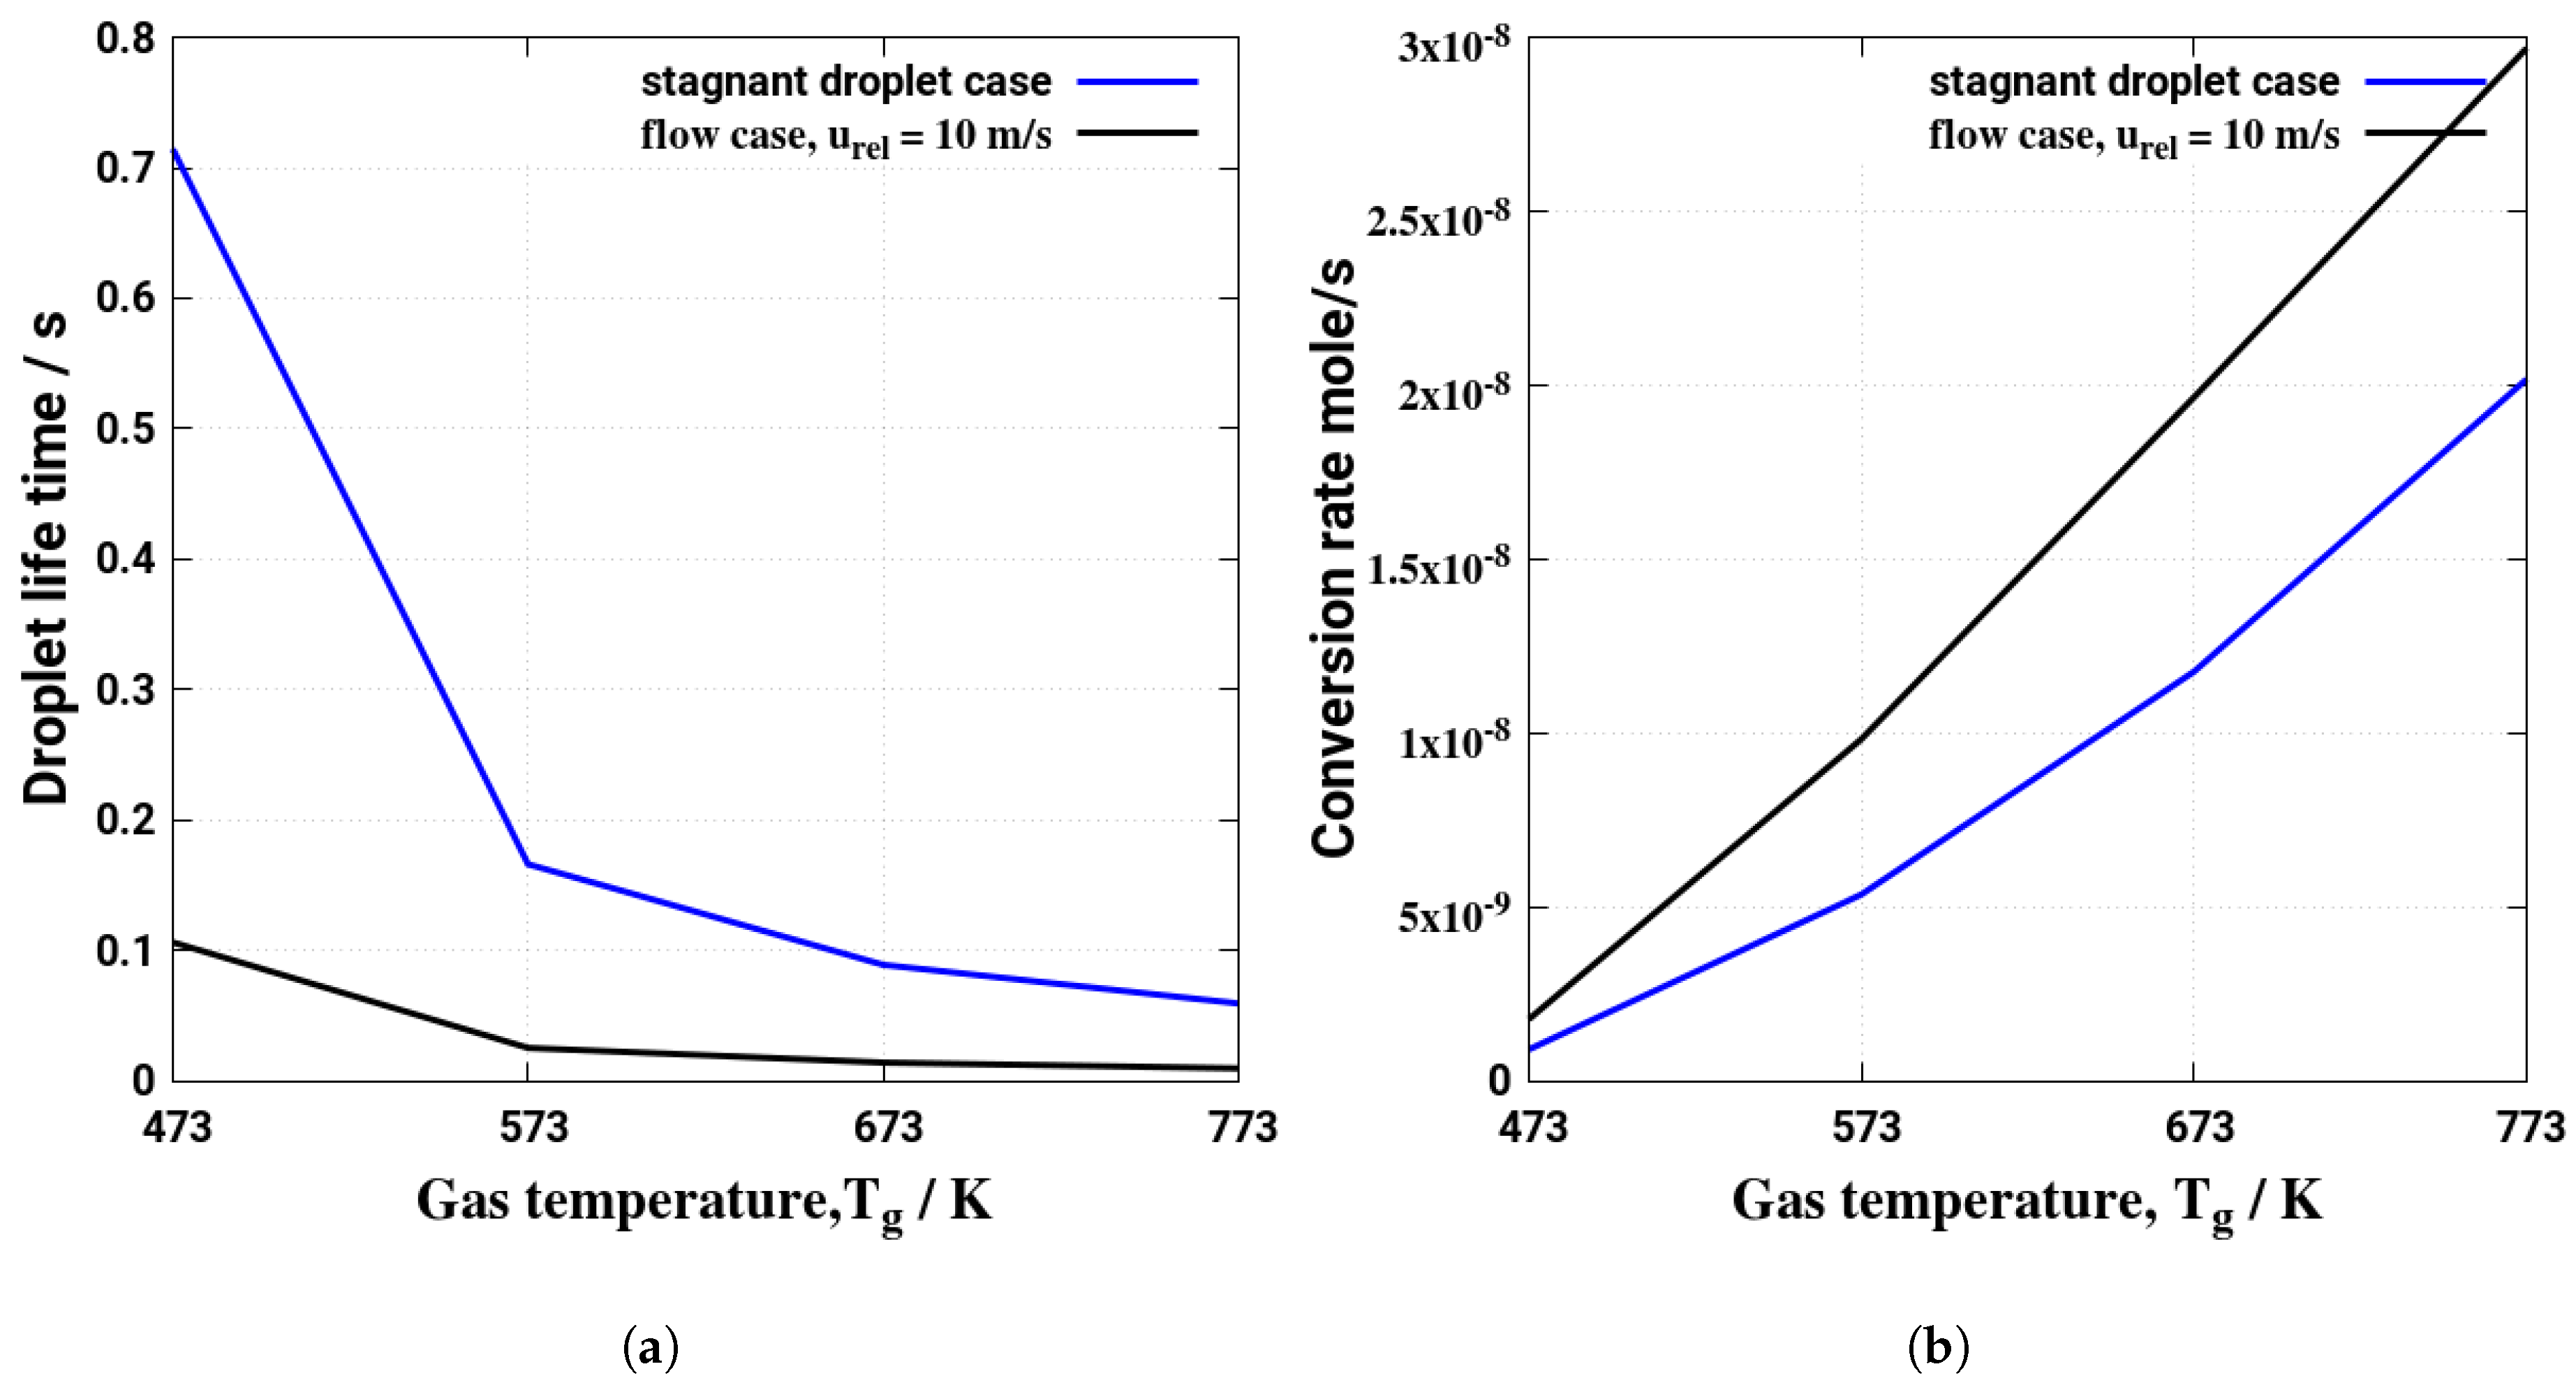
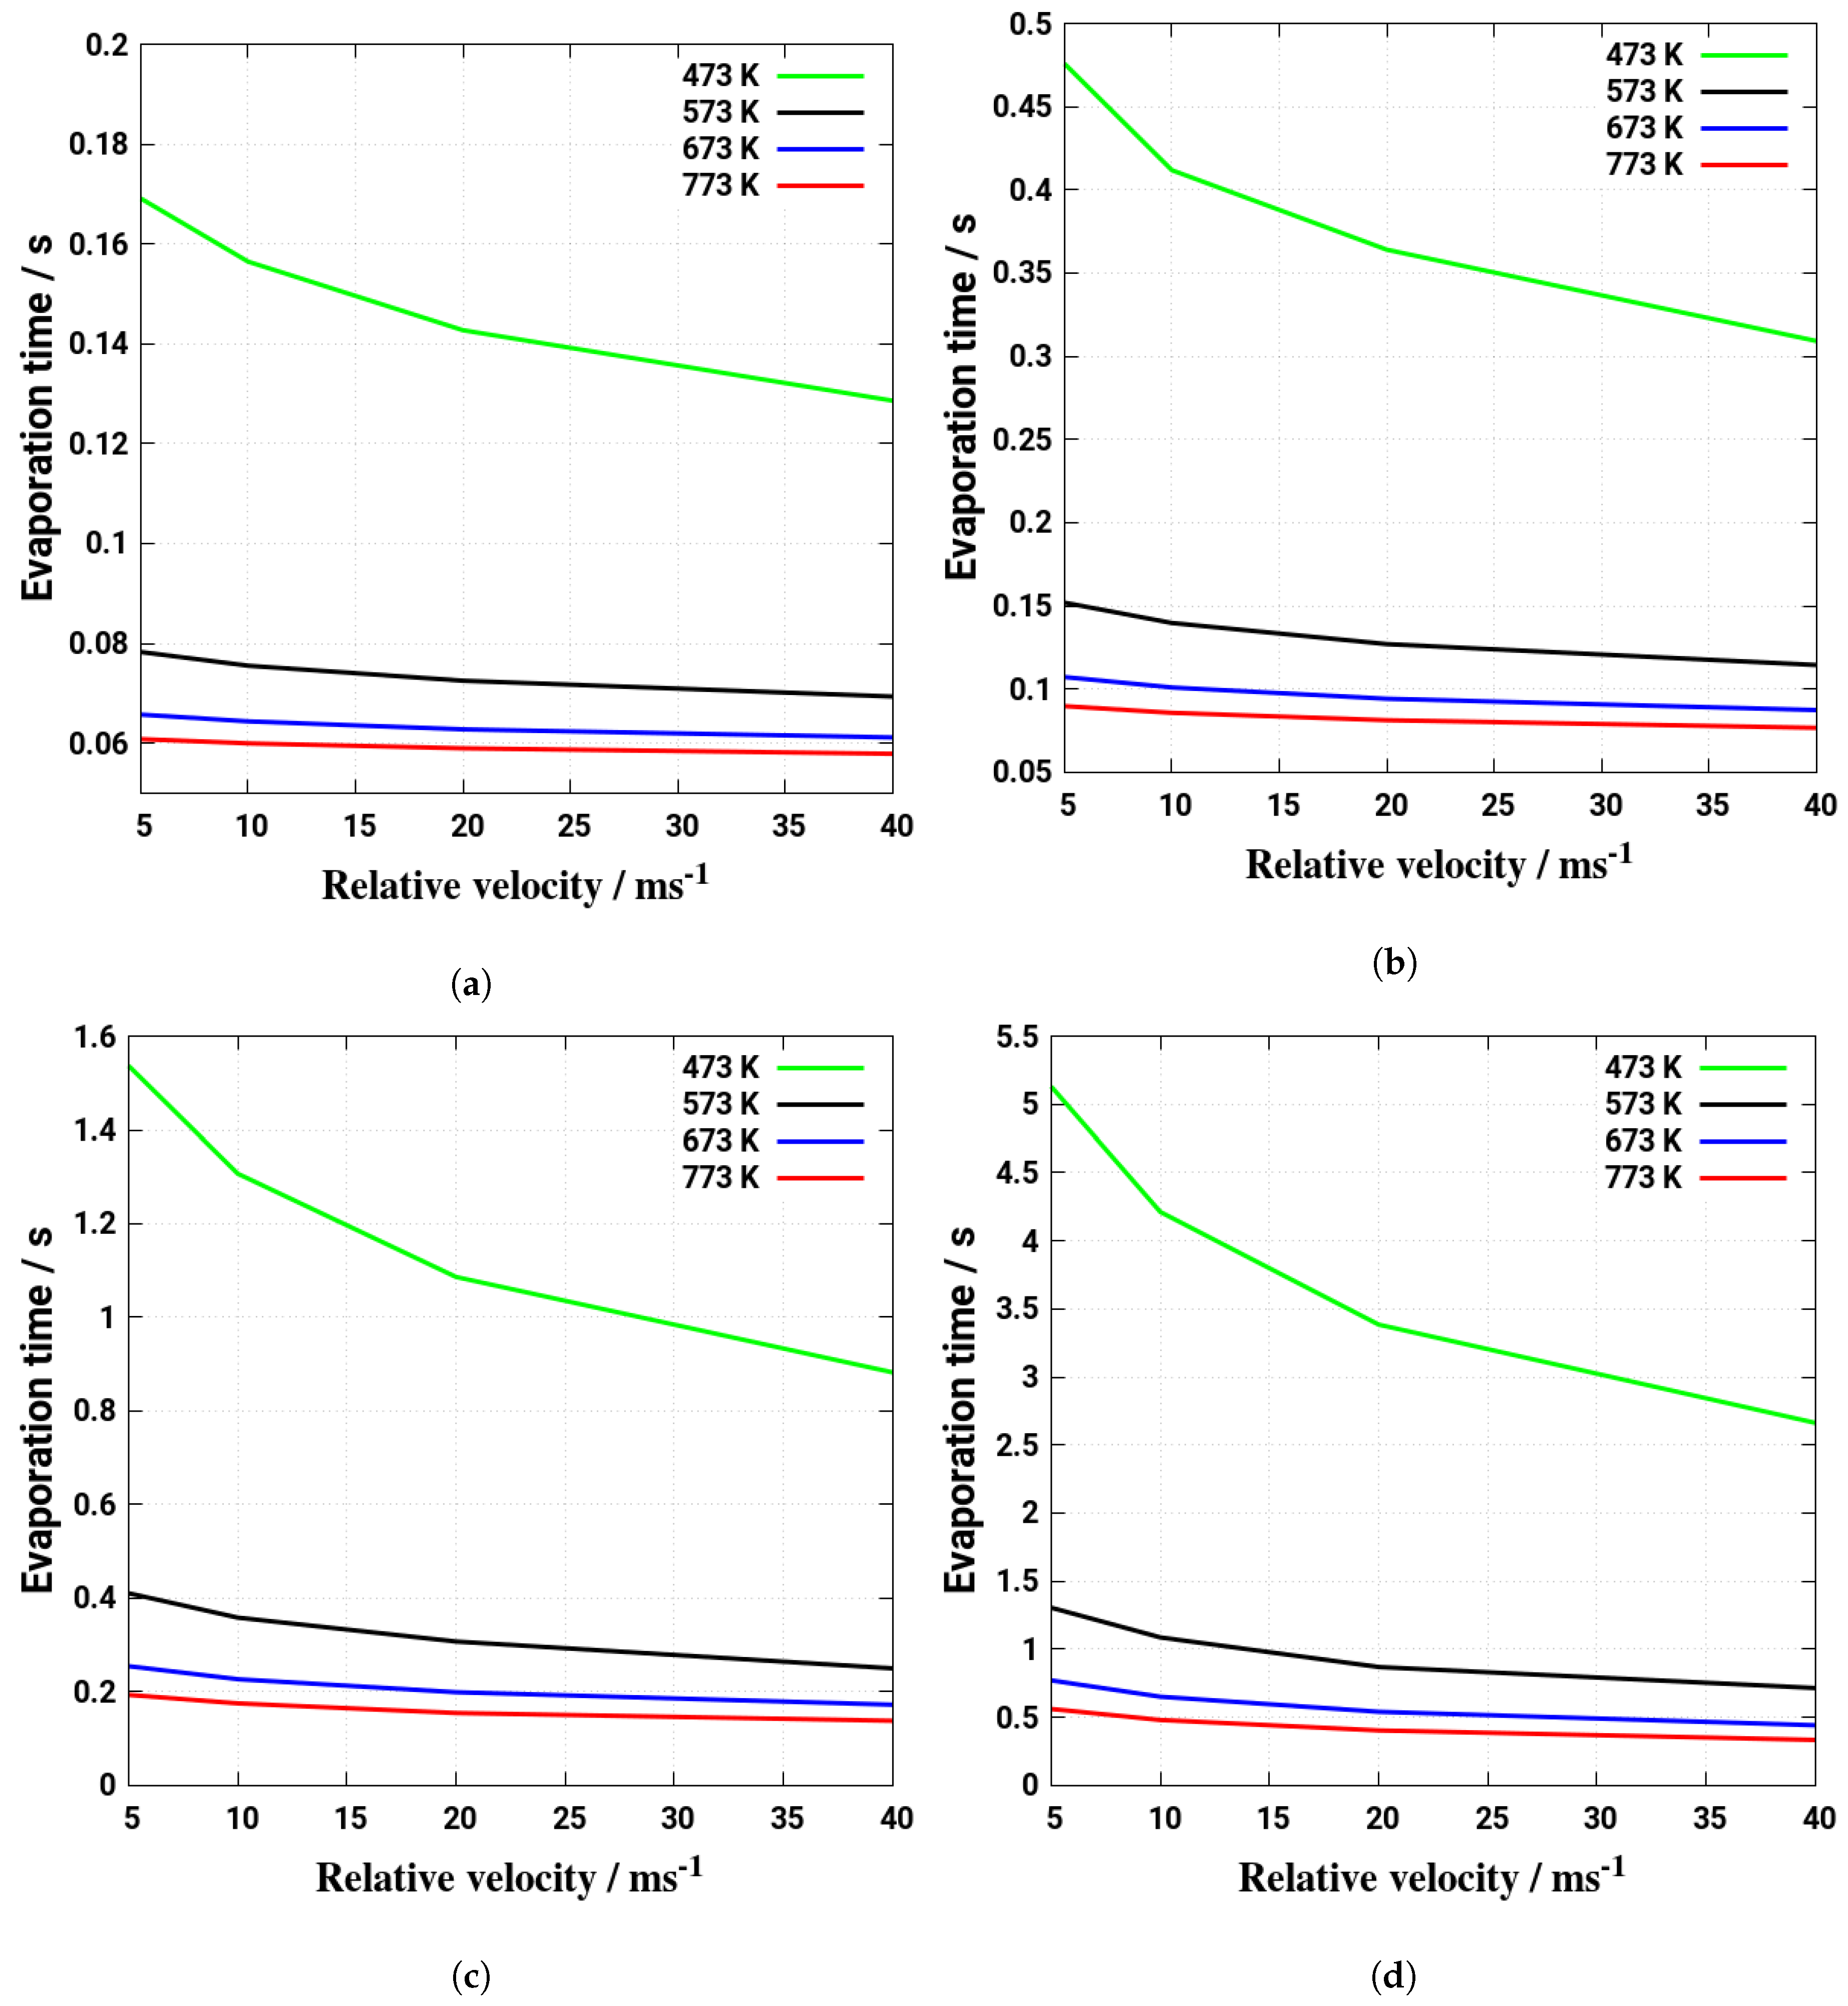
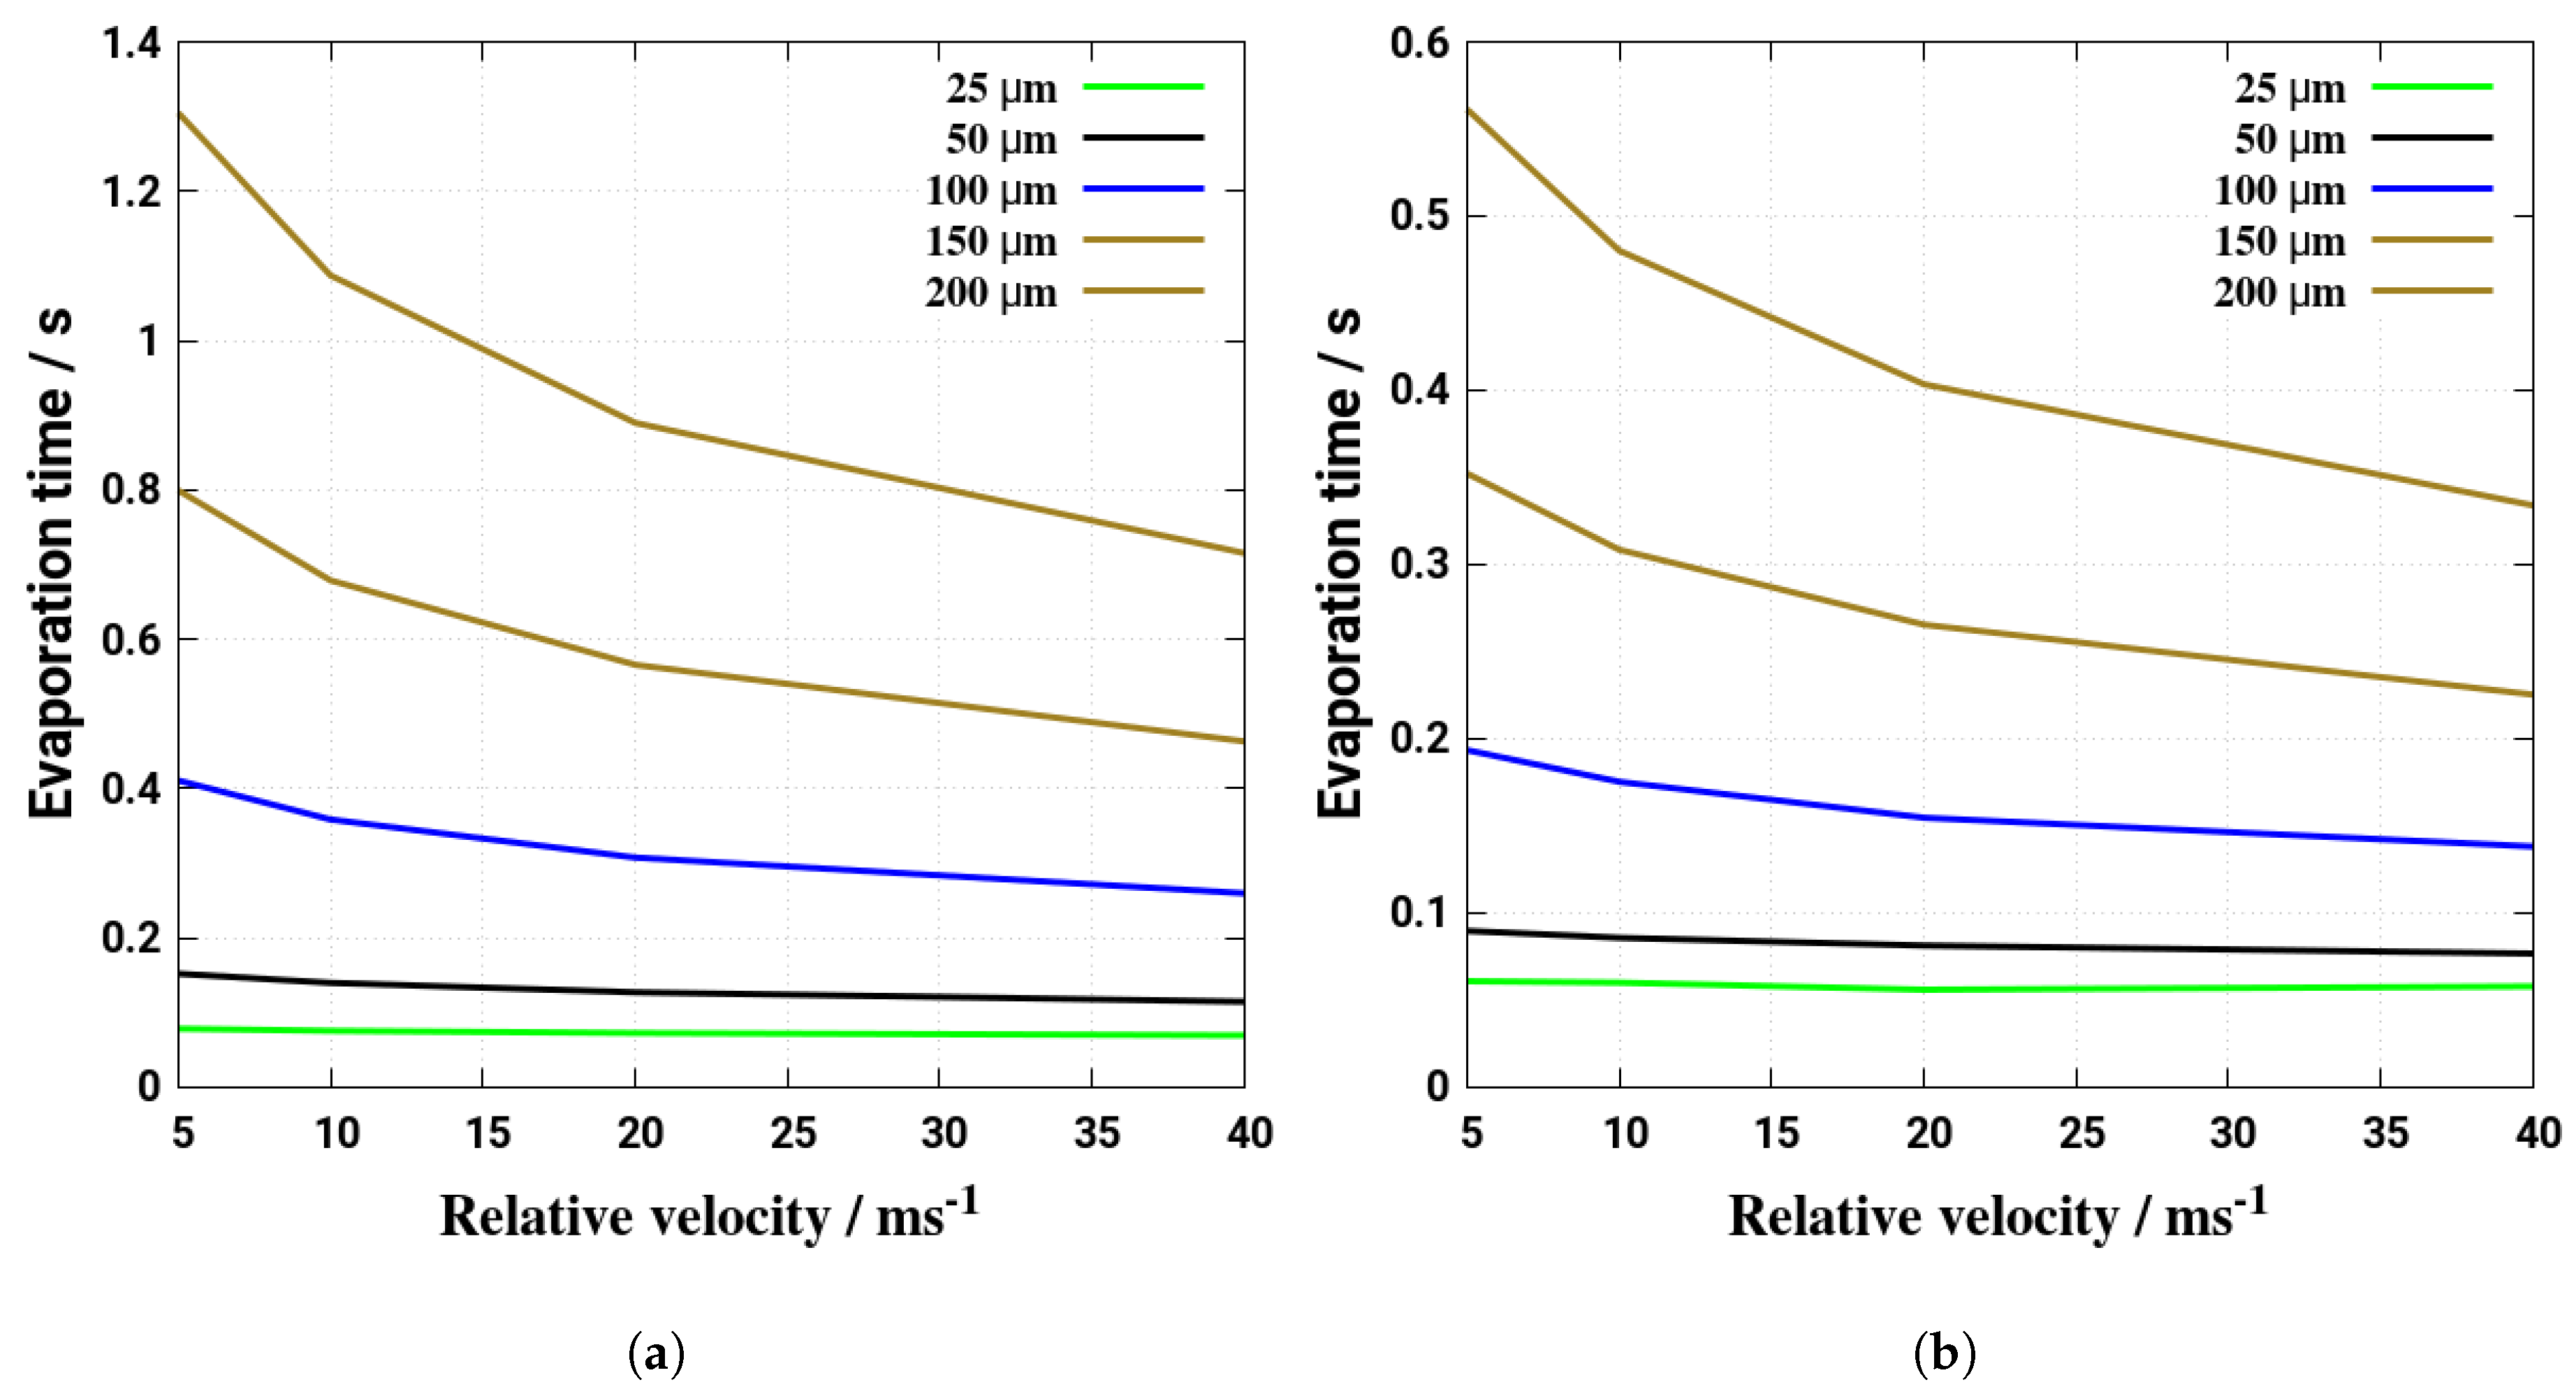
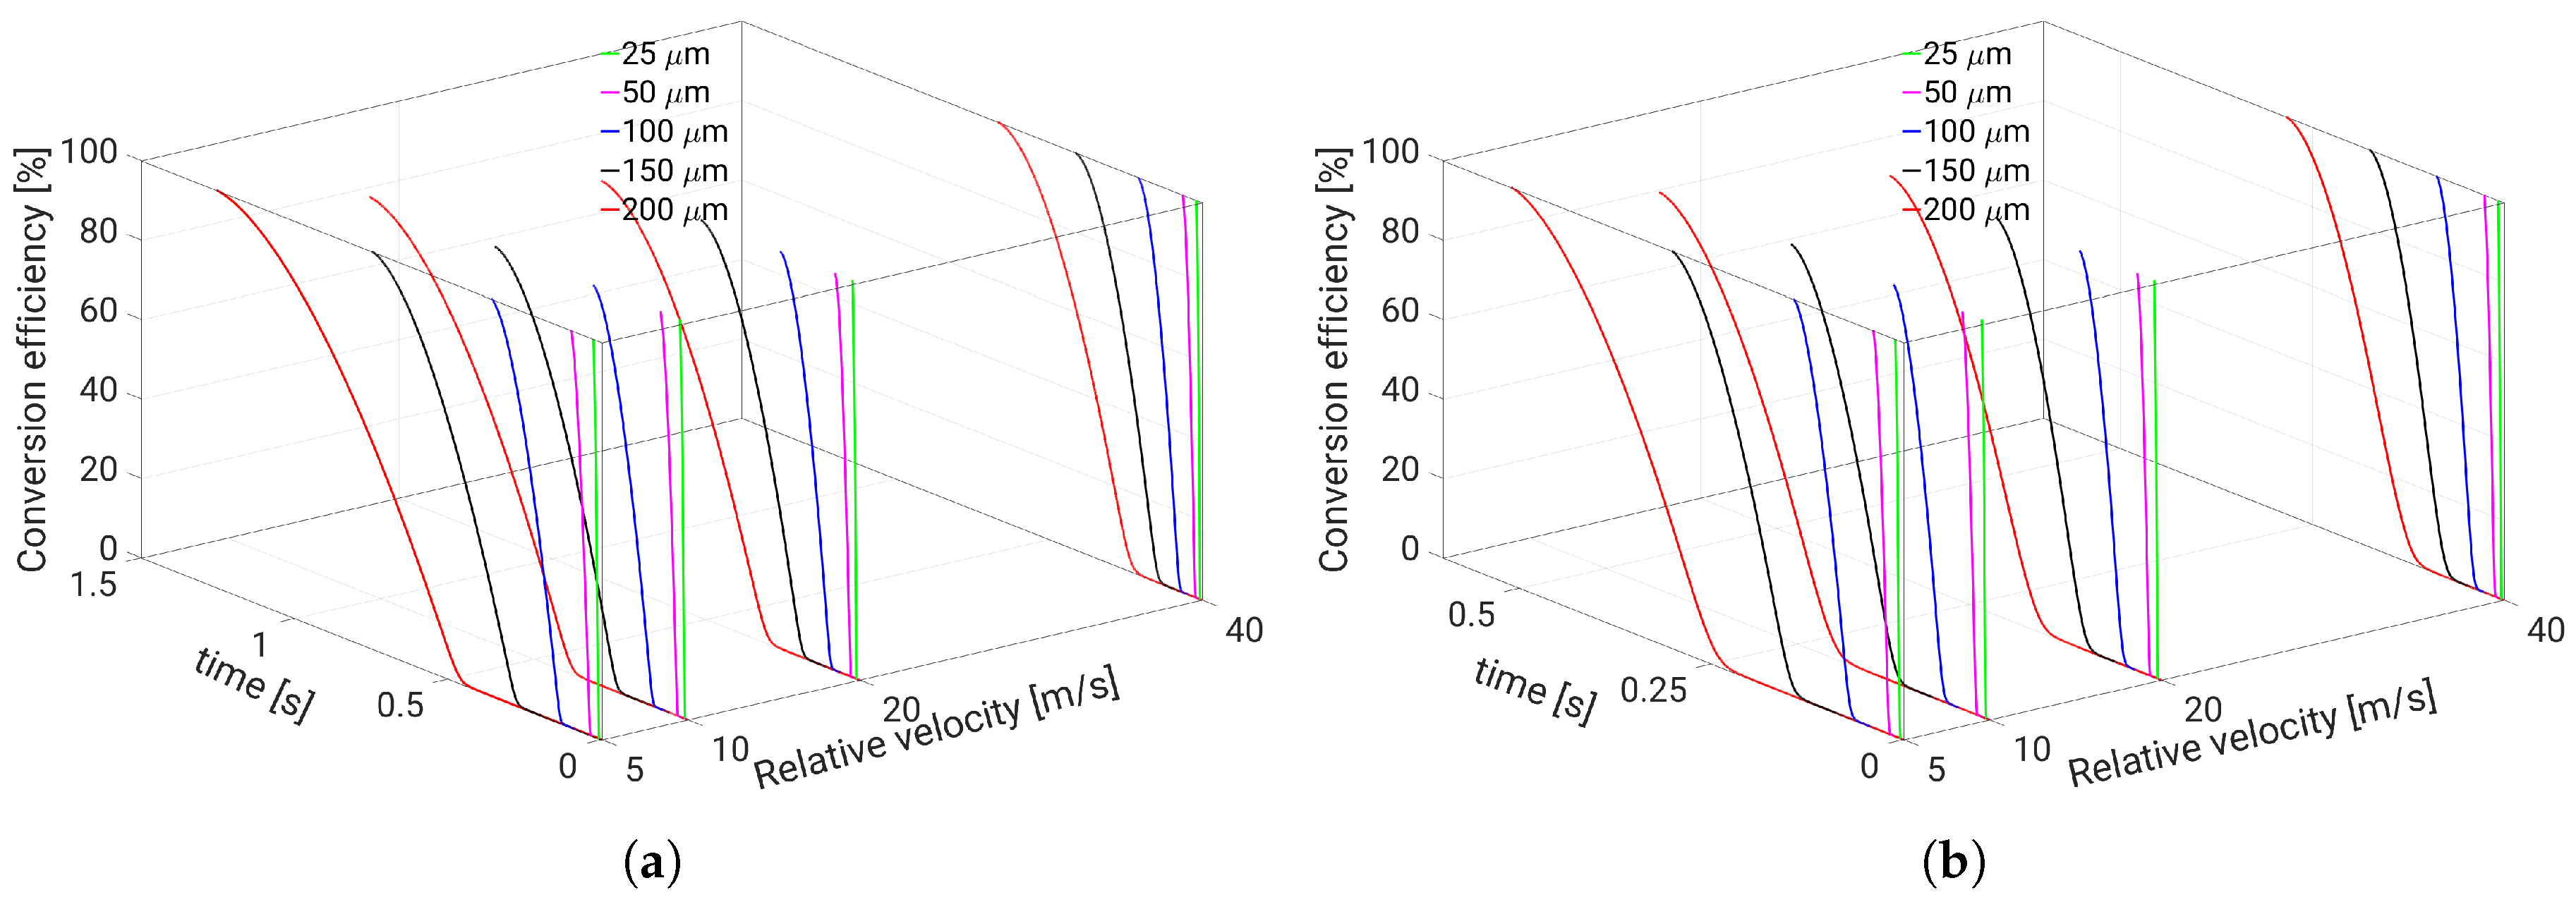
In order to carry out early design analysis, the droplet residence and life time together with the possibilities of droplet-wall impingement are of great relevance. At first, Figure 4a shows the comparison of droplet life time for a droplet with d p = 50 μ m under stagnant and convective carrier gas conditions at various temperatures. It can be clearly seen that the convective gas at higher temperature enhances the mass transfer rate to many folds. This strongly influences the conversion rate as seen in Figure 4b. The effect of gas velocity will be further analyzed next. In fact, the usual operating conditions in automotive applications for the SCR exhaust after-treatment lie in the range of 5–100 m/s for the exhaust gas velocity, 400–1000 K for the exhaust gas temperature and 350–900 K for the wall temperature. The UWS is usually injected with the injection velocity ranging within 5–25 m/s and the injection temperature of about 300–350 K to atomize sprays characterized by Sauter Mean Diameters between 20–150 μ m, (see in [5]. To gain further information, the phase change dynamics of AdBlue® droplets of various diameter (25, 50, 100, 150, and 200 μ m) typical for SCR systems are simulated. All the numerical simulations carried out are summarized in Table 3. The respective results are shown in Figure 5 in which the noticeable influence of droplet relative velocity can be seen for each combination of droplet diameter and carrier gas temperature. The mass transfer is greatly enhanced when the gas temperature is increased from 473 K to 573 K, while it is more gradual between temperatures of 573 K to 673 K and 673 K to 773 K. With increasing gas temperature, the influence of droplet relative velocity becomes very minimal. This observation also holds for the other droplet diameters. However, as expected, the larger droplets last for considerably longer times than smaller droplet.
This behavior is clearly displayed in Figure 6 for two temperatures, namely, 573 K and 773 K. For the lowest small relative velocity (5 m/s) droplet life time for biggest droplet is almost 20 times longer than for the small droplets (see Figure 6a) and around ten times longer for higher relative velocity (40 m/s). These differences are smaller for higher gas phase temperature as seen in Figure 6b.
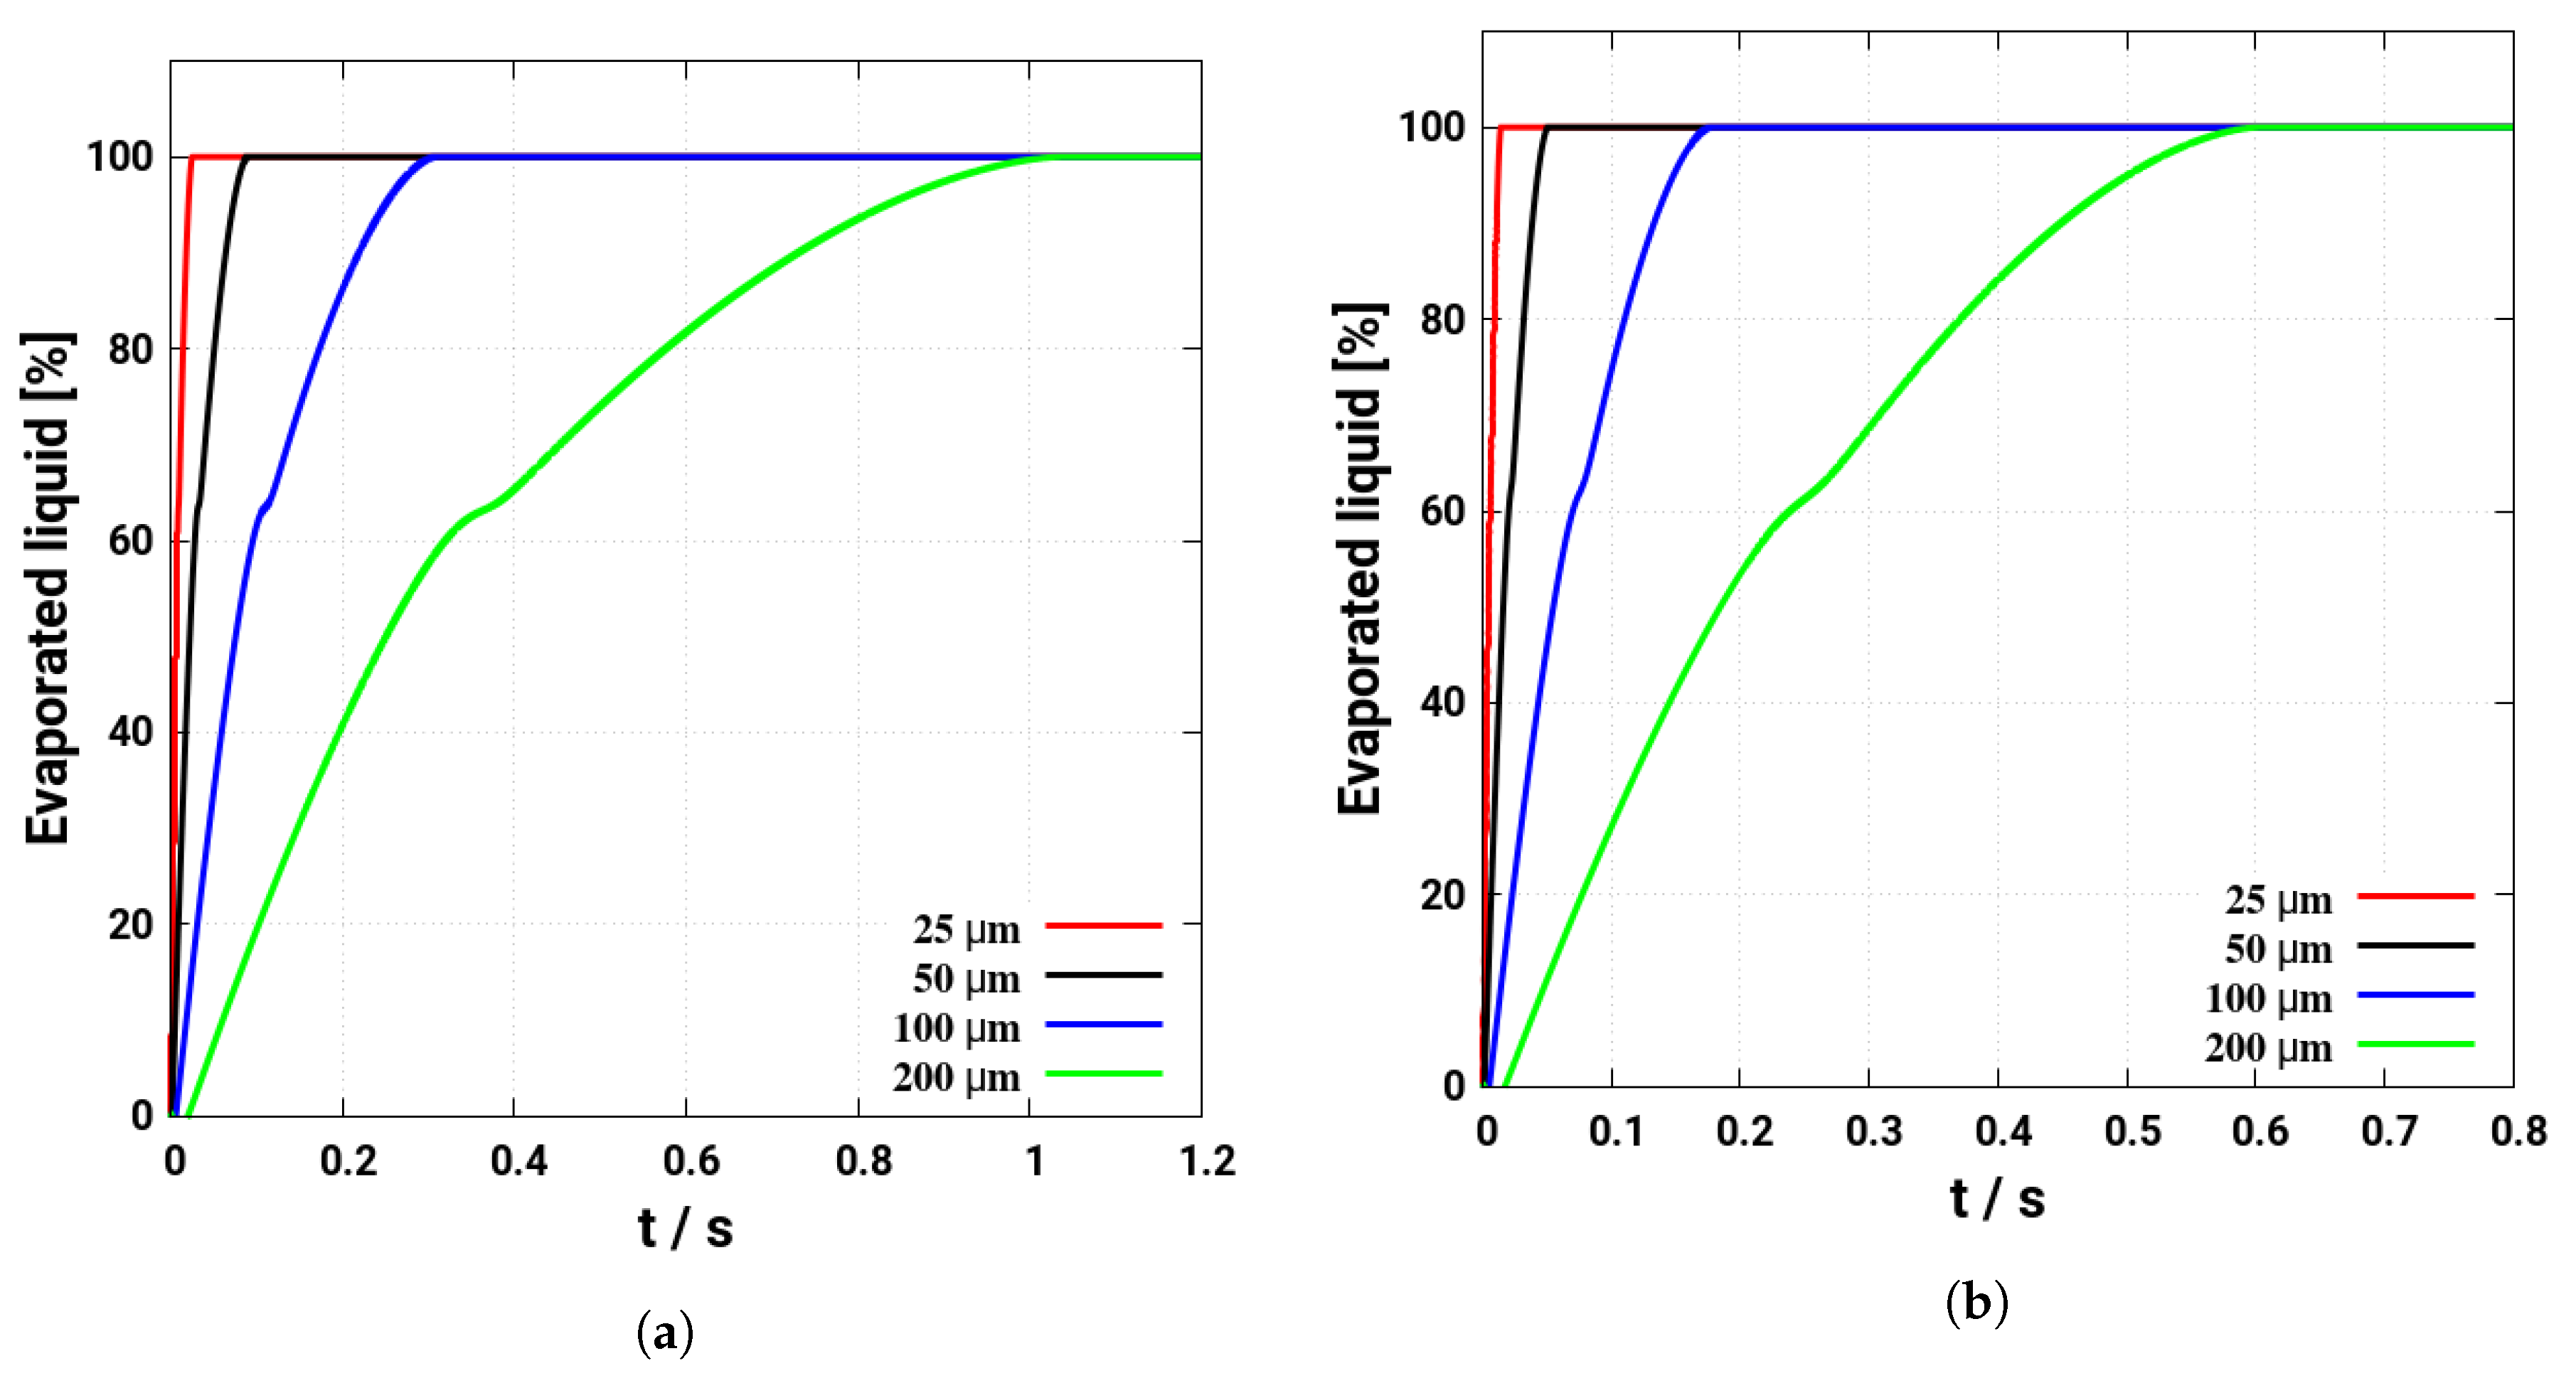
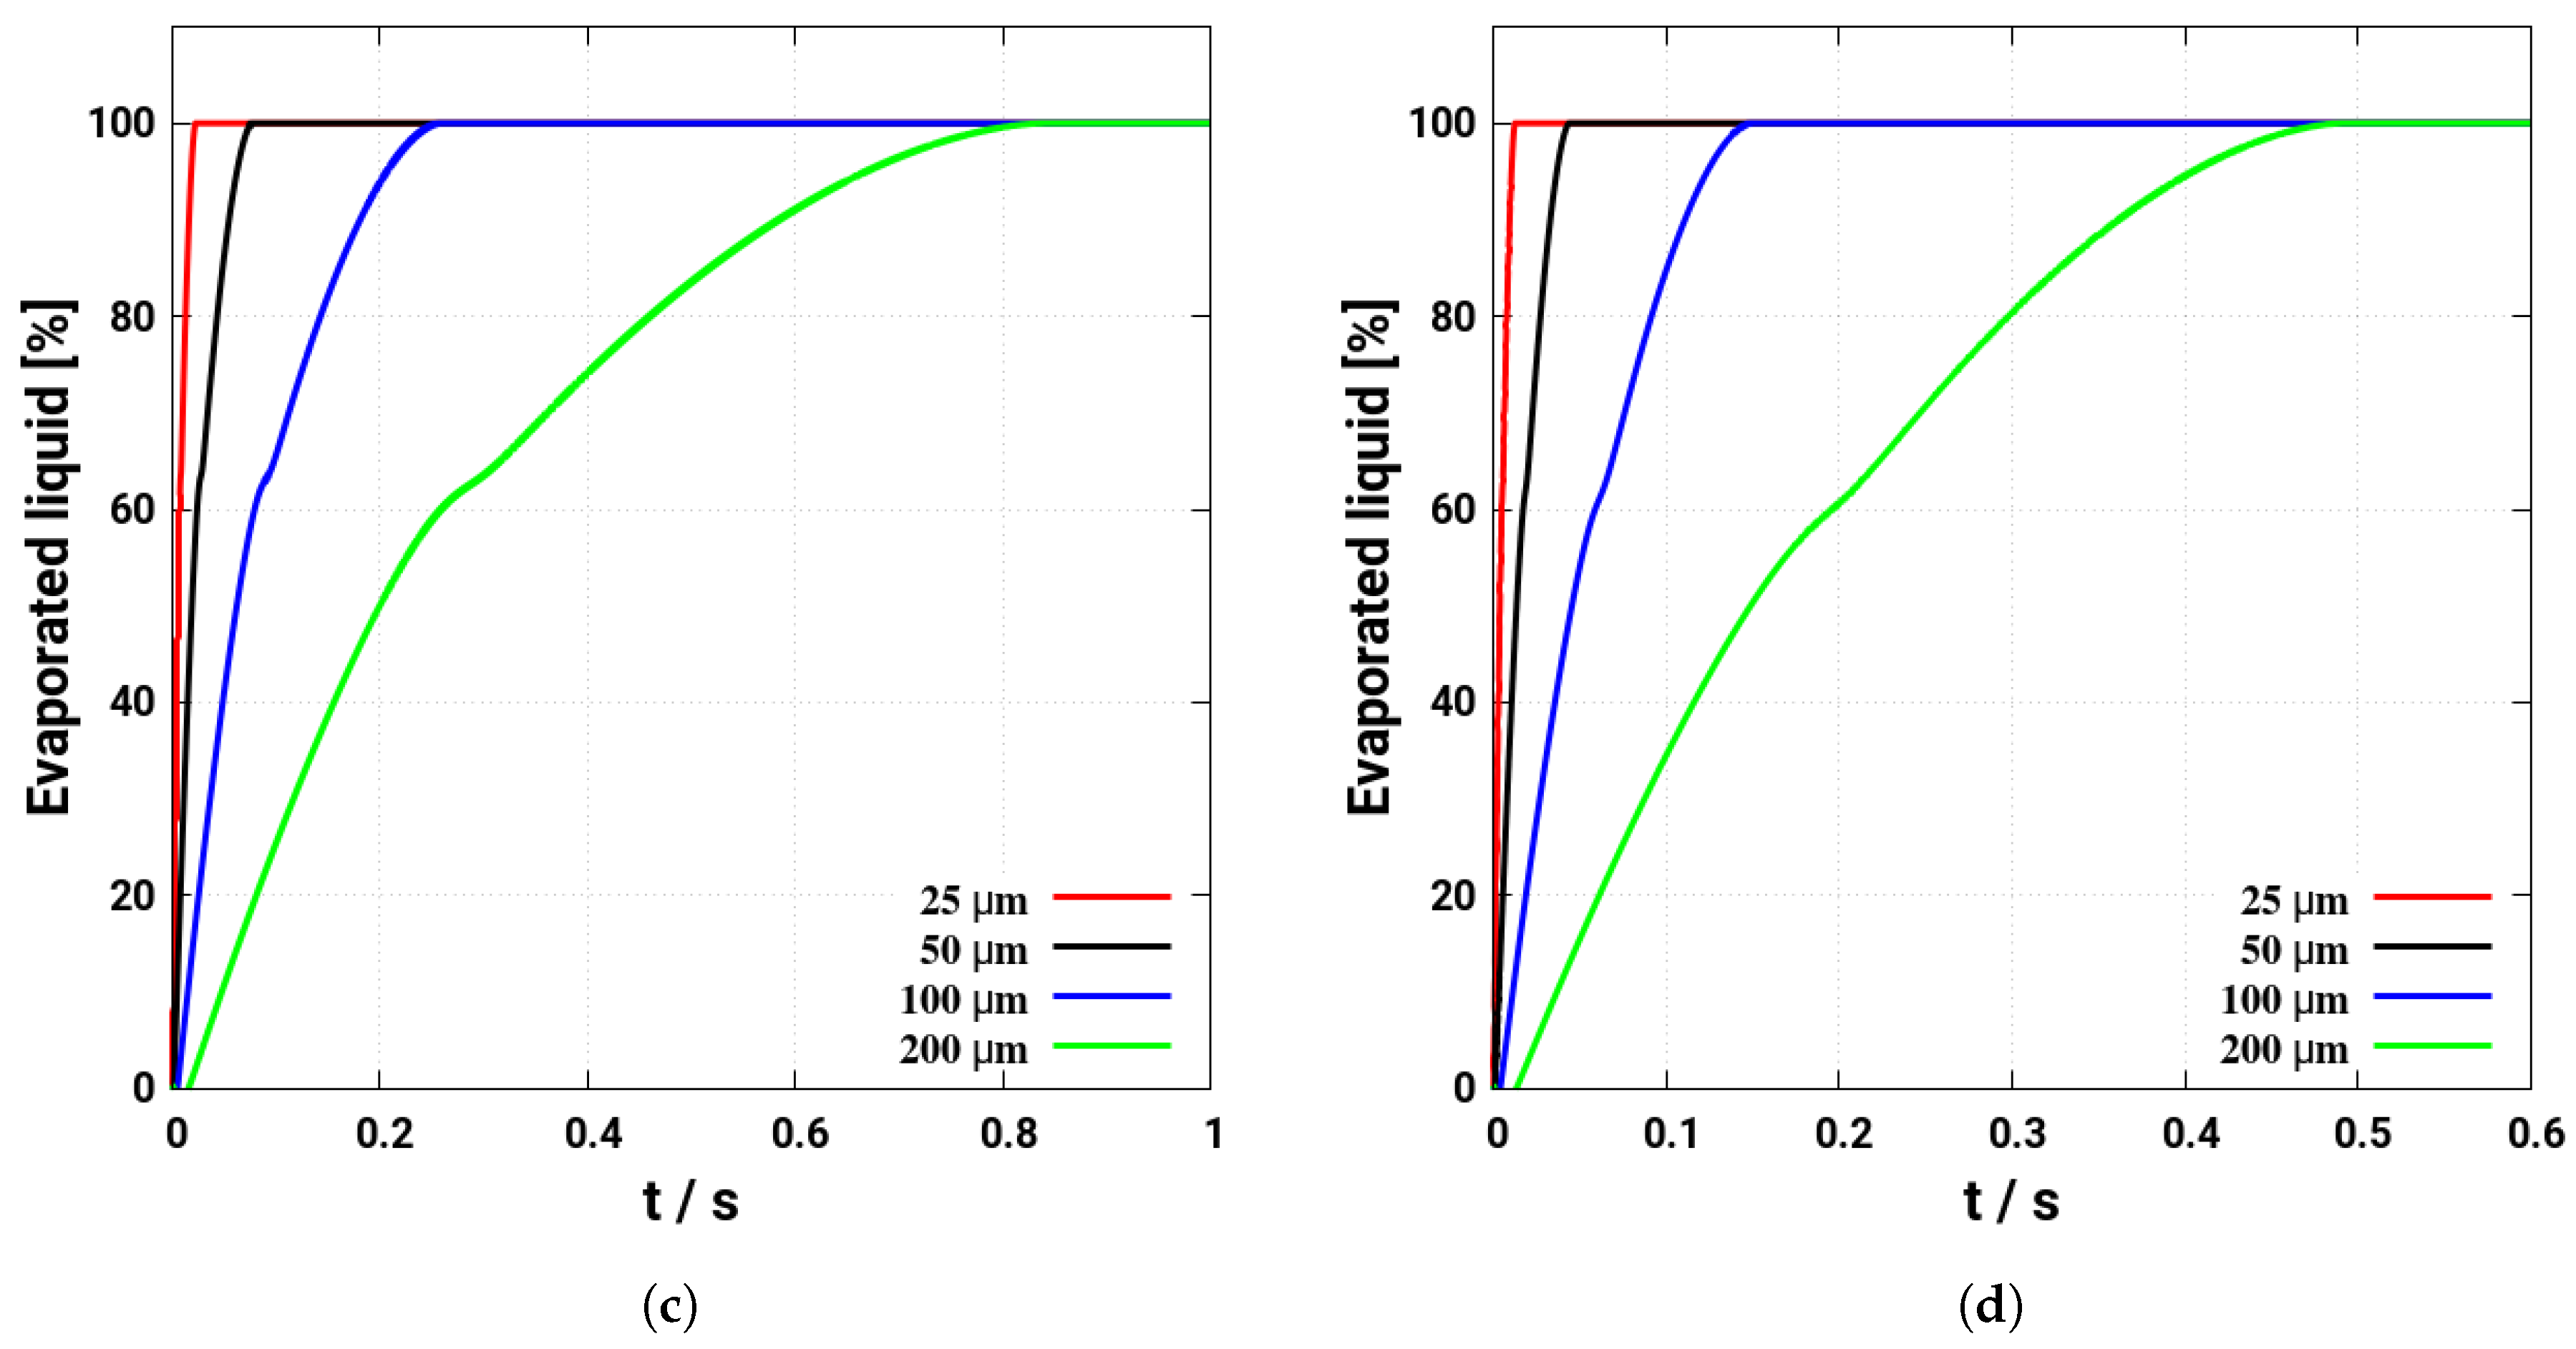
Focusing on the droplet life time inside the SCR system, it appears that this parameter is a vital indicator of SCR system performance, once the AdBlue® evaporation and subsequent mixing and NH3 conversion efficiency are of interest. For a given SCR duct size (diameter and length), the droplet life time can then be utilized to draw inferences about liquid wall–film and subsequent deposit formation on the mixing duct wall and on the entrance cross-section of the monolith allowing at the same time to select the optimum injection characteristics. Since droplet may travel within the mixing pipe while thermally decomposing, the time and length scale of processes of interest are of utmost importance. In this respect, Figure 7 depicts the percentage of evaporated mass for various droplets at two gas temperatures, 573 K and 673 K, as a function of the droplet life time. Since the associated time scale is considerably larger for the bigger droplet at both temperature levels, it can be deduced that big droplets may have enough time to impact the pipe wall or the entrance front of the monolith.
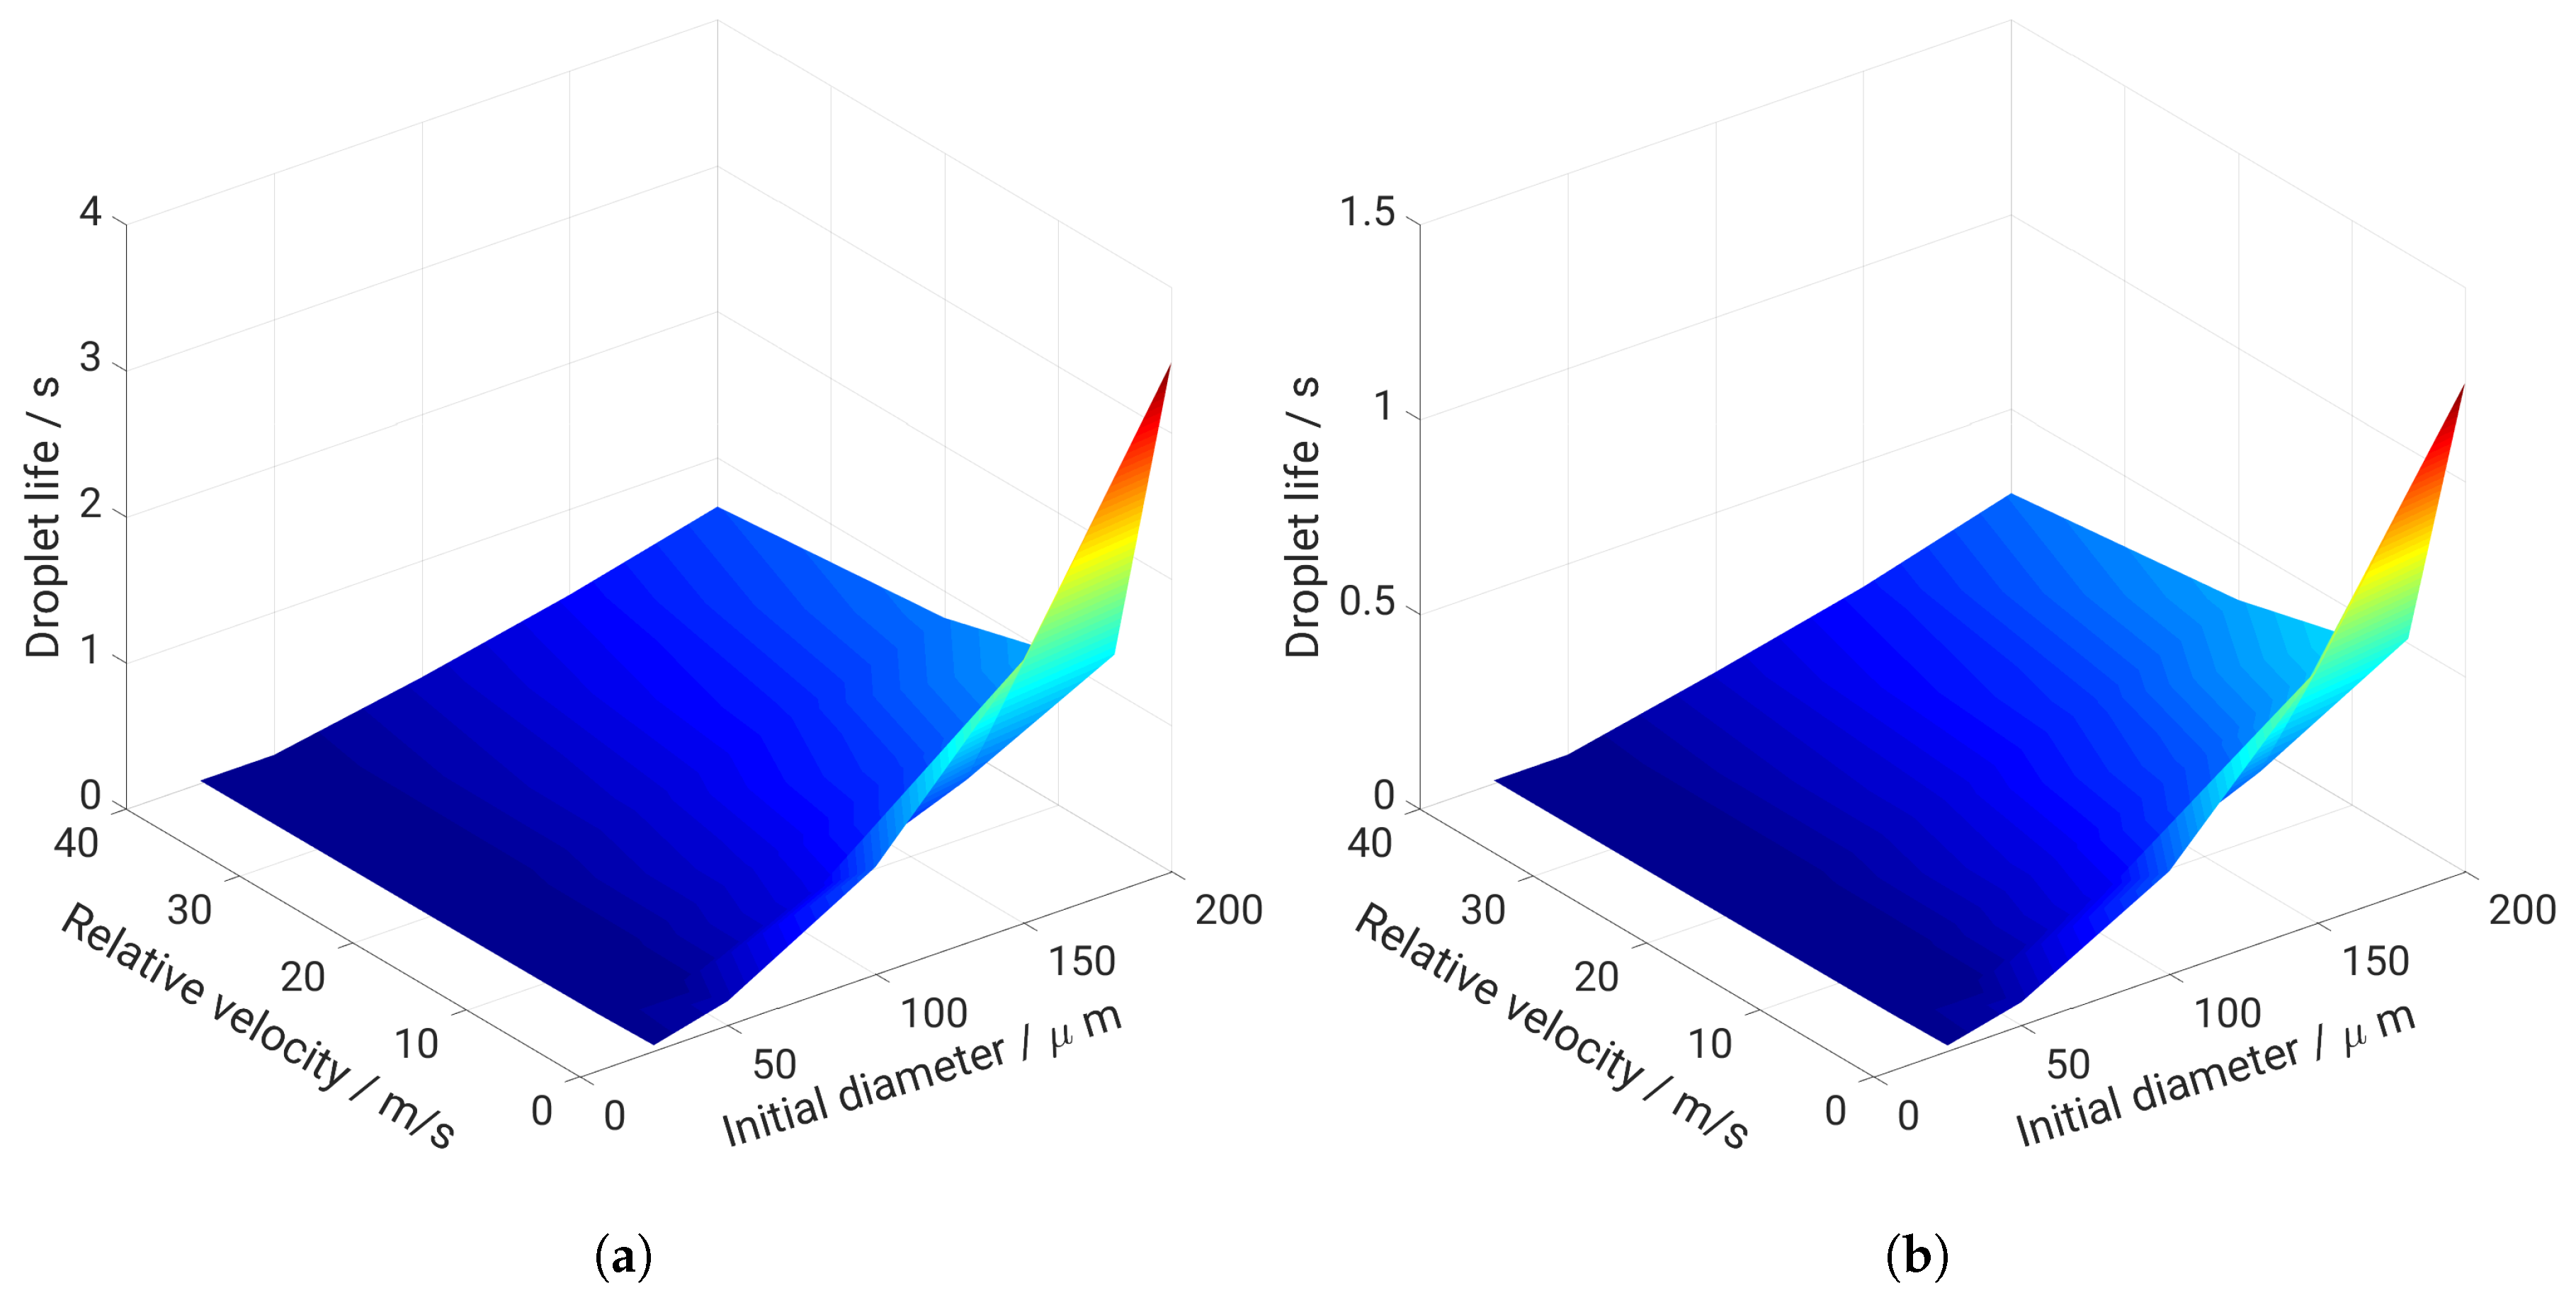
Considering all the results accounting for various relative velocities, Figure 8 provides a clear view of how the two parameters, relative velocity and initial diameter, impact the prediction of the droplet life time, exemplary at two different gas phase temperatures, T g = 573 K and T g = 773 K. It can be partially concluded that for a given droplet diameter, both high relative velocity and high gas temperature enhance the droplet evaporation rate while reducing the droplet life time.
How the resulting urea is decomposed to provide the NH3 gas needed to reduce NOX emission in the SCR system is depicted in Figure 9. Thereby, the urea conversion efficiency which is defined as the ratio of decomposed mass of pure urea to the initial mass of urea is displayed as a function of droplet life time and imposed relative velocity for various droplet diameters at two different temperatures. It is apparent that for a given droplet diameter, higher relative velocity results in faster conversion. Further, higher relative velocity and temperature lead to higher conversion efficiency. With respect to the droplet size, it can be observed that larger droplets need more time to first evaporate water and then slowly decompose. The decomposition is faster with higher relative velocity for small droplets. By reducing the droplet diameter exemplary from 200 μ m to 100 μ m (case, T g = 573 K, relative velocity urel = 20 m/s), it can be quantitatively seen that the time needed only for water evaporation process in the case of d = 200 μ m ( t e v a p = 0.35245 s) is larger than the total time for the overall decomposition (evaporation and thermal conversion) of the droplet with d = 100 μ m ( t e v a p + t d e c o m p o s i t i o n = 0.2575 s). This implies that small droplets and higher relative velocity are to be favored for optimal conversion of NH3 in addition to higher temperature.

6. Effect of Turbulent Cross-Flowing on Droplet Dynamics Characteristics

In real SCR systems, complex unsteady turbulent multi-phase flow phenomena including polydispersed AdBlue® spray evolve with a wide range of relative velocity between droplet phase and carrier gas phase. This results from AdBlue® droplets which are sprayed into a mixing pipe which is flowing by a hot exhaust gas. To reduce the complexity while gaining early information on the injected droplet size needed for a minimum deposition and optimal conversion, only a single AdBlue® is considered. It is injected into a hot turbulent cross-flowing stream within a mixing pipe under consideration of the operating parameters listed in Table 4. The droplet may experience phase change processes including interaction with the pipe and monolith front wall; see Figure 1, case S4).
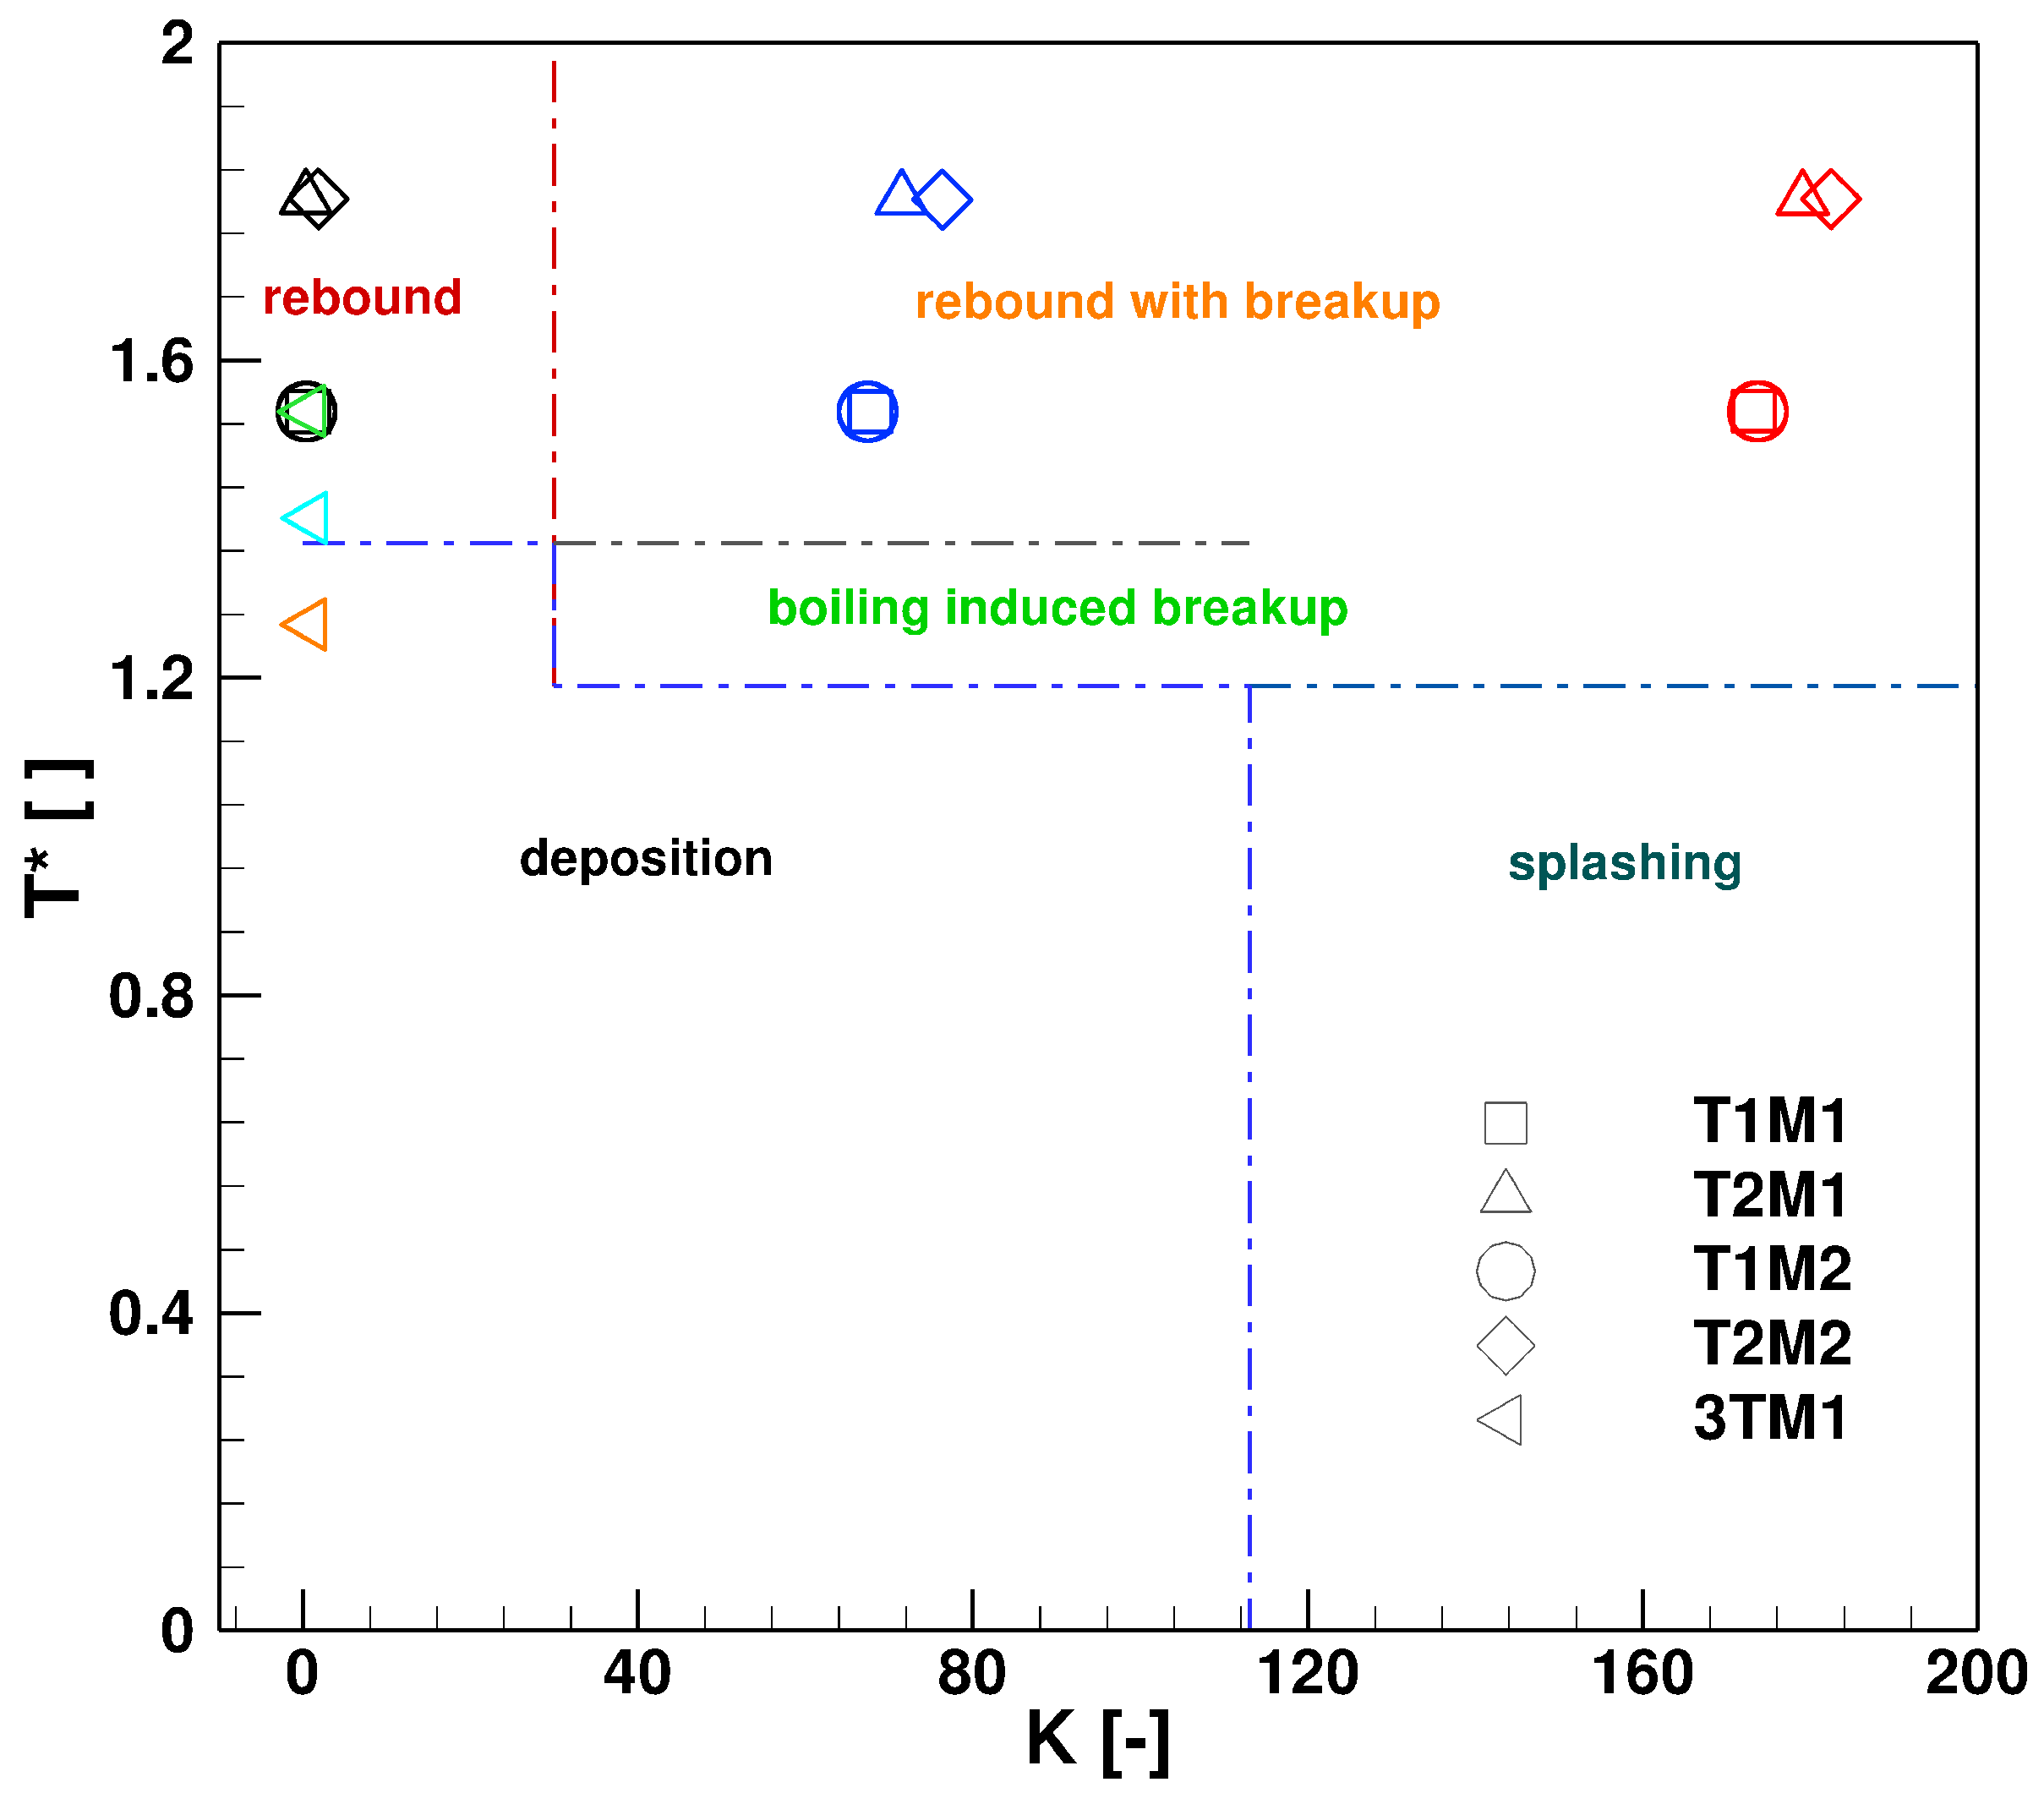
The injection location and the dimension of SCR duct are shown in Figure 1d. The droplet is injected with an injection velocity of 28.7 m/s at from an injector inclined at an angle of 50 with respect to the horizontal plane (see Figure 1, (S4)). Especially, the droplet residence time along with the droplet path length are investigated for various droplet diameters under (1) variation of the gas flow rate (T1M1 and T1M2, T2M1 and T2M2), and (2) variation of the gas temperature (T1M1 and T2M1, T1M2 and T2M2), respectively. In addition the case 3TM1 is designed to especially meet the condition for liquid wall–film formation during the droplet impingement. Figure 10 shows a regime map based on the impact parameters “K” and “T*” (see Equation (10)) for droplet-wall impingement of AdBlue® as reported in [37]. It provides a clear demarcation among various impingement outcomes. The wall deposition is expected with droplet having very little momentum and lower wall temperature, while droplet can rebound when temperature is sufficiently high. By further increasing the droplet momentum, the droplet can splash and break into smaller droplets as suggested in [38], which obviously can enhance the evaporation of AdBlue® droplet and conversion rate (see Figure 11).
Focusing on the residence time of the droplet, let us monitor the trajectory of the droplet resulting from two essential motions experienced by the droplet: the transverse motion pushing the droplet away from the injection point and a stream-wise motion carrying the droplet downstream with the cross-flow.
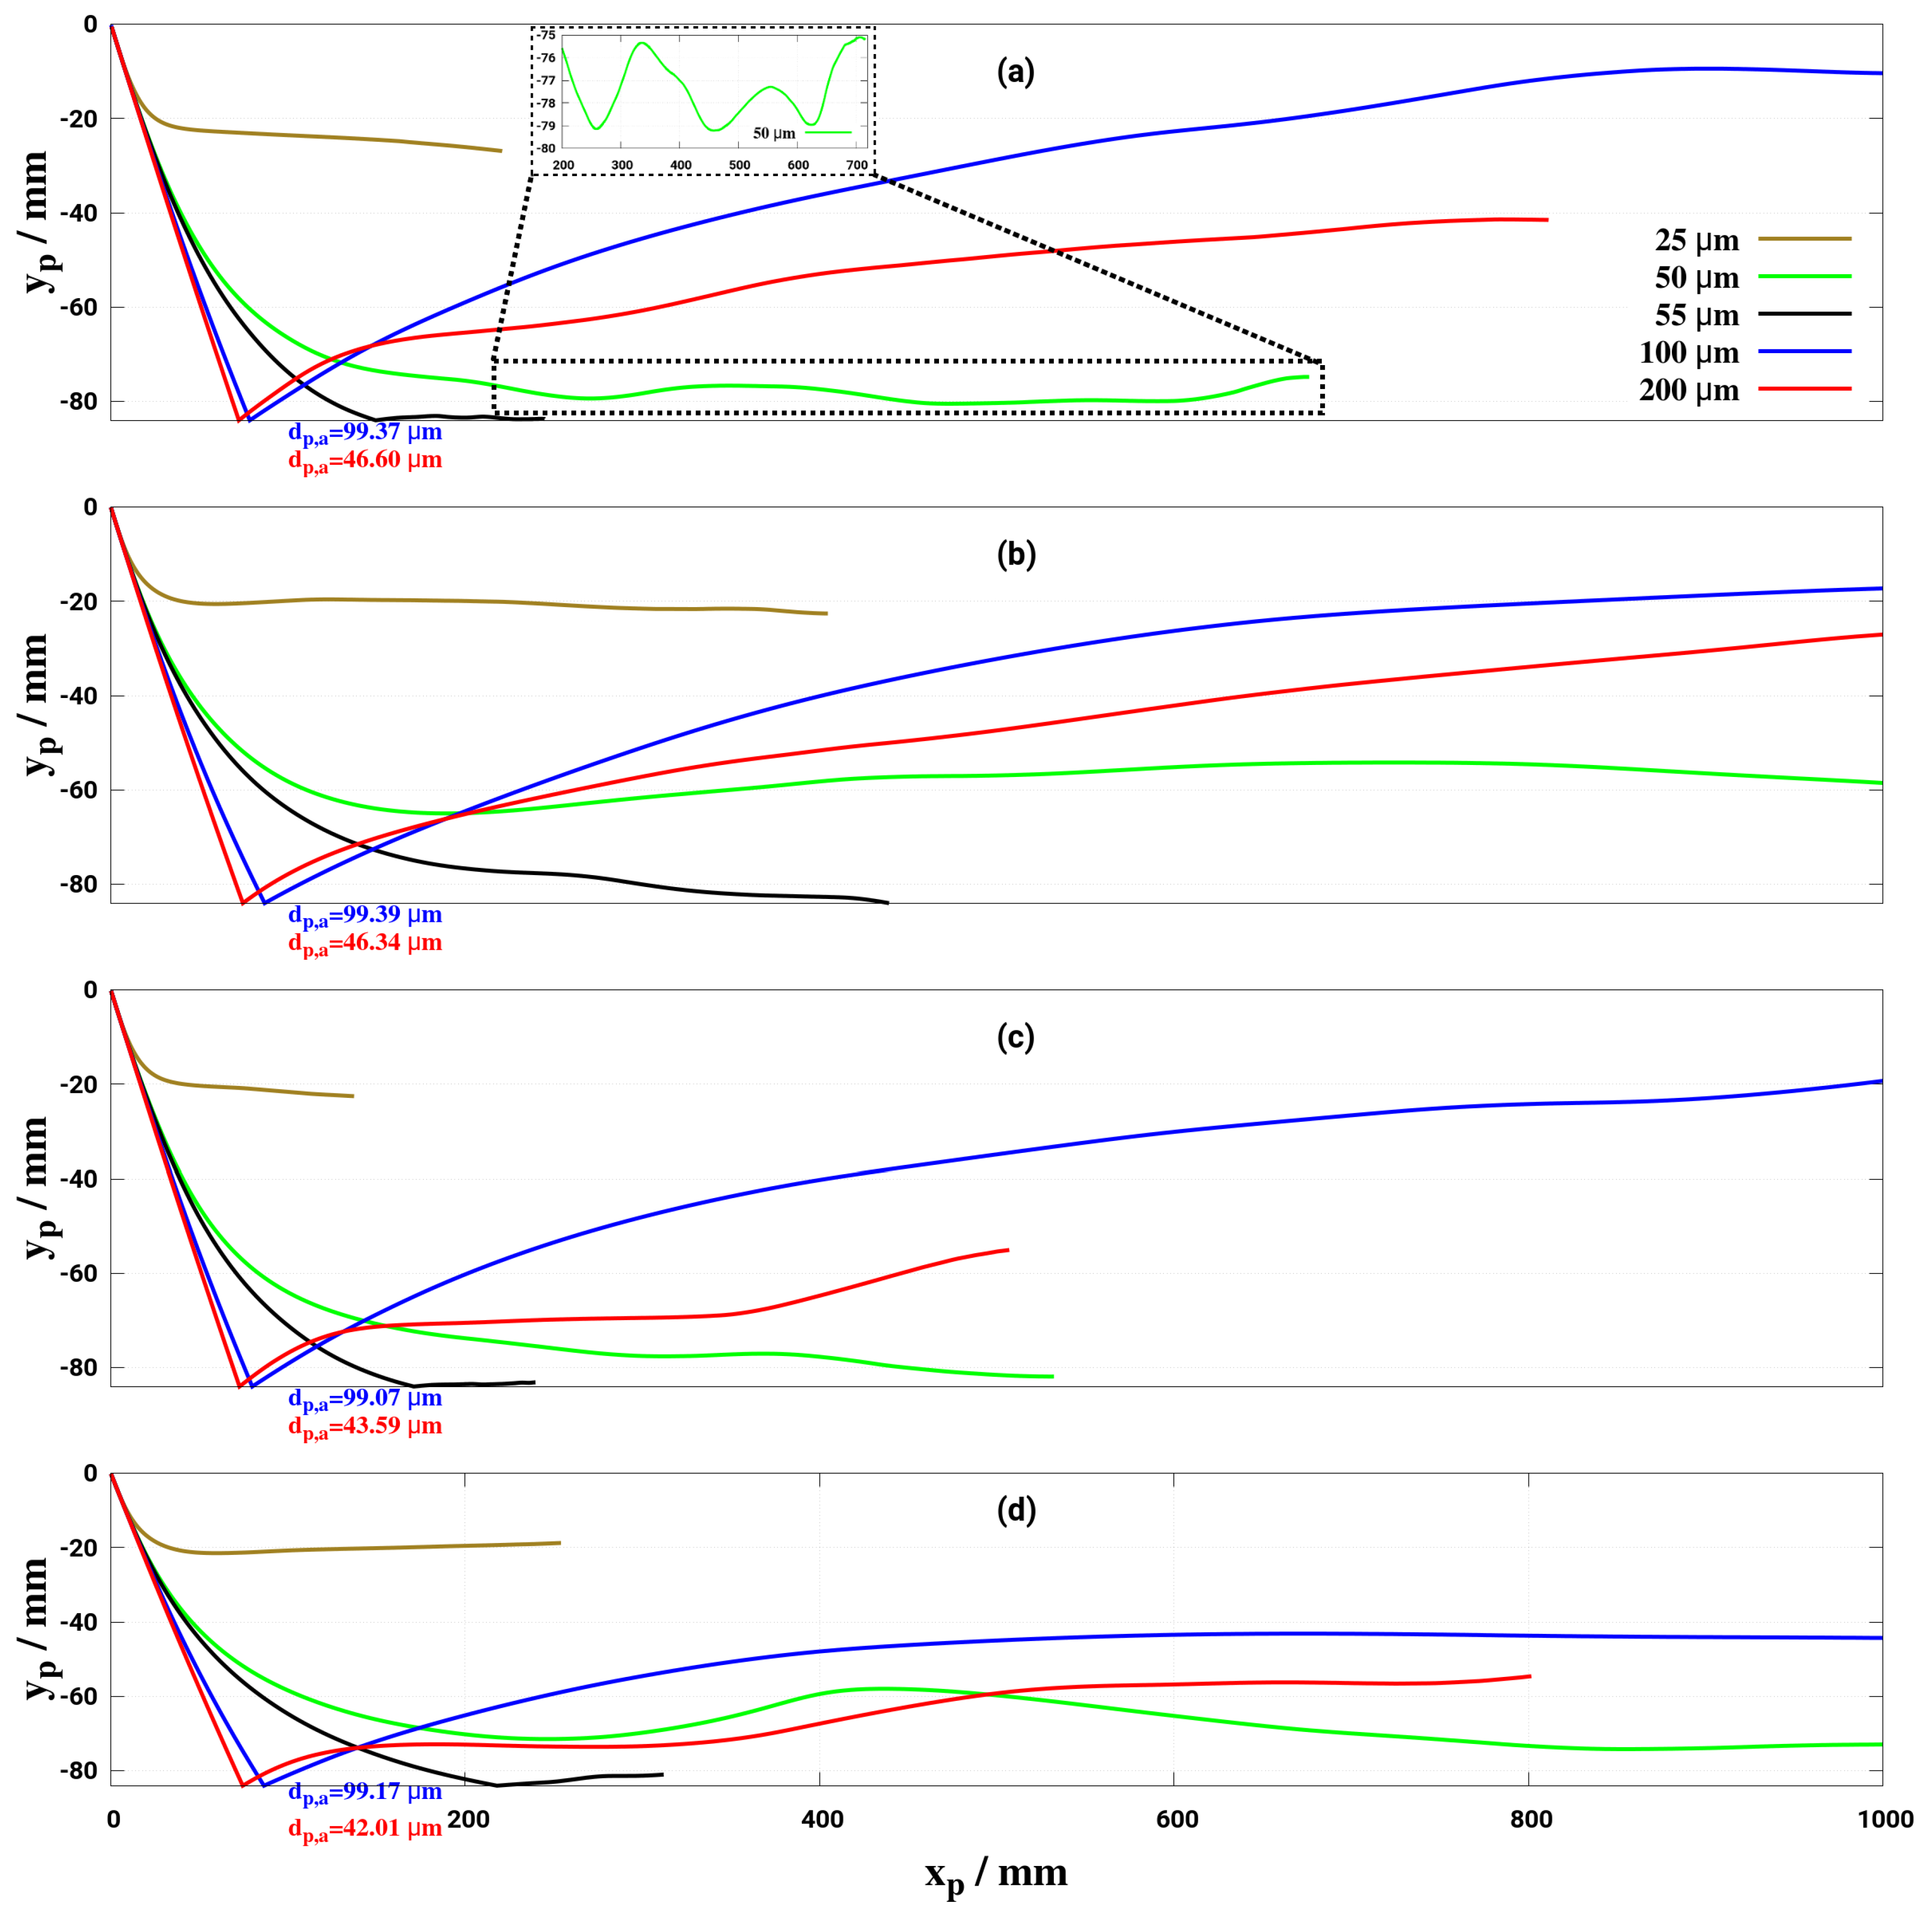
The obtained droplet trajectories for all cases under consideration are plotted in Figure 11. To recall that both higher droplet relative velocity and higher gas temperature enhance considerably the droplet evaporation rate and, in turn, reduce the droplet life time (see previous section), indicating favorable SCR operating conditions. Apart from that, how further a droplet evolves and how long it takes to travel the SCR mixing duct may also give useful hint for possible wall impingement and subsequent liquid wall–film and deposit formation.
Figure 11a depicts the droplet trajectory for the case “T1M1” ( T g = 573 K, m ˙ g = 100 kg/h). It can be clearly seen that the droplet (except d0 = 100 μ m) completely evaporates before reaching the end of the mixing section where the entrance cross-section of the monolith may be situated. In such a case, tendency to deposition formation on the SCR mixing duct wall or/and on the monolith entrance cross-section is avoided. Droplet/wall interaction is obvious for droplet diameters of 100 μ m and 200 μ m, only, for which splashing is observed. After splashing the droplet breaks into smaller droplets giving rise to an increase of evaporation. The degree of splashing is strong for droplet diameter of 200 μ m while the longer droplet life time and longer droplet path length can be realized for diameter of 100 μ m.
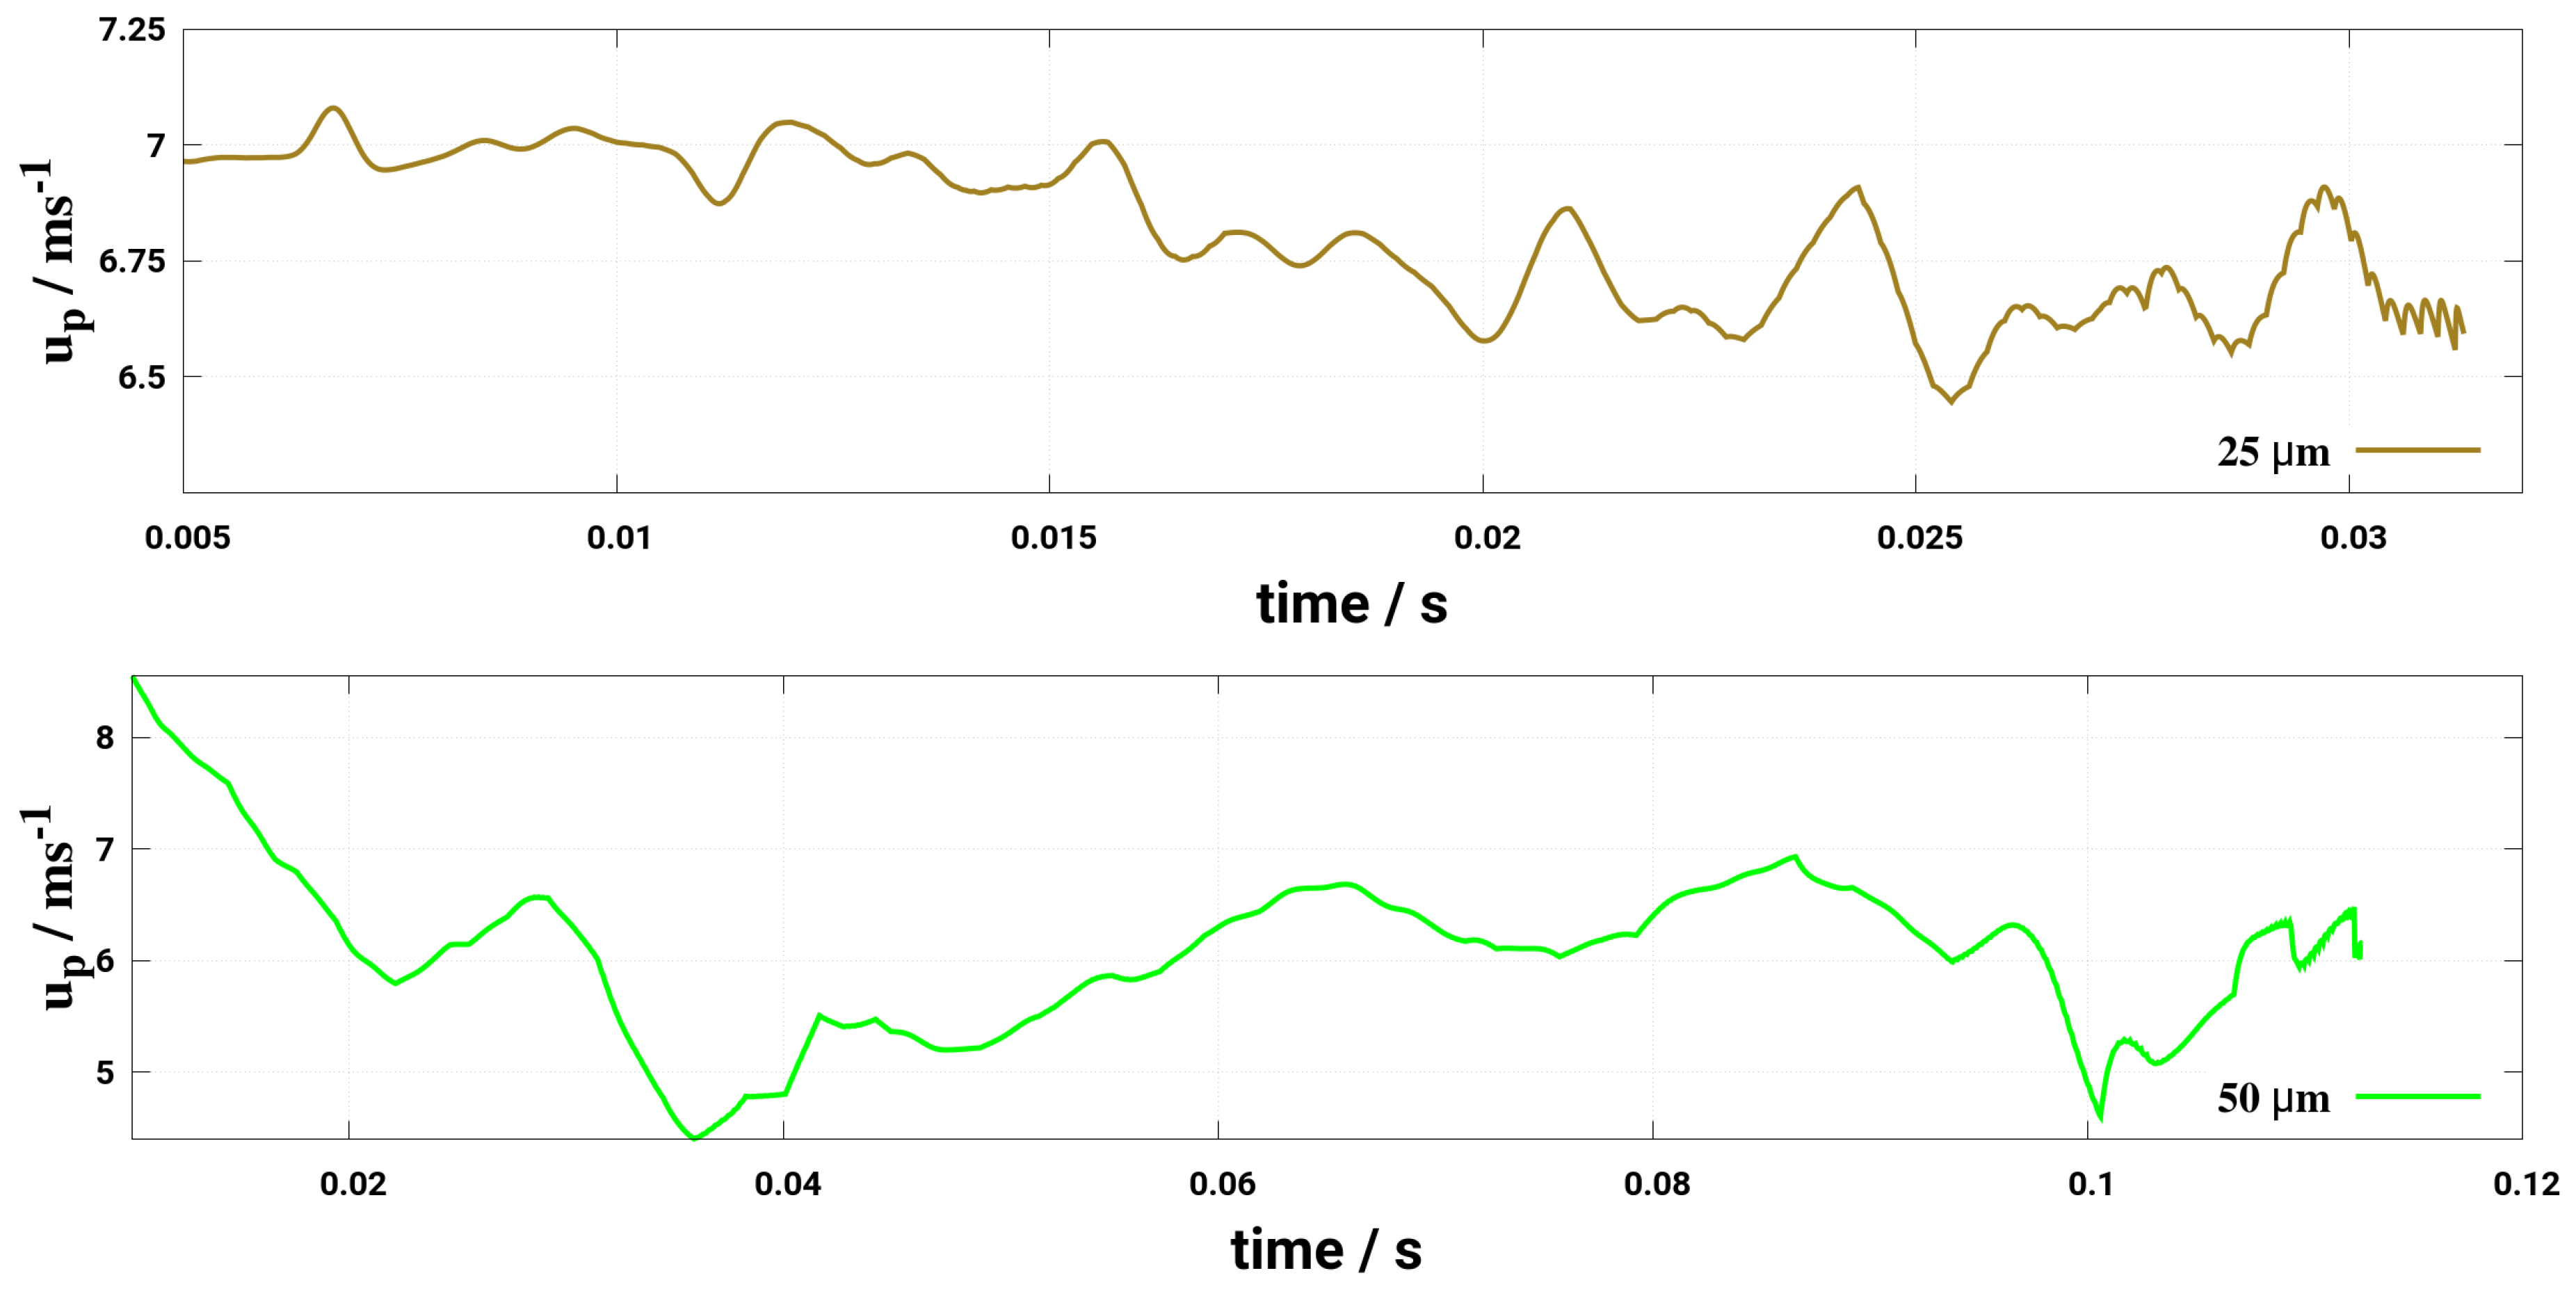
Comparisons with case “T1M2” ( T g = 573 K, m ˙ g = 200 kg/h) (see Figure 11a,b) allow to assess the influence of cross-flow on droplet dynamics. Compared to case “T1M1” all the droplets achieved longer droplet path length. Moreover, all the droplets, except d = 25 μ m, can potentially cross the mixing duct and impinge the entrance cross-section of the monolith. Such a droplet can enter and further decompose in the fine channel of monolith or may lead to deposits formation across the SCR-monolith cross-section. To examine the influence of gas temperature, further comparison can be made especially between cases “T1M1” and “T2M1” (see Figure 11a,c). Compared to case “T1M1” all the droplets have shorter trajectory, except for d = 100 μ m. This can be attributed to complex wall-impingement dynamics predominantly bouncing in nature for droplet with diameter of 100 μ m. Note that longer droplet path length is observed for all droplets in “T2M2” of strong gas flow rate in contrast to “T2M1” under the same gas temperature of T g = 673 K. Once different temperatures are considered, droplet trajectories in case of high temperature “T2M2” are shorter than in the case with low temperature “T1M2” under the same gas flow rate of m ˙ g = 200 kg/h. The initial post-impingement droplet diameters are also provided at the respective impingement location for droplets which undergo splashing/rebound (see Figure 11). It can be noted that the droplet with d0 = 100 μ m undergoes bouncing without any noticeable breakup in all cases. However, droplet with d0 = 200 μ m solely experience intense splashing which give rise to smaller droplets after impingement. This in turn contributes to faster evaporation and reduced droplet life inside the SCR duct as shown in Figure 11. Further, in order to evidence the influence of gas phase turbulence on the droplet dispersion, the instantaneous velocity of the droplet is plotted in Figure 12 for the case of d0 = 25/50 μ m, m ˙ g = 100 kg/h, and T g = 573 K during its full lifetime.
The turbulence impact on the droplet velocity is even higher at the last stage as the droplet diameter becomes smaller and smaller during its evaporation process. It can be further observed that for d0 = 25 μ m droplet, the dispersion is more significant as the droplet size is smaller, thus the droplet strongly follows the turbulent flow. In fact, by considering the two-way coupling between the gas phase and droplet, it turns out that the turbulent dispersion is adequately captured for the case of Stoke’s number larger than one as it appears in this study without accounting for subgrid scale dispersion model [54]. According to [55], it is worth noting that for RANS (URANS) additional dispersion model must be included which may require more numerical care with respect to the phase coupling procedure.
Additional simulations are performed with d = 55 μ m to assess the wall–film formation dynamics for respective cross-flow conditions. Due to very weak impact, the droplet forms a wall–film (see Figure 11a) and further convected along the duct wall until completely decomposed. Similar behavior is also observed for other two cases (T2M1, T1M2, see Figure 11b,c), while at higher wall temperature in the case T2M2, the droplet is bounced off after impinging, and convected closely parallel to the duct wall due to a weak impact. Considering the case 3TM1, the droplet impinges the wall and sticks on it and forms a liquid wall–film. This is clearly depicted in Figure 13.
These characteristic behaviors can be imprinted within the diagram K-T*. This is done in Figure 10 for all cases under consideration in Table 4. It turns out that the case 3TM1 features the condition for liquid wall–film formation on the duct wall that may lead to deposit formation as observed in [37].

7. Conclusions

A LES-based Eulerian–Lagrangian model tool including a multi-component evaporation model along with a thermal decomposition mechanism has been extended to include wall–film formation model in order to study the effect of turbulent cross-flowing stream conditions on the dynamic droplet characteristics. The impact has been recorded in terms of droplet trajectory and evaporation time, decomposition efficiency and liquid wall–film formation. The objective was to provide early information on the injected droplet size and velocity required for a minimum deposition and optimal conversion in terms of droplet trajectories, droplet evaporation time, decomposition efficiency and wall–film formation dynamics.
For that purpose, four droplet configurations have been designed. First, a standing droplet case without any relative velocity followed by a standing droplet case. Next, a droplet into convective environment with co-flow characterized by various relative velocities between the carrier phase and the droplet phase, and an injected droplet into a hot cross-flowing stream within a mixing pipe in which the droplet may experience phase change processes including interaction with the pipe wall along with liquid wall–film and possible solid deposit formation processes.
After a successful validation of the numerical tool by means of numerical experimental data from a detailed numerical model of a standing droplet case, the results from the investigations allow to draw following conclusions.
  • As the evaporation characteristics obviously depend on the AdBlue® droplet diameter, gas phase temperature and droplet relative velocity, it turns out that a smaller droplet diameter, higher temperature and relative velocity lead to shorter droplet life time as the droplet evaporates faster. Under such conditions, possible droplet/wall interaction processes on the pipe wall or/and at the entrance front of the monolith are avoided.
  • Since the gaseous NH3 generated by urea decomposition is intended to reduce NOX emission in the SCR system, it is apparent for the prediction of high NOX removal performance that UWS injector system which allows to realize such operating conditions (droplet with smaller diameter, higher relative velocity and gas temperature) will support high conversion efficiency of urea into NH3.
  • Lower mass flow rate and higher gas temperature reduce considerably the droplet trajectory allowing a droplet to fully decompose before interacting with the entrance section of the monolith. This may help to avoid impinging and deposition on the pipe wall for small droplet (d < 50 μ m) for the investigated conditions.
  • The wall deposition consists essentially of two main processes: first, droplet impingement on the wall for which, based on K and T* values, the droplet can undergo various physical processes such as deposition, splashing rebound, breakup. Second, only deposited droplet may form solid deposition based on chemical kinetics and phase thermodynamics. In the present study only phase thermodynamics are considered to define the solid deposition, while chemical kinetics for solid deposit formation is scope of our ongoing research activities. On this basis, it has been clearly shown that the droplet wall impingement can be favorable scenario as it can be responsible for breakup into smaller droplets and subsequently cause faster evaporation and conversion.
  • Considering the two-way coupling between the gas phase and droplet, it turns out that the turbulent dispersion is adequately captured by LES for a case of a Stoke’s number that is larger than one as it appears in this study without accounting for a subgrid scale dispersion model. Note that for RANS (URANS) additional dispersion model must be included which may require more numerical care with respect to the phase coupling procedure.

Author Contributions

For this research, K.N., F.R. and A.S. conceived and designed the numerical setup. Detailed numerical simulation was perfomed by M.S. Reaction kinetics were reduced by M.S. and V.B. from the detail kinetics provided by O.D. K.N. carried out the numerical simulations using the LES-based Eulerian–Lagrangian tool and exploited the data. Together with A.S., analyzed, discussed and interpreted the overall numerical results. A.S., U.M., V.B. and J.J. contributed by providing materials and computing resources.

Funding

Deutsche Forschungsgemeinschaft (DFG): 237267381.

Acknowledgments

The authors gratefully acknowledge the financial support by the DFG (German Research Council)-Projektnummer 237267381—TRR 150, the support of the numerical simulations on the Lichtenberg High Performance Computer (HHLR) at the University of Darmstadt and the financial support by the Open Access Publishing Fund of Technische Universität Darmstadt.

Conflicts of Interest

The authors declare no conflict of interest.

References

  1. Regulation (EC) No 715/2007 of the European Parliament and of the Council of 20 June 2007 on Type Approval of Motor Vehicles with Respect to Emissions from Light Passenger and Commercial Vehicles (Euro 5 and Euro 6) and on Access to Vehicle Repair and Maintenance Information; Technical Report; Official Journal of the European Union: Brussels, Belgium, 2007.
  2. Nova, I.; Tronconi, E. (Eds.) Urea-SCR Technology for deNOx After Treatment of Diesel Exhausts; Springer Press: Singapore, 2014. [Google Scholar]
  3. Tripathi, G.; Dhar, A.; Sadiki, A. Recent Advancements in After-Treatment Technology for Internal Combustion Engines—An Overview. In Advances in Internal Combustion Engine Research. Energy, Environment, and Sustainability; Srivastava, D., Agarwal, A., Datta, A., Maurya, R., Eds.; Springer Press: Singapore, 2018; pp. 159–179. [Google Scholar]
  4. Nishad, K.; Sadiki, A.; janicka, J. Numerical Modeling of adBlue Droplet Evaporation in the Context of SCR-DeNOx. In Proceedings of the 18th Annual Conference of Liquid Atomization and Spray Systems-Asia (ILASS-Asia), Chennai, India, 6–10 November 2016. [Google Scholar]
  5. Birkhold, F.; Meingast, U.; Wassermann, P.; Deutschmann, O. Modeling and simulation of the injection of urea-water-solution for automotive SCR DeNOx-systems. Appl. Catal. B Environ. 2007, 70, 119–127. [Google Scholar] [CrossRef]
  6. Praveena, V.; Martin, M.L.J. A review on various after treatment techniques to reduce NOx emissions in a CI engine. J. Energy Inst. 2017. [Google Scholar] [CrossRef]
  7. Nishad, K.; Sadiki, A.; Janicka, J. Numerical investigation of adBlue droplet evaporation and thermal decomposition in the context of NOx-SCR using a multi-component evaporation model. Energies 2018, 11, 222. [Google Scholar] [CrossRef]
  8. Ebrahimian, V.; Nicolle, A.; Habchi, C. Detailed modeling of the evaporation and thermal decomposition of urea-water solution in SCR systems. AIChE J. 2012, 58, 1998–2009. [Google Scholar] [CrossRef]
  9. Ström, H.; Sasic, S.; Andersson, B. Effects of the Turbulent-to-Laminar Transition in Monolithic Reactors for Automotive Pollution Control. Ind. Eng. Chem. Res. 2011, 50, 3194–3205. [Google Scholar] [CrossRef]
  10. Spiteri, A. Experimental Investigation of the Injection Process in Urea-SCR deNOx Exhaust Gas After-Treatment Systems. Ph.D. Thesis, Department of Mechanical and Process Engineering, ETH Zürich, Switzerland, 2016. [Google Scholar]
  11. Stein, M.; Bykov, V.; Mass, U. The Effect of Evaporation Models on Urea Decomposition from Urea-Water-Solution Droplets in SCR Conditions. Emiss. Control Sci. Technol. 2018, 3, 263–274. [Google Scholar] [CrossRef]
  12. Abramzon, B.; Sirignano, W. Droplet vaporization model for spray combustion calculations. Int. J. Heat Mass Transf. 1989, 32, 1605–1618. [Google Scholar] [CrossRef]
  13. Sazhin, S.S.; Elwardany, A.E.; Heikal, M.R. New approaches to the modelling of multi-component fuel droplet heating and evaporation. J. Phys. Conf. Ser. 2015, 585, 012014. [Google Scholar] [CrossRef]
  14. Sadiki, A.; Chrigui, M.; Janicka, J.; Maneshkarimi, M. Modeling and Simulation of Effects of Turbulence on Vaporization, Mixing and Combustion of Liquid-Fuel Sprays. Flow Turbul. Combust. 2005, 75, 105–130. [Google Scholar] [CrossRef]
  15. Miller, R.S.; Harstad, K.; Bellan, J. Evaluation of equilibrium and non-equilibrium evaporation models for many-droplet gas-liquid flow simulations. Int. J. Multiph. Flow 1998, 24, 1025–1055. [Google Scholar] [CrossRef]
  16. Gan, X.; Yao, D.; Wu, F.; Dai, J.; Wei, L.; Li, X. Modeling and simulation of urea-water-solution droplet evaporation and thermolysis processes for SCR systems. Chin. J. Chem. Eng. 2016, 24, 1065–1073. [Google Scholar] [CrossRef]
  17. Olsson, L.; Sjövall, H.; Blint, R.J. A kinetic model for ammonia selective catalytic reduction over Cu-ZSM-5. Appl. Catal. B Environ. 2008, 81, 203–217. [Google Scholar] [CrossRef]
  18. Wurzenberger, J.C.; Wanker, R. Multi-Scale SCR Modeling, 1D Kinetic Analysis and 3D System Simulation; SAE Technical Paper; SAE International: Warrendale, PA, USA, 2005. [Google Scholar]
  19. Kaario, O.T.; Vuorinen, V.; Zhu, L.; Larmi, M.; Liu, R. Mixing and evaporation analysis of a high-pressure SCR system using a hybrid LES-RANS approach. Energy 2017, 120, 827–841. [Google Scholar] [CrossRef] [Green Version]
  20. Ström, H.; Lundström, A.; Andersson, B. Choice of urea-spray models in CFD simulations of urea-SCR systems. Chem. Eng. J. 2009, 150, 69–82. [Google Scholar] [CrossRef]
  21. Gökalp, I.; Chauveau, C.; Simon, O.; Chesneau, X. Mass transfer from liquid fuel droplets in turbulent flow. Combust. Flame 1992, 89, 286–298. [Google Scholar] [CrossRef]
  22. Sornek, R.; Dobashi, R.; Hirano, T. Effect of turbulence on vaporization, mixing, and combustion of liquid fuel soray. Combust. Flame 2000, 120, 479–491. [Google Scholar] [CrossRef]
  23. Nishad, K.; Ries, F.; Janicka, J.; Sadiki, S. Analysis of spray dynamics of urea-water-solution jets in a SCR-DeNOx system: An LES based study. Int. J. Heat Fluid Flow 2018, 70, 247–258. [Google Scholar] [CrossRef]
  24. Hirschfelder, J.O.; Curtiss, C.F.; Bird, R.B. Molecular Theory of Gases and Liquids; Wiley: New York, NY, USA, 1964. [Google Scholar]
  25. Ranz, W.; Marshall, W. Evaporation from drops: Part 2. Chem. Eng. Prog. 1952, 18, 173–180. [Google Scholar] [CrossRef]
  26. Wang, T.J.; Baek, S.W.; Lee, S.Y.; Kang, D.H.; Yeo, G.K. Experimental Investigation on Evaporation of Urea-Water-Solution Droplet for SCR Applications. AIChE J. 2009, 55, 3267–3276. [Google Scholar] [CrossRef]
  27. Wu, P.K.; Kirkendall, K.A.; Fuller, R.P.; Nejad, A.S. Spray Structures of Liquid Jets Atomized in Subsonic Cross-Flows. J. Propuls. Power 1998, 14, 173–182. [Google Scholar] [CrossRef]
  28. Prakash, R.S.; Sinha, A.; Raghunandan, B.; Tomar, G.; Ravikrishna, R. Breakup of Volatile Liquid Jet in Hot Cross Flow. Procedia IUTAM 2015, 15, 18–25. [Google Scholar] [CrossRef] [Green Version]
  29. Chrigui, M.; Sadiki, A.; Ahmadi, G. Study of interaction in spray between evaporating droplets and turbulence using second order turbulence RANS modelling and a Lagrangian approach. Prog. Comput. Fluid Dyn. 2004, 4, 162–174. [Google Scholar] [CrossRef]
  30. Nicoud, F.; Ducros, F. Subgrid-scale stress modelling based on the square of the velocity gradient Tensor. Flow Turbul. Combust. 1999, 62, 183–200. [Google Scholar] [CrossRef]
  31. Montorfano, A.; Piscaglia, F.; Onorati, A. Wall-adapting subgrid-scale models to apply to large eddy simulation of internal combustion engines. Int. J. Comput. Math. 2014, 91, 62–70. [Google Scholar] [CrossRef]
  32. Ries, F.; Nishad, K.; Dressler, L.; Janicka, J.; Sadiki, A. Evaluating large eddy simulation results based on error analysis. Theor. Comput. Fluid Dyn. 2018, 1–20. [Google Scholar] [CrossRef]
  33. Pope, S.B. Turbulence Flow; Cambridge University Press: Cambridge, UK, 2000. [Google Scholar]
  34. Chrigui, M.; Masri, A.R.; Sadiki, A.; Janicka, J. Large Eddy Simulation of a Polydisperse Ethanol Spray Flame. Flow Turbul. Combust. 2013, 90, 813–832. [Google Scholar] [CrossRef]
  35. Torres, D.J.; O’rourke, P.J.; Amsden, A.A. Efficient multicomponent fuel algorithm. Combust. Theory Model. 2003, 7, 66–86. [Google Scholar] [CrossRef]
  36. Munnannur, A.; Chiruta, M.; Liu, Z.G. Thermal and Fluid Dynamic Considerations in Aftertreatment System Design for SCR Solid Deposit Mitigation. In Proceedings of the SAE 2012 World Congress & Exhibition, Detroit, MI, USA, 24–26 April 2012; SAE International: Warrendale, PA, USA, 2012. [Google Scholar]
  37. Börnhorst, M.; Deutschmann, O. Single droplet impingement of urea water solution on a heated substrate. Int. J. Heat Fluid Flow 2018, 69, 55–61. [Google Scholar] [CrossRef]
  38. Kuhnke, D. Spray Wall Interaction Modelling by Dimensionless Data Analysis. Ph.D. Thesis, Department of Mathematics, Darmstadt University of Technology, Darmstadt, Germany, 2004. [Google Scholar]
  39. O’Rourke, P.J.; Amsden, A.A. A Spray/Wall Interaction Submodel for the KIVA-3 Wall Film Model. In Proceedings of the SAE 2000 World Congress, Detroit, MI, USA, 6–9 March 2000; SAE International: Warrendale, PA, USA, 2000. [Google Scholar]
  40. Nishad, K. Modeling and Unsteady Simulation of Turbulent Multi-Phase Flow Including Fuel Injection in IC-Engines. Ph.D. Thesis, Department of Mechanical Engineering, Technische Universität Darmstadt, Darmstadt, Germany, 2013. [Google Scholar]
  41. Nishad, K.; Pischke, P.; Goryntsev, D.; Sadiki, A.; Kneer, R. LES Based Modeling and Simulation of Spray Dynamics including Gasoline Direct Injection (GDI) Processes using KIVA-4 Code. In Proceedings of the SAE 2012 World Congress & Exhibition, Detroit, MI, USA, 24–26 April 2012; SAE International: Warrendale, PA, USA, 2012. [Google Scholar]
  42. Goryntsev, D.; Nishad, K.; Sadiki, A.; Janicka, J. Application of LES for Analysis of Unsteady Effects on Combustion Processes and Misfires in DISI Engine. Oil Gas Sci. Technol. Rev. IFP Energies Nouvelles 2014, 69, 129–140. [Google Scholar] [CrossRef]
  43. Stauch, R.; Lipp, S.; Maas, U. Detailed numerical simulations of the autoignition of single n-heptane droplets in air. Combust. Flame 2006, 145, 533–542. [Google Scholar] [CrossRef]
  44. Maas, U. Mathematische Modellierung instationärer Verbrennungsprozesse unter verwendung detaillierter chemischer Reaktionsmechanismen. Ph.D. Thesis, Universität Heidelberg, Heidelberg, Germany, 1988. [Google Scholar]
  45. Smith, L.J.; Berendsen, H.J.C.; van Gunsteren, W.F. Computer simulation of urea-water mixtures: A test of force field parameters for use in biomolecular simulation. J. Phys. Chem. B 2004, 108, 1065–1071. [Google Scholar] [CrossRef]
  46. Kontin, S.; Höfler, A.; Koch, R.; Bauer, H.J. Heat and Mass Transfer accompanied by Crystallisation of single Particles containing Urea-water-solution. In Proceedings of the 23rd Annual Conference on Liquid Atomization and Spray Systems, Brno, Czech Republic, 12–14 September 2010. [Google Scholar]
  47. Ryddner, D.T.; Trujillo, M.F. Modeling Urea-Water Solution Droplet Evaporation. Emiss. Control Sci. Technol. 2015, 1, 80–97. [Google Scholar] [CrossRef] [Green Version]
  48. Wei, L.; Youtong, Z.; Asif, M. Investigation on UWS Evaporation for Vehicle SCR Applications. AIChE J. 2016, 62, 880–890. [Google Scholar] [CrossRef]
  49. Yaws, C.L. Chemical Properties Handbook; McGraw-Hill: New York, NY, USA, 1999. [Google Scholar]
  50. Reid, R.; Prausnitz, J.; Poling, B. The Properties of Gases and Liquids, 4th ed.; McGraw-Hill: New York, NY, USA, 1989. [Google Scholar]
  51. Maas, U.; Warnatz, J. Ignition processes in hydrogen-oxygen mixtures. Combust. Flame 1988, 74, 53–69. [Google Scholar] [CrossRef]
  52. Stauch, R. Detaillierte Simulation von Verbrennungsprozessen in Mehrphasensystemen. Ph.D. Thesis, Universität Karlsruhe, Karlsruhe, Germany, 2007. [Google Scholar]
  53. Deuflhard, P.; Hairer, E.; Zugck, J. One-step and Extrapolation Methods for Differential-Algebraic systems. Numer. Math. 2004, 51, 501–516. [Google Scholar] [CrossRef]
  54. Fede, P.; Simonin, O.; Villedieu, P.; Squires, K. Stochastic Modeling of the Turbulent Subgrid Fluid Velocity Along Inertial Particle Trajectories. In Proceedings of the Summer Program Center for Turbulence Research Stanford University, Stanford, CA, USA, 4–9 July 2006. [Google Scholar]
  55. Ahmadi, W.; Mehdizadeh, A.; Chrigui, M.; Sadiki, A. Numerical Evaluation of Unsteadiness in Particle Dispersion Modeling. J. Fluids Eng. 2014, 137, 034502. [Google Scholar] [CrossRef]
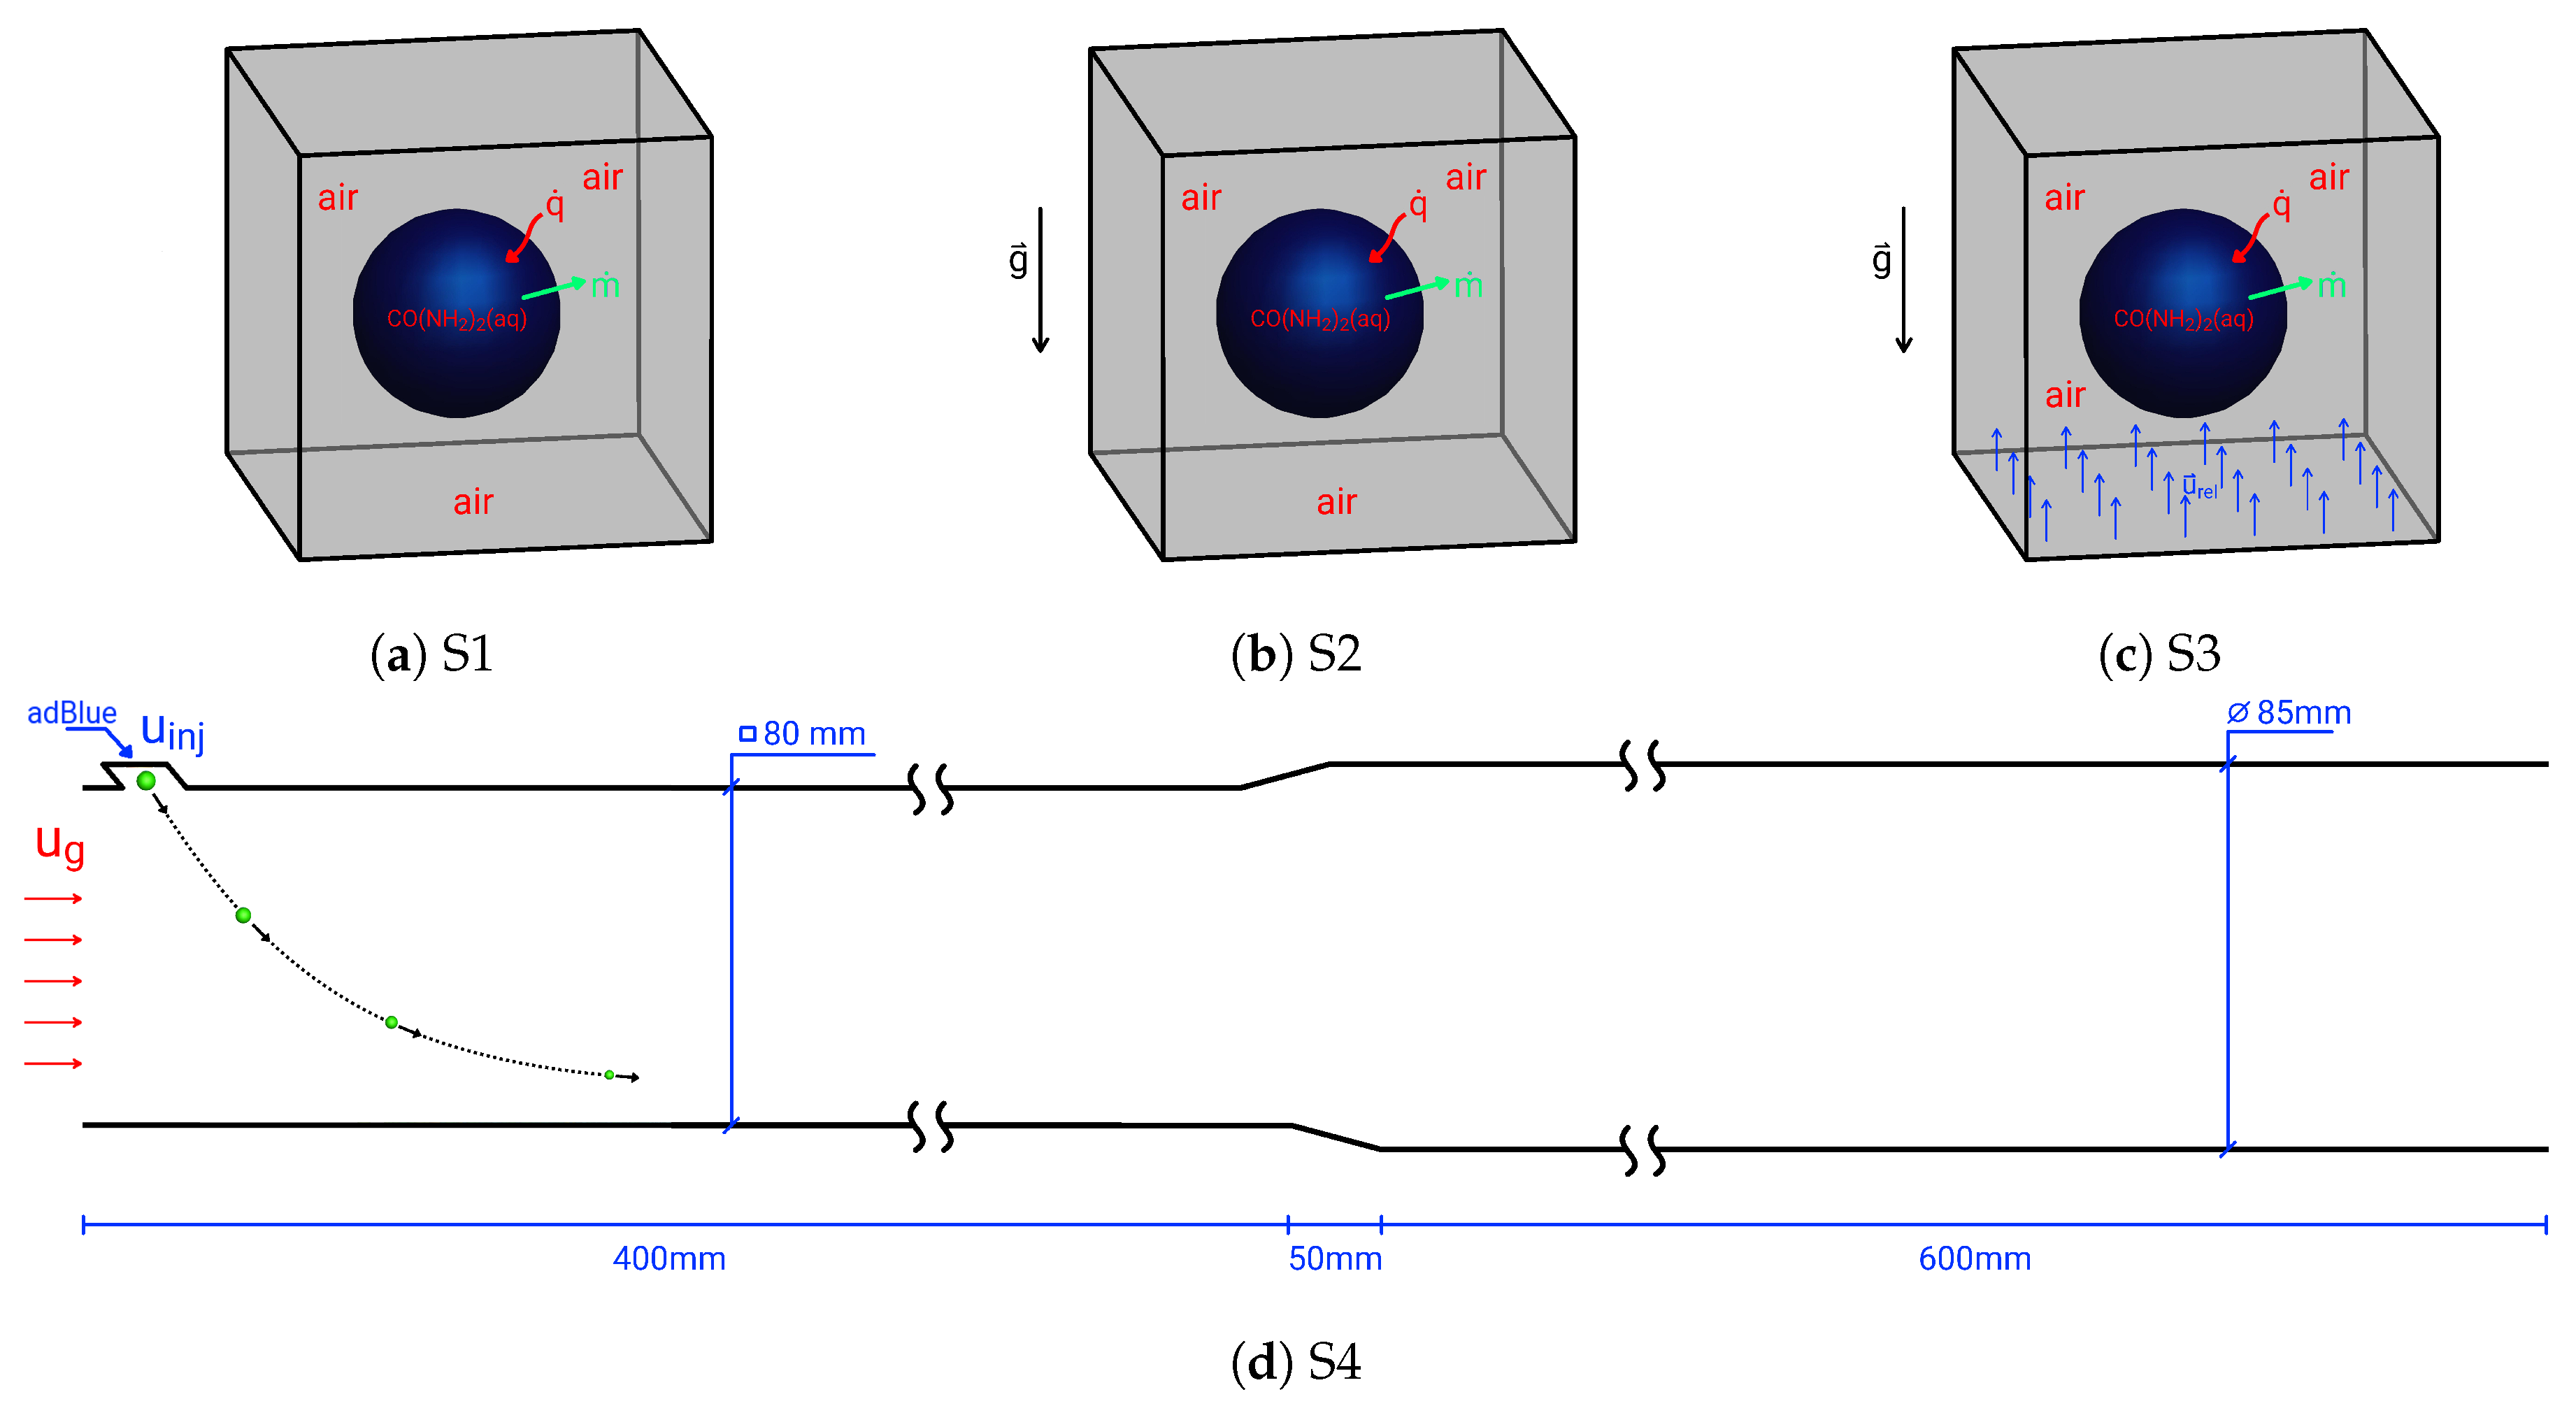
Figure 1. Schematic of simulation cases: (a) stagnant droplet no gravity (S1); (b) stagnant droplet with gravity (S2); (c) with relative velocity urel, m/s (S3); (d) hot cross-flow case (S4).
Energies 12 02600 g001
Figure 2. Comparison between detailed simulations (B07) and reduced model (LES based, C05) without chemistry (only evaporation). (a) dry air; (b) moist air.
Energies 12 02600 g002
Figure 3. Validation of evaporation model (C05) for AdBlue® droplet evaporation under gravitational influence (experiment [26]).
Energies 12 02600 g003
Figure 4. Comparison of evaporation/conversion dynamics of dp = 50 μ m for stagnant droplet urel = 0, and with relative velocity urel = 10 m/s: (a) droplet lifetime; (b) average NH3 conversion rate.
Energies 12 02600 g004
Figure 5. Influence of droplet relative velocity and gas temperature on evaporation dynamics for droplet diameters of: (a) 25 μ m; (b) 50 μ m; (c) 100 μ m; (d) 200 μ m.
Energies 12 02600 g005
Figure 6. Influence of droplet relative velocity and diameter on evaporation dynamics for gas temperature. (a) 573 K; (b) 773 K.
Energies 12 02600 g006
Figure 7. Evaporated droplet mass with respect to various diameter for: (a) urel = 10 m/s, T g = 573 K; (b) urel = 10 m/s, T g = 673 K; (c) urel = 20 m/s, T g = 573 K; (d) urel = 20 m/s, T g = 673 K.
Energies 12 02600 g007aEnergies 12 02600 g007b
Figure 8. Droplet life with respect to various diameter and relative velocity for: (a) T g = 573 K; (b) T g = 773 K.
Energies 12 02600 g008
Figure 9. Conversion efficiency with respect to various diameter and relative velocity for: (a) T g = 573 K; (b) T g = 773 K.
Energies 12 02600 g009
Figure 10. Droplet -wall impingement regime map [5,37] with operating points for single droplet study in cross flow (red: 200 μ m; blue: 100 μ m; black: 55 μ m; green: 573 K; cyan: 523 K; orange: 473 K).
Energies 12 02600 g010
Figure 11. Droplet trajectory and life under various gas temperatures and mass flow rate cases: (a) T1M1; (b) T1M2; (c) T2M1; (d) T2M2. Initial post-impingement droplet diameters (dp,a) are given in colors at respective impingement locations for droplets which undergo splashing/rebound.
Energies 12 02600 g011
Figure 12. Evolution of the instantaneous velocity of the droplets during its lifetime: for mass flow rate m ˙ g = 100 kg/h at gas temperatures of 573 K, examplarily d0 = 25, 50 μ m.
Energies 12 02600 g012
Figure 13. Droplet trajectory and life: deposition case for mass flow rate m ˙ g = 100 kg/h at various gas temperatures of 573 K, 523 K, and 423 K.
Energies 12 02600 g013
Table 1. Specification of quantities appearing in the filtered transport equations.
Variables Ψ F F SGS Σ ˜ Ψ ˜ S Ψ ˜
mass ρ ¯ 000 S ρ ¯
momentum ρ ¯ u ˜ i 2 μ D ¯ i j 1 3 D ¯ k k δ i j p ¯ δ i j τ i j SGS ρ ¯ g i S u ˜ i
species mass fraction ρ ¯ ϕ ˜ ρ ¯ D ϕ ˜ ϕ ˜ x j J j ϕ ( SGS ) 0 S ϕ ˜
enthalpy ρ ¯ h ˜ ρ ¯ D h ˜ h ˜ x j J j h ( SGS ) W ˜ h ˜ S h ˜
Table 2. Comparisons properties between detailed simulations and the LES-based Eulerian–Lagrangian.
PropertiesDetailed Simulation [B07]Reduced Model [C05]
Droplet phaseResolved 1DResolved 1D
Gas phase close to dropletResolved 1DNot resolved, 0D (Film model)
Ambient conditionsGiven as boundary condition of gas-phaseTaken from LES
InterfaceLocal evaporation balanceFilm model connects ambient
Connects gas-phases and dropletonditions and droplet
Values at interfaceVapor pressure and partialWeighted average of droplet
pressuredata and ambient conditions
Gradients at interfaceLocal gradients (first elementInterface value to ambient
of gas phase)condition
DiffusionMixture averageOnly evaporating species
Table 3. Operating parameters for droplet life parametric study.
Initial Diameter, ( μ m)T g , (K)Relative Velocity, urel (m/s)
254730, 5, 10, 20, 40
5730, 5, 10, 20, 40
6730, 5, 10, 20, 40
7730, 5, 10, 20, 40
504730, 5, 10, 20, 40
5730, 5, 10, 20, 40
6730, 5, 10, 20, 40
7730, 5, 10, 20, 40
1004730, 5, 10, 20, 40
5730, 5, 10, 20, 40
6730, 5, 10, 20, 40
7730, 5, 10, 20, 40
1504730, 5, 10, 20, 40
5730, 5, 10, 20, 40
6730, 5, 10, 20, 40
7730, 5, 10, 20, 40
2004730, 5, 10, 20, 40
5730, 5, 10, 20, 40
6730, 5, 10, 20, 40
7730, 5, 10, 20, 40
Table 4. Operating parameters for hot-cross flow cases (Wall temperature T w is assumed equal to T g ).
CaseGas Temperature, T g (K)Gas Flow Rate, m ˙ g (kg/h)Droplet Diameter ( μ m)
T1M157310025, 50, 55, 100, 200
T1M257320025, 50, 55, 100, 200
T2M167310025, 50, 55, 100, 200
T2M267320025, 50, 55, 100, 200
3TM1573, 523, 47310055