Assessing the Impacts of Electric Vehicle Recharging Infrastructure Deployment Efforts in the European Union

 ,
,  , , and
Abstract
:1. Introduction
1.1. General Studies of Alternative Fuels and Infrastructure Interaction
1.2. EV and Grid/Market Interaction
1.3. EV Impacts
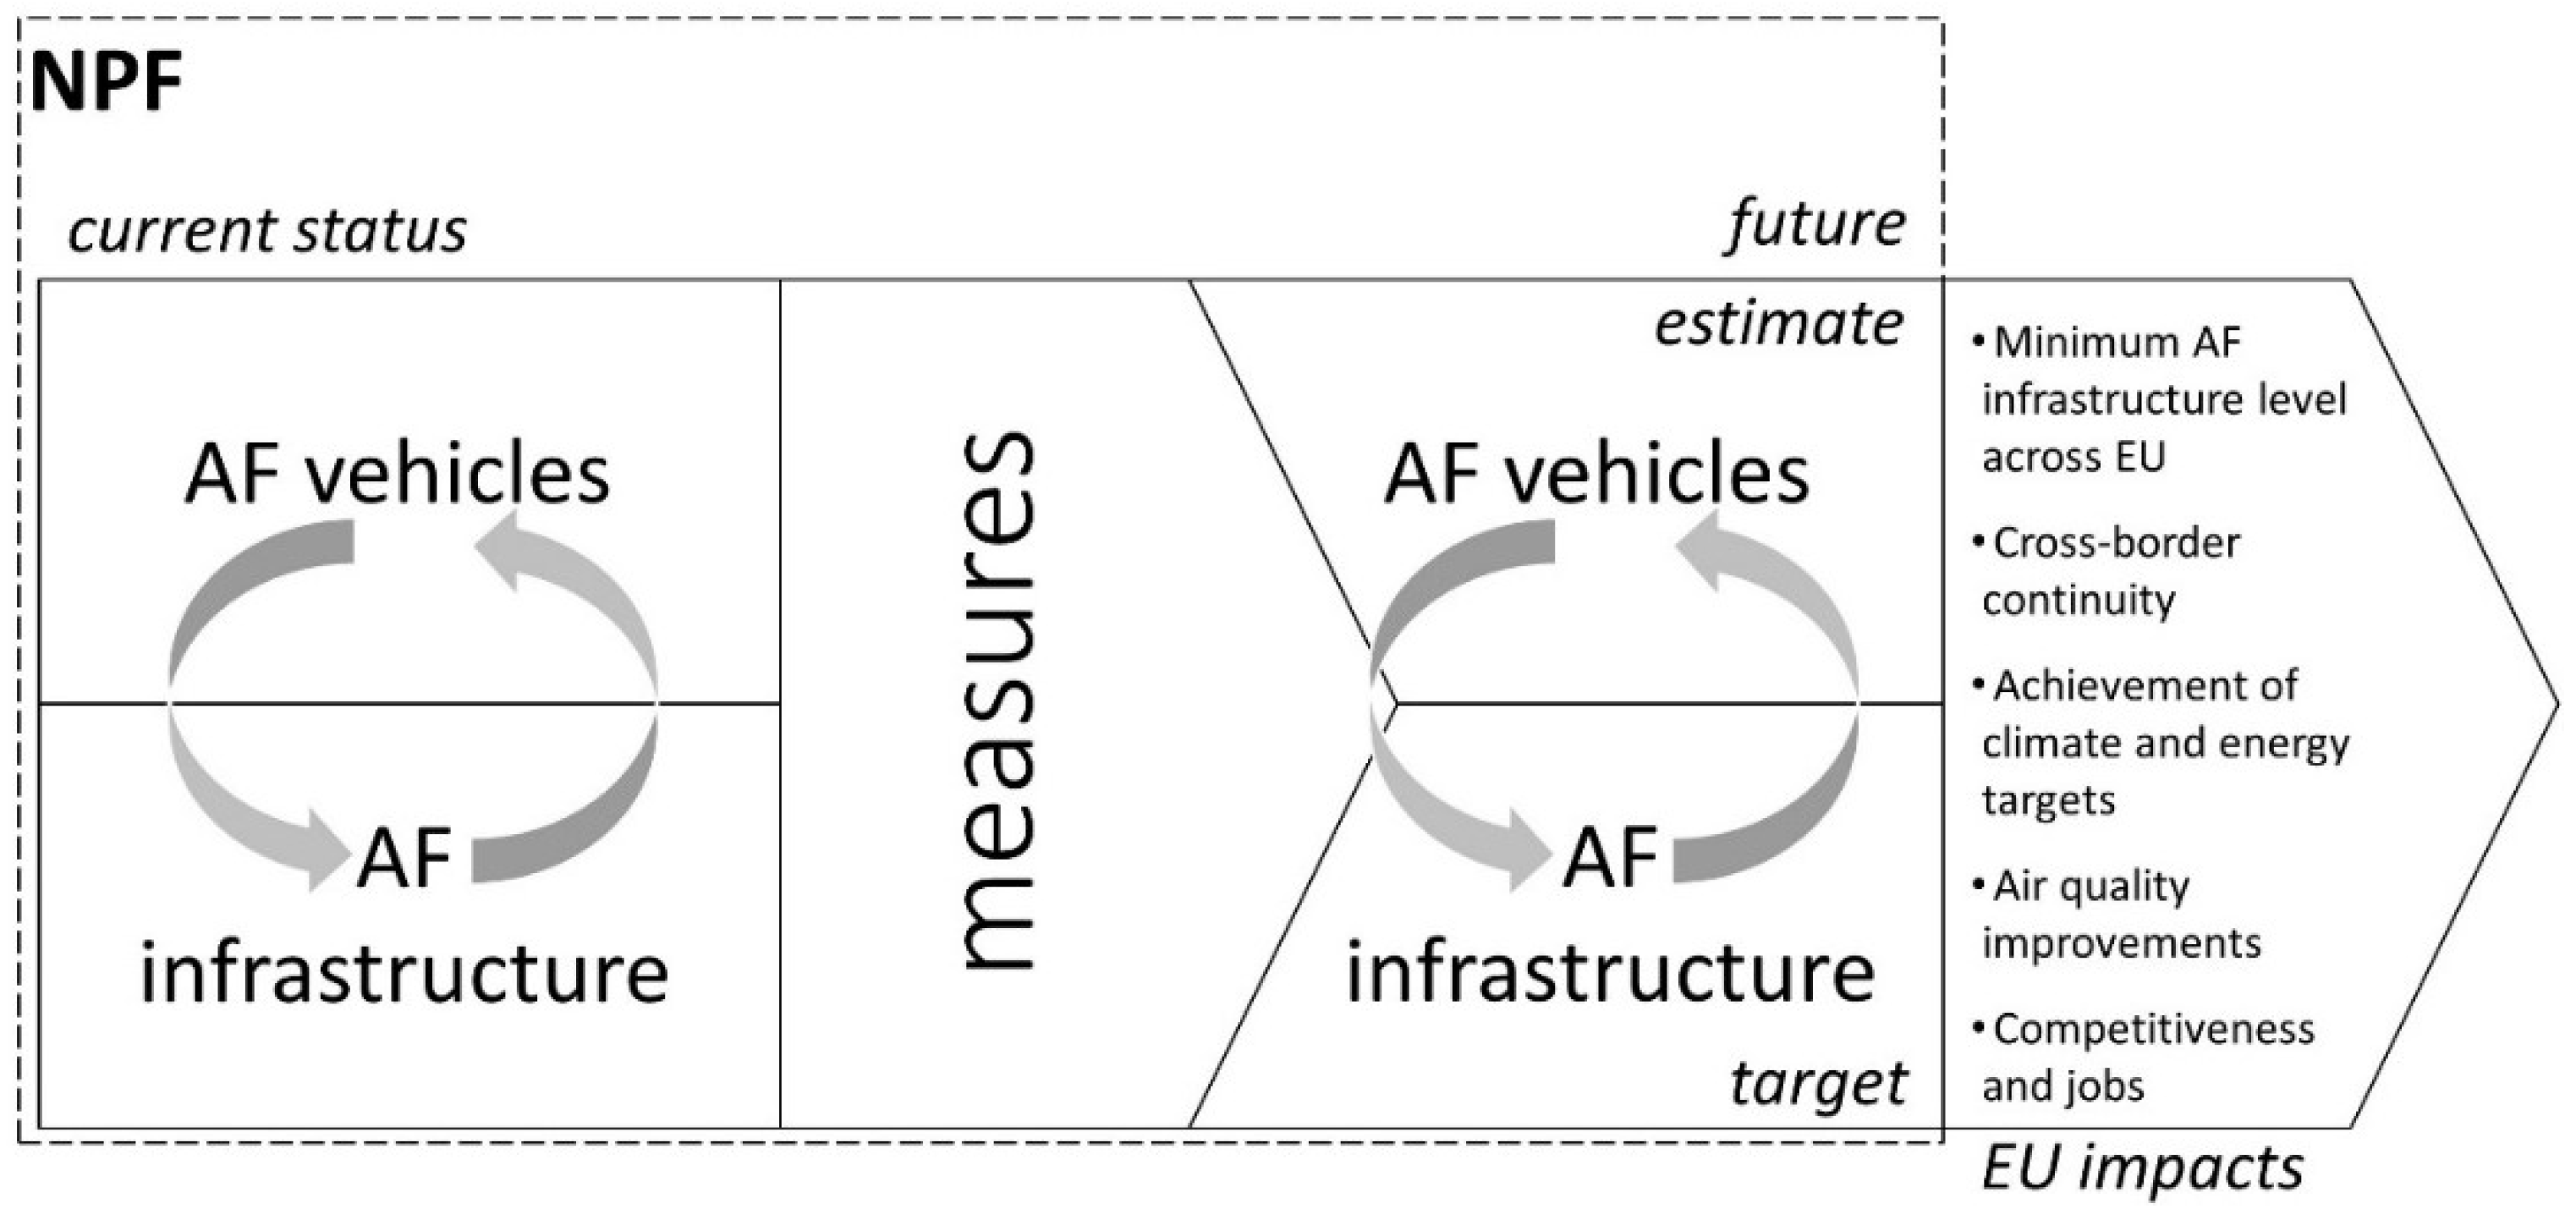
2. Policy Context
- creation of a recharging infrastructure across the EU MSs, including cross-border continuity and enabling a market deployment of electric vehicles;
- support to the attainment of EU climate and energy objectives;
- improvement of air quality;
- reinforcement of the EU’s competitiveness and job creation.
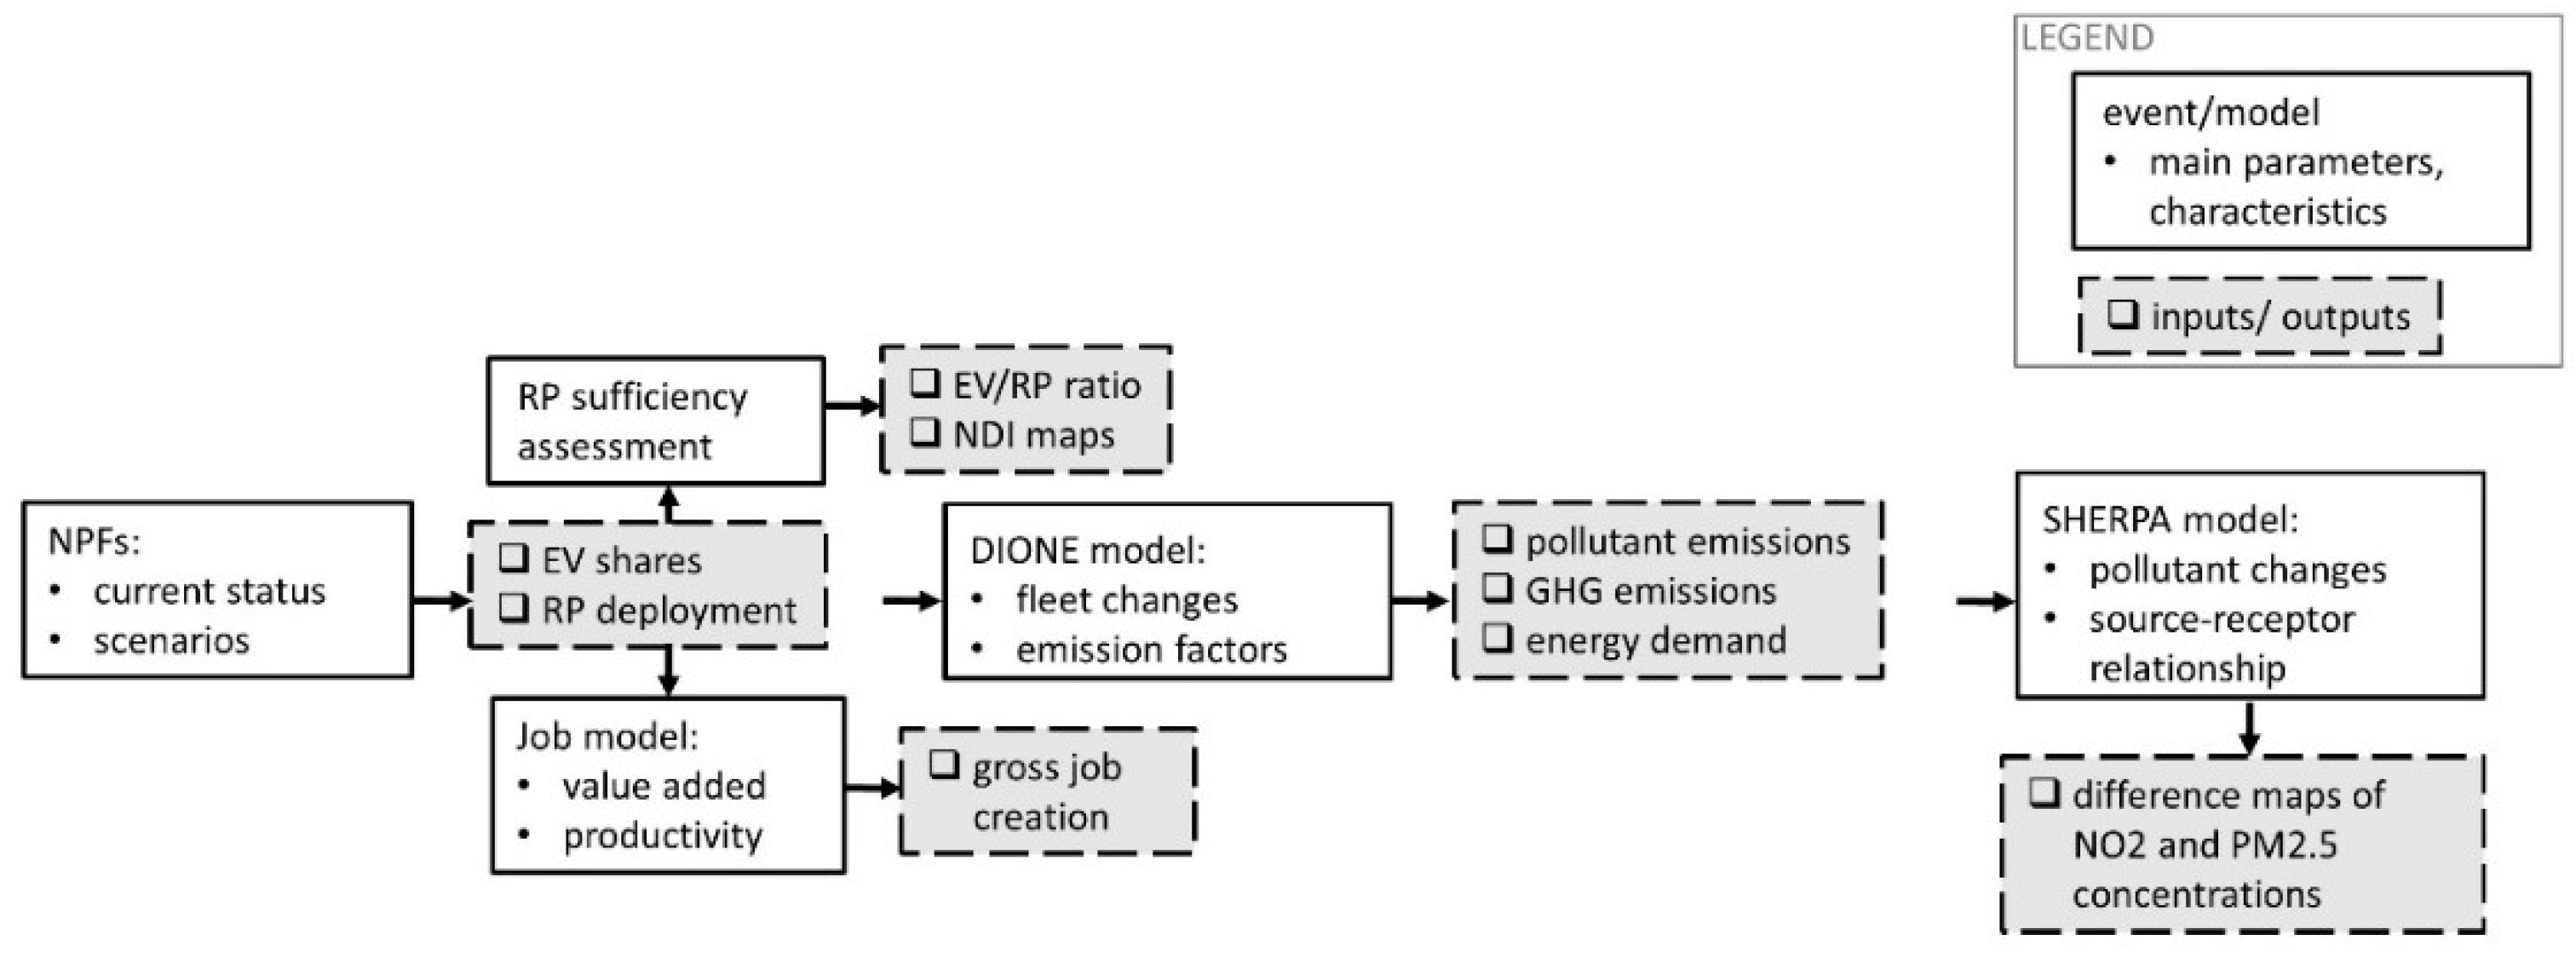
3. Assessment Methodology
3.1. Creation of a Minimum Level of Recharging Infrastructure
3.2. EU Climate and Energy Modelling
3.3. Air Quality Modelling
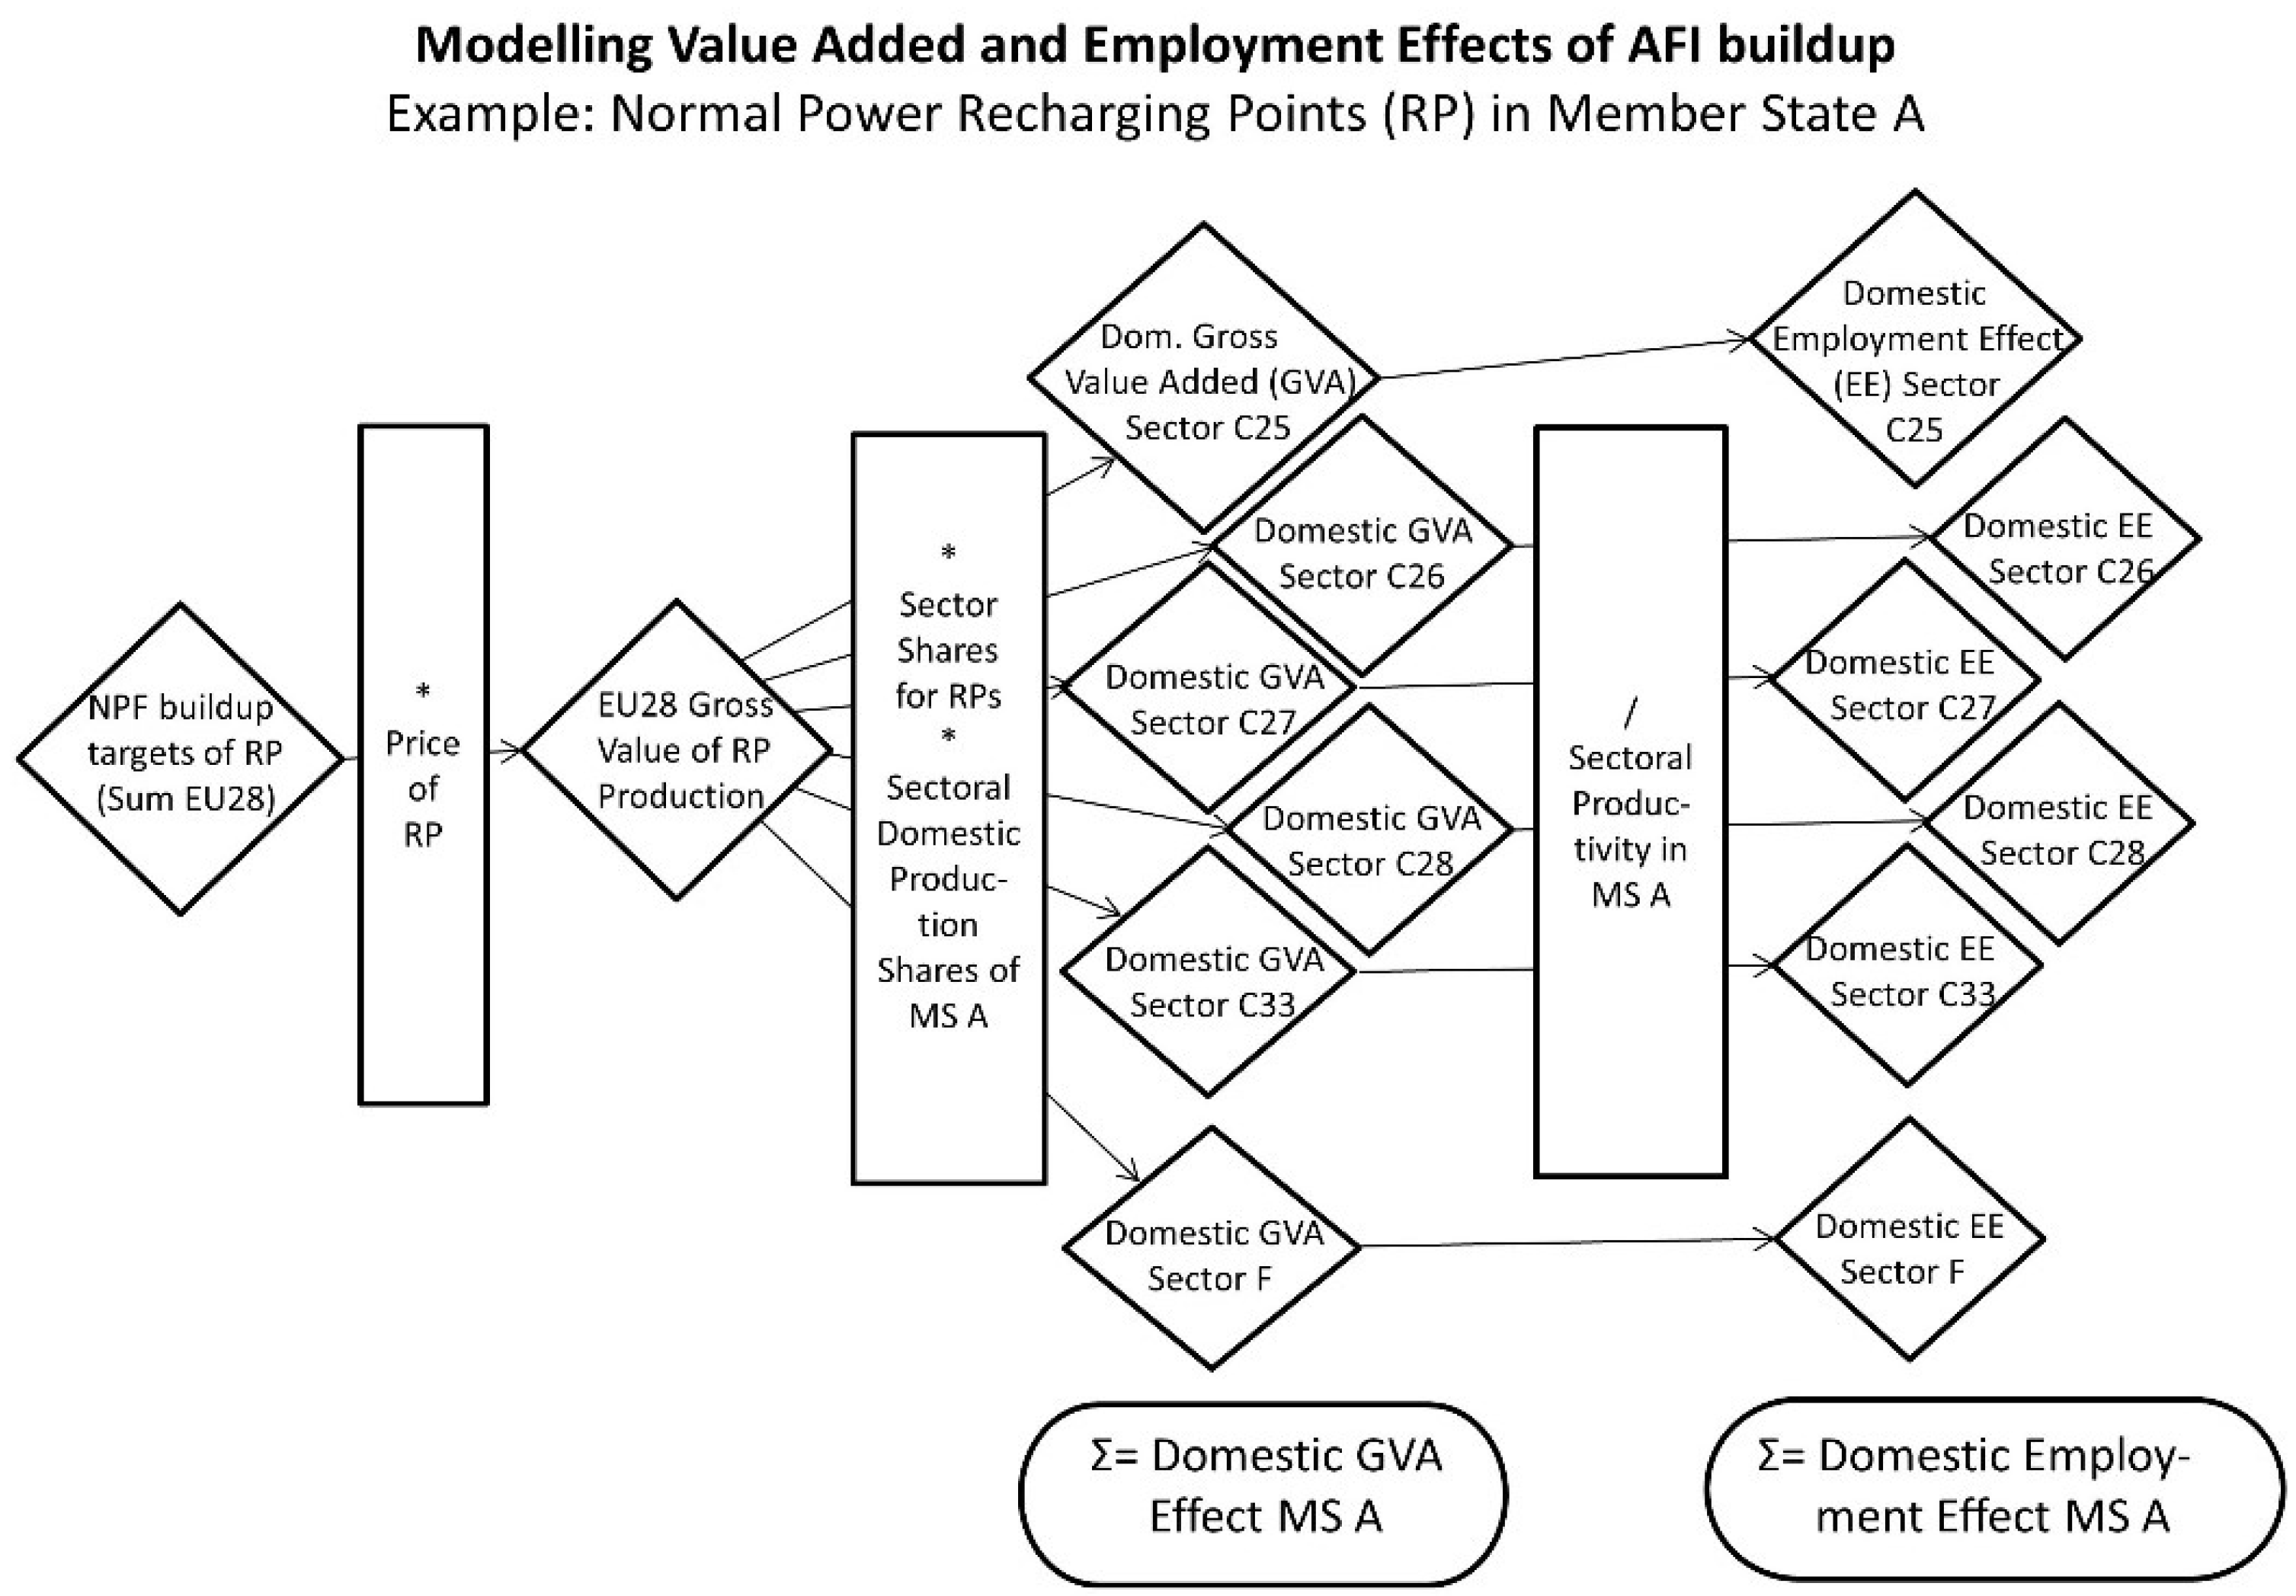
3.4. Job Impacts
3.5. Scenario Assumptions
- REF scenario: The reference scenario without NPFs builds on the EU Reference Scenario 2016 [30], but excludes the incentives for alternative fuels provided at the MS level. The REF scenario was implemented in the PRIMES-TREMOVE model and replicated in the DIONE model (see Section 3.2).
- SWD2013 scenario: This scenario is based on the assumptions made in the impact assessment of the proposed AFI directive, as shown in the Staff Working Document (SWD) published in 2013 [26]. For the 2013 impact assessment, the PRIMES-TREMOVE model was used. This scenario was replicated in the DIONE model to calculate energy use and emission reductions from cars with respect to the other two scenarios.
- NPF scenario: This scenario is the result of taking into account the NPFs, submitted in 2016–2018 to the EC as per the adopted AFI directive. EV market uptake in the EU is lower under this scenario than under the SWD2013 scenario. The PRIMES-TREMOVE model was not used to run this scenario (see Section 3.2).
4. Assessment Results
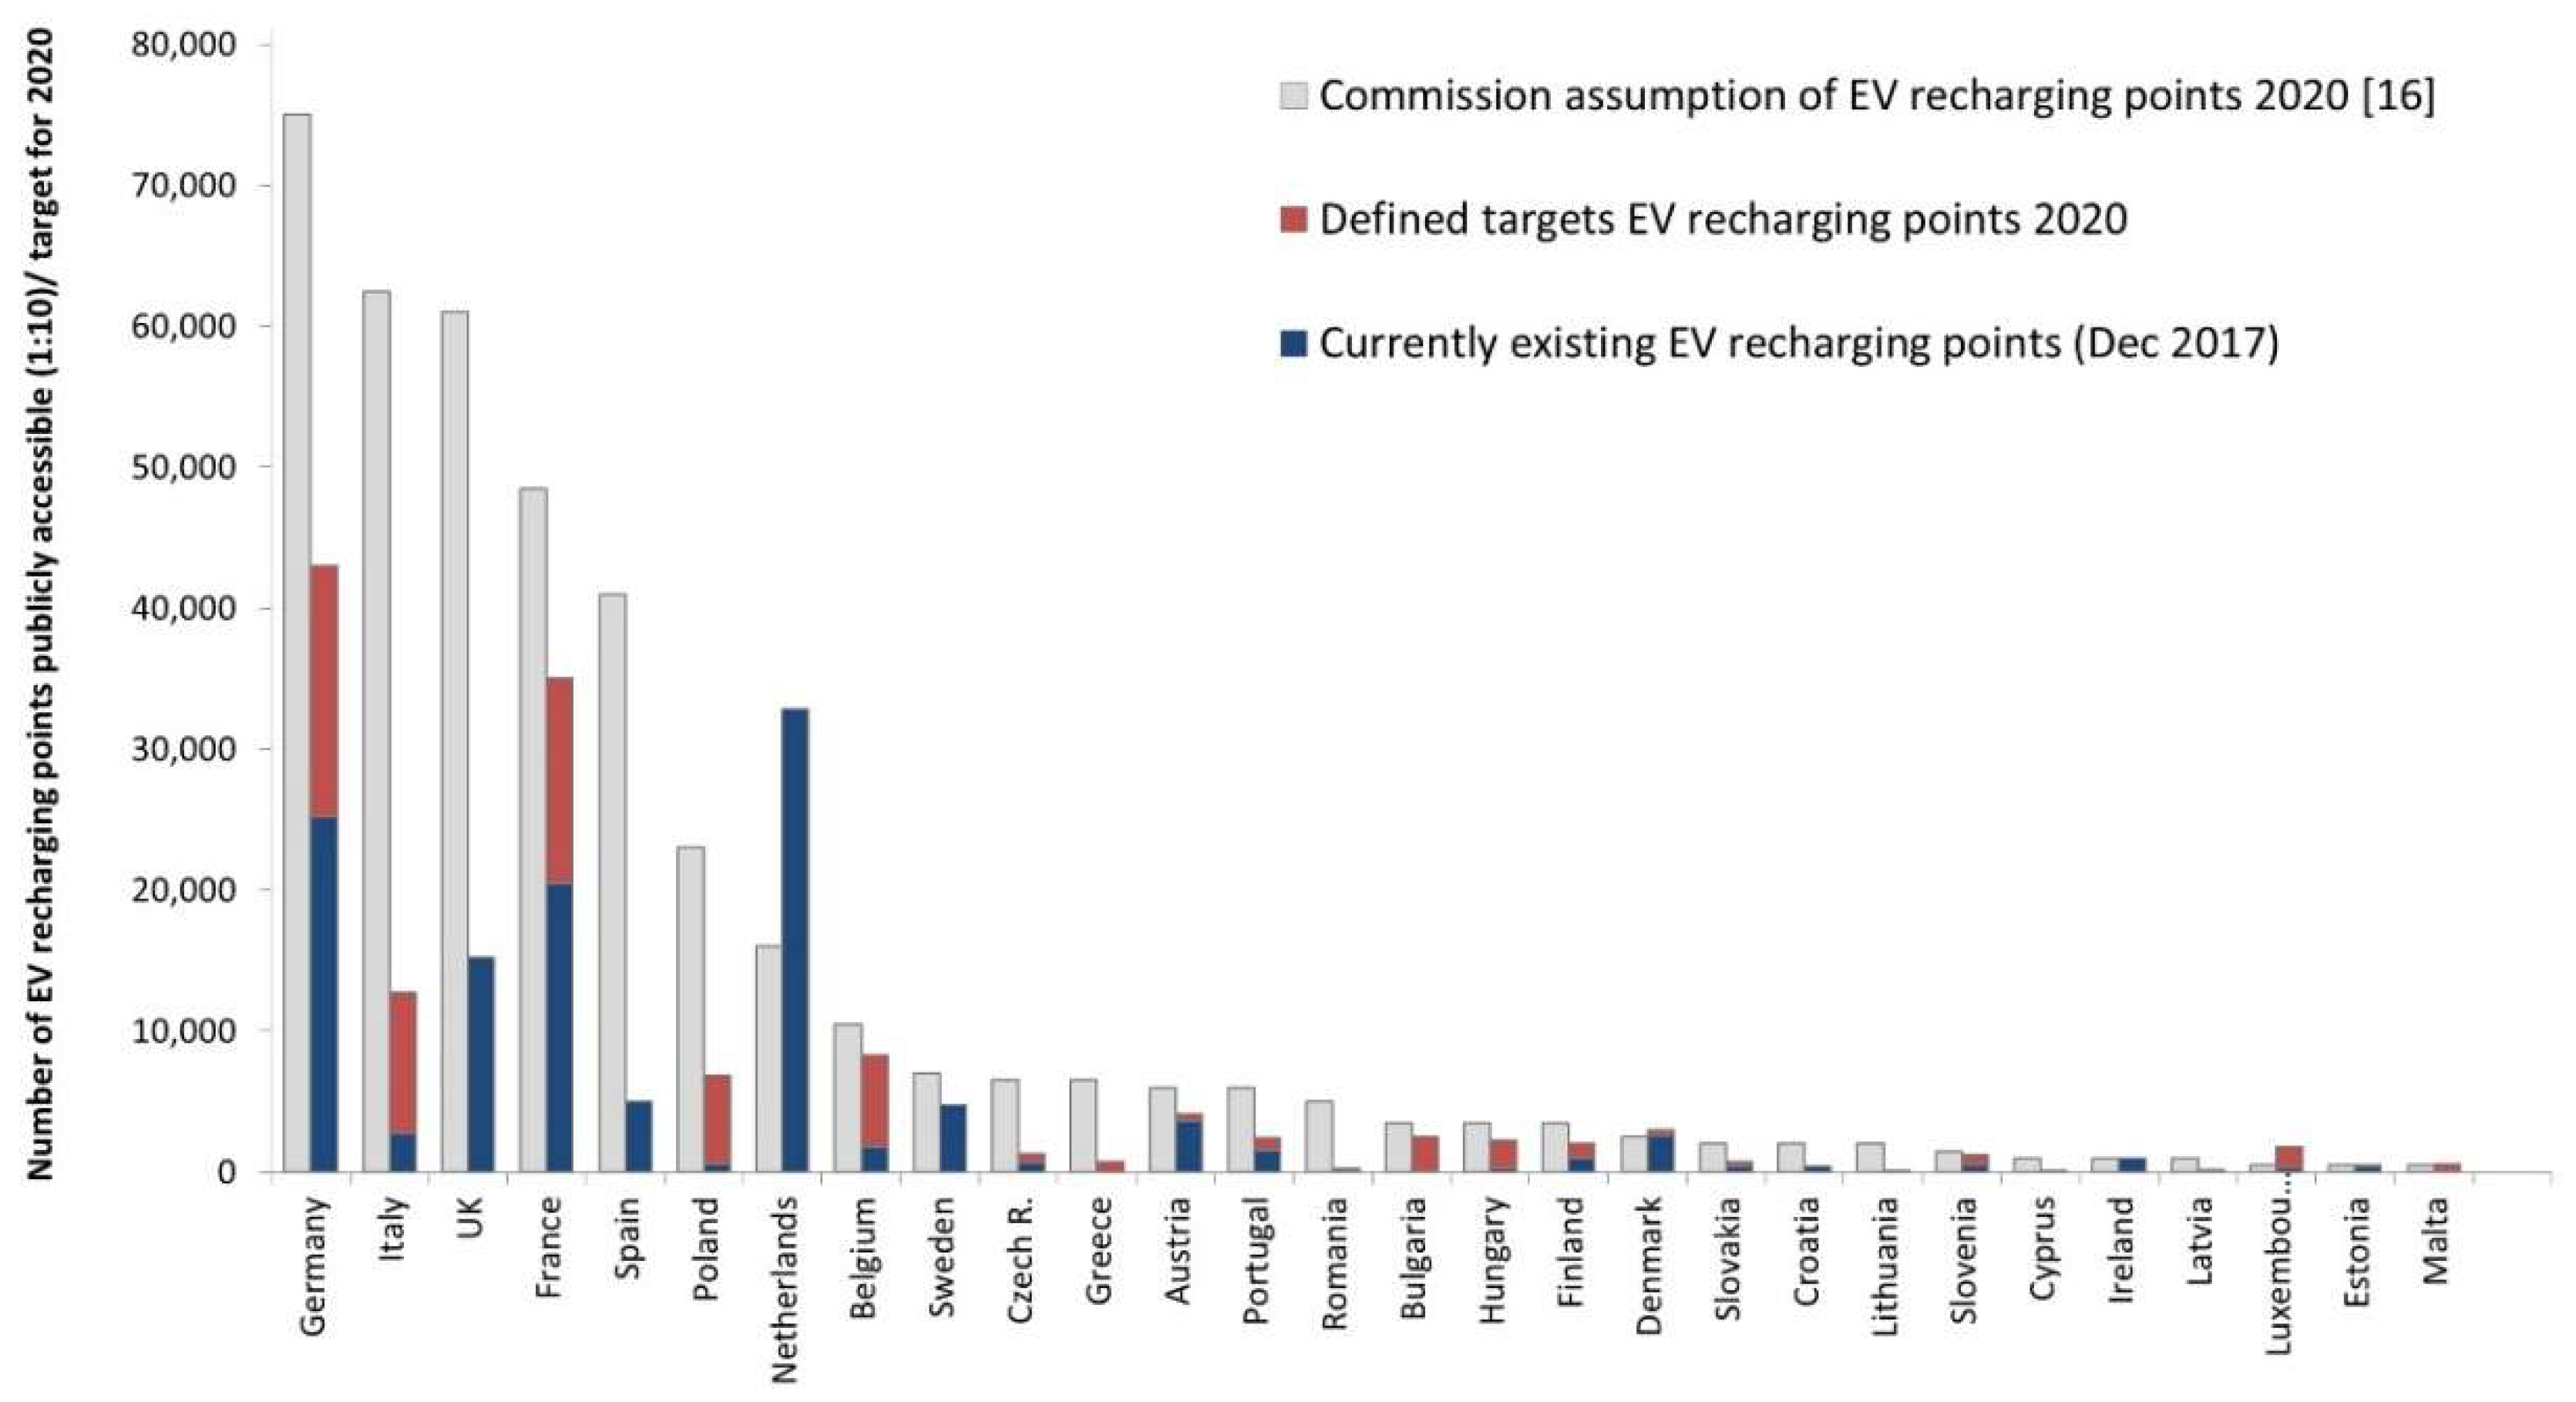
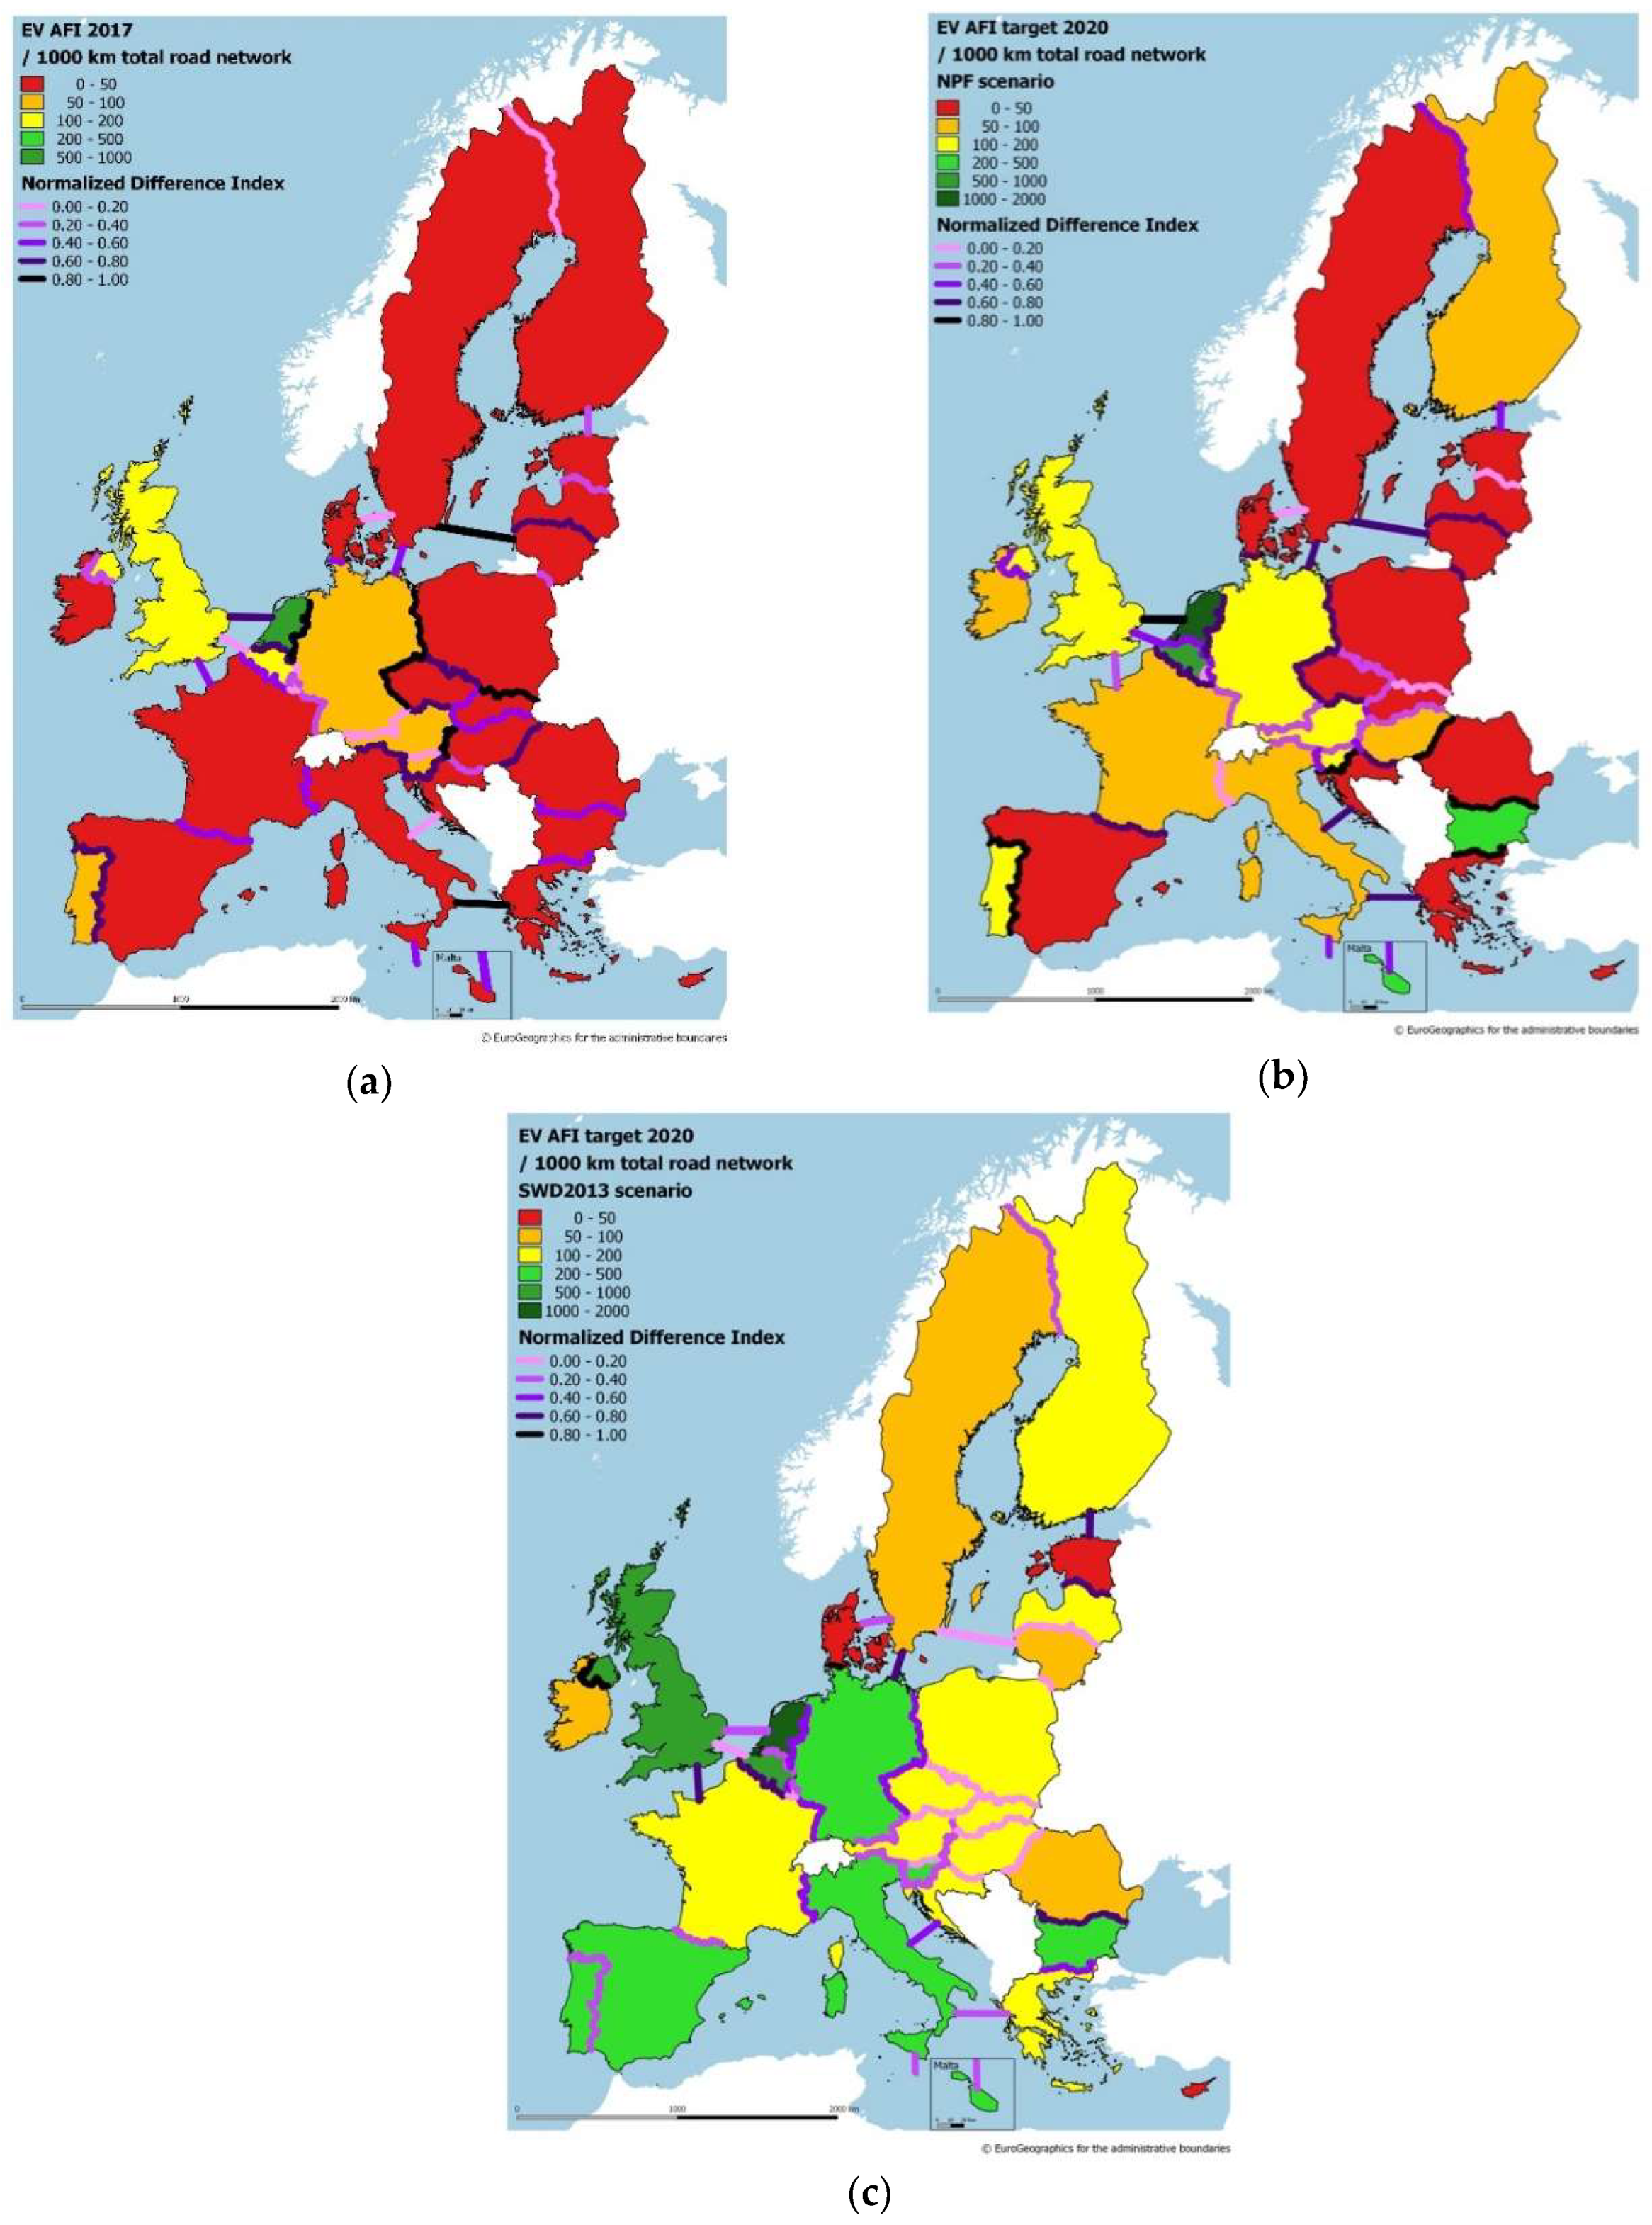
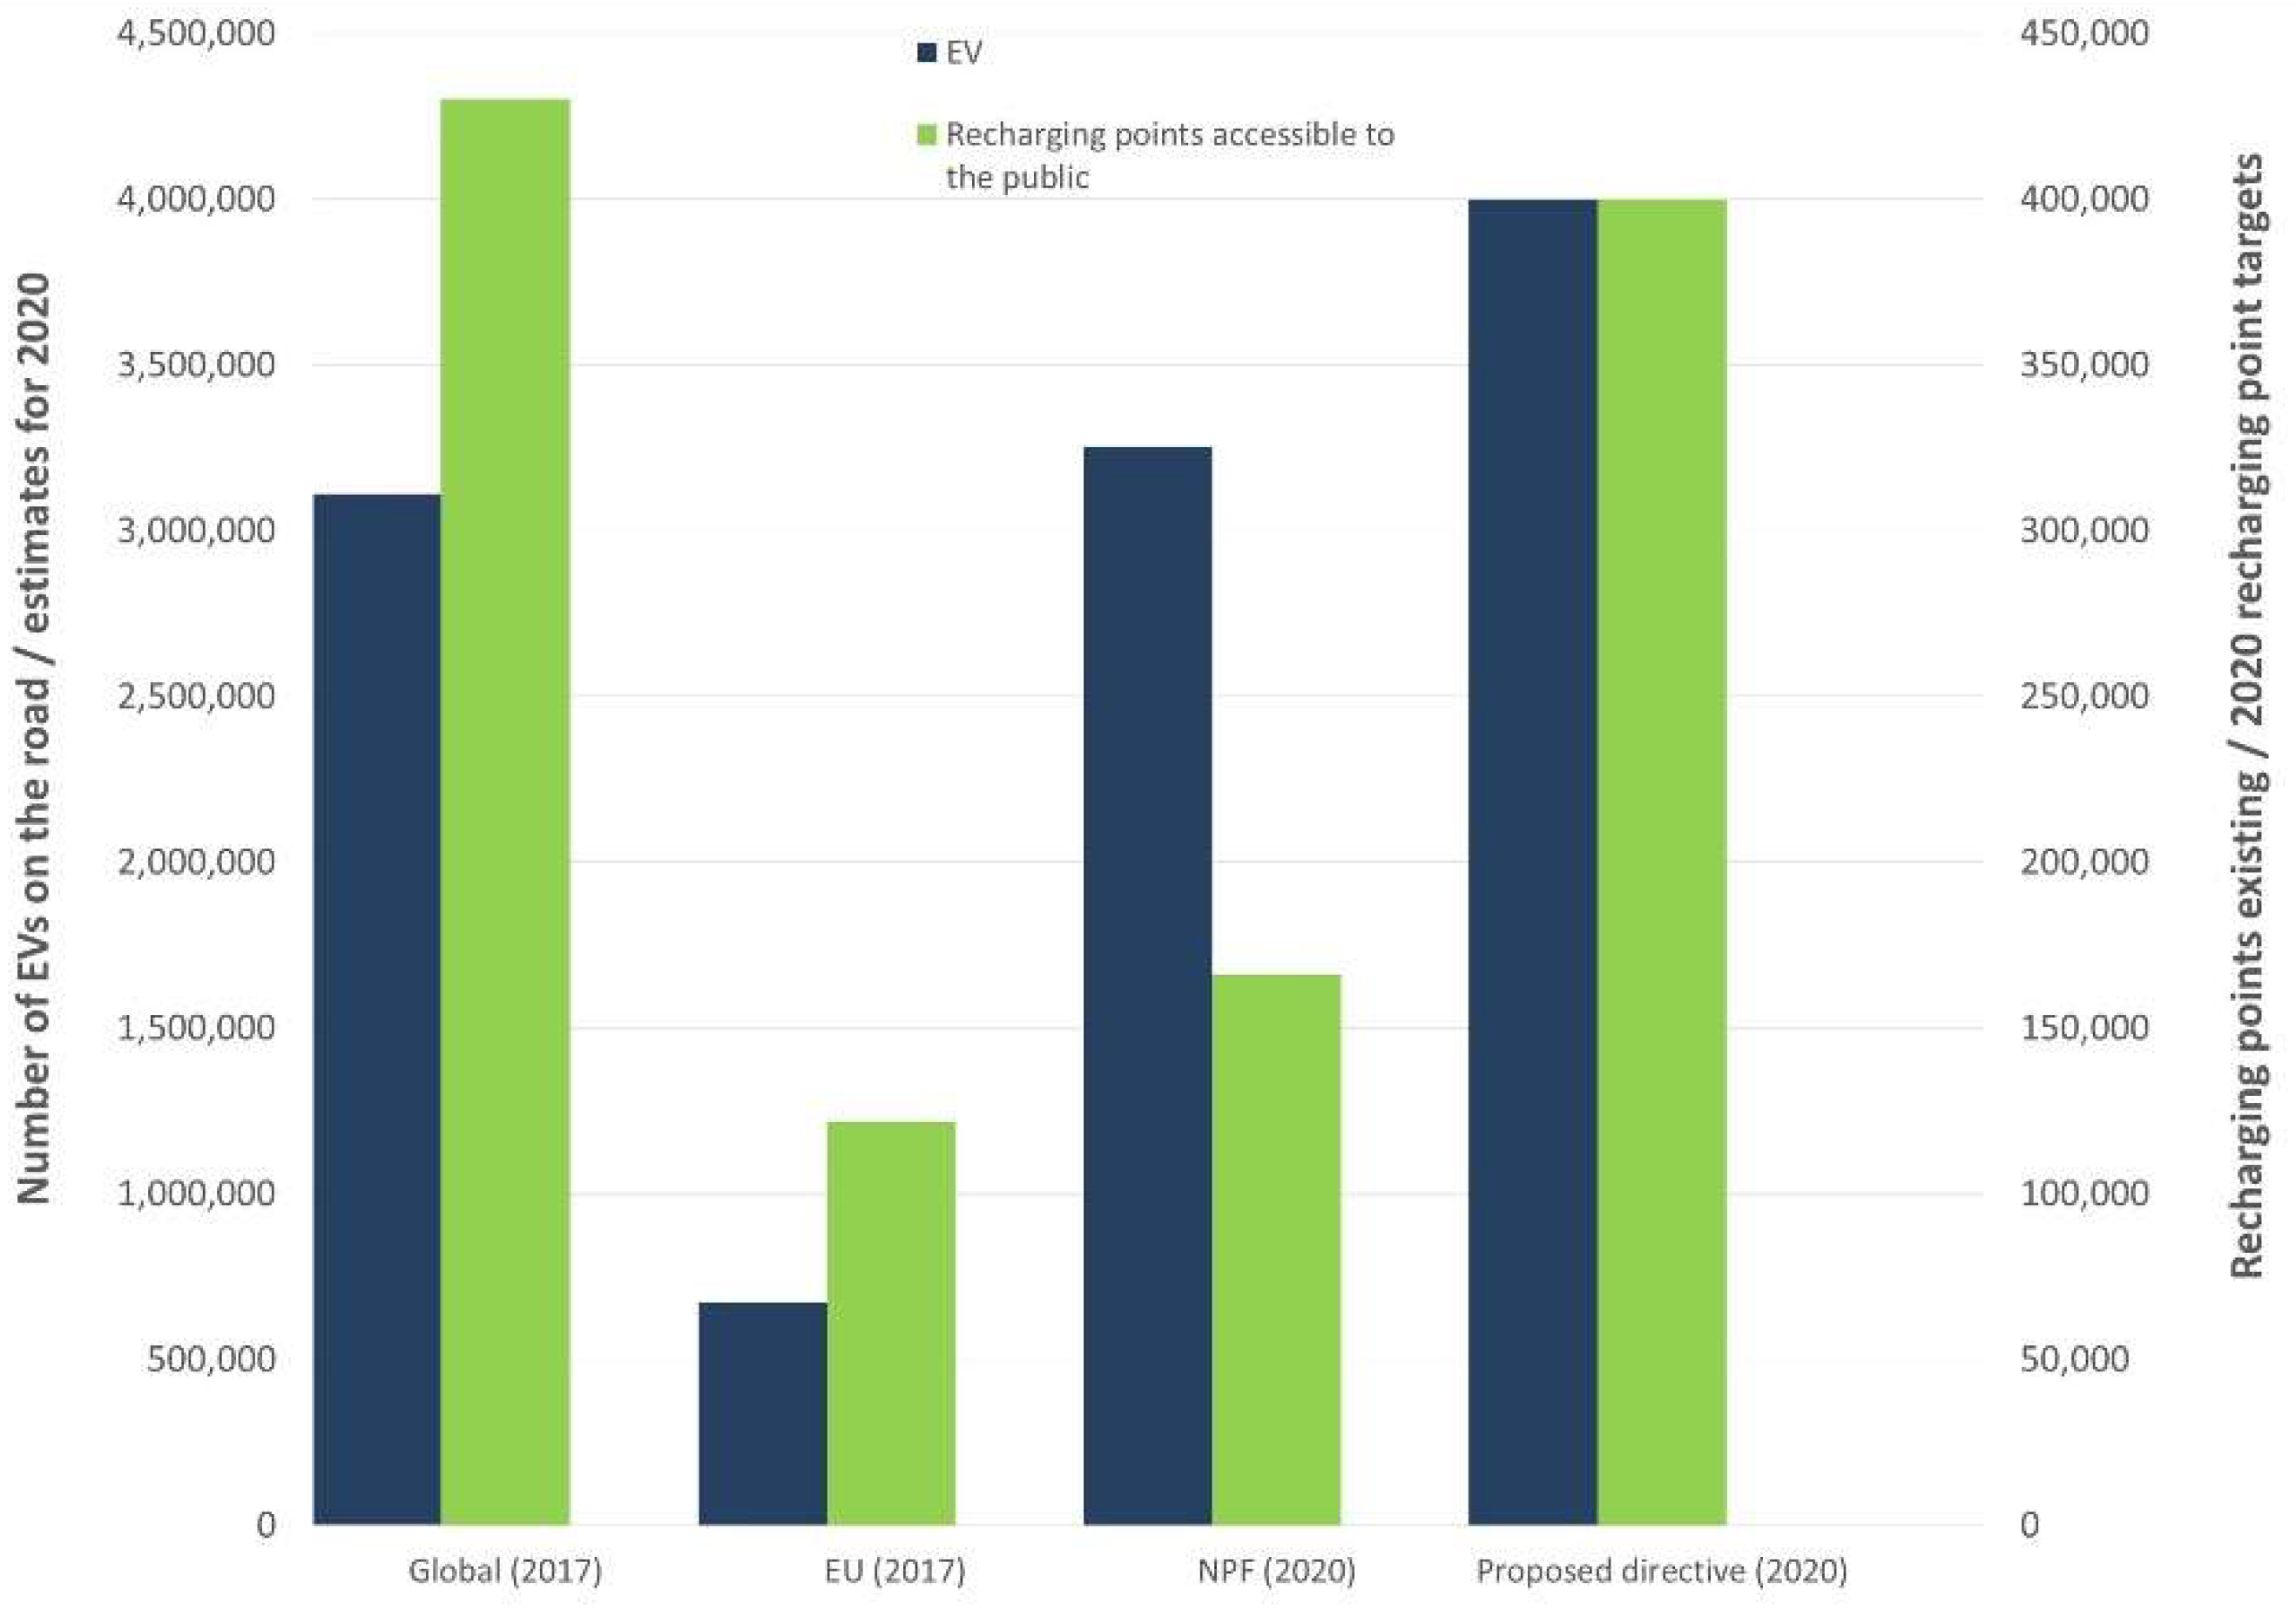
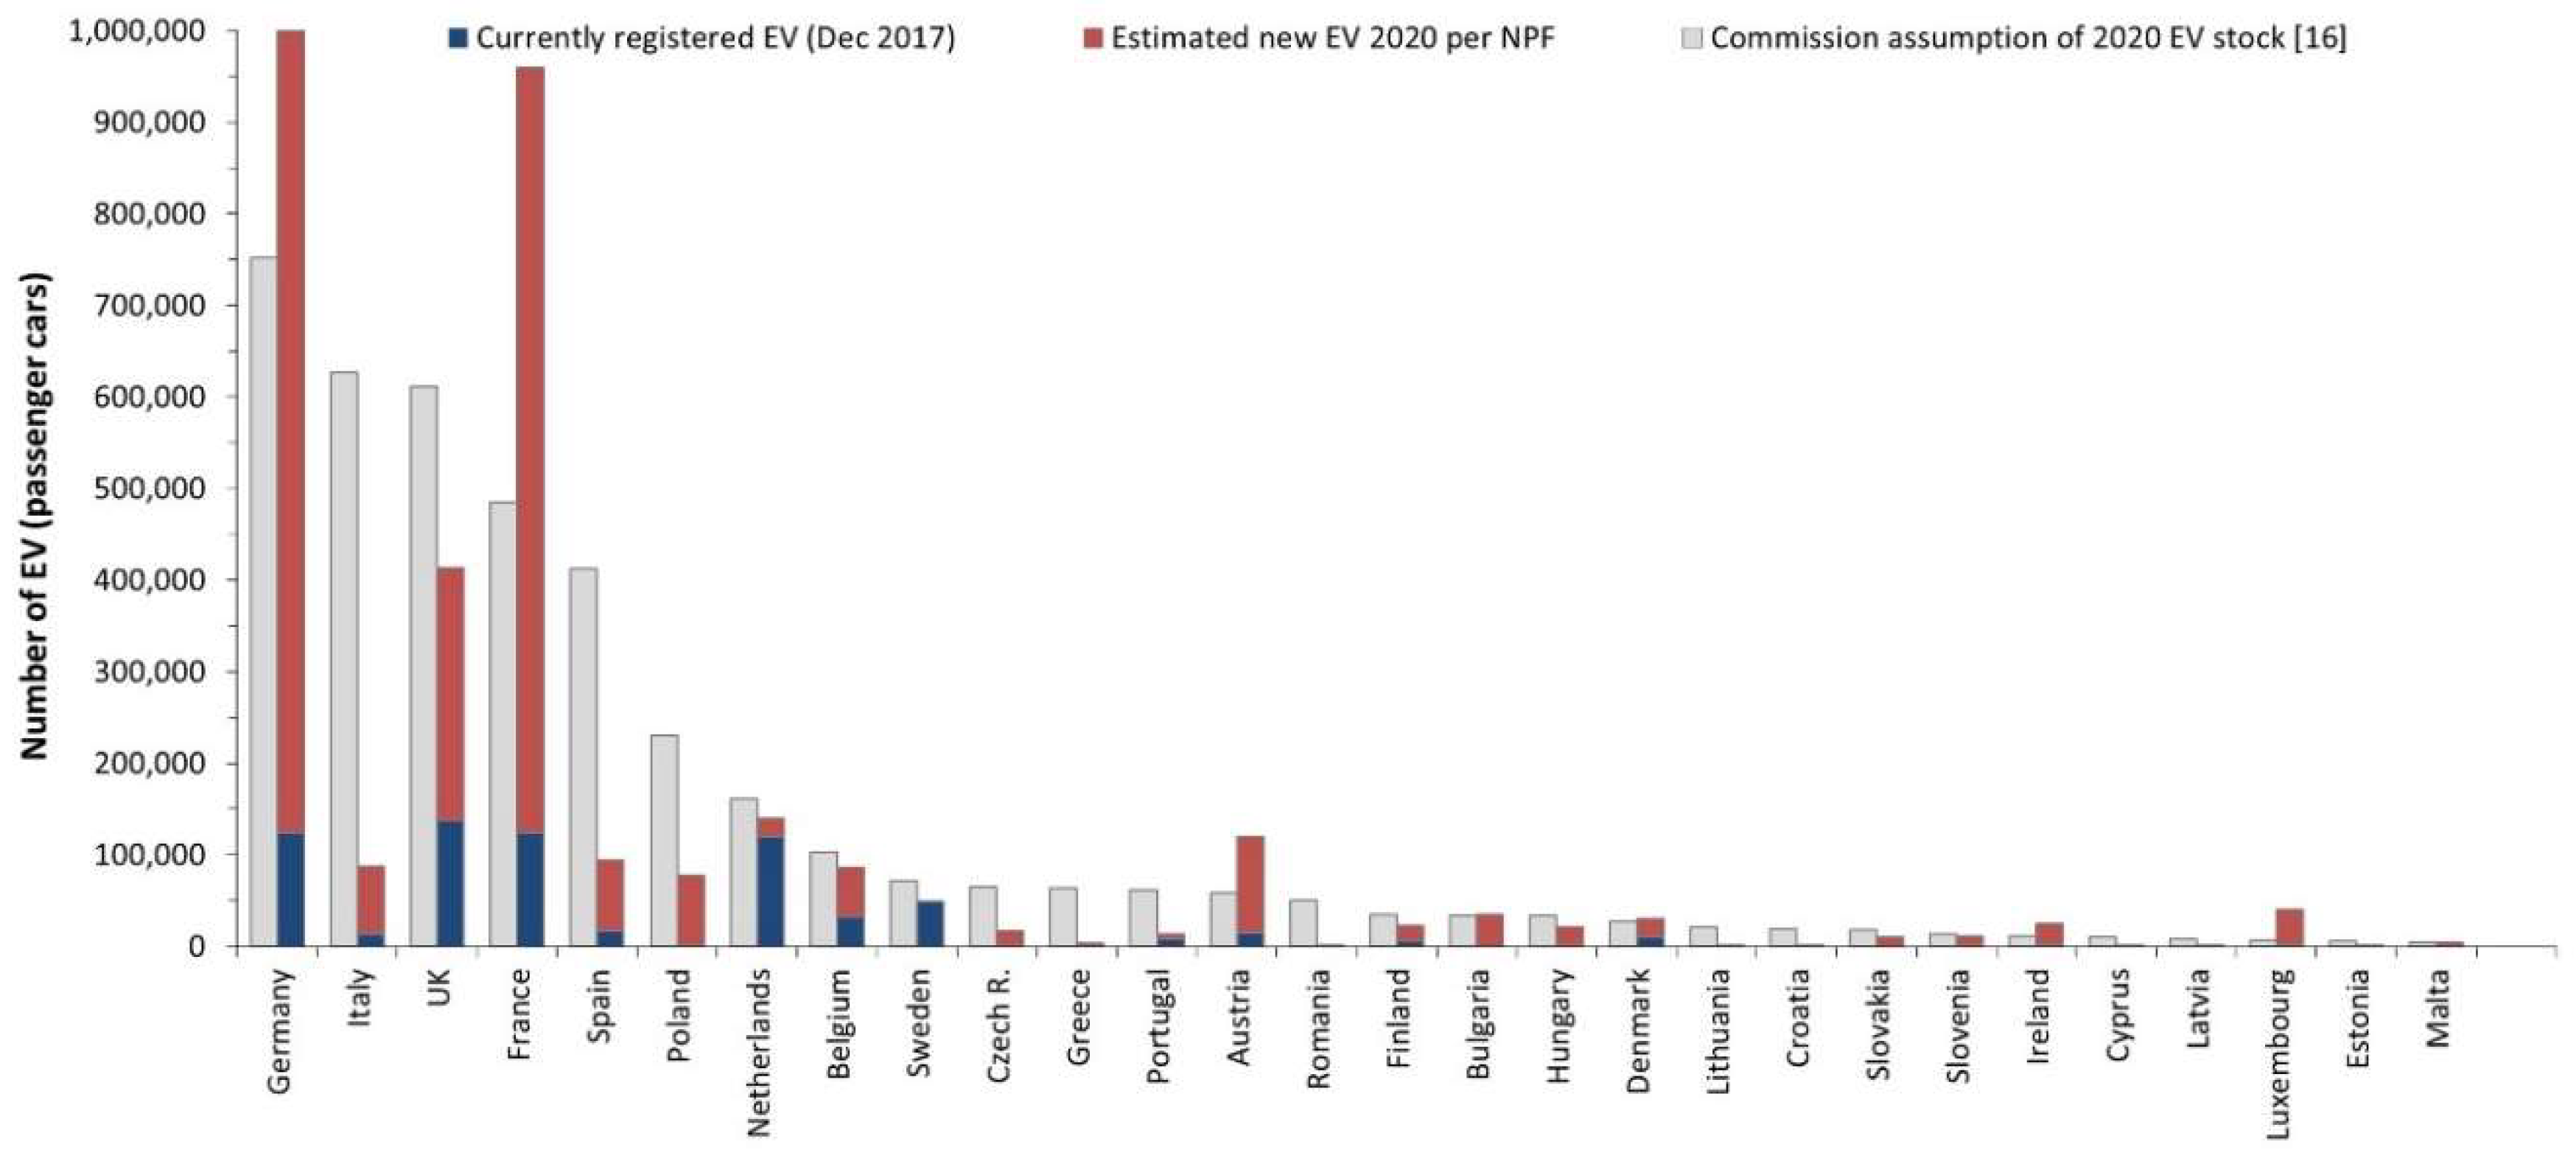
4.1. Recharging Infrastructure
4.2. Climate and Energy Impacts
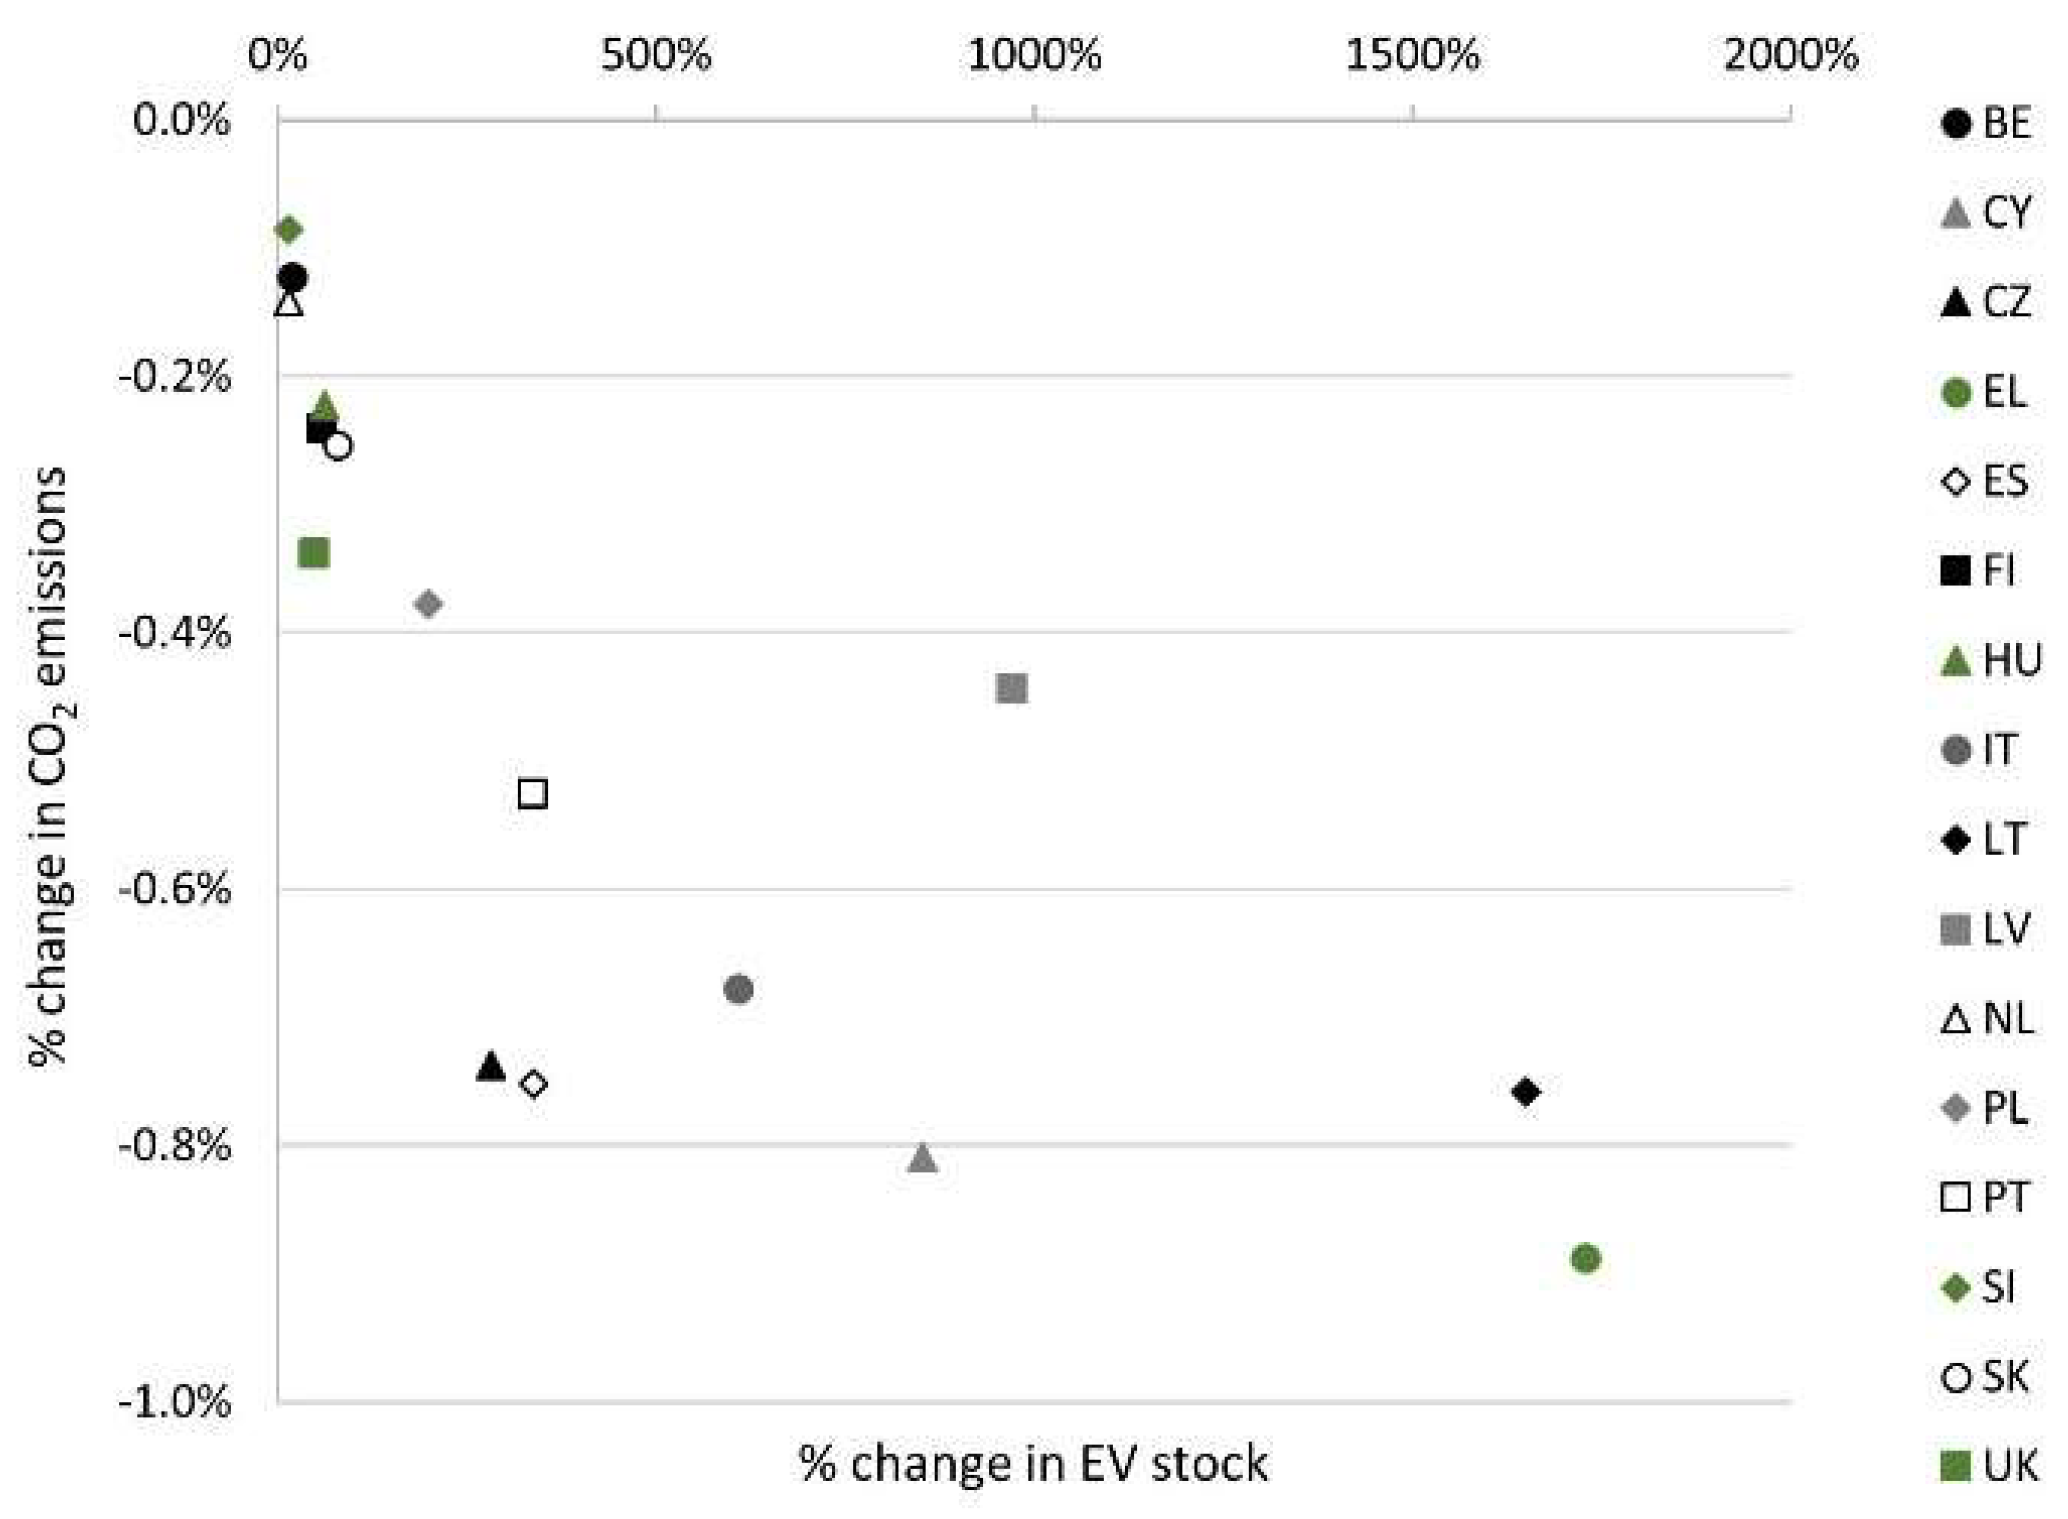
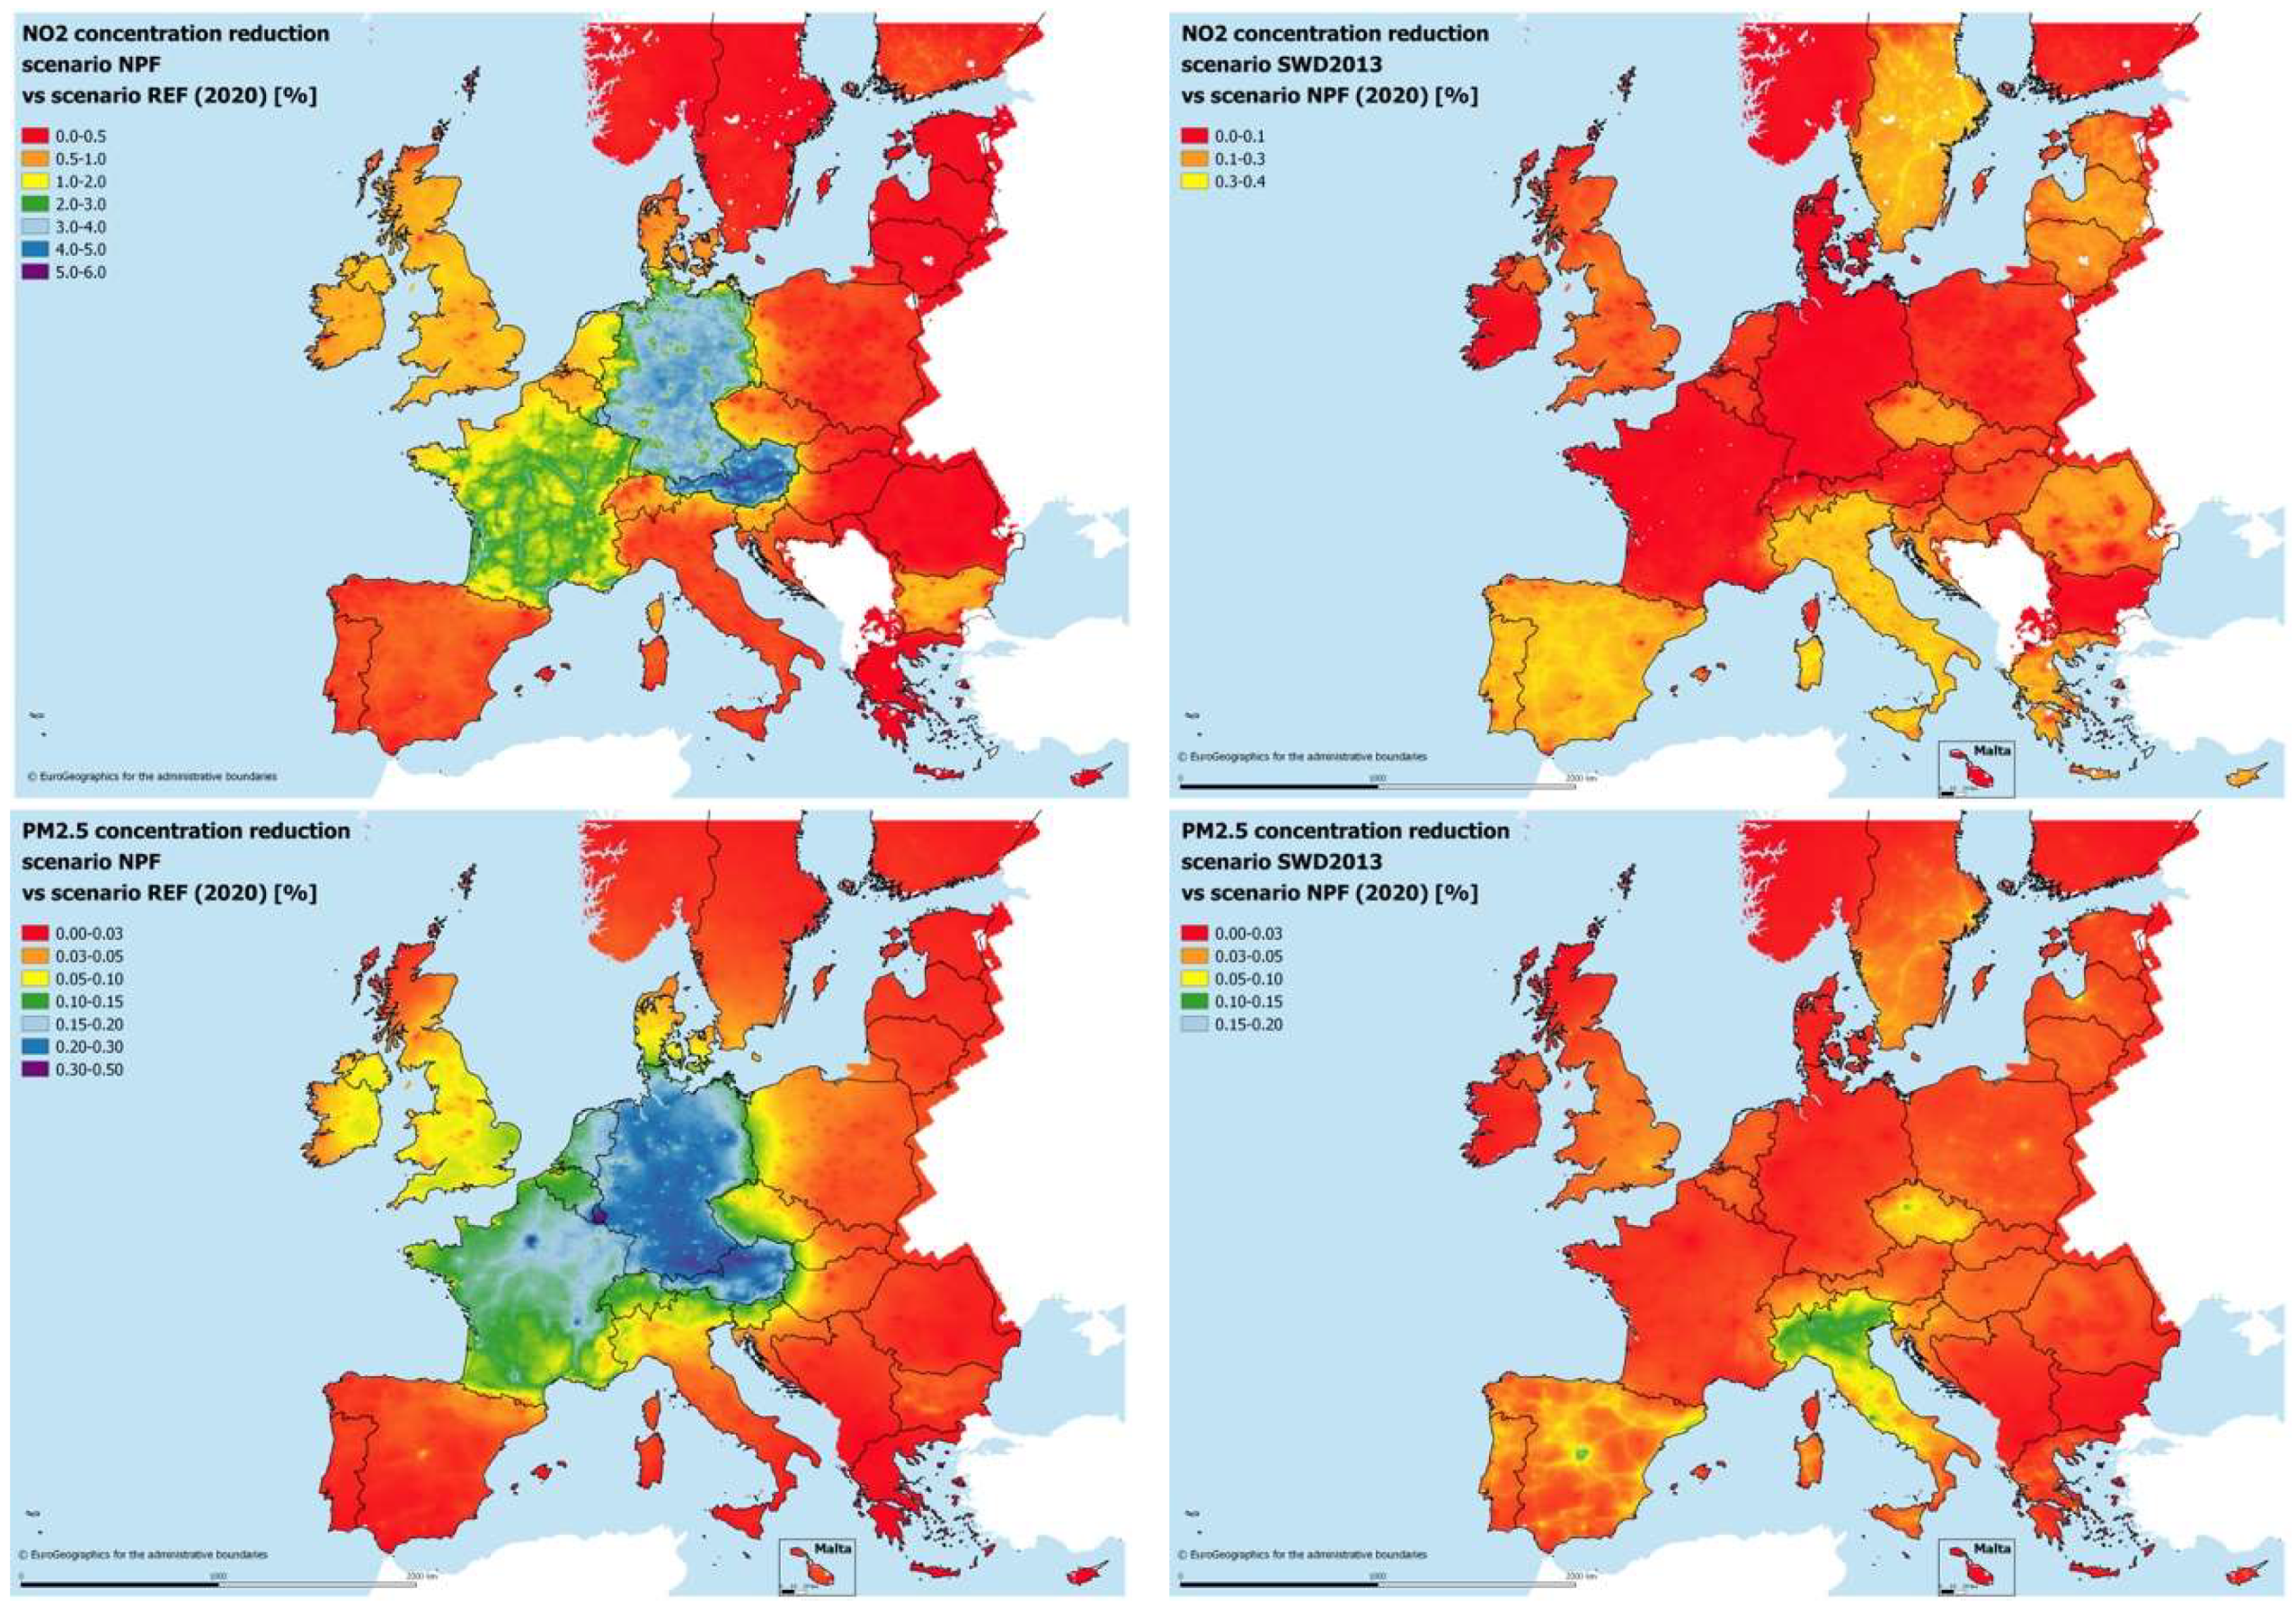
4.3. Air Quality Impacts
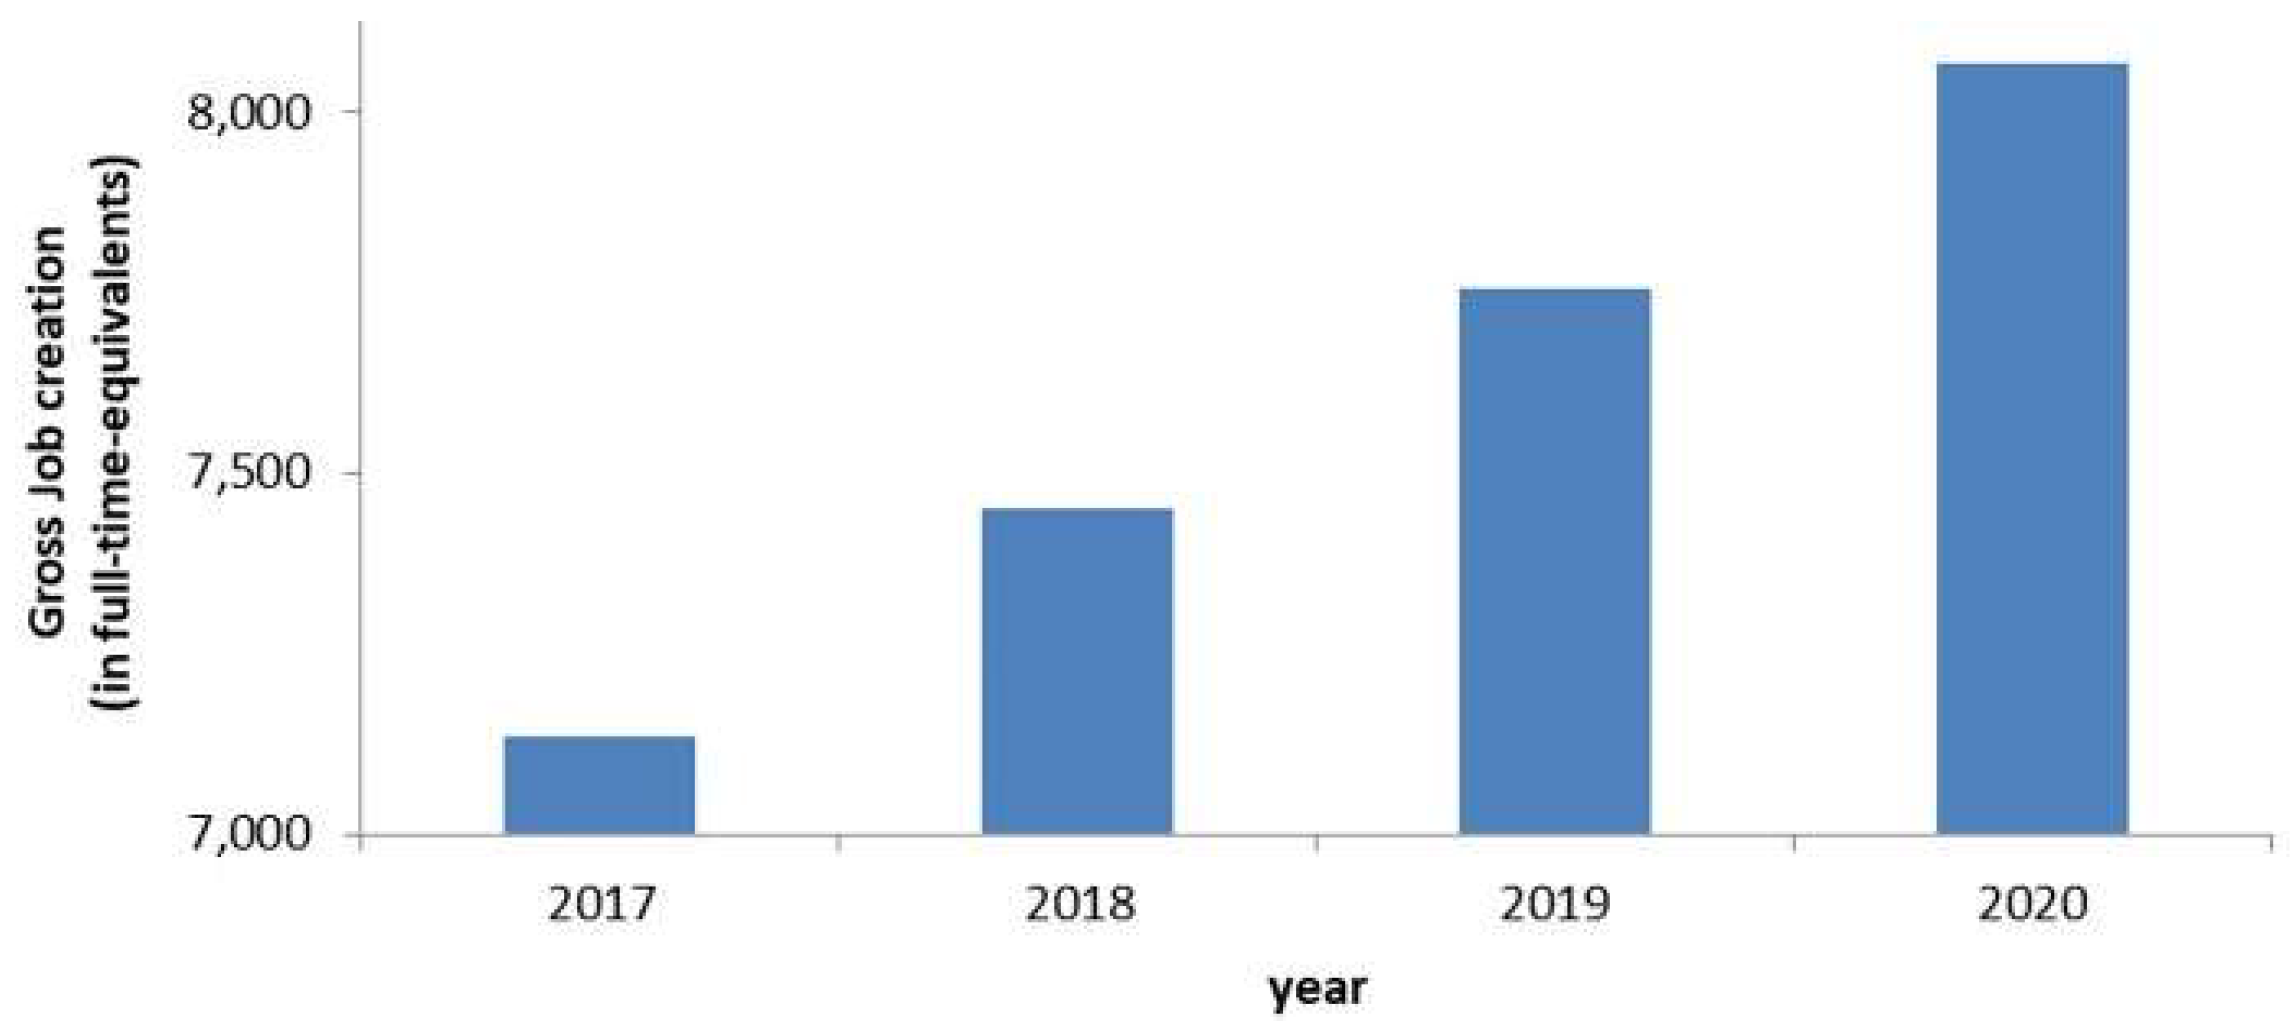
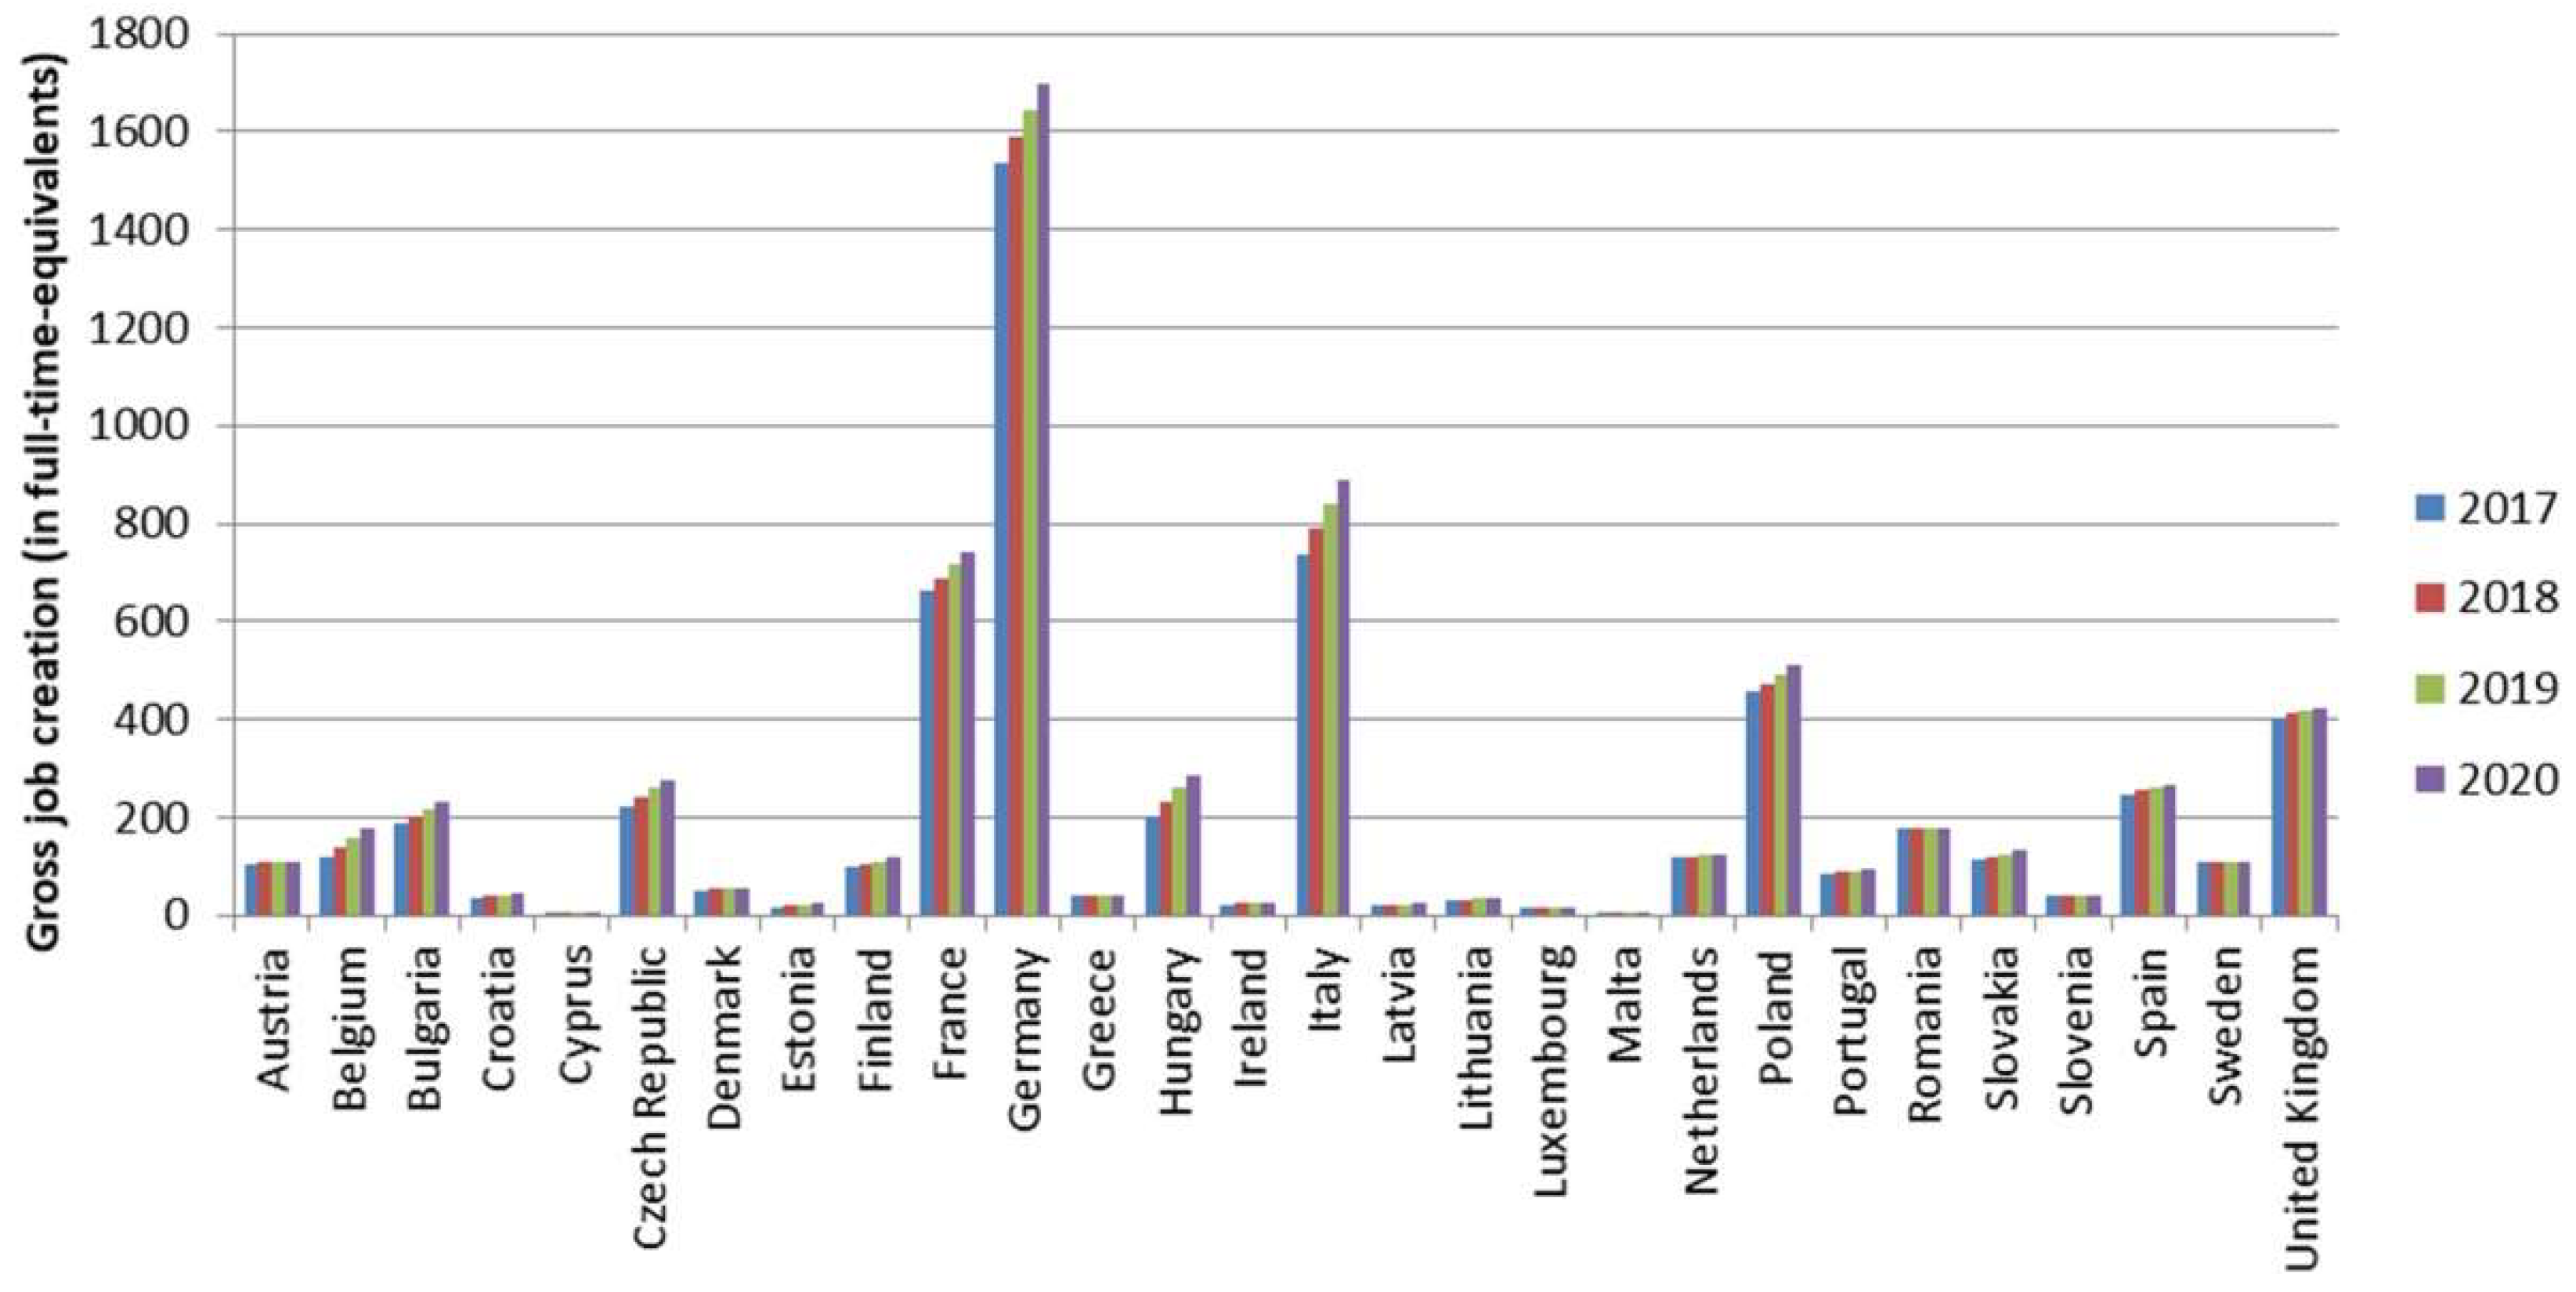
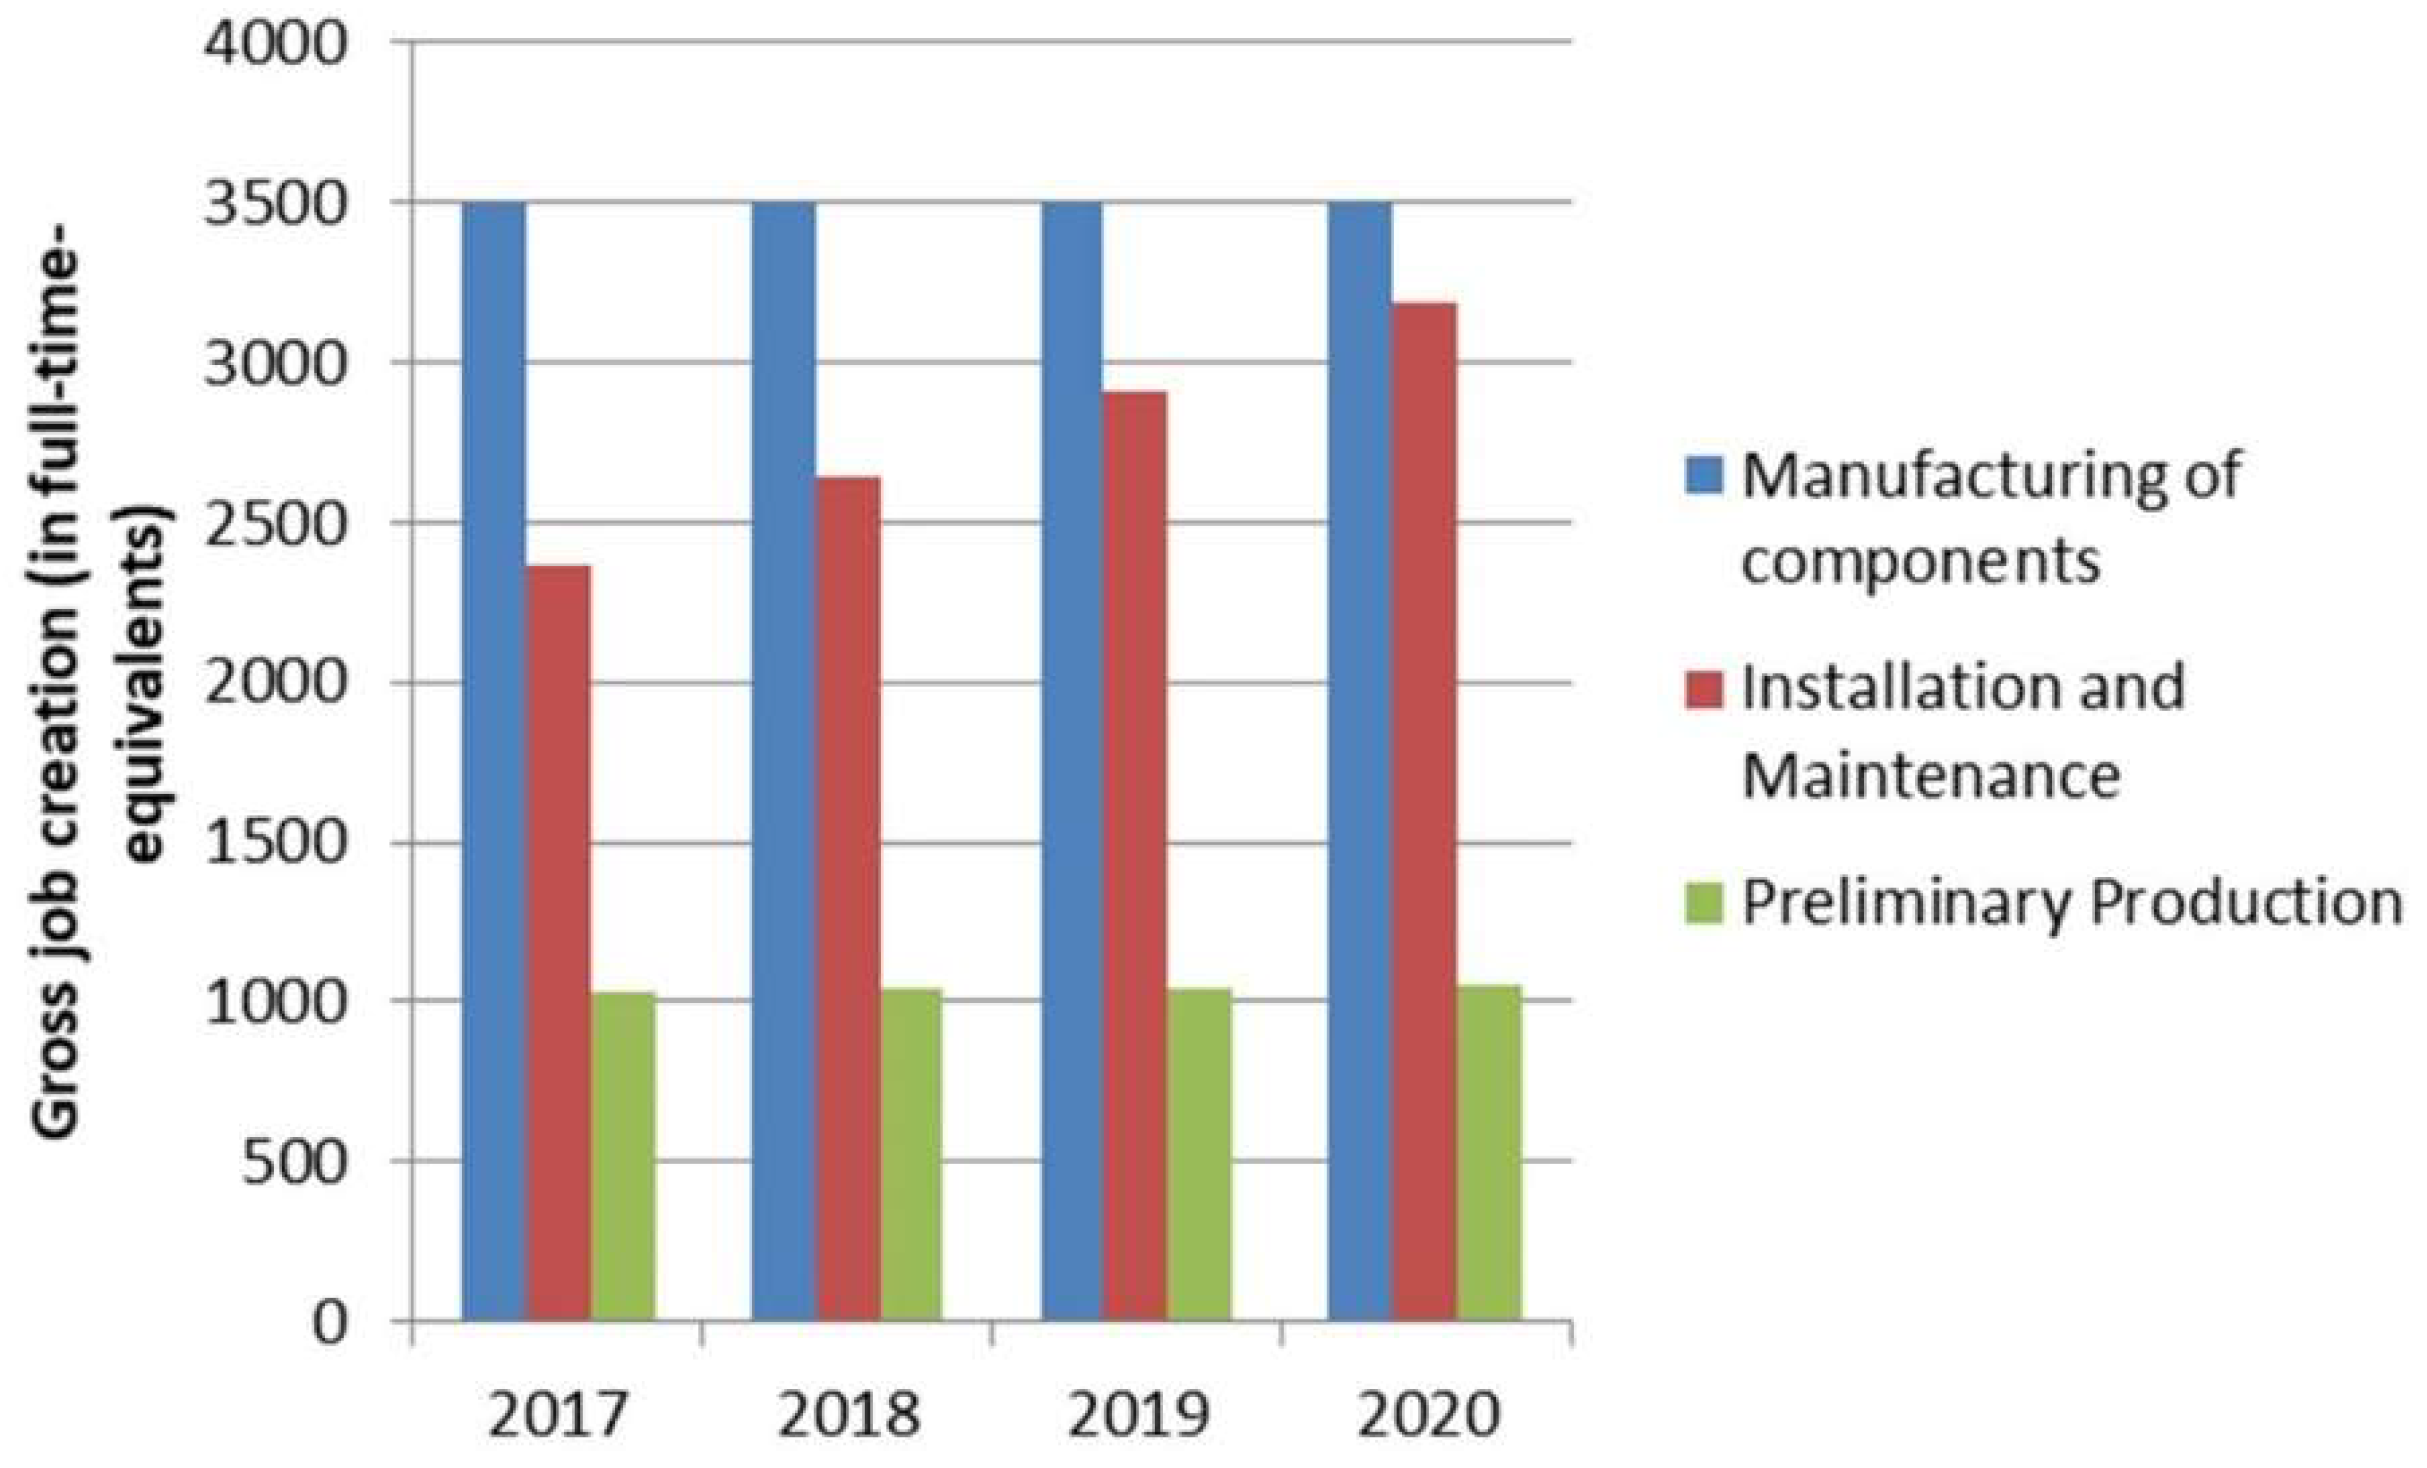
4.4. Job Impacts
5. Conclusions and Policy Implications
Author Contributions
Funding
Acknowledgments
Conflicts of Interest
Abbreviations
| AF | alternative fuels |
| AFI | alternative fuels infrastructure |
| AFV | alternative fuels vehicle |
| BAT | battery |
| CNG | compressed natural gas |
| CO2 | carbon dioxide |
| DIONE | fleet impact model, (DIONE is a name not an acronym) |
| E3MLab | Energy-Economy-Environment Modelling Laboratory |
| EC | European Commission |
| EE | employment effect |
| EU | European Union |
| EV | electric vehicle |
| GHG | greenhouse gas |
| GVA | gross value of production added |
| GVP | gross value of production |
| ICCS | Institute of Communication and Computer Systems |
| ICE | internal combustion engine |
| JRC | Joint Research Centre |
| LNG | liquefied natural gas |
| MS | member state |
| NACE | nomenclature statistique des activités économiques dans la communauté Européenne |
| NDI | normalised difference index |
| NO2 | nitrogen dioxide |
| NOx | nitrogen oxides |
| NPF | national policy framework |
| PM | particulate matter (PM2.5 is PM with a diameter of 2.5 μm or less) |
| PPM | primary particulate matter |
| PRIMES-TREMOVE | price-induced market equilibrium system (linked with transport model) |
| REF | reference scenario |
| RP | recharging point |
| SHERPA | screening for high emission reduction on air model |
| SWD | staff working document |
| TEN-T | Trans-European Transport Network |
| UK | United Kingdom |
| US | United States |
| VOC | volatile organic compounds |
| WtW | well-to-wheel |
Formula Parameters and Variables
| Infrastructure NDI | |
| Index | density of infrastructure |
| m, n | member state index |
| DIONE | |
| a,b,c,d,e | vehicle specific parameters |
| a1, c1, e1, λ1, μ1 | vehicle specific battery related parameters |
| F, FC | fuel consumption |
| iSOC | intial state of charge (of the battery) |
| r1, r2, r3, λ, μ | vehicle specific parameters |
| RANGEdynamic | all-electric range of a plug-in hybrid vehicle or range extender vehicle |
| v | velocity |
| x | distance travelled |
| SHERPA | |
| change in emissions (in comparison to the base case) due to a given policy | |
| change in average concentrations (in comparison to the base case) due to a given policy | |
| i, j | source and receptor cells |
| total number of source cells | |
| p | considered precursor emissions (NOx, VOC, NH3, PPM, SO2) |
| total number of precursors | |
| NOx | yearly emissions of nitrogen oxides |
| VOC | yearly emissions of volatile organic compounds |
| NH3 | yearly emissions of ammonia |
| PPM | yearly emissions of primary particulate matter |
| SO2 | yearly emissions of sulphur dioxide |
| NO2 | yearly average concentrations of nitrogen dioxides |
| PM2.5 | yearly average concentrations of particulate matter (diameter < 2.5 ) |
| SHERPA transfer coefficients (general formulation) | |
| SHERPA transfer coefficients (specific formulation) | |
| distances between sources (i) and receptors (j) | |
References
- European Commission. Communication: Delivering on Low-Emission Mobility; European Commission: Brussels, Belgium, 2017. [Google Scholar]
- European Commission. Communication: A Clean Planet for All—A European Strategic Long-Term Vision for a Prosperous, Modern, Competitive and Climate Neutral Economy; European Commission: Brussels, Belgium, 2018. [Google Scholar]
- European Commission. Communication: A European Strategy for Low-Emission Mobility; European Commission: Brussels, Belgium, 2016. [Google Scholar]
- European Union. Directive 2014/94/EU of the European Parliament and of the Council of 22 October 2014 on the Deployment of Alternative Fuels Infrastructure; European Union: Brussels, Belgium, 2014. [Google Scholar]
- Von Rosenstiel, D.P.; Heuermann, D.F.; Hüsig, S. Why has the introduction of natural gas vehicles failed in Germany?—Lessons on the role of market failure in markets for alternative fuel vehicles. Energy Policy 2015, 78, 91–101. [Google Scholar] [CrossRef]
- Melendez, M.; Theis, K.; Johnson, C. Lessons Learned from the Alternative Fuels Experience and How They Apply to the Development of a Hydrogen-Fueled Transportation System; Technical Report NREL/TP-560-40753; National Renewable Energy: Golden, CO, USA, 2007. [Google Scholar]
- Liao, F.; Molin, E.; van Wee, B. Consumer preferences for electric vehicles:A literature review. Transp. Rev. 2016, 3, 252–275. [Google Scholar]
- Hardman, S.; Jenn, A.; Tal, G.; Axsen, J.; Beard, G.; Daina, N.; Figenbaum, E.; Jakobsson, N.; Jochem, P.; Kinnear, N.; et al. A review of consumer preferences of and interactions with electric vehicle charging infrastructure. Transp. Res. Part D Transp. Environ. 2018, 62, 508–523. [Google Scholar] [CrossRef] [Green Version]
- Santini, D.J. Electric vehicle waves of history: Lessons learned about market deployment of electric vehicles. In Electric Vehicles—The Benefits and Barriers; Soylu, S., Ed.; IntechOpen: Rijeka, Croatia, 2011. [Google Scholar]
- Lucas, A.; Prettico, G.; Flammini, M.; Kotsakis, E.; Fulli, G.; Masera, M. Indicator-based methodology for assessing EV charging infrastructure using exploratory data analysis. Energies 2018, 11, 1869. [Google Scholar] [CrossRef]
- Singh, M.; Kumar, P.; Kar, I. A multi charging station for electric vehicles and its utilization for load management and the grid support. IEEE Trans. Smart Grid 2013, 4, 1026–1037. [Google Scholar] [CrossRef]
- Kong, Q.; Fowler, M.; Entchev, E.; Ribberink, H.; McCallum, R. The role of charging infrastructure in electric vehicle implementation within smart grids. Energies 2018, 11, 3362. [Google Scholar] [CrossRef]
- Hernández, J.C.; Sanchez-Sutil, F.; Vidal, P.G.; Rus-Casas, C. Primary frequency control and dynamic grid support for vehicle-to-grid in transmission systems. Int. J. Electr. Power Energy Syst. 2018, 100, 152–166. [Google Scholar] [CrossRef]
- Monteiro, V.; Afonso, J.A.; Ferreira, J.C.; Afonso, J.L. Vehicle electrification: New challenges and opportunities for smart grids. Energies 2019, 12, 118. [Google Scholar] [CrossRef]
- Canizes, B.; Soares, J.; Vale, Z.; Corchado, J.M. Optimal distribution grid operation using DLMP-based pricing for electric vehicle charging infrastructure in a smart city. Energies 2019, 12, 686. [Google Scholar] [CrossRef]
- Ruiz-Rodriguez, F.J.; Hernández, J.C.; Jurado, F. Voltage behaviour in radial distribution systems under the uncertainties of photovoltaic systems and electric vehicle charging loads. Int. Trans. Electr. Energ. Syst. 2018, 28, e2490. [Google Scholar] [CrossRef]
- Hernández, J.C.; Ruiz-Rodríguez, F.J.; Jurado, F. Modelling and assessment of the combined technical impact of electric vehicles and photovoltaic generation in radial distribution systems. Energy 2017, 141, 316–332. [Google Scholar]
- Ruiz-Rodríguez, F.J.; Hernández, J.C.; Jurado, F. Probabilistic load-flow analysis of biomass-fuelled gas engines with electrical vehicles in distribution systems. Energies 2017, 10, 1536. [Google Scholar]
- Lopes, J.A.P.; Soares, F.J.; Almeida, P.M.R. Integration of electric vehicles in the electric power system. Proc. IEEE 2011, 99, 168–183. [Google Scholar] [CrossRef]
- López, M.A.; de la Torre, S.; Martín, S.; Aguado, J.A. Demand-side management in smart grid operation considering electric vehicles load shifting and vehicle-to-grid support. Int. J. Electr. Power Energy Syst. 2015, 64, 689–698. [Google Scholar] [CrossRef]
- Garcia, R.; Freire, F. A review of fleet-based life-cycle approaches focusing on energy and environmental impacts of vehicles. Renew. Sustain. Energy Rev. 2017, 79, 935–945. [Google Scholar] [CrossRef]
- Thiel, C.; Nijs, W.; Simoes, S.; Schmidt, J.; van Zyl, A.; Schmid, E. The impact of the EU car CO2 regulation on the energy system and the role of electro-mobility to achieve transport decarbonisation. Energy Policy 2016, 96, 153–166. [Google Scholar] [CrossRef]
- Schnell, J.L.; Naik, V.; Horowitz, L.W.; Paulot, F.; Ginoux, P.; Zhao, M.; Horton, D.E. Air quality impacts from the electrification of light-duty passenger vehicles in the United States. Atmos. Environ. 2019, 208, 95–102. [Google Scholar] [CrossRef]
- Popa, M.E.; Segers, A.J.; Denier van der Gon, H.A.C.; Krol, M.C.; Visschedijk, A.J.H.; Schaap, M.; Röckmann, T. Impact of a future H2 transportation on atmospheric pollution in Europe. Atmos. Environ. 2015, 113, 208–222. [Google Scholar] [CrossRef]
- European Commission. Proposal for a Directive of the European Parliament and of the Council on the Deployment of Alternative Fuels Infrastructure; European Commission: Brussels, Belgium, 2013. [Google Scholar]
- European Commission. Impact Assessment Accompanying the Document Proposal for a Directive of the European Parliament and of the Council on the Deployment of Alternative Fuels Infrastructure; European Commission: Brussels, Belgium, 2013. [Google Scholar]
- European Commission. Staff Working Document—Detailed Assessment of the National Policy Frameworks; European Commission: Brussels, Belgium, 2017. [Google Scholar]
- Viesi, D.; Crema, L.; Testi, M. The Italian hydrogen mobility scenario implementing the European directive on alternative fuels infrastructure (DAFI 2014/94/EU). Int. J. Hydrogen Energy 2017, 42, 27354–27373. [Google Scholar] [CrossRef]
- European Commission. Staff Working Document—Report on the Assessment of the Member States National Policy Frameworks for the Development of the Market as Regards Alternative Fuels in the Transport Sector and the Deployment of the Relevant Infrastructure Pursuant to Article 10 (2) of Directive 2014/94/EU; European Commission: Brussels, Belgium, 2019. [Google Scholar]
- Capros, P.; Siskos, P. PRIMES-TREMOVE Transport Model v3—Model Description; National Technical University of Athens, Institute of Communication and Computer Systems (ICCS), Energy-Economy-Environment Modelling Laboratory (E3MLab): Athens, Greece, 2011. [Google Scholar]
- European Union. EU Reference Scenario 2016—Energy, Transport and GHG Emissions—Trends to 2050; Publications Office of the European Union: Luxembourg, 2016; ISBN 978-92-79-52374-8. [Google Scholar] [CrossRef]
- EMEP/EEA. Air Pollutant Emission Inventory Guidebook, European Environment Agency. 2016. Available online: https://www.eea.europa.eu/publications/emep-eea-guidebook-2016 (accessed on 3 July 2018).
- European Commission. Impact Assessment Accompanying the Document Proposal for a Regulation of the European Parliament and of the Council Setting Emission Performance Standards for New Passenger Cars and for New Light Commercial Vehicles as Part of the Union’s Integrated Approach to Reduce C2 Emissions from Light-Duty Vehicles and Amending Regulation (EC) No 715/2007 (recast); European Commission: Brussels, Belgium, 2017. [Google Scholar]
- Krause, J.; Donati, A.V.; Thiel, C. Light Duty Vehicle CO2 Emission Reduction Cost Curves and Cost Assessment—The DIONE Model; JRC Science for Policy Report EUR28821; Publications Office of the European Union: Luxembourg, 2017. [Google Scholar]
- Thiel, C.; Drossinos, I.; Krause, J.; Harrison, G.; Gkatzoflias, D.; Donati, A. Modelling electro-mobility: An integrated modelling platform for assessing European policies. Trans. Res. Procedia 2016, 14, 2544–2553. [Google Scholar] [CrossRef]
- Harrison, G.; Krause, J.; Thiel, C. Transitions and impacts of passenger car powertrain technologies in European member states. Trans. Res. Procedia 2016, 14, 2620–2629. [Google Scholar] [CrossRef]
- Thunis, P.; Degraeuwe, B.; Pisoni, E.; Ferrari, F.; Clappier, A. On the design and assessment of regional air quality plans: The SHERPA approach. J. Environ. Manag. 2016, 183, 952–958. [Google Scholar] [CrossRef] [PubMed]
- Pisoni, E.; Clappier, A.; Degraeuwe, B.; Thunis, P. Adding spatial flexibility to source-receptor relationships for air quality modeling. Environ. Model. Softw. 2017, 90, 68–77. [Google Scholar] [CrossRef] [PubMed]
- Thunis, P.; Pisoni, E.; Degraeuwe, B.; Kranenburg, R.; Schaap, M.; Clappier, A. Dynamic evaluation of air quality models over European regions. Atmos. Environ. 2015, 111, 185–194. [Google Scholar] [CrossRef]
- Ortega, M.; del Río, P.; Ruiz, P.; Thiel, C. Employment effects of renewable electricity deployment. A novel methodology. Energy 2015, 91, 940–951. [Google Scholar] [CrossRef]
- European Alternative Fuels Observatory. Available online: www.eafo.eu (accessed on 30 August 2018).
- International Energy Agency. Global EV Outlook 2018—Towards Cross-Modal Electrification; International Energy Agency: Paris, France, 2018. [Google Scholar]
- Gómez Vilchez, J.J.; Julea, A.; Peduzzi, E.; Pisoni, E.; Krause, J.; Siskos, P.; Thiel, C. Modelling the impacts of EU countries’ electric car deployment plans on atmospheric emissions and concentrations. Eur. Trans. Res. Rev. under review.
- European Commission. Communication: Towards the Broadest Use of Alternative Fuels—An Action Plan on Alternative Fuels Infrastructure; European Commission: Brussels, Belgium, 2017. [Google Scholar]
- Council of the European Union; European Parliament. Regulation (EU) No 333/2014 of the European Parliament and of the Council of 11 March 2014 amending Regulation (EC) No 443/2009 to define the modalities for reaching the 2020 target to reduce CO2 emissions from new passenger cars. Off. J. Eur. Union 2014, 103, 15–19. [Google Scholar]
- Harrison, G.; Thiel, C. An exploratory policy analysis of electric vehicle sales competition and sensitivity to infrastructure in Europe. Technol. Forecast. Soc. Chang. 2017, 114, 165–178. [Google Scholar] [CrossRef]


| Sector | Fabricated Metal Products, except Machinery and Equipment | Computer, Electronic and Optical Products | Electrical Equipment | Machinery and Equipment | Repair and Installation Services of Machinery and Equipment | Constructions and Construction Works |
|---|---|---|---|---|---|---|
| NACE Sector Number | C25 | C26 | C27 | C28 | C33 | F |
| Impact in the Transport Sector | NPF vs. REF * | SWD2013 ** vs. NPF |
|---|---|---|
| Reduction of fossil oil-based fuels and related CO2 emissions | 0.4% | 0.2% |
| Reduction of NOx emissions | 0.37% | 0.09% |
| Reduction of PM2.5 emissions | 0.44% | 0.11% |
© 2019 by the authors. Licensee MDPI, Basel, Switzerland. This article is an open access article distributed under the terms and conditions of the Creative Commons Attribution (CC BY) license (http://creativecommons.org/licenses/by/4.0/).
Share and Cite
Thiel, C.; Julea, A.; Acosta Iborra, B.; De Miguel Echevarria, N.; Peduzzi, E.; Pisoni, E.; Gómez Vilchez, J.J.; Krause, J. Assessing the Impacts of Electric Vehicle Recharging Infrastructure Deployment Efforts in the European Union. Energies 2019, 12, 2409. https://doi.org/10.3390/en12122409
Thiel C, Julea A, Acosta Iborra B, De Miguel Echevarria N, Peduzzi E, Pisoni E, Gómez Vilchez JJ, Krause J. Assessing the Impacts of Electric Vehicle Recharging Infrastructure Deployment Efforts in the European Union. Energies. 2019; 12(12):2409. https://doi.org/10.3390/en12122409
Chicago/Turabian StyleThiel, Christian, Andreea Julea, Beatriz Acosta Iborra, Nerea De Miguel Echevarria, Emanuela Peduzzi, Enrico Pisoni, Jonatan J. Gómez Vilchez, and Jette Krause. 2019. "Assessing the Impacts of Electric Vehicle Recharging Infrastructure Deployment Efforts in the European Union" Energies 12, no. 12: 2409. https://doi.org/10.3390/en12122409
APA StyleThiel, C., Julea, A., Acosta Iborra, B., De Miguel Echevarria, N., Peduzzi, E., Pisoni, E., Gómez Vilchez, J. J., & Krause, J. (2019). Assessing the Impacts of Electric Vehicle Recharging Infrastructure Deployment Efforts in the European Union. Energies, 12(12), 2409. https://doi.org/10.3390/en12122409