Effect of Filler Concentration on Tracking Resistance of ATH-Filled Silicone Rubber Nanocomposites

Abstract
:1. Introduction
2. Material Preparation and Characterization Methods
2.1. Material Preparation
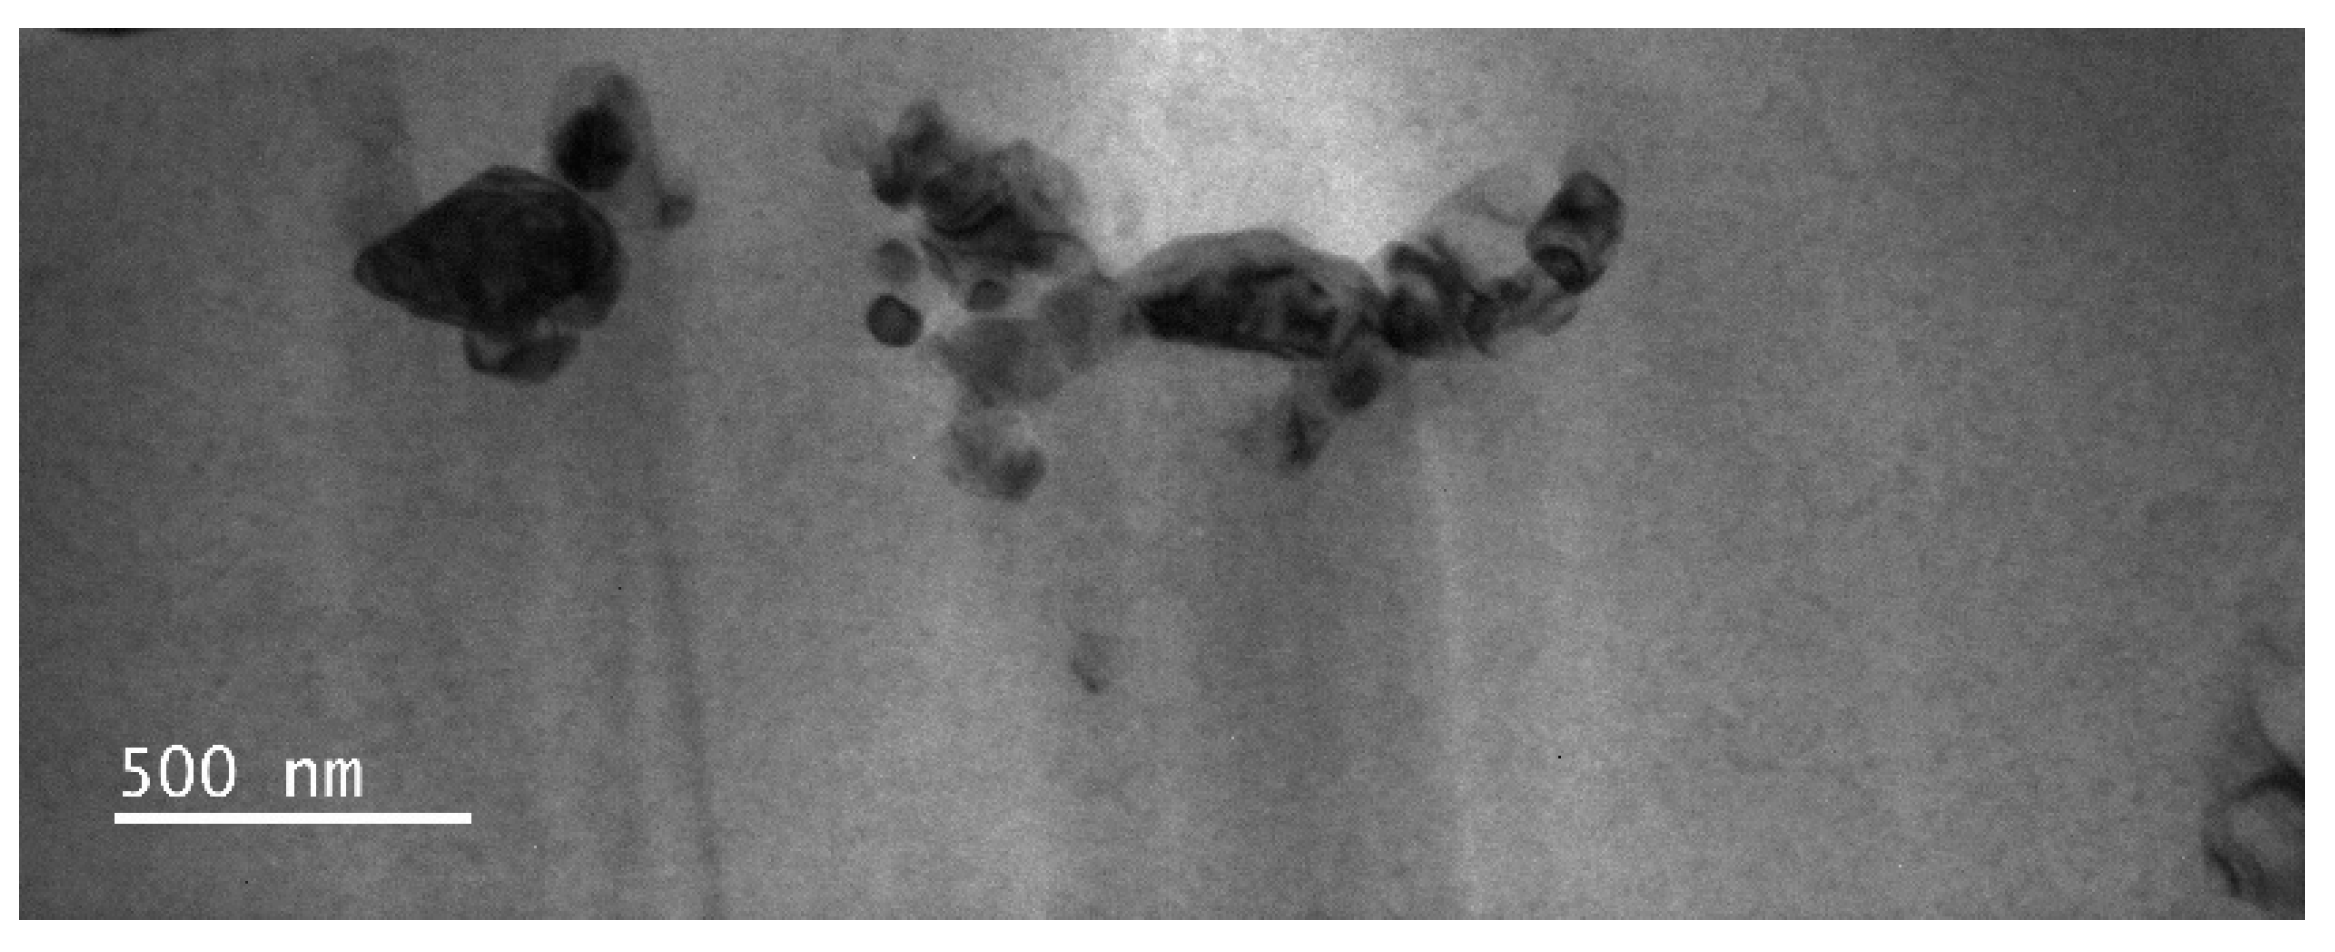
2.2. Transmission Electron Microscopy (TEM)
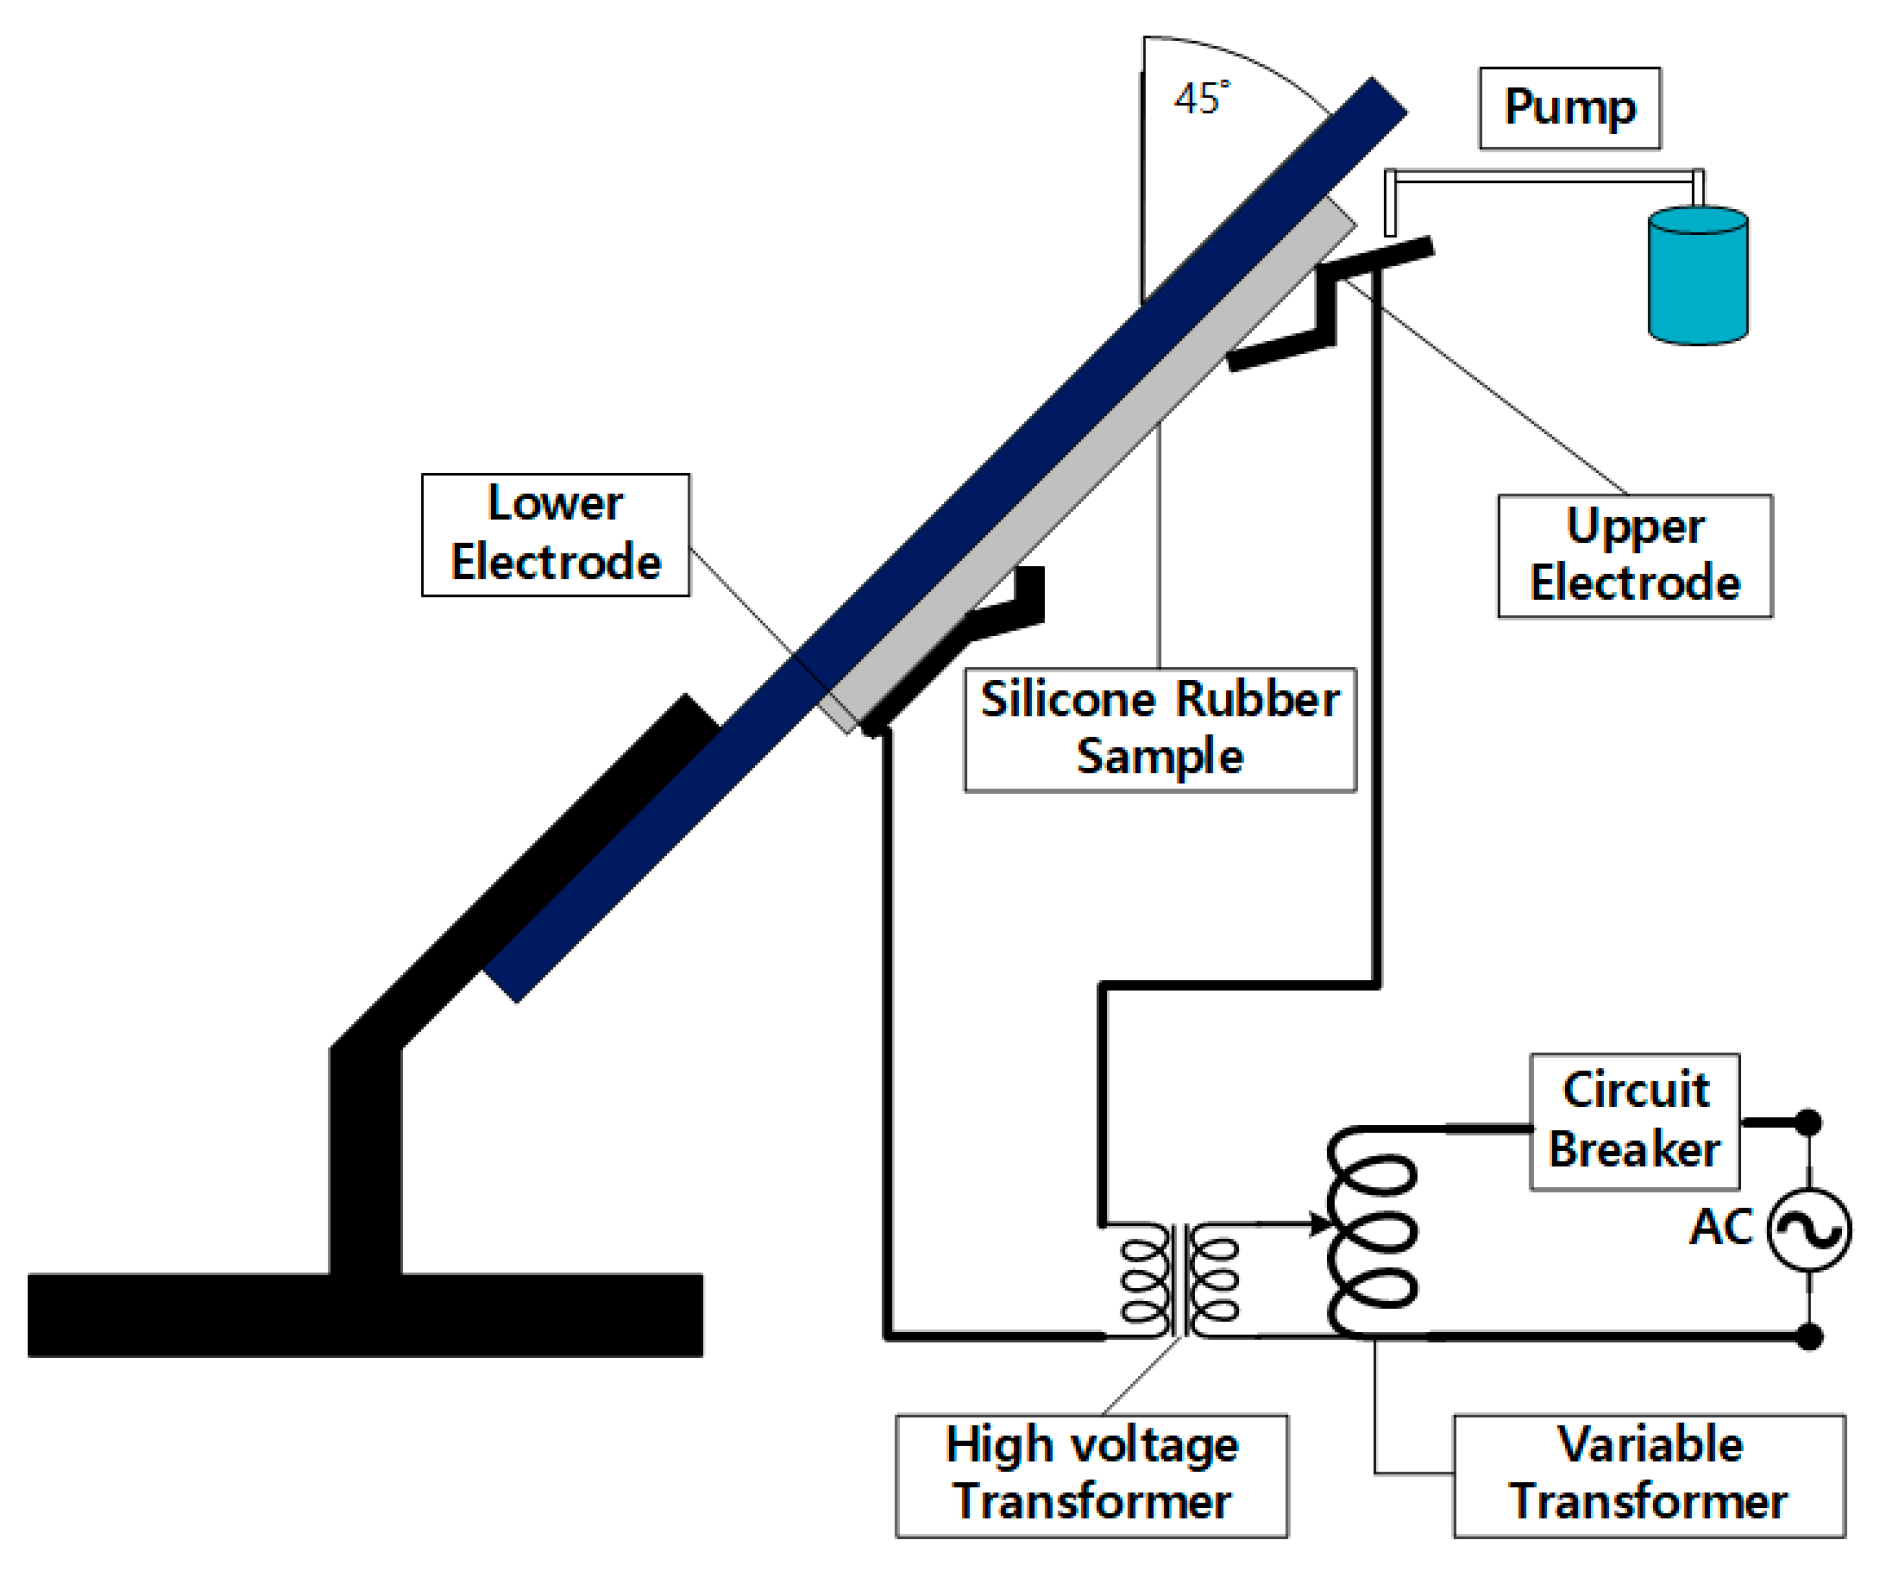
2.3. Inclined Plane Test (IPT)
2.4. Surface Contact Angle
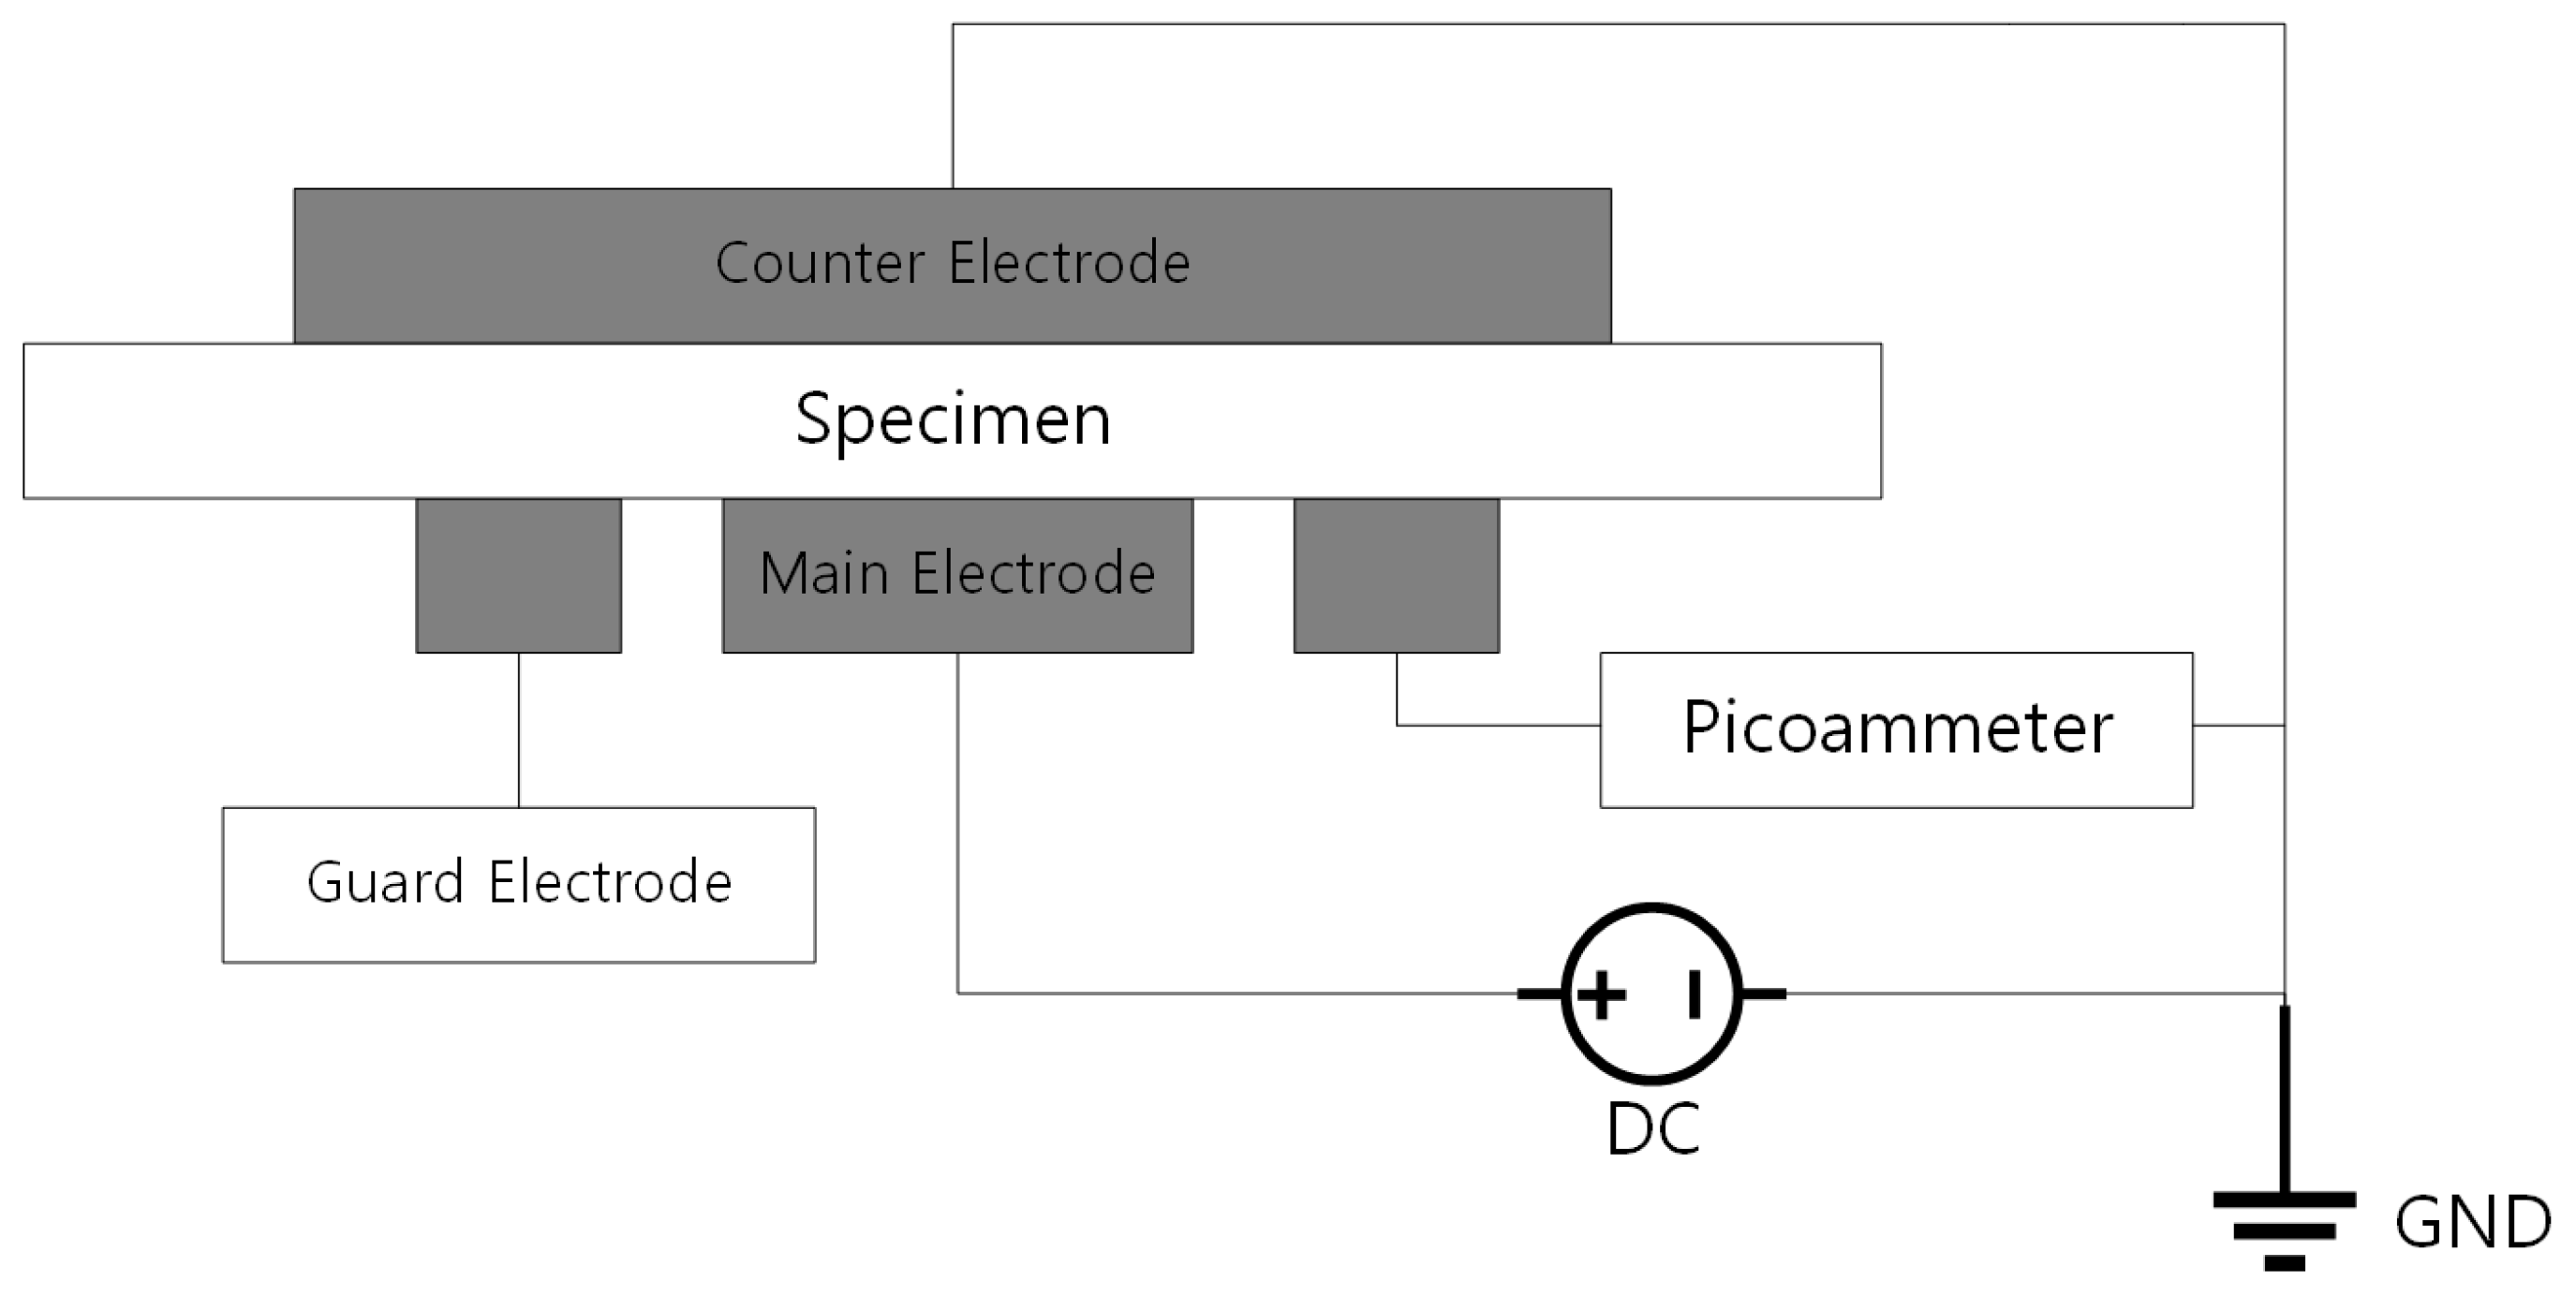
2.5. Surface Leakage Current
2.6. Thermal Stability
3. Results
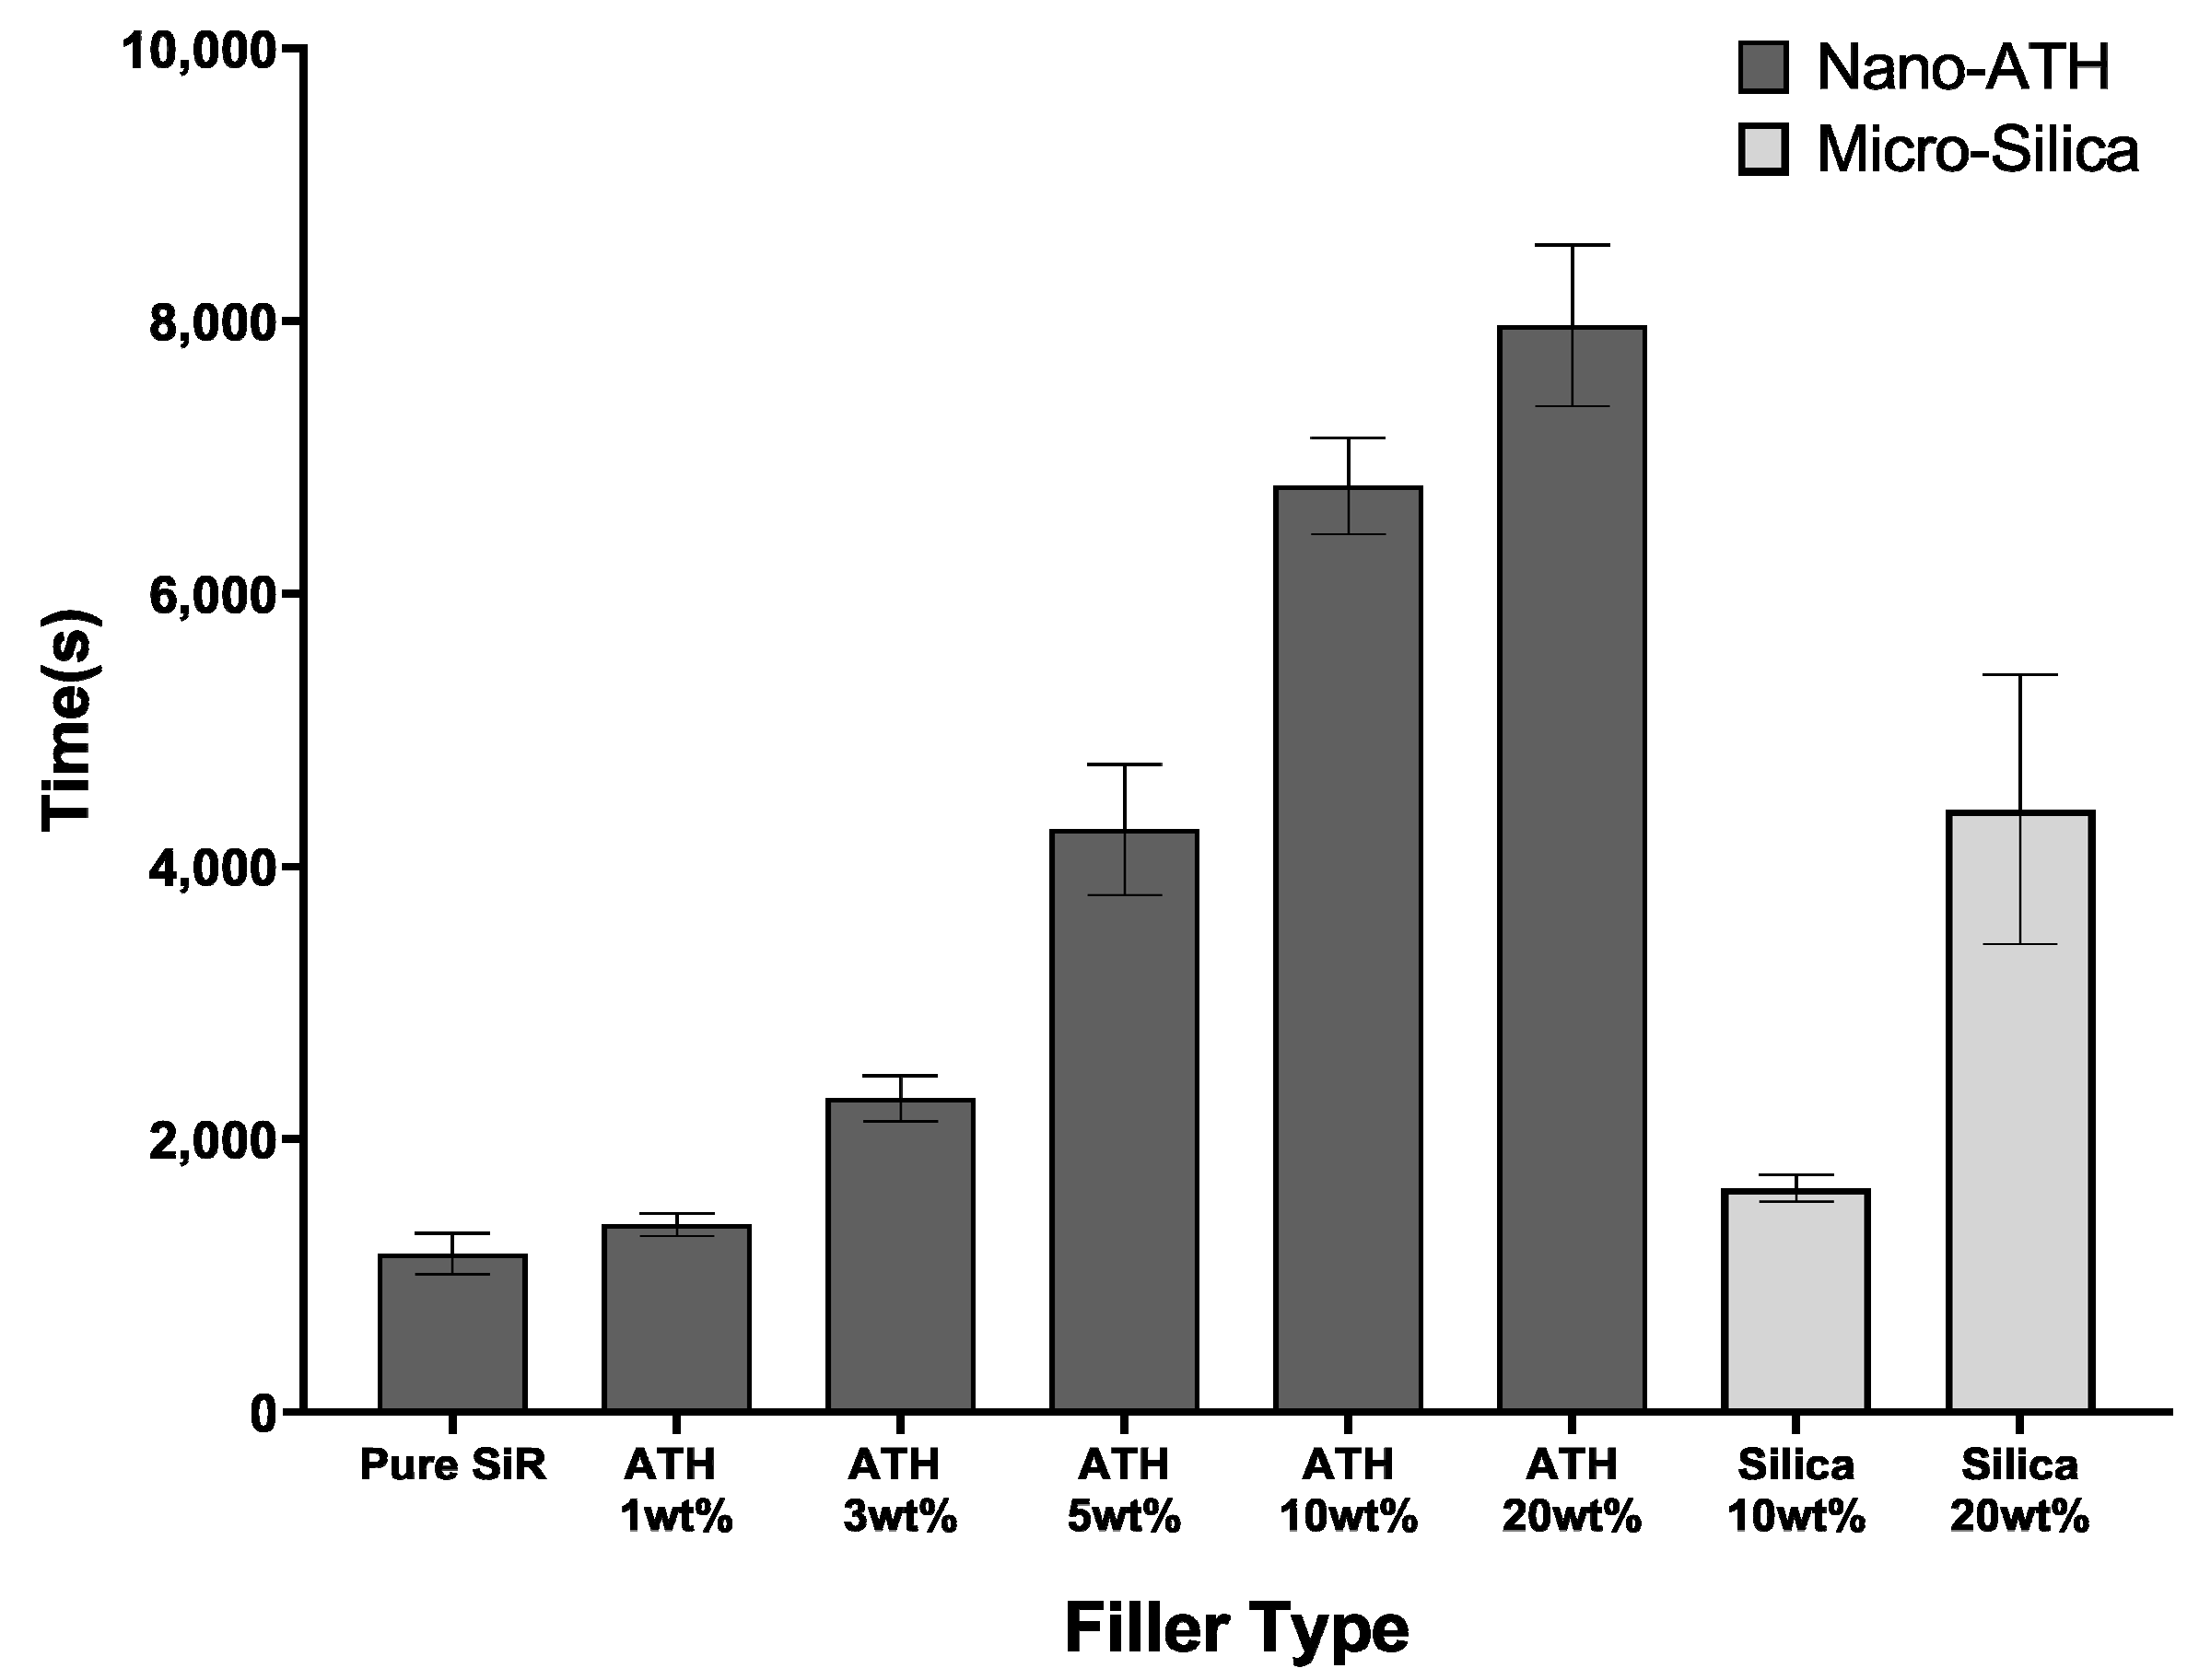
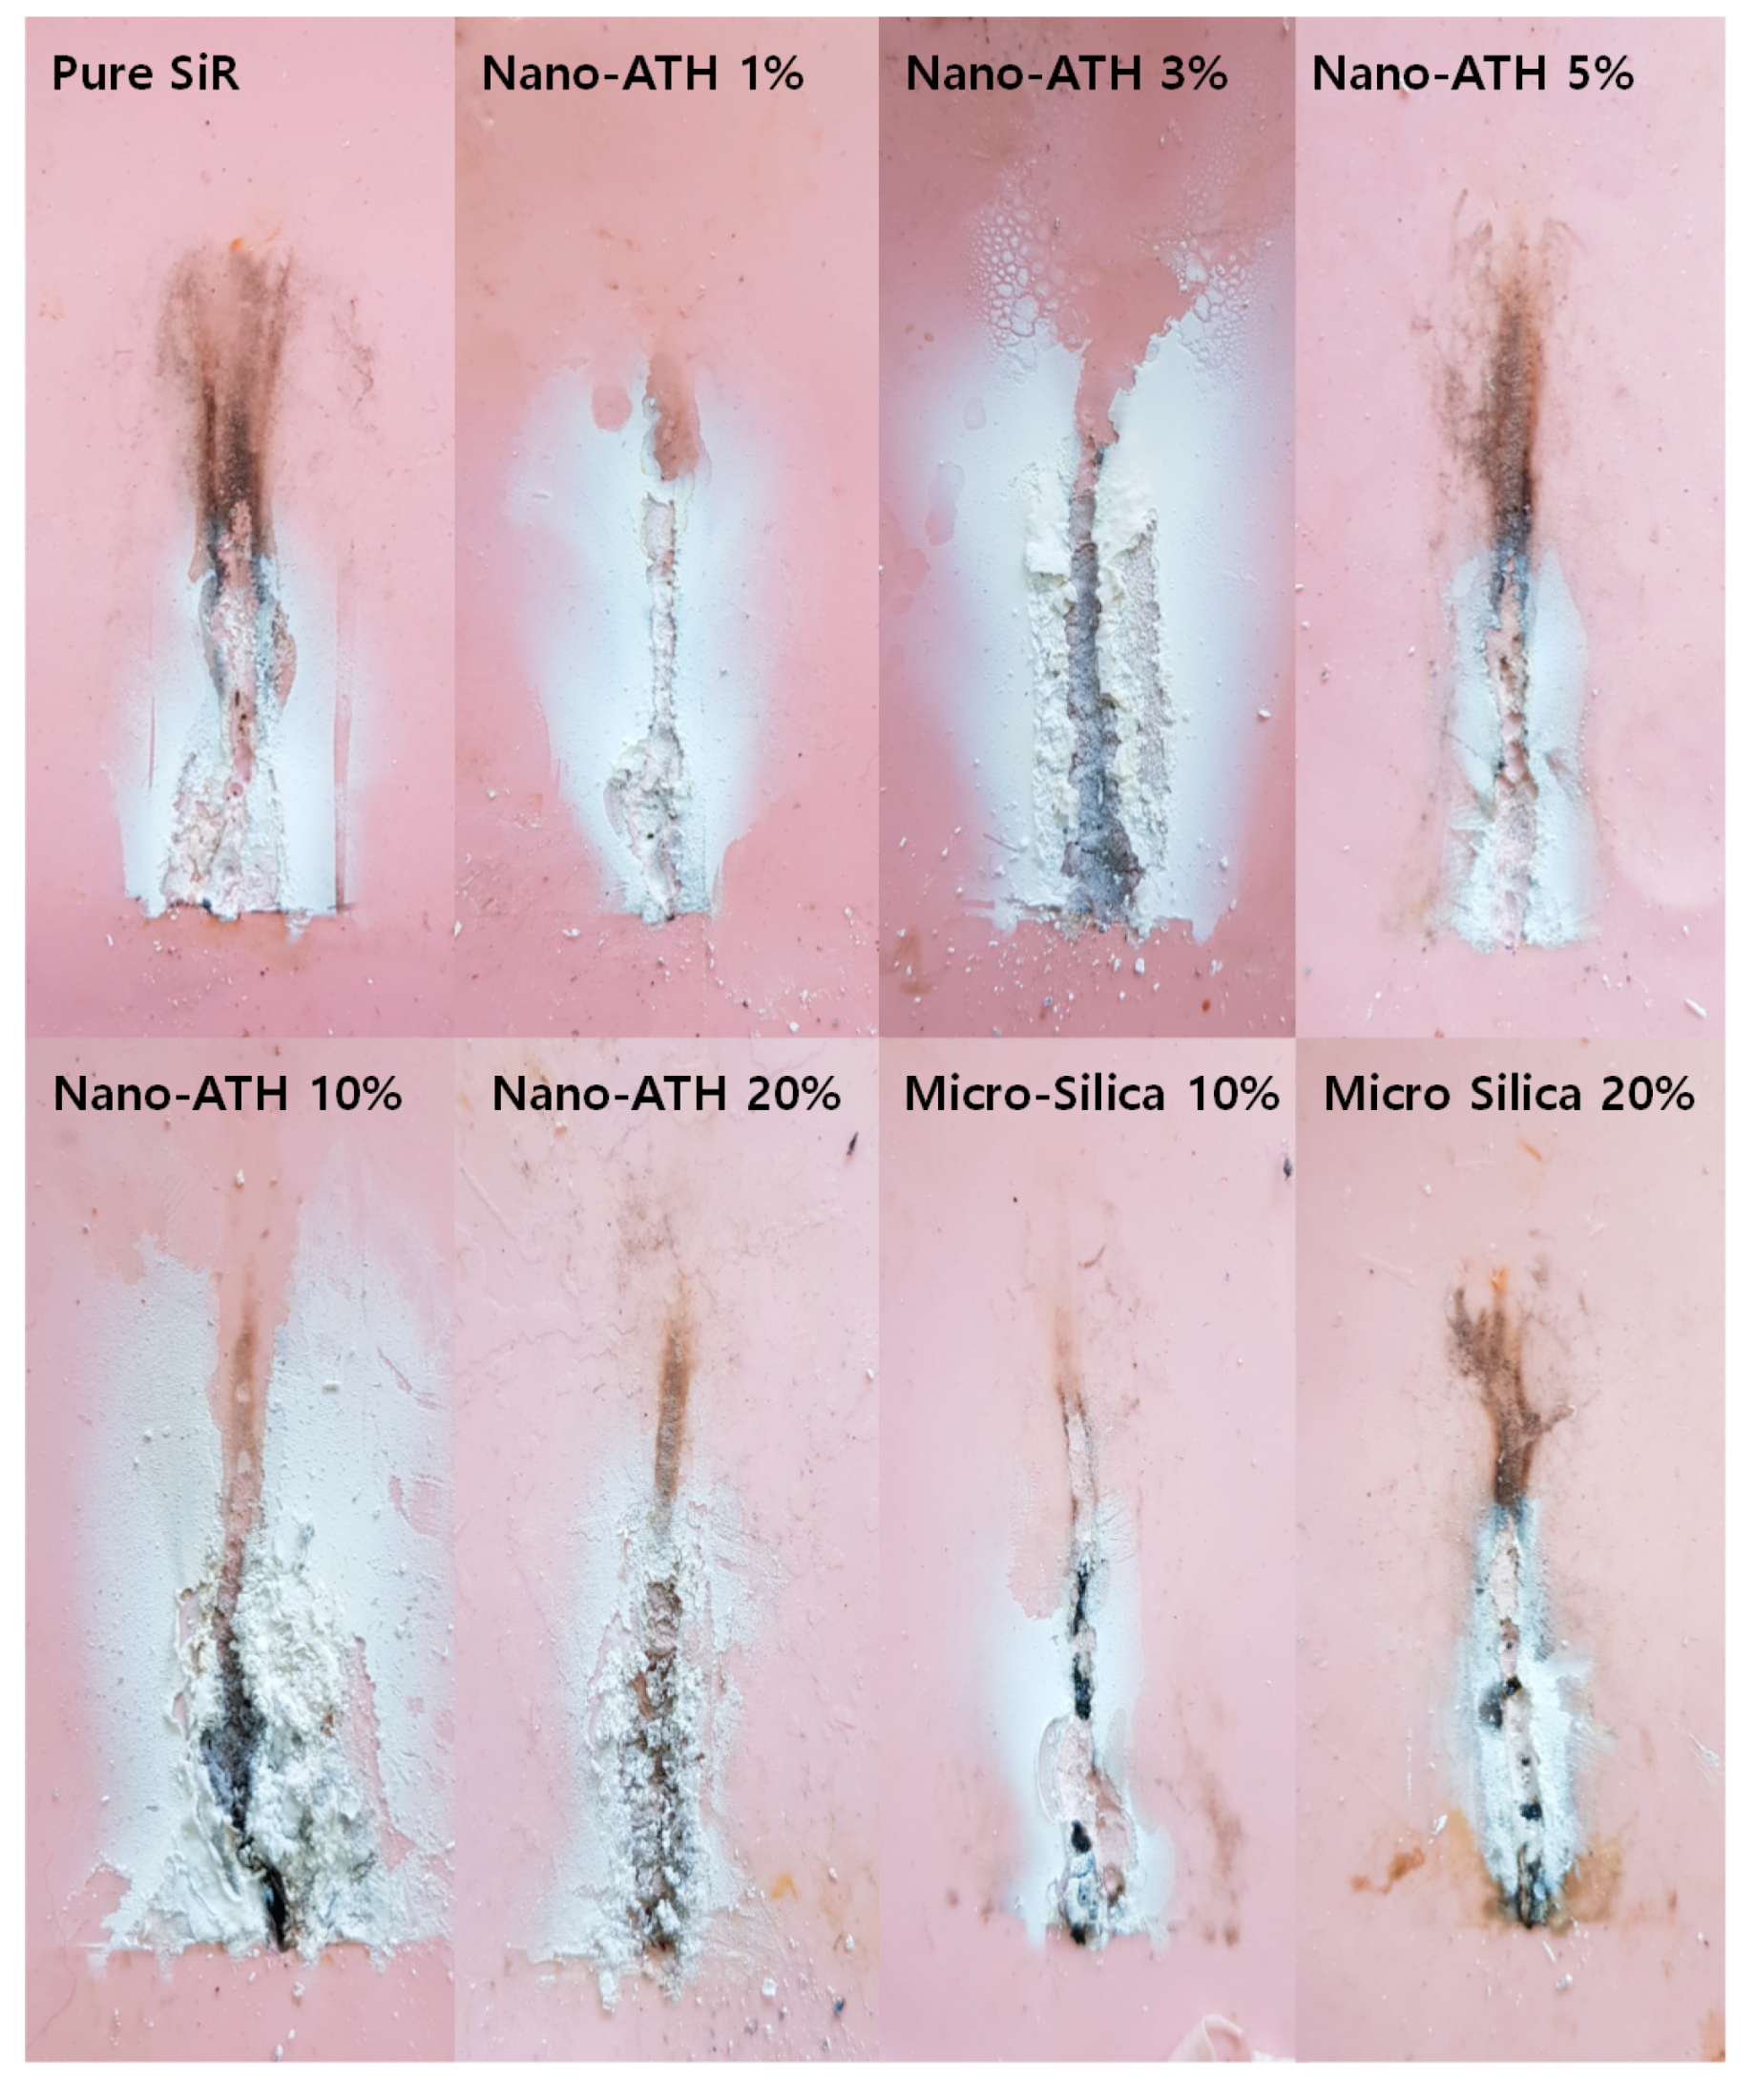
3.1. Tracking Time
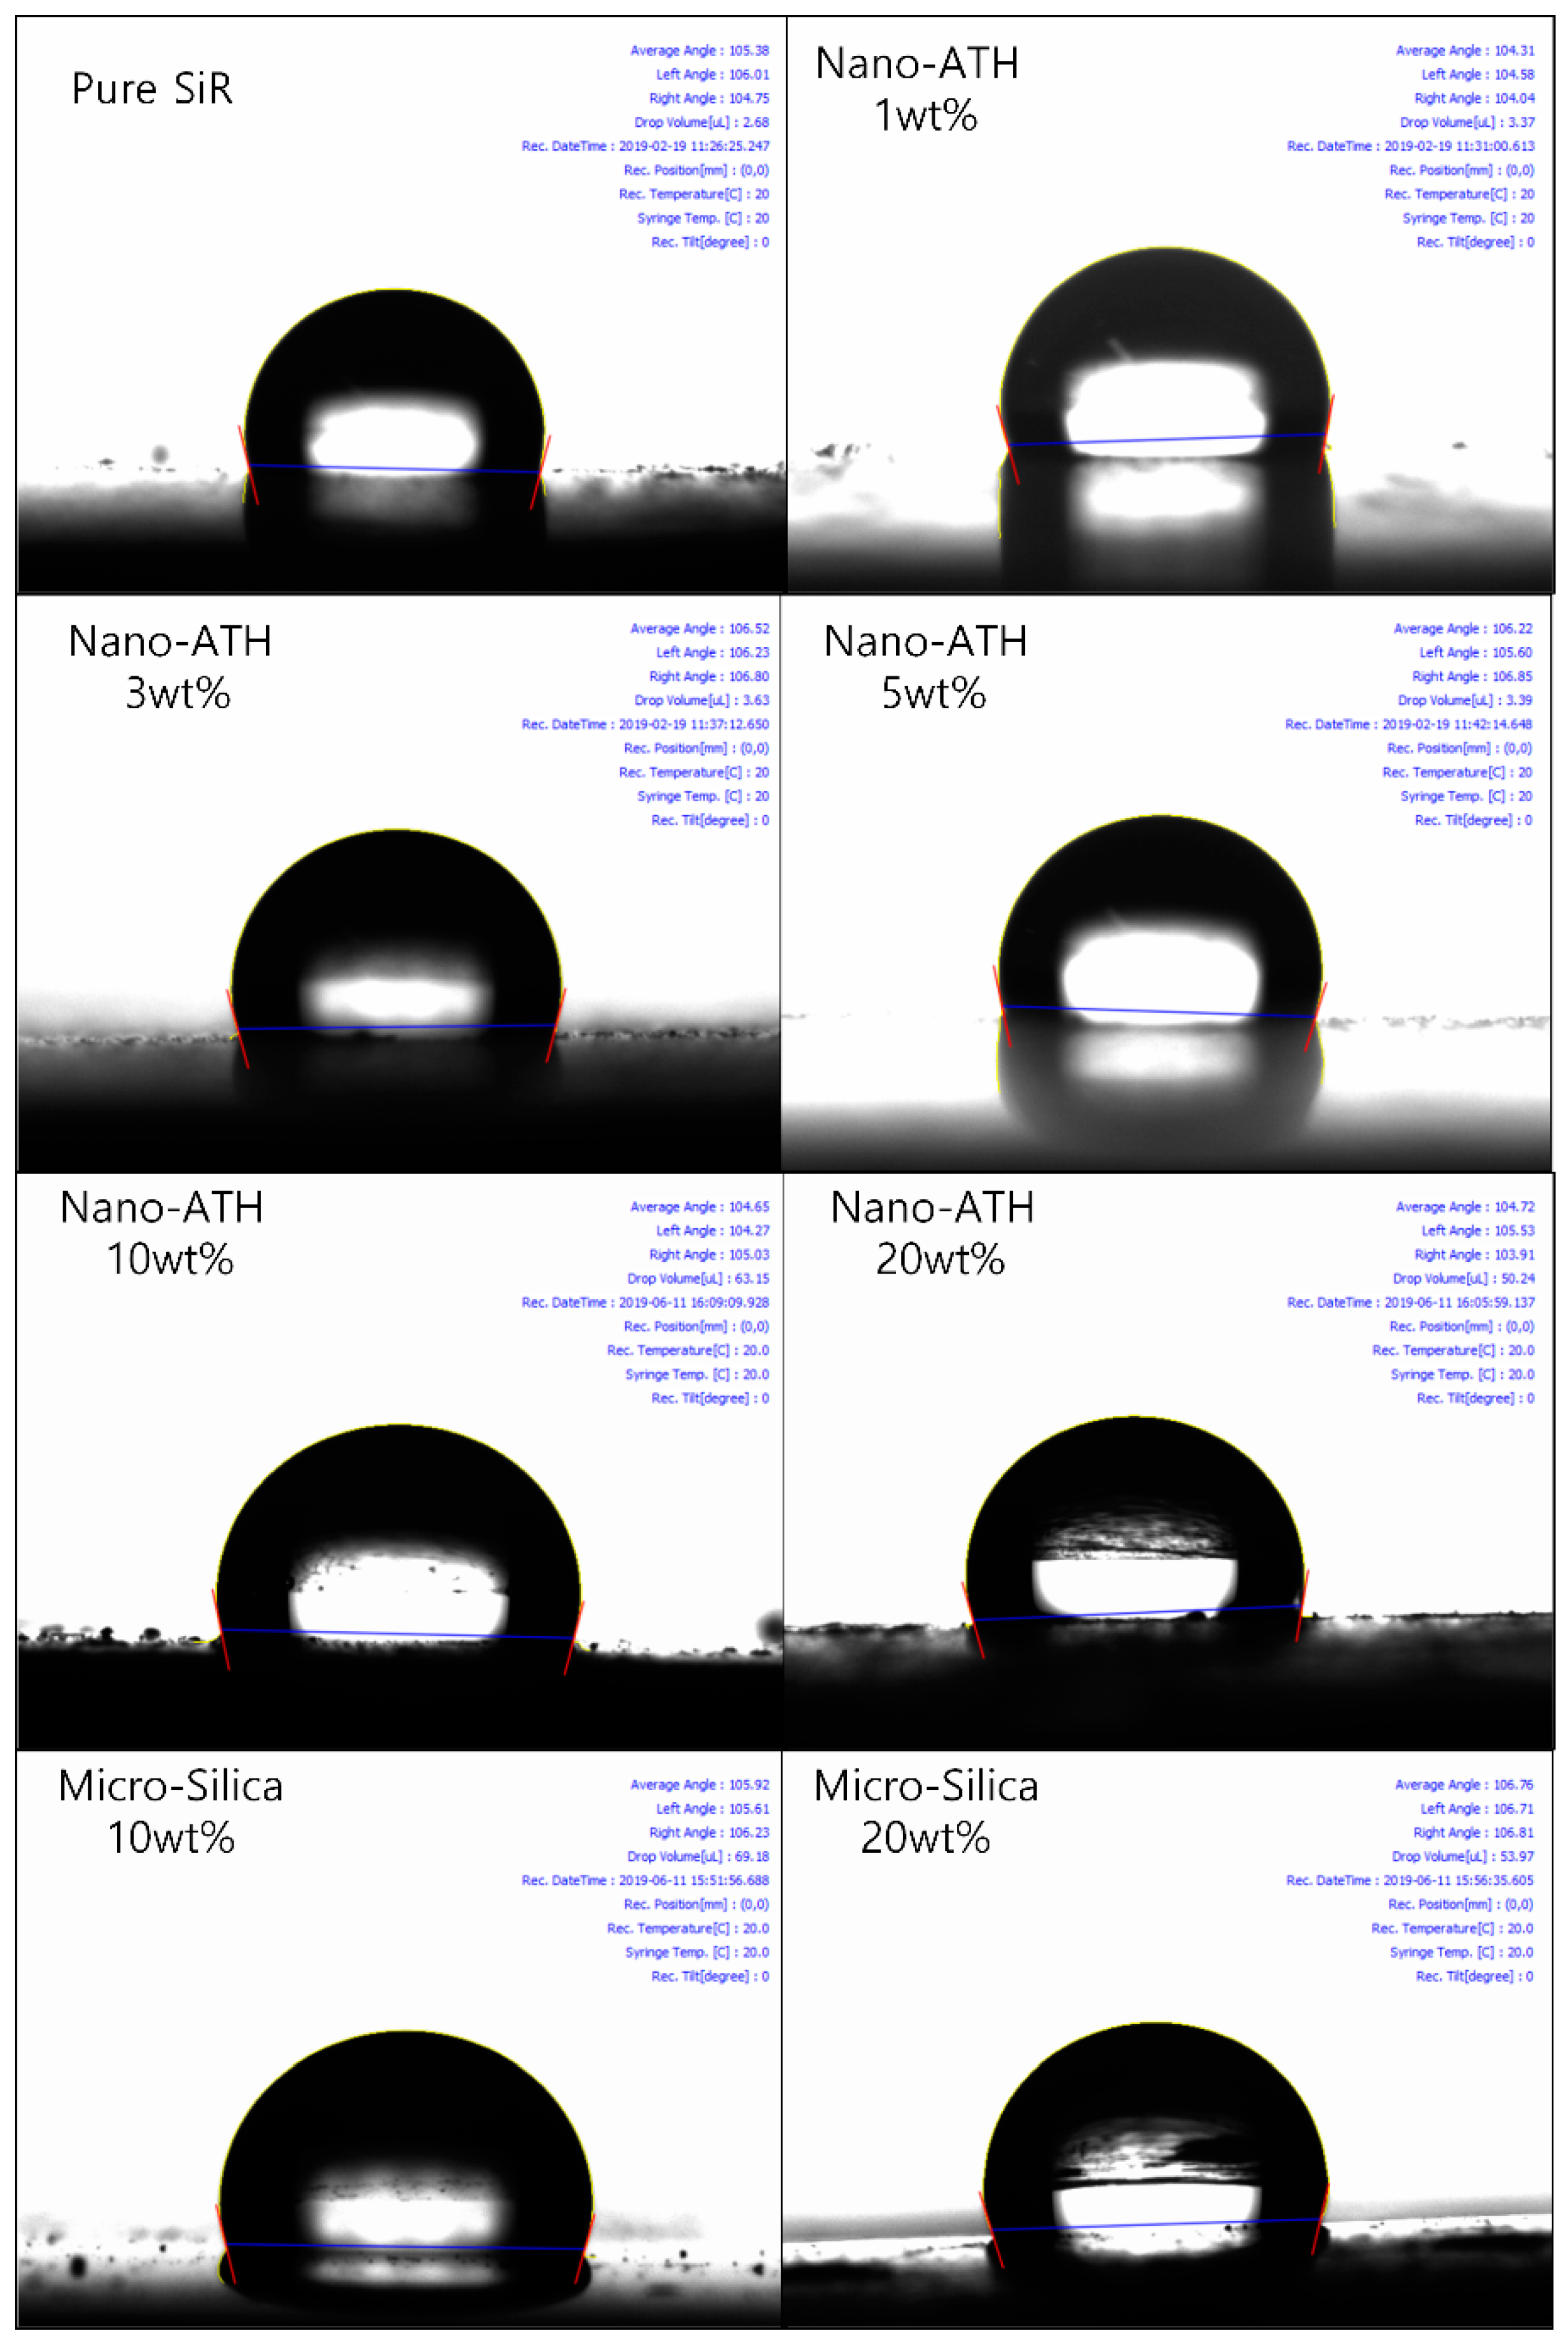
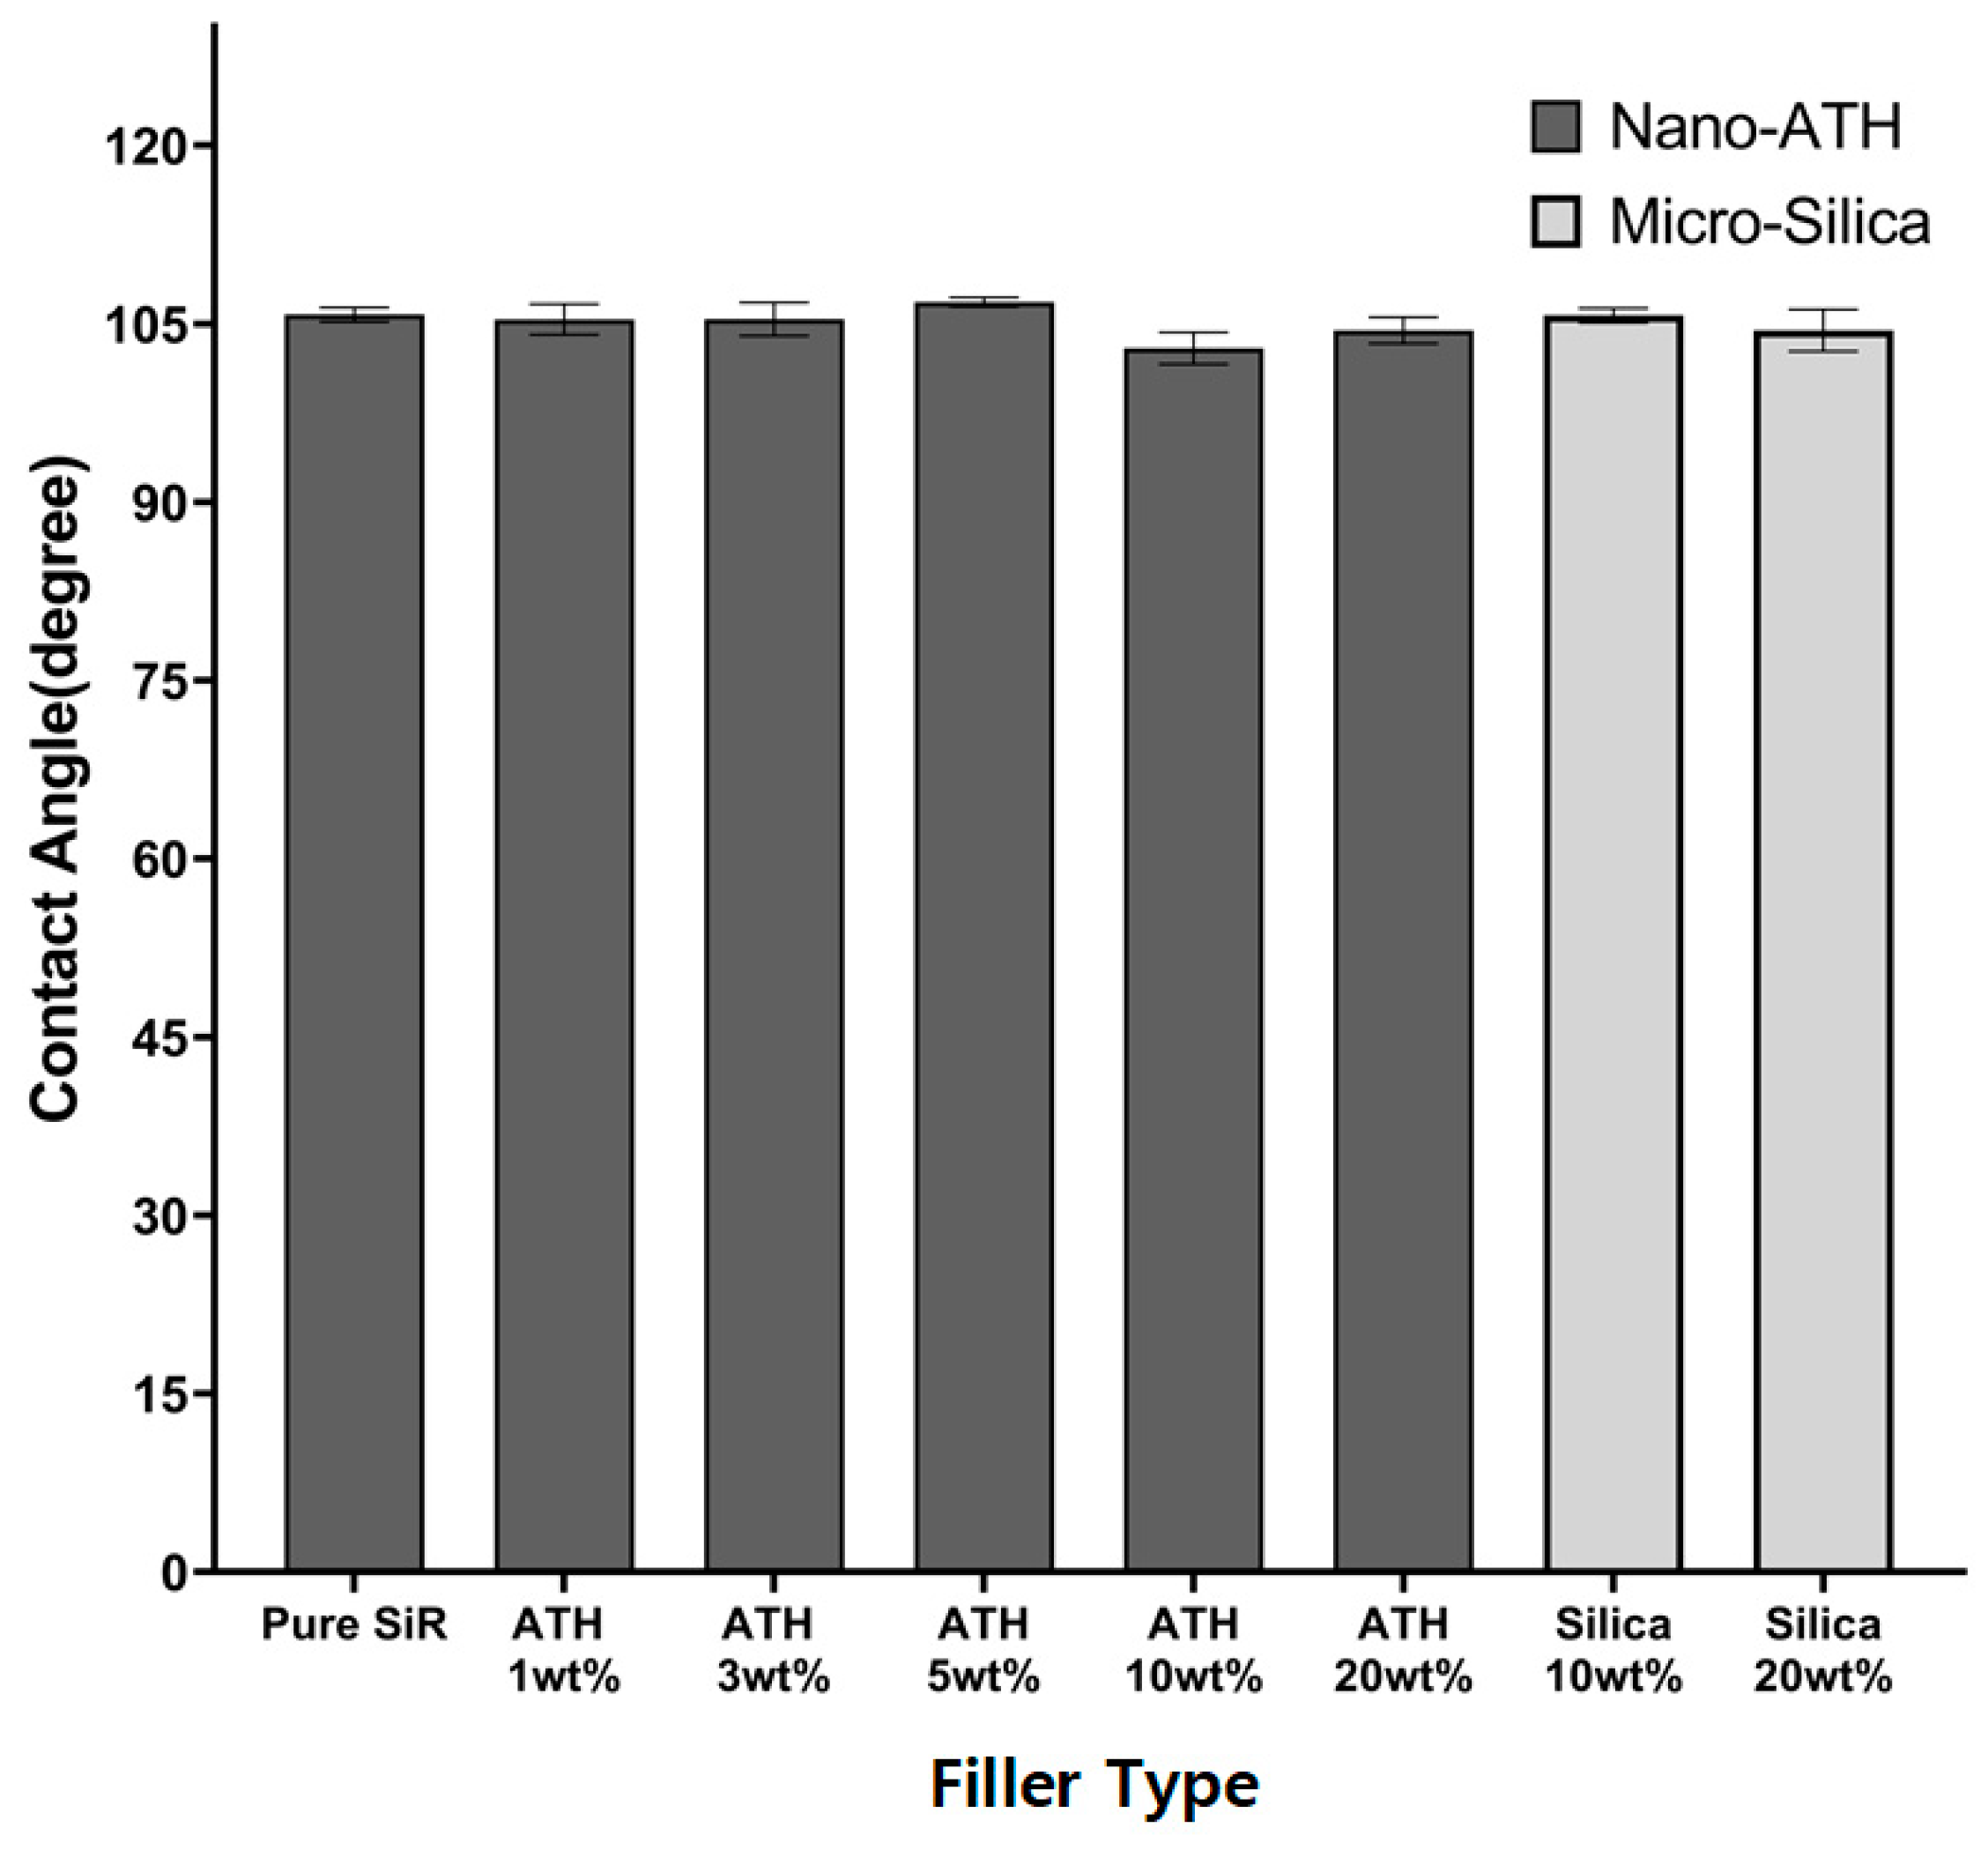
3.2. Surface Contact Angle
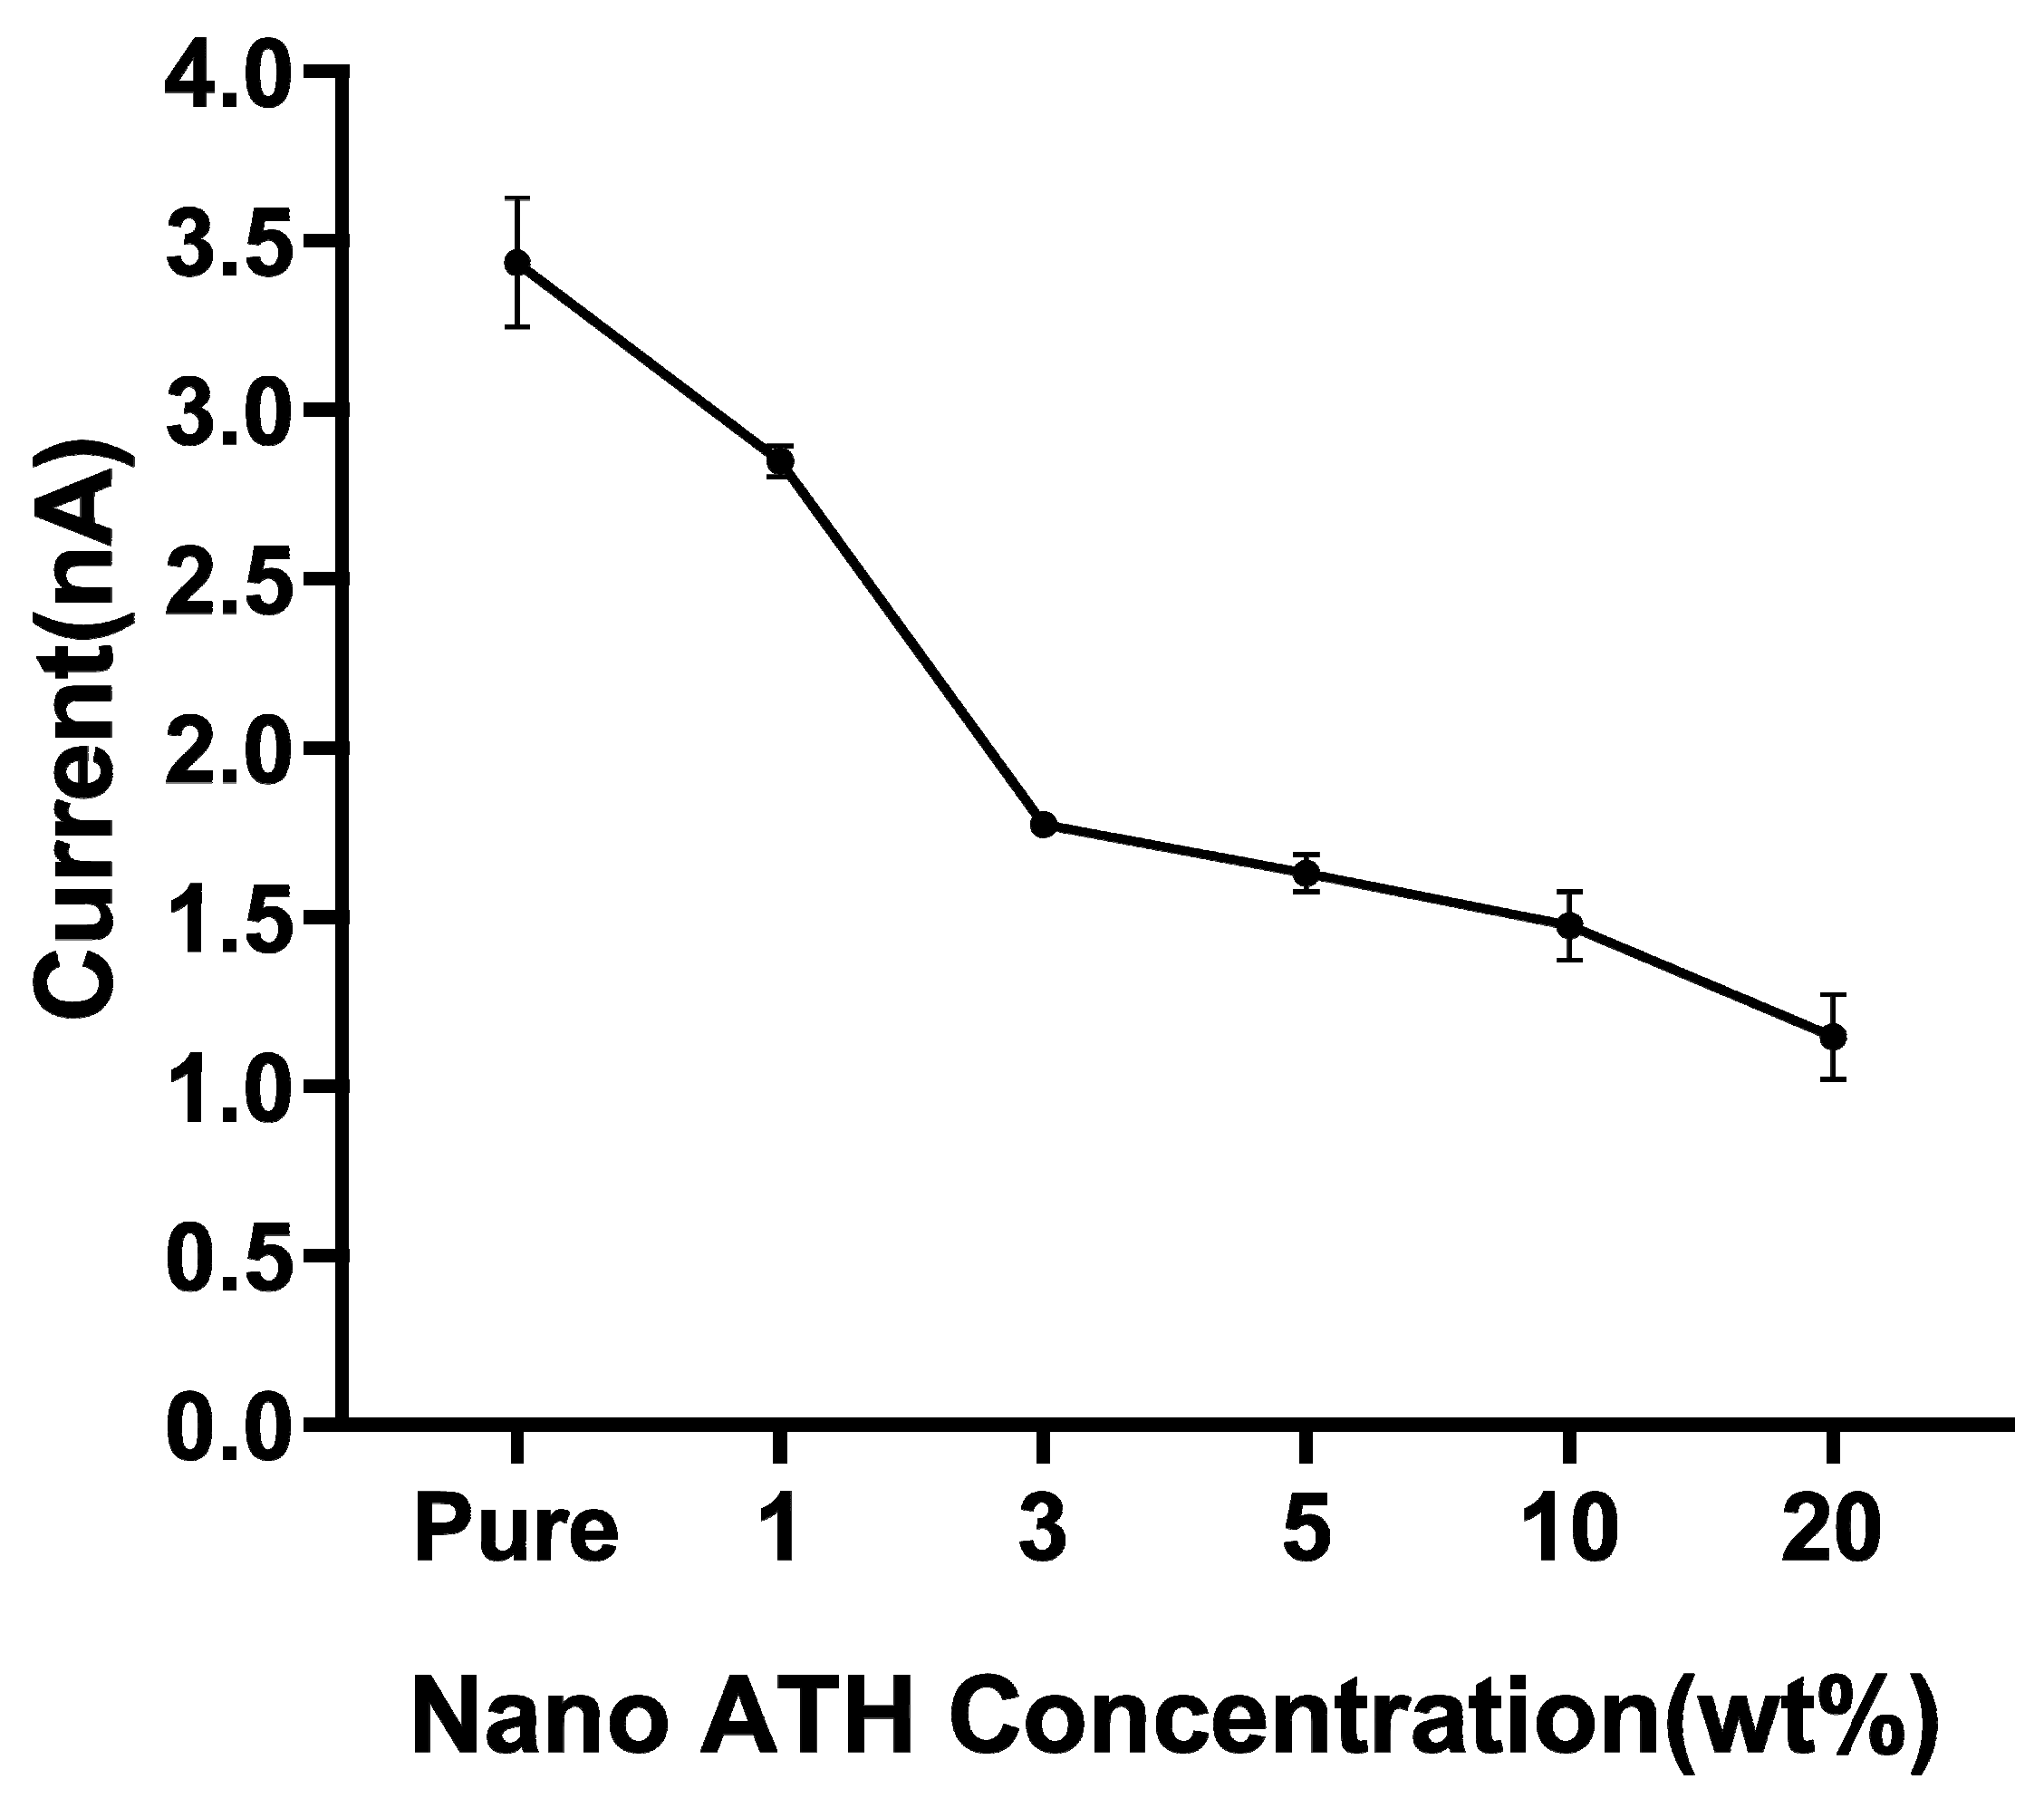
3.3. Surface Leakage Current
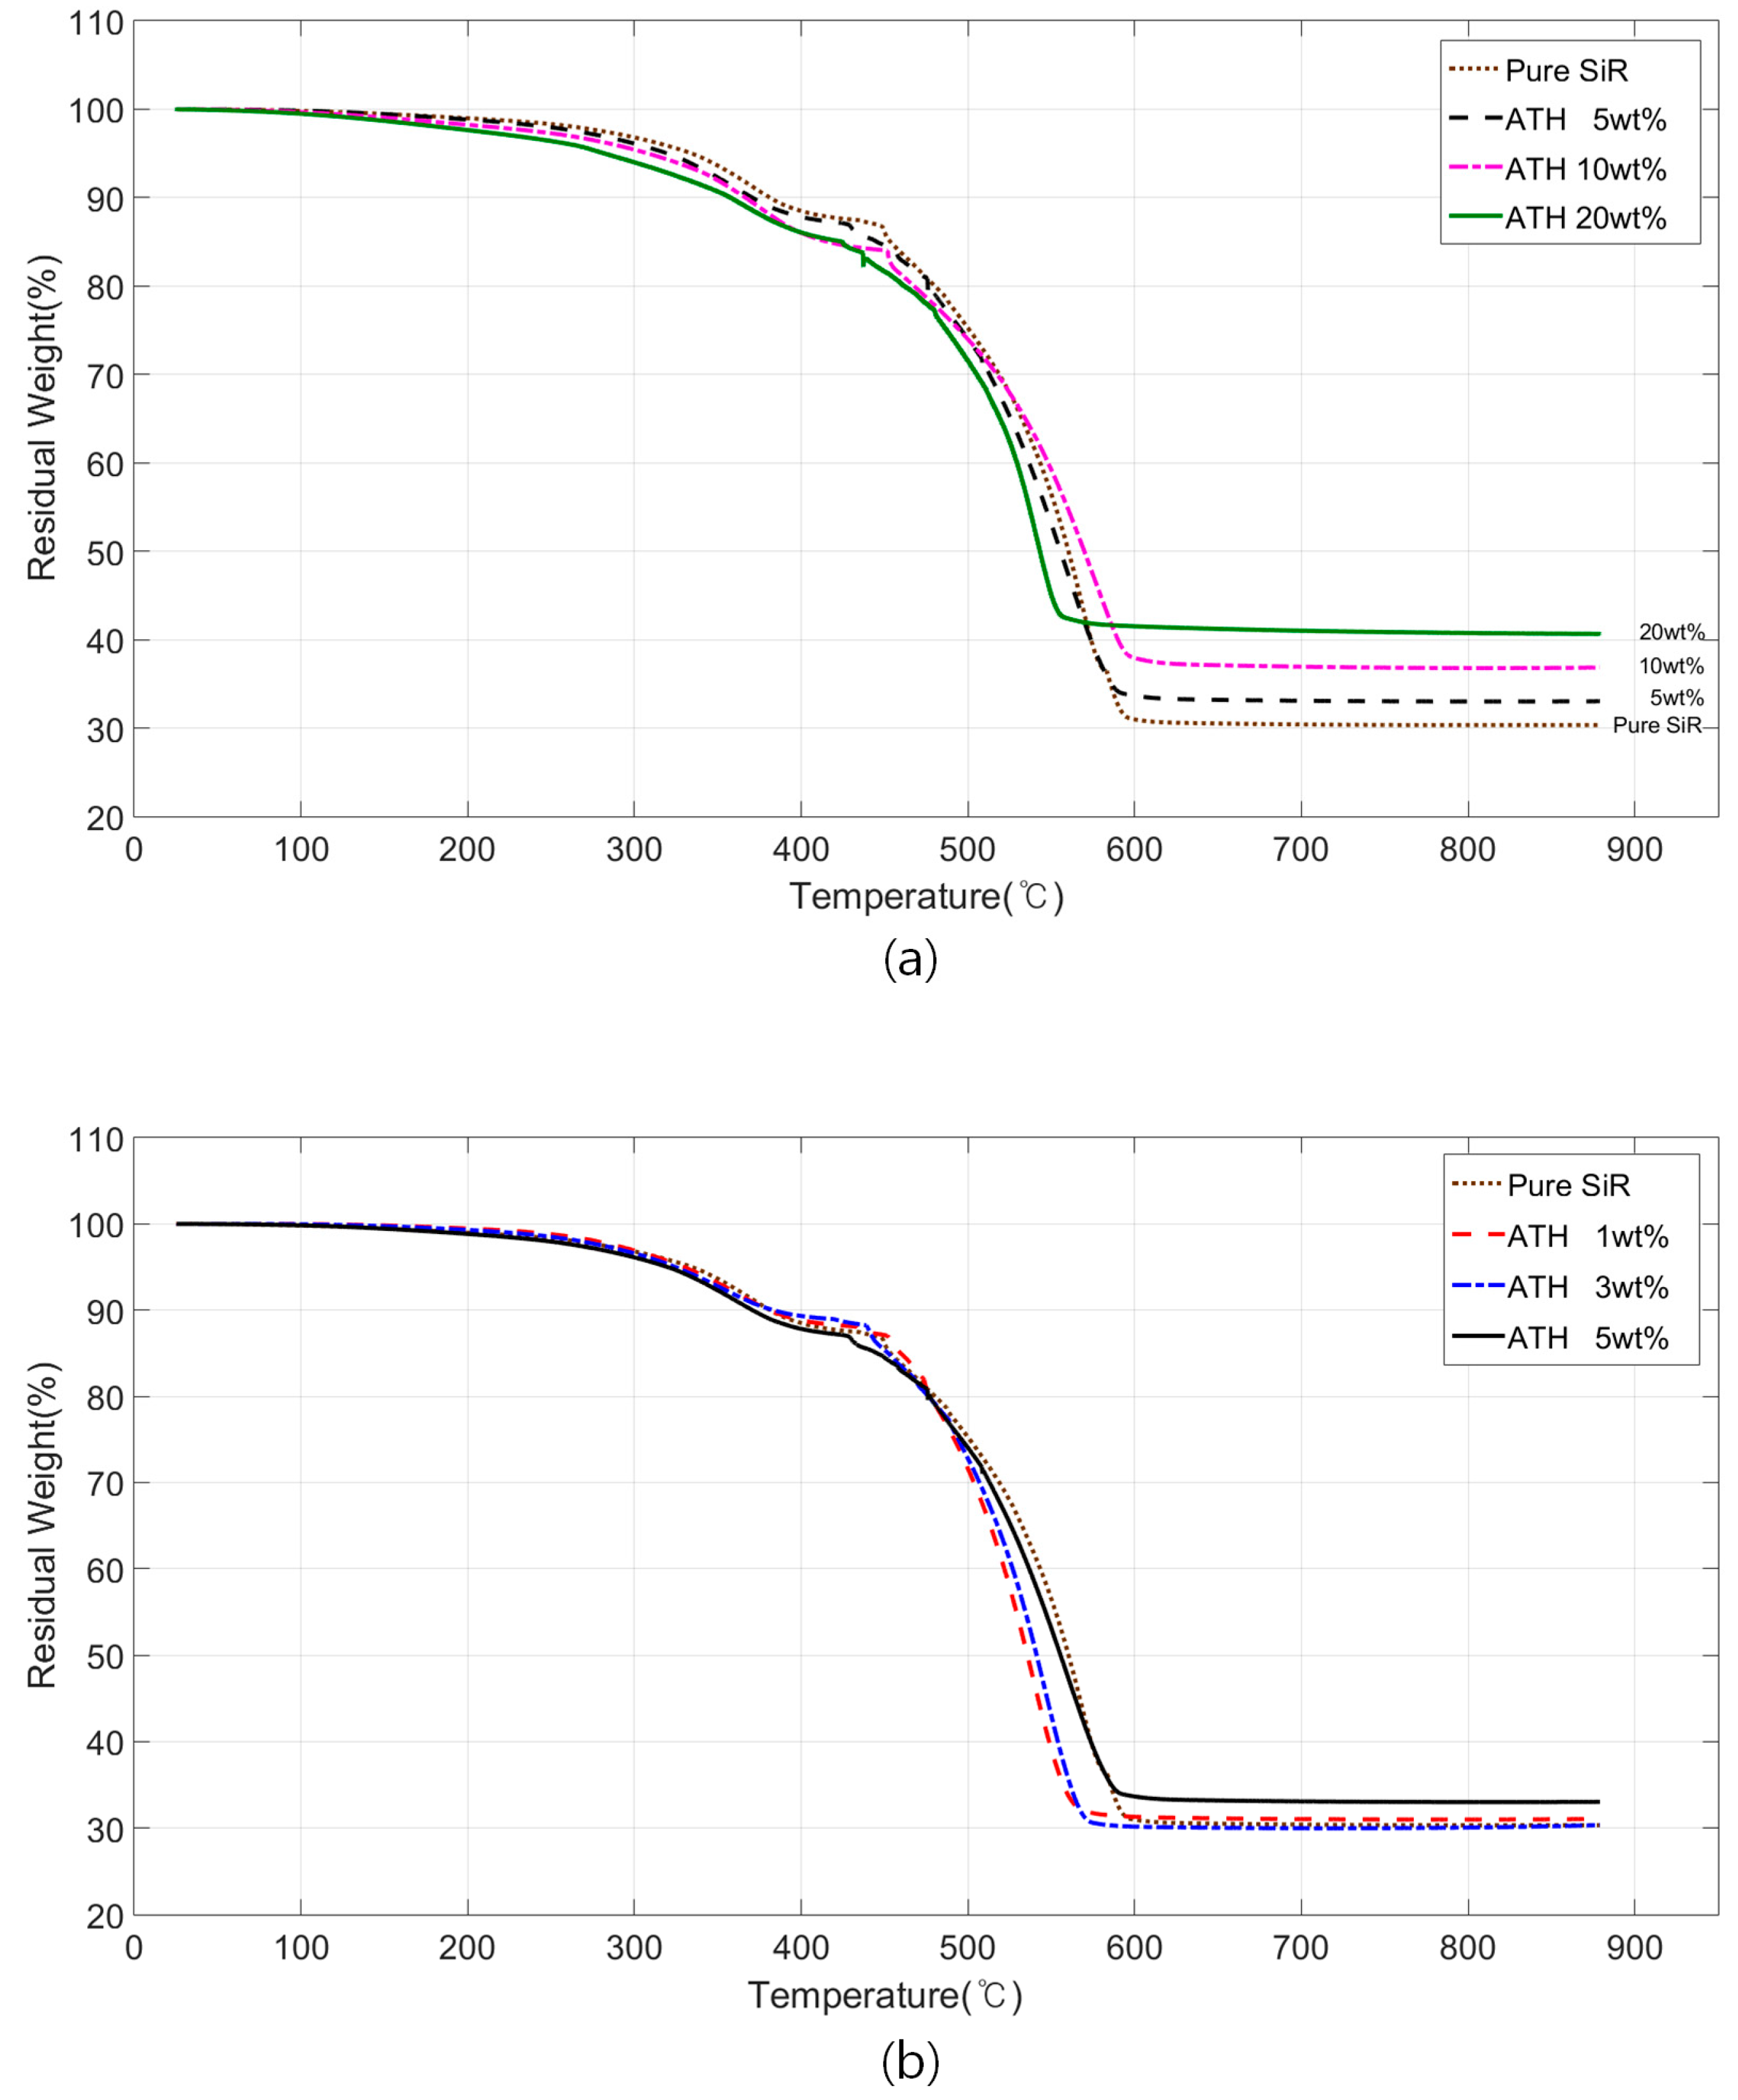
3.4. Thermal Stability
4. Discussion
5. Conclusions
Author Contributions
Funding
Conflicts of Interest
References
- Ansorge, S.; Schmuck, F.; Papailiou, K.O. Impact of different Fillers and Filler Treatments on the Erosion Suppression Mechanism of Silicone Rubber for Use as Outdoor Insulation Material. IEEE Trans. Dielectr. Electr. Insul. 2015, 22, 979–989. [Google Scholar] [CrossRef]
- Nazir, M.Q.; Phung, B.T.; Yu, S.; Li, S. Effects of Thermal Properties on Tracking and Erosion Resistance of Micro-ATH/AlN/BN filled Silicone Rubber Composites. IEEE Trans. Dielectr. Electr. Insul. 2018, 25, 2076–2085. [Google Scholar] [CrossRef]
- Amin, M.; Akbar, M.; Amin, S. Hydrophobicity of Silicone Rubber used for Outdoor Insulation (An Overview). Rev. Adv. Mater. Sci. 2007, 16, 10–26. [Google Scholar]
- Venkatesulu, B.; Thomas, M.J. Long-term Accelerated Weathering of Outdoor Silicone Rubber Insulators. IEEE Trans. Dielectr. Electr. Insul. 2011, 11, 418–424. [Google Scholar] [CrossRef]
- Verma, A.R.; Reddy, B.S. Tracking and Erosion Resistance of LSR and HTV Silicone Rubber Samples under Acid Rain Conditions. IEEE Trans. Dielectr. Electr. Insul. 2018, 25, 46–52. [Google Scholar] [CrossRef]
- Cherney, E.A. Silicone Rubber Dielectrics Modified by Inorganic Fillers for Outdoor High Voltage Insulation Applications. IEEE Trans. Dielectr. Electr. Insul. 2005, 12, 1108–1115. [Google Scholar] [CrossRef]
- Xing, Z.; Zhang, C.; Hu, X.; Guo, P.; Zhang, J.; Wang, Z.; Wu, K.; Li, J. Surface Tracking of MgO/Epoxy Nanocomposites: Effect of Surface Hydrophobicity. Appl. Sci. 2019, 9, 413. [Google Scholar] [CrossRef]
- Karady, G.G.; Shah, M.; Brown, R.L. Flashover Mechanism of Silicone Rubber Insulators used for Outdoor Insulation-1. IEEE Trans. Power Deliv. 1995, 10, 1965–1971. [Google Scholar] [CrossRef]
- Xue, Y.; Li, X.; Zhang, D.; Wang, H.; Chen, Y.; Chen, Y. Comparison of ATH and SiO2 fillers filled silicone rubber composites for HTV insulators. Compos. Sci. Technol. 2018, 155, 137–143. [Google Scholar] [CrossRef]
- Meyer, L.H.; Cherny, E.A.; Jayaram, S.H. The Role of Inorganic Fillers in Silicone Rubber for Outdoor Insulation-Alumina Tri-Hydrate or Silica. IEEE Electr. Insul. Mag. 2004, 20, 13–21. [Google Scholar] [CrossRef]
- Loganathan, N.; Chandrasekar, S. Analysis of Surface Tracking of Micro and Nano Size Alumina Filled Silicone Rubber for High Voltage AC Transmission. J. Electr. Eng. Technol. 2013, 8, 345–353. [Google Scholar] [CrossRef] [Green Version]
- Nazir, M.T.; Phung, B.T.; Yu, S.; Li, S.; Xie, D.; Zhang, Y. Thermal distribution analysis and suppression mechanism of carbonized tracking and erosion in silicone rubber/SiO2 nanocomposites. Polym. Test. 2018, 70, 226–233. [Google Scholar] [CrossRef]
- Machevich, J.; Simmons, S. Polymer Outdoor Insulating Materials Part 2: Material Considerations. IEEE Electr. Insul. Mag. 1997, 13, 10–16. [Google Scholar] [CrossRef]
- Liu, P.; Li, L.; Wang, L.; Huang, T.; Yao, Y.; Xu, W. Effects of 2D boron nitride (BN) nanoplates filler on the thermal, electrical, mechanical and dielectric properties of high temperature vulcanized silicone rubber for composite insulators. J. Alloy. Compd. 2019, 774, 396–404. [Google Scholar] [CrossRef]
- Ansorge, S.; Schmuck, F.; Papailiou, K.O. Improved Silicone Rubbers for the Use as Housing Material in Composite Insulators. IEEE Trans. Dielectr. Electr. Insul. 2012, 19, 209–217. [Google Scholar] [CrossRef]
- Loganathan, N.; Muniraj, C.; Chandrasekar, S. Tracking and Erosion Resistance Performance Investigation on Nano-sized SiO2 Filled Silicone Rubber for Outdoor Insulation Applications. IEEE Trans. Dielectr. Electr. Insul. 2014, 21, 2172–2180. [Google Scholar] [CrossRef]
- Fairus, M.; Hafiz, M.; Mansor, N.S.; Kamarol, M.; Jaafar, M. Comparative Study of SiR/EPDM Containing Nano-alumina and Titanium Dioxides in Electrical Surface Tracking. IEEE Trans. Dielectr. Electr. Insul. 2017, 24, 2901–2910. [Google Scholar] [CrossRef]
- Raetzke, S.; Kindersberger, J. Role of Interphase on the Resistance to High-voltage Arcing on Tracking and Erision of Silicone/SiO2 Nanocomposites. IEEE Trans. Dielectr. Electr. Insul. 2018, 17, 607–614. [Google Scholar] [CrossRef]
- Nazir, M.T.; Phung, B.T.; Yu, S.; Zhang, Y.; Li, S. Tracking, erosion and thermal distribution of micro-AlN + nano-SiO2 co-filled silicone rubber for high-voltage outdoor insulation. High Volt. 2018, 3, 289–294. [Google Scholar] [CrossRef]
- Nazir, M.T.; Phung, B.T.; Hoffman, M.; Yu, S.; Li, S. Micro-AlN/nano-SiO2 co-filled silicone rubber composites with high thermal stability and excellent dielectric properties. Mater. Lett. 2017, 209, 421–424. [Google Scholar] [CrossRef]
- Du, B.X.; Xiao, M. Effects of Thermally Conducting Particles on Resistance to Tracking Failure of Polyimide/BN Composites. IEEE Trans. Dielectr. Electr. Insul. 2014, 21, 1565–1572. [Google Scholar] [CrossRef]
- Du, B.X.; Xiao, M. Thermal Accumulation and Tracking Failure Process of BN-filler Epoxy-matrix Composite. IEEE Trans. Dielectr. Electr. Insul. 2013, 20, 2270–2276. [Google Scholar] [CrossRef]
- Du, B.X.; Xiao, M.; Zhang, J.W. Effect of Thermal Conductivity on Tracking Failure of Epoxy/BN Composite under Pulse Strength. IEEE Trans. Dielectr. Electr. Insul. 2013, 20, 296–302. [Google Scholar] [CrossRef]
- El-Hag, A.H.; Simon, L.C.; Jayaram, S.H.; Cherney, E.A. Erosion resistance of nano-filled silicone rubber. IEEE Trans. Dielectr. Electr. Insul. 2006, 13, 122–128. [Google Scholar] [CrossRef]
- Venkatesulu, B.; Thomas, M.J. Erosion Resistance of Alumina-filled Silicone Rubber Nanocomposites. IEEE Trans. Dielectr. Electr. Insul. 2010, 17, 615–624. [Google Scholar] [CrossRef]
- Du, B.X.; Zhang, J.W.; Liu, Y. Effect of Concentration on Tracking Failure of Epoxy/TiO2 Nanocomposites under dc Voltage. IEEE Trans. Dielectr. Electr. Insul. 2012, 19, 1750–1759. [Google Scholar] [CrossRef]
- Plesa, I.; Notingher, P.V.; Schlogl, S.; Sumereder, C.; Muhr, M. Properties of Polymer Composites Used in High-Voltage Applications. Polymers 2016, 8, 173. [Google Scholar] [CrossRef]
- Momen, G.; Farzaaneh, M. Survey of Micro/Nano Filler Use to Improve Silicone Rubber for Outdoor Insulators. Rev. Adv. Mater. Sci. 2011, 27, 1–13. [Google Scholar]
- Li, S.; Yin, G.; Chen, G.; Li, J.; Bai, S.; Zhong, L.; Zhang, Y.; Lei, Q. Short-term Breakdown and Long-term Failure in Nanodielectrics: A review. IEEE Trans. Dielectr. Electr. Insul. 2010, 17, 1523–1535. [Google Scholar] [CrossRef]
- IEC 60587. Electrical Insulating Materials Used under Sever Ambient Conditions-Test Methods for Evaluating Resistance to Tracking and Erosion; IEC: Geneva, Switzerland, 2007. [Google Scholar]
- Ghenem, R.A. Using the Inclined-Plane Test to Evaluate the Resistance of Outdoor Polymer Insulating Materials to electrical Tracking and Erosion. IEEE Electr. Insul. Mag. 2015, 35, 16–22. [Google Scholar] [CrossRef]
- Pylarinos, D.; Siderakls, K.; Pyrgioti, E. Measuring and Analyzing Leakage Current for Outdoor Insulators and Specimens. Rev. Adv. Mater. Sci. 2011, 29, 31–53. [Google Scholar]
- Zhao, W.; Zhang, G.; Yang, Y.; Yan, Z. Correlation between Trapping Parameters and Surface Insulation Strength of Solid Dielectric under Pulse Voltage in Vacuum. IEEE Trans. Dielectr. Electr. Insul. 2007, 14, 170–178. [Google Scholar] [CrossRef]
- Tanaka, T.; Imai, T. Advanced Nanodielectrics-Fundamentals and Applications, 1st ed.; Pan Stanford Publishing Pte. Ltd.: Singapore, Singapore, 2017. [Google Scholar]
- Kannan, P.; Sivakumar, M.; Mekala, K.; Chandarasekar, S. Tracking/Erosion Resistance Analysis of Nano-Al(OH)3 Filled Silicone Rubber Insulating Materials for High Voltage DC Applications. J. Electr. Eng. Technol. 2015, 10, 355–363. [Google Scholar] [CrossRef]
- Li, S.; Min, D.; Wang, W.; Chen, G. Linking Traps to Dielectric Breakdown through Charge Dynamics for Polymer nanocomposites. IEEE Trans. Dielectr. Electr. Insul. 2016, 23, 2777–2785. [Google Scholar] [CrossRef]
- Plesa, I.; Notingher, P.V.; Stancu, C.; Wiesbrock, F.; Schlogl, S. Polyethylene Nanocomposites for Power Cable Insulations. Polymers 2019, 11, 1–61. [Google Scholar]
- Tanaka, T.; Kozako, M.; Fuse, n.; Ohki, Y. Proposal of a multi-core model for polymer nanocomposite dielectrics. IEEE Trans. Dielectr. Electr. Insul. 2005, 12, 669–681. [Google Scholar] [CrossRef]
- Lewis, T.J. Interfaces: Nanometric dielectrics. J. Phys. D Appl. Phys. 2005 38, 202–212. [CrossRef]
- Mu, Q.; Feng, S.; Diao, G. Thermal Conductivity of silicone rubber filled with ZnO. Polym. Compos. 2007, 28, 125–130. [Google Scholar] [CrossRef]


| Relevant Material Properties | Factors Affecting Development of Tracking Failure |
|---|---|
| Surface Contact Angle (Section 3.2, Figure 6) | Contaminated surface |
| Surface Leakage Current (Section 3.3, Figure 8) | Heat Generation |
| Thermal Stability (Section 3.4, Figure 9) | Thermal decomposition |
© 2019 by the authors. Licensee MDPI, Basel, Switzerland. This article is an open access article distributed under the terms and conditions of the Creative Commons Attribution (CC BY) license (http://creativecommons.org/licenses/by/4.0/).
Share and Cite
Jeon, Y.; Hong, S.-K.; Kim, M. Effect of Filler Concentration on Tracking Resistance of ATH-Filled Silicone Rubber Nanocomposites. Energies 2019, 12, 2401. https://doi.org/10.3390/en12122401
Jeon Y, Hong S-K, Kim M. Effect of Filler Concentration on Tracking Resistance of ATH-Filled Silicone Rubber Nanocomposites. Energies. 2019; 12(12):2401. https://doi.org/10.3390/en12122401
Chicago/Turabian StyleJeon, Youngtaek, Shin-Ki Hong, and Myungchin Kim. 2019. "Effect of Filler Concentration on Tracking Resistance of ATH-Filled Silicone Rubber Nanocomposites" Energies 12, no. 12: 2401. https://doi.org/10.3390/en12122401
APA StyleJeon, Y., Hong, S.-K., & Kim, M. (2019). Effect of Filler Concentration on Tracking Resistance of ATH-Filled Silicone Rubber Nanocomposites. Energies, 12(12), 2401. https://doi.org/10.3390/en12122401