Article

Comparative Analysis of the Results of Diagnostic Measurements with an Internal Inspection of Oil-Filled Power Transformers

1
Institute of Electrical Power Engineering, Lodz University of Technology, 90-924 Lodz, Poland
2
Zrew Transformers S.A., 92-412 Lodz, Poland
*
Author to whom correspondence should be addressed.
Energies 2019, 12(11), 2155; https://doi.org/10.3390/en12112155
Submission received: 27 March 2019 / Revised: 31 May 2019 / Accepted: 3 June 2019 / Published: 5 June 2019
(This article belongs to the Special Issue Power Transformer Condition Assessment)

Abstract

:
This article presents a description of four independent case studies concerning situations when power transformers were directed to internal inspection. This inspection was the result of a specific case of a routine diagnostic procedure that was carried out and, where the transformer was switched off by a Buchholz gas relay. The case studies described were selected such that they represented situations when availability of historical data on the previous measurements was limited and a quick diagnosis had to be made on the basis of the results from the last measurement. In all of the cases presented here, the analysis of the gases dissolved in oil had played an important role in the detection of the defects that turned out to be dangerous for further exploitation of the transformers considered. The first signal about a possible developing defect was elicited solely from the measurements of the oil samples taken from the transformer in service. However, more detailed recognition and initial localization of the defect was possible after additional supplementary measurements (winding resistance, sweep frequency response analysis, etc.), which required the transformer to be switched off. The conducted sequence of actions, based on the developed diagnostic procedure, indicated the possibility of effective and early withdrawal of the transformer from operation, before it underwent a serious failure.

1. Introduction

Each unexpected outage of power transformer is associated with financial losses for its owner, as well as the energy consumers who are supplied through this transformer. Additionally, when unsealing the transformer tank, a fire might break out or a leakage of mineral oil (still the dominant insulation and cooling medium in power transformers) might occur, causing soil and water contamination [1,2]. Hence, it is important to detect at an early stage, all signals that might indicate a potential defect in a transformer. Then, on the basis of a proper diagnostic procedure, an effective and rational decision for the further exploitation of a given transformer unit might be made up. One of such decisions is timely de-energizing power transformers from service and forwarding it to an internal inspection. It should also be understood that, in addition to the technical condition of the transformer, decision about its de-energizing might be forced by the age of the transformer, its service condition, place of installation, and the ability to replace it by a reserve unit. The proper selection of a diagnostic procedure and correct interpretation of the results obtained from different types of measurements are valid, no matter the place of the transformer installation [3,4,5,6,7,8,9,10,11,12,13,14]. In the case of wind and solar farms, appropriate procedures become even more important due to the accumulation of stresses that affect both the insulation and an active part of transformer. These stresses result, among others, from a high variability of loads, frequent de-energizing of transformers, environmental impact (lightning, large daily fluctuations in ambient temperature, and sea climate), and requirements to stay operational during significant voltage dips [15]. The analyses carried out have indicated that transformer failures might occur mainly in the insulation system of the transformer, transformer windings, bushings, and on-load tap changers (OLTC). Hence, appropriate methods and diagnostic procedures must be chosen, in order to allow the detection of defects occurring solely in these parts of the transformer. The best option seems to be the use of methods that are non-invasive, easy to apply, and give an intuitive view about the initial selection of transformers on healthy units and units with suspected or developed defect [5,10,16,17,18,19]. Among these methods, one of the most important is the analysis of the gases dissolved in oil (DGA), which constitutes a part of the fundamental measurements within the first level of a diagnostic procedure of a transformer in service [9]. DGA is a commonly used method that allows for the detection of thermal or electrical defects that occur in oil–paper insulation. The distinctive defects (breakdowns, partial discharges, and thermal faults) might generate a characteristic pattern of gases. Electrical discharges in oil generate large amounts of hydrogen (H2) and acetylene (C2H2). In the case of defects of cellulose insulation, carbon monoxide (CO) and carbon dioxide (CO2) are also generated. In the case of partial discharges in oil, large quantities of hydrogen and methane (CH4) are formed. Concerning partial discharges in oil-impregnated cellulose insulation, small amounts of CO and CO2 might be measured. However, the type and amount of gases generated as a result of the thermal degradation of oil, depend on the temperature. With an increase in temperature, hydrocarbons are generated in the following sequence, methane–ethane–ethylene–acetylene, but H2 concentration is low in this case. Thermal decomposition of cellulose is associated with the generation of large amounts of carbon monoxide and lesser amounts of carbon dioxide [4,5,9,13,16,17,18,19,
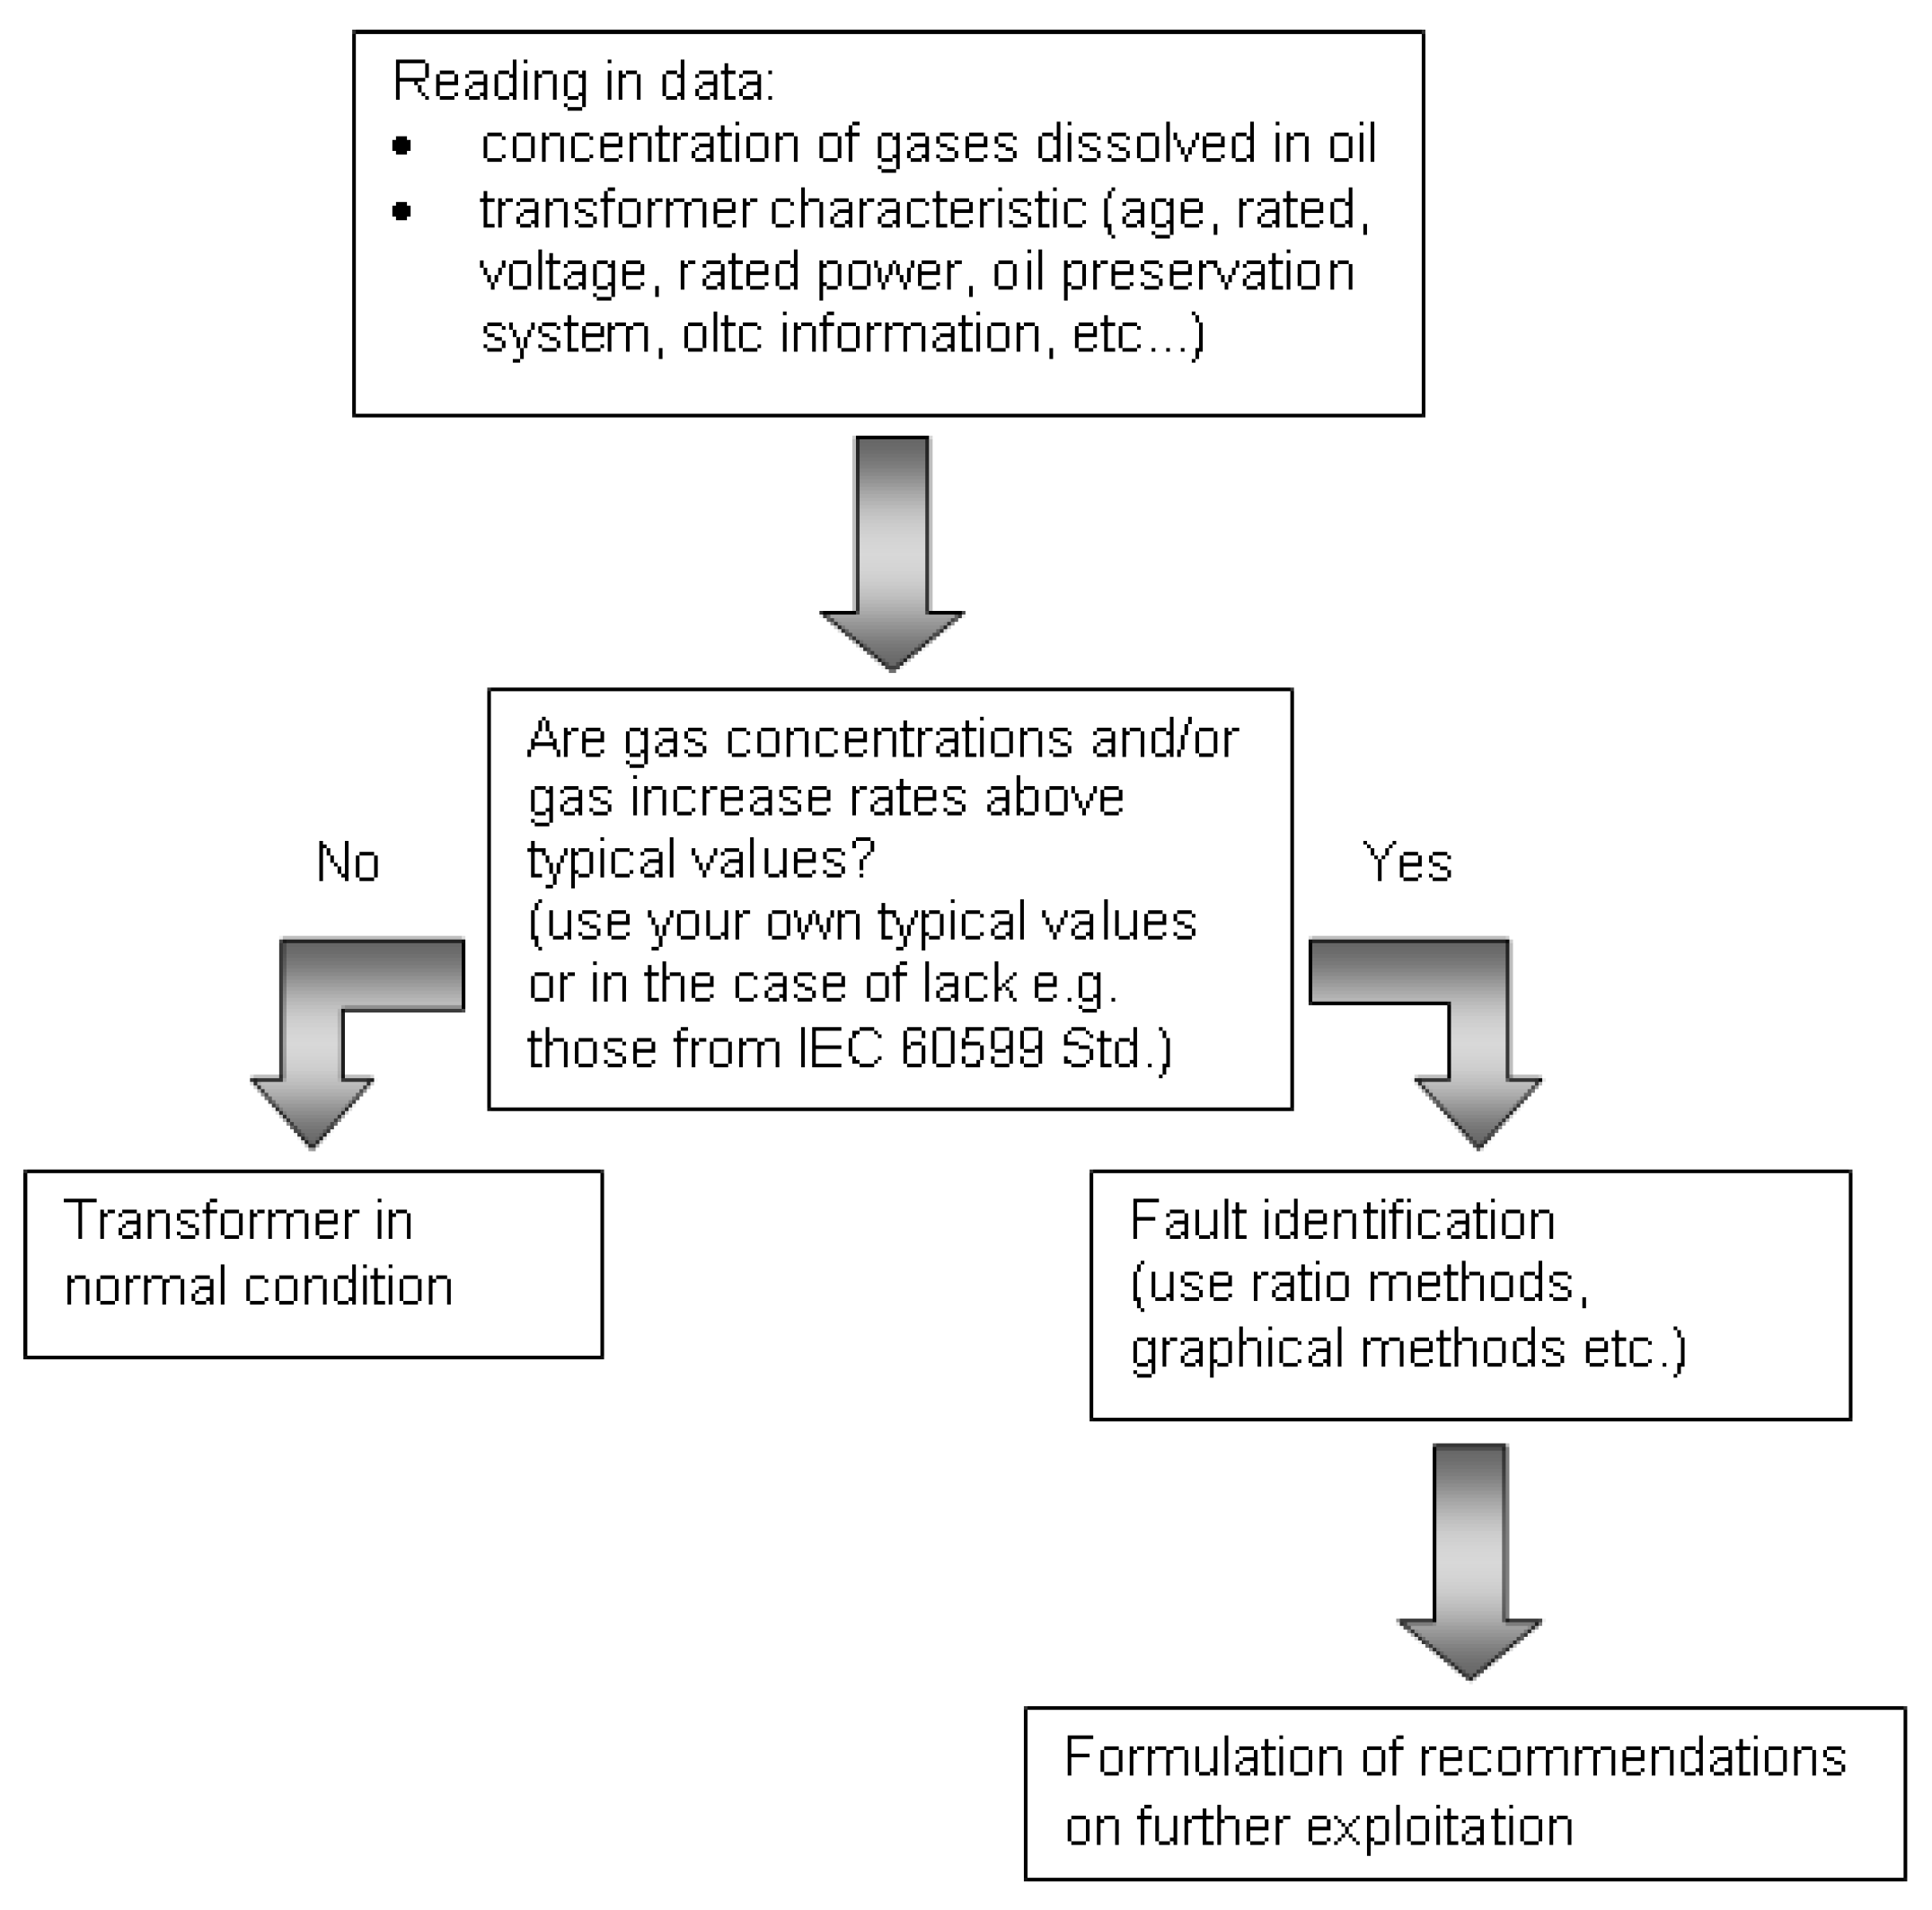
20]. The conclusions about the transformer’s technical condition, based on the results of the chromatographic analysis of the oil sample taken from the transformer, is typically carried out in accordance with the general scheme presented in Figure 1 [20].
The exceedance of the typically assumed values (the second block from the top) could be used as an indicator in the assessment of the transformer as a unit of normal condition or one suspected of defects. However, it is important to point out that the differences might be a result of the methods applied for determining the nature of the defect. This is especially apparent when the availability of historical measurement data is limited [9,16,17,18,21].
In Poland, the typical values of gas concentrations in oil are described separately for the generator step-up and the network power transformers [16]. These are listed in Table 1.
Acceptable gas concentration increase refers to the total amount of combustible gases. For the generator step-up power transformers and the network power transformers, these are 35 ppm/month and 40 ppm/month, respectively. The level of defect development is evaluated on the basis of the sum of combustible gases. It is assumed that in the case of generator step-up transformers, a slowly-developing defect evolves when the mentioned sum is in the range of 2200–3700 ppm, while for the network transformers, this sum is between 2500 and 3700 ppm. However danger state occurs, when the sum of combustible gases, independent of the transformer type, is in the range of 3700 and 7500 ppm and is in an emergency state, when the sum exceeds 7500 ppm. The character of the defect is determined on the basis of the ratio method recommended by the IEC (International Electrotechnical Commission) 60599 Standard [22]. The distinctive limits describing the type of defect are set as a reminder in Table 2.
Additionally, the determined value of CO2/CO ratio, which is lower than 3, might indicate that cellulose insulation is a subject of abnormal decomposition (fault involves cellulose insulation). In the case of the defect of a thermal origin, the criteria quoted in Table 3 are used for determining the overheating temperature [
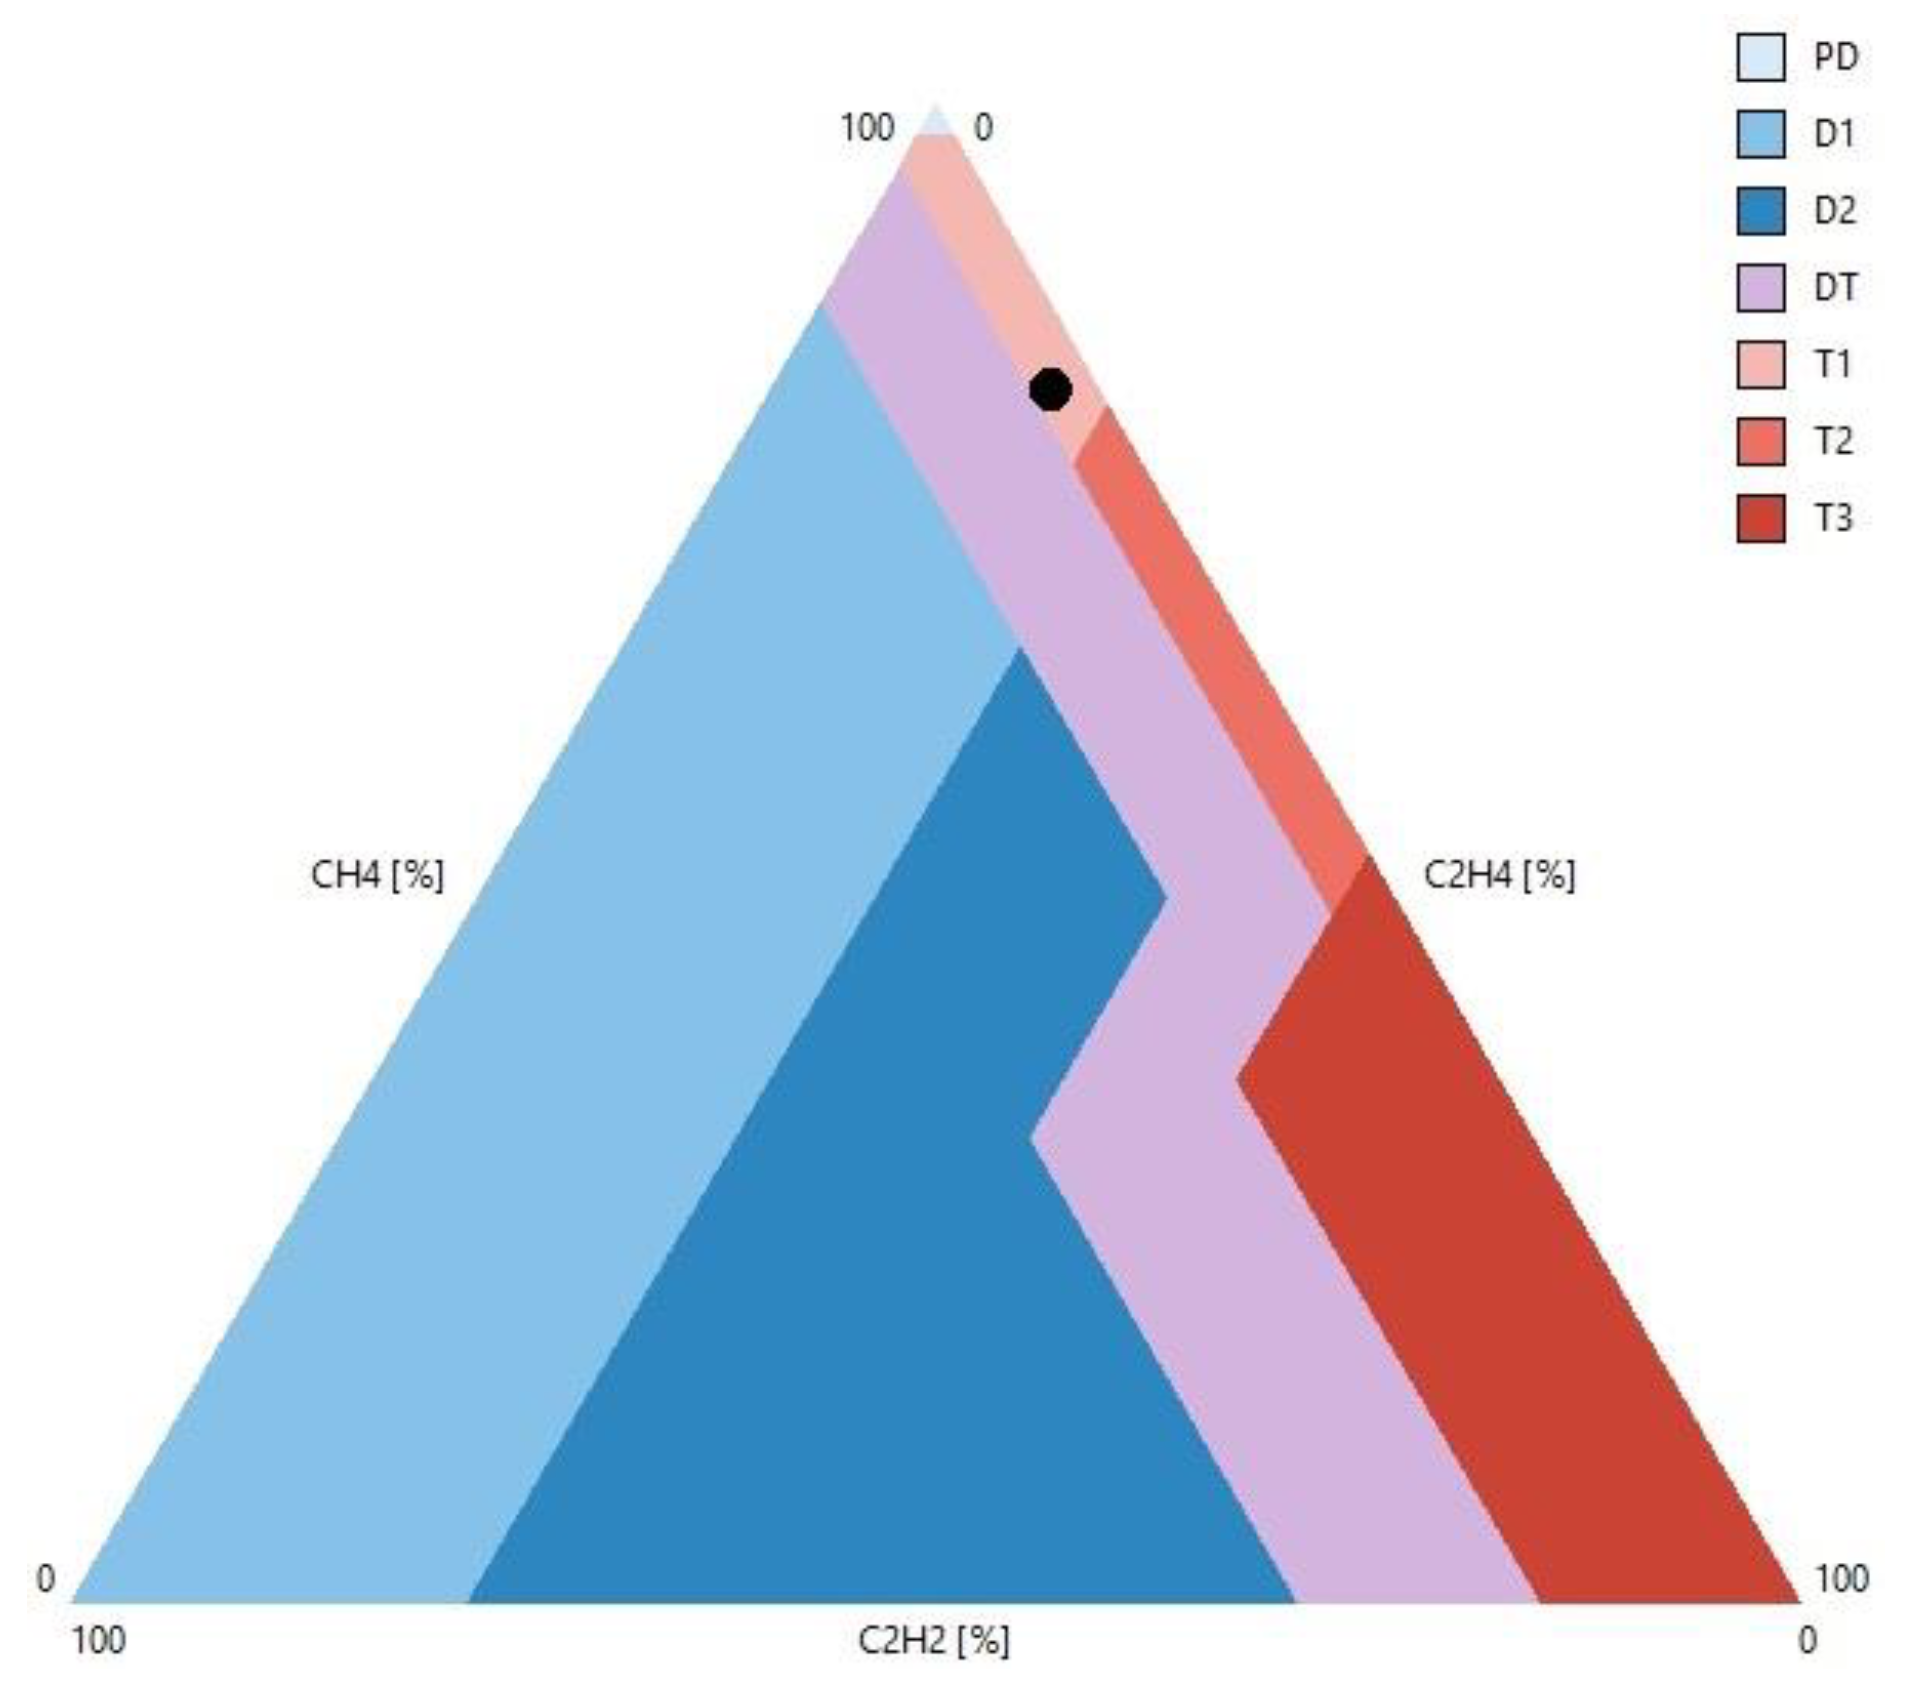
16]. For obtaining a diagnosis or when one cannot be obtained from the ratio method based on the IEC 60599 Standard, the Duval Triangle Method is applied (the triangles are called 1, 4, and 5) [18,23].
A quantity considered in the assessment of the technical condition of transformers is the winding resistance measurement, which belongs to the fundamental electrical measurements and is performed typically when the first level of diagnostic procedure gives information of the potential defect [9]. It is carried out for the de-energized transformer and with the terminals disconnected from the network. Winding resistance is measured between all line terminals of transformers, both at a high voltage (HV) and a medium voltage (MV) or low voltage (LV) site [16,24,25]. An important aspect is that the measured and calculated values of resistances must be given in relation to the reference temperature, which commonly equals to 20 °C. So, if they are measured in another value of temperature, they must be recalculated with simultaneous consideration of the materials of the windings (cooper or aluminum). According to the recommendation of [25], the values of the resistances should not differ by more than 1% from the values given by the transformer manufacturer. In turn, the differences between the resistances corresponding to the distinctive phases, should not be higher than 3%. The measurements of the resistances between the external terminals of the transformer, allow for detection of gaps between the contacts, short circuits, or the conditions of the mechanical and welded connections. These problems might concern the windings and bushings, as well as the de-energized tap changers (DETC) and the on-load tap changers (OLTC). This is because all of these components affect the measured values of resistances. The measurement of winding resistance might be helpful in determining the place of failure, when the dissolved gas analysis indicate local overheating.
Together with the winding resistance measurement, the method of sweep frequency response analysis (SFRA) is widely applied in the diagnostic procedures, when the DGA results (as well as other oil parameters) give information about the suspected defect. The SFRA method is based on applying the frequency modulated AC voltage to one of the terminals of the transformer and performing the measurements of voltage/current (typically voltage) occurring on another transformer terminal. For diagnostic purposes, both amplitude-based observations and angle-based observations in terms of the transfer function in a given range of frequency are used. In practice, the amplitude-based observation is commonly applied [25,26,27,28,29,30,31,32]. According to [16,27] as a useful range of frequencies from the diagnostic point-of-view, the following ranges might be quoted−5 kHz ÷ 1 MHz for power transformers of a rated voltage >100 kV and 5 kHz ÷ 2 MHz for power transformers of a rated voltage <100 kV. The frequencies above 1–2 MHz and below 5 kHz are not used in practical applications of the SFRA method because for frequencies f < 5 kHz, the magnetic residue in the core makes the interpretation of results difficult, and for frequency f > 1–2 MHz, problems with repeatability of the results might appear. The measurements are commonly performed for the windings of each side in typical connection systems—open, short-circuited, with capacitive coupling, and inductive coupling. For each of these systems, the shape of the transfer function is different. The studies carried out till date and experiences from interpreting the results [28,29,30,31,32] have showed that the shape of the transfer function in some ranges of frequencies, might be connected with the given types of defects. These defects have been defined below by taking into account that the frequency limits have not been defined precisely:
  • for f < 20 kHz—residual magnetism, problems with core, open circuits, shorted turns,
  • for 20 kHz < f < 100 kHz—bulk winding movement,
  • for 100 kHz < f < 500 kHz—radial and axial winding deformation,
  • for f > 500 kHz—taps leads, measurement leads, winding connections.
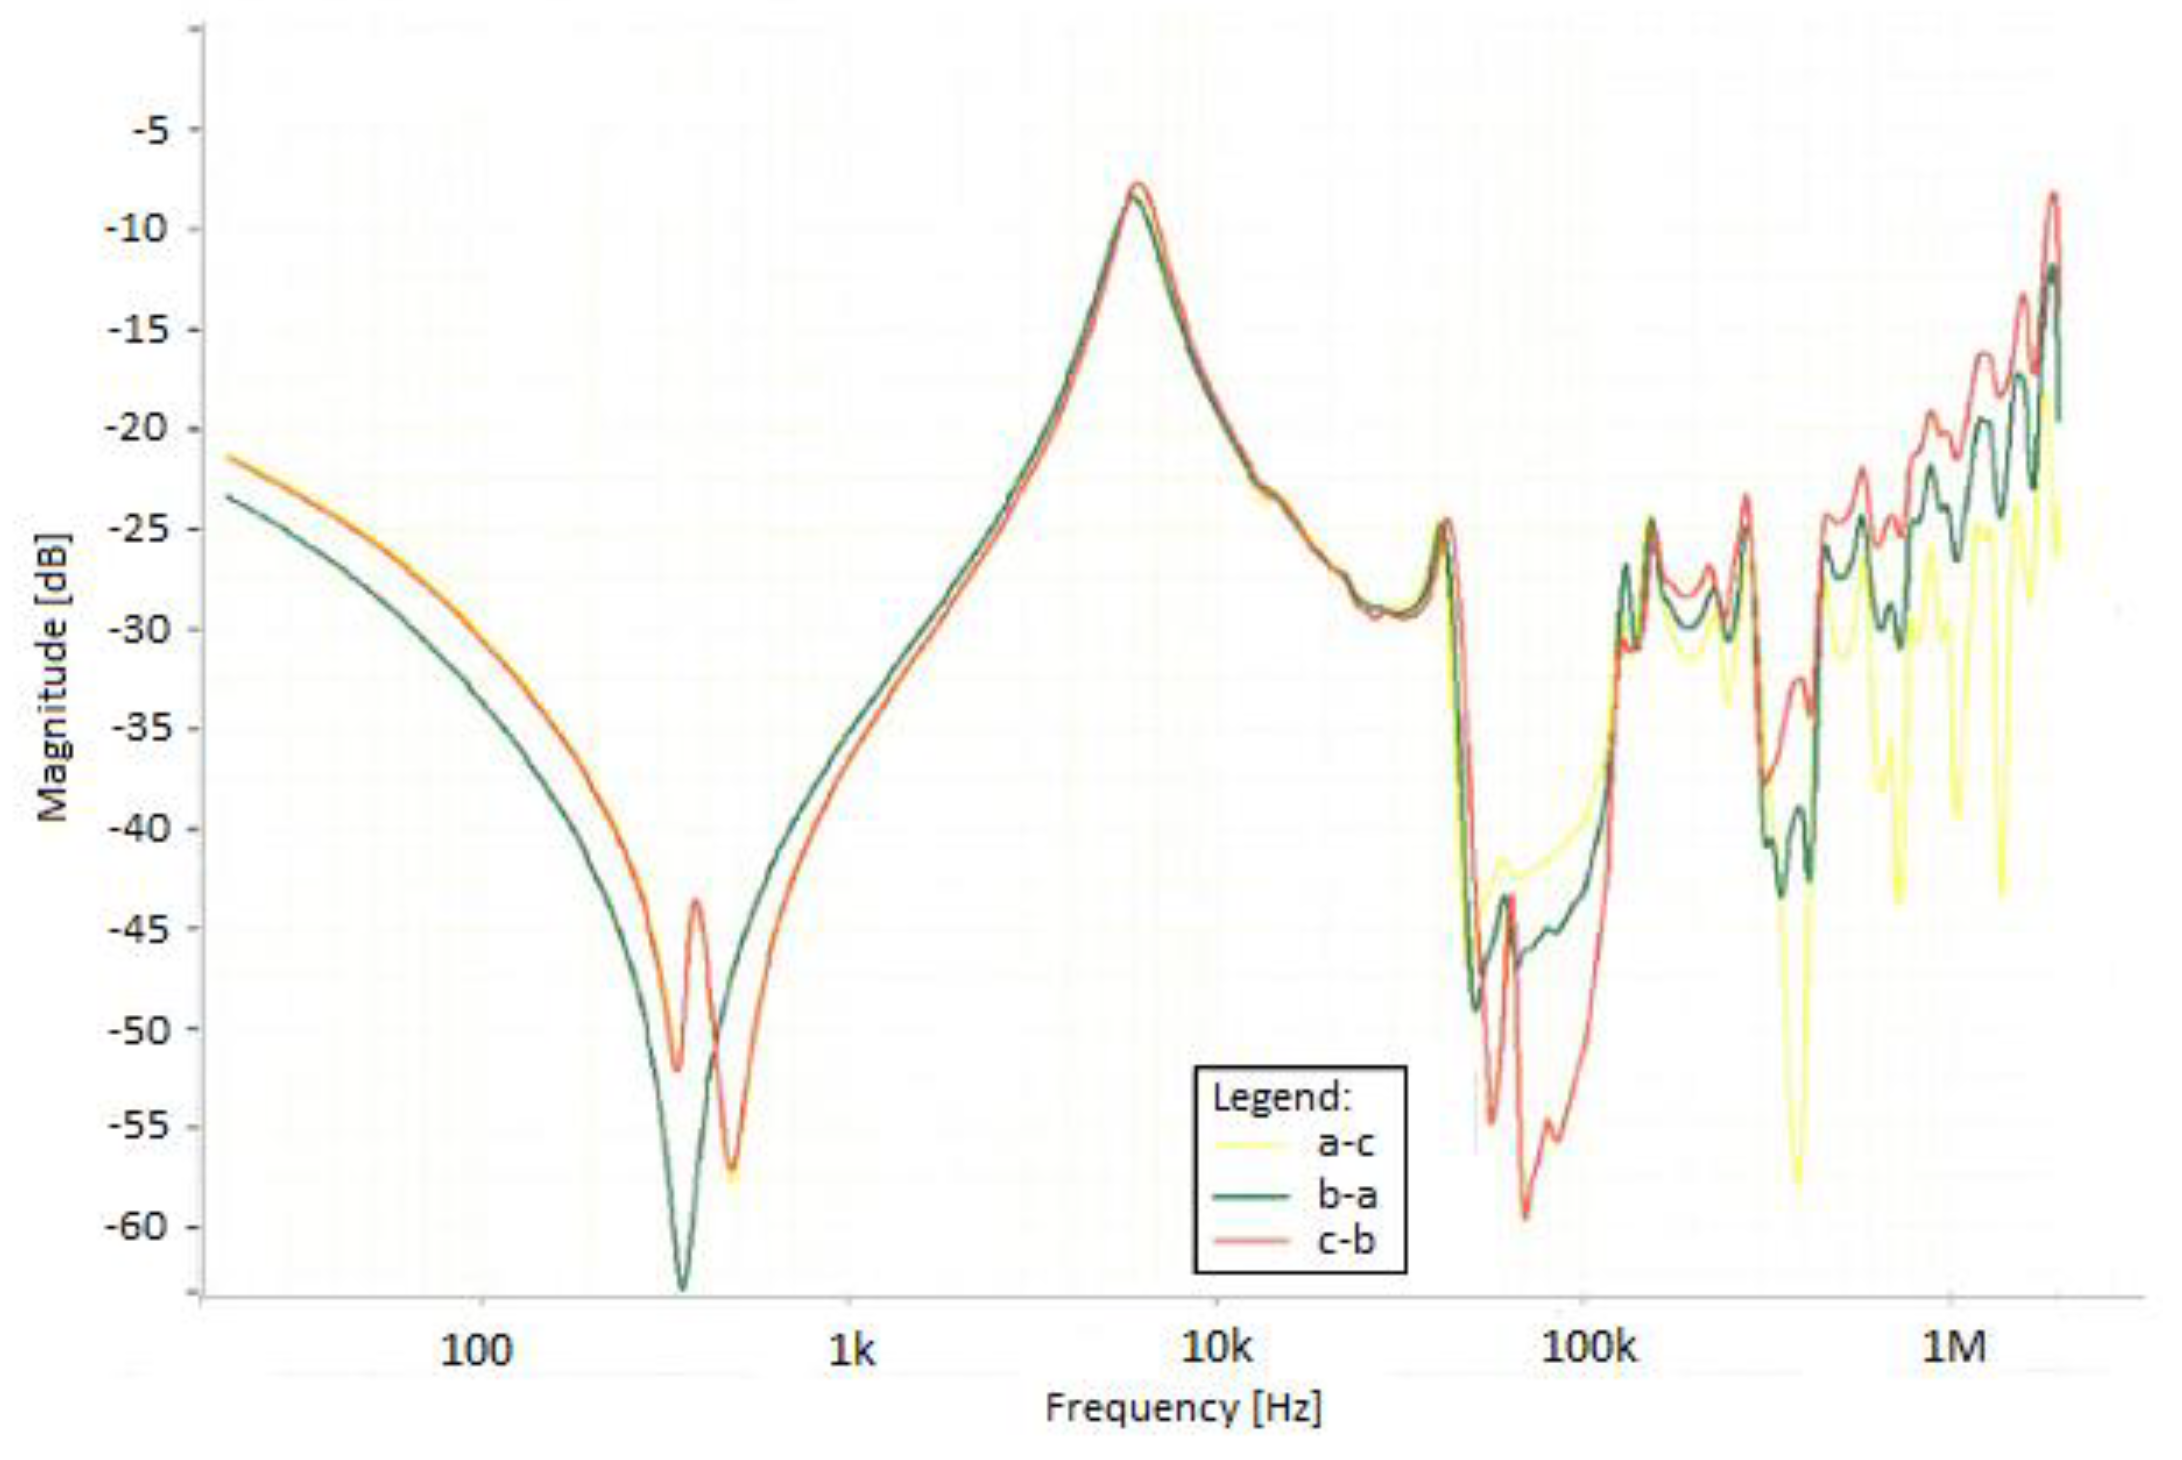
In general, SFRA is a method of comparative character, which means that the actual shape of the transfer function is related to the results obtained in the previous measurement, for the same winding of the same transformer, the measurements performed for other windings of the same transformer, or the measurements carried out for the sister units. For this reason, extensive experience in interpreting the observed transfer functions is required. Additionally, the SFRA measurements are burdened with a large degree of subjectivity of assessment. Attempts have been undertaken for an elaboration of objective criteria and indicators that underline the importance of the changes, but so far these attempts have not been successful.
Taking into account the description presented above, in this paper the authors have decided to present the results of practical use of the mentioned diagnostic measurements in assessment of the technical conditions of the transformers in service, in the form of case studies. The case studies described were specially selected as they represent the situations when availability of historical data about the previous measurements was limited and a quick diagnosis had to be made on the basis of the results from the last measurements. Such situations occur quite often, when the transformer units are taken over from a given management company, without any operating documentation. In such a scenario, the latest measurements are decisive and decisions about diagnostic actions are made on the basis of their results. In the second case only the most recent measurements were considered in the diagnostic procedure as the previous measurements were obtained from different diagnostic companies and were performed by different measurement instruments. This is a common situation in Poland because a transformer management company, due to the applicable law, is obligated to choose a company that performs the measurements on the basis of auction, as a result there is a high frequency of change in companies. Considering this state of affairs, having a diagnostic procedure becomes difficult, as it is a known fact that the differences appear in the results obtained from the measurements made by different laboratories [21]. Additionally, all case studies presented concerned situations where after diagnostic procedure the transformer units were withdrawn from service and directed to the internal inspection. The emphasis was placed on the presentation of the technical reasons that led to such a decision. Then, these reasons were set with the defects identified and the reasonableness of the decision taken was assessed.
The case studies were also chosen from the point-of-view of their importance for researchers, considering the condition monitoring and diagnosis of the transformers in service and the scientists who developed the diagnostic methods that were especially based on DGA.
However, existing methods that recognize the nature of the defect occurring in transformers, on the basis of measured concentrations of gases dissolved in oil have been developed as a result of the analysis of a large number of data derived from real transformer units, or that obtained during experiments carried out in the laboratories where oil is subjected to specific thermal or electrical stresses. An example of a database that was used to develop new diagnostic methods is provided in [33]. In turn, the method of using the sets of gas concentrations dissolved in oil to develop a diagnostic tool is presented in [34]. Thus, the case studies presented, herein, might interest scientists planning the development of methods for interpreting the concentrations of gases dissolved in oil or supplementing the databases with new case studies, where a defect identified on the basis of DGA (using the IEC 60599 Standard and the Duval Triangle Method) has been confirmed by internal inspection.
On the other hand, the presented case studies are important due to the fact that they showed a mutual complementation of various diagnostic methods that required the withdrawal of the transformer from service (such as with the DGA method) with ones that did not require such a withdrawal. Thus, these case studies might be interesting for practitioners who want to confirm the type of damage reported by the DGA.
The presented cases were also consistent due to the fact that the DGA results solely indicated the need to precisely analyze those units in which a certain type of defect might have occurred.
Finally, the data provided herein might also be used later to verify the effectiveness of the diagnostic methods or to develop the computer tools made for interpreting the diagnostic results, e.g., in the process of training and validation of artificial neural networks.

2. Analysis of the Measurement Results and Their Comparison with the Internal Inspection

The four case studies of free-breathing mineral-oil-filled transformers have been analyzed herein. They concern the generator step-up transformer (case Study 1), two network transformers (case Studies 2 and 3), and transformers working in connection with wind turbines (case Study 4). In the first case, the diagnostic procedure was performed in order to switch off the transformer by the Buchholz gas relay. In the rest of the cases, the diagnostic measurements were performed within the routine control.

2.1. Case Study 1

Case Study 1 concerned a generator step-up transformer manufactured in 2004 with a rated power of 30 MVA, a voltage ratio of 110/10.5 kV, and a vector group YNd11. The analysis of the results of the routine measurement of gas concentrations dissolved in oil, performed in accordance with the IEC 60559 Standard [22], and supplemented with analysis of propane (C3H6) and propylene (C3H8) concentrations [16], indicated the appearance of local overheating, in the range of temperatures between 150 °C and 300 °C. Such a diagnosis was confirmed by the analysis using the Duval Triangle 1, which indicated a T2-type thermal fault in the temperature range of 300 °C to 700 °C (Figure 2).
Due to the importance of the unit considered for the operation of an electrical power system, the transformer analyzed was left in service, with recommendation of more frequent analysis of gases dissolved in oil, as well as a detailed monitoring of its load. Unfortunately, after five months of operation, the transformer was switched off by the 1st and 2nd levels of the Buchholz gas relay. This situation forced the diagnostic actions. An oil sample was taken from the transformer and sent for checking the typical oil parameters and gas concentrations. The results obtained from these measurements are shown in Table 4 (basic oil parameters) and Table 5 (concentrations of gases dissolved in oil; the results marked as 2nd in Table 5), respectively. Additionally, in Table 5 the results of the first chromatographic analysis mentioned above, which indicated the appearance of local overheating (marked in this table as 1st), have been quoted. The measured values of the oil parameters (shown in Table 4) fulfilled all requirements of the national transformer operation instructions [16] and they did not arouse any suspicions.
However, the analysis carried out for the gases dissolved in oil sample taken from the transformer after an emergency shutdown, indicated an exceedance of the typical values of concentrations of hydrogen, acetylene, propane, propylene, and carbon oxide. It was also stated that, in relation to the previous measurement, the increase in total combustion gases (TCG) was 656.8 ppm. The ratio method applied in accordance to the IEC 60599 Standard indicated discharge occurrence. This diagnosis was again confirmed by the Duval Triangle Method, which indicated a defect of type D1 (low energy discharges), on the basis of Duval Triangle 1 (Figure 3).
As the level of exceedance of the required values was significant, a decision for internal inspection was made. After untanking the transformer, the defects were identified (presented in Figure 4).
First of all, the defect identified was the loose and damaged clamping elements on phase A. Then, during the process of removing the windings from the core, the damage of both primary (110 kV side) and secondary (10.5 kV side) windings of phase A were identified. The traces from the electric arc (acting of electro-dynamic forces) in the secondary windings and the turn short-circuits in the primary windings were also disclosed on the same phase. The internal inspection carried out, confirmed the initial diagnosis regarding the occurrence of discharges in the transformer insulation, which resulted in the carbonization of the paper insulation visible in Figure 4c, and a failure of the phase A winding, due to a short circuit. Since the windings of transformer phase B and C were not destroyed, a decision was made to rewind phase A and after performing the factory tests, the transformer was returned to service.

2.2. Case Study 2

During the exploitation of the three winding network power transformers with a rated power of 40/20/20 MVA, a voltage ratio of 115/16.5/16.5 kV, and the vector group YNd11d11 manufactured in 1985, the complex measurements were performed in accordance to the diagnostic system applied in the distribution company [9]. These covered the measurements of the magnetization currents, the measurements of the dielectric dissipation factor of winding insulation and bushings, the measurements of core and winding deformation using the SFRA method, the measurement of moisture levels of paper insulation using Frequency Domain Spectroscopy (FDS), the measurement of insulation resistance, and the measurement of windings resistance. As a routine procedure, the oil samples were also taken from the transformer in order to measure the oil parameters and to analyze the concentrations of gases dissolved in oil. The results concerning the oil parameters measured are shown in Table 6. They fulfilled the requirements and indicated a good condition of oil.
In turn, the results of the measurements of concentrations of gases dissolved in oil are shown in Table 7. In order to show a short trend (earlier data were not available), the results obtained 14 months before the considered diagnostic actions have also been quoted.
As can be seen, a significant increase of hydrogen, methane, ethane, and propane, and consequently, an increase in TCG were identified. It was stated that hydrogen, ethane and propane exceeded the typical values in accordance to the [16]. As the adopted procedure required the interpretation of the results, the analysis was also done in accordance with the IEC 60559 Standard using the ratio method and was supported by the Duval Triangle Method. The ratio method indicated that the local overheating did not exceed 300 °C. The defect diagnosed by this method as well as the temperature of overheating were confirmed by a simple calculation based on the concentration of propane and propylene (C3H6/C3H8 = 0.09 and C2H4/C3H8 = 0.12), which, in accordance with the data from Table 3, quoted above, indicated the overheating temperature within the range of 150–300 °C. In turn, the diagnosis obtained after the application of the Duval Triangle Method was a T1 type thermal fault, therefore, the obtained fault was in the same temperature range. The result of the analysis using Duval Triangle 1 is shown in Figure 5.
Since the other measurements were made in the considered transformer, the anomalies were identified on the basis of the results obtained using the SFRA method. These anomalies concerned the tertiary windings and the frequency range between 60 and 100 kHz, as shown in Figure 6. In this range of frequency the windings deformation might be treated as the adopted cause of failure.
On the basis of the DGA data and the SFRA results, decision for an internal inspection was made. As a result of this inspection, the following defects were identified—loose and damaged of clamping elements, windings deformation, and gaps in the elements of solid insulation (pictorially presented in Figure 7).
As in the case Study 1, the internal inspection made possible the recognition of the defect, in accordance with the results of the diagnosis, based on the results of the DGA and the SFRA method. Local overheating clearly resulted from the deformations that occurred, causing a local increase in temperatures, as a result of the limitations of an effective cooling. In turn, the deformations themselves were reflected in the results of the SFRA measurements.
After properly repairing the area of the damaged windings, the transformer was returned to service.

2.3. Case Study 3

During the exploitation of the network power transformer with a rated power 10 MVA, voltage ratio 110/6 kV, and the vector group YNd11 manufactured in 1973, complex measurements were performed as the 2nd level of the adopted diagnostic system [9]. The measurements covered, among others, the measurement of magnetization currents, measurement of insulation resistance, measurement of windings resistance, measurement of basic parameters of oil sample taken from the transformer, as well as a dissolved gas analysis. The oil parameters measured (shown in Table 8) fulfilled the required criteria and indicated a good condition of oil.
However, an analysis of the measured concentrations of the gases dissolved in oil (Table 9) indicated that methane, ethane, ethylene, acetylene, propane, and propylene exceeded the typical values as per [16].
Taking this into account, the evaluation of a potential defect type was carried out on the basis of the recommendations described in the IEC 60559 Standard [22], with simultaneous consideration of the obtained concentrations of propane (C3H6) and propylene (C3H8) [16] and the results of the analysis of the Duval Triangle Method (Figure 8). In the first two cases, the analysis showed that the potential defect was a thermal one, in the range of temperatures 300–700 °C and in one case (Duval Triangle 1) the defect concerned a temperature above 700 °C.
In turn, the results of the winding resistance measurement performed for the HV windings (110 kV) for all positions of the tap changer are shown in Figure 9. The observed increase of resistance for phase C is clearly visible, in comparison to the other phases.
On the basis of the measurement results obtained, the decision for an internal inspection was made. It led to the identification of the burnt lead in phase C of the HV winding. The defect has been pictorially presented in Figure 10.
As was clearly noticed, the local overheating was a result of the identified burnt lead in phase C of the HV winding, which was also apparent in the measurement of the winding resistance. An action was taken and the lead in phase C was repaired. The transformer then passed the comprehensive tests and was returned to service.

2.4. Case Study 4

The 4th case study concerned the transformer, which was selected from a group of several wind turbine generator (WTG) step-up transformers with a rated power of 2.7 MVA, a voltage ratio of 30/0.66 kV, and of the Dyn5 vector group. All units were manufactured in 2008 by the same manufacturer and they were characterized by aluminum windings. In all cases, after a relatively short period of operation (5–8 years), the DGA-based problems were identified. The transformer owner, after five years of operation of the selected unit, decided to perform the first DGA test. The results of this test have been shown in Table 10 as measurement number 1 and have been designated as a “routine test”. As the typical concentrations of the distinctive gases (hydrogen, ethylene, ethane, methane, propylene and carbon dioxide) had exceeded, an attempt to identify a potential defect was made. Interpretation of the results obtained, made in accordance with recommendations of the IEC 60559 standard [22], indicated a thermal defect in the temperature range of 300–700 °C. Simultaneously, following the recommendations of [16], exceedance of a temperature of 700 °C could not be excluded (C3H6/C3H8 = 85.57 and C2H4/C3H8 = 15.06), as shown in Table 3. The latter was also confirmed by the diagnosis based on the Duval Triangle Method, where the T3 type of the thermal defect was identified [9,16,18,21,23]. The results of the analysis using Duval Triangle 1 have been presented in Figure 11.
Since there were no previous measurements of the gases dissolved in oil, the owner of the transformer decided to degas the oil, immediately perform a chromatographic analysis after this, and repeat it after one month. The results obtained in this field are shown in Table 10—the measurements have been marked by numbers 2 and 3 and have been designated as “after degassing” and “1 month later”, respectively. As can be seen in this table, the measurements performed one month after oil degassing revealed a significant increase in the gas concentrations. The exceedance of the typical values by the gases such as hydrogen, ethylene, methane, and acetylene was noticed unambiguously. Interpretation of the results obtained, made in accordance with the recommendations of the IEC 60559 standard [22] and the Duval Triangle 1 clearly indicated a discharge of low energy. The results of the analysis using the Duval Triangle 1 have been presented in Figure 12.
The extremely high increase in the TCG (exceeding 2000 ppm/month) and the suggested type of fault (discharges) caused in directing the transformer towards an internal inspection. As a result, burnt connections (aluminum and cooper) on the regulating windings of phases B and C were identified. Confirmation of this observation can be seen in Figure 13.
After repairing the aluminum–copper connection and applying Cu–Al washers, the transformer was returned into service. Chromatographic analysis of the oil performed after 1 and 2 years of repairing the transformer, did not indicate any abnormalities (Table 10—measurement numbers 4 and 5, designated as “1 year later” and “2 years later”). In the case of the other transformers with the same constructional features and rated parameters that have been mentioned above, the original washers used by the manufacturer were also replaced with those made of Al–Cu.

3. Discussion

The case studies presented in the paper concerned oil-filled power transformers of various nominal voltage and power, their different constructional features, and the different functions they performed in the power system. The transformers were also characterized by different operating time. Despite these differences, the first signal indicating a defect was always obtained as a result of the oil tests, and in particular as a result of information about the gases dissolved in oil. However, in each case, the identified defect differed from the others.
The first case study revealed the weakness of the analysis of gases dissolved in oil—the failure of the analyzed transformer might have occurred between the consecutive oil tests. However, this fact was not a surprise. Such a disadvantage also characterized all operation actions performed at the scheduled time intervals (so-called time-based maintenance). The solution to this problem was the use of continuous monitoring of the selected diagnostic indicators, among which the concentrations of the gases dissolved in oil was treated as one of the most important indicators. In the case of an electrical discharge, which is usually a sudden phenomenon caused by external factors, a continuous monitoring might also be insufficient.
In the literature, it is difficult to find a description of the defects that are indicated by an analysis of the gases dissolved in oil and the SFRA methods, with a simultaneous absence of signals from other diagnostic methods. Therefore, an analysis of case Study 2 should have been interesting. Deformation of the windings detected by the SFRA method could have been a cause of disturbance in the flow of the cooling agent (mineral oil) and could have been a source of local overheating, which in turn was indicated by the DGA results.
The third considered case study showed a good complementation of the DGA method and the measurements of the winding resistance. DGA as a method that does not require turning off the transformer from the service, indicated the nature of the defect. However, performing the winding resistance measurement—a method requiring the transformer to be turned off—was used to identify which transformer element was responsible for the observed thermal defect.
The last of the presented cases indicated that the observation of anomalies in the gas concentrations and detection of their cause during the internal inspection of the transformer would facilitate the elimination of similar constructional errors, in the entire group of transformers originating from a single manufacturer. In this case, after detecting a similar pattern for the gases dissolved in the oil, it was possible to locate the source of gas generation through an analogy to the inspected unit. This allowed for the omission of tedious searches.
In conclusion, all presented cases were combined through a common point—the nature of defect occurring in the transformers was recognized on the basis of measured concentrations of gases dissolved in oil. The IEC 60599 Standard based analysis, as well as the Duval Triangle Method jointly indicated a similar type of defect on the basis of the data available from the latest measurements. As we also had other measurement data, such as SFRA or a winding resistance measurement, the decision process was carried out and an internal inspection was performed. In all cases, the defect identified on the basis of DGA was confirmed by this inspection. Thus, the case studies presented in this paper represent important data which might be used by the scientists who develop diagnostic methods or expert systems, based on DGA. The results presented might also supplement the databases of the expert systems where identification of the defect resulted from a comparison of cases of a similar origin.

4. Conclusions

This paper presented four case studies concerning oil power transformers, which were sent for an internal inspection aimed at identifying the potential defects resulting from previous observations, as a result of the operational events and diagnostic tests. In each case, the internal inspection indicated a presence of defects that were dangerous for a further exploitation of the transformers considered.
The considerations presented confirmed the key role of the measurements of oil parameters, with a particular emphasis on the analysis of the concentrations of gases dissolved in oil in assessment of the technical conditions of the power transformers. Simultaneously, case Studies 2 and 3 showed that just the additional studies (performed in the place of transformer operation, but after de-energizing the transformer) allowed for an identification of the nature of the defect and its general location. It can be assumed that without the SFRA and the winding resistance measurements, the transformers considered would have remained in service with recommendation of oil testing at shorter time intervals.
The experience confirmed by the case studies presented shows that DGA is a very effective tool for detecting and recognizing the general nature of defects that appear in a transformer, but its suitability for defect location without any support from other methods, mainly electrical ones, is weak.

Author Contributions

Conceptualization, T.P.; Data curation, T.P., and R.K.; Formal analysis, T.P., and P.R.; Methodology, T.P., P.R., and R.K.; Supervision, T.P.; Validation, T.P., P.R., and R.K.; Visualization, P.R.; Writing—original draft, T.P., P.R., and R.K.; Writing—review and editing, P.R.

Funding

This research received no external funding.

Conflicts of Interest

The authors declare no conflict of interest.

References

  1. Doukas, H.; Xidonas, P.; Angelopoulos, D.; Askounis, D.; Psarras, J. Distribution Transformers Failures: How does it cost? Evidence from Greece. Energy Syst. 2016, 7, 601–613. [Google Scholar] [CrossRef]
  2. EL-Bassiouny, A.; EL-Shimy, M.; Hammouda, R. Impact of Power Transformer Failures on Customer Interruptions Costs Using Customer Damage Function. In Proceedings of the 2017 Nineteenth International Middle East Power Systems Conference (MEPCON), Cairo, Egypt, 19–21 December 2017. [Google Scholar]
  3. Saha, T. Review of modern diagnostic techniques for assessing insulation condition in aged transformers. IEEE Trans. Dielectr. Electr. Insul. 2003, 10, 903–917. [Google Scholar] [CrossRef] [Green Version]
  4. Rolim, J.R.; Morais, D.R. A hybrid tool for detection of incipient faults in transformers based on the dissolved gas analysis of insulating oil. IEEE Trans. Power Deliv. 2006, 21, 673–680. [Google Scholar]
  5. Sarkar, S.; Sharma, T.; Baral, A.; Chatterjee, B.; Dey, D.; Chakravorti, S. An expert system approach for transformer insulation diagnosis combining conventional diagnostic tests and PDC, RVM data. IEEE Trans. Dielectr. Electr. Insul. 2014, 21, 882–891. [Google Scholar] [CrossRef]
  6. Murugan, R.; Ramasamy, R. Failure analysis of power transformer for effective maintenance planning in electric utilities. Eng. Fail. Anal. 2015, 55, 182–192. [Google Scholar] [CrossRef]
  7. Tenbohlen, S.; Coenen, S.; Djamali, M.; Müller, A.; Samimi, M.; Siegel, M. Diagnostic Measurements for Power Transformers. Energies 2016, 9, 347. [Google Scholar] [CrossRef]
  8. N’cho, J.; Fofana, I.; Hadjadj, Y.; Beroual, A. Review of physicochemical-based diagnostic techniques for assessing insulation condition in aged transformers. Energies 2016, 9, 367. [Google Scholar] [CrossRef]
  9. Rozga, P.; Piotrowski, T.; Kozak, R. Experiences with detection of transformer failure based on insulating oil tests. In Proceedings of the 2017 IEEE 19th International Conference on Dielectric Liquids (ICDL), Manchester, UK, 25–29 June 2017. [Google Scholar]
  10. Kunicki, M.; Cichon, A.; Borucki, S. Measurements on partial discharge in on-site operating power transformer: A case study. IET Gener. Transm. Distrib. 2018, 12, 2487–2495. [Google Scholar] [CrossRef]
  11. Christina, A.J.; Salam, M.A.; Rahman, Q.M.; Wen, F.; Ang, S.P.; Voon, W. Causes of transformer failures and diagnostic methods–A review. Renew. Sustain. Energy Rev. 2018, 82, 1442–1456. [Google Scholar]
  12. Tang, X.; Wang, W.; Zhang, X.; Wang, E.; Li, X. On-Line Analysis of Oil-Dissolved Gas in Power Transformers Using Fourier Transform Infrared Spectrometry. Energies 2018, 11, 3192. [Google Scholar] [CrossRef]
  13. Faiz, J.; Soleimani, M. Assessment of Computational Intelligence and Conventional Dissolved Gas Analysis Methods for Transformer Fault Diagnosis. IEEE Trans. Dielectr. Electr. Insul. 2018, 25, 1798–1806. [Google Scholar] [CrossRef]
  14. Li, E.; Wang, L.; Song, B. Fault Diagnosis of Power Transformers With Membership Degree. IEEE Access 2019, 7, 28791–28798. [Google Scholar] [CrossRef]
  15. Jose, G.; Chacko, R. A review on wind turbine transformers. In Proceedings of the 2014 Annual International Conference on Emerging Research Areas: Magnetics, Machines and Drives, Kottayam, India, 24–26 July 2014. [Google Scholar]
  16. Energopomiar-Elektryka. Framework Instruction of Transformer Operation (FITO); Energopomiar-Elektryka: Gliwice, Poland, 2012. (In Polish) [Google Scholar]
  17. International Council on Large Electric Systems. Transformer Reliability Survey; CIGRE Brochure 642: Paris, France, 2015. [Google Scholar]
  18. Duval, M. A review of faults detectable by gas-in-oil analysis in transformers. IEEE Electr. Insul. Mag. 2002, 18, 8–17. [Google Scholar] [CrossRef] [Green Version]
  19. Noori, M.; Effatnejad, R.; Hajihosseini, P. Using dissolved gas analysis results to detect and isolate the internal faults of power transformers by applying a fuzzy logic method. IET Gener. Transm. Distr. 2017, 11, 2721–2729. [Google Scholar] [CrossRef]
  20. IEEE Std. C57.104-2008. IEEE Guide for the Interpretation of Gases Generated in Oil-Immersed Transformers; IEEE Std. C57.104-2008: Piscatvi, NJ, USA, 2009. [Google Scholar]
  21. Duval, M.; Durkham, J. Improving the Reliability of Transformer Gas-in-Oil Diagnosis. IEEE Electr. Insul. Mag. 2005, 21, 21–27. [Google Scholar] [CrossRef]
  22. IEC 60599 Standard. Mineral Oil-Impregnated Electrical Equipment in Service–Guide to the Interpretation of Dissolved and Free Gases Analysis; IEC 60599 Standard: Geneva, Switzerland, 2007. [Google Scholar]
  23. Duval, M. The Duval triangle for load tap changers, non-mineral oils and low temperature faults in transformers. IEEE Electr. Insul. Mag. 2008, 24, 22–29. [Google Scholar] [CrossRef]
  24. IEEE Std. 62-199. IEEE Guide for Diagnostic Field Testing of Electric Power Apparatus-Part 1: Oil Filled Power Transformers, Regulators and Reactors; IEEE Std. 62-199: Piscatvi, NJ, USA, 2005. [Google Scholar]
  25. International Council on Large Electric Systems. Guide for Transformer Maintenance; CIGRE Brochure 445: Paris, France, 2011. [Google Scholar]
  26. International Council on Large Electric Systems. Mechanical Condition Assessment of Transformer Windings Using Frequency Response Analysis (FRA); CIGRE Brochure 342: Paris, France, 2008. [Google Scholar]
  27. IEEE std. 57.149. IEEE Guide for the Application and Interpretation of Frequency Response Analysis for Oil-Immersed Transformers; IEEE std. 57.149: Piscatvi, NJ, USA, 2012. [Google Scholar]
  28. Alsuhaibani, S.; Khan, Y.; Beroual, A.; Malik, N. A review of Frequency Response Analysis methods for power transformer diagnostics. Energies 2016, 9, 879. [Google Scholar] [CrossRef]
  29. Samimi, M.H.; Tenbohlen, S.; Akmal AA, S.; Mohseni, H. Effect of Different Connection Schemes, Terminating Resistors and Measurement Impedances on the Sensitivity of the FRA Method. IEEE Trans. Power Deliv. 2017, 32, 1713–1720. [Google Scholar] [CrossRef]
  30. Lewandowski, K.; Moranda, H. Detection of windings short-circuits in a power transformer using the SFRA method. Prz. Elektrotech. 2018, 94, 118–121. [Google Scholar]
  31. Kuniewski, M.; Zydron, P. Analysis of the Applicability of Various Excitation Signals for FRA Diagnostics of Transformers. In Proceedings of the 2018 IEEE 2nd International Conference on Dielectrics, Budapest, Hungary, 1–5 July 2018. [Google Scholar]
  32. Banaszak, S.; Szoka, W. Cross Test Comparison in Transformer Windings Frequency Response Analysis. Energies 2018, 11, 1349. [Google Scholar] [CrossRef]
  33. Duval, M.; dePablo, A. Interpretation of gas-in-oil analysis using new IEC publication 60599 and IEC TC 10 databases. IEEE Electr. Insul. Mag. 2001, 17, 31–41. [Google Scholar] [CrossRef]
  34. Diaa-Eldin, A.M. Development of a New Graphical Technique for DGA in Power Transformers Based on the Five Combustible Gases. IEEE Trans. Dielectr. Electr. Insul. 2015, 22, 2507–2512. [Google Scholar]
Figure 1. General scheme used for the assessment of transformer technical conditions, based on the analysis of the gases dissolved in oil.
Energies 12 02155 g001
Figure 2. Defect indicated by the Duval Triangle Method performed as routine measurement for a 30 MVA, 110/10.5 kV power transformer.
Energies 12 02155 g002
Figure 3. Defect indicated by the Duval Triangle Method for 30 MVA, 110/10.5 kV power transformer performed after an emergency shutdown of the transformer.
Energies 12 02155 g003
Figure 4. The damages identified during the internal inspection of 30 MVA, 110/10.5 kV step-up generator transformer. (a) Loose and damaged clamping elements, (b) turn short circuits in primary (high voltage) windings, and (c) traces from the electric arc (acting the electro-dynamic forces) in the secondary windings.
Energies 12 02155 g004
Figure 5. Defect indicated by the Duval Triangle Method for 40/20/20 MVA, 115/16.5/16.5 kV power transformer.
Energies 12 02155 g005
Figure 6. Results of the sweep frequency response analysis (SFRA) measurements for tertiary windings in an open system.
Energies 12 02155 g006
Figure 7. The damages identified during an internal inspection of the 40/20/20 MVA, 115/16.5/16.5 kV power transformer: (a) Loose and damaged clamping elements, (b) windings deformation, and (c) gaps in the elements solid insulation.
Energies 12 02155 g007
Figure 8. Defect indicated by the Duval Triangle Method for 10 MVA, 110/6 kV power transformer.
Energies 12 02155 g008
Figure 9. Resistance of the high voltage (HV) windings (110 kV side) of 10 MVA, 110/6 kV network power transformer.
Energies 12 02155 g009
Figure 10. Damage identified during internal inspection of a 10 MVA, 110/6 kV power transformer.
Energies 12 02155 g010
Figure 11. Defect indicated by the Duval Triangle Method for a 2.7 MVA, 30/0.66 kV power transformer for a 1st measurement designated as “routine test”.
Energies 12 02155 g011
Figure 12. Defect indicated by the Duval Triangle for a 2.7 MVA, 30/0.66 kV power transformer for a 3rd measurement designated as “1 month later”.
Energies 12 02155 g012
Figure 13. Damage identified during an internal inspection of a 2.7 MVA, 30/0.06 kV power transformer.
Energies 12 02155 g013
Table 1. Typical gas concentrations in ppm according to [16].
GasGenerator Step-Up TransformerNetwork Transformer
H2 (hydrogen)260350
CH4 (methane)250200
C2H6 (ethane)160170
C2H4 (ethylene)250260
C2H2 (acetylene)2070
C3H8 (propane)4030
C3H6 (propylene)4040
CO (carbon oxide)280260
CO2 (carbon dioxide)35004000
Table 2. Defect types recognized in the ratio method as per IEC 60599 Standard [22].
C2H2/C2H4CH4/H2C2H4/C2H6
Partial dischargesNot significant<0.1<0.2
Discharges of low energy>10.1–0.5>1
Discharges of high energy0.6–2.50.1–1>2
Thermal defect at T < 300 °CNot significant>1<1
Thermal defect at 300 °C < T < 700 °C<0.1>11–4
Thermal defect at T > 700 °C<0.2>1>4
Table 3. Additional criteria for determining the temperature of thermal defect [16].
Gas RatiosTemperature Range [°C]
150–300300–700>700
C3H6/C3H8<22–6<6
C2H4/C3H8<33–15<15
Table 4. Results of the measurements of oil sample taken from 30 MVA, 110/10.5 kV power transformer.
ParameterValue
MeasuredRequired [16]
Appearancefulfill criteriaclear, no separated water and solid particles
Fire point (°C)144≥130
Acid number (mg KOH/g)0.01≤0.25
Moisture content (ppm)10.2≤25
Dielectric dissipation factor at 50 °C0.004<0.07
Resistivity at 50 °C (Ωm)67.8 × 10⁹>5 × 10⁹
AC breakdown voltage (kV)66.0≥45
Table 5. Gas concentrations measured for the oil samples taken from 30 MVA, 110/10.5 kV power transformer (exceedance of the typical values is marked in bold font).
GasGas ConcentrationsGas Increase
1st2nd[16]
(ppm)(ppm)(ppm)(ppm)
H2 (hydrogen)10.6319.2260308.6
CH4 (methane)24.060.525036.5
C2H6 (ethane)55.252.1160-
C2H4 (ethylene)13.247.125033.9
C2H2 (acetylene)0.0139.920139.9
C3H8 (propane)81.848.940-
C3H6 (propylene)52.142.140-
CO (carbon oxide)385.4569.3280183.9
CO2 (carbon dioxide)6539.21644.93500-
Sum of total combustion gases TCG622.31279.1-656.8
1st—refers to the data from the 1st chromatographic analysis identifying the local overheating; 2nd—refers to the data from the 2nd chromatographic analysis made after switching the transformer off by the Buchholz gas relay; [16]—refers to the typical gas concentrations according to [16].
Table 6. Results of the measurements of oil sample taken from a 40/20/20 MVA, 115/16.5/16.5 kV power transformer.
ParameterValue
MeasuredRequired [16]
Appearancefulfill criteriaclear, no separated water and solid particles
Fire point (°C)135≥130
Acid number (mg KOH/g)0.071≤0.25
Moisture content (ppm)18.0≤25
Dielectric dissipation factor at 50 °C0.0044<0.07
Resistivity at 50 °C (Ωm)50.8 × 10⁹>5 × 10⁹
AC breakdown voltage (kV)72.4≥45
Table 7. Gas concentrations measured for oil samples taken from a 30 MVA, 110/10.5 kV power transformer (exceedance of the typical values is marked in bold font).
GasGas ConcentrationsGas Increase
1st2nd[16]
(ppm)(ppm)(ppm)(ppm)
H2 (hydrogen)164.0742.0350578.0
CH4 (methane)48.6148.020099.4
C2H6 (ethane)52.1237.0170184.9
C2H4 (ethylene)13.930.026016.1
C2H2 (acetylene)7.55.070-
C3H8 (propane)10.9251.030240.1
C3H6 (propylene)17.122.0404.9
CO (carbon oxide)500.988.0260-
CO2 (carbon dioxide)1889.51692.04000-
Sum of total combustion gases TCG975.71555.0-579.3
1st—refers to the data from the 1st chromatographic analysis made 14 months before the considered diagnostic actions; 2nd—refers to the data from 2nd chromatographic analysis; [16]—refers to the typical gas concentrations according to [16].
Table 8. Results of the measurements of oil sample taken from a 10 MVA, 110/6 kV power transformer.
ParameterValue
MeasuredRequired [16]
Appearancefulfill criteriaclear, no separated water and solid particles
Fire point (°C)146≥130
Acid number (mg KOH/g)0.12≤0.25
Moisture content (ppm)6.0≤25
Dielectric dissipation factor at 50 °C0.012<0.07
Resistivity at 50 °C (Ωm)17.0 × 10⁹>5 × 10⁹
AC breakdown voltage (kV)79.0≥45
Table 9. The gas concentrations measured for oil samples taken from 10 MVA, 110/6 kV power transformer (exceedance of the typical values is marked in bold font).
GasGas Concentrations
Measured (ppm)Typical (ppm)
H2 (hydrogen)132350
CH4 (methane)713200
C2H6 (ethane)807170
C2H4 (ethylene)1089260
C2H2 (acetylene)5170
C3H8 (propane)63830
C3H6 (propylene)219140
CO (carbon oxide)480260
CO2 (carbon dioxide)30004000
Sum of total combustion gases TCG6101-
Table 10. Gas concentrations measured for the oil samples taken from a 2.7 MVA, 30/0.66 kV power transformer (exceedance of the typical values is marked in bold font).
GasGas Concentrations
Measured (ppm)Typical (ppm)
123456
Routine TestAfter Degassing1 Month LaterAfter Repairing1 Year Later2 Years Later
H2 (hydrogen)881.01.51464.14.819.916.4350
CH4 (methane)1183.40.6202.42.524.120.3200
C2H6 (ethane)1141.31.163.65.523.716.9170
C2H4 (ethylene)4445.91.3179.12.35.65.4260
C2H2 (acetylene)26.80.0486.40.00.00.070
C3H8 (propane)29.60.05.61.35.46.830
C3H6 (propylene)2532.90.023.80.00.41.240
CO (carbon oxide)122.78.424.4132.8232.1192.5260
CO2 (carbon dioxide)4419.2556.6840.91389.01122.41268.44000
TCG10,363.612.92449.4149.2311.2259.5-

