1. Introduction
Recent decades have seen growing energy demand due to the increasing trend of industrialization in the world as well as population growth. Crude oil, or petroleum, is a major source of energy in power generation systems, and most countries import crude oil and its derivatives to cope with their increasing energy demand.
In the United States, new methods of oil exploration (such as fracking) and the exploration of new oil regions (such as Bakken formation in North Dakota) have resulted in crude oil production boom. In 2016, the US became the largest exporter of refined petroleum products [
1]. Rail is the primary method of shipping this crude oil (also referred to as just “crude” in this manuscript), since a major pipeline system meant to transport it has been indefinitely delayed [
2].
From 2010 to 2015, crude oil shipments from the Midwest to the rest of the US have steadily increased [
3]. With rail crude now supplying more than half of the east coast refineries’ feedstock [
3], the stress on the aging rail infrastructure has been thrown into sharp relief, with many crude oil derailments and crashes in recent years. These generally result in devastating oil fires and loss of life and property [
4,
5,
6].
Upgrading US rail infrastructure is an expensive and time-intensive undertaking, and, meanwhile, the crude has to be transported to fulfil the nation’s energy needs. Therefore, a stop-gap solution must be developed to control the combustion behavior of crude in the event of a derailment. The first step for that is the measurement and quantification of combustion properties of various US crudes, which is one of the objectives of this paper.
The well-established experimental setup used in present research has been previously used to determine combustion characteristics of liquid fuels [
7,
8,
9] and yields convenient measurement of vital important properties such as ignition delay [
9] and burning rates [
7,
8,
9]. Furthermore, this method is implementable at a lab scale, uses small sample quantities, and promotes spherical symmetry of the droplet as it burns. The latter is important for the eventual mathematical modeling of the combustion process. Treating crude as a multicomponent liquid fuel, this paper establishes the experimental burning rate and ignition delay of sub-millimeter sized droplets of various crudes.
There are several challenges involved with determining the combustion characteristics of crude as a liquid fuel. The physical and chemical properties of crude oils depend on the production lot and the region of origin, which cause variation in crude oil combustion characteristics. Because of its multicomponent nature, the crude oil combustion process runs quite differently compared to a pure single-component liquid fuel. The presence of various hydrocarbons, each with their own viscosity, density, and boiling point, in crude oils present a challenge in the burning mechanism of this fuel [
10,
11].
The combustion process of this kind of multicomponent fuel can be associated with an unsteady burning process with a sudden fragmentation of fuel droplets, called a microexplosion. A microexplosion in droplet combustion occurs when the droplet’s internal temperature exceeds the homogeneous nucleation temperature of a fuel component, which results in the formation and growth of a vapor bubble inside the fuel droplet. The growing vapor bubble ultimately shatters the surrounding liquid fuel into smaller fragments that burn more efficiently. Microexplosions have been widely discussed in literature for multicomponent fuel droplet combustion in normal and reduced gravity [
12,
13,
14,
15,
16,
17,
18,
19]. Although concerns have been raised on the role of supporting fiber as a nucleation site for bubbling, the microexplosions of fiber-supported droplets have been widely studied [
15,
16,
17,
18,
19].
Only a few systematic studies of crude oil combustion characteristics appear in the literature, but they are mostly related to pool fires. Iwata et al. [
20] studied variations in the burning behavior of crude oils based on small-scale free-burning pool fire data. They conducted tests to measure the heat release rate based on oxygen consumption calorimetry, radiative heat flux from the flame, mass loss rate, liquid fuel temperature, and the concentration of CO
2 and CO in the exhaust gas for various crude oils. They observed that the heat release rate, mass loss rate, and flame radiation were a function of the type of crude oil. The effect of surface area on the in-situ combustion of crude oil was investigated by Drici and Vossoughi [
21] through tests on crude oil alone and in the presence of clays, silica, and alumina with variable surface areas. They observed that decreasing the crude oil/surface area ratio enhanced the low-temperature oxidation peak. They also found that additives with a large specific surface area shifted a large portion of the exothermic heat from a higher to a lower temperature range. Kok et al. [
22] studied the oxidation of crude oil in a porous medium under pressurized conditions to simulate in-situ combustion during oil recovery using high pressure thermogravimetric analysis (HPTG). They observed three distinct reaction regions from the HPTG curves in an oxidizing environment subjected to a constant heating rate. These were low-temperature oxidation, fuel deposition, and high-temperature oxidation. The method of Coats and Redfern was used to obtain kinetic parameters, and the results were discussed. An investigation of the combustion process of crude oil was performed by Nowak et al. [
23]. A top-mounted combustor was scaled down from the baseline system, and different types of crude oil were burnt in the atmospheric test rig. They studied the combustion process by measuring temperature and velocity field distributions in the combustion chamber for different injector designs’ parameters. They also measured the molar fraction of CO
2 and compared it to the injector parameters.
The research presented in this work was carried out on crude oil acquired from the Rocky Mountain oil production region (Colorado), the Northern Great Plains oil production region (Bakken-North Dakota), the Northeast oil production region (Pennsylvania), and the Gulf Coast oil production region (Texas). Although there can be significant variety in crude oil properties,
Table 1 presents the typical properties of Colorado, Pennsylvania, and Texas crudes from [
24] and the typical properties of Bakken crude from [
25].
The main goal of the research presented in the work is to gain knowledge of the crude oil combustion mechanism. An analysis of the results of the burning rate, ignition time, and microexplosion behavior at the scale of a single spherical fuel droplet is presented in this work. This research has been formulated to lay the groundwork for the eventual modification of crude combustion behavior using physical and chemical means to improve transportation safety. Various nanomaterials [
8,
9] and polymeric additives [
7] are envisioned to be used in the future to bring about such combustion behavior modifications.
2. Experimental Procedure
The experimental apparatus was inspired by the original work of Avedisian et al. [
26] and Bae et al. [
27] and was previously used in the work presented by Singh et al. [
9]. Three 16 µm silicon-carbide (SiC) fibers are fixed between six posts, as shown in
Figure 1. A sub-millimeter-sized droplet is suspended at the center point of the fibers. The upper limit to the initial size of the droplets (or
d0) is kept sub-millimeter because larger droplets cannot be supported by the support fibers. Droplet size was also influenced by the need to exceed the criteria described by Avedisian and Jackson [
28] to keep (
d0/
dfiber) >13 to match burning rates close to those of unsupported droplets. For the present study, a ratio of 60 > (
d0/
dfiber) > 48 was maintained.
Semi-circular heating coils of 1 mm diameter are positioned in close proximity on either side of the droplet. These coils are made of 36 gauge Kenthal with a resistance of 4 Ω each and are connected to a power supply of 15 V to make them glow red-hot. Combined, they produce energy equivalent to 14.06 J in a typical experiment where they are energized for 500 ms. The coils are mounted on the end-effectors of solenoids. A microcontroller (Arduino Uno), in sync with the high-speed camera, waits for a signal from the computer when the process is to be initiated. Upon receiving the signal, it further signals the coils to glow for a pre-determined time (typically 500 ms as previously noted) and start the combustion process. The process of droplet combustion is captured by a black and white IDT X-StreamVision XS-3 CCD camera operated at 1000 frames per second and fitted with a 105 mm lens (Nikon AF Micro-Nikkor-F/2.8, Tokyo, Japan). Back-lighting is provided by a single bright white LED at 3.3 V.
Simultaneously, the combustion event is magnified with a concave mirror (4.0″ diameter, 9.0″ focal length) and recorded with a Casio EXILIM Pro EX-F1 CMOS camera (Casio, Tokyo, Japan) at 600 frames per second. As the coils are signaled to start glowing, an indicator light (bright white LED) is switched on by the microcontroller at the same time. The field of view of the CMOS camera is large enough to capture both the combustion process and the indicator light. The obtained color video footage is post-processed using MATLAB® (MathWorks, Natick, MA, USA) to extract all frames sequentially. The images obtained are 8-bit/channel RGB frames with 432 × 192 pixels resolution. There is a delay of 1.7 ms between two consecutive frames, so the exact time between the indicator light switching on and the combustion process starting can be calculated by counting the number of frames between the two processes. Similarly, total combustion time can also be calculated.
The CCD camera yields 8-bit grayscale images with 948 × 592 pixels resolution. To obtain the size of the droplet, the combustion process CCD camera images are post-processed using Fiji/ImageJ, an open-source digital image processing software developed by several laboratories [
29,
30,
31]. The SiC suspending wires are so small that a typical droplet starts out almost perfectly spherical. As combustion progresses, there are microexplosions within the droplet that distort its shape, so a corrective procedure is done to calculate equivalent diameter [
8,
32,
33]:
where
and
are the major and minor droplet diameters. As stated earlier, crude oil samples from various US oil fields (identified as Colorado, Bakken-North Dakota, Pennsylvania, and Texas) were obtained for this research. All samples obtained were light and sweet paraffinic types.
3. Results and Discussion
In all the samples tested during this study, most of the combustion process is marked by the presence of microexplosions (
Figure 2). The beginning of the experimental process consists of the ignition coils heating the droplet, which leads to volumetric expansion. This is marked by an increase in normalized droplet area
in Zone I (
Figure 3,
Figure 4 and
Figure 5) and has been reported in the literature before by Singh et al. [
9]. Since the droplet is being heated but does not catch fire until the end of Zone I, this zone is also termed ignition delay. The end of Zone I is marked by a decrease in normalized droplet area
.
After ignition has been achieved, the general behavior of all crude oils is steady combustion with the added component of puffing and microexplosions for most of the duration of their combustion. However, several distinct zones were evident and will be explained in the subsequent sections. Bakken, Colorado, and Pennsylvania crude oils show almost the same behavior. As explained above, there is a swell in the droplet as it expands due to heating. As combustion is initiated and the fuel vaporizes to burn in the flame, the droplet shrinks. At the start of the combustion process, there is a period of steady burning accompanied by a few microexplosions (Zone II), which gives way to a period of violent microexplosions (
Figure 2) in Zone III, which then gives way to a period of steadier burning with smaller-intensity microexplosions in Zone IV (
Figure 3,
Figure 4 and
Figure 5). All these combustion regimes can be classified as distinct zones.
This combustion behavior can be explained by the highly multicomponent nature of crude oil. Crude oil consists of different components that boil at low, intermediate, and high temperatures. In the beginning, the droplet is relatively cold, and Zone II burns steadily with very few microexplosions because there is very little differential boiling. As combustion progresses, the low and intermediate fractions start to bubble and evaporate, causing a large amount of microexplosions, as seen in Zone III. As these components bubble out and escape, and the droplet temperature continues going up, only fractions that have higher boiling points are left, for the most part, and a steadier combustion regime with lower microexplosion intensity is seen in Zone IV.
Texas crude oil burns aggressively from beginning to the end, with violent microexplosions. This can be attributed to the presence of water with a boiling point, as well as presence of the other low-boiling components in this crude. The burning properties of Texas crude pose substantial problems for accurate image processing to obtain reliable burning rates. Therefore, burning rates have only been calculated for Bakken, Pennsylvania, and Colorado crudes.
Unless otherwise noted, at least five experiments were performed for each crude. After post processing, the average of the combustion rates, microexplosion behavior, ignition delay, and total combustion time from these experiments yielded the general combustion properties of that particular fuel, with the standard deviation serving as the error.
3.1. Burning Rate of Fuel Droplets
Bakken, Colorado, and Pennsylvania crudes show several distinct combustion zones (
Figure 3,
Figure 4 and
Figure 5). Zone IV (Steady Combustion + Low-intensity Microexplosion Combustion Regime) shows a much clearer and meaningful combustion trend than Zone III (Violent Microexplosion Combustion Regime). Zone IV also comprises a significant amount, if not the majority, of the total combustion regime in all experiments conducted with Bakken, Colorado, and Pennsylvania crudes. For this reason, only the Zone IV burning rates have been calculated for these crudes. Zone IV is non-existent for Texas crude because the entirety of that crude oil type is spent in Zone III; this is discussed further in the following section, which outlines the microexplosion characteristics of all fuel types. As droplet combustion progresses, the heat from the flame causes more fuel to evaporate from the droplet surface. This vaporized fuel then burns in the flame. The overall effect is a shrinkage in the droplet diameter, which, in this research, was recorded using a high-speed camera at 1000 frames per second. The variation of diameter
d at a given time
t follows the well-known quasi-steady theory of droplet combustion, which can be calculated as [
34,
35]:
where
is the diameter of droplet at time
,
is the initial droplet diameter, and
is the combustion or burning rate. It can be seen from Equation (2) that the higher the
, the faster the droplet burns. The moving averaging method was used to reduce data from the original dataset, and the reduced data was used to calculate the combustion rate. At least five experiments were conducted for each fuel type, and the combustion rate for each experiment was calculated separately. An average of all experiments conducted for a single fuel yielded the average combustion rate for that fuel, and the standard deviation for the same served as the error for the calculation (
Figure 6). It was found that the combustion rates of Bakken, Colorado, and Pennsylvania crudes are very close (
Figure 6). Nominally, Pennsylvania crude was found to be the fastest burning of the three, and Bakken crude was found to be the slowest.
3.2. Microexplosion Behavior
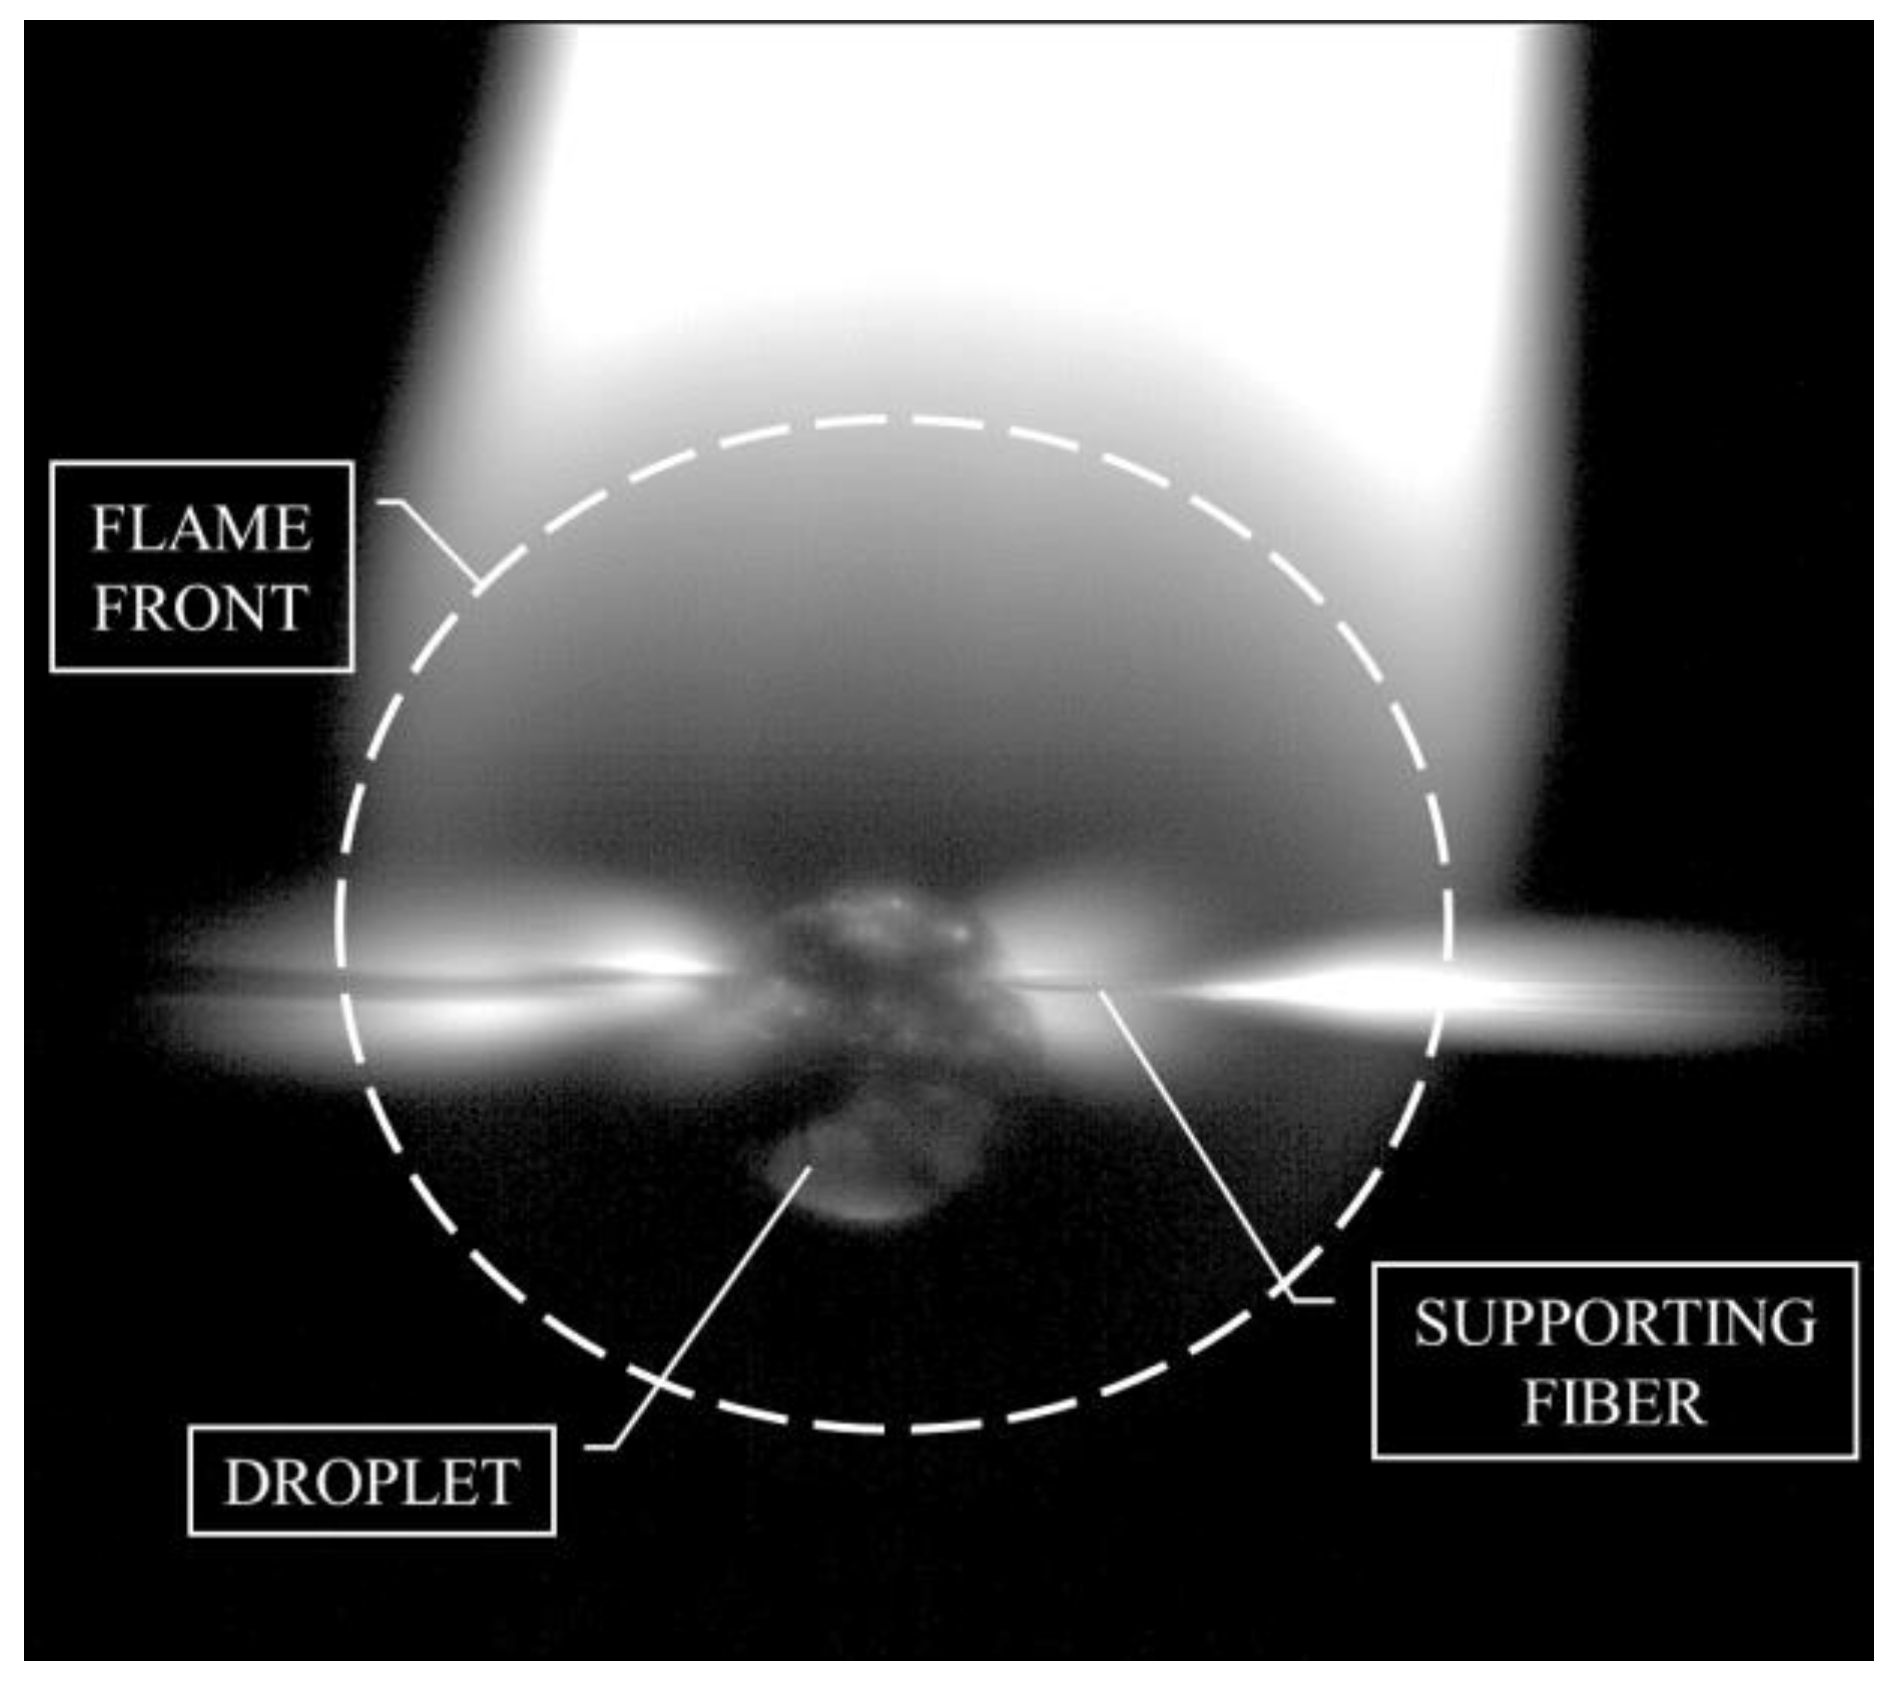
Microexplosions during droplet combustion are characterized by two phases: puffing and explosion (
Figure 7). During puffing, small bubbles form and build up inside the droplet. As stated before, these bubbles comprise the low-boiling-point fractions in the crude oil. For the most part, nucleation is homogeneous throughout the volume of the fluid (
Figure 8), as found by Lasheras et al. [
36]. The interaction between the bubbles is difficult to quantify because the process is very fast and visibility is limited, but they appear to travel one by one to the droplet surface. Once they arrive at the droplet surface, they pop, releasing hot and readily combustible vapor to the flame. This results in an explosion that causes the whole droplet to distort and smaller droplets to be ejected; this event is termed a “microexplosion.” Droplet distortion due to microexplosions can sometimes entrain bubbles into the liquid bulk, consistent with previous research by Wang et al. [
37], which suggests that air entrainment can contribute to microexplosions. The puffing and explosion phenomena can be observed as a rapid spike and dip, respectively, in the evolution of the
data of a given droplet (
Figure 3,
Figure 4 and
Figure 5). Avedisian et al. [
34] described two sorts of microexplosions: “balloon burst” and “spitting.” Bakken, Pennsylvania, and Colorado crudes display the spitting microexplosion, while Texas crude displays both spitting and balloon burst microexplosions (
Figure 9). In comparison to these multicomponent fuels, note that single-component fuels, such as soy-based biodiesel, displayed very little to no microexplosions [
9].
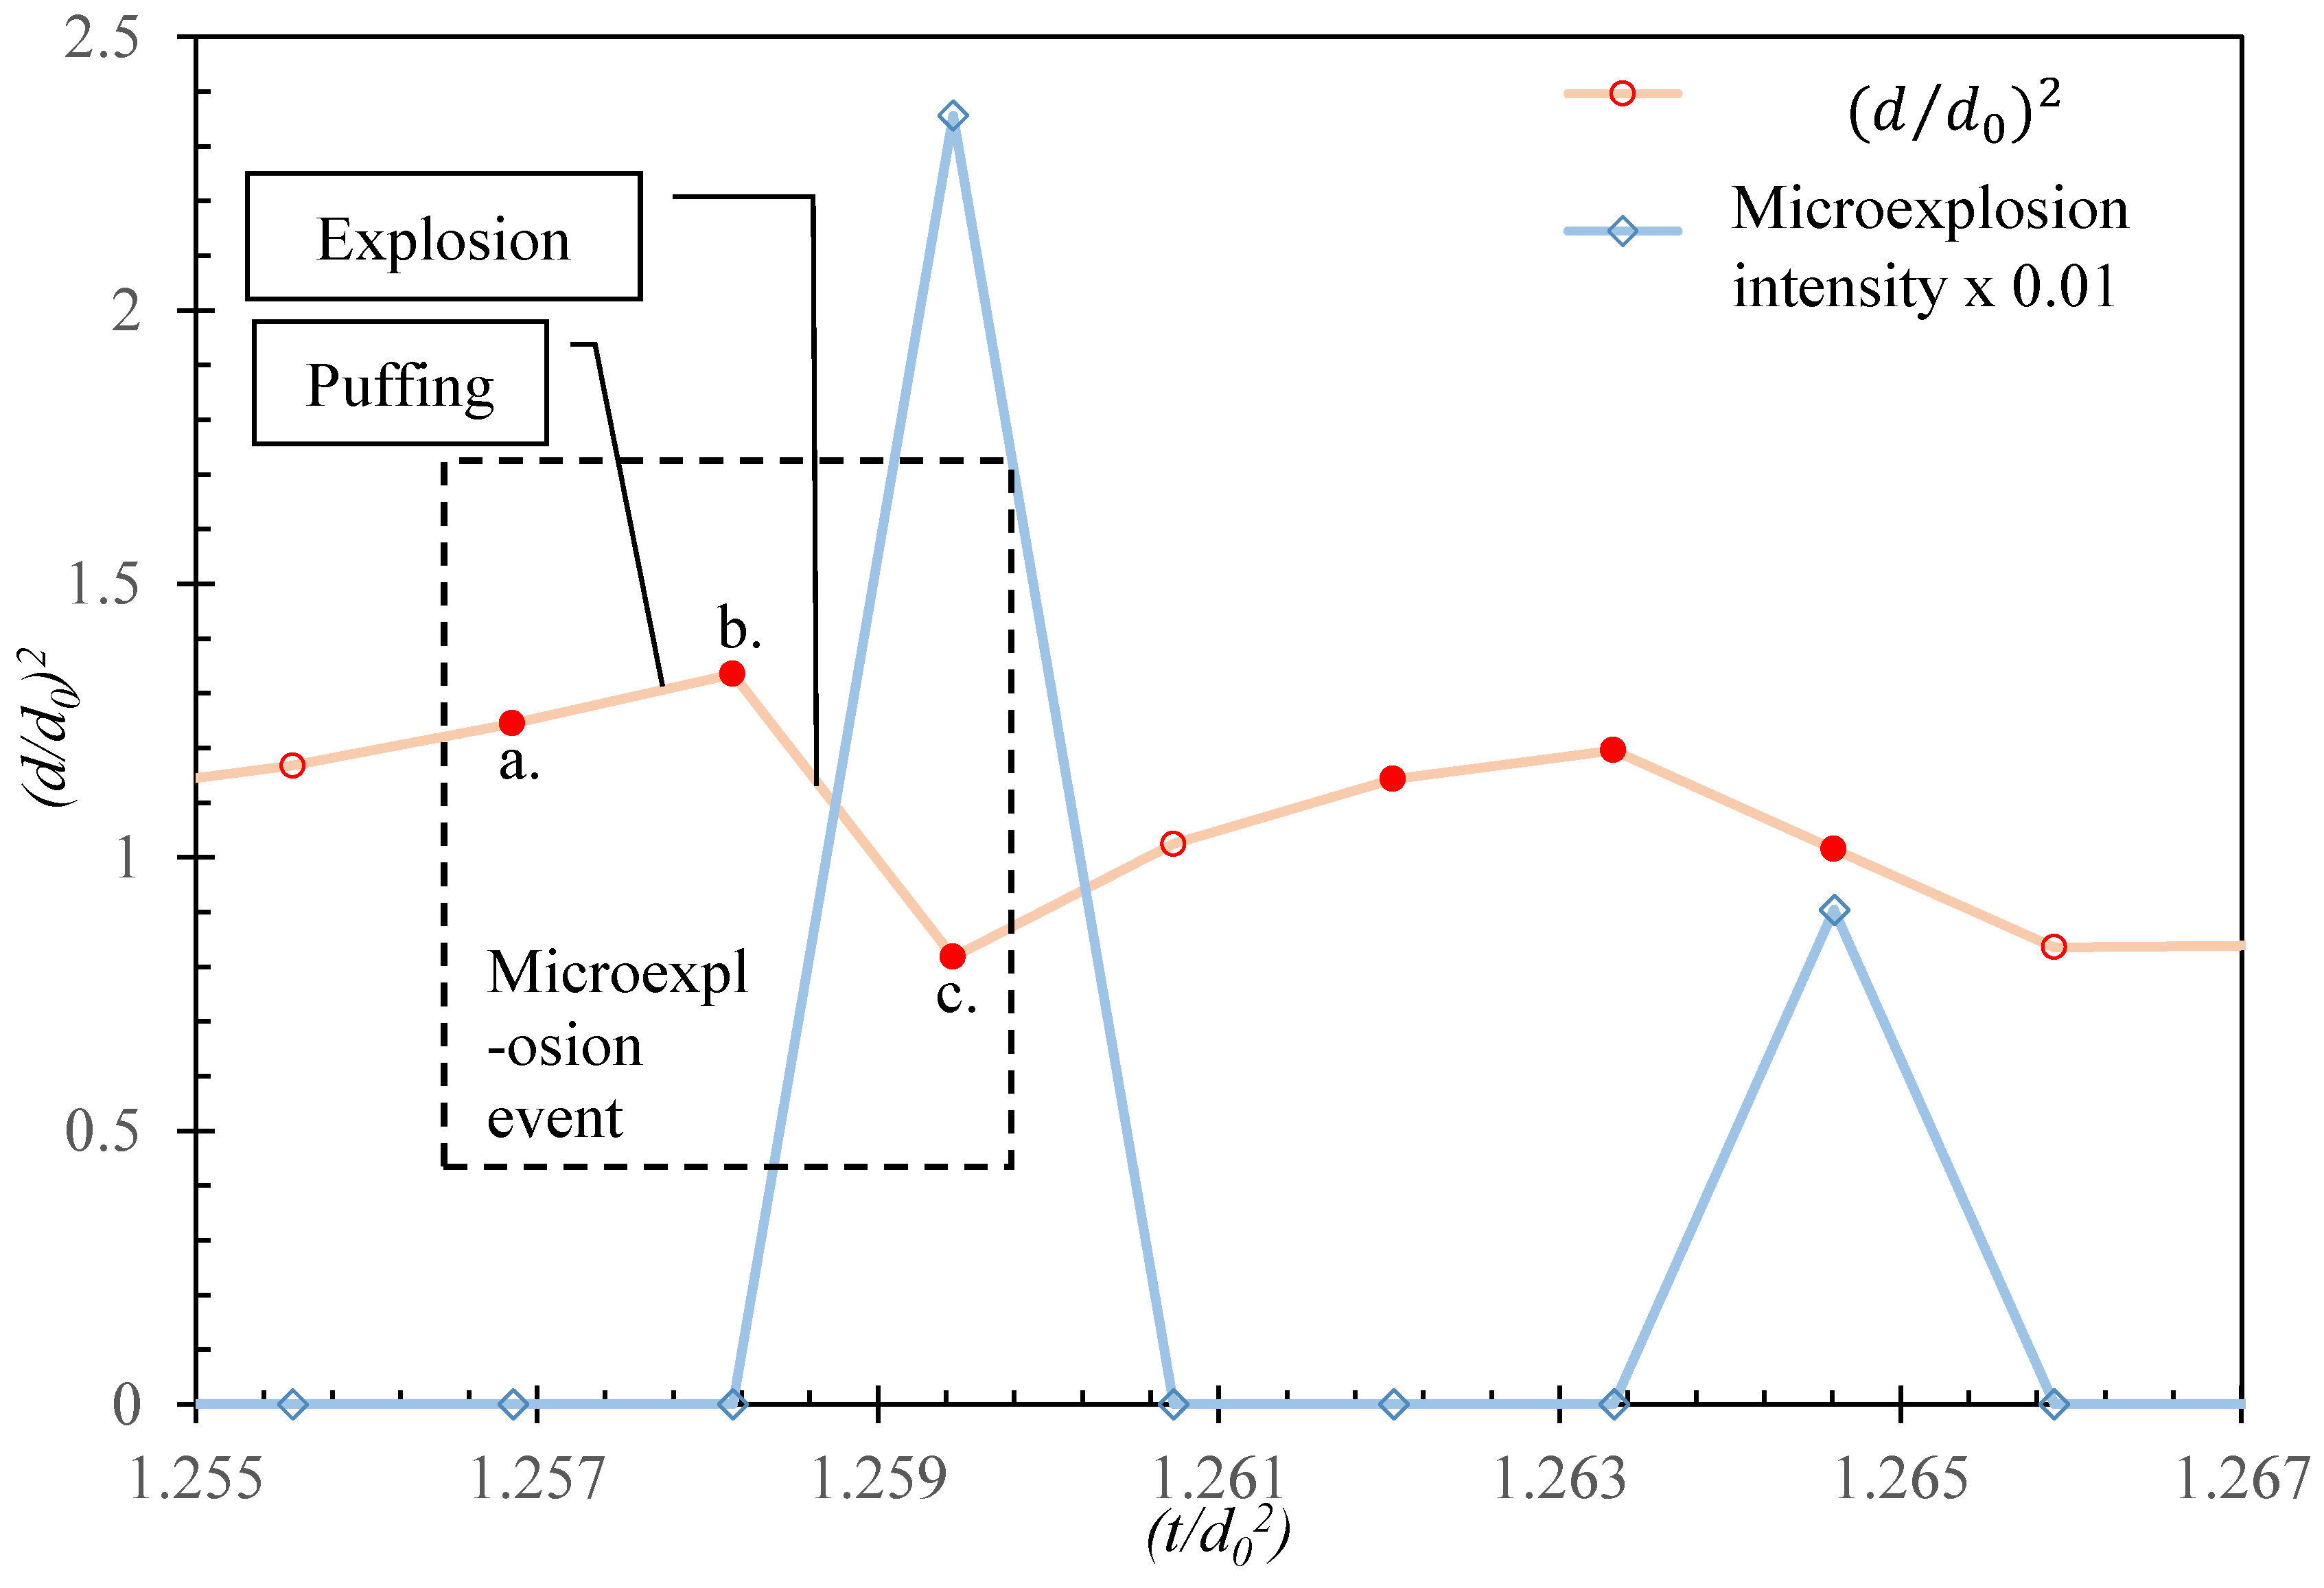
The puffing and explosion phenomena can be observed as a rapid spike and dip, respectively, in the evolution of
data of a given droplet (see
Figure 10). This information can be used to characterize microexplosion intensity. A single microexplosion, as shown in
Figure 10, is characterized by a local maxima with a local minima in the
plot. The puffing process takes place from (a) to (b) and is characterized by a sharp rise in
. The explosion takes place from (b) to (c) and is marked by a sharp decrease in
. A stronger, more intense, microexplosion can, therefore, be characterized by having a sharper puffing and/or a sharper explosion region in a given amount of time. Microexplosion intensity for a given microexplosion event can, therefore, be quantified as:
where
I is the intensity of the microexplosion event,
, and
.
The intensity of microexplosion events for Zone III for all experiments was calculated. The average number of microexplosion events and intensity for each fuel was then calculated, as well as the standard deviation. The latter served as the error for these calculations (
Figure 11). Texas crude surpassed all other crudes in average intensity of microexplosions, which also attests to the highly explosive burning behavior captured by the CCD and CMOS cameras. Among the Bakken, Pennsylvania, and Colorado crudes, Bakken has the highest average microexplosion intensity.
3.3. Ignition Delay Time
Ignition delay is the time a given fuel droplet takes to start burning after heating coils have been activated. It measures how easily a given fuel droplet will ignite—the smaller the ignition delay, the easier it is to ignite the fuel. Ignition delay time was measured using footage obtained from the CMOS camera, with data input from the CCD camera. A MATLAB code was used to extract all frames from the CMOS footage, and the number of frames between the heating coils being activated and the combustion process starting was counted. Since the footage was recorded at 600 frames per second, the time difference between any two consecutive frames is about 1.7 ms. Texas crude oil was found to have the maximum average ignition delay of all crudes tested (
Figure 12). This can be explained by its higher initial boiling point and higher specific gravity (
Table 1) compared to the other crudes. Together with its high microexplosion intensity (
Section 3.2), this also points towards the presence of a relatively high water-content in Texas crude, which is common in many crude oils. Bakken crude had the smallest average ignition delay in all crudes tested (
Figure 12). This can be explained by the very light nature of this crude oil, with a low initial boiling point and low specific gravity (
Table 1), which points to the presence of a large number of low-boiling constituents. Operator error caused ignition delay experimental data to be available for only three experiments for Bakken, leading to a smaller error bar for that crude. Note that these data cannot be supplemented with additional data at this time, since ignition delay is highly sensitive to heating coil size and shape, and the heating coil for this experimental set is not available anymore.
3.4. Total Combustion Time
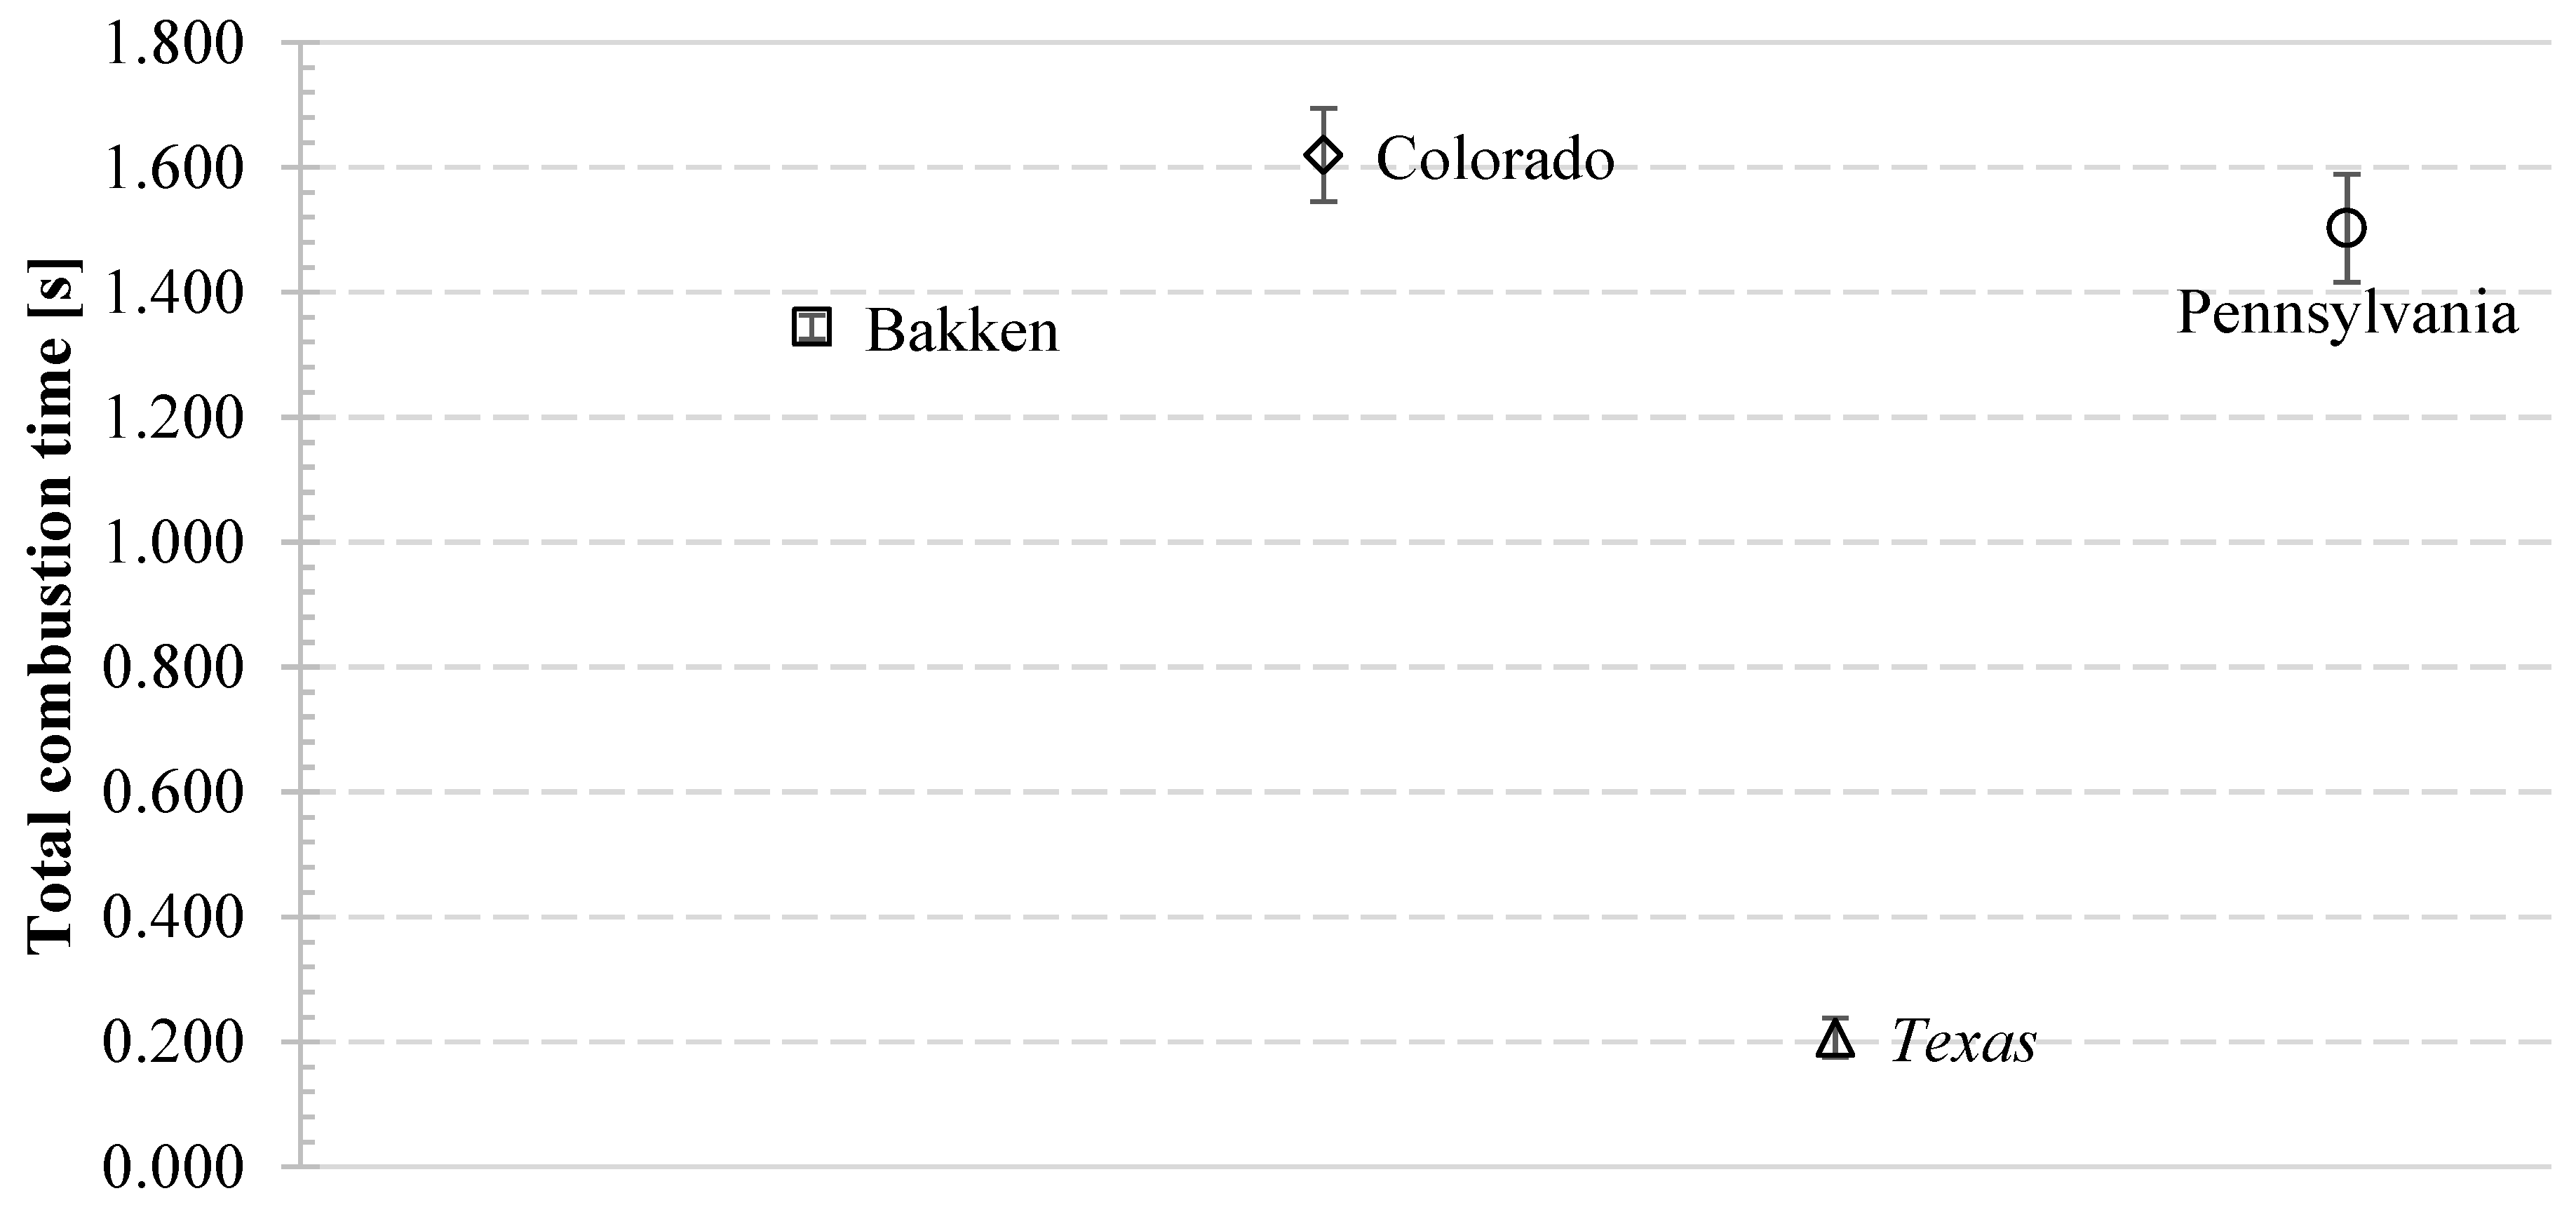
The technique to measure total combustion time is the same as that used to measure ignition delay. However, frames are counted between combustion initiation and combustion extinction. According to
Figure 13, Colorado crude oil burns the longest. Due to its highly explosive and aggressive nature, Texas crude is found to nominally have the smallest total combustion time. This is misleading because most of the volume of the fuel escapes via microexplosions, and neither camera has a field of view large enough to account for all of it. Therefore, in a meaningful way, Bakken crude has the least total combustion time. This is due to its relatively high microexplosion intensity, leading to relatively high liquid loss. Notably, total combustion time experimental data for only two experiments was available for Bakken, leading to a smaller error bar for that crude.
3.5. Soot Residue Analysis
Figure 14 shows the flame structure of a Pennsylvania crude oil droplet, where soot incandescence is visible in the upper regions of the flame. It is also found that Bakken, Colorado, and Pennsylvania crudes leave a soot residue on the supporting fiber after the combustion process has stopped. This soot residue which can be further analyzed to gain more information about the combustion process. Another advantage of soot residue analysis is to find the particulate size in the emissions that can be expected to result from a crude oil fire. This can help determine the appropriate respiratory equipment for fire damage control crews. As shown in
Figure 9, Texas crude fluid volume mostly escapes via microexplosions and leaves no soot residue behind. All soot residue samples were tested using a Hitachi S-4800 SEM at the Central Microscopy Research Facility at the University of Iowa.
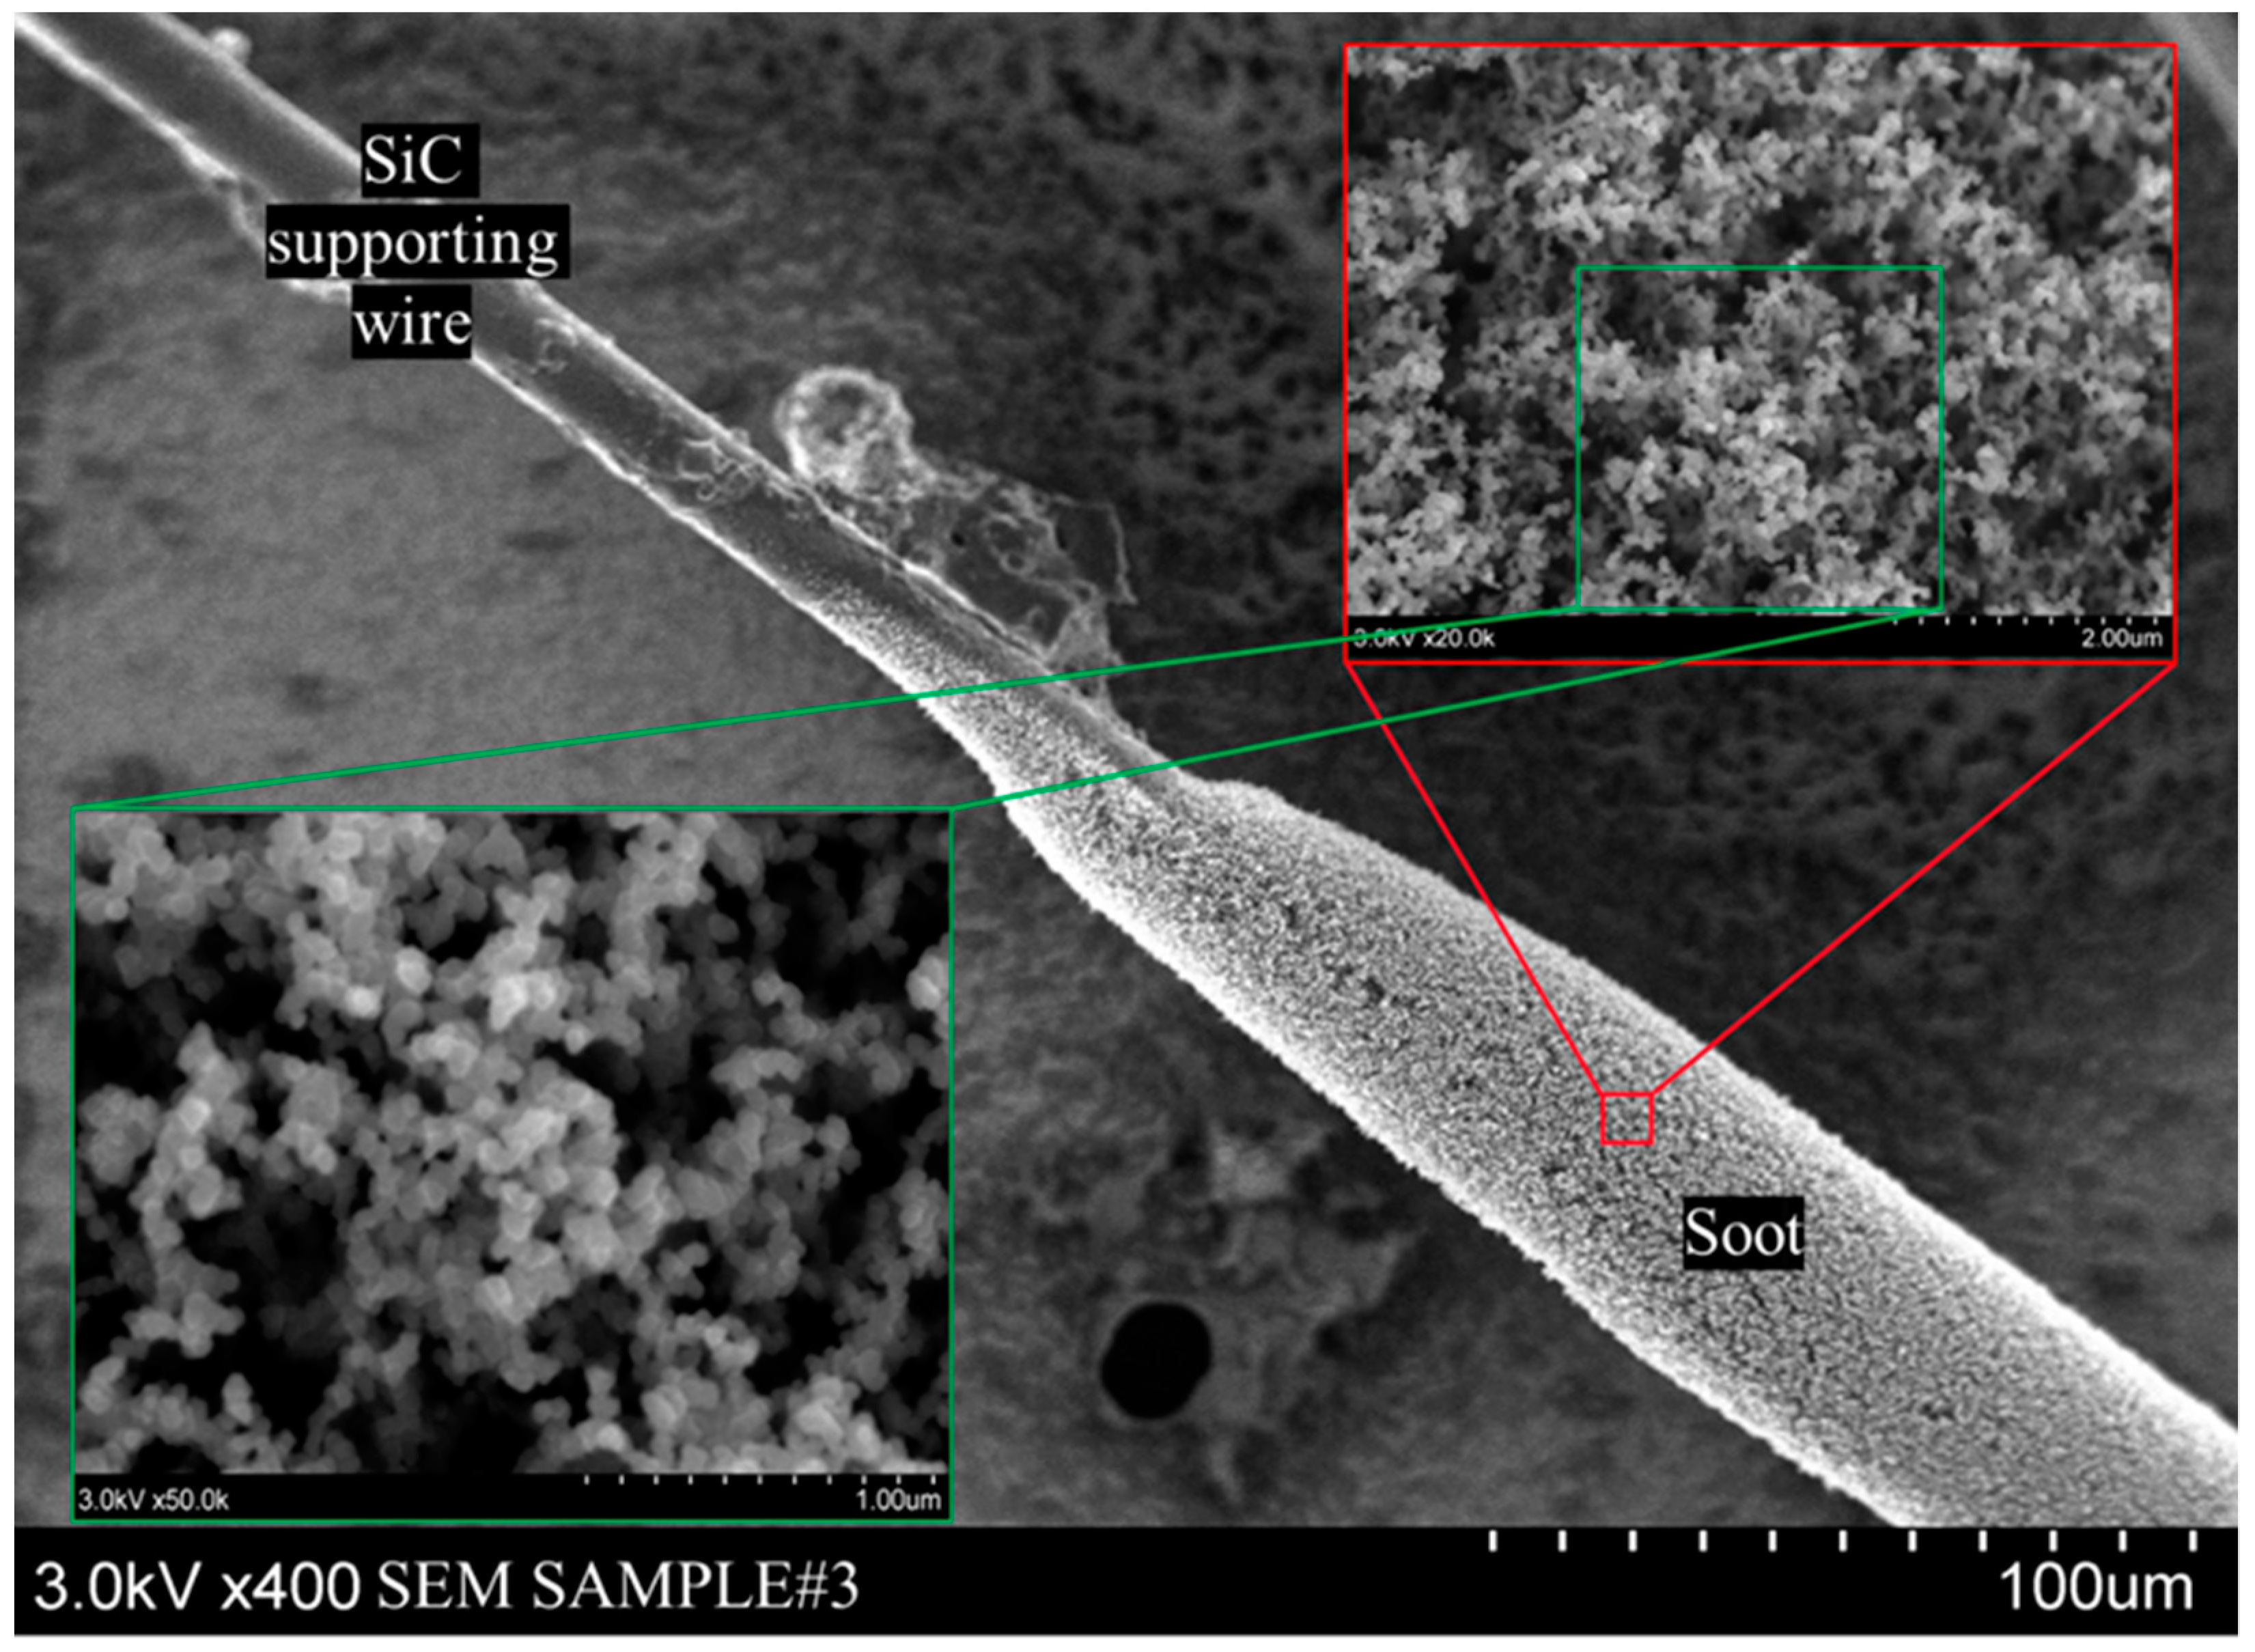
Figure 15 shows a representative soot sample from a Colorado crude oil combustion experiment. The SiC support wire can be clearly seen, along with the soot deposited on it. The SEM can zoom into the surface of the soot deposit, where individual soot particles are visible. However, the instrument is limited by the electric conductivity of the sample, and finely resolving very small structures (such as in
Figure 16IIb) can be challenging.
Figure 16 compares the soot structures of Bakken, Pennsylvania, and Colorado crude oils. Bakken and Colorado crudes leave behind a spongy, high porosity soot structure with almost spherical individual soot particles with an average size of ~70 µm. Pennsylvania crude leaves behind a more compact spongy soot structure where string-like elements are clearly visible (
Figure 16IIa). The individual soot particles average ~20 µm. Ultimately, the soot residue and its structure are highly dependent on the chemical makeup of the fuel.
4. Conclusions
The study focused mainly on fuel droplet combustion and ignition analysis to compare the burning behavior of four different crude oils at atmospheric pressures and temperatures. Various properties, such as combustion rate, microexplosion intensity, ignition delay, total combustion time, and sooting behavior were presented and discussed.
Bakken, Pennsylvania, and Colorado crude oils burned with four different combustion regimes, whereas Texas crude oil burned very explosively.
For the largest and most dominant combustion regime, burning rates for all crudes were found to be comparable. Nominally, Pennsylvania crude burned the fastest and Bakken crude burned the slowest.
Texas crude was found have the most intense microexplosions of all crudes tested.
Texas crude also had the highest ignition delay, while Bakken had the lowest. Colorado crude had the highest total combustion time, and Bakken had the lowest.
Soot analysis with SEM revealed that Bakken and Colorado crudes left a loose, spongy soot residue with individual soot particle sizes of 70 µm, but Pennsylvania crude left behind a more densely packed structure with much smaller average soot particle sizes of 20 µm. This can be attributed to the difference in the chemical compositions of these mixtures.
Properties, such as burning rate, are envisioned to be used in future work to validate numerical combustion models of complex multicomponent liquid fuels. It is expected that this research will also generate interest in exploring the combustion behaviors of other crude oil types and how best to modify them.


