Article

Cadmium Addition Effects on Anaerobic Digestion with Elevated Temperatures

Research Center for Engineering Ecology and Nonlinear Science, North China Electric Power University, Beijing 102206, China
*
Author to whom correspondence should be addressed.
Energies 2019, 12(12), 2367; https://doi.org/10.3390/en12122367
Submission received: 7 May 2019 / Revised: 11 June 2019 / Accepted: 18 June 2019 / Published: 20 June 2019
(This article belongs to the Section B: Energy and Environment)

Abstract

:
Anaerobic fermentation with biogas as an energy source is influenced by the presence of heavy metals. However, the availability of the heavy metals is dependent on the digestion temperature. In this study, the impacts of Cd on the characteristics of biogas, substrate biodegradation, and enzyme activity during anaerobic co-digestion were investigated under varying digestion temperatures. The results showed that 1 mg/L initial Cd concentration improved cumulative biogas yields by 404.96%, 16.93%, and 5.56% at 55 °C, 45 °C, and 35 °C, respectively. In contrast, at low temperatures (25 °C), the yield decreased by 0.77%. In the 55 °C group, Cd addition improved the activity of cellulase (p < 0.05) and coenzyme F420 (p < 0.01). The total chemical oxygen demand (COD) during the peak period and the transformation of hydrolytic organic components into volatile fatty acids (VFAs) influenced the CH4 and biogas yields. There were no significant differences in cellulase, dehydrogenase, and coenzyme F420 activities with or without Cd addition when the digestion temperature was 45 °C, 35 °C, and 25 °C. Therefore, thermophilic digestion is recommended for the efficient degradation of Cd-contaminated biowaste. Moreover, the impact of metals on the performance of anaerobic digestion should be considered together with temperature conditions in future research and practice.

1. Introduction

Lignocellulosic biomass wastes, which are being generated in large amounts annually, can be used as an energy resource by sustainable technologies, such as anaerobic digestion [1,2,3]. The digestion microorganism in the reactors requires a trace amount of certain metals for optimal growth and performance [4]. In the past decades, the impacts of cadmium (Cd) on anaerobic digestion received great attention since it is a metal of major environmental and human concern [5,6,7,8].
Previous studies reported that the toxicity of Cd influenced the efficiency and amount of CH4 formation [9,10,11,12]. However, only few studies showed that the biogas yields during anaerobic digestion of bioenergy crops were enhanced by Cd contamination at a certain concentration range [5,8,13,14]. Cd concentrations of 2.00 ± 0.44, 39.80 ± 1.25, and 6.37 ± 0.15 mg Cd/kg biomass in the shoot of canola, oat, and wheat improved the biogas yields by 59.37%, 79.23%, and 11.34% compared to the control group under thermophilic conditions (55.0 ± 1.0 °C) [8]. A study on biogas production with maize contaminated with Cd as feedstocks (the final Cd concentration of residues achieved 5.34 mg/kg) found no inhibitory effects during the anaerobic digestion process (42 °C) [7]. An activating effect of Cd2+ was found on methanogenesis in the marine archaeon Methanosarcina acetivorans [15]. With acetate as substrate, Cd2+ slightly increased both the growth and methane rate synthesis [15]. In spite of this, there is still lack of information about the role of Cd in biodegradation, particularly on the modification of the methanogenic pathway.
The concentration of the available Cd in the reactor is greatly influenced by temperature changes. Under thermophilic conditions (55.0 ± 1.0 °C), Cd concentrations less than 1.0 mg/L were shown to be non-inhibitory to the anaerobic digestion process [14]. However, to the best of our knowledge, most of the previous research on the impacts of temperature was carried out without considering the presence of heavy metals in the reactors.
The aim of this study was to examine the effect of elevated temperatures combined with the addition of Cd on the anaerobic digestion of lignocellulosic biomass. The impacts of Cd on the biogas properties, substrate biodegradation, and enzyme activity were investigated by comparing with a control that had no Cd added. Data from this study demonstrate the impact of temperatures on the performance and biodegradability of anaerobic fermentation and provide information for biogas production practice from metal-contaminated lignocellulosic biomass.

2. Materials and Methods

2.1. Experimental Materials

A corn stover, a representation of lignocellulosic biomass, collected from farmland in Shandong Province, China was used as the feedstock. Prior to grinding into powder and passing through a 10-mesh sieve, the corn stover was air-dried. The stover was then pretreated with 6% phosphoric acid for 24 h at room temperature to destroy the lignocellulosic structure and enhance fermentation efficiency. After pretreatment, the corn stover was washed with deionized water 5–8 times. Fresh cow dung collected from the Yanqing base, Beijing Dairy Cattle Center was used as an inoculum. It was stored at 4.0 °C. The total solid (TS) of the raw cow dung was 15.44 ± 1.13% dry weight, and the volatile solid (VS) was 85.95 ± 2.18% of TS. No extra inoculum was used to start the experiment. The Cd contents in the corn stover and cow dung were lower than the limit of detection.

2.2. Anaerobic Fermentation Experiment Set-Up

The experiments were performed in the anaerobic reactors (working volume of 20 L, total volume of 30 L, YGF 300/30, Shanghai Yangge Biological Engineering Equipment Co., Ltd., Shanghai, China) for 16 days at 55 °C, 45 °C, 35 °C, and 25 °C (±1.0 °C, automatically controlled). Acid-pretreated corn stover (0.8 kg dry weight) was mixed with cow dung (0.8 kg dry weight, also worked as inoculum) as feedstocks. TS of the substrate in the reactors was set at 8% by adding distilled water. At the beginning of fermentation, CdCl2 solution was then added into the reactors to achieve a final concentration of 1 mg/L based on a previous study [14]. The reactors were purged with N2 gas for 5 min to remove the oxygen.

2.3. Measurements

Biogas yield was automatically measured at 9:00 a.m. each day using a gas flowmeter (MGC-1 V3.1 PMMA, Dr Ing. Ritter Apparatebau Gmbh & Co. Kg. Germany) connected to the reactor. Solid, liquid, and gas samples were collected every three days at 9:00 a.m. The TS, volatile solids (VS), chemical oxygen demand (COD), and cellulose, cellulase, and coenzyme F420 activities were measured using methods previously reported [16,17,18,19]. Briefly, TS was determined by weighing the samples after drying at 105 °C for 24 h, while VS was determined after treating the samples in a muffle furnace at 550 °C for 1 h. The COD in the supernatant was obtained using the potassium dichromate method after sample centrifugation at 5000 rpm for 10 min. Cellulose was determined after the removal of lipids and treatment using nitric acid and ethanol [19]. Cellulase and coenzyme F420 activities in the supernatant were determined according to the standard method after centrifugation at 4000 rpm for 5 min [20]. Samples for volatile fatty acids (VFAs) analysis were passed through a 0.45-μm nitrocellulose membrane filter and frozen prior to analysis. VFA concentrations were determined by a gas chromatograph (GC–2014, Shimadzu Co., Japan) with a flame ionization detector (FID). VFA was expressed as mg/L of individual species (C2–C5 fatty acids). CH4 content in biogas was measured by a gas chromatograph (GC-2014C, Shimadzu Co. Japan) equipped with a GDX-401 column and H2 as the carrier gas. Detection was performed with a thermal conductivity detector (TCD).

2.4. Data Analysis

The data in the study were the average of three repeats. Error bars represent the standard errors of the mean (SEM) = SD/ n , where SD is the standard deviation. One-way analysis of variance (one-way ANOVA), at 0.05 (* p < 0.05) and 0.01 (** p < 0.01) levels of significance, was performed using Statistical Package for the Social Sciences software (IBM SPSS Statistics 21, Chicago, IL, USA).

3. Results and Discussion

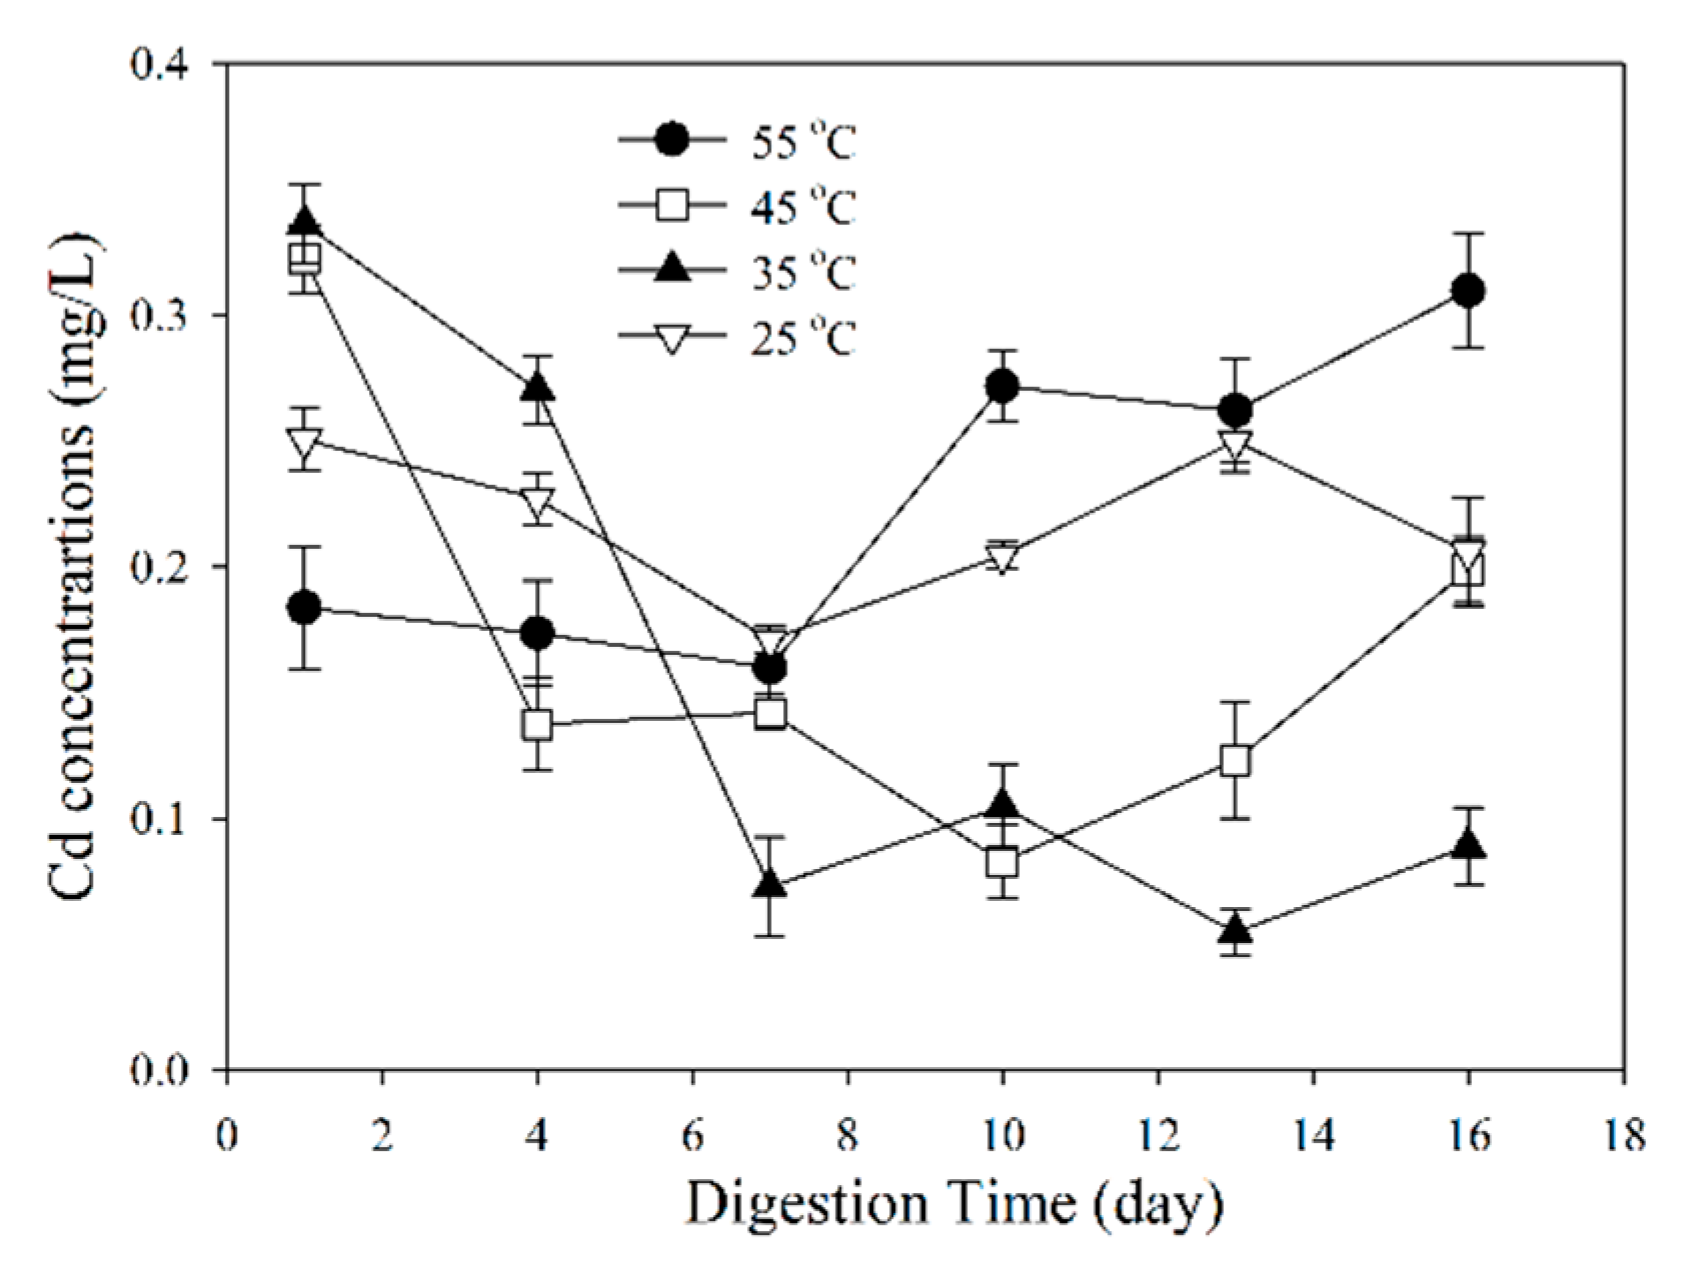
3.1. Fate of Cd during the Digestion Process

The fate of Cd in the reactor was important for the deposition of residues, as Cd is both toxic and a probable carcinogen. Figure 1 shows the Cd concentrations in the digestion liquor during the digestion process. In the 55 °C group, the Cd concentration on the first day was 0.18 mg/L, which was much lower than the initial Cd concentration. This suggests that most of the Cd added was removed from the digestion liquor. However, heavy metals may be adsorbed onto the solid fraction (i.e., the biomass or inert particulate matter) [21]. The adsorption of Cd2+ was favored by increasing the temperature, since Cd2+ adsorption is an endothermic process [22]. Therefore, the low Cd concentrations observed in the 55 °C group could be attributed to Cd precipitation and adsorption. After the seventh day, the Cd concentrations increased to 0.27 mg/L and finally reached 0.31 mg/L at the end of the experiment. This increase in the Cd concentrations was likely due to the degradation or desorption of the substrate. The corresponding reduction in the daily biogas yields indicated Cd’s toxicity to biogas production.
The Cd concentrations in the 45 and 35 °C groups were higher than that in the 55 °C group on the first day of digestion, followed by the 25 °C group. At the end of the experiment, it was found that the Cd concentrations were in the order of 55 °C > 25 °C > 35 °C > 45 °C, which was opposite to the order on the first day of digestion. Therefore, under high-temperature conditions (55 °C), more Cd was removed from the liquor at the beginning of digestion, which was beneficial for the start-up stage, as well as high biogas yields during the digestion process. However, at the end of digestion under high-temperature conditions (55 °C), more Cd was released to the liquor, probably due to enhanced substrate degradation in these conditions.

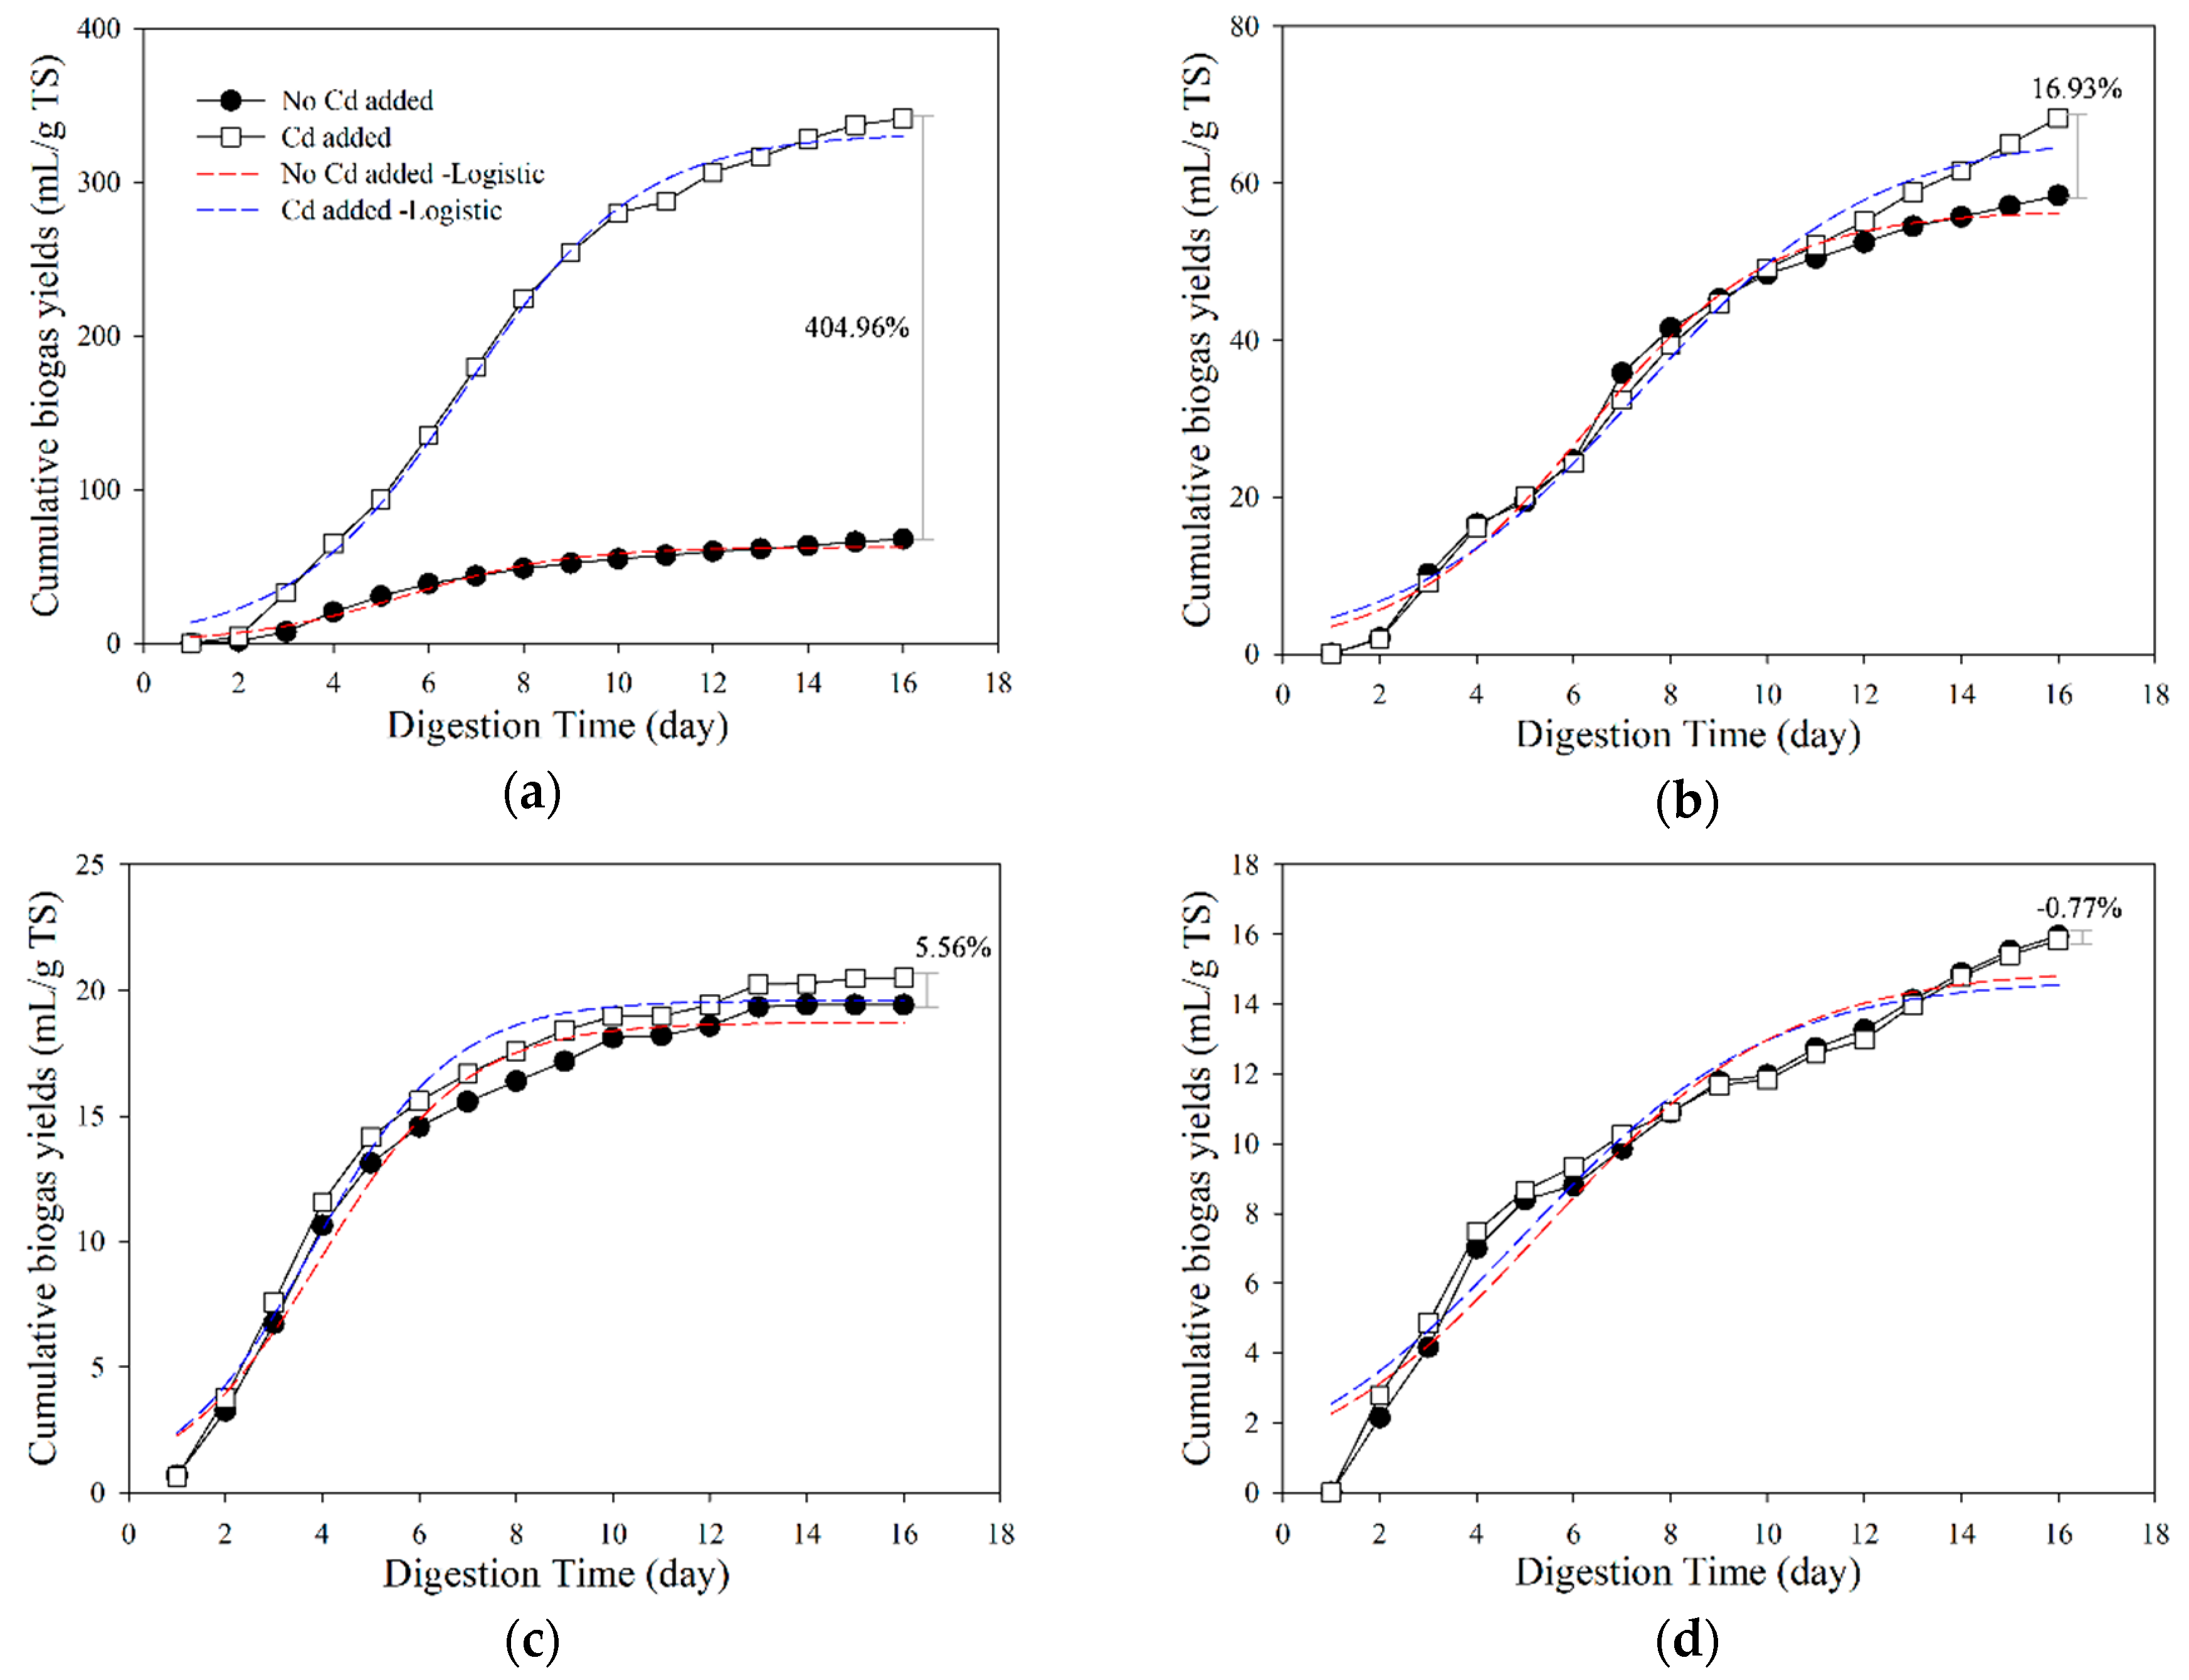
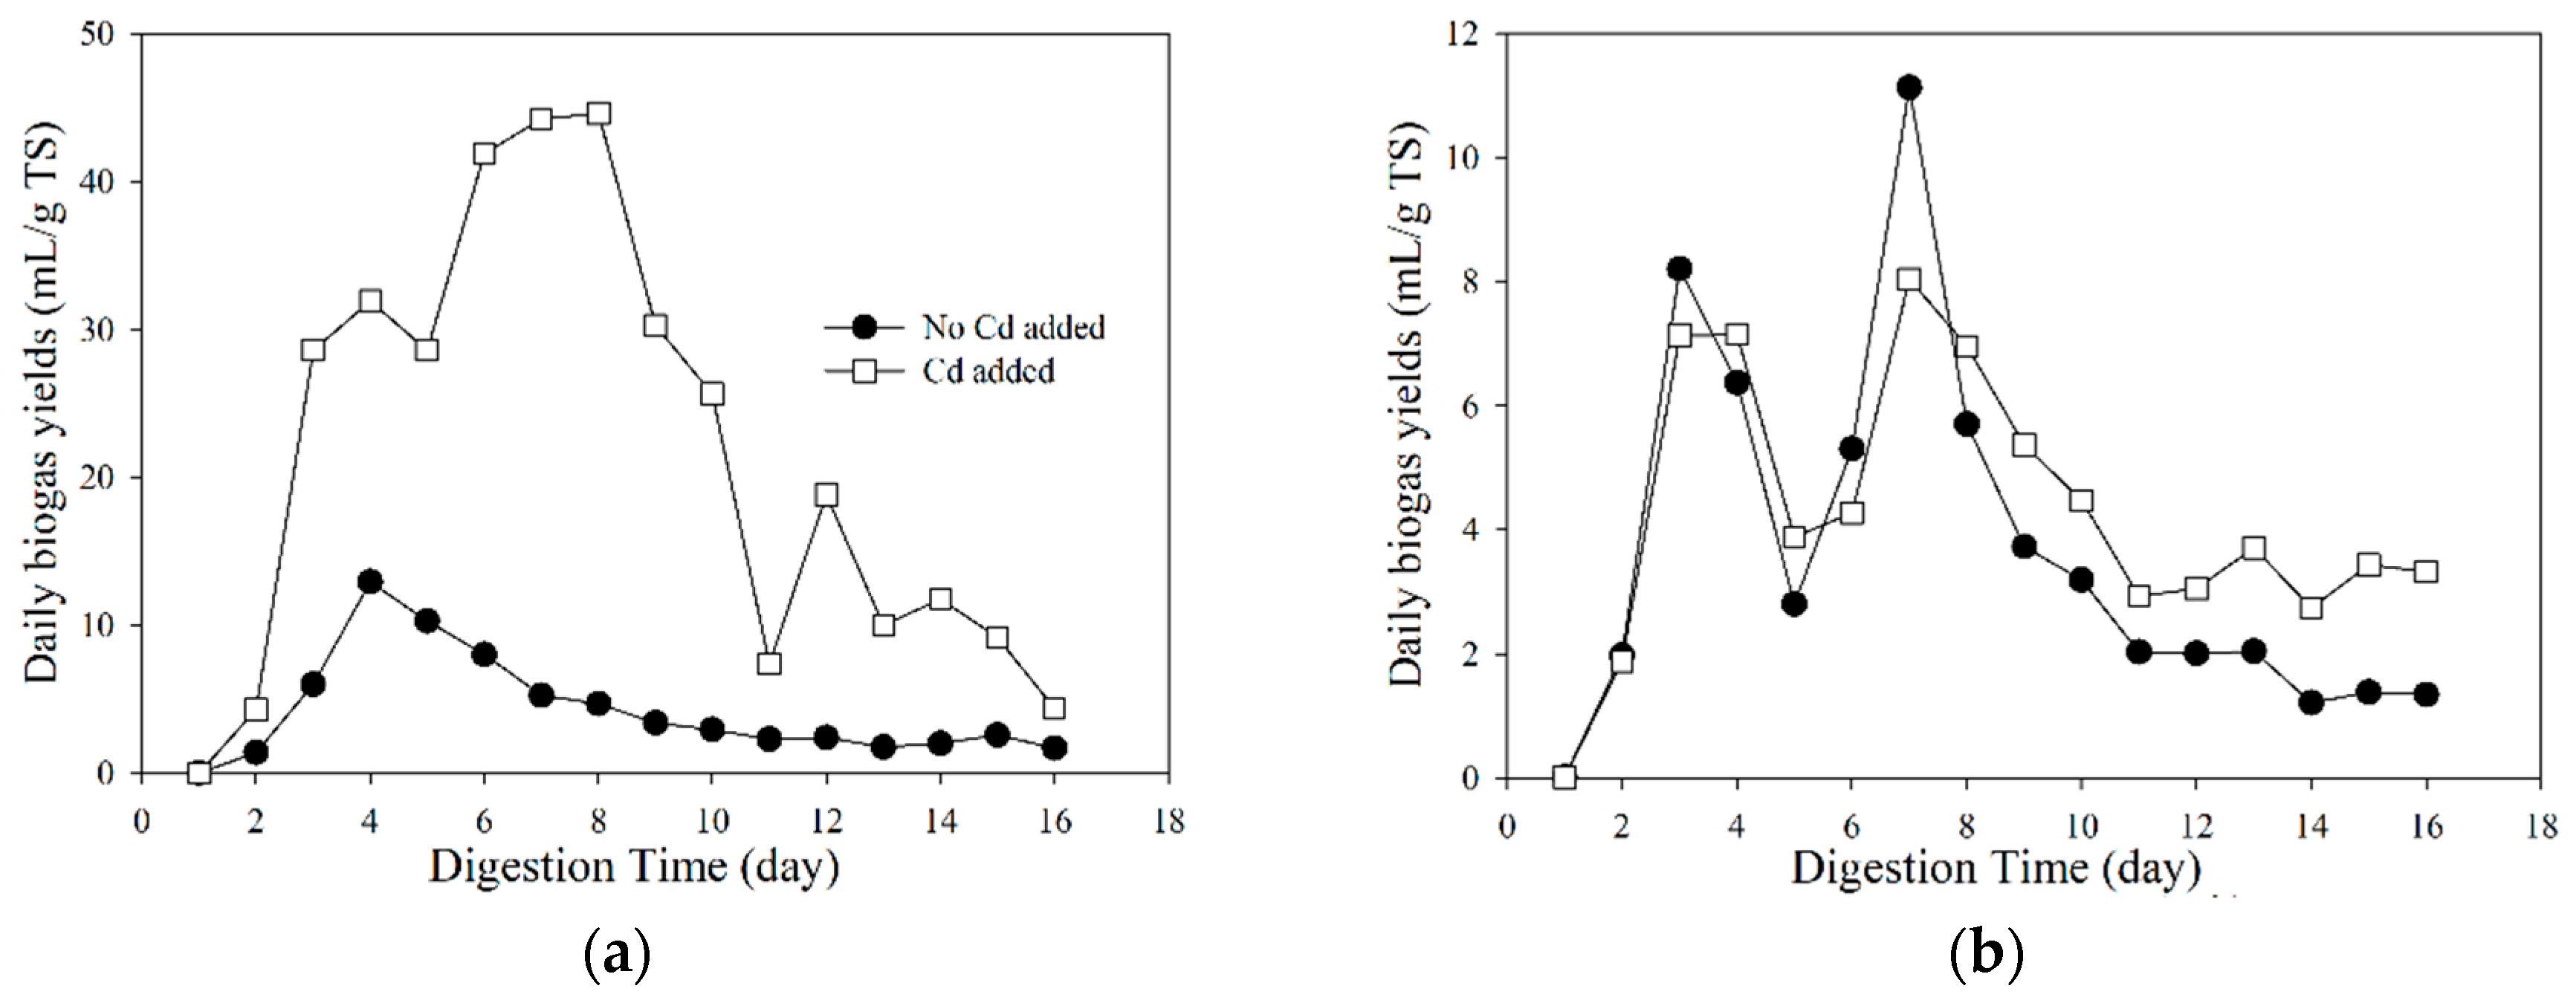
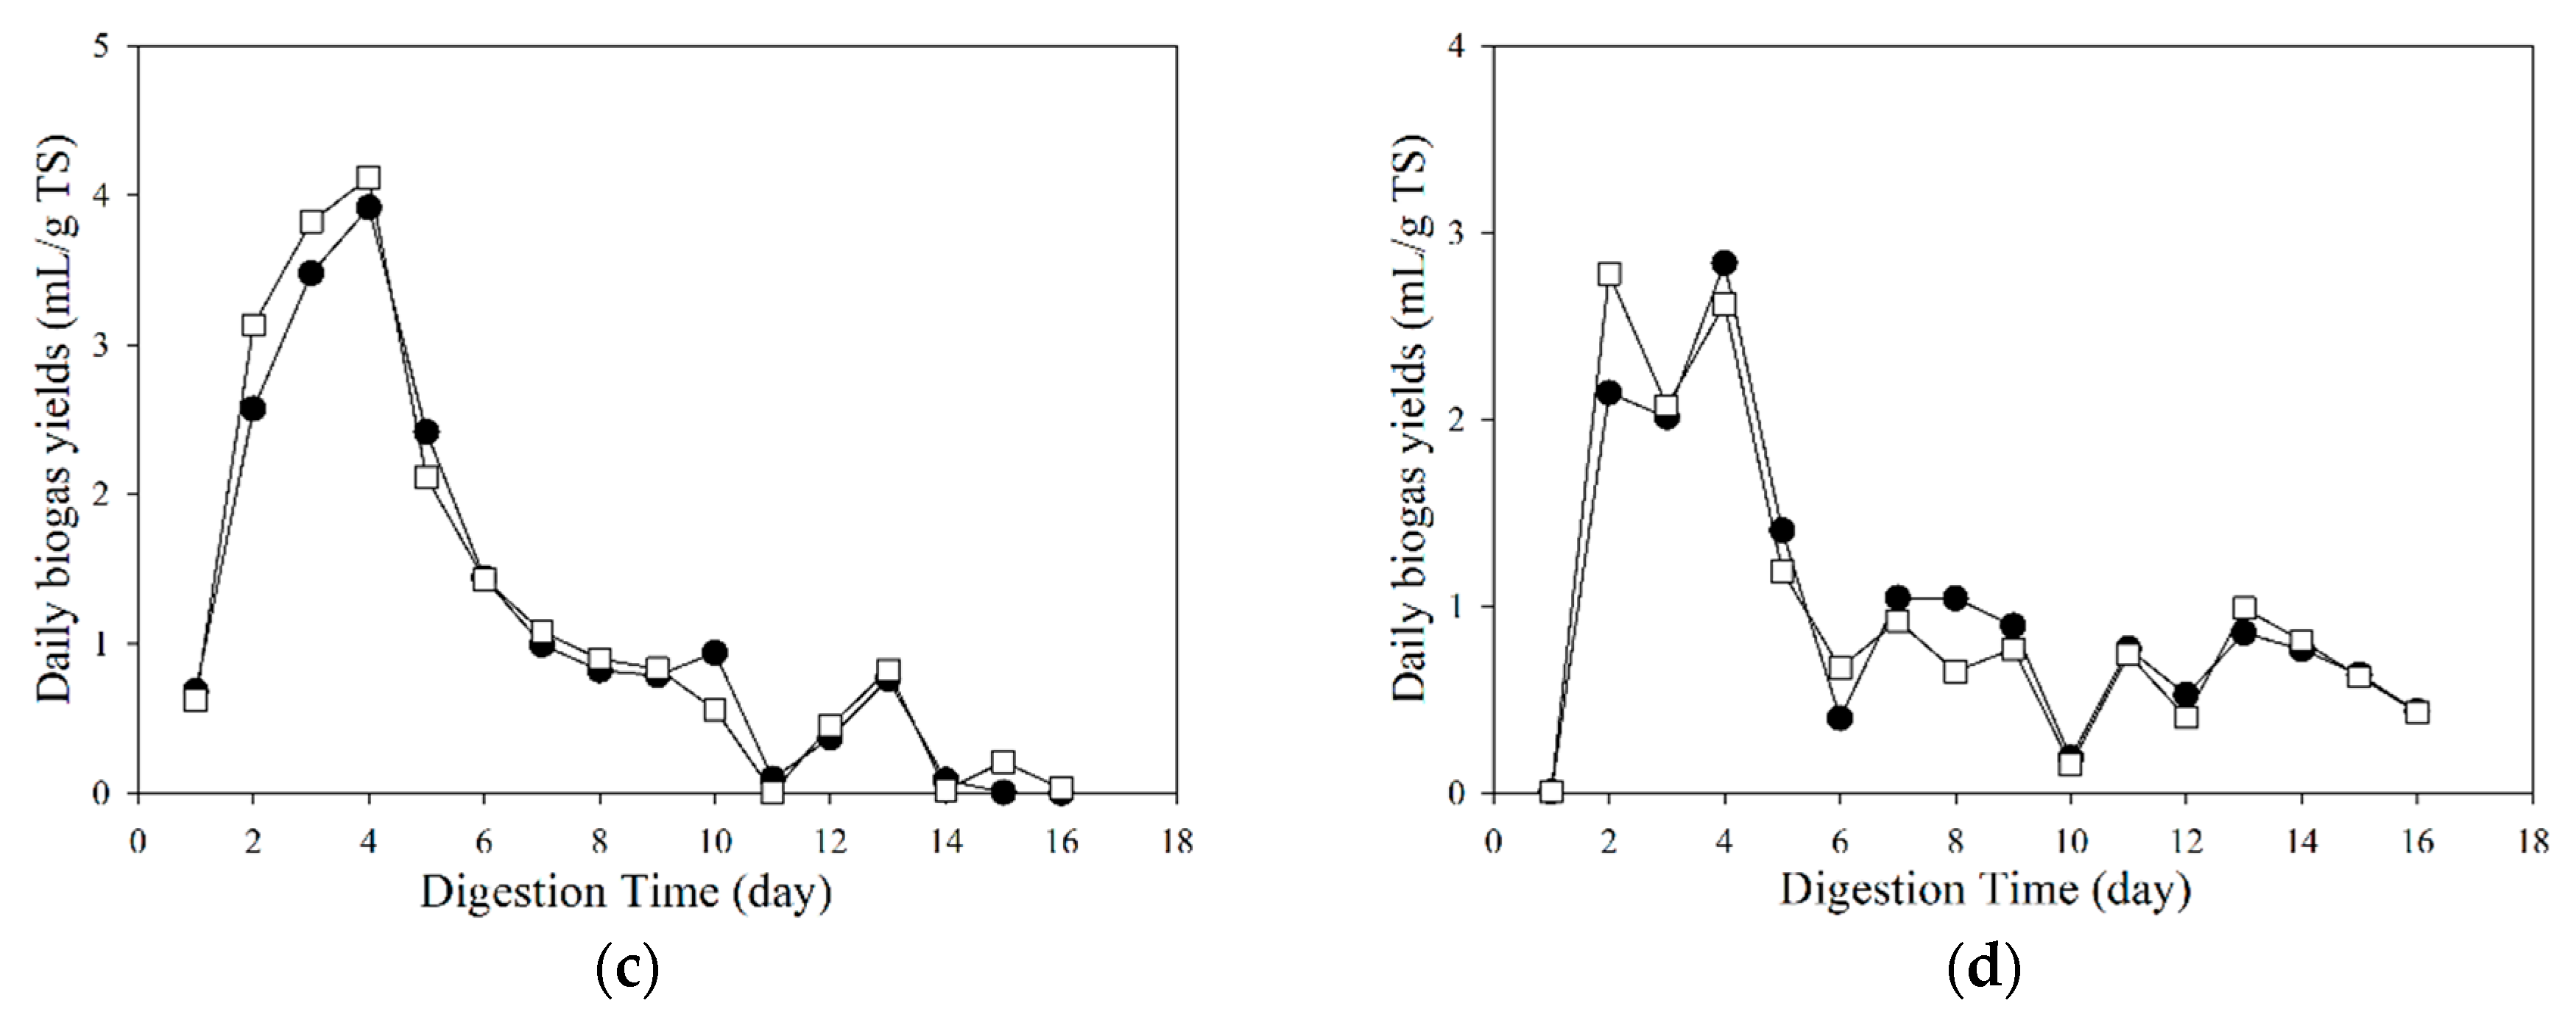
3.2. Biogas Properties under Different Temperatures

Figure 2 shows the impact of Cd addition on the cumulative biogas yields under different digestion temperatures. When the temperatures were 55 °C, 45 °C, and 35 °C, the Cd-added groups obtained higher biogas yields than the control group (no Cd-added) by 404.96%, 16.93%, and 5.56%, respectively. Thus, Cd addition enhanced the biogas production within the temperature range. When the temperature further decreased to 25 °C, biogas yields in the Cd-added group were lower than in the control group (−0.77%), indicating that Cd had an inhibitory effect on biogas production. According to the logistic fitting results, the theoretical maximum cumulative biogas yields showed the same tendency with the experimental results. Similar to the results of cumulative biogas yields, the stimulatory effect of Cd on daily biogas yields was remarkable when the digestion temperature was 55 °C (Figure 3).
The stimulatory effects of Cd were also found in anaerobic digestion when other crops were used as feedstocks [8,14]. A previous study found that there was no inhibitory effect on biogas production when Cd less than 1 mg/L was present in a thermophilic reactor [14]. In the present study, the available Cd concentrations in the reactor during digestion were lower than 1 mg/L as there were Cd losses due to precipitation, sorption, and formation of complexes [21]. Despite the low Cd concentrations in the 25 °C group, an inhibitory effect on biogas production was observed. A previous study found that low temperatures reduced CH4 production when swine manure was used as the substrate [23]. These results were contrary to a previous study (25–27 °C) on acetate- and methanol-grown Methanosarcina acetivorans C2A strain cells in which Cd showed a significant stimulatory effect on the CH4 production [15]. Therefore, temperature variations should be taken into account when establishing the threshold or optimal range of Cd concentrations for biogas production.
The CH4 contents in the biogas varied with temperatures in the presence of Cd as shown in Figure S1 (Supplementary Materials). Trends in CH4 contents in the 35 °C and 25 °C groups were not characterized fully because the biogas yields were too low for collection by the gas bag. Overall, when temperature increased, the CH4 contents increased in both Cd-added and control groups. CH4 contents reached a plateau after the fourth day in the 55 °C group, while they continued increasing at lower temperatures. The results indicated that elevated temperatures accelerated the start-up of fermentation. On the other hand, Cd addition improved the CH4 contents by approximately 6% after the fourth day in the 55 °C group. The impact of Cd on biogas compositions in the other three temperature groups was not significant. Therefore, thermophilic digestion (55 °C) promoted the CH4 production in the presence of Cd. In contrast, low temperature hindered the production of CH4, which agreed with a previous study that used swine manure as a substrate [23].

3.3. Substrate Biodegradation

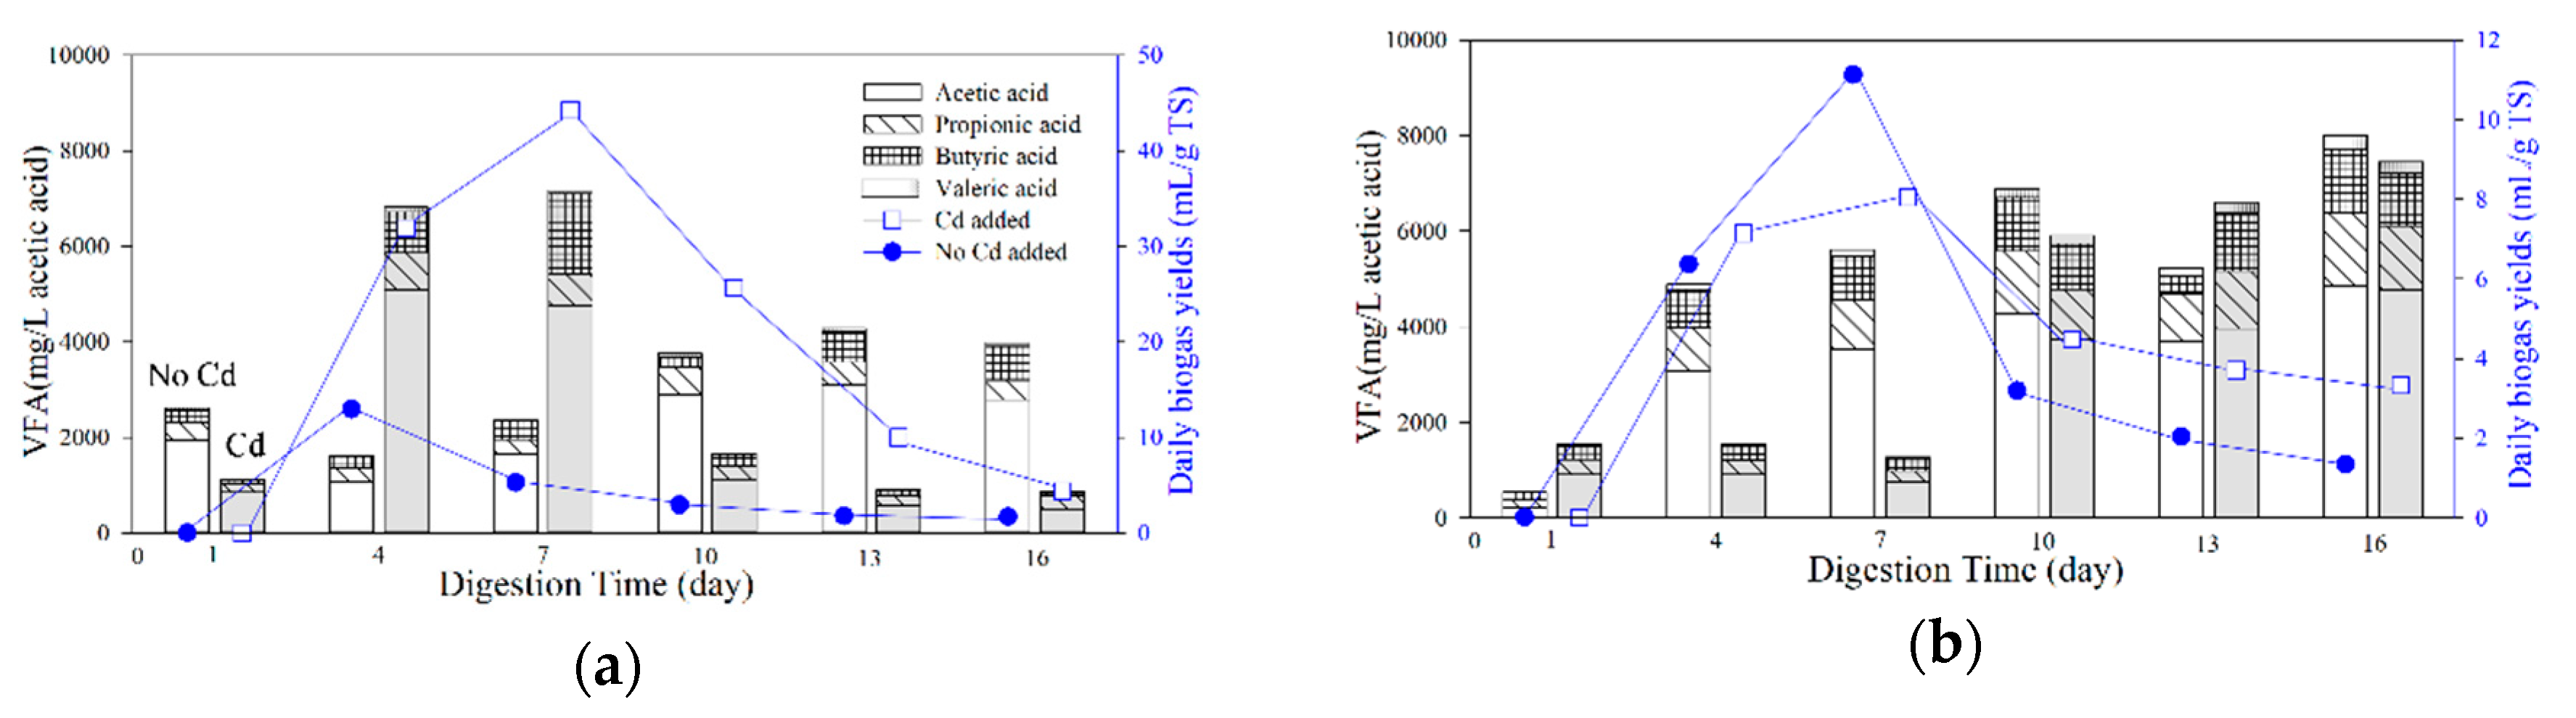
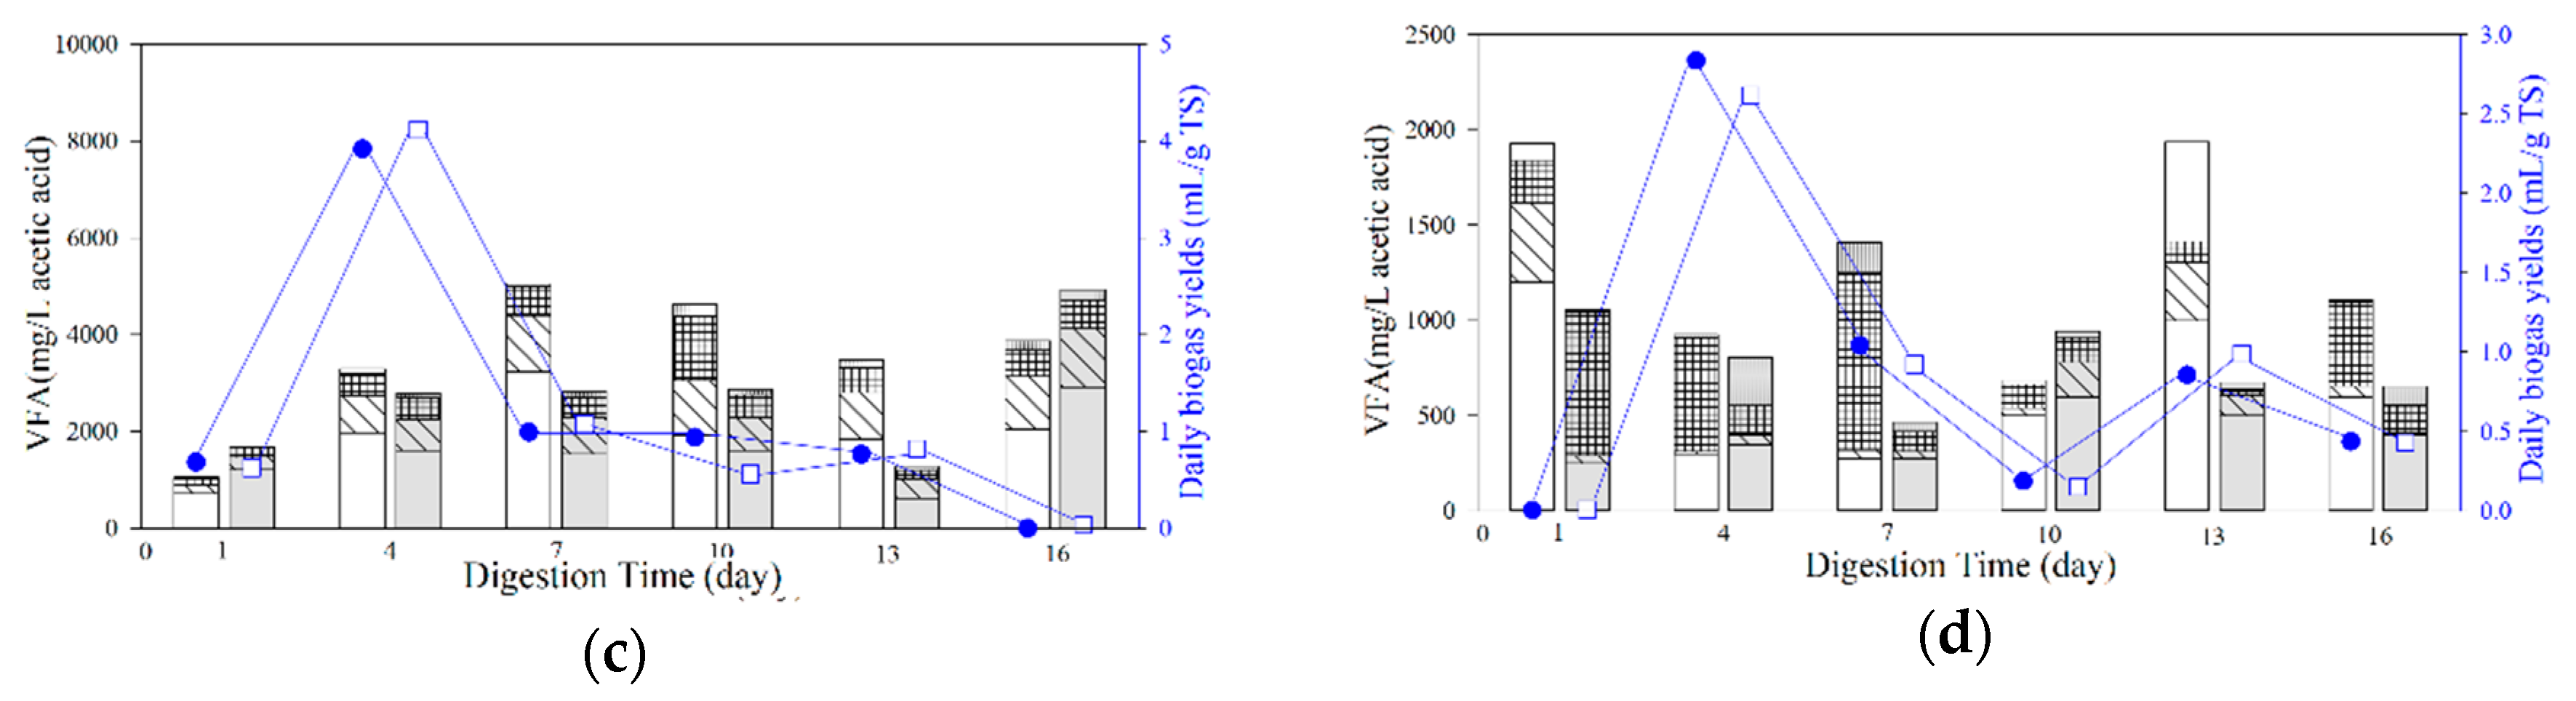
3.3.1. Responses of VFAs
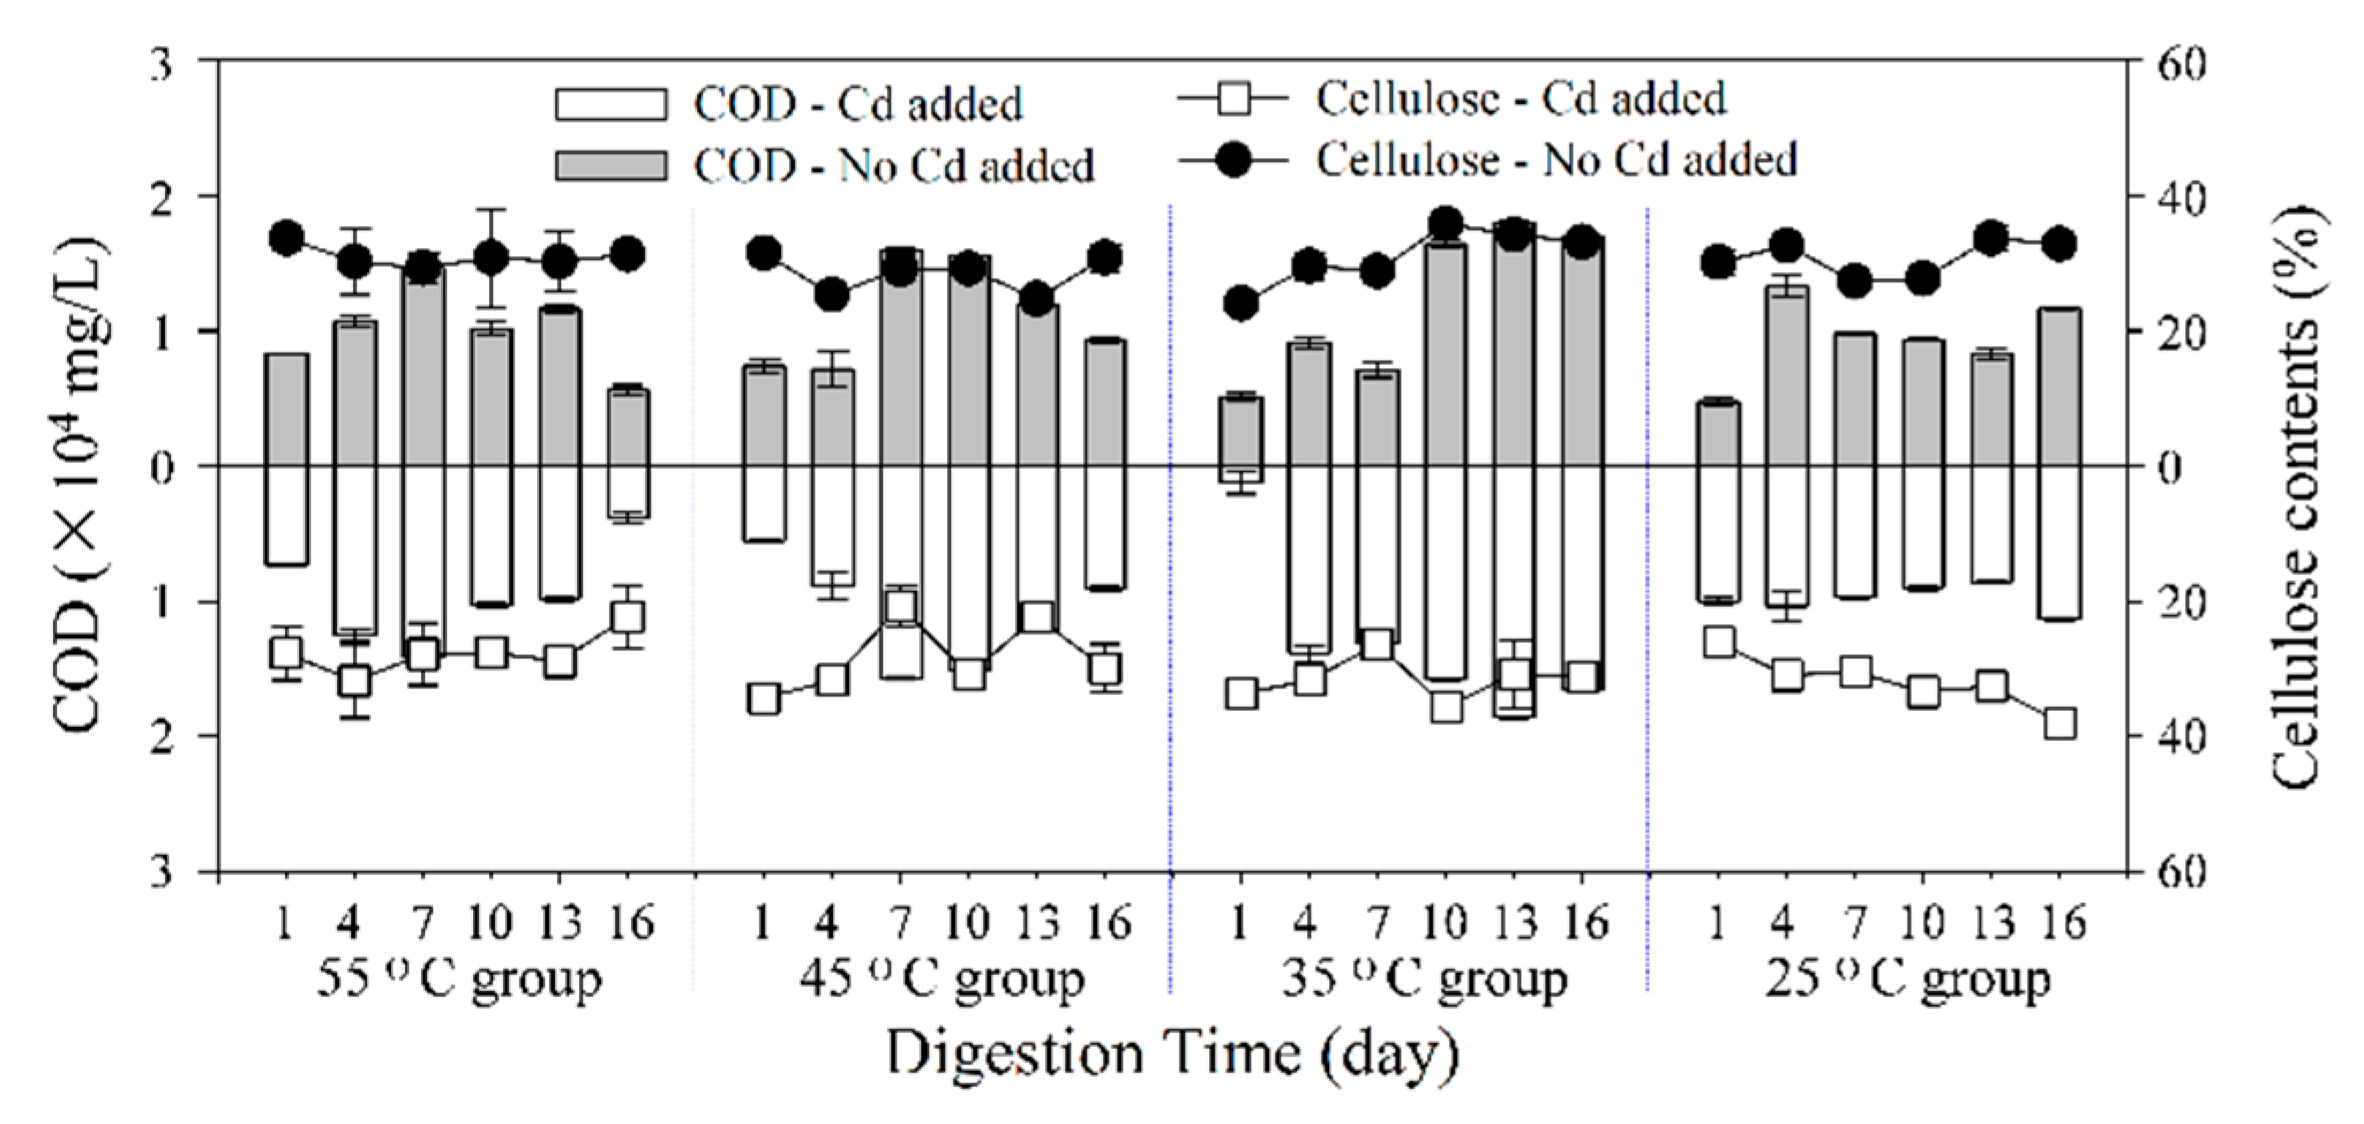
The VFA compositions (as mg/L acetic acid) are presented in Figure 4. The variation of VFAs was influenced greatly by both Cd addition and digestion temperatures. The total VFA concentrations in the Cd-added 55 °C group increased from the first to the fourth day (Figure 4a). During this period, acidogens were probably active, leading to the formation of VFAs and other organic products as a result of acidogenic reactions that proceed after hydrolysis [24]. The total VFA concentrations remained high between the fourth and seventh day (i.e., peak biogas-producing period) and decreased rapidly afterward. In general, the VFA concentration in the Cd-added group varied in similar tendency with the daily biogas yields. Comparing the VFA concentrations and biogas yields under different digestion temperature revealed that the amount of the total VFA concentrations did not dominate the biogas production.
Acetic acid was the main component of the VFA, followed by propionic acid ≈ butyric acid > valeric acid in the 55 °C, 45 °C, and 35 °C groups. When the digestion temperature was 25 °C, the percentages of butyric acid and valeric acid increased at various time intervals in the no Cd-added group, as well as the first day of the Cd-added group. The concentrations of butyric acid were even higher than the concentrations of acetic acid sometimes. Therefore, low temperature was not beneficial for the generation of acetic acid or transforming high VFAs (butyric acid and valeric acid) into low VFAs (acetic acid), especially in the no Cd-added group. It was, thus, proposed that the reaction rate of generating acetate from glucose (Equation (1)) or acetogenesis from butyric acid (Equation (2)) was limited [25]. The reaction of Equation (2) was probably limited due to the high free energy yield (48 KJ/mol) for the transformation of butyrate to acetate [25]. Cd addition was unlikely to weaken the limitation.
C6H12O6 + H2O → 2CH3COOH + 2CO2+ 4H2.
CH3CH2CH2COOH + 2H2O → 2CH3COO + 2H+ + 2H2.
Upon comparison of the VFAs in the Cd-added group and no Cd-added group, it was found that the impact of Cd addition on the acetic acid, propionic acid, and butyric acid was similar in the 35 °C group, while the impact on the valeric acid was different (Figure S2, Supplementary Materials). The low acetic acid in the Cd-added group accounted for the results of biogas yields when the Cd-added group obtained lower biogas yields than the no Cd-added group when the digestion temperature was 25 °C. In the study of the effect of Cd in mesophilic (37 °C) anaerobic acidogenesis of a simulated dairy waste, it was found that a low dosage of Cd (5 to 20 mg/L) resulted in a decrease of both acetate and butyrate concentrations and a significant accumulation of propionate [26]. The present study indicated that the accumulation or decline of VFAs should be analyzed according to the digestion stages and temperatures.

3.3.2. COD

The hydrolytic products in the digestion liquor could be represented by COD. In the 55 °C group, COD concentration in both the Cd-added and no Cd-added group showed similar trends; there was an initial increase in COD concentration followed by a gradual decrease (Figure 5). The average COD during the entire digestion process in the Cd-added and no Cd-added group was 9651.83 ± 1374.29 and 10,172.01 ± 1138.17 mg/L, respectively. Higher COD peak period was observed in the Cd-added group than the no Cd-added group, and the biogas yield was also higher in the former group. Thus, Cd addition enhances the biogas production by increasing the total COD during the peak period and, more importantly, by transferring the hydrolytic organic components into VFAs (Figure S2, Supplementary Materials).
By comparing the COD concentrations of different temperature groups, it was found that high COD concentrations did not induce high biogas yields [18,27,28]. In fact, the improved generation of VFAs from hydrolytic products and the formation of acetic acid under thermophilic conditions increased biogas yields. Under thermophilic conditions, substrates in the reactors were more accessible and biogas yields were improved compared to mesophilic processes.

3.3.3. Degradation of Cellulose

The cellulose contents in the solid residues are shown in Figure 5. The average cellulose contents in the no Cd-added groups were 30.92%, 28.43%, 30.92%, and 30.70% for 55 °C, 45 °C, 35 °C, and 25 °C groups, respectively, and were 27.68%, 28.30%, 31.53%, and 31.90% in the Cd-added groups. There were no significant differences between the Cd-added group and the no Cd-added group at all investigated temperatures (one-way ANOVA, p > 0.05).
In the 55 °C group, the decrease of cellulose in the no Cd-added group from the first to the seventh day was accompanied by an increase in COD. This suggested that the organic components in the liquor likely originated from the cellulose of the feedstock. After the seventh day, the cellulose contents were stable while the COD decreased. The hydrolysis of cellulose was, thus, less efficient during this period. The generation of VFAs consumed the hydrolytic products and induced the decrease in COD. In the Cd-added group, the variation of cellulose was similar with that observed in COD. The organic components in the liquor were probably from non-cellulose compositions. On the other hand, the hydrolytic products were efficiently transferred into the VFAs and eventually CH4.
In the 45 °C group, in the presence of Cd, the degradation of cellulose resulted in the increase of COD in the first seven days. Afterward, COD was decreased due to the increase of VFAs, and the degradation of cellulose varied with the digestion progressing. In the 35 °C group, the organic components in the liquor of the no Cd-added group likely originated from non-cellulose compositions, as the COD and cellulose contents were both low in the first seven days and then increased during the later stages. In the presence of Cd, the cellulose contents varied from 26.3% to 35.6% and did not have remarkable relationships with the variation of COD. In the 25 °C group, the cellulose contents in the Cd-added group increased gradually with the digestion progressing, which should be attributed to the degradation of non-cellulose compositions.

3.4. Responses of Enzyme Activity to Varied Temperatures under Cd Stress
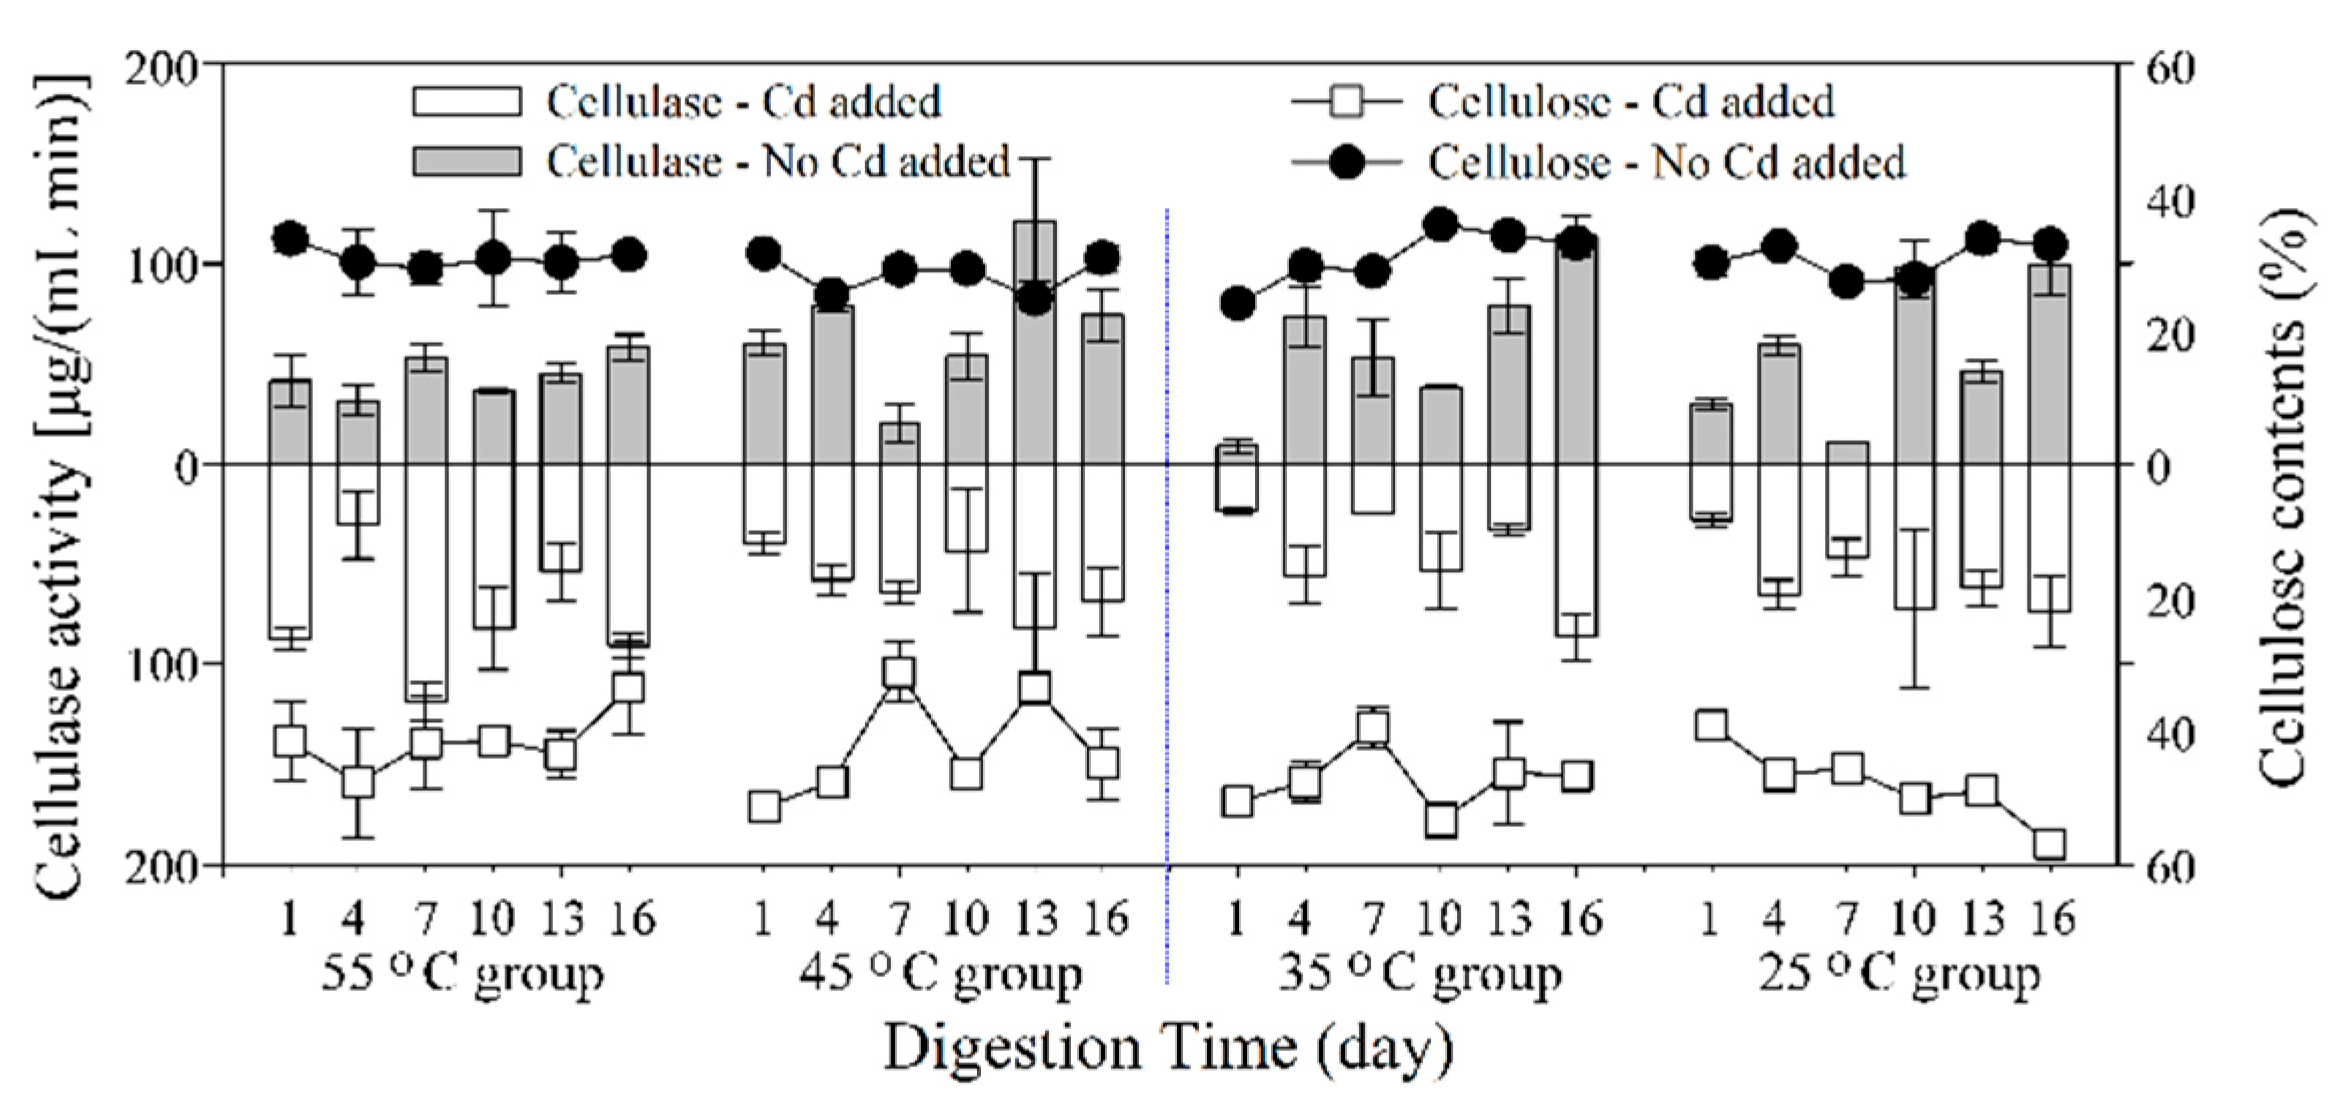
3.4.1. Cellulase

The cellulase plays an important role in the hydrolysis stage. It was related to the cellulose contents and COD concentrations in the liquid phase of substrate. The average cellulase activities in the no Cd-added groups were 44.41 ± 4.14, 68.14 ± 13.64, 61.11 ± 14.74, and 57.18 ± 14.71 μg/(mL∙min) for 55 °C, 45 °C, 35 °C, and 25 °C groups, respectively, and were 76.99 ± 12.52, 59.18 ± 6.49, 45.91 ± 9.82, and 57.87 ± 7.13 μg/(mL∙min) in the Cd-added groups (Figure 6). Therefore, in the 55 °C group, Cd addition significantly improved the activity of cellulase (p < 0.05). There was no significant difference between the Cd-added and no Cd-added group when the digestion temperature was 45 °C, 35 °C, and 25 °C.
When the digestion temperature was 55 °C, in spite of higher cellulase activity in the Cd-added group, the cellulose content was not significantly decreased (Figure 5). It was attributed to the degradation of non-cellulose compositions, such as hemicellulose, which resulted in the better degradation of the feedstock and higher biogas yields (Figure 3a). In the 45 °C group, the variation of cellulase activity was opposite to the variation of cellulose contents, i.e., the increase of cellulase activity caused the corresponding degradation of cellulose. In the 35 °C and 25 °C groups, there was no clear relationship between the variation of cellulase activity and degradation of cellulose, regardless of whether Cd was added or not. It seemed that the cellulose was not well degraded in the feedstock, and its percentage in the solid residue was influenced greatly by the degradation of other non-cellulose compositions.

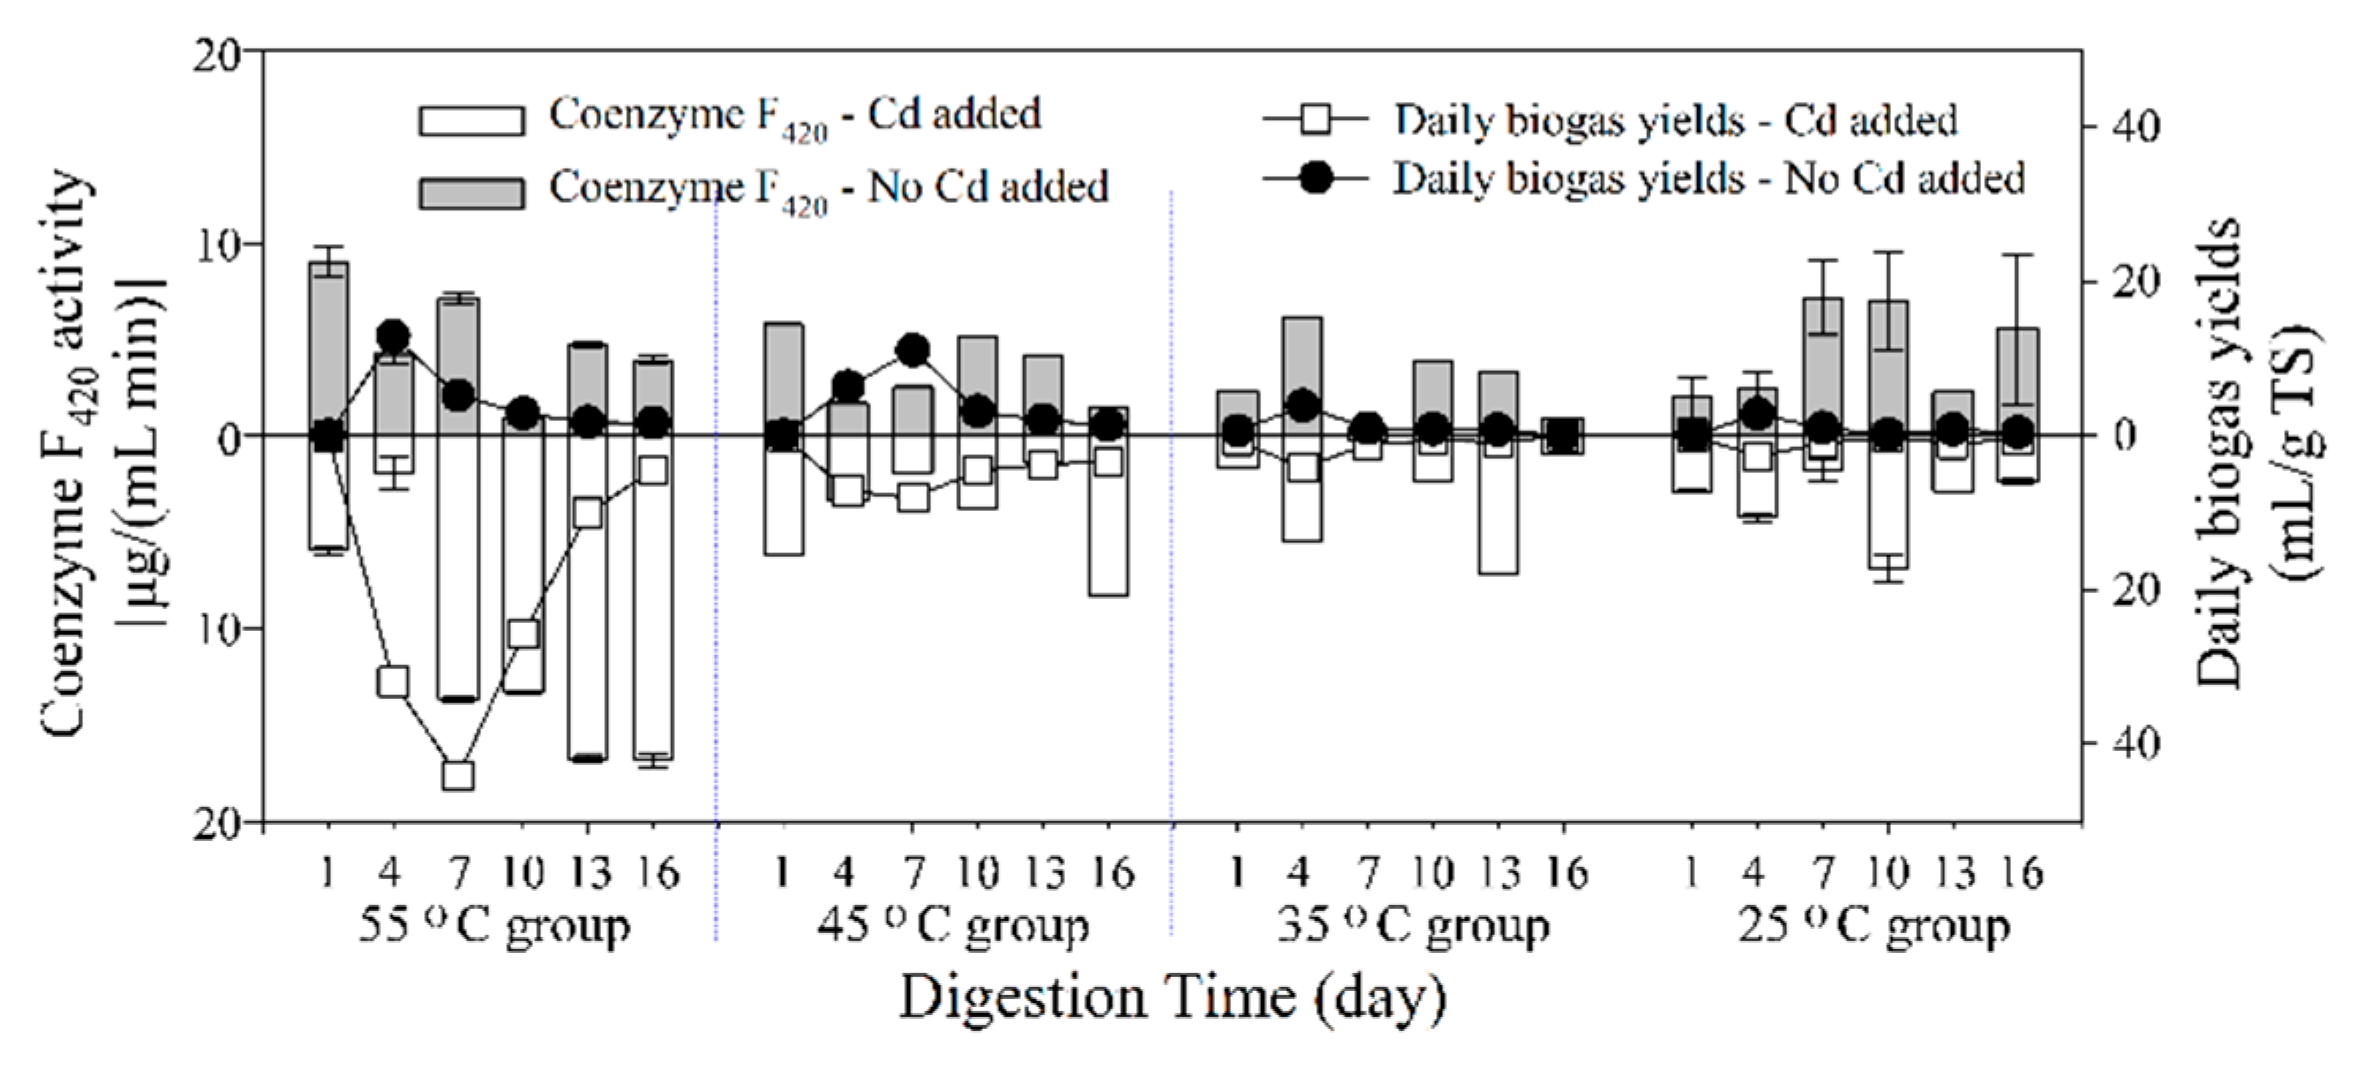
3.4.2. Coenzyme F420

Coenzyme F420 functions in the H2/CO2 pathway [17], which contributes to 30% of CH4 production in most systems [29,30]. However, the contribution of H2/CO2 versus acetate as metabolic precursors for methanogens may be greatly different in various anaerobic environments [30]. The average coenzyme F420 activities in the no Cd-added groups were 5.00 ± 1.14, 3.47 ± 0.75, 2.83 ± 0.86, and 4.42 ± 1.00 μg/(mL∙min) for 55 °C, 45 °C, 35 °C, and 25 °C groups, respectively, and were 11.41 ± 2.49, 4.11 ± 1.08, 2.99 ± 1.12, and 3.49 ± 0.75 μg/(mL∙min) in the Cd-added groups (Figure 7). Therefore, in the 55 °C group, Cd addition significantly improved the activity of coenzyme F420 (p < 0.01). There was no significant difference between the Cd-added and no Cd-added group when the digestion temperature was 45 °C, 35 °C, and 25 °C.
The results of coenzyme F420 activity showed that higher coenzyme F420 activities did not always result in higher biogas production. The stimulatory effect of Cd addition on the coenzyme F420 activity was only significant when the temperature was 55 °C, and this probably accounted for the higher biogas yields. Thus, the H2/CO2 pathway was probably enhanced by Cd addition when the digestion temperature was 55 °C, which corresponded with the higher CH4 contents and the lower CO2 and H2 contents in the biogas. However, this phenomenon was not found in the other three digestion temperature conditions. At an incubation temperature of 25–27 °C, the influence of Cd on enzyme activities was previously examined in marine archaeon Methanosarcina acetivorans [15]. The results showed that acetate kinase activity was slightly increased (25–30%) by 10 μM total Cd, while CO dehydrogenase /acetylCoA synthase activity and carbonic anhydrase were not activated. Cd was shown to bind and activate carbonic anhydrase in vivo [31], and uncouple the methanogenic pathway by collapsing the ion gradient across the plasma membrane [15].
In the present study, the elevated temperature enhanced the activity of the cellulase and then increased the degradation of cellulose in the presence of Cd. More organic matter was hydrolyzed and acidified into VFA compositions. A digestion temperature of 55 °C benefited the transformation of higher VFAs (such as butyrate and valeric acid) to acetic acid, thus providing enough precursors for methanogenesis. The activity of co-enzyme F420 was also stimulated, leading to the observed increase of biogas yields. More importantly, the CO2 in the biogas was utilized for CH4 production, resulting in higher CH4 yields in the thermophilic anaerobic digestion.

4. Conclusions

This study examined the combined effects of temperatures and Cd addition on anaerobic digestion. The addition of 1 mg/L initial Cd concentration into the anaerobic digestion improved the biogas yields of the 55 °C group, followed by 45 °C and 35 °C groups, while it reduced the yield of the 25 °C group. The stimulatory mechanism of Cd addition in the 55 °C group was recognized as higher COD during the peak period, the efficient transformation of hydrolytic products into VFAs, especially acetic acid, and higher activities of cellulase and coenzyme F420. Moreover, a high temperature of 55 °C promoted the transfer of more Cd from liquor to solid substrate at the beginning of the digestion stage, thus accelerating the digestion start-up. At temperatures of 45 °C, 35 °C, and 25 °C, there was no significant difference in cellulase and coenzyme F420 activity between the Cd-added and no Cd-added group. In conclusion, a temperature of 55 °C is suggested for enhancing the degradation of biowaste in anaerobic conditions and in the presence of Cd.

Supplementary Materials

The following are available online at https://www.mdpi.com/1996-1073/12/12/2367/s1: Figure S1. CH4 contents under Cd stress with digestion temperatures of 55 °C, 45 °C, 35 °C, and 25 °C; Figure S2: Volatile fatty acids (VFAs) ratio of the Cd-added group to no Cd-added group with digestion temperatures of 55 °C (a), 45 °C (b), 35 °C (c), and 25 °C (d). The blue dash line indicates a ratio of 1, i.e., the same amount of VFAs in the Cd-added and no Cd-added groups.

Author Contributions

Conceptualization, Y.T. and H.Z.; methodology, Y.T., Y.L., S.L., and X.M.; software, Y.T., Y.L., and S.L.; validation, all authors; formal analysis, Y.T. and S.L.; investigation, Y.T. and X.M.; resources, H.Z. and H.H.; data curation, Y.T.; writing—original draft preparation, Y.T.; writing—review and editing, Y.T.; visualization, Y.T., Y.L., and S.L.; supervision, H.Z.; project administration, Y.T. and H.Z.; funding acquisition, H.Z. and H.H.

Funding

This research was funded by the Major Science and Technology Program for Water Pollution Control and Treatment (grant numbers 2015ZX07204-007 and 2017ZX07101-003), and the Fundamental Research Funds for the Central Universities (grant number 2018MS051).

Acknowledgments

We acknowledge Beijing Dairy Cattle Center for kindly supplying cow dung for the experiments. We thank Edmond Sanganyado for helping polish the language of the revised manuscript.

Conflicts of Interest

The authors declare no conflict of interest.

References

  1. Uma, S.; Thalla, A.K.; Devatha, C.P. Co-digestion of food waste and switchgrass for biogas potential: Effects of process parameters. Waste Biomass Valorization 2018, 1–13. [Google Scholar] [CrossRef]
  2. Fernandes, K.D.; Cañote, S.J.B.; Ribeiro, E.M.; Thiago Filho, G.L.; Fonseca, A.L. Can we use Cd-contaminated macrophytes for biogas production? Environ. Sci. Pollut. Res. 2018, 1–11. [Google Scholar] [CrossRef] [PubMed]
  3. Bhui, I.; Mathew, A.K.; Chaudhury, S.; Balachandran, S. Influence of volatile fatty acids in different inoculum to substrate ratio and enhancement of biogas production using water hyacinth and salvinia. Bioresour. Technol. 2018, 270, 409–415. [Google Scholar] [CrossRef] [PubMed]
  4. Manyiloh, C.E.; Mamphweli, S.N.; Meyer, E.L.; Okoh, A.I.; Makaka, G.; Simon, M. Microbial anaerobic digestion (bio-digesters) as an approach to the decontamination of animal wastes in pollution control and the generation of renewable energy. Int. J. Environ. Res. Public Health 2013, 10, 4390–4417. [Google Scholar] [CrossRef] [PubMed]
  5. Jain, S.K.; Gujral, G.S.; Jha, N.K.; Vasudevan, P. Production of biogas from Azolla pinnata R.Br and Lemna minor L.: Effect of heavy metal contamination. Bioresour. Technol. 1992, 41, 273–277. [Google Scholar] [CrossRef]
  6. Lin, C.-Y. Effect of heavy metals on volatile fatty acid degradation in anaerobic digestion. Water Res. 1992, 26, 177–183. [Google Scholar] [CrossRef]
  7. Šotnar, M.; Mareček, J.; Máchal, P.; Koutný, T.; Geršl, M.; Krčálová, E.; Korenko, M. Biogas production of phytoremediation plants contaminated with cadmium. Научни Tpyдoве Pyceнския Университет 2014, 53, 174. [Google Scholar]
  8. Zhang, H.; Tian, Y.; Wang, L.; Zhang, L.; Dai, L. Ecophysiological characteristics and biogas production of cadmium-contaminated crops. Bioresour. Technol. 2013, 146, 628–636. [Google Scholar] [CrossRef]
  9. Bo, M.; Florczak, I.; Zdanowska, P.; Wojdalski, J. An analysis of metal concentrations in food wastes for biogas production. Renew. Energy 2015, 77, 467–472. [Google Scholar]
  10. Abdel-shafy, H.I.; Mansour, M.S.M. Biogas production as affected by heavy metals in the anaerobic digestion of sludge. Egypt. J. Pet. 2014, 23, 409–417. [Google Scholar] [CrossRef] [Green Version]
  11. Keshri, J.; Mankazana, B.B.J.; Momba, M.N.B. Profile of bacterial communities in South African mine-water samples using Illumina next-generation sequencing platform. Appl. Microbiol. Biotechnol. 2015, 99, 3233–3242. [Google Scholar] [CrossRef] [PubMed]
  12. Matheri, A.N.; Belaid, M.; Seodigeng, T.; CatherineNgila, J. The role of trace elements on anaerobic co-digestion in biogas production. In Proceedings of the World Congress on Engineering, London, UK, 29 June–1 July 2016. [Google Scholar]
  13. Yu, H.Q.; Fang, H.H.P. Inhibition by chromium and cadmium of anaerobic acidogenesis. Water Sci. Technol. 2001, 43, 267–274. [Google Scholar] [CrossRef] [PubMed]
  14. Tian, Y.; Zhang, H. Producing biogas from agricultural residues generated during phytoremediation process: Possibility, threshold, and challenges. Int. J. Green Energy 2016, 13, 1556–1563. [Google Scholar] [CrossRef]
  15. Lira-Silva, E.; Santiago-Martínez, M.G.; Hernández-Juárez, V.; García-Contreras, R.; Moreno-Sánchez, R.; Jasso-Chávez, R. Activation of methanogenesis by cadmium in the marine archaeon Methanosarcina acetivorans. PLoS ONE 2012, 7, e48779. [Google Scholar] [CrossRef] [PubMed]
  16. Zhang, H.; Han, X.; Tian, Y.; Li, Y.; Yang, K.; Hao, H.; Chai, Y.; Xu, X. Process analysis of anaerobic fermentation of Phragmites australis straw and cow dung exposing to elevated chromium (VI) concentrations. J. Environ. Manag. 2018, 224, 414–424. [Google Scholar] [CrossRef] [PubMed]
  17. Hao, H.; Tian, Y.; Zhang, H.; Chai, Y. Copper stressed anaerobic fermentation: Biogas properties, process stability, biodegradation and enzyme responses. Biodegradation 2017, 28, 369–381. [Google Scholar] [CrossRef]
  18. Tian, Y.; Zhang, H.; Chai, Y.; Wang, L.; Mi, X.; Zhang, L.; Ware, M.A. Biogas properties and enzymatic analysis during anaerobic fermentation of Phragmites australis straw and cow dung: Influence of nickel chloride supplement. Biodegradation 2017, 28, 15–25. [Google Scholar] [CrossRef]
  19. Tian, Y.; Zhang, H.; Mi, X.; Wang, L.; Zhang, L.; Ai, Y. Research on anaerobic digestion of corn stover enhanced by dilute acid pretreatment: Mechanism study and potential utilization in practical application. J. Renew. Sustain. Energy 2016, 8, 023103. [Google Scholar] [CrossRef]
  20. Su, Y. Biogas Fermentation Detection Technology; Metallurgical Industry Press: Beijing, China, 2011. [Google Scholar]
  21. Chen, Y.; Cheng, J.J.; Creamer, K.S. Inhibition of anaerobic digestion process: A review. Bioresour. Technol. 2008, 99, 4044–4064. [Google Scholar] [CrossRef]
  22. Leyva-Ramos, R.; Bernal-Jacome, L.A.; Acosta-Rodriguez, I. Adsorption of cadmium (II) from aqueous solution on natural and oxidized corncob. Sep. Purif. Technol. 2005, 45, 41–49. [Google Scholar] [CrossRef]
  23. Zhu, Z.; Cheng, G.; Zhu, Y.; Zeng, H.; Wei, R.; Wei, C. The effects of different anaerobic fermentation temperature on biogas fermentation of swine manure. In Proceedings of the 2011 International Conference on Computer Distributed Control and Intelligent Environmental Monitoring, Changsha, China, 19 February 2011. [Google Scholar]
  24. Jayaweera, M.W.; Dilhani, J.A.; Kularatne, R.K.; Wijeyekoon, S.L. Biogas production from water hyacinth (Eichhornia crassipes (Mart.) Solms) grown under different nitrogen concentrations. J. Environ. Sci. Health Part A Toxic/Hazardous Subst. Environ. Eng. 2007, 42, 925–932. [Google Scholar] [CrossRef] [PubMed]
  25. Amarneh, F.F.K. Quantitative and Qualitative Assessment of Macronutrients and Micronutrients of Digestate from Biogas Units under Different Feedstock Loadings. Master’s Thesis, An-Najah National University, Bloomington, IN, USA, 2014. [Google Scholar]
  26. Yu, H.Q.; Fang, H.H.P.; Tay, J.H. Effects of Fe2+ on sludge granulation in upflow anaerobic sludge blanket reactors. Water Sci. Technol. 2000, 41, 199–206. [Google Scholar] [CrossRef]
  27. Chakraborty, N.; Chatterjee, M.; Sarkar, G.M.; Lahiri, S.C. Inhibitory effects of the divalent metal ions on biomethanation by iolated mesophilic methanogen in AC21 medium in presence or absence of juices from water hyacinth. Bioenergy Res. 2010, 3, 314–320. [Google Scholar] [CrossRef]
  28. Zhang, H.; Tian, Y.; Wang, L.; Mi, X.; Chai, Y. Effect of ferrous chloride on biogas production and enzymatic activities during anaerobic fermentation of cow dung and Phragmites straw. Biodegradation 2016, 27, 69–82. [Google Scholar] [CrossRef] [PubMed]
  29. Harper, S.R.; Pohland, F.G. Recent developments in hydrogen management during anaerobic biological wastewater treatment. Biotechnol. Bioeng. 1986, 28, 585–602. [Google Scholar] [CrossRef] [PubMed]
  30. Nettmann, E.; Bergmann, I.; Pramschu, S.; Mundt, K.; Plogsties, V.; Herrmann, C.; Klocke, M. Polyphasic analyses of methanogenic archaeal communities in agricultural biogas plants. Appl. Environ. Microbiol. 2010, 76, 2540–2548. [Google Scholar] [CrossRef] [PubMed]
  31. Tripp, B.C.; Rd, B.C.; Cruz, F.; Krebs, C.; Ferry, J.G. A role for iron in an ancient carbonic anhydrase. J. Biol. Chem. 2004, 279, 6683. [Google Scholar] [CrossRef] [PubMed]
Figure 1. Cd concentrations in the digestion liquor (mg/L) during the anaerobic digestion.
Energies 12 02367 g001
Figure 2. Cumulative biogas yields and logistic fitting results under Cd stress with digestion temperatures of 55 °C (a), 45 °C (b), 35 °C (c), and 25 °C (d).
Energies 12 02367 g002
Figure 3. Daily biogas yields under Cd stress with digestion temperatures of 55 °C (a), 45 °C (b), 35 °C (c), and 25 °C (d).
Energies 12 02367 g003aEnergies 12 02367 g003b
Figure 4. Volatile fatty acid (VFA) concentrations (as mg/L acetic acid) in the liquid phase with (right gray column) and without (left white column) Cd stress with digestion temperatures of 55 °C (a), 45 °C (b), 35 °C (c), and 25 °C (d). The compositions of VFA are shown by stacked bars with the order of acetic acid (blank), propionic acid (coarse), butyric acid (grid), and valeric acid (dotted) from bottom.
Energies 12 02367 g004aEnergies 12 02367 g004b
Figure 5. Chemical oxygen demand (COD) of the no Cd-added group and Cd-added group with digestion temperatures of 55 °C, 45 °C, 35 °C, and 25 °C.
Energies 12 02367 g005
Figure 6. Cellulase activity of the no Cd-added group and Cd-added group with digestion temperatures of 55 °C, 45 °C, 35 °C, and 25 °C.
Energies 12 02367 g006
Figure 7. Coenzyme F420 activity of the no Cd-added group and Cd-added group with digestion temperatures of 55 °C, 45 °C, 35 °C, and 25 °C.
Energies 12 02367 g007

