Nature-Inspired Whale Optimization Algorithm for Optimal Coordination of Directional Overcurrent Relays in Power Systems


 , and
, and 
Abstract
:1. Introduction
1.1. Motivation and Incitement
1.2. Literature Review
1.3. Contribution and Paper Organization
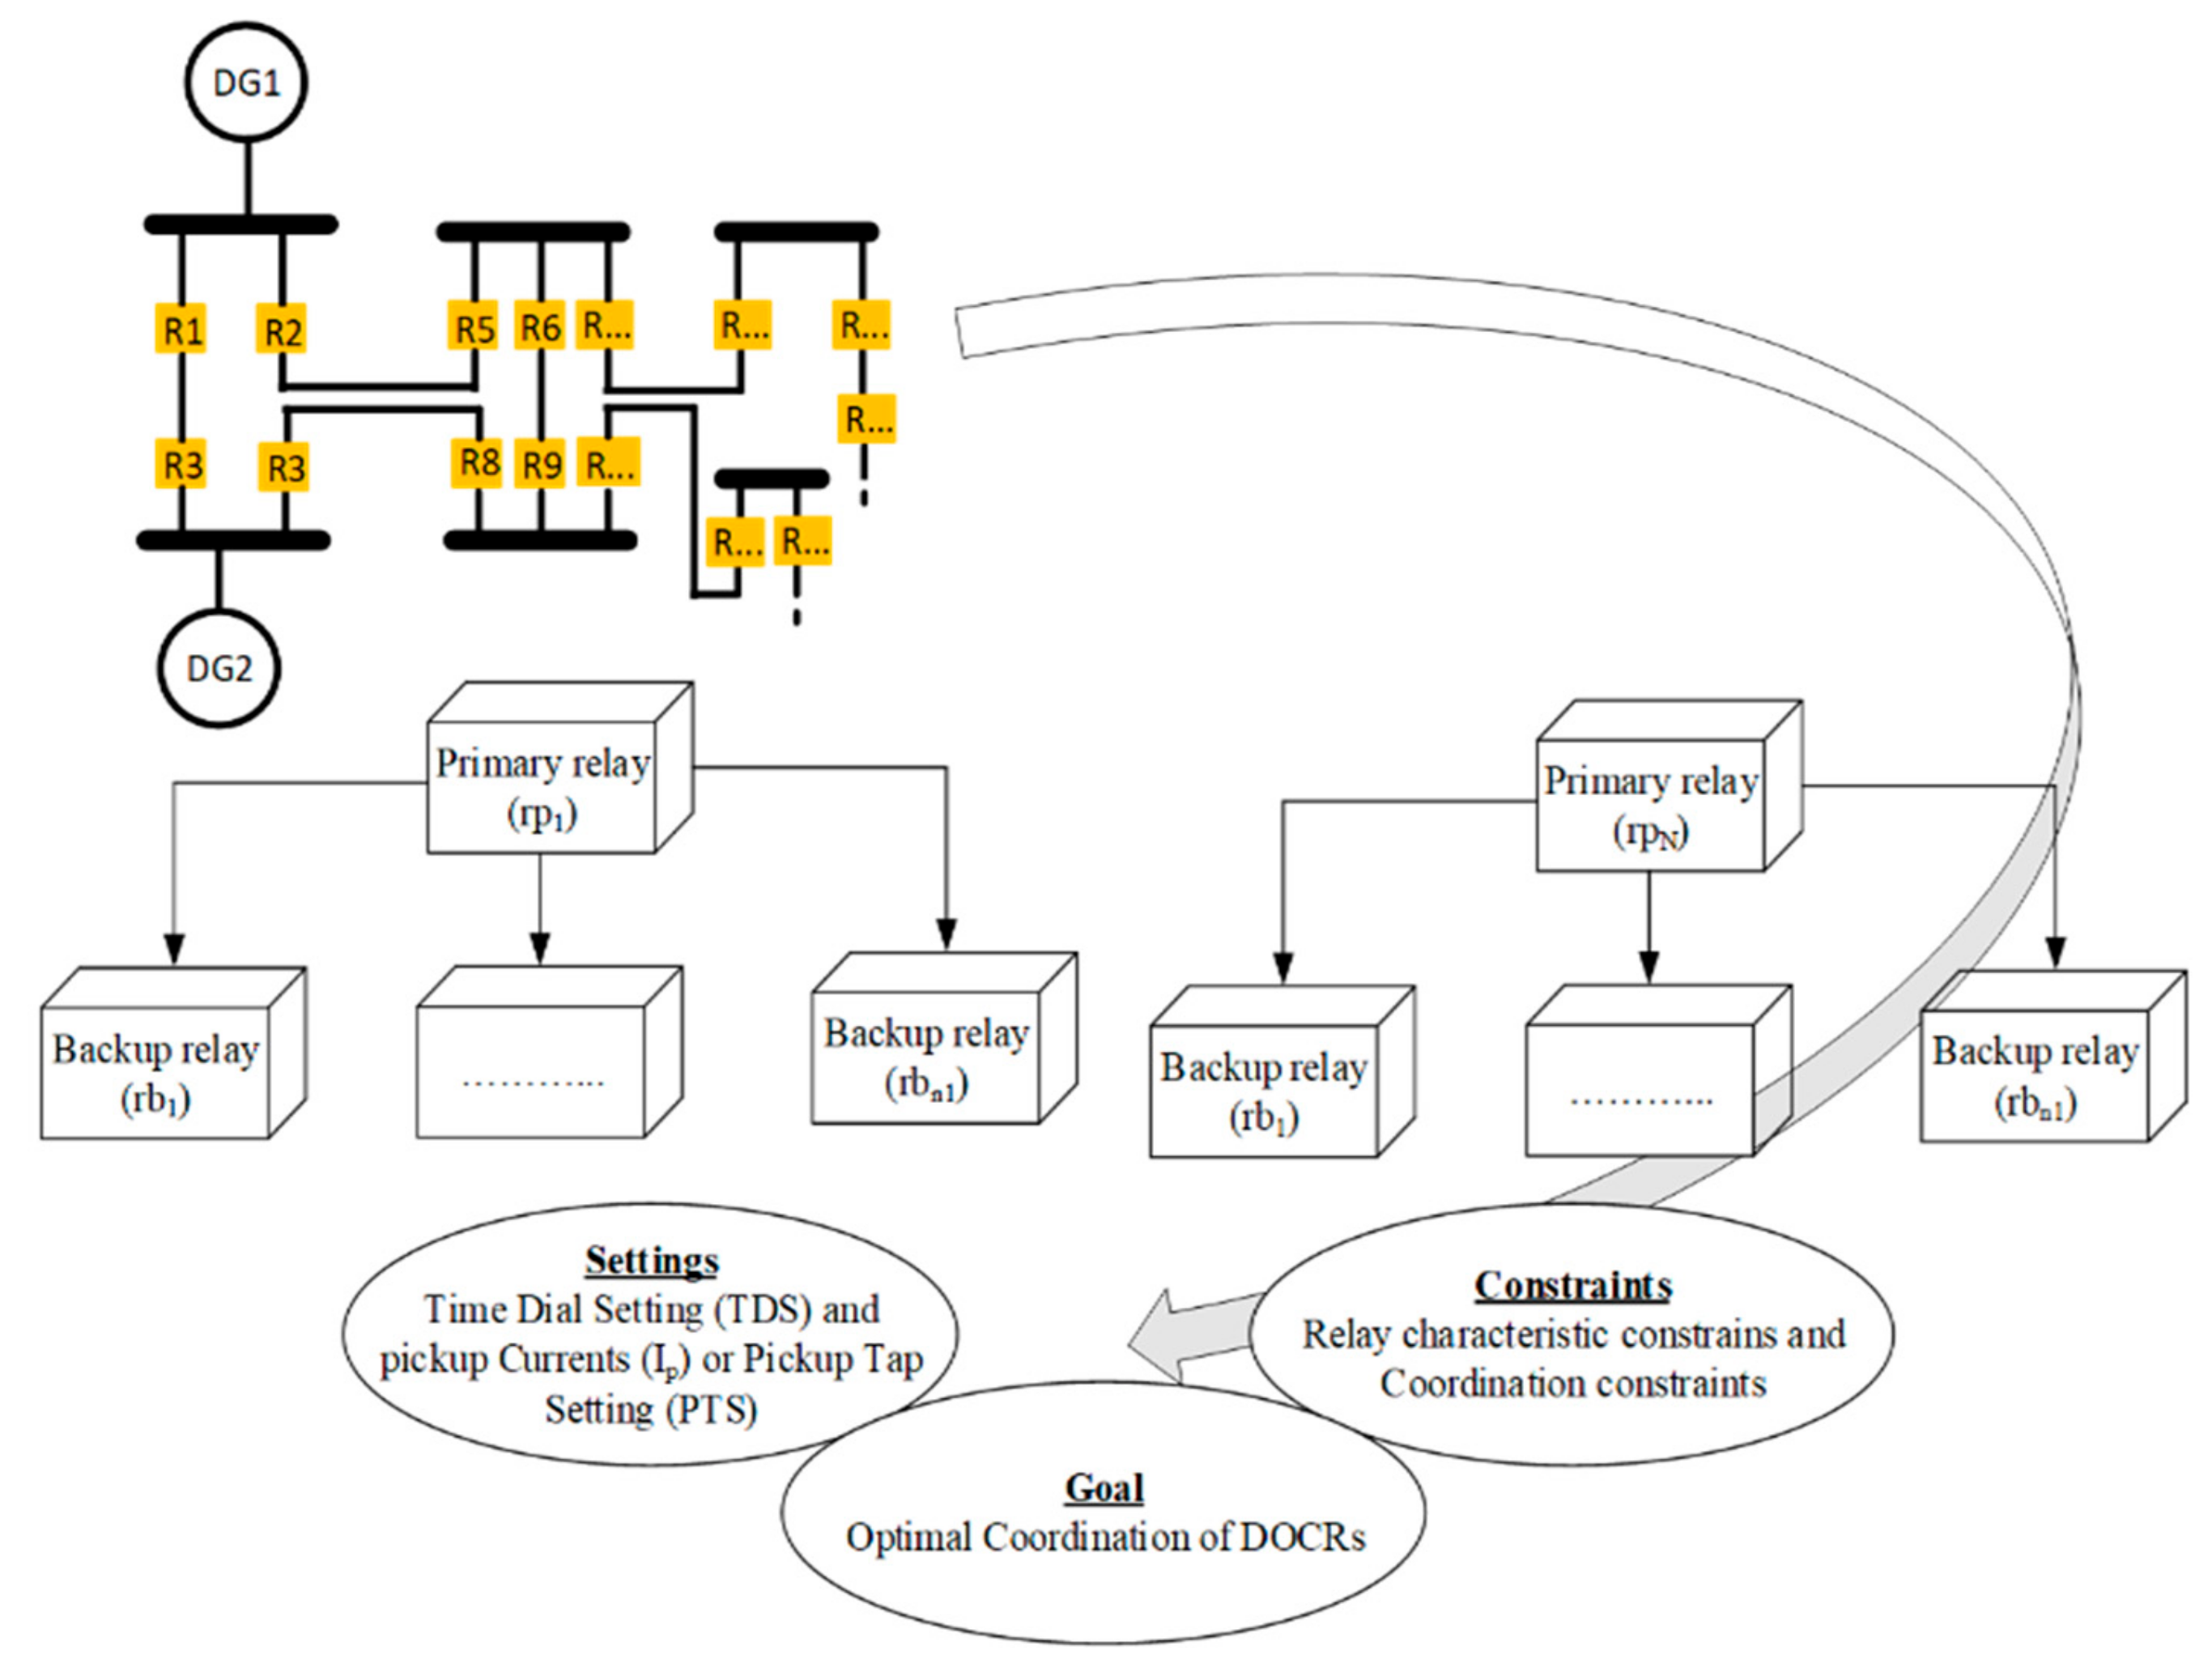
2. DOCR Problem Formulation
2.1. Coordination Criteria
- Tb: the backup relay operating time; and
- Tp: the primary (or main) relay operating time.
2.2. Relay Setting Bounds
3. Whale Optimization Algorithm
3.1. Encircling Prey
3.2. Bubble-Net Attacking Method
3.2.1. Shrinking Encircling Mechanism
3.2.2. Spiral Updating of Position
3.3. Search for Prey
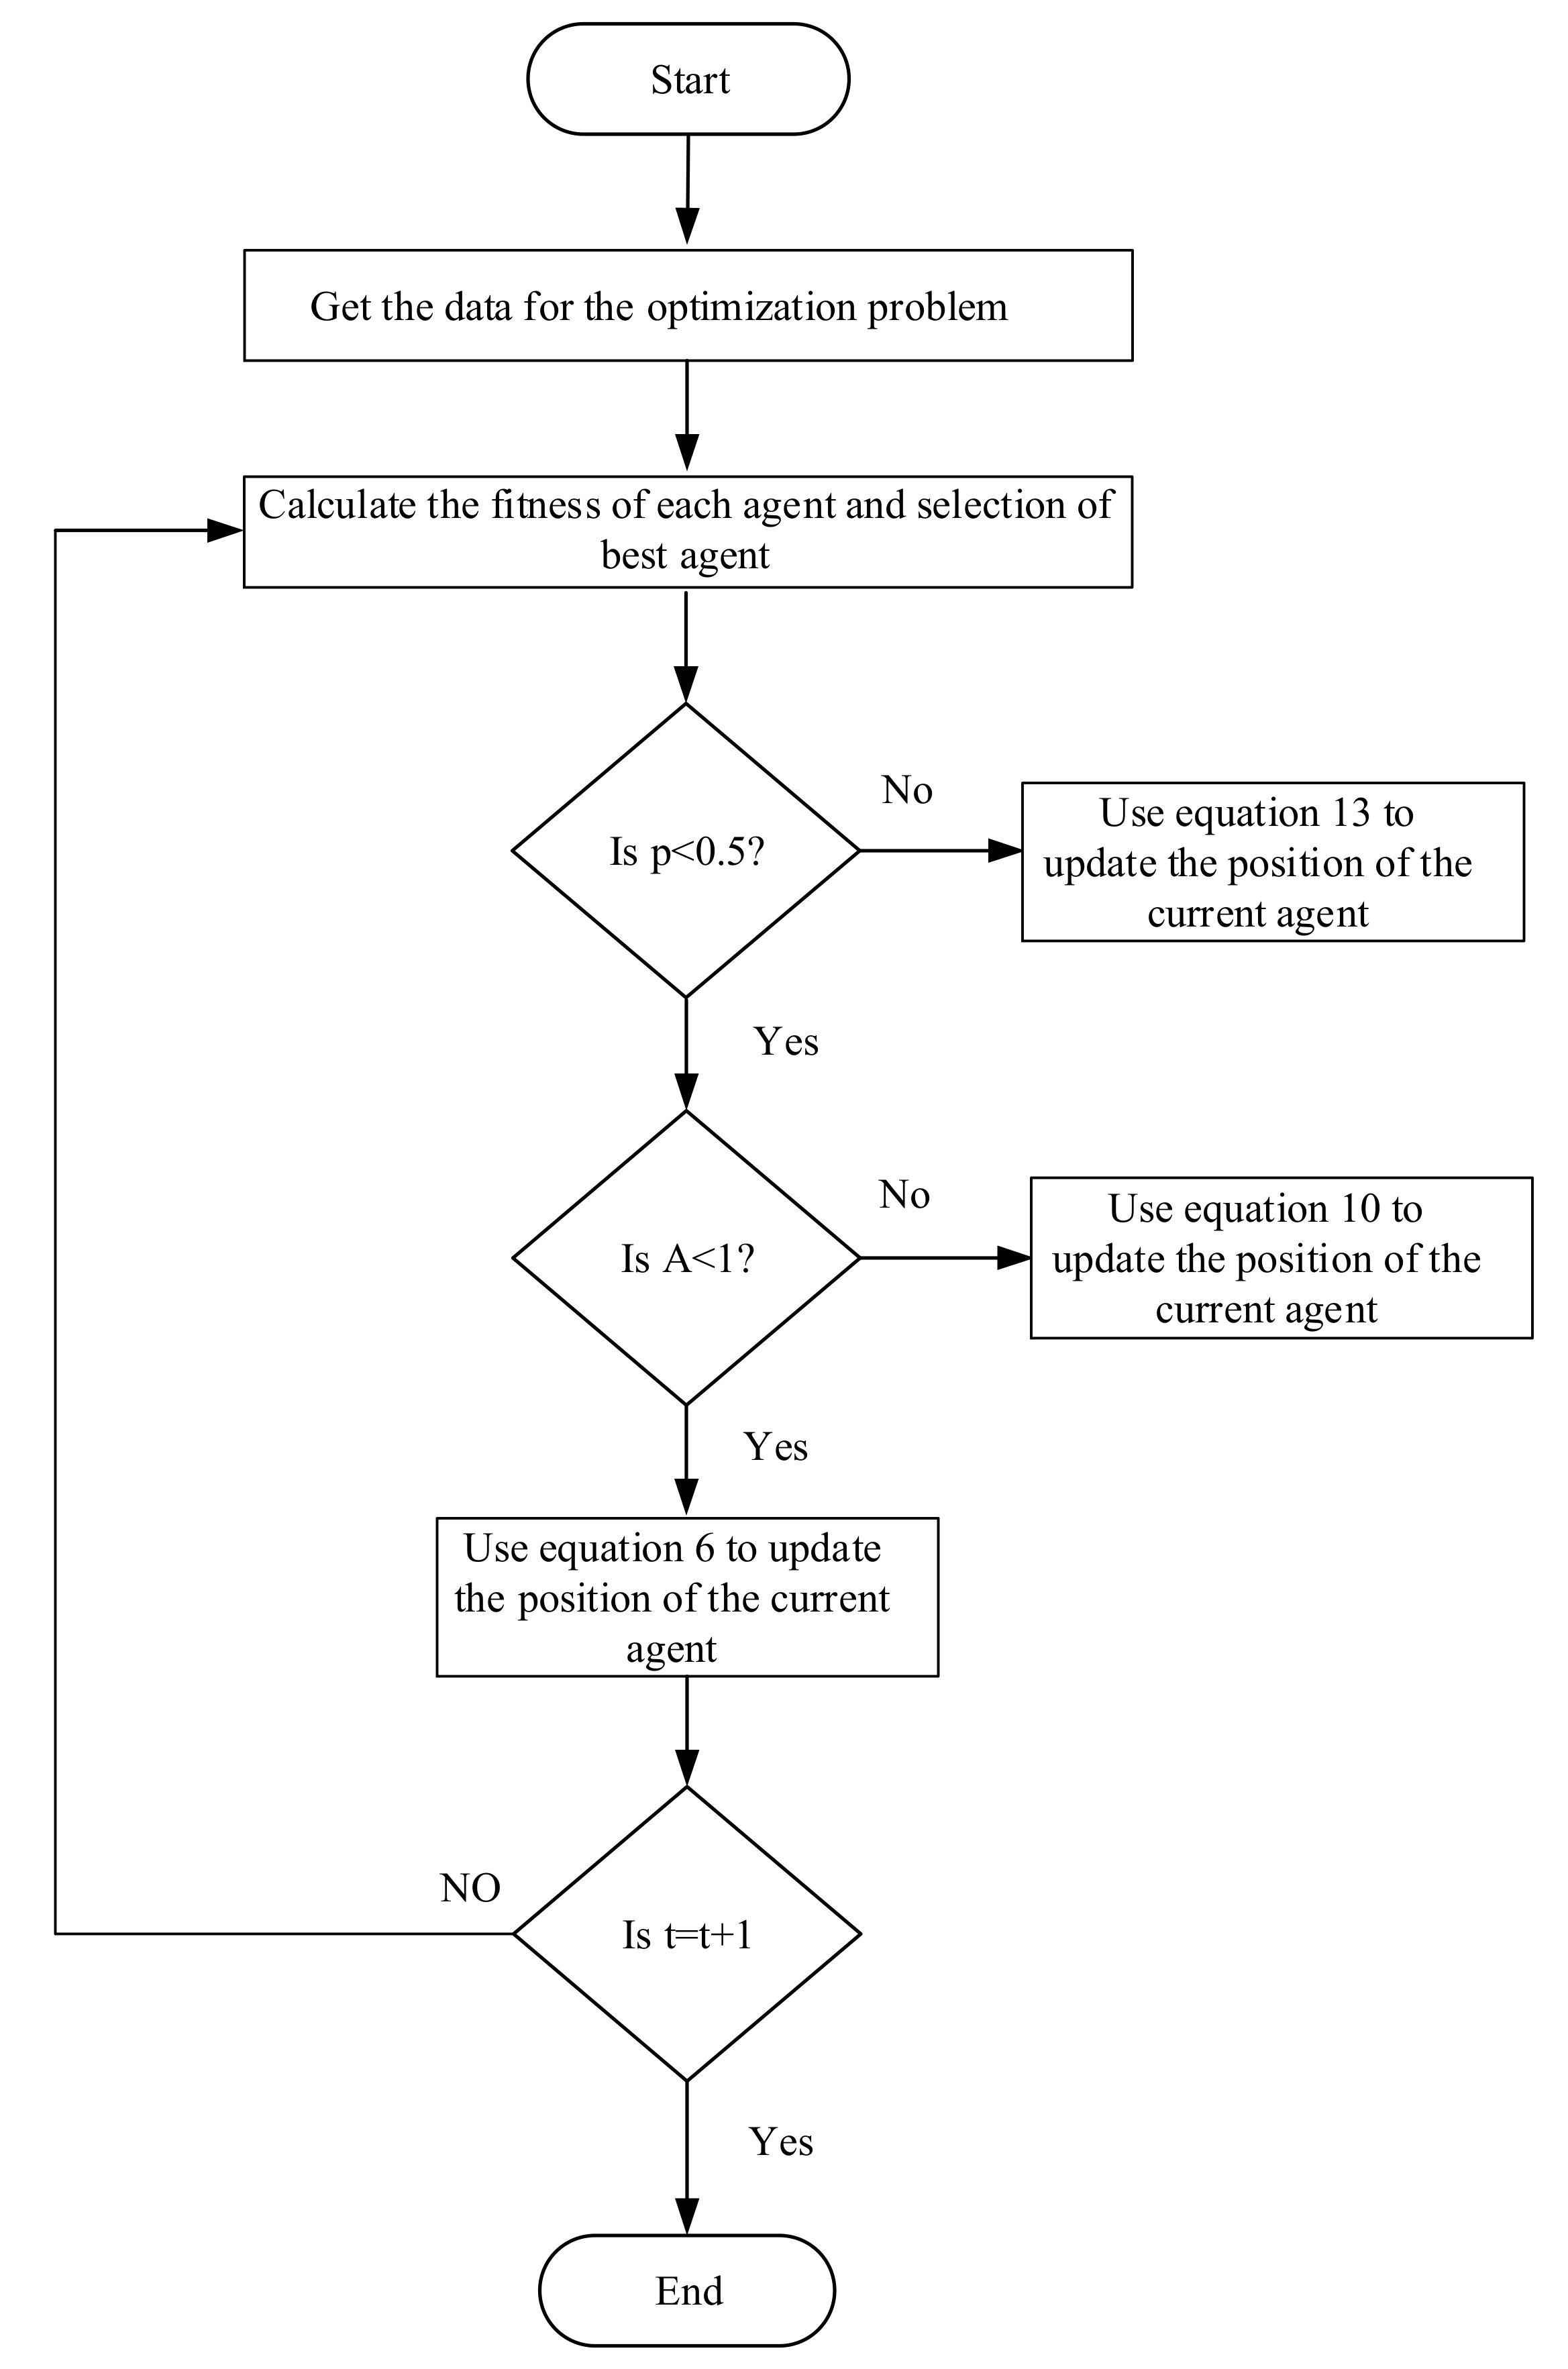
3.4. The Steps of WOA
| Algorithm 1. The pseudocode of WOA. |
| Initialize population size (NP), number of design variables and meeting criteria, number of fitness function evaluations Analyze the fitness function value for each search agent = The best search agent while (t < maximum number of iteration) for each search agent Update a, , C, l and p if (p < 0.5) if (|| < 1) Update the position of the current search agent by the Equation (6) else if (|| 1 Select the random search agent Update the position of the current search agent by the Equation (13) end if else if (p ) Update the position of the current search agent by the Equation (10) end if end for Alleviate any search agent that goes outside the search space fitness function evaluations of each search agent Update if there is a better solution t = t + 1 end while Return |
4. Results and Discussion
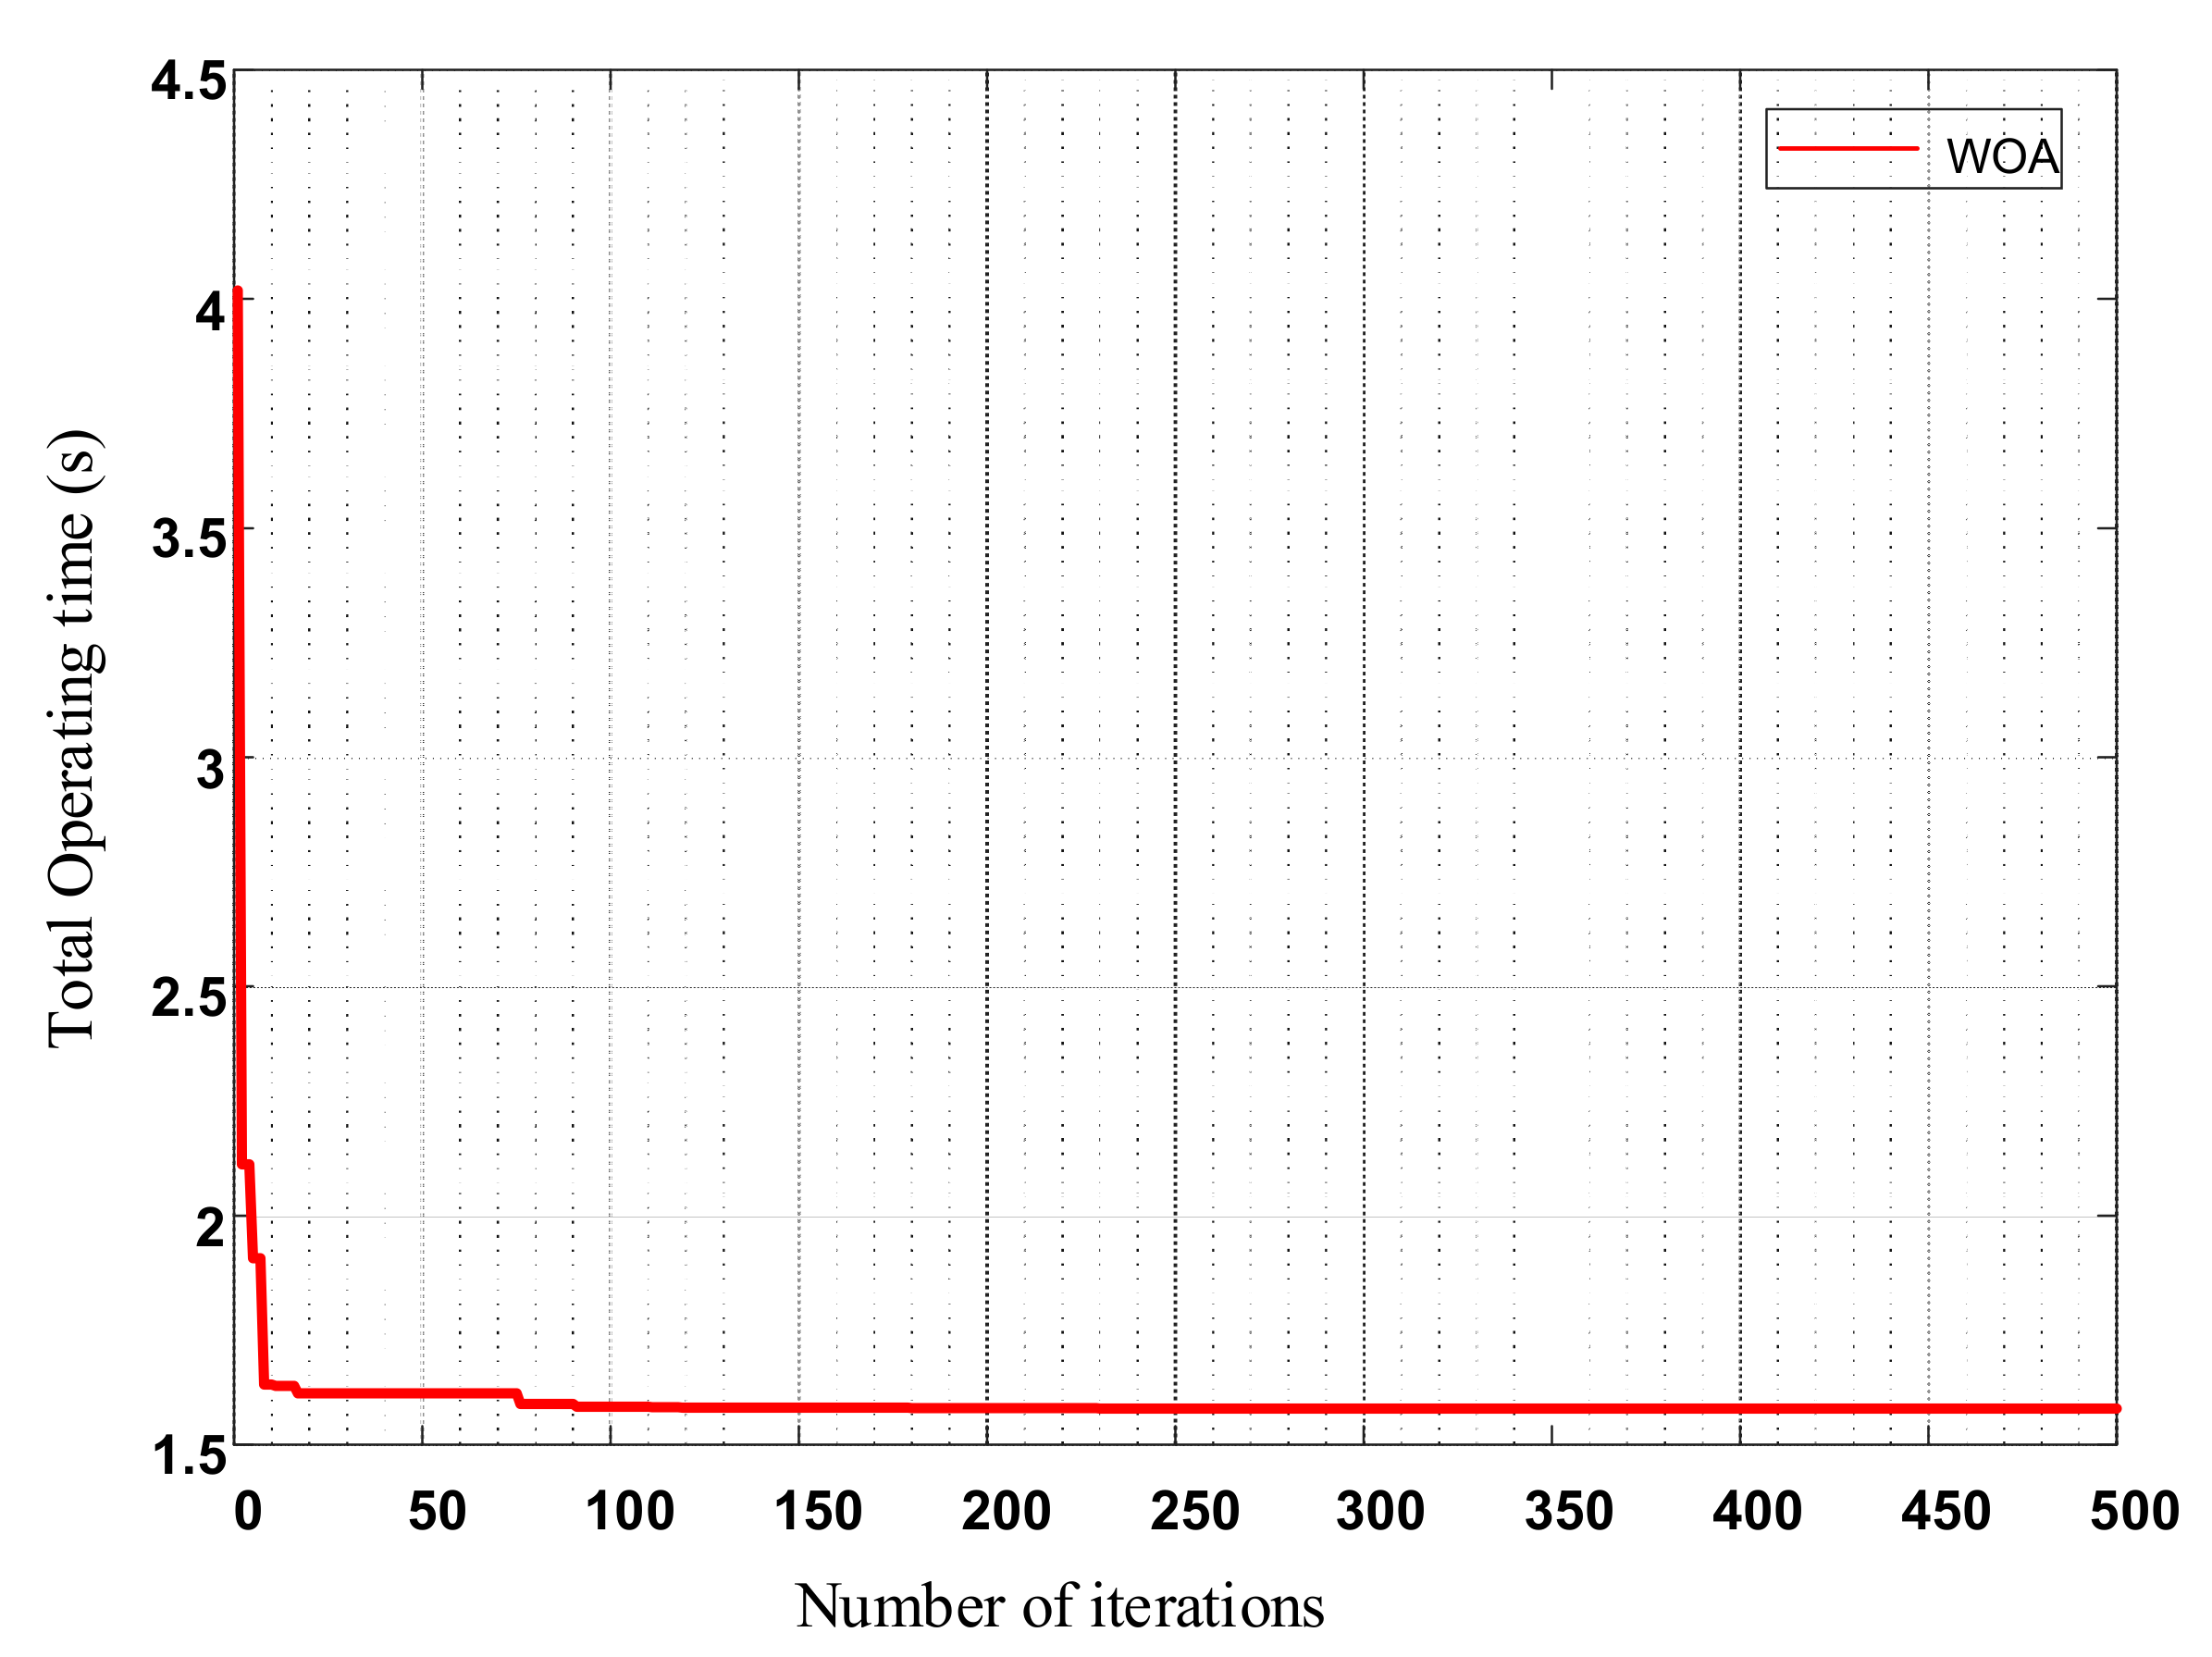
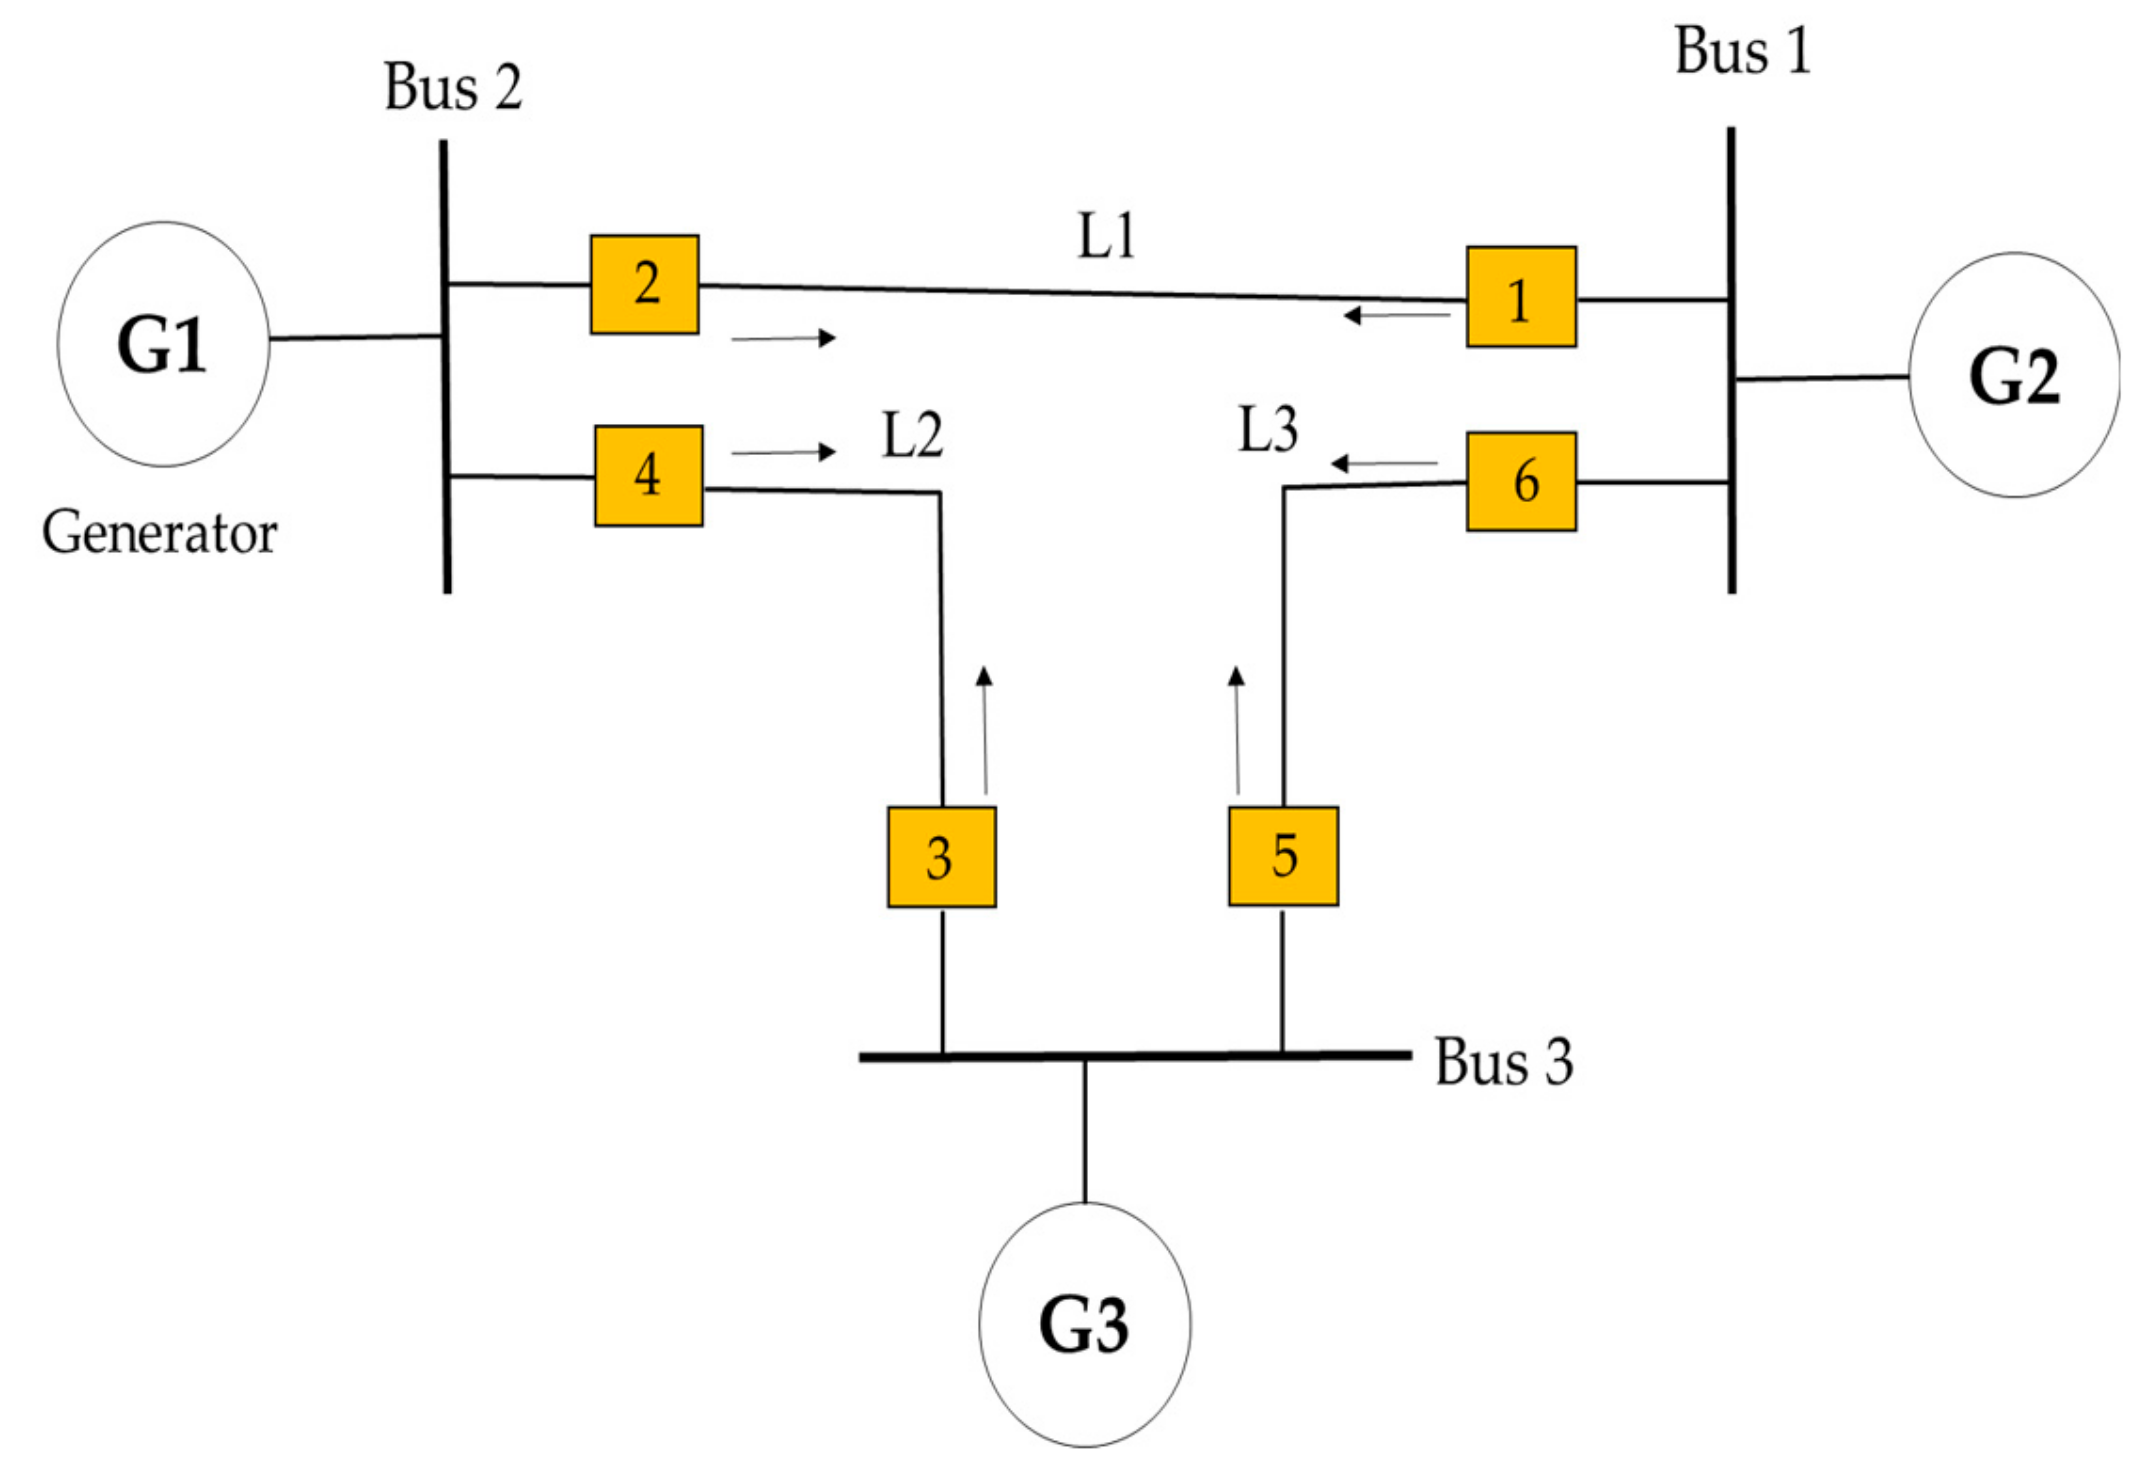
4.1. Case I: IEEE Three-Bus System
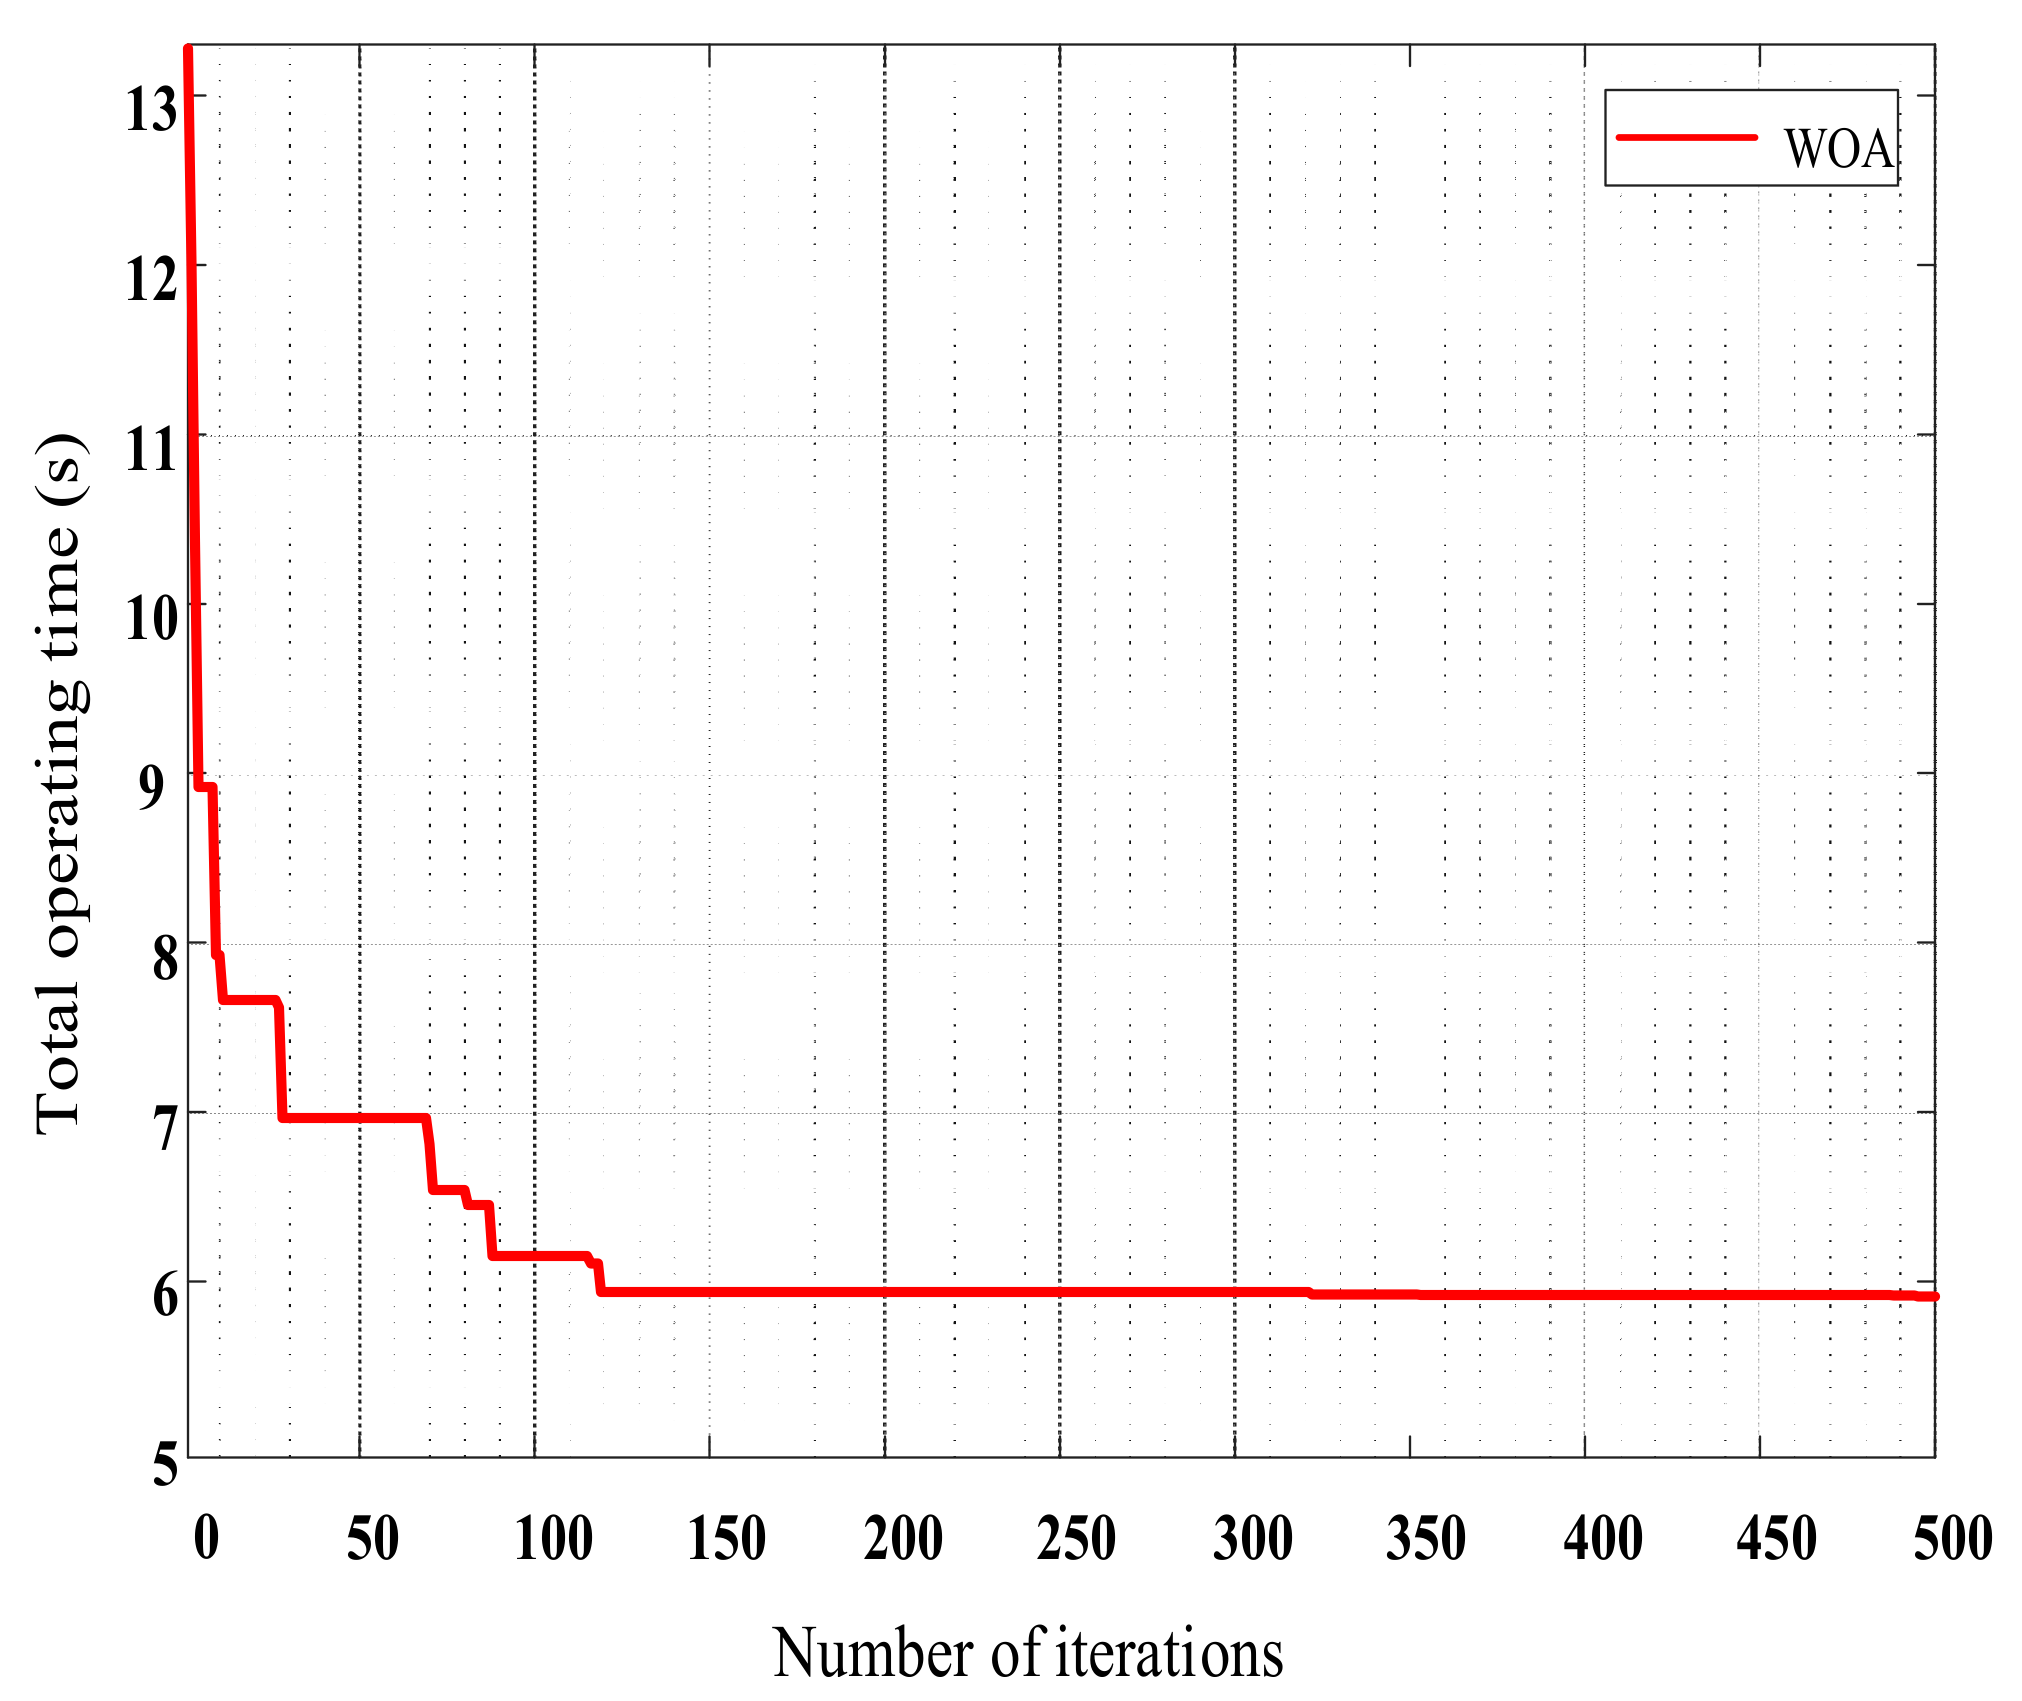
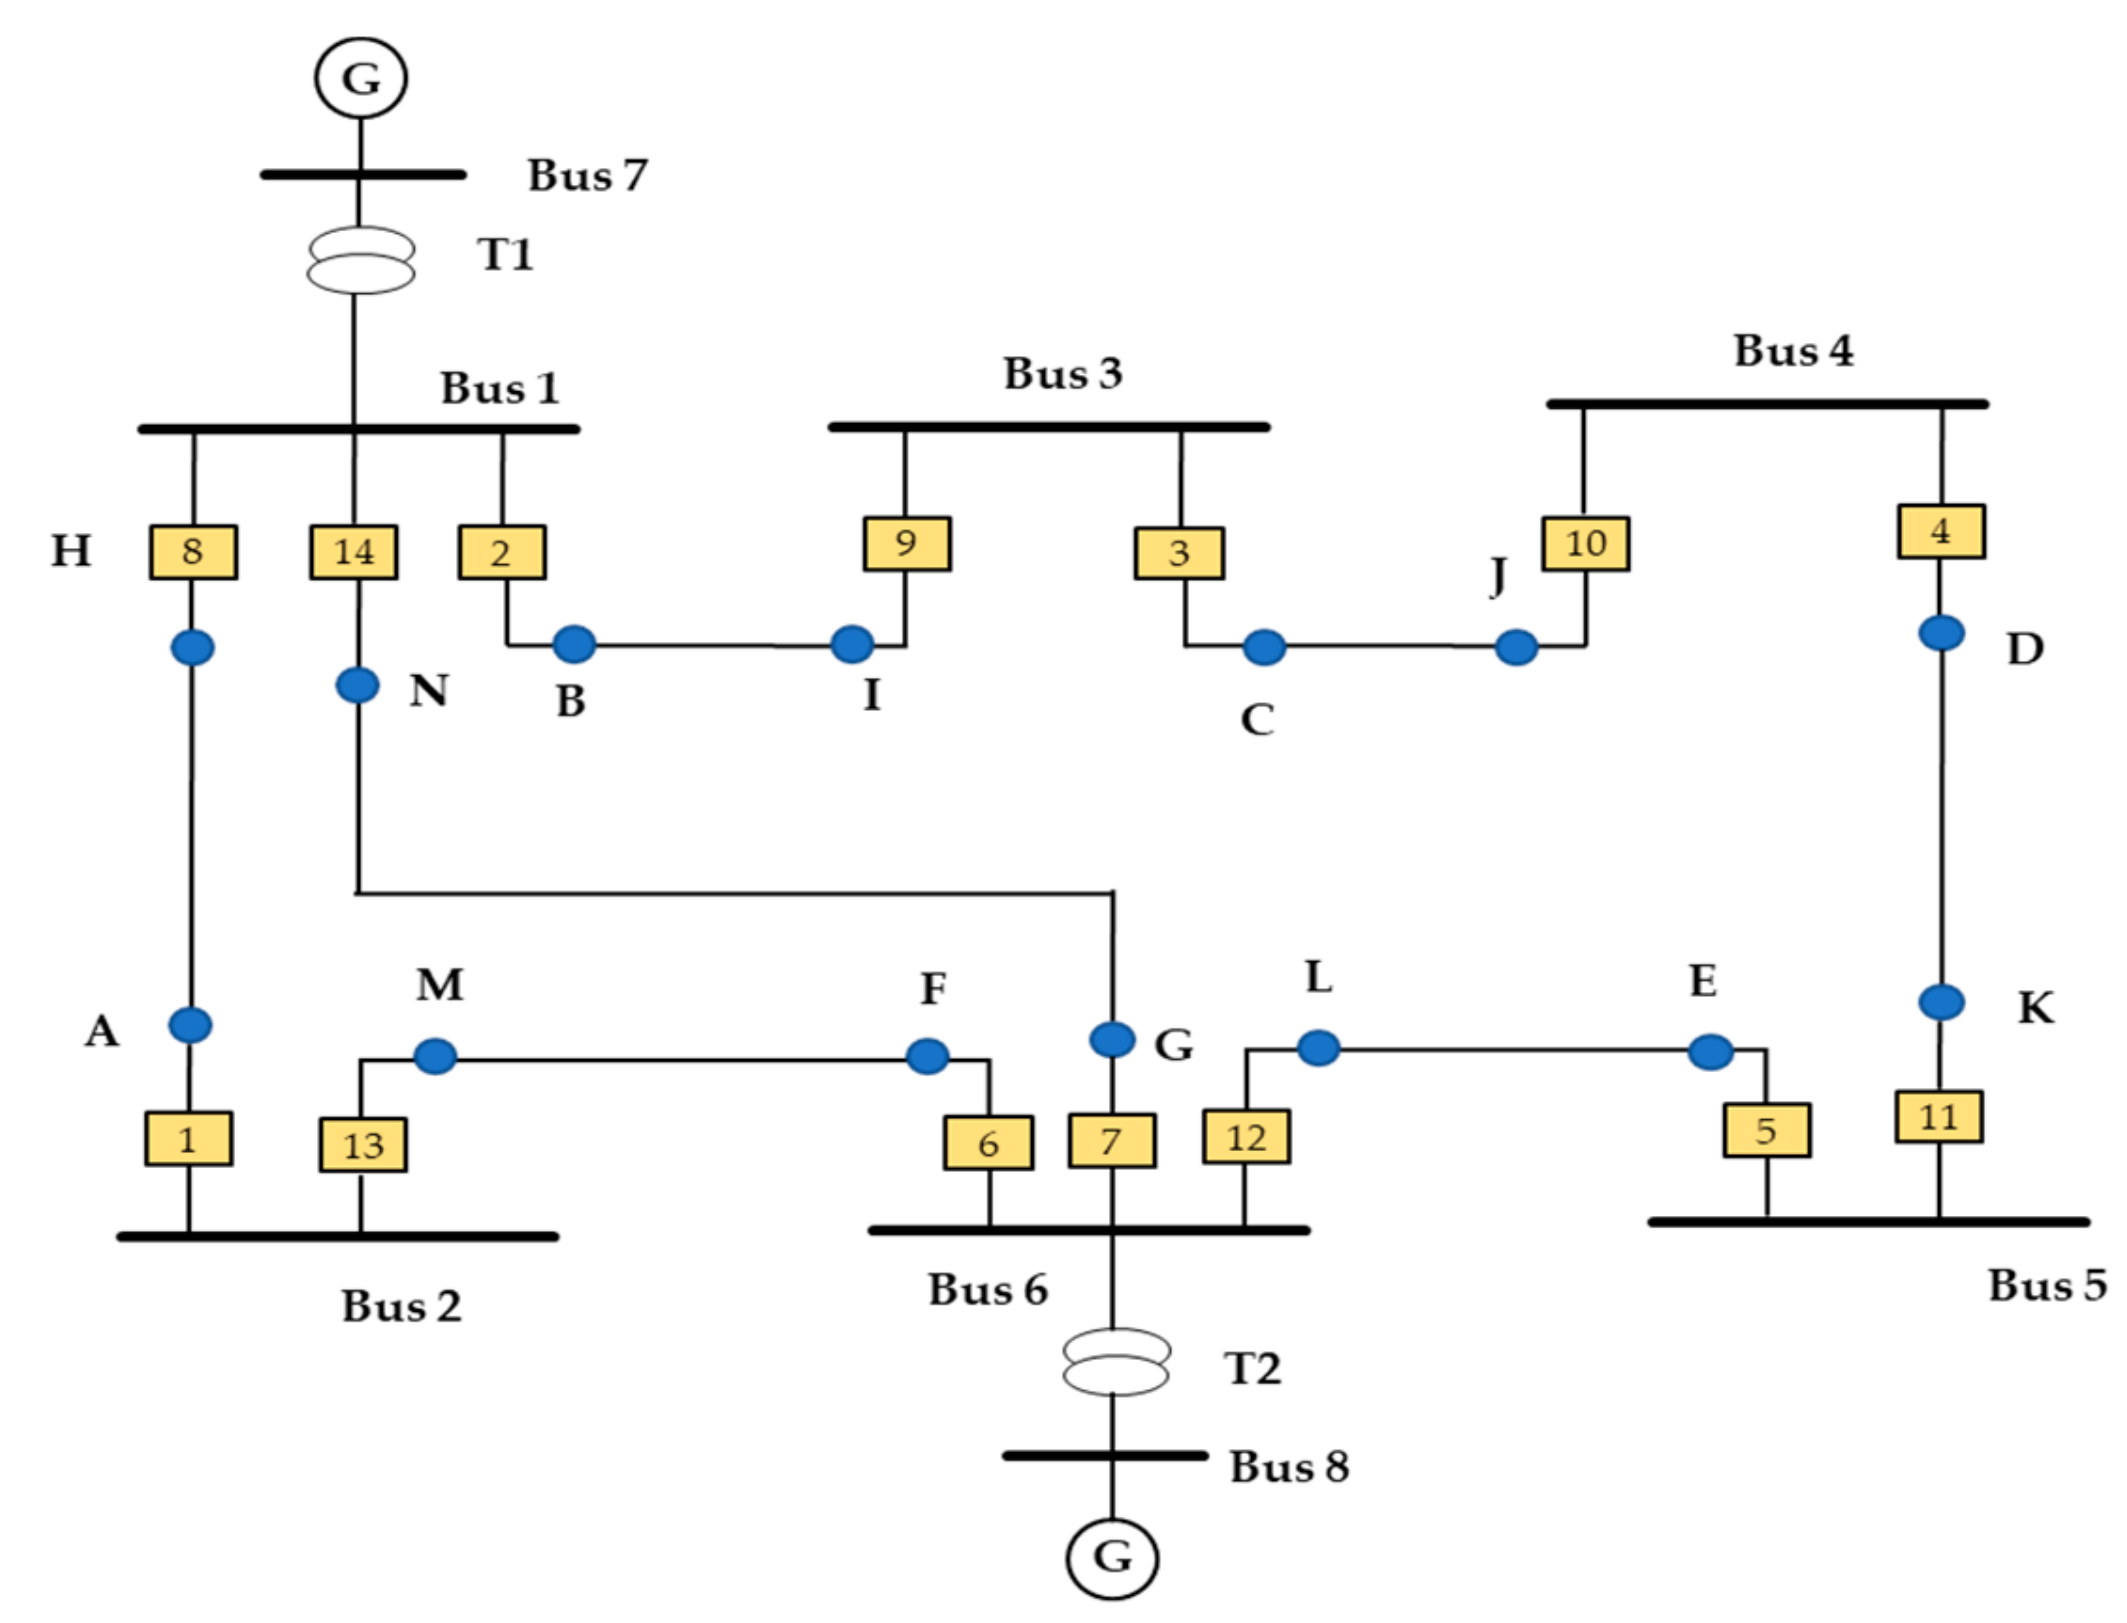
4.2. Case II: IEEE Eight-Bus System
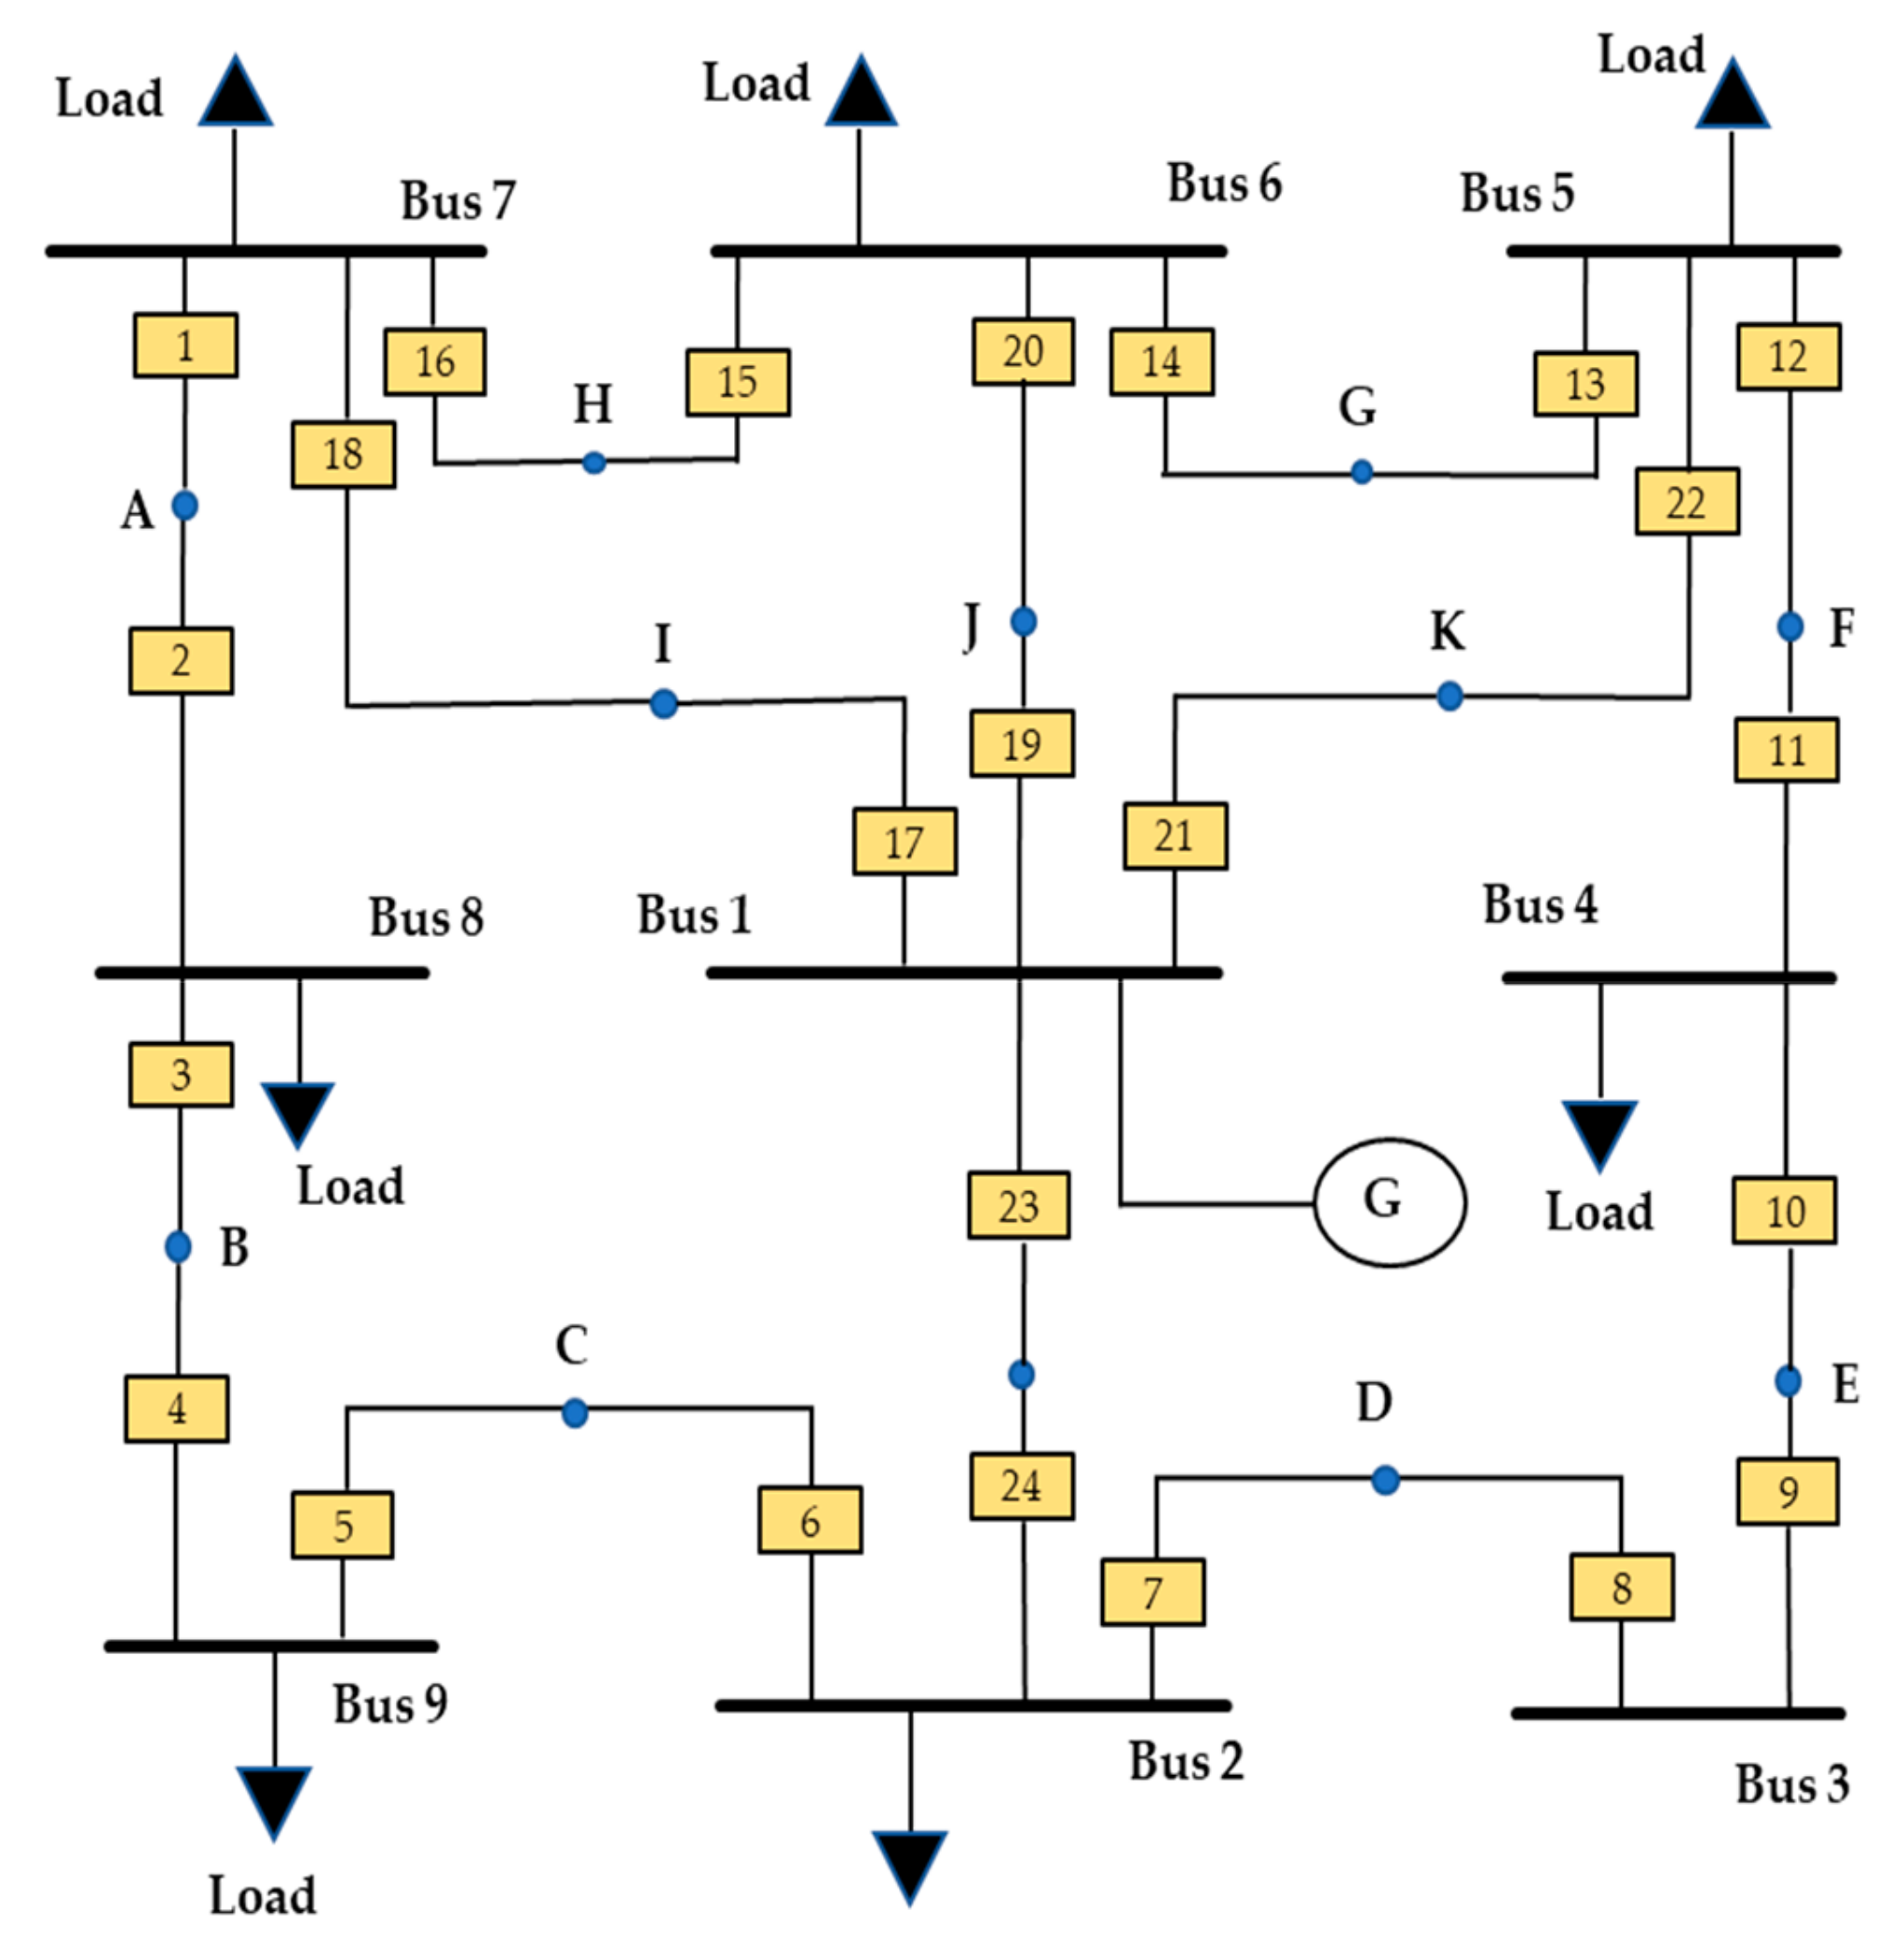
4.3. Case III: IEEE Nine-Bus System
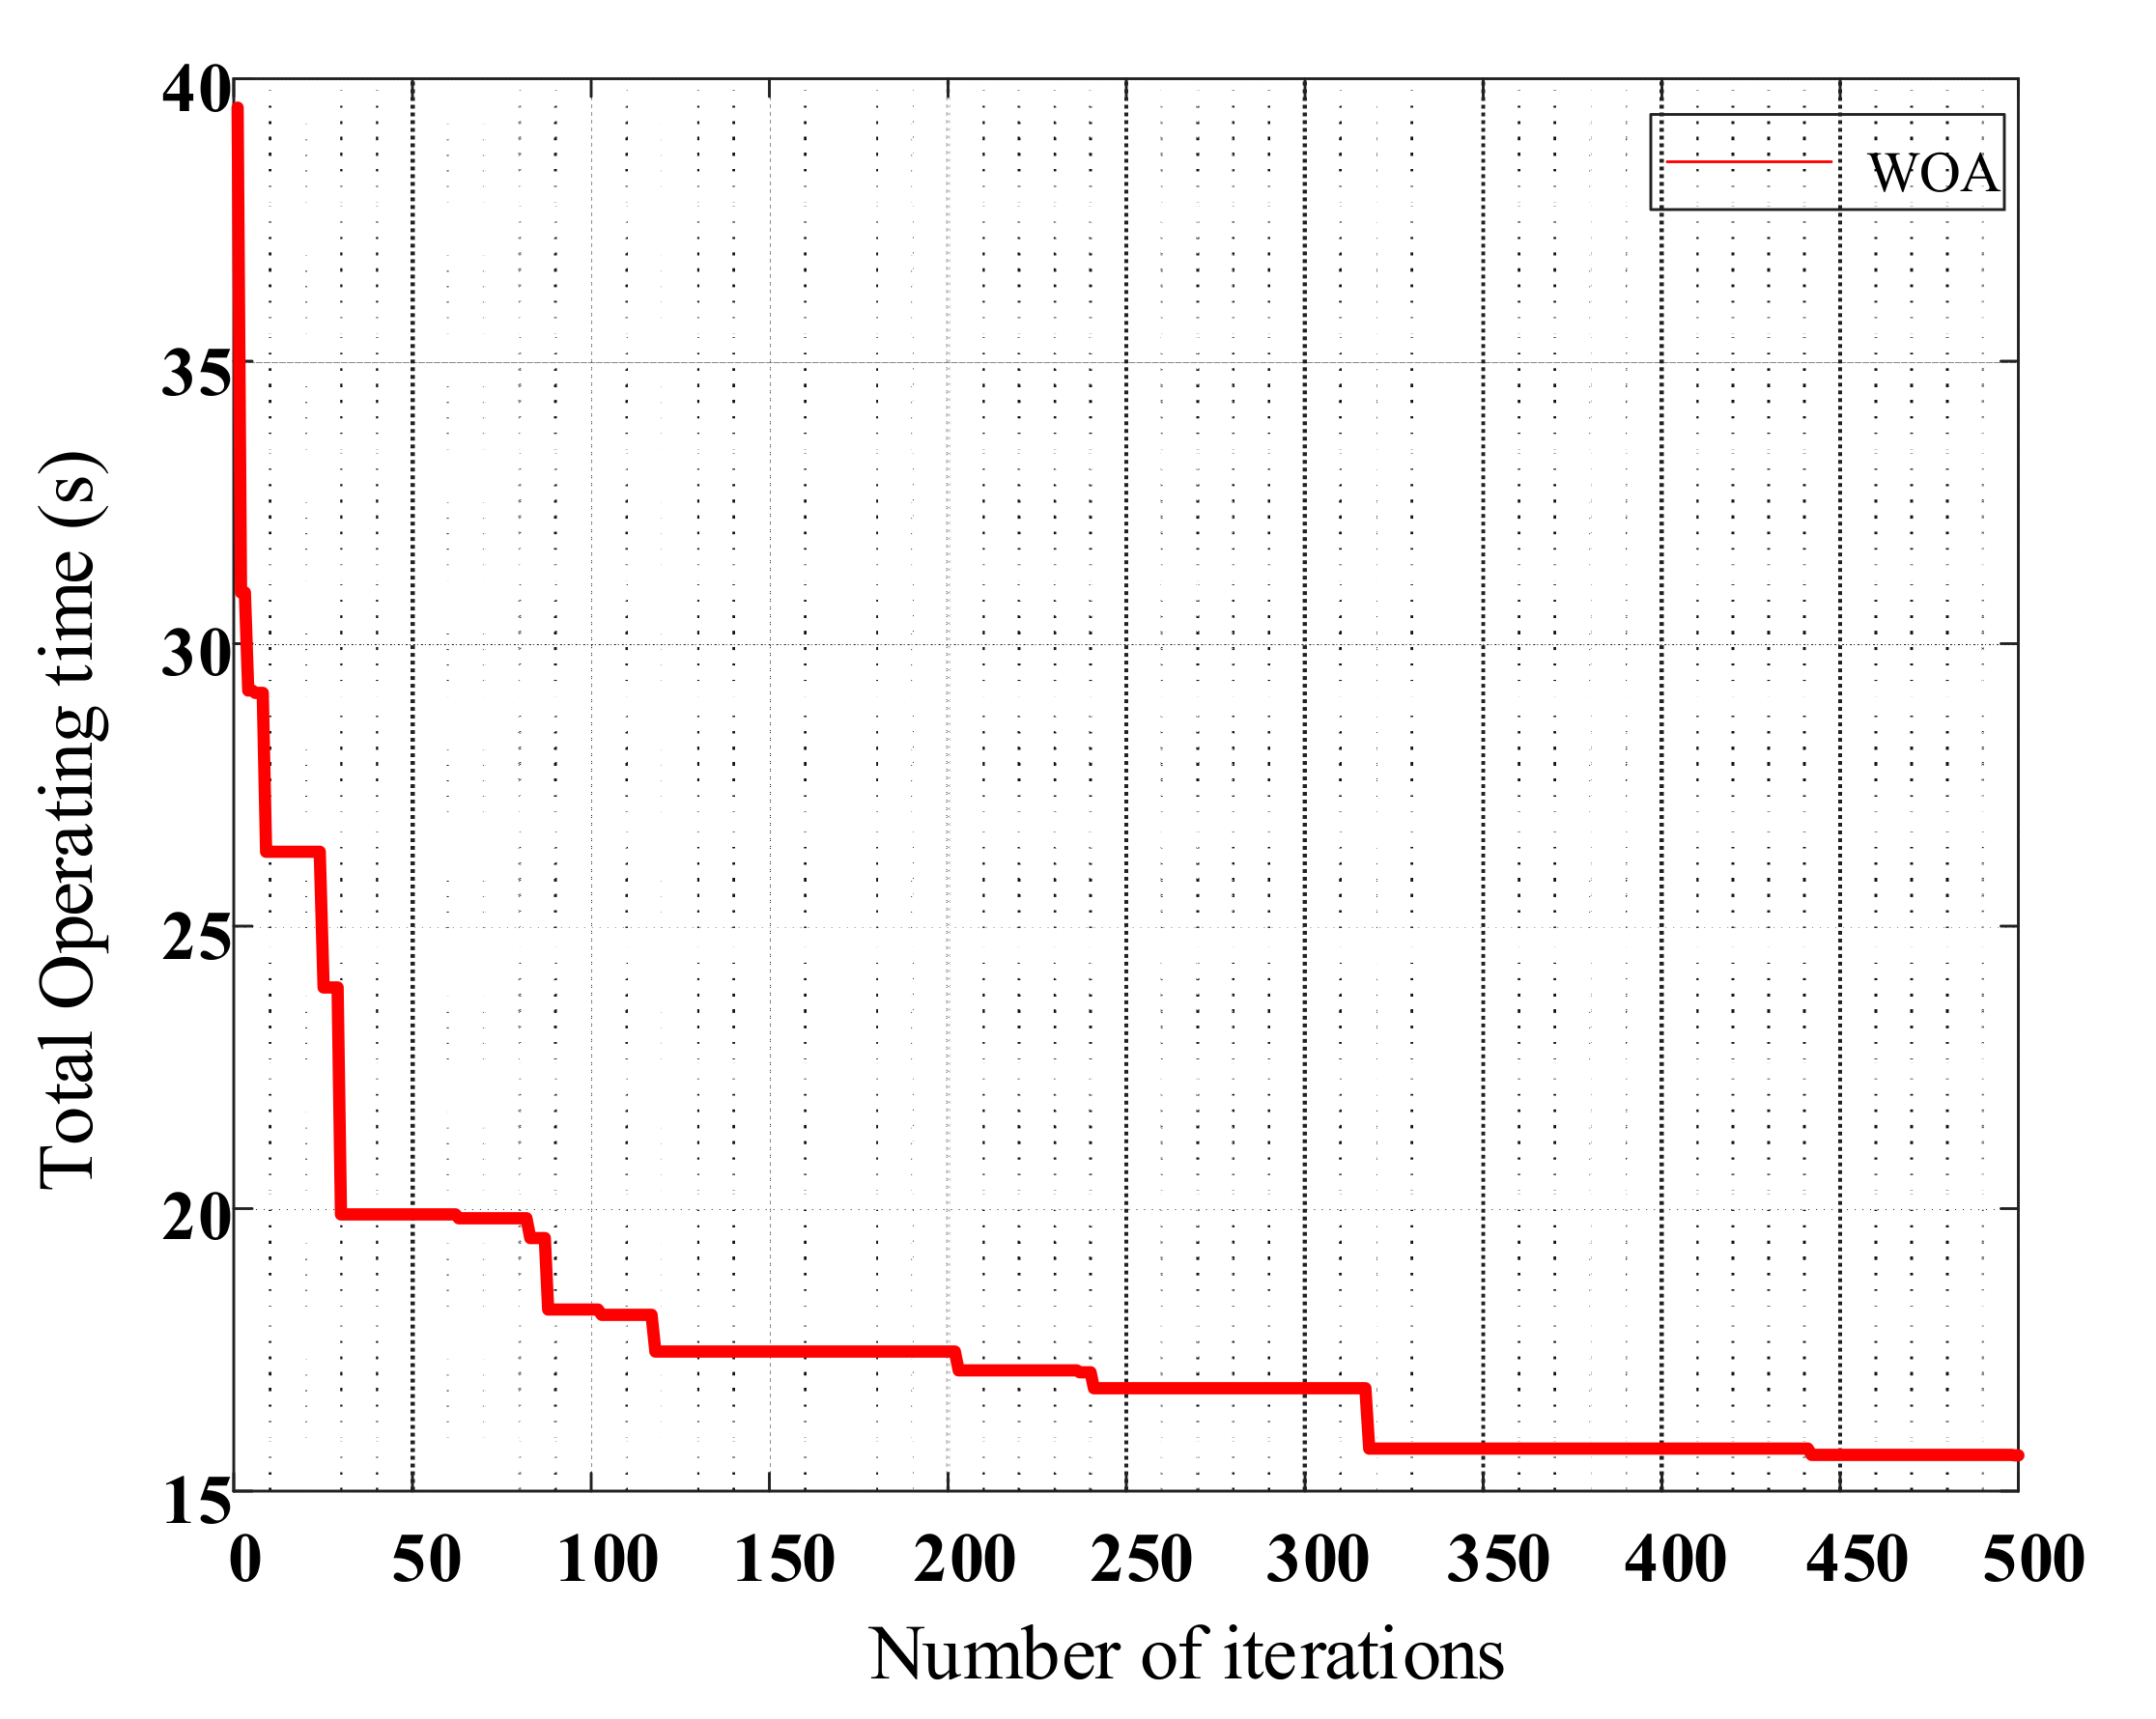
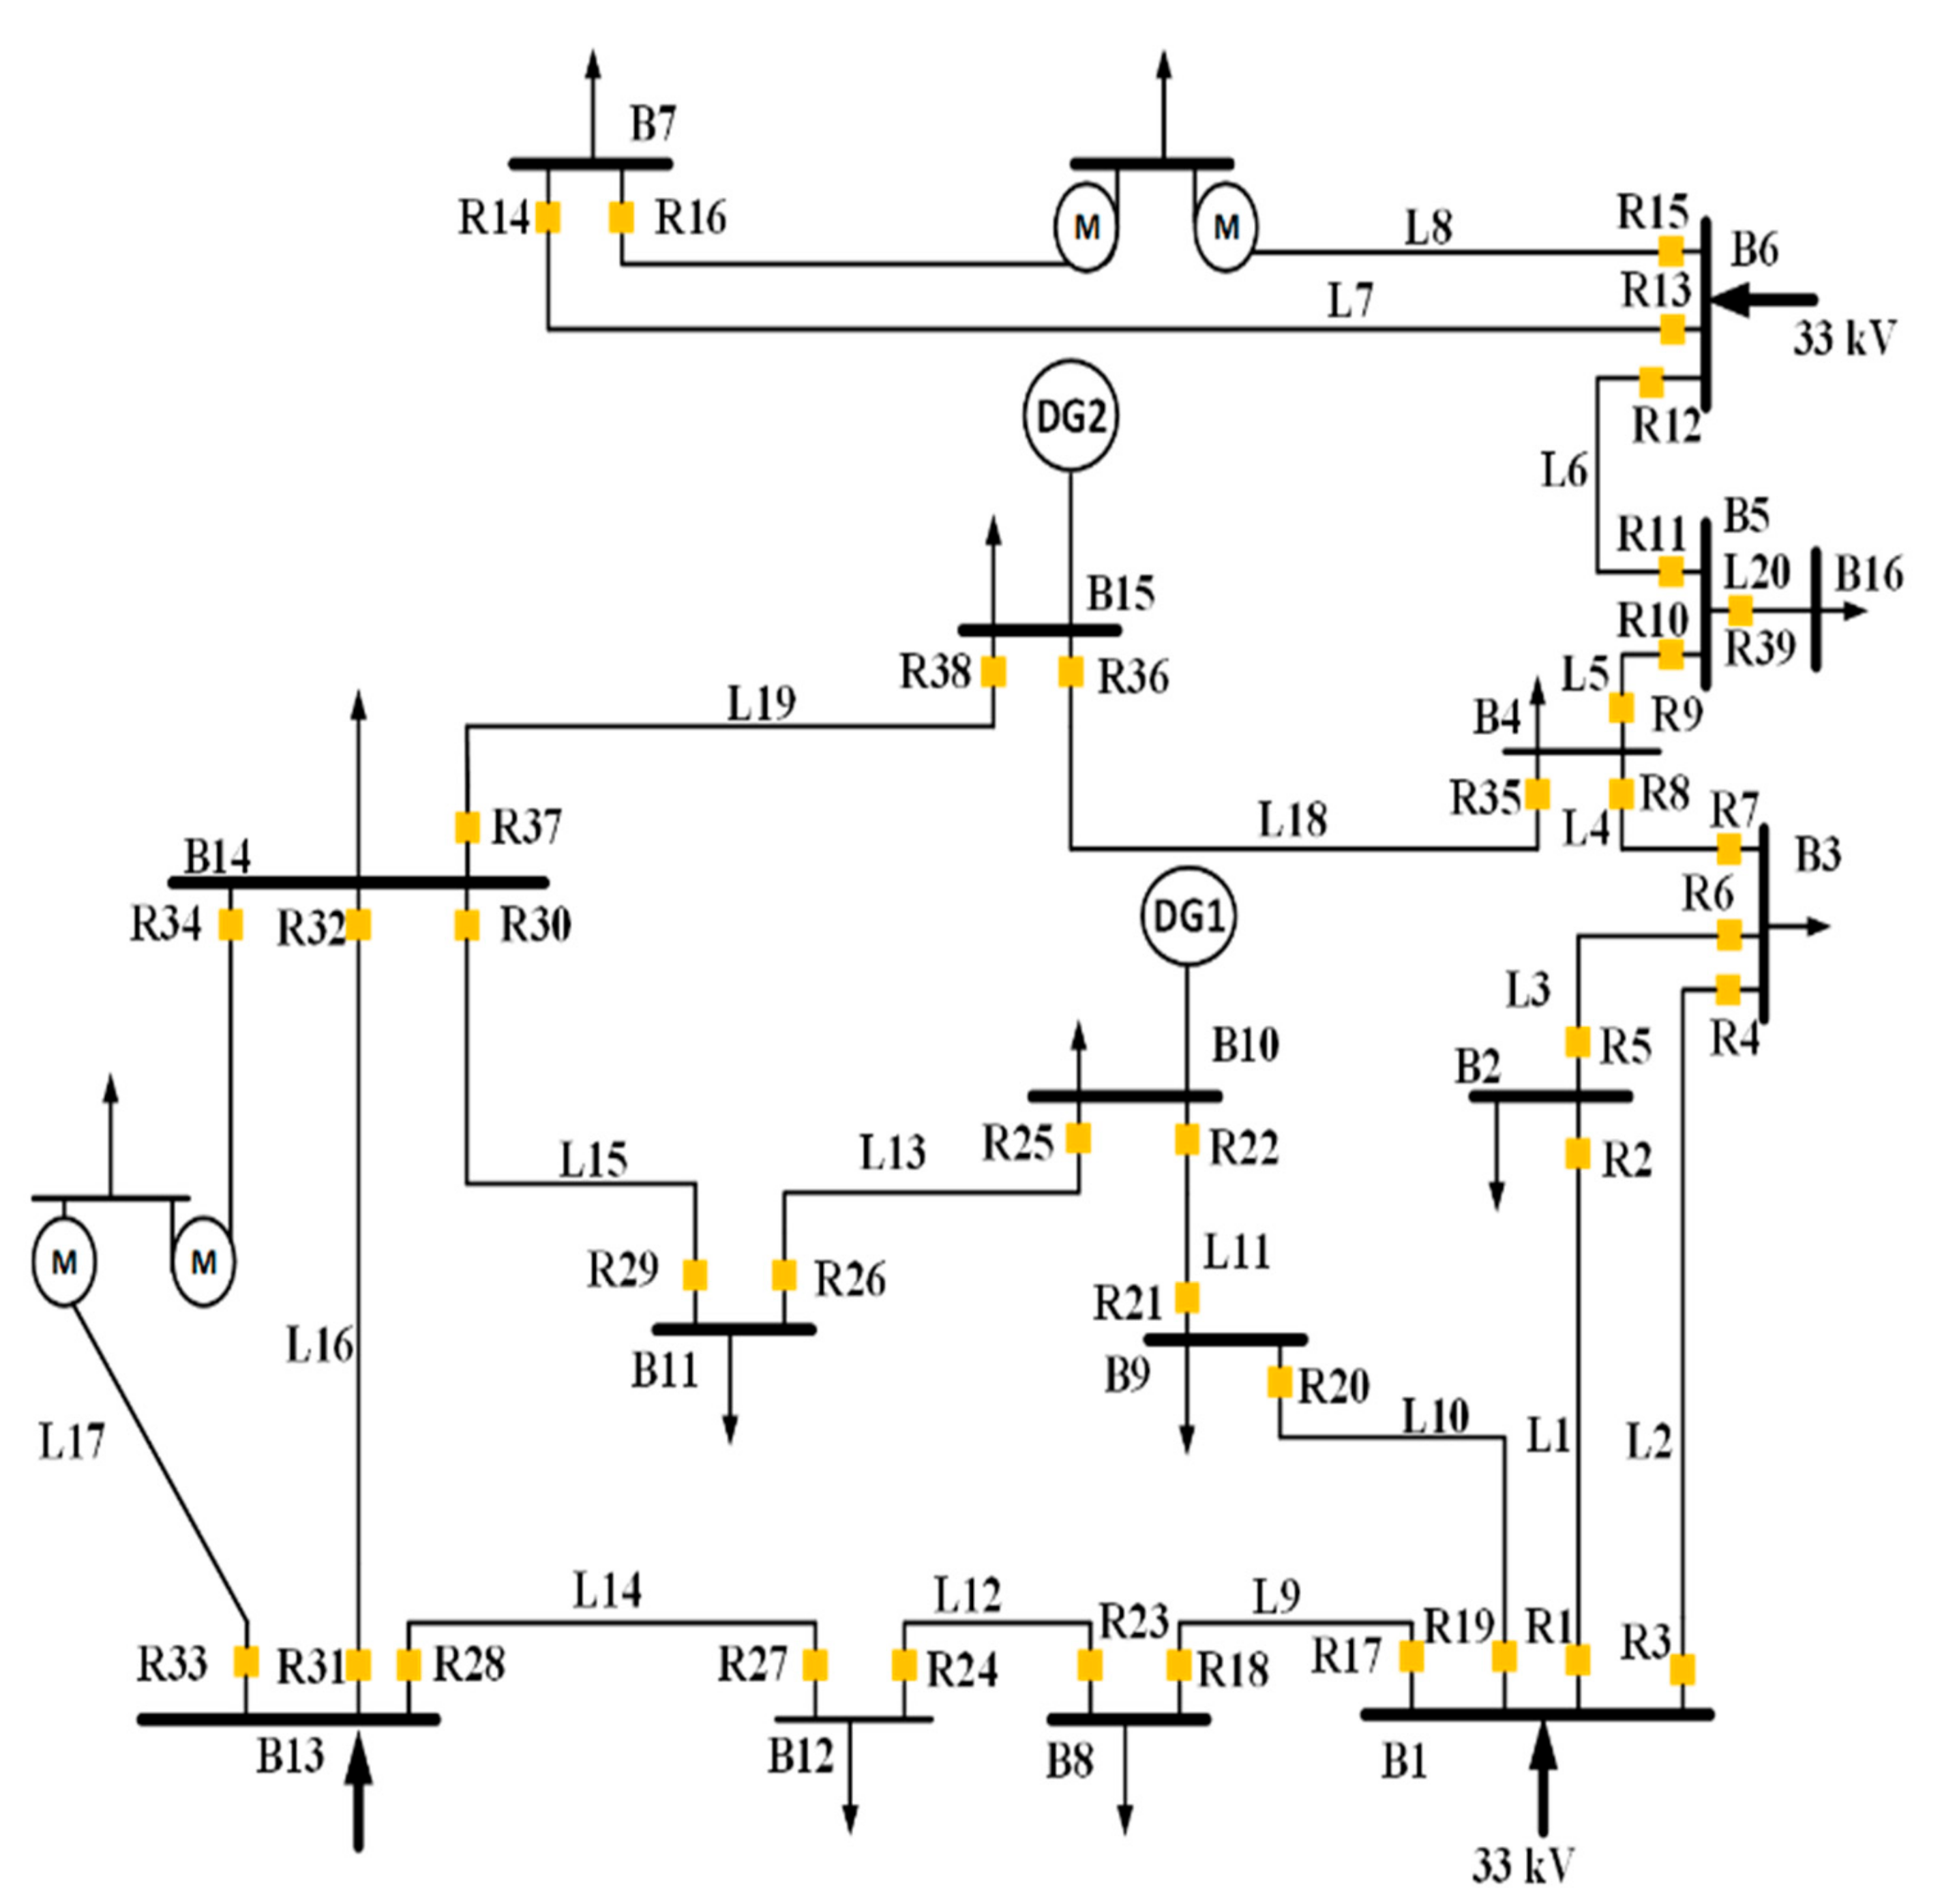
4.4. Case IV: IEEE 15-Bus System
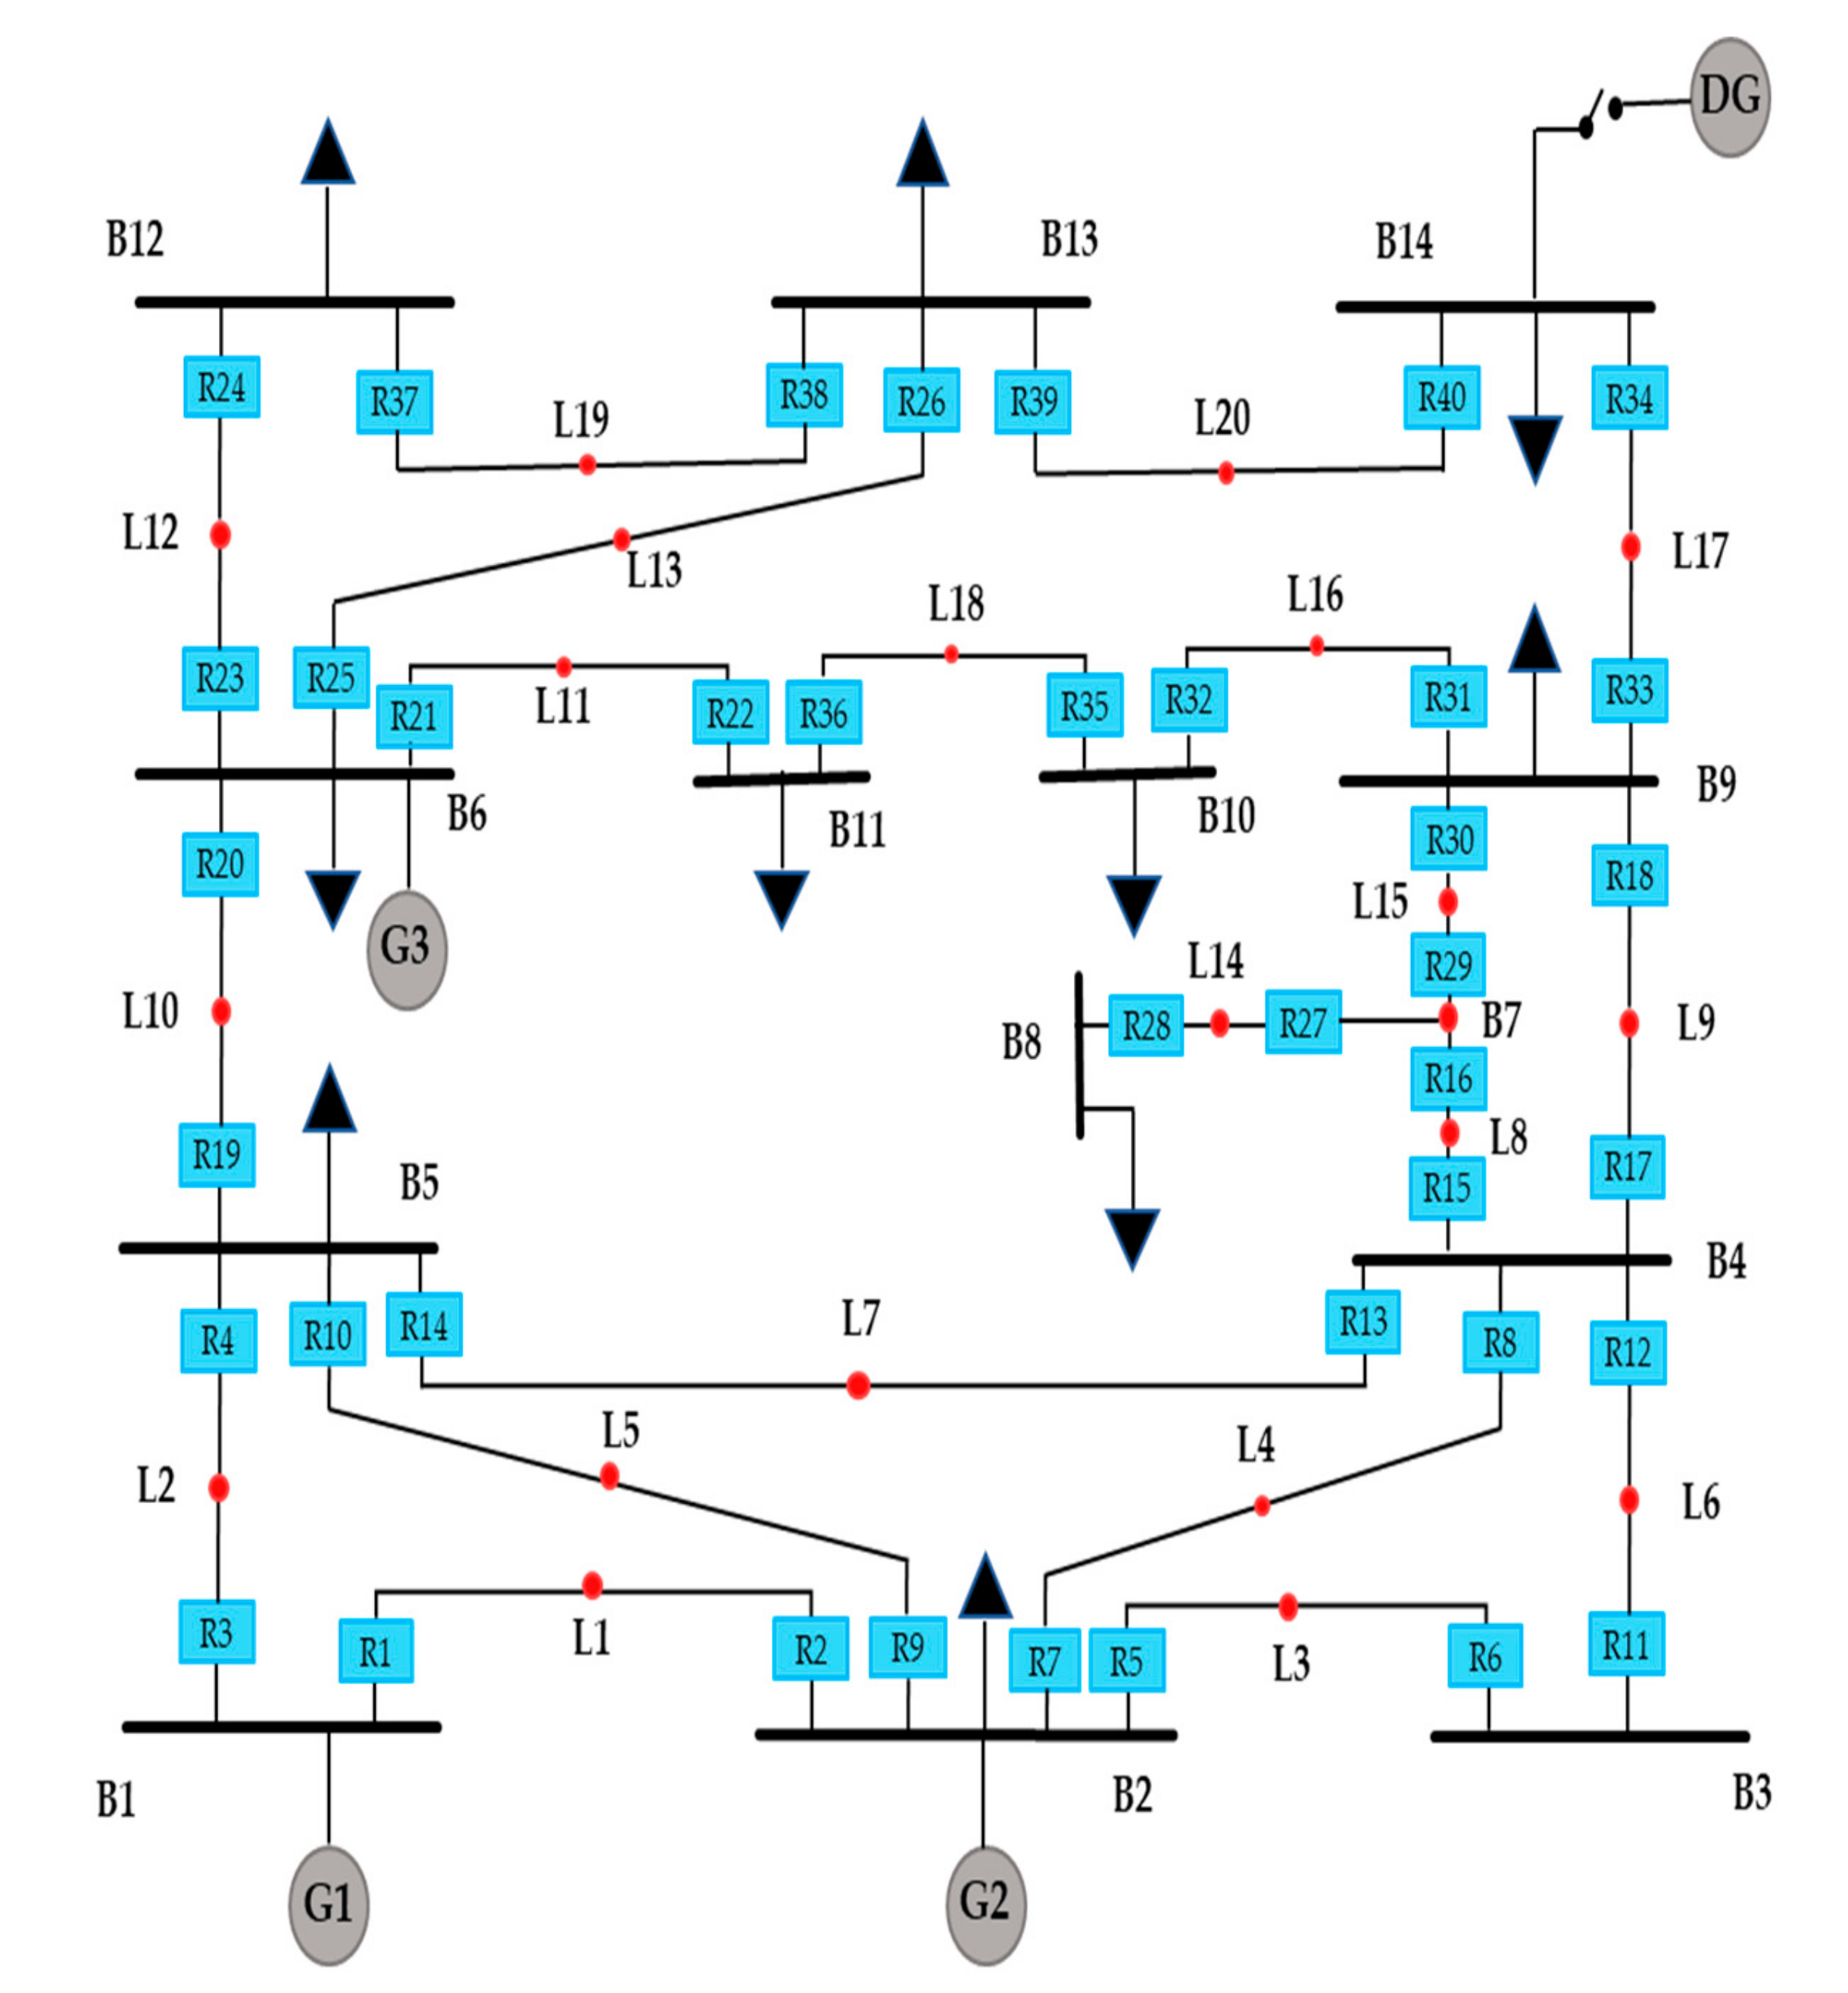
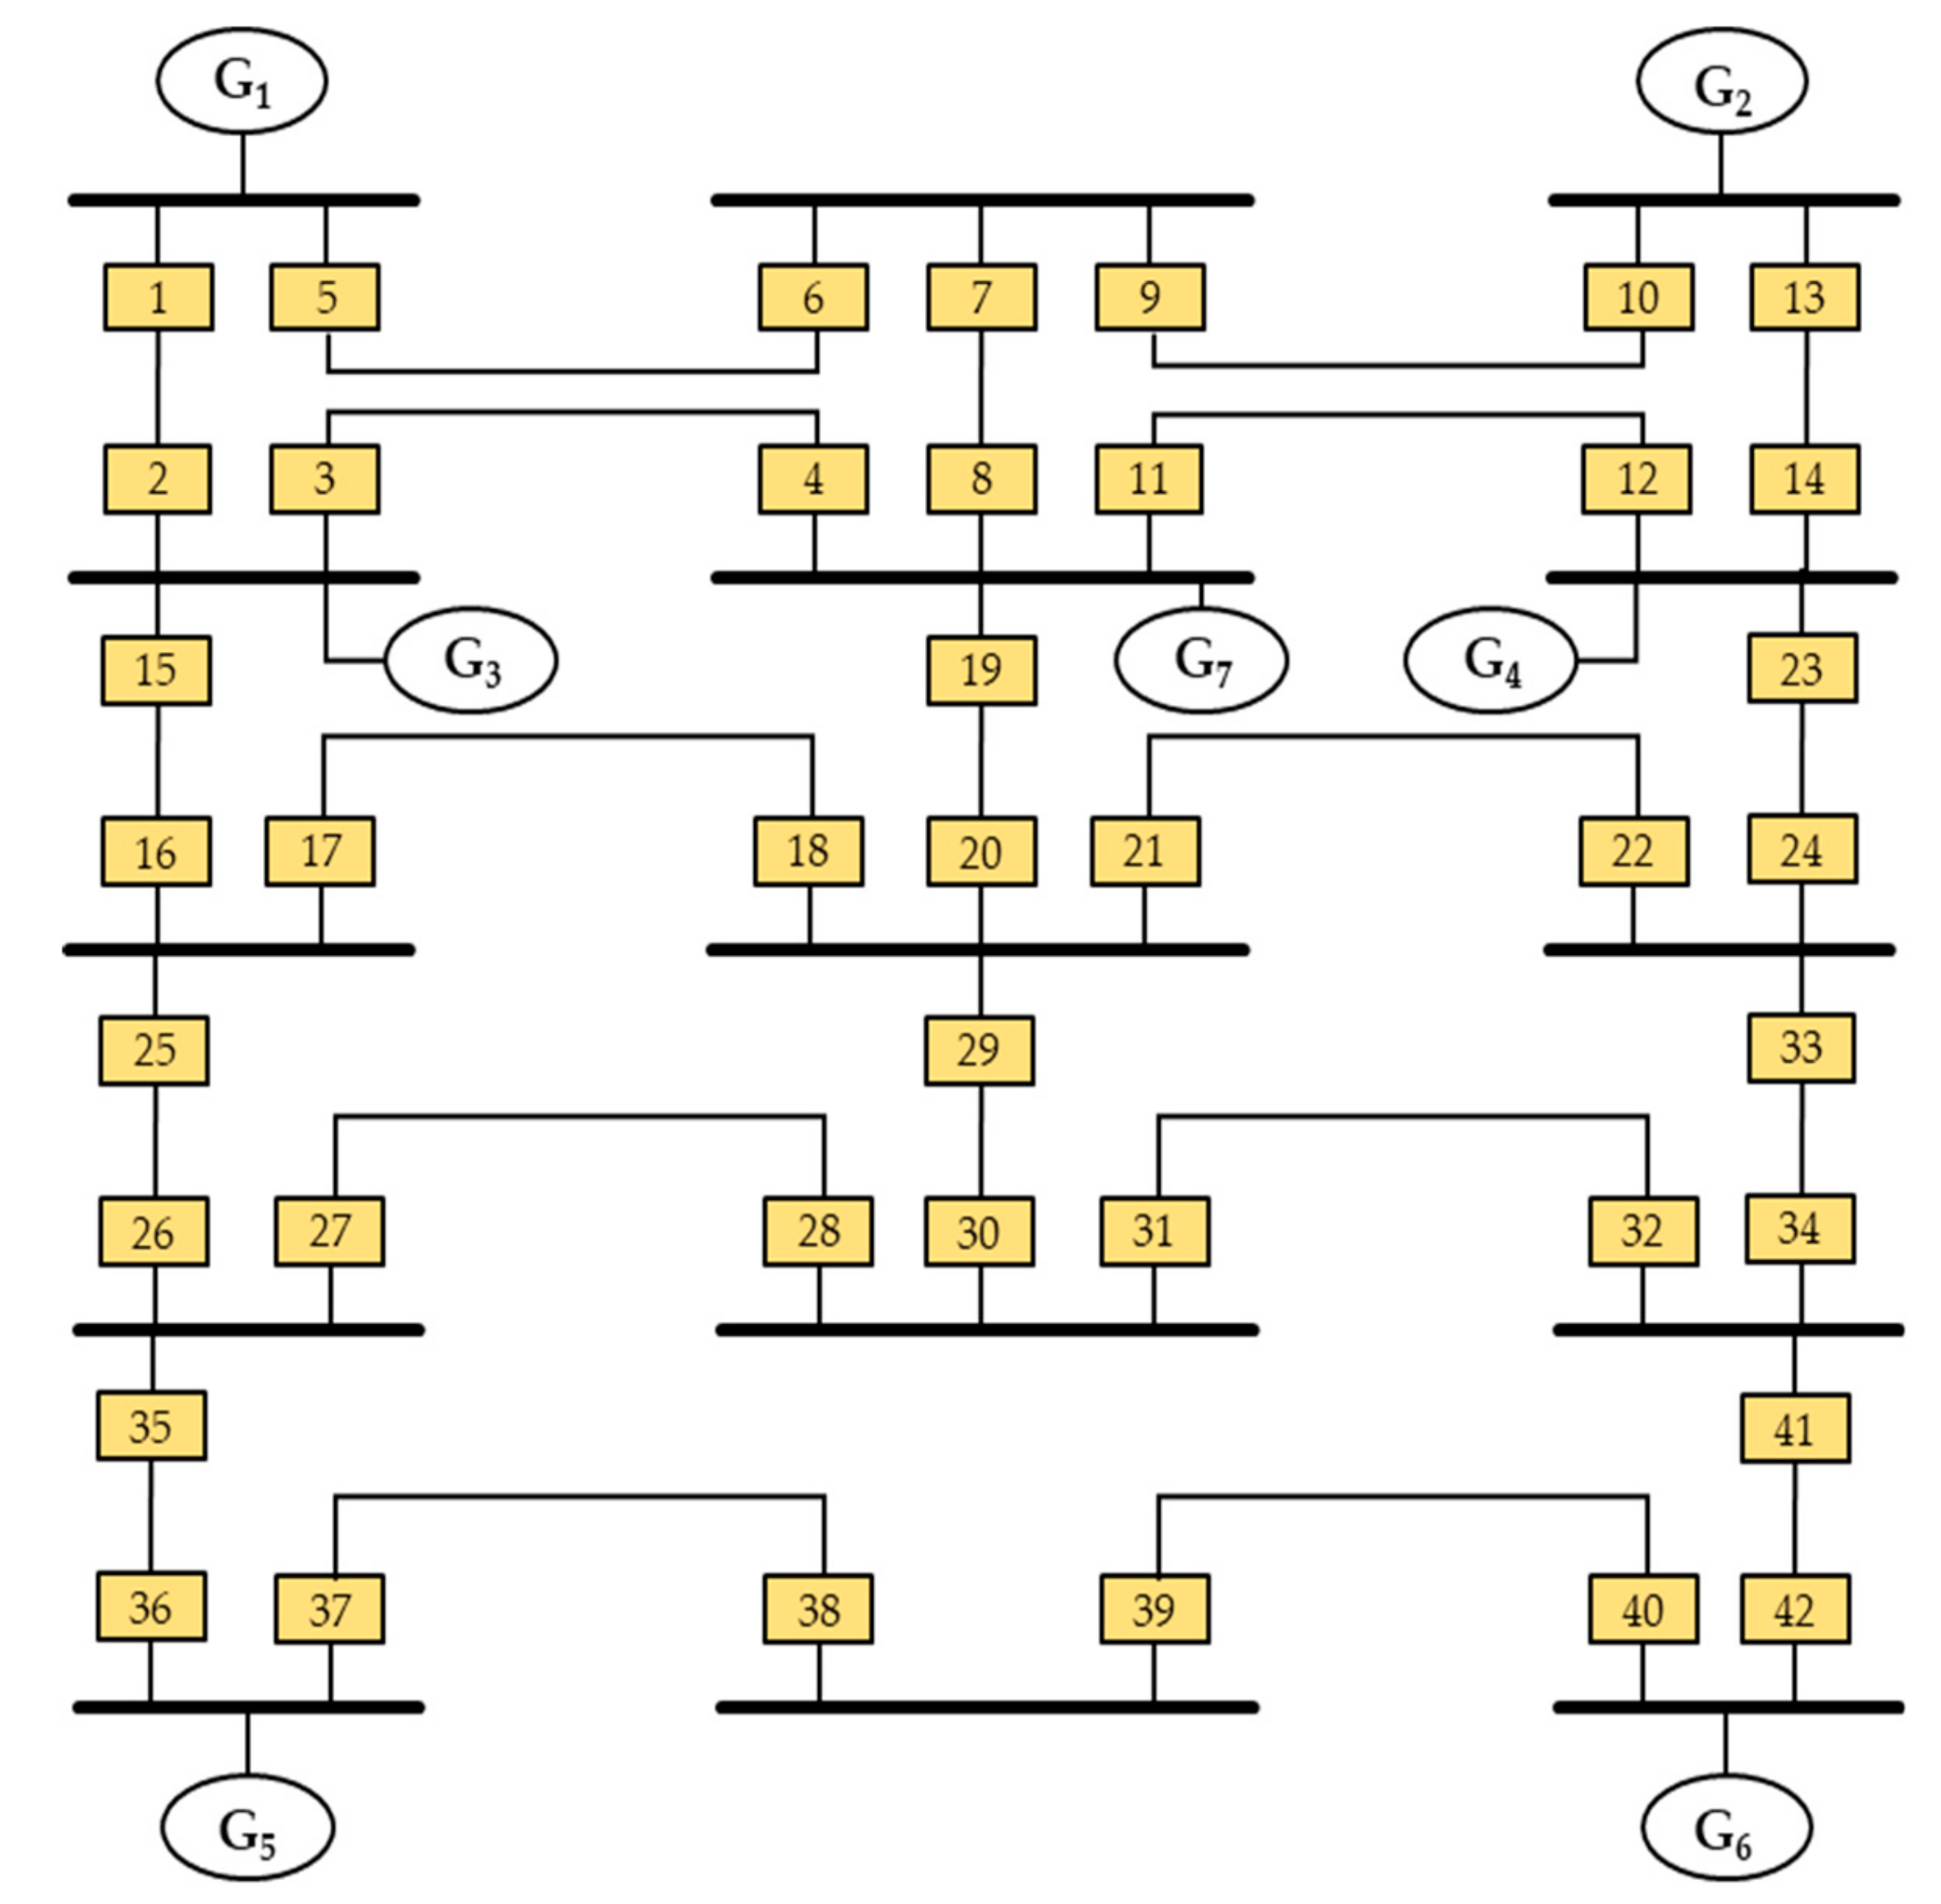
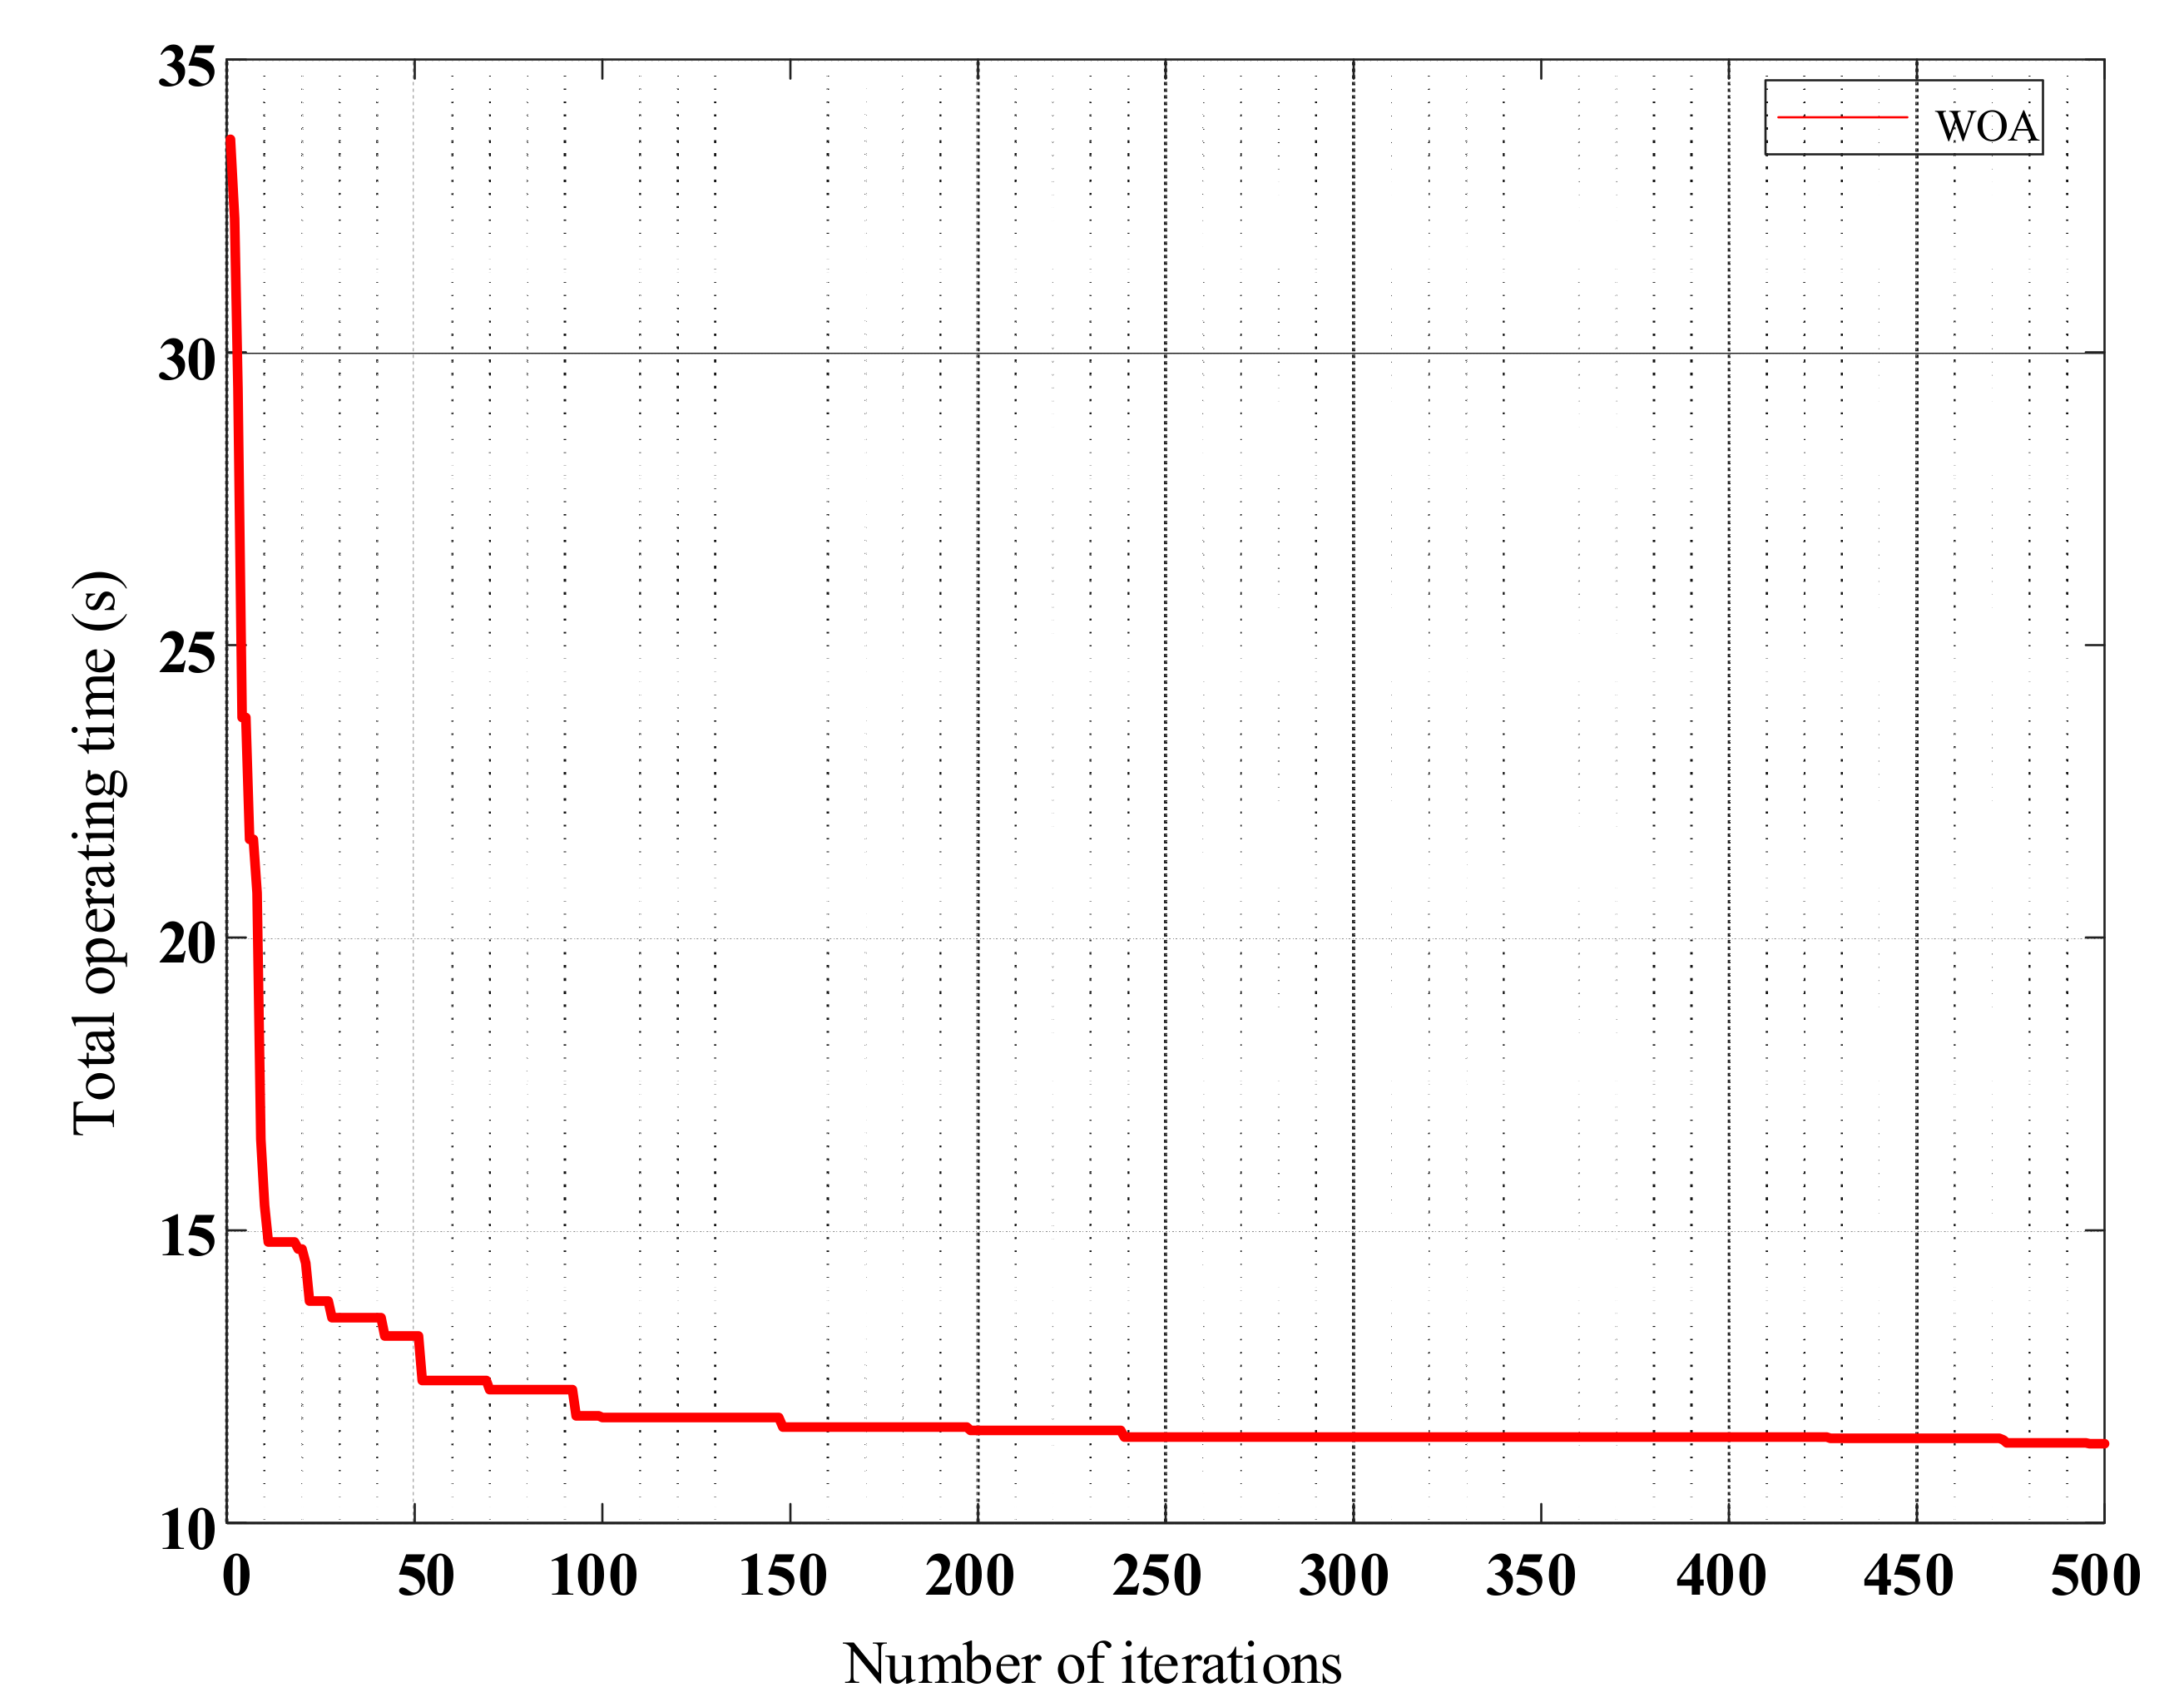
4.5. Case V: IEEE 30-Bus System
4.6. Case VI: Coordination Scheme Using Numerical Directional Relays
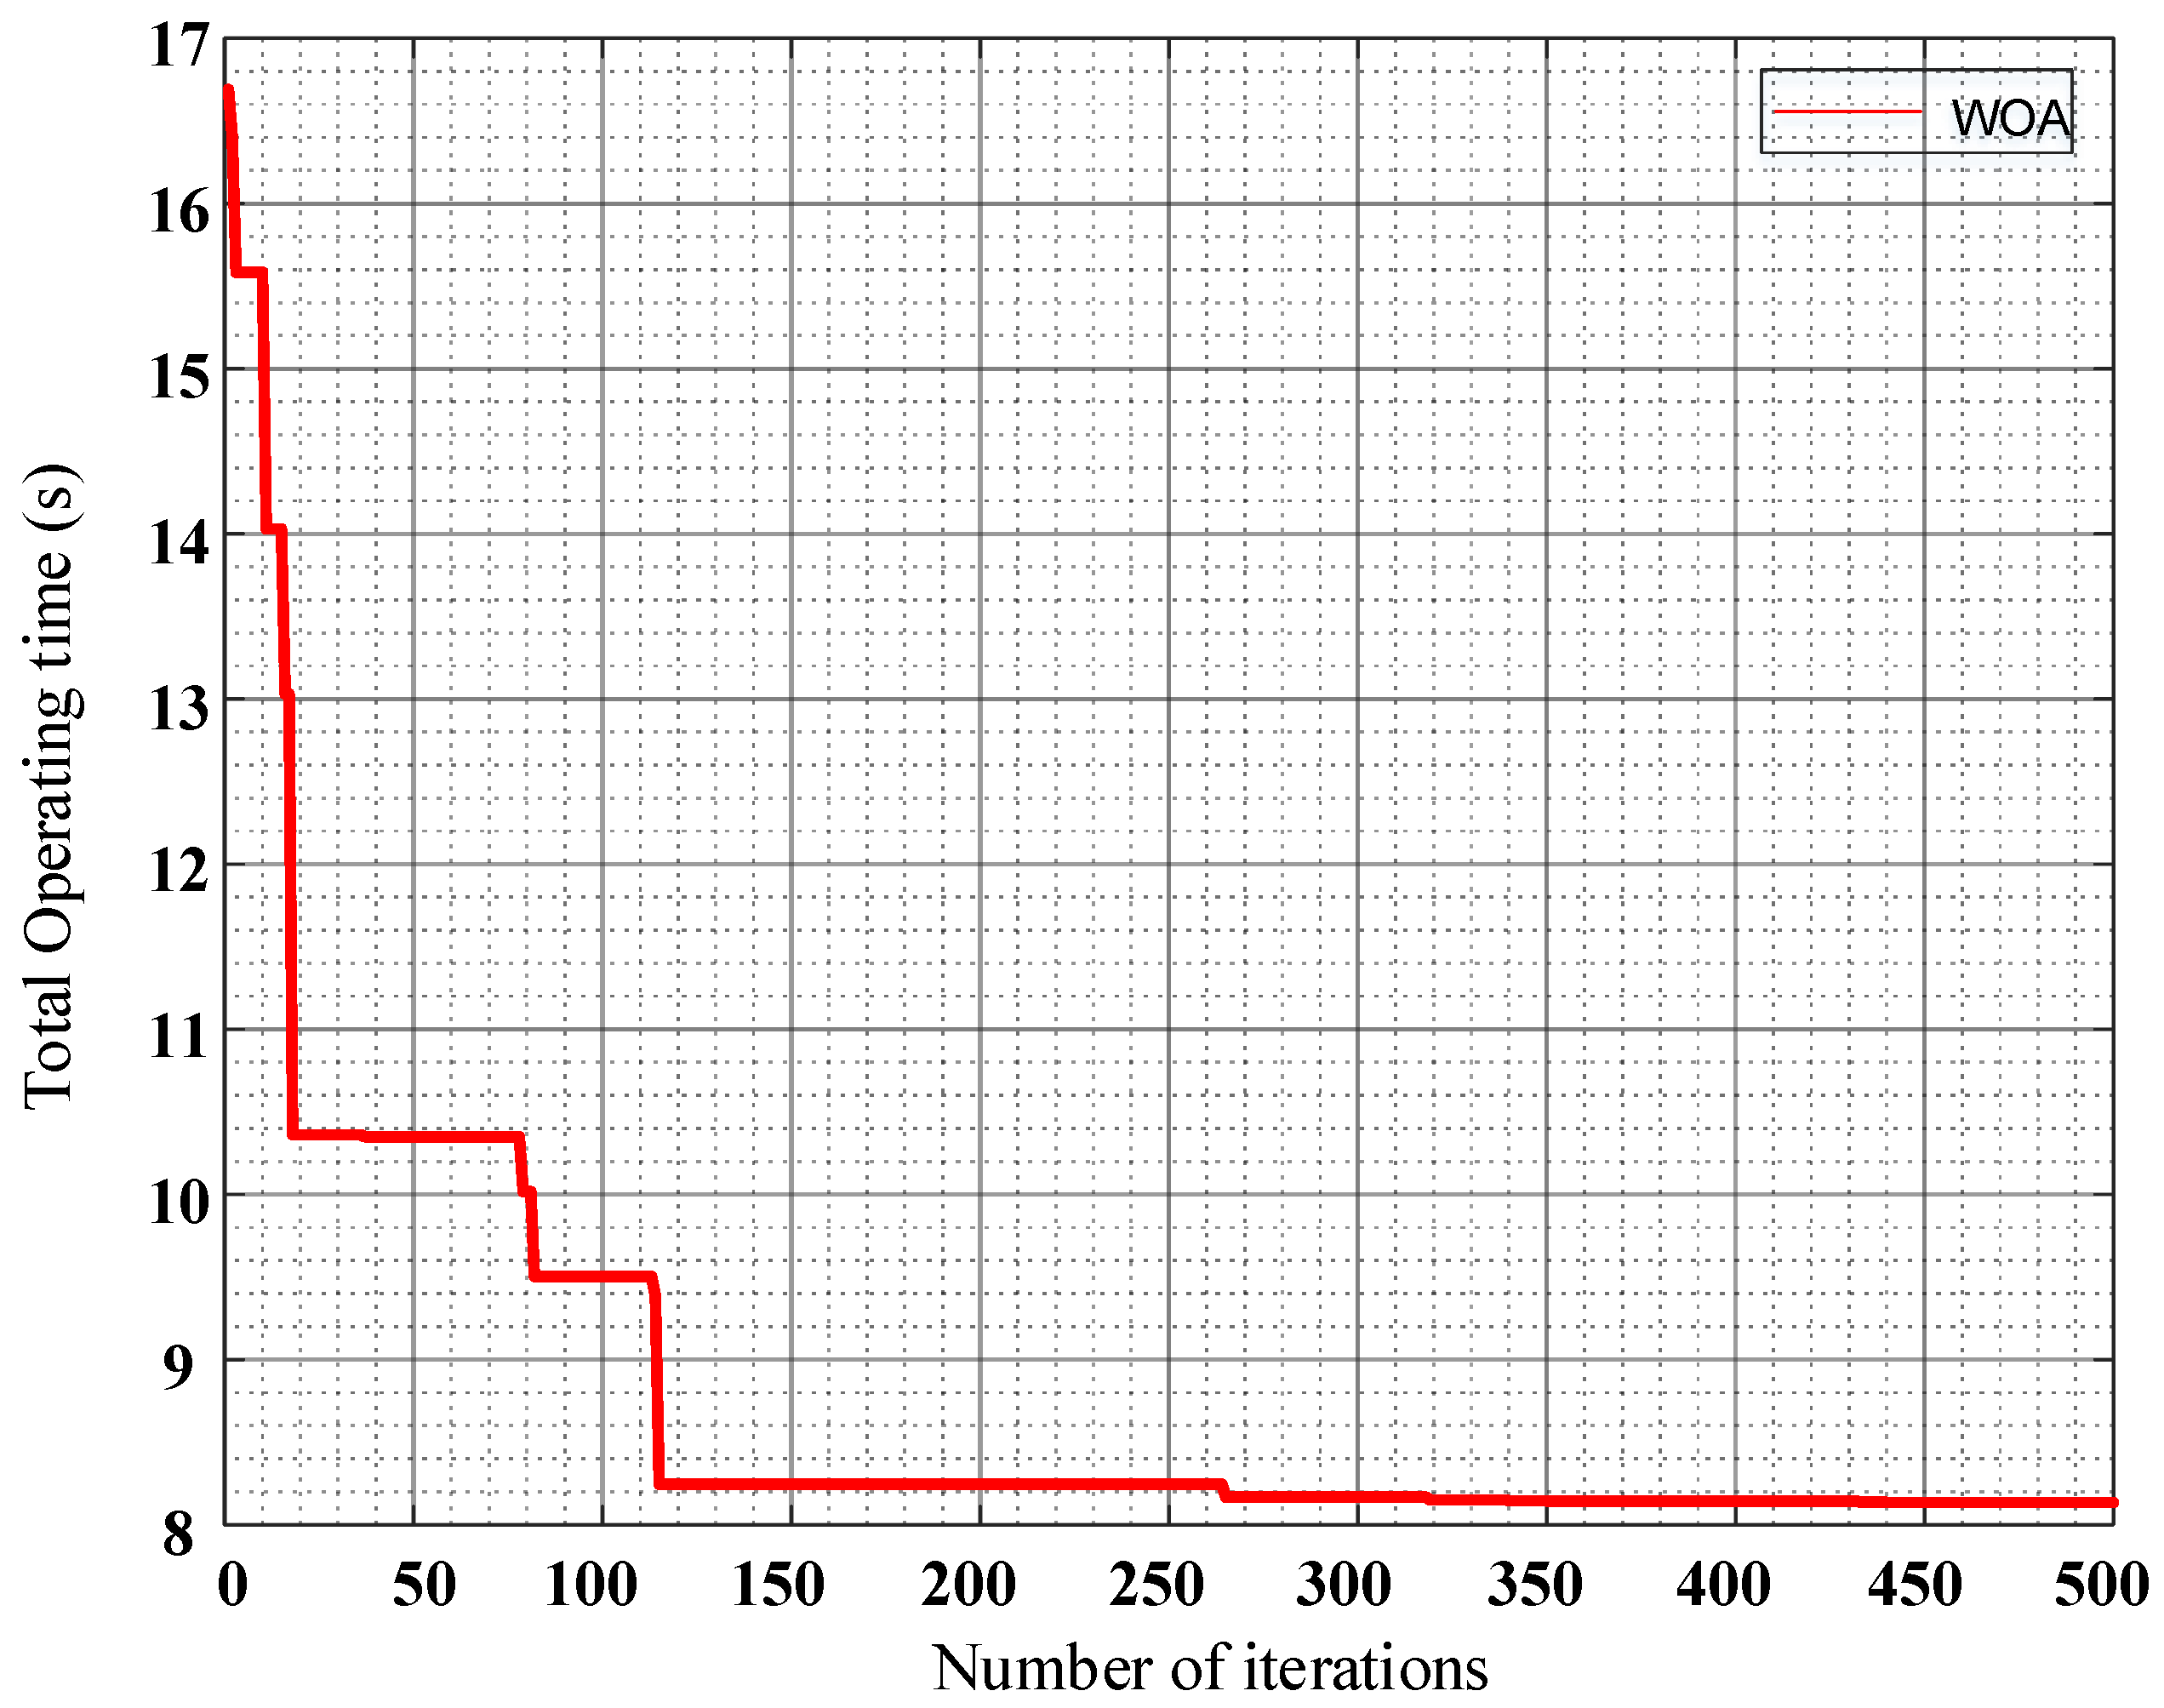
Application of WOA
5. Discussion
6. Conclusions
Author Contributions
Funding
Conflicts of Interest
Nomenclature
| OCR | Overcurrent relay |
| DOCR | Directional overcurrent relay |
| TDS | Time dial setting |
| Top | Total operating time |
| PSM | Plug setting multiplier |
| If | Fault current |
| Ip | Pickup current |
| CTR | Current transformer ratio |
| CTI | Coordination time interval |
| DG | Distributed generation |
| IDMT | Inverse definite minimum time |
| IEC | International electro-technical commission |
| IEEE | Institute of electrical and electronics engineers |
| NERC | Federal energy regulatory commission |
| PR | Primary relay |
| BR | Backup relay |
| Tb | Backup relay operating time |
| Tp | Primary relay operating time |
| LP | Linear programming |
| NLP | Non-linear programming |
| MILP | Mixed integer linear programming |
| MINLP | Mixed integer non-linear programming |
| MECPSO | Multiple embedded crossover PSO |
| FA | Firefly algorithm |
| GA | Genetic algorithm |
| HGA | Hybrid genetic algorithm |
| DE | Differential evaluation |
| MEFO | Modified electromagnetic field optimization |
| PSO | Particle swarm optimization |
| BBO | Biogeography based optimization |
| GWO | Grey wolf optimization |
| TLBO | Teaching learning based optimization |
| SA | Seeker algorithm |
| GSO | Group search optimization |
| AP | Analytic approach |
| BSA | Back tracking search algorithm |
| WOA | Whale optimization algorithm |
References
- Lu, Y.; Chung, J.-L. Detecting and solving the coordination curve intersection problem of overcurrent relays in subtransmission systems with a new method. Electr. Power Syst. Res. 2013, 95, 19–27. [Google Scholar] [CrossRef]
- Ezzeddine, M.; Kaczmarek, R.; Iftikhar, M. Coordination of directional overcurrent relays using a novel method to select their settings. IET Gener. Transm. Distrib. 2011, 5, 743–750. [Google Scholar] [CrossRef]
- Sharifian, H.; Abyaneh, H.A.; Salman, S.K.; Mohammadi, R.; Razavi, F. Determination of the minimum break point set using expert system and genetic algorithm. IEEE Trans. Power Deliv. 2010, 25, 1284–1295. [Google Scholar] [CrossRef]
- Birla, D.; Maheshwari, R.; Gupta, H. A New nonlinear directional overcurrent relay coordination technique, and banes and boons of near-end faults based approach. IEEE Trans. Power Deliv. 2006, 21, 1176–1182. [Google Scholar] [CrossRef]
- Damborg, M.; Ramaswami, R.; Venkata, S.; Postforoosh, J. Computer aided transmission protection system design part I: Alcorithms. IEEE Trans. Power Appar. Syst. 1984, 51–59. [Google Scholar] [CrossRef]
- Yu, J.T.; Kim, C.H.; Wadood, A.; Khurshiad, T.; Rhee, S. Self-adaptive multi-population JAYA algorithm with lévy flights for solving economic load dispatch problems. IEEE Access 2019, 7, 21372–21384. [Google Scholar] [CrossRef]
- Yu, J.; Kim, C.H.; Wadood, A.; Khurshiad, T.; Rhee, S.B. A novel multi-population based chaotic JAYA algorithm with application in solving economic load dispatch problems. Energies 2018, 11, 1946. [Google Scholar] [CrossRef]
- Gholami Farkoush, S.; Khurshaid, T.; Wadood, A.; Kim, C.H.; Kharal, K.H.; Kim, K.H.; Rhee, S.B. Investigation and optimization of grounding grid based on lightning response by using ATP-EMTP and genetic algorithm. Complexity 2018, 2018, 1–8. [Google Scholar] [CrossRef]
- Mousa, A.A.A. Hybrid ant optimization system for multiobjective economic emission load dispatch problem under fuzziness. Swarm Evol. Comput. 2014, 18, 11–21. [Google Scholar] [CrossRef]
- Camargo, M.P.; Rueda, J.L.; Erlich, I.; Añó, O. Comparison of emerging metaheuristic algorithms for optimal hydrothermal system operation. Swarm Evol. Comput. 2014, 18, 83–96. [Google Scholar] [CrossRef]
- Bhattacharya, S.K.; Goswami, S.K. Distribution network reconfiguration considering protection coordination constraints. Electr. Power Compon. Syst. 2008, 36, 1150–1165. [Google Scholar] [CrossRef]
- Abyaneh, H.; Al-Dabbagh, M.; Karegar, H.; Sadeghi, S.; Khan, R. A new optimal approach for coordination of overcurrent relays in interconnected power systems. IEEE Trans. Power Deliv. 2003, 18, 430–435. [Google Scholar] [CrossRef]
- Bedekar, P.P.; Bhide, S.R. Optimum coordination of directional overcurrent relays using the hybrid GA-NLP approach. IEEE Trans. Power Deliv. 2010, 26, 109–119. [Google Scholar] [CrossRef]
- Noghabi, A.S.; Sadeh, J.; Mashhadi, H.R. Considering different network topologies in optimal overcurrent relay coordination using a hybrid GA. IEEE Trans. Power Deliv. 2009, 24, 1857–1863. [Google Scholar] [CrossRef]
- US Federal Energy Regulatory Commission. Mandatory Reliability Standards for the Bulk-Power 718 System; Docket no. RM06-16-000; Order no. Order 693: 72; US Federal Energy Regulatory Commission: Washington, DC, USA, 2007. [Google Scholar]
- Zhang, H.; Heydt, G.T.; Vittal, V.; Quintero, J. An improved network model for transmission expansion planning considering reactive power and network losses. IEEE Trans. Power Syst. 2013, 28, 3471–3479. [Google Scholar] [CrossRef]
- Khanabadi, M.; Ghasemi, H.; Doostizadeh, M. Optimal transmission switching considering voltage security and N-1 contingency analysis. IEEE Trans. Power Syst. 2012, 28, 542–550. [Google Scholar] [CrossRef]
- Urdaneta, A.; Perez, L.; Restrepo, H. Optimal coordination of directional overcurrent relays considering dynamic changes in the network topology. IEEE Trans. Power Deliv. 1997, 12, 1458–1464. [Google Scholar] [CrossRef]
- Noghabi, A.S.; Mashhadi, H.R.; Sadeh, J. Optimal coordination of directional overcurrent relays considering different network topologies using interval linear programming. IEEE Trans. Power Deliv. 2010, 25, 1348–1354. [Google Scholar] [CrossRef]
- Zeineldin, H.H.; Mohamed, Y.A.-R.I.; Khadkikar, V.; Pandi, V.R. A protection coordination index for evaluating distributed generation impacts on protection for meshed distribution systems. IEEE Trans. Smart Grid 2013, 4, 1523–1532. [Google Scholar] [CrossRef]
- Najy, W.K.; Zeineldin, H.H.; Woon, W.L. Optimal protection coordination for microgrids with grid-connected and islanded capability. IEEE Trans. Ind. Electron. 2012, 60, 1668–1677. [Google Scholar] [CrossRef]
- Saleh, K.A.; Zeineldin, H.H.; El-Saadany, E.F. Optimal protection coordination for microgrids considering N $−$1 contingency. IEEE Trans. Ind. Informatics 2017, 13, 2270–2278. [Google Scholar] [CrossRef]
- Saleh, K.A.; Zeineldin, H.H.; Al-Hinai, A.; El-Saadany, E.F. Optimal coordination of directional overcurrent relays using a new time-current-voltage characteristic. IEEE Trans. Power Syst. 2014, 30, 537–544. [Google Scholar] [CrossRef]
- Saleh, K.A.; El-Saadany, E.F.; Al-Hinai, A.; Zeineldin, H.H. Dual-setting characteristic for directional overcurrent relays considering multiple fault locations. IET Gener. Transm. Distrib. 2015, 9, 1332–1340. [Google Scholar] [CrossRef]
- Saleh, K.A.; El Moursi, M.S.; Zeineldin, H.H. A New protection scheme considering fault ride through requirements for transmission level interconnected wind parks. IEEE Trans. Ind. Inform. 2015, 11, 1324–1333. [Google Scholar] [CrossRef]
- Zeineldin, H.H.; El-Saadany, E.F.; Salama, M.M.A. Optimal coordination of overcurrent relays using a modified particle swarm optimization. Electr. Power Syst. Res. 2006, 76, 988–995. [Google Scholar] [CrossRef]
- Zeienldin, H.; El-Saadany, E.F.; Salama, M.A. A novel problem formulation for directional overcurrent relay coordination. In Proceedings of the Large Engineering Systems Conference on Power Engineering (IEEE Cat. No. 04EX819), Halifax, NS, Canada, 28–30 July 2004; pp. 48–52. [Google Scholar]
- Amraee, T. Coordination of directional overcurrent relays using seeker algorithm. IEEE Trans. Power Deliv. 2012, 27, 1415–1422. [Google Scholar] [CrossRef]
- Urdaneta, A.; Nadira, R.; Jimenez, L.P. Optimal coordination of directional overcurrent relays in interconnected power systems. IEEE Trans. Power Deliv. 1988, 3, 903–911. [Google Scholar] [CrossRef]
- Wadood, A.; Farkoush, S.G.; Khurshaid, T.; Kim, C.-H.; Yu, J.; Geem, Z.W.; Rhee, S.-B. An optimized protection coordination scheme for the optimal coordination of overcurrent relays using a nature-inspired root tree algorithm. Appl. Sci. 2018, 8, 1664. [Google Scholar] [CrossRef]
- Wadood, A.; Khurshaid, T.; Farkoush, S.G.; Kim, C.H.; Rhee, S.B. A bio-inspired rooted tree algorithm for optimal coordination of overcurrent relays. In International Conference on Intelligent Technologies and Applications; Springer: Singapore, 2018; pp. 188–201. [Google Scholar]
- Wadood, A.; Kim, C.-H.; Khurshiad, T.; Farkoush, S.G.; Rhee, S.-B. Application of a continuous particle swarm optimization (CPSO) for the optimal coordination of overcurrent relays considering a penalty method. Energies 2018, 11, 869. [Google Scholar] [CrossRef]
- Khurshaid, T.; Wadood, A.; Farkoush, S.G.; Kim, C.-H.; Cho, N.; Rhee, S.-B. Modified particle swarm optimizer as optimization of time dial settings for coordination of directional overcurrent relay. J. Electr. Eng. Technol. 2019, 14, 55–68. [Google Scholar] [CrossRef]
- Mansour, M.M.; Mekhamer, S.F.; El-Kharbawe, N. A modified particle swarm optimizer for the coordination of directional overcurrent relays. IEEE Trans. Power Deliv. 2007, 22, 1400–1410. [Google Scholar] [CrossRef]
- Baghaee, H.R.; Mirsalim, M.; Gharehpetian, G.B.; Talebi, H.A.; Aghamirsalim, M. MOPSO/FDMT-based pareto-optimal solution for coordination of overcurrent relays in interconnected networks and multi-DER microgrids. IET Gener. Transm. Distrib. 2018, 12, 2871–2886. [Google Scholar] [CrossRef]
- Darabi, A.; Bagheri, M.; Gharehpetian, G.B. Highly accurate directional overcurrent coordination via combination of Rosen’s gradient projection–complex method with GA-PSO algorithm. IEEE Syst. J. 2019, 1–12. [Google Scholar] [CrossRef]
- Thangaraj, R.; Pant, M.; Deep, K. Optimal coordination of over-current relays using modified differential evolution algorithms. Eng. Appl. Artif. Intell. 2010, 23, 820–829. [Google Scholar] [CrossRef]
- Kim, C.H.; Khurshaid, T.; Wadood, A.; Farkoush, S.G.; Rhee, S.B. Gray wolf optimizer for the optimal coordination of directional overcurrent relay. J. Electr. Eng. Technol. 2018, 13, 1043–1051. [Google Scholar]
- Singh, M.; Panigrahi, B.; Abhyankar, A. Optimal coordination of directional over-current relays using teaching learning-based optimization (TLBO) algorithm. Int. J. Electr. Power Energy Syst. 2013, 50, 33–41. [Google Scholar] [CrossRef]
- Albasri, F.A.; Alroomi, A.R.; Talaq, J.H. Optimal Coordination of directional overcurrent relays using biogeography-based optimization algorithm. IEEE Trans. Power Deliv. 2015, 30, 1810–1820. [Google Scholar] [CrossRef]
- El-Hana Bouchekara, H.R.; Zellagui, M.; Abido, M.A. Coordination of directional overcurret relays using the backtracking search algorithm. J. Electr. Syst. 2016, 12, 387–405. [Google Scholar]
- Damchi, Y.; Dolatabadi, M.; Mashhadi, H.R.; Sadeh, J. MILP approach for optimal coordination of directional overcurrent relays in interconnected power systems. Electr. Power Syst. Res. 2018, 158, 267–274. [Google Scholar] [CrossRef]
- Sulaiman, M.; Waseem; Muhammad, S.; Khan, A. Improved Solutions for the optimal coordination of DOCRs using firefly algorithm. Complexity 2018, 2018, 1–15. [Google Scholar]
- Bouchekara, H.; Zellagui, M.; Abido, M.; Bouchekara, H.R.E.-H. Optimal coordination of directional overcurrent relays using a modified electromagnetic field optimization algorithm. Appl. Soft Comput. 2017, 54, 267–283. [Google Scholar] [CrossRef]
- Kalage, A.A.; Ghawghawe, N.D. Optimum coordination of directional overcurrent relays using modified adaptive teaching learning based optimization algorithm. Intell. Ind. Syst. 2016, 2, 55–71. [Google Scholar] [CrossRef]
- Mahari, A.; Seyedi, H. An analytic approach for optimal coordination of overcurrent relays. IET Gener. Transm. Distrib. 2013, 7, 674–680. [Google Scholar] [CrossRef]
- Alipour, M.; Teimourzadeh, S.; Seyedi, H. Improved group search optimization algorithm for coordination of directional overcurrent relays. Swarm Evol. Comput. 2015, 23, 40–49. [Google Scholar] [CrossRef]
- Alam, M.N.; Das, B.; Pant, V. A comparative study of metaheuristic optimization approaches for directional overcurrent relays coordination. Electr. Power Syst. Res. 2015, 128, 39–52. [Google Scholar] [CrossRef]
- Farzinfar, M.; Jazaeri, M.; Razavi, F. A new approach for optimal coordination of distance and directional over-current relays using multiple embedded crossover PSO. Int. J. Electr. Power Energy Syst. 2014, 61, 620–628. [Google Scholar] [CrossRef]
- Mirjalili, S.; Lewis, A. The whale optimization algorithm. advances in engineering software. Neurocomputing 2016, 95, 51–67. [Google Scholar]
- Mafarja, M.M.; Mirjalili, S. Hybrid Whale Optimization algorithm with simulated annealing for feature selection. Neurocomputing 2017, 260, 302–312. [Google Scholar] [CrossRef]
- Mohammadi, R.; Abyaneh, H.A.; Rudsari, H.M.; Fathi, S.H.; Rastegar, H. Overcurrent relays coordination considering the priority of constraints. IEEE Trans. Power Deliv. 2011, 26, 1927–1938. [Google Scholar] [CrossRef]
- Alam, M.N. Adaptive protection coordination scheme using numerical directional overcurrent relays. IEEE Trans. Ind. Informatics 2019, 15, 64–73. [Google Scholar] [CrossRef]
- Alam, M.N.; Das, B.; Pant, V. An interior point method based protection coordination scheme for directional overcurrent relays in meshed networks. Int. J. Electr. Power Energy Syst. 2016, 81, 153–164. [Google Scholar] [CrossRef]


| Relay No. | CTR | Pickup Tap |
|---|---|---|
| 1 | 300/5 | 5 |
| 2 | 200/5 | 1.5 |
| 3 | 200/5 | 5 |
| 4 | 300/5 | 4 |
| 5 | 200/5 | 2 |
| 6 | 400/5 | 2.5 |
| Relay No. | TDS | PS |
|---|---|---|
| 1 | 0.0500 | 1.2500 |
| 2 | 0.0500 | 1.2500 |
| 3 | 0.05553 | 1.3837 |
| 4 | 0.0500 | 1.2500 |
| 5 | 0.0710 | 2.4746 |
| 6 | 0.1587 | 2.2163 |
| Total Operating Time (s) | 1.5262 | |
| Method | Objective Function |
|---|---|
| TLBO (MOF) [39] | 6.972 |
| TLBO [39] | 5.3349 |
| MDE [37] | 4.7806 |
| Simplex method [29] | 1.9258 |
| MINLP [28] | 1.727 |
| Seeker algorithm [28] | 1.599 |
| PSO method [34] | 1.9258 |
| BB0-LP [40] | 1.59871 |
| GSO [47] | 1.4807 |
| Proposed algorithm | 1.5262 |
| Net Gain | ∑ ∆(t) (s) |
|---|---|
| WOA/TLBO (MOF) | 5.4458 |
| WOA/TLBO | 3.8087 |
| WOA/MDE | 3.2544 |
| FWOA/SM | 0.3996 |
| WOA/MINLP | 0.2008 |
| WOA/SA | 0.0728 |
| WOA/PSO | 0.3996 |
| WOA/BBO-LP | 0.07251 |
| Relay No. | CTR |
|---|---|
| 1 | 1200/5 |
| 2 | 1200/5 |
| 3 | 800/5 |
| 4 | 1200/5 |
| 5 | 1200/5 |
| 6 | 1200/5 |
| 7 | 800/5 |
| 8 | 1200/5 |
| 9 | 800/5 |
| 10 | 1200/5 |
| 11 | 1200/5 |
| 12 | 1200/5 |
| 13 | 1200/5 |
| 14 | 800/5 |
| Relay No. | TDS | PS |
|---|---|---|
| 1 | 0.1000 | 1.25 |
| 2 | 0.5929 | 1.3746 |
| 3 | 0.1007 | 1.2586 |
| 4 | 0.1000 | 1.25 |
| 5 | 0.3581 | 2.0638 |
| 6 | 0.2490 | 1.5745 |
| 7 | 0.1018 | 1.2726 |
| 8 | 0.3430 | 1.8559 |
| 9 | 0.1000 | 1.25 |
| 10 | 0.1000 | 1.25 |
| 11 | 0.1004 | 1.2548 |
| 12 | 0.1521 | 1.901 |
| 13 | 0.1000 | 1.25 |
| 14 | 0.1000 | 1.25 |
| Total operating time (s) | 5.9535 | |
| Method | Objective Function |
|---|---|
| SA [28] | 8.4270 |
| GA [14] | 11.001 |
| HGA-LP [14] | 10.9499 |
| NLP [2] | 6.4169 |
| LM [2] | 11.0645 |
| BBO-LP [40] | 8.75559 |
| MILP [42] | 8.0061 |
| FA [43] | 6.6463 |
| MEFO [44] | 6.349 |
| BSA [41] | 6.363 |
| Proposed algorithm | 5.9535 |
| Net Gain | ∑ ∆(t) (s) |
|---|---|
| WOA/SA | 2.4735 |
| WOA/GA | 5.0475 |
| WOA/HGA-LP | 4.9964 |
| WOA/NLP | 0.45819 |
| WOA/LP | 5.111 |
| WOA/BBO-LP | 2.8020 |
| WOA/FA | 0.6929 |
| WOA/MEFO | 0.3955 |
| WOA/BSA | 0.4095 |
| Relay No. | TDS | PS |
|---|---|---|
| 1 | 0.2316 | 2.4466 |
| 2 | 0.1001 | 1.5014 |
| 3 | 0.2377 | 2.4650 |
| 4 | 1.200 | 2.5000 |
| 5 | 0.1469 | 2.2553 |
| 6 | 0.7059 | 2.5000 |
| 7 | 0.1761 | 2.4542 |
| 8 | 0.5674 | 2.4224 |
| 9 | 1.2000 | 2.5000 |
| 10 | 0.2193 | 2.3922 |
| 11 | 0.6990 | 1.8076 |
| 12 | 0.1368 | 1.8399 |
| 13 | 0.1454 | 2.1276 |
| 14 | 0.1497 | 2.5000 |
| 15 | 0.1632 | 2.0901 |
| 16 | 1.1431 | 2.3815 |
| 17 | 0.2636 | 1.6991 |
| 18 | 0.14875 | 2.2135 |
| 19 | 0.12251 | 1.8376 |
| 20 | 0.18656 | 2.4963 |
| 21 | 0.51479 | 1.5402 |
| 22 | 0.17653 | 2.5000 |
| 23 | 1.2000 | 2.5000 |
| 24 | 0.1303 | 1.9311 |
| Total operating time (s) | 8.3849 | |
| Method | Objective Function |
|---|---|
| TLBO [45] | 82.9012 |
| IDE [45] | 59.6471 |
| MTALBO [45] | 41.9041 |
| GA [13] | 32.6058 |
| BBO [40] | 28.8348 |
| BH [44] | 25.884 |
| NPL [13] | 19.4041 |
| PSO [48] | 13.9742 |
| HS [44] | 9.838 |
| DE [48] | 8.6822 |
| Proposed algorithm | 8.3849 |
| Net Gain | ∑ ∆(t) (s) |
|---|---|
| WOA/TLBO | 74.5163 |
| WOA/IDE | 51.2622 |
| WOA/MTALBO | 33.5192 |
| WOA/GA | 24.2209 |
| WOA/BBO | 20.4499 |
| WOA/BH | 17.4991 |
| WOA/NPL | 11.0192 |
| WOA/PSO | 5.5893 |
| WOA/HS | 1.4531 |
| WOA/DE | 0.2973 |
| Relay No. | CT Ratio |
|---|---|
| 18-20-21-29 | 1600/5 |
| 2-4-8-11-12-14-15-23 | 1200/5 |
| 1-3-5-10-13-19-36-37-40-42 | 800/5 |
| 6-7-9-16-24-25-26-27-28-31-32-33-35 | 600/5 |
| 17-22-30-34-38-39-41 | 400/5 |
| Relay No. | WOA | Relay No. | WOA | ||
|---|---|---|---|---|---|
| TDS | PS | TDS | PS | ||
| 1 | 0.1000 | 0.5000 | 22 | 0.1039 | 0.5195 |
| 2 | 0.1030 | 0.5150 | 23 | 0.1010 | 0.5049 |
| 3 | 0.1078 | 0.5393 | 24 | 0.1000 | 0.5000 |
| 4 | 0.1000 | 0.5000 | 25 | 0.1139 | 0.5695 |
| 5 | 0.1041 | 0.5206 | 26 | 0.1101 | 0.5504 |
| 6 | 0.1240 | 0.6201 | 27 | 1.0414 | 2.3668 |
| 7 | 0.1000 | 0.5003 | 28 | 0.3260 | 1.1297 |
| 8 | 0.1000 | 0.5000 | 29 | 0.2249 | 0.7461 |
| 9 | 0.1455 | 0.7275 | 30 | 0.1000 | 0.5000 |
| 10 | 0.1078 | 0.5392 | 31 | 0.1483 | 0.5000 |
| 11 | 0.1020 | 0.5103 | 32 | 0.1056 | 0.5280 |
| 12 | 0.1000 | 0.5000 | 33 | 0.1487 | 0.7438 |
| 13 | 0.1070 | 0.5350 | 34 | 0.2123 | 0.5689 |
| 14 | 1.1000 | 2.5000 | 35 | 0.1152 | 0.5759 |
| 15 | 0.1000 | 0.5000 | 36 | 0.7140 | 1.6790 |
| 16 | 0.1148 | 0.5742 | 37 | 0.1245 | 0.6229 |
| 17 | 0.1015 | 0.5077 | 38 | 0.1066 | 1.1121 |
| 18 | 0.4930 | 1.4766 | 39 | 0.4113 | 0.9377 |
| 19 | 0.1539 | 0.7699 | 40 | 0.1515 | 0.7576 |
| 20 | 0.2644 | 0.9671 | 41 | 0.4033 | 0.9166 |
| 21 | 0.1557 | 0.7785 | 42 | 0.1105 | 0.5195 |
| (s) | 11.2670 | ||||
| Method | Objective Function |
|---|---|
| MTLBO [45] | 52.5039 |
| SA [28] | 12.227 |
| MINLP [28] | 15.335 |
| AP [46] | 11.6542 |
| GSO [47] | 13.6542 |
| IGSO [47] | 12.135 |
| DE [48] | 11.7591 |
| HS [48] | 12.6225 |
| MEFO [44] | 13.953 |
| BSA [41] | 16.293 |
| Proposed algorithm | 11.2670 |
| Net Gain | ∑ ∆(t) (s) |
|---|---|
| WOA/TLBO | 41.2369 |
| WOA/SA | 0.96 |
| WOA/MINPL | 4.068 |
| WOA/AP | 0.3872 |
| WOA/GSO | 2.3872 |
| WOA/IGSO | 0.868 |
| WOA/DE | 0.4921 |
| WOA/HS | 1.3555 |
| WOA/MEFO | 2.686 |
| WOA/BSA | 5.026 |
| Fault Zone | Primary Relay | Primary Relay |
|---|---|---|
| L 1 | 1 | 4, 18, 20 |
| 2 | 6 | |
| L2 | 3 | 2, 18, 20 |
| 4 | 5, 8 | |
| L 3 | 5 | 1 |
| 6 | 3, 8 | |
| L 4 | 7 | 3, 5 |
| 8 | 10, 36 | |
| L 5 | 9 | 7, 36 |
| 10 | 12 | |
| L 6 | 11 | 9 |
| 12 | - | |
| L 7 | 13 | 11 |
| 14 | 15 | |
| L 8 | 15 | 11 |
| 16 | 13 | |
| L 9 | 17 | 2, 4, 20 |
| 18 | 24 | |
| L 10 | 19 | 2, 4, 18 |
| 20 | 22 | |
| L 11 | 21 | 19 |
| 22 | 26 | |
| L 12 | 23 | 17 |
| 24 | 28 | |
| L 13 | 25 | 21 |
| 26 | 30 | |
| L 14 | 27 | 23 |
| 28 | 32, 34 | |
| L 15 | 29 | 25 |
| 30 | 31, 33, 38 | |
| L 16 | 31 | 27, 34 |
| 32 | 29, 33, 38 | |
| L 17 | 33 | 27, 32 |
| 34 | 37 | |
| L 18 | 35 | 29, 31, 38 |
| 36 | 7, 10 | |
| L 19 | 37 | 37 |
| 38 | 29, 31, 33 | |
| L 20 | 39 | 35 |
| - | - |
| Relay No. | TDS | PS |
|---|---|---|
| 1 | 0.1131 | 1.6958 |
| 2 | 0.1000 | 1.5000 |
| 3 | 0.1007 | 1.5109 |
| 4 | 0.1007 | 1.5111 |
| 5 | 0.1000 | 1.5000 |
| 6 | 0.9236 | 2.4761 |
| 7 | 0.1000 | 1.5005 |
| 8 | 0.1000 | 1.5000 |
| 9 | 0.1001 | 1.5029 |
| 10 | 0.1002 | 1.5042 |
| 11 | 0.1076 | 1.6149 |
| 12 | 0.1000 | 1.5000 |
| 13 | 0.1074 | 1.6118 |
| 14 | 1.0933 | 2.4849 |
| 15 | 0.6461 | 2.3447 |
| 16 | 0.8541 | 1.9412 |
| 17 | 0.2737 | 1.7453 |
| 18 | 0.6984 | 2.1623 |
| 19 | 0.1046 | 1.5824 |
| 20 | 0.2328 | 2.4762 |
| 21 | 0.1672 | 2.3334 |
| 22 | 0.1118 | 1.6782 |
| 23 | 0.1003 | 1.5000 |
| 24 | 0.1000 | 1.5000 |
| 25 | 0.1013 | 1.5205 |
| 26 | 0.1757 | 2.3145 |
| 27 | 0.1037 | 1.5555 |
| 28 | 0.2170 | 2.3228 |
| 29 | 0.1990 | 2.1887 |
| 30 | 0.2856 | 2.5000 |
| 31 | 0.3598 | 2.0241 |
| 32 | 0.1049 | 1.5747 |
| 33 | 0.1522 | 2.1039 |
| 34 | 0.1000 | 1.5006 |
| 35 | 0.2242 | 2.4661 |
| 36 | 0.1271 | 1.9075 |
| 37 | 0.1727 | 2.4772 |
| 38 | 0.2007 | 1.7111 |
| 39 | 0.1002 | 1.5035 |
| Total operating time (s) | 15.7139 | |
| Method | Objective Function |
|---|---|
| GA [48] | 28.0195 |
| PSO [48] | 39.1836 |
| DE [48] | 17.8122 |
| HS [48] | 19.2133 |
| SOA [48] | 33.7734 |
| Proposed Algorithm | 15.7139 |
| Net Gain | ∑ ∆(t) (s) |
|---|---|
| WOA/GA | 12.3056 |
| WOA/PSO | 23.4697 |
| WOA/DE | 2.0983 |
| WOA/HS | 3.4994 |
| WOA/SOA | 18.0595 |
| CT Ratio | Relay No. | CT Ratio | Relay No. |
|---|---|---|---|
| 8000/5 | 1 | 1000/5 | 20, 35, 38 |
| 5000/5 | 29 | 800/5 | 16,18 |
| 4000/5 | 5, 25 | 600/5 | 22, 32, 37, 40 |
| 3500/5 | 3, 14 | 500/5 | 17, 26, 34 |
| 3000/5 | 21 | 400/5 | 2, 4, 8, 10, 13, 24 |
| 2500/5 | 7 | 250/5 | 11 |
| 2000/5 | 12,36,39 | 200/5 | 6 |
| 1600/5 | 9, 19, 23, 27, 31 | 50/5 | 28 |
| 1200/5 | 15, 30, 33 | - | - |
| Relay No. | TDS | PS |
|---|---|---|
| 1 | 0.1000 | 0.5000 |
| 2 | 0.1000 | 0.5000 |
| 3 | 1.0227 | 1.9967 |
| 4 | 0.1000 | 0.5000 |
| 5 | 1.1000 | 2.0000 |
| 6 | 1.0703 | 1.9461 |
| 7 | 0.1000 | 0.5000 |
| 8 | 0.1010 | 0.5048 |
| 9 | 0.1316 | 0.6582 |
| 10 | 0.2419 | 1.1192 |
| 11 | 0.1097 | 0.5486 |
| 12 | 0.1154 | 0.5773 |
| 13 | 0.1000 | 0.5000 |
| 14 | 1.0968 | 1.9941 |
| 15 | 0.1146 | 0.5731 |
| 16 | 0.1107 | 0.5539 |
| 17 | 0.1000 | 0.5001 |
| 18 | 0.5058 | 1.9887 |
| 19 | 1.0551 | 1.9185 |
| 20 | 0.1145 | 0.5727 |
| 21 | 0.2439 | 1.2169 |
| 22 | 0.1379 | 0.6897 |
| 23 | 0.2896 | 0.5218 |
| 24 | 0.2923 | 1.4617 |
| 25 | 0.3049 | 1.7079 |
| 26 | 1.1000 | 2.0000 |
| 27 | 0.1014 | 0.5071 |
| 28 | 0.1021 | 0.5108 |
| 29 | 0.1000 | 0.5000 |
| 30 | 0.8158 | 1.9280 |
| 31 | 1.0175 | 1.9850 |
| 32 | 1.0721 | 1.9508 |
| 33 | 0.1278 | 0.6390 |
| 34 | 0.1264 | 0.6324 |
| 35 | 0.1620 | 0.8101 |
| 36 | 1.0557 | 1.9810 |
| 37 | 0.1710 | 0.8283 |
| 38 | 0.2721 | 0.5000 |
| 39 | 0.9686 | 1.7611 |
| 40 | 0.13037 | 0.6518 |
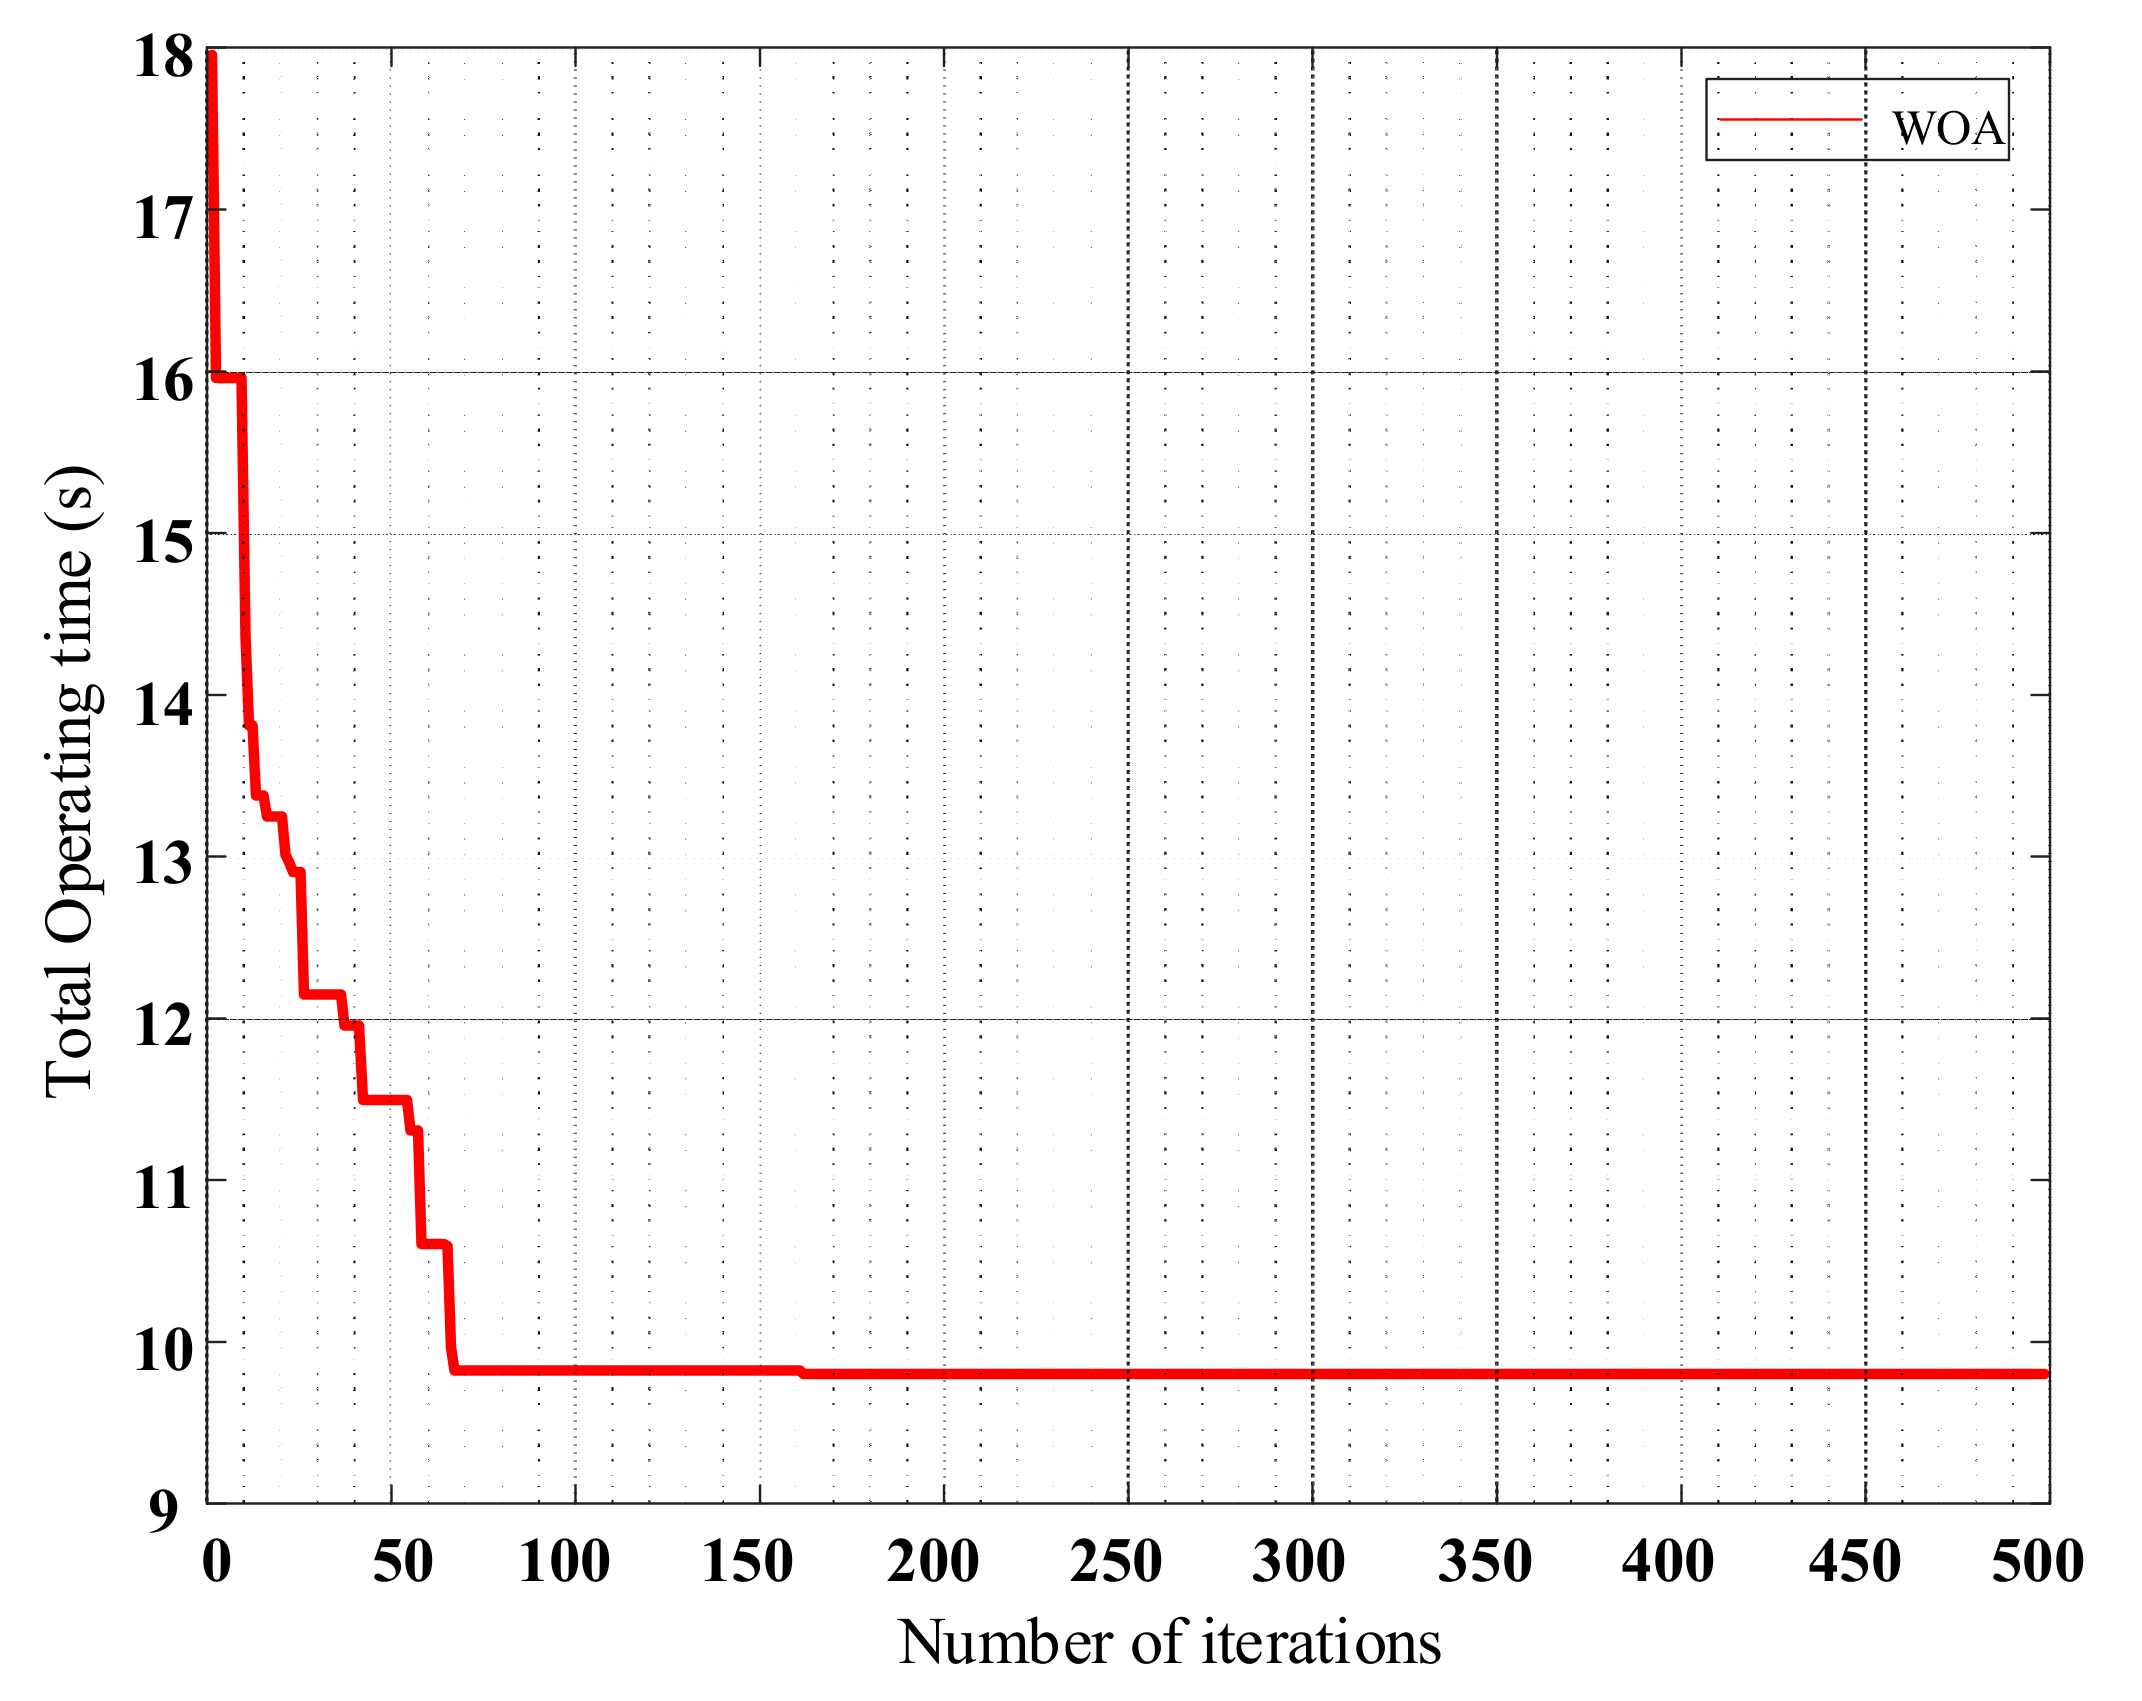
| Total operating time (s) | 9.9105 | |
| Method | Objective Function |
|---|---|
| HGA-LP [42] | 13.4914 |
| MILP [42] | 13.1411 |
| MECPSO [49] | 12.919 |
| MAPSO [49] | 14.126 |
| Proposed Algorithm | 9.9105 |
| Net Gain | ∑ ∆(t) (s) |
|---|---|
| WOA/HGA-LP | 3.5812 |
| WOA/MILP | 3.2306 |
| WOA/MECPSO | 3.0085 |
| WOA/MAPSO | 4.2155 |
© 2019 by the authors. Licensee MDPI, Basel, Switzerland. This article is an open access article distributed under the terms and conditions of the Creative Commons Attribution (CC BY) license (http://creativecommons.org/licenses/by/4.0/).
Share and Cite
Wadood, A.; Khurshaid, T.; Farkoush, S.G.; Yu, J.; Kim, C.-H.; Rhee, S.-B. Nature-Inspired Whale Optimization Algorithm for Optimal Coordination of Directional Overcurrent Relays in Power Systems. Energies 2019, 12, 2297. https://doi.org/10.3390/en12122297
Wadood A, Khurshaid T, Farkoush SG, Yu J, Kim C-H, Rhee S-B. Nature-Inspired Whale Optimization Algorithm for Optimal Coordination of Directional Overcurrent Relays in Power Systems. Energies. 2019; 12(12):2297. https://doi.org/10.3390/en12122297
Chicago/Turabian StyleWadood, Abdul, Tahir Khurshaid, Saeid Gholami Farkoush, Jiangtao Yu, Chang-Hwan Kim, and Sang-Bong Rhee. 2019. "Nature-Inspired Whale Optimization Algorithm for Optimal Coordination of Directional Overcurrent Relays in Power Systems" Energies 12, no. 12: 2297. https://doi.org/10.3390/en12122297
APA StyleWadood, A., Khurshaid, T., Farkoush, S. G., Yu, J., Kim, C.-H., & Rhee, S.-B. (2019). Nature-Inspired Whale Optimization Algorithm for Optimal Coordination of Directional Overcurrent Relays in Power Systems. Energies, 12(12), 2297. https://doi.org/10.3390/en12122297