Article

A Forecast Model for the Level of Engineering Maturity Impact on Contractor’s Procurement and Construction Costs for Offshore EPC Megaprojects

1
Hyundai Heavy Industries, Engineering Management Team, 400 Bangeojinsunhwan-doro, Dong-gu, Ulsan 44114, Korea
2
Graduate Institute of Ferrous Technology (GIFT), Pohang University of Science and Technology (POSTECH), 77 Cheongam-Ro, Nam-Ku, Pohang 37673, Korea
3
Department of Industrial and Management Engineering, Pohang University of Science and Technology (POSTECH), 77 Cheongam-Ro, Nam-Ku, Pohang 37673, Korea
*
Author to whom correspondence should be addressed.
Energies 2019, 12(12), 2295; https://doi.org/10.3390/en12122295
Submission received: 28 May 2019 / Revised: 8 June 2019 / Accepted: 12 June 2019 / Published: 16 June 2019

Abstract

:
This paper focuses on the influence of detailed engineering maturities on offshore engineering, procurement, and construction (EPC) project procurement and construction cost performance. The authors propose a detailed engineering completion rating index system (DECRIS) to estimate the engineering maturities, from contract award to beginning of construction or steel cutting. The DECRIS is supplemented in this study with an artificial neural network methodology (ANN) to forecast procurement and construction cost performances. The study shows that R2 and mean error values using ANN functions are 20.2% higher and 19.7% lower, respectively, than cost performance estimations using linear regressions. The DECRIS cutoff score at each gate and DECRIS forecasting performance of total cost impact were validated through the results of fifteen historical offshore EPC South Korean mega-projects, which contain over 300 procurement cost performance data points in total. Finally, based on the DECRIS and ANN findings and a trade-off optimization using a Monte-Carlo simulation with a genetic algorithm, the authors propose a cost mitigation plan for potential project risks based on optimizing the engineering resources. This research aids both owners and EPC contractors to mitigate cost overrun risks, which could be continuously monitored at the key engineering gates, and engineering resources could be adjusted per optimization results.

1. Introduction

Changes in an engineering, procurement, and construction (EPC) project are inevitable. Per the EPC model, contractors are responsible for procurement and construction risks arising from engineering maturities which have not been completed during the ‘define stage’ of projects. During the last two decades, EPC contractors in South Korea have carried out a large number of offshore EPC mega projects. Over 80 mega-projects including fixed platforms and floaters were ordered to the EPC contractors amounting to about 70 billion dollars, 15% of the total worldwide capital expenditures for topside oil production facilities. The Korean EPC contractors encountered numerous changes in the detailed engineering phases of the projects, often resulting in significant profit losses [1].
According to sample data from one historical project that was completed by a Korean EPC contractor from 2014 to 2017, approximately 40%~45% of the total project price was for major equipment and bulk material procurement. In addition, about 20%~25% was for the labor cost of construction activities. Therefore, over 60% of the total project cost was related to direct costs of procurement and construction. In projects that experienced significant cost increase due to growth in the construction and procurement stage, these cost increases were attributed to a combination of low engineering maturities and fast-tracking trends of EPC projects. Therefore, EPC contractors must be aware of the project cost risks before the contract award and/or during the detailed engineering execution stage.
With regard to the contractual obligations of an EPC contract, EPC contractors accept the single point of responsibility of both design and construction. Through front-end engineering and design (FEED) endorsements, EPC contractors are responsible to ensure that project execution will meet and exceed the clients’ project goals and purposes. After the FEED endorsement, clients typically do not accept any change orders even though FEED packages have often not been fully matured. Contradictorily, EPC contractors are not able to transfer these design change risks to the vendors so any further design change occurring after the equipment supply contract or the bulk material purchase order is considered as a vendor change order, which should be compensated to the contractor. Most engineering aspects must be fully defined prior to the procurement of major equipment and bulk material. We found, for example, that on the aforementioned historical project, client change orders relative to the vendor change order were less than 20% of the vendor change orders. The remaining 80% had to be covered solely by EPC contractors.
In order to reduce the project risks caused by low engineering maturities on offshore EPC mega-projects, Kim et al. [1] had developed a qualitative score for the engineering maturities using the detailed engineering completion rating index system (DECRIS). This was used to predict their impacts on project construction cost. While it is a valid addition to the general body of knowledge, construction costs are not the only project cost risks, as procurement cost risks can also have significant impacts. Therefore, the main purpose of this research is to predict the project procurement cost impact by the DECRIS framework and to develop a mitigation plan that covers the engineering, procurement, and construction risks.

1.1. Existing Literature

Existing literature covers critical factors, which cause cost overruns for both domestic and international construction projects. Shibani and Arumugam [2] studied the factors that lead to cost overruns in Indian construction projects by surveying of experts in construction fields. They reported that regular changes of contractors were indicated by 71% of the participants. An analysis by Hsieh et al. [3] showed that 23.7% of design variation orders originated from issues within the planning and design stages on 90 historical projects in Taipei. Ssegawa et al. [4] similarly reported that 45.7% of change orders resulted from either additions and/or omissions in the design, the most common cause of the project cost growth. The above studies report the importance of detailed design maturities to reduce additional cost impact on the projects. Kaming et al. identified 16 factors causing cost impact [5]. Frimpong et al. [6] and Creedy [7] highlighted 24 and 31 factors respectively. These three studies indicated that inaccurate cost estimate during execution as well as design error is one of the major causes of cost impact. The above represents the most applicable publications. The authors performed a holistic review of existing literature pertaining to critical cost impact factors on international projects. Of the total 30 literature articles reviewed, 57% have also mentioned the impact of inaccurate cost estimates.
Ibbs [8] studied the quantitative impacts of project changes that contributed at least 30% to the entire change order. After reviewing over one hundred projects, said publication determined that 0.34% of productivity decrease and 0.88% of construction labor cost increase could be expected per 1% of project change. This result means that project change globally affects the project cost performance, therefore reducing these project changes are one of the key parameters to keeping the labor productivity high and cost impact low [8]. Wang et al. [9] depicted that the relationship with clients and engineers is especially important for contractors to deliver EPC project within schedule and cost performance. Using different data analysis, they found that design management is critical to project cost performance. In addition, with successful design management, contractors can also take long-term business opportunities by demonstrating engineering competence [9].
Table 1 summarizes research studied previously to identify which factors mostly affect the cost performance of construction projects. Most of them indicate that inaccurate cost estimates at the bidding stage and design changes during construction are the most critical factors that affect the entire project cost performance. Previous studies with the main factors highlighted were categorized by project locations in the various regions, i.e., Australia, East Asia, South-East Asia, Middle Asia, West Asia, Europe, and Africa.
Dikmen et al. [33] defined the project risks that are associated with construction, design, payment, client, and sub-contractor (procurement) risk. Publications estimated the overall project risk using a fuzzy risk assessment. The fuzzy set provides a magnified risk rating for each risk and for overall project risks. The magnified risks are limited in that the risks cannot be forecasted as a cost unit. Kim et al. [34] provided the prediction model using a DECRIS framework that estimates construction cost impacts by assessing detailed design maturities, optimizing the engineering and the construction impacts. However, the optimization model is limited to the calculation of only the construction impact. In estimating EPC project performance, the procurement cost impact must also be combined with the engineering and construction impacts. Yoo et al. [35] studied the importance level of 52 risk elements through expert survey and weighing the risks for EPC nuclear power plant projects, and concluded that the schedule of procurement and delivery is the most critical risk factor to project success. By measuring each risk level, the overall project cost and schedule could be monitored and forecasted [35]. Although the risk management in the study was well defined and structured, assessment methods of the risk rating, however, are qualitative and uncertain. A practical and objective approach to assess the risk rating is required to enhance the accuracy of cost and schedule performance forecast of the project.
Most of the literature described the importance of the design maturities on estimating contract prices and performing the EPC execution without fatal design changes, which cause cost impacts on procurement and construction. In other words, most of the previous research was limited to the acknowledgement and identification of factors affecting project cost performance without any development of practical application methods or/and tools to mitigate these interacting factors. Especially, there is little research so far focusing on engineering management processes for upstream projects in energy infrastructure to assess and measure the interaction between major gates for EPC projects, i.e., the maturity (completion progress) level of detailed engineering and procurement for equipment/material purchasing, and construction initiation.

1.2. Point of Departure and Research Contribution

Kim et al. [1] have previously described use of the DECRIS framework to define important elements of detailed engineering and correlate these elements to project construction performance. In addition, Kim et al. [34] suggested the forecasting and mitigation method using DECRIS framework at five key gates (from FEED verification to construction start). The most significant objective of this research is to expand the DECRIS framework to procurement cost performance and to determine any correlation between the DECRIS model and the project procurement performance at these key engineering gates. This validity of the proposed model’s added value is tested using artificial neural network (ANN) best-fit curves. Finally, this research proposes potential cost risk mitigation measures (including engineering, procurement, and construction consequences), using a Monte-Carlo simulation with genetic algorithm for optimization. This research contributes to industry by providing EPC contractors a tool which accurately determines procurement and construction risks at the initial stage and suggests potential mitigation measures, balancing engineering resources based on the assessment of detailed engineering maturities. With this suggested DECRIS model, project owners and EPC contractors may be able to monitor the required progress for engineering–procurement–construction at each engineering gate.

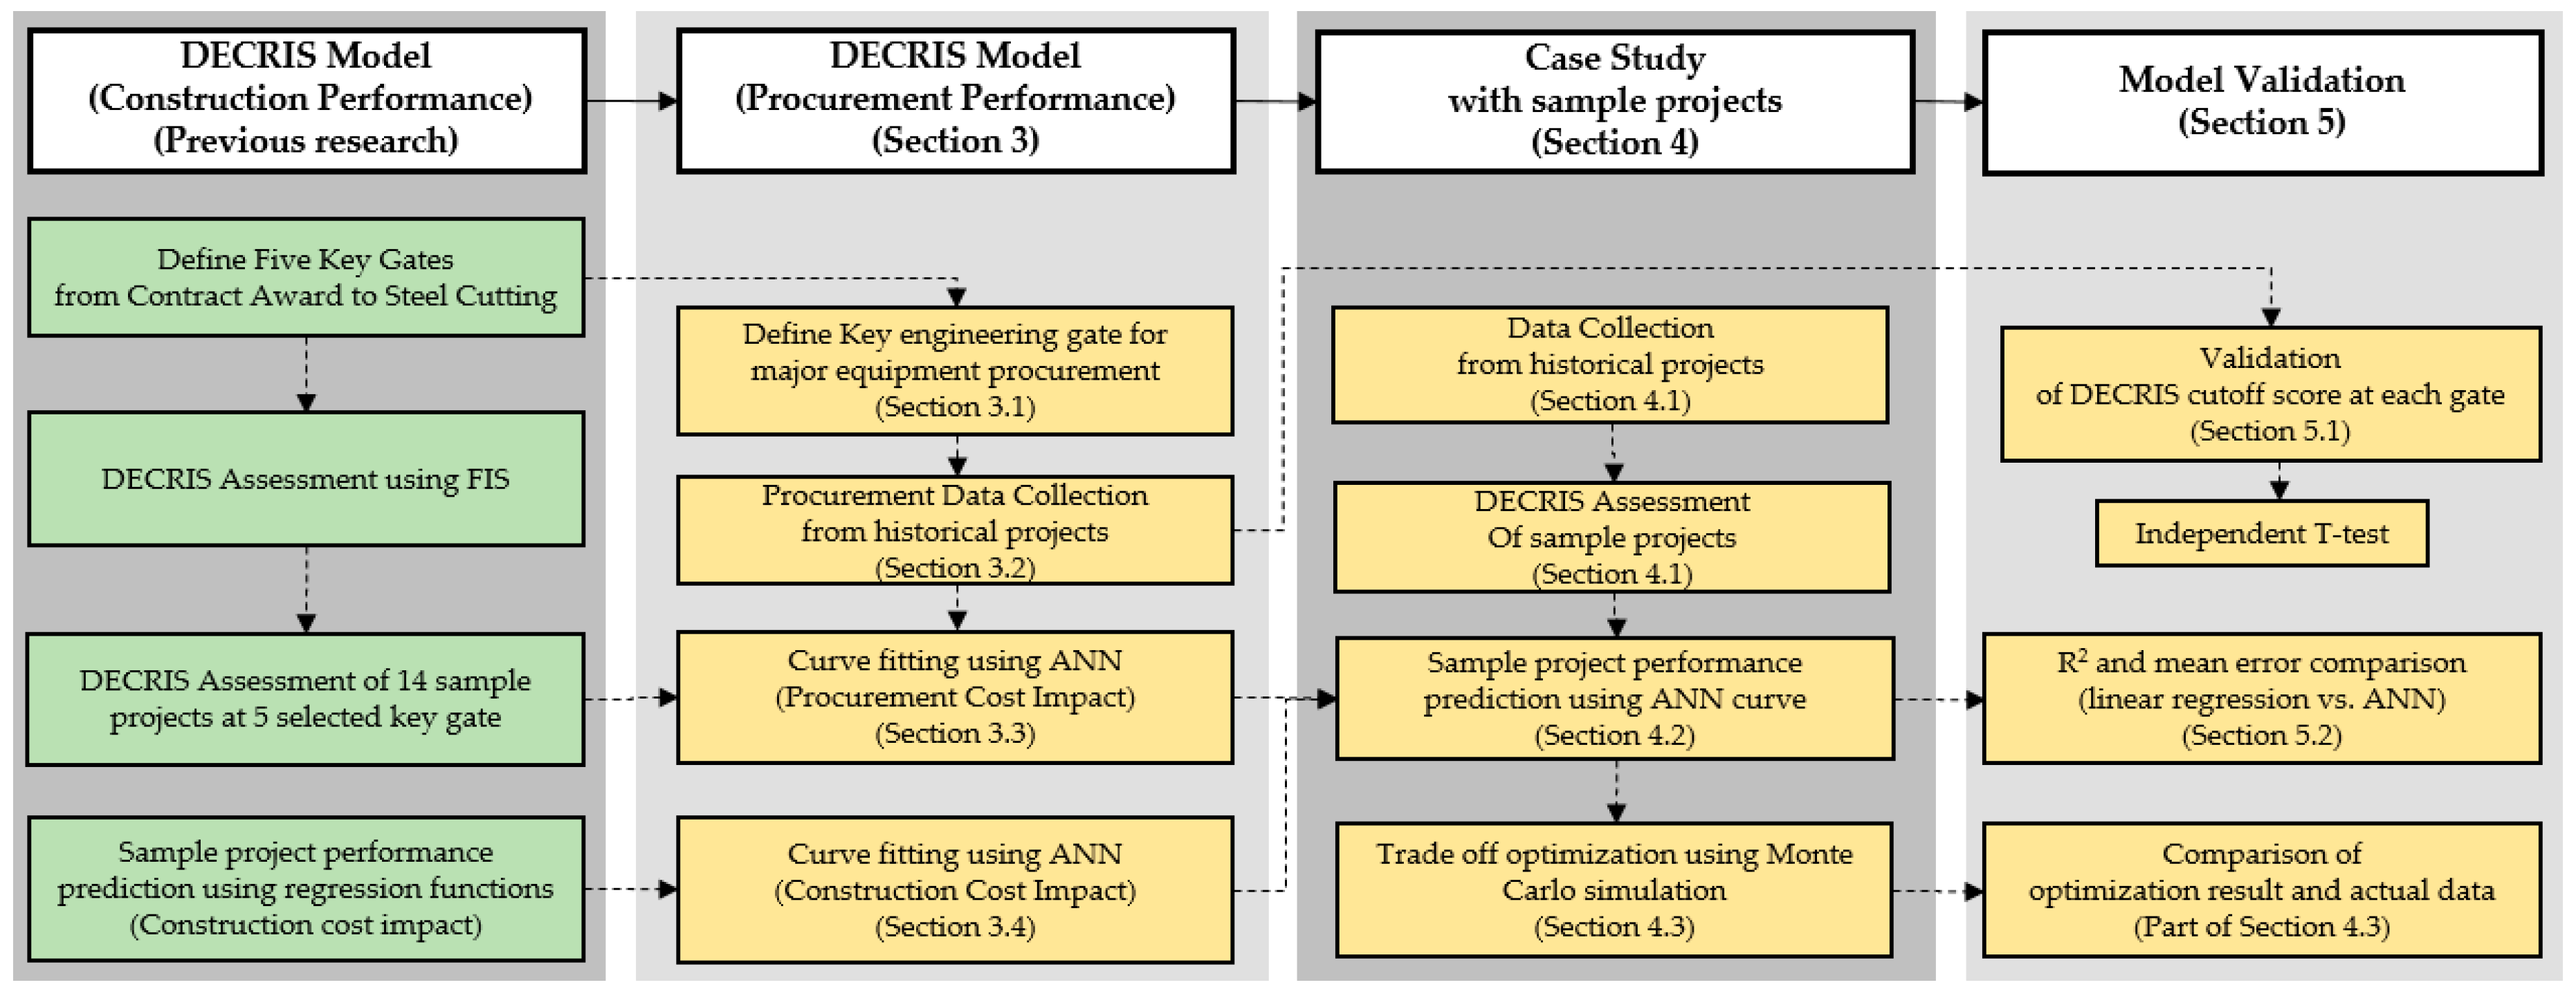
2. Research Methodology

The major purpose of this research is to expand the DECRIS prediction and mitigation model from construction performance to combine engineering, construction, and procurement performances. Therefore, the study first builds off the existing DECRIS model, which is correlated to the prediction and mitigation of the project construction cost and schedule impact.
Figure 1 describes the research procedures used in the application of the DECRIS model in procurement to a case study based on sample projects and to the model validation. In the DECRIS model application section, the DECRIS model assigns seven gates: five gates for construction risk review and another two gates for procurement risk review. The correlation between the DECRIS calculation and project performance will be reviewed using the ANN model. In the following section, a case study assessing the capability of the DECRIS model to predict procurement performance for an offshore EPC mega-project will be performed. To verify the model, a DECRIS cut-off score, which was confirmed in the previous research, will be reviewed. Finally, the prediction performance of the ANN model will be discussed. There are three main methodologies applied in this research, as well as a set of statistical methods such as independent T-test, F-test, and linear regression.

2.1. Existing DECRIS Model

The methodology needed to calculate the detailed engineering maturities with the DECRIS framework [1] was previously reported. The DECRIS model consists of 69 major factors called “elements” that affect detailed design maturities for EPC projects. Using the DECRIS level assessment of each element at the specific stage of EPC execution stage, the detailed engineering maturity could be qualitatively calculated within the range of 70 to 1000. A lower DECRIS score means higher design maturities for the EPC contractor. A correlation between the resulting DECRIS score and the project construction cost and schedule performance in the fourteen historical projects, which were completed in South Korea by an offshore EPC contractor, were statistically validated using various tools such as t-test, linear regression, fuzzy set qualitative comparative analysis, and fuzzy inference system. Additionally, the DECRIS cut-off score to ensure the project performance was established as 810, 660, 500, 380, and 300 at the five key engineering gates (i.e., (1) FEED verification, (2) major equipment procurement, (3) 60% modeling review, (4) 90% modeling review, and finally (5) steel cutting). A trade-off optimization concept using Monte Carlo simulation was proposed and validated with case studies [34]. With the DECRIS assessment and optimization, the project owner and the EPC contractor can monitor the detailed design completion rate affecting the construction risks and mitigate construction cost risks with the optimization method. The following three equations were defined in the previous DECRIS research [1,34], and required to forecast engineering, construction and procurement impacts, as further described in this paper.
Construction labor hours increase rate (CLIR)
= Construction labor hours increased by design change/Planned construction labor hours
Vendor change order rate (VCOR)
= Vendor change order cost/Original purchase order price
Engineering resource enhancement rate (ERER)
= Additional engineering labor hours/Planned engineering labor hours

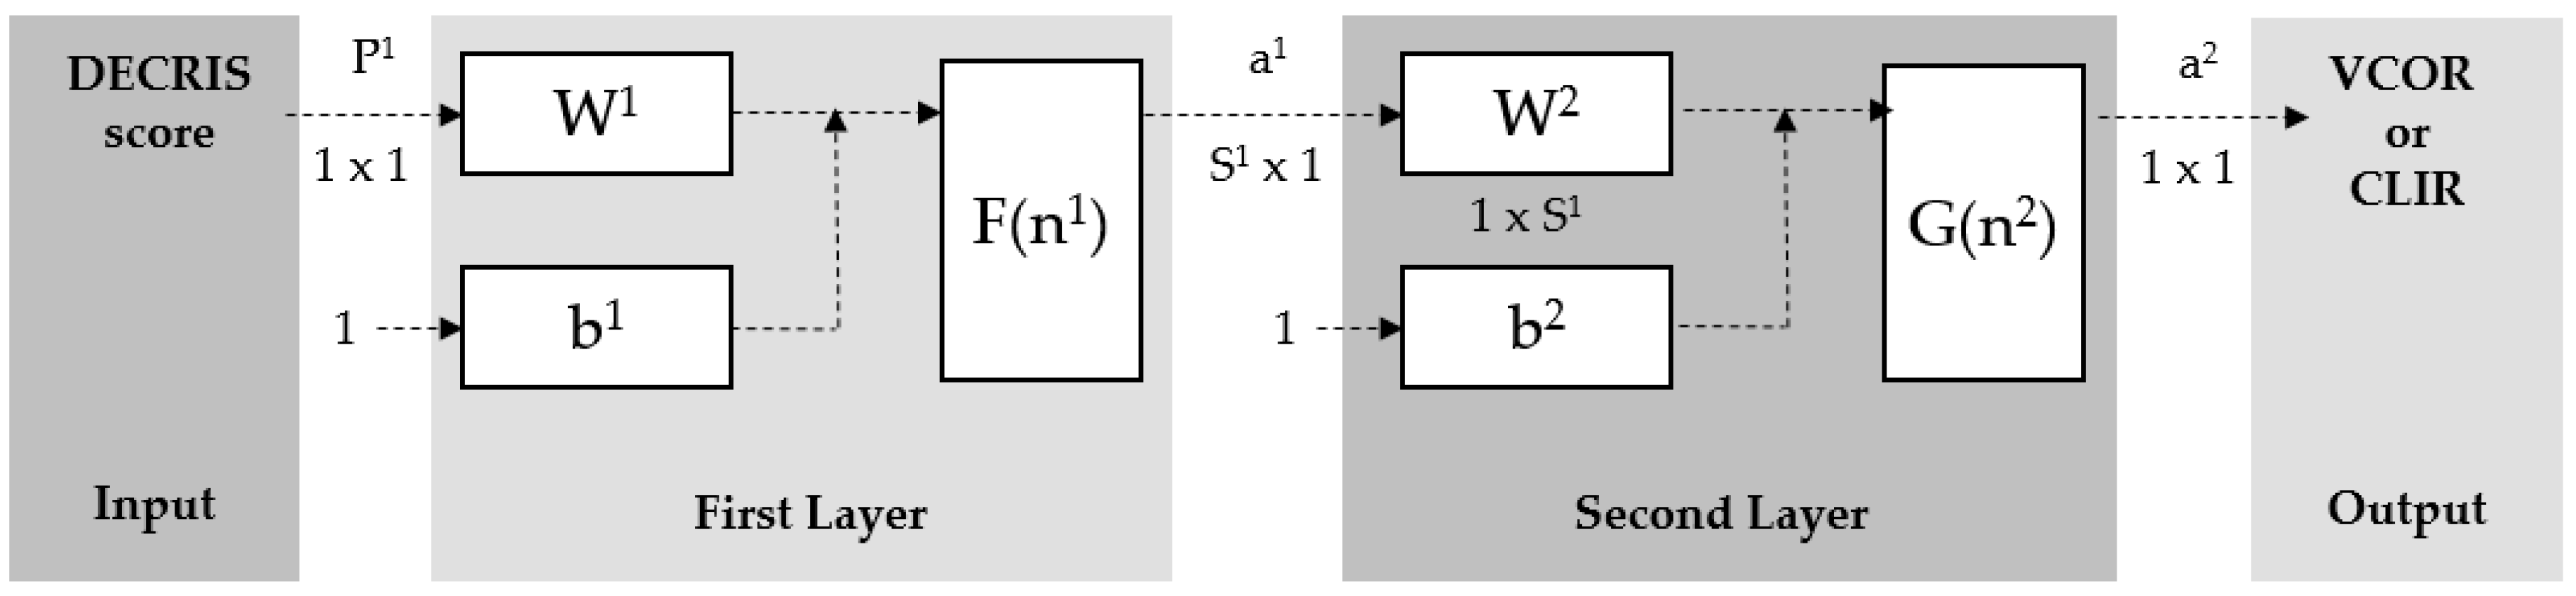
2.2. Artificial Neural Network

The artificial neural network is an effective tool used to solve various issues related to curve fitting, prediction, pattern interpretation, clustering, time series forecasting, etc. For example, Kim et al. adopted the neural network model in estimating construction costs in the construction project fields [36]. In a general manner, ANN consists of a number of neurons, which include input, weight, bias, transfer function and output [37]. The input data is calculated with weight and bias using a transfer function of a neuron (which was empirically decided by a researcher). The weight of each neuron is continuously adjusted throughout the machine running, which are categorized as supervised learning, unsupervised learning, and reinforcement learning. If a designated model is not diverse, the weight and the bias of each neuron will be stable after a sufficient number of iterations of forward propagation and back-propagation.
The following Figure 2 shows a sample of a multilayer perceptron mode.
In the previous DECRIS research [1,34], linear regression was used for forecasting construction cost performance. In some cases, forecast performance of a model could be enhanced with non-linear regression. In order to increase forecast performance in this research, the ANN model was applied to find out the best-fit curve between the DECRIS score at the dedicated key gate and the project actual performance. Multilayer perceptron is a useful tool to perform curve fittings by supervised learning when researchers know a set of input data and the corresponding labels. When the dataset was constructed, data normalization processes were required to reduce the number of iterations with the equation set below. After an initialization process using a set of weights and bias (such as Widrow and Nguyen), the iteration of the machine learning could be started as the following formula.
Forward propagation
a1(2) = g(θ11(1)x1 + θ12(1)x2 + θ13(1)x3 + b1)
a2(2) = g(θ21(1)x1 + θ22(1)x2 + θ23(1)x3 + b2)
a3(2) = g(θ31(1)x1 + θ32(1)x2 + θ33(1)x3 + b3)
a1(3) = h(x) = h(θ11(2)a1(2) + θ12(2)a2(2) + θ13(2)a3(2))
Back propagation
sM = −2h’M(nM)(ta) and sm = g’m(nm)(Wm+1)Tsm+1, m = M − 1, …, 2, 1
θ m(k + 1) = θ m(k) − αSm(am−1)T and bm(k + 1) = bm(k) − αSm
S(2) = −2h’(2)(n(2))(ta(2)) and S(1) = g’(1)(n(1))(W(2))TS2
where, ai(j) = activation of unit i in layer j; θ(j) = matrix of weight controlling the function from layer j to layer j+1; g(x), h(x) = the transfer functions of the output and the hidden layer, respectively; M = number of layer, k = number of learning, t = corresponding label data, and α = a learning rate
When curve fitting using ANN, a combination of log-sigmoid (at the hidden layer) and linear (at the outlet layer) was generally applied [37]. Through the iteration of forward and backward propagation, sum squared error (SSE) is subsequently decreased up to a stable condition. The performance of ANN after training is verified with the SSE histogram and with linear regression analysis between outlet data and actual data. Kim et al. found that a linear regression model could be used for the correlation function with considerable statistical significance [1,34]. However, in several cases, R2 between the performance and DECRIS is lower than 0.5. In this research, ANN is adapted to find the better or the best fit to explain the correlation between DECRIS and actual performance. The target for R2 value was greater than 0.6 with preferred values up to 0.7~0.8 using ANN curve fitting. The result in the next section gives the preferable range of R2 value, which was found better than the R2 value found using simple linear regression.

2.3. Trade-Off Using Monte-Carlo Simulation

Monte-Carlo Simulation is widely used to optimize difficult multi-dimensional models such as investment cost, resource optimization, priority of the project sequence, and warehouse optimization. Input variables are set up and deterministic algebraic functions are arranged to calculate an optimum point. After verification of inlet distribution function such as normal distribution or beta distribution, simulations are performed with several thousands of iterations. The results are shown as deterministic value of optimum point and probabilistic ranges of output variables [38].
In this research, total cost impact was calculated with deterministic algebraic function including construction and procurement cost performance, cost of engineering resource enhancement and cost deduction caused by enhanced engineering maturities. With series of simulations using commercial software (at-Risk), a deterministic optimum point of engineering resource enhancement was proposed and probabilistic ranges of total cost impacts were discussed. The optimum point was rechecked using optimization with genetic algorithm was also performed to find the exact engineering resource enhancement and total cost impact value.

3. DECRIS Model for Forecasting Procurement Performances

3.1. Definition of Key Engineering Gates for Major Equipment Procurement

In previous research, five (5) key engineering gates were defined as (1) FEED verification, (2) major equipment procurement, (3) 60% modeling review, (4) 90% modeling review, and (5) steel cutting. FEED verification (gate 1) and major equipment procurement (gate 2) were collected for the study of the influence of engineering maturity on equipment procurement. At the FEED verification session, the expected VCOR was calculated. The mitigation plan was set to satisfy the required DECRIS value at gate 2. Engineering maturity at gates 3 to 5, which occurs later than equipment procurement, does not impact on the procurement cost and therefore was not included in this study.

3.2. Data Collection from Historical Projects

Equipment purchasing data was collected from 15 historical projects. The quantity of the data is 324 items and their total cost amount is about 1.7 billion dollars. In order to review the correlation between DECRIS and VCOR, purchased cost amount and change order amount were calculated per each project.
Hagan et al. [37] described that at least 15% of the data should be used for ANN network test and the selected data shall not be used for learning of the network. Projects E, G, and O were selected through the random sampling, and DECRIS scores and VCOR results in the remaining 12 projects were calculated for the network training.
Prior to starting a neural network, linear regressions were performed for brief-checking the relationship between DECRIS score and VCOR, and R2 values were found as 0.4246, 0.5451 at gates 1 and 2 respectively.
Table 2 shows the details of DECRIS values and VCOR for 15 projects.

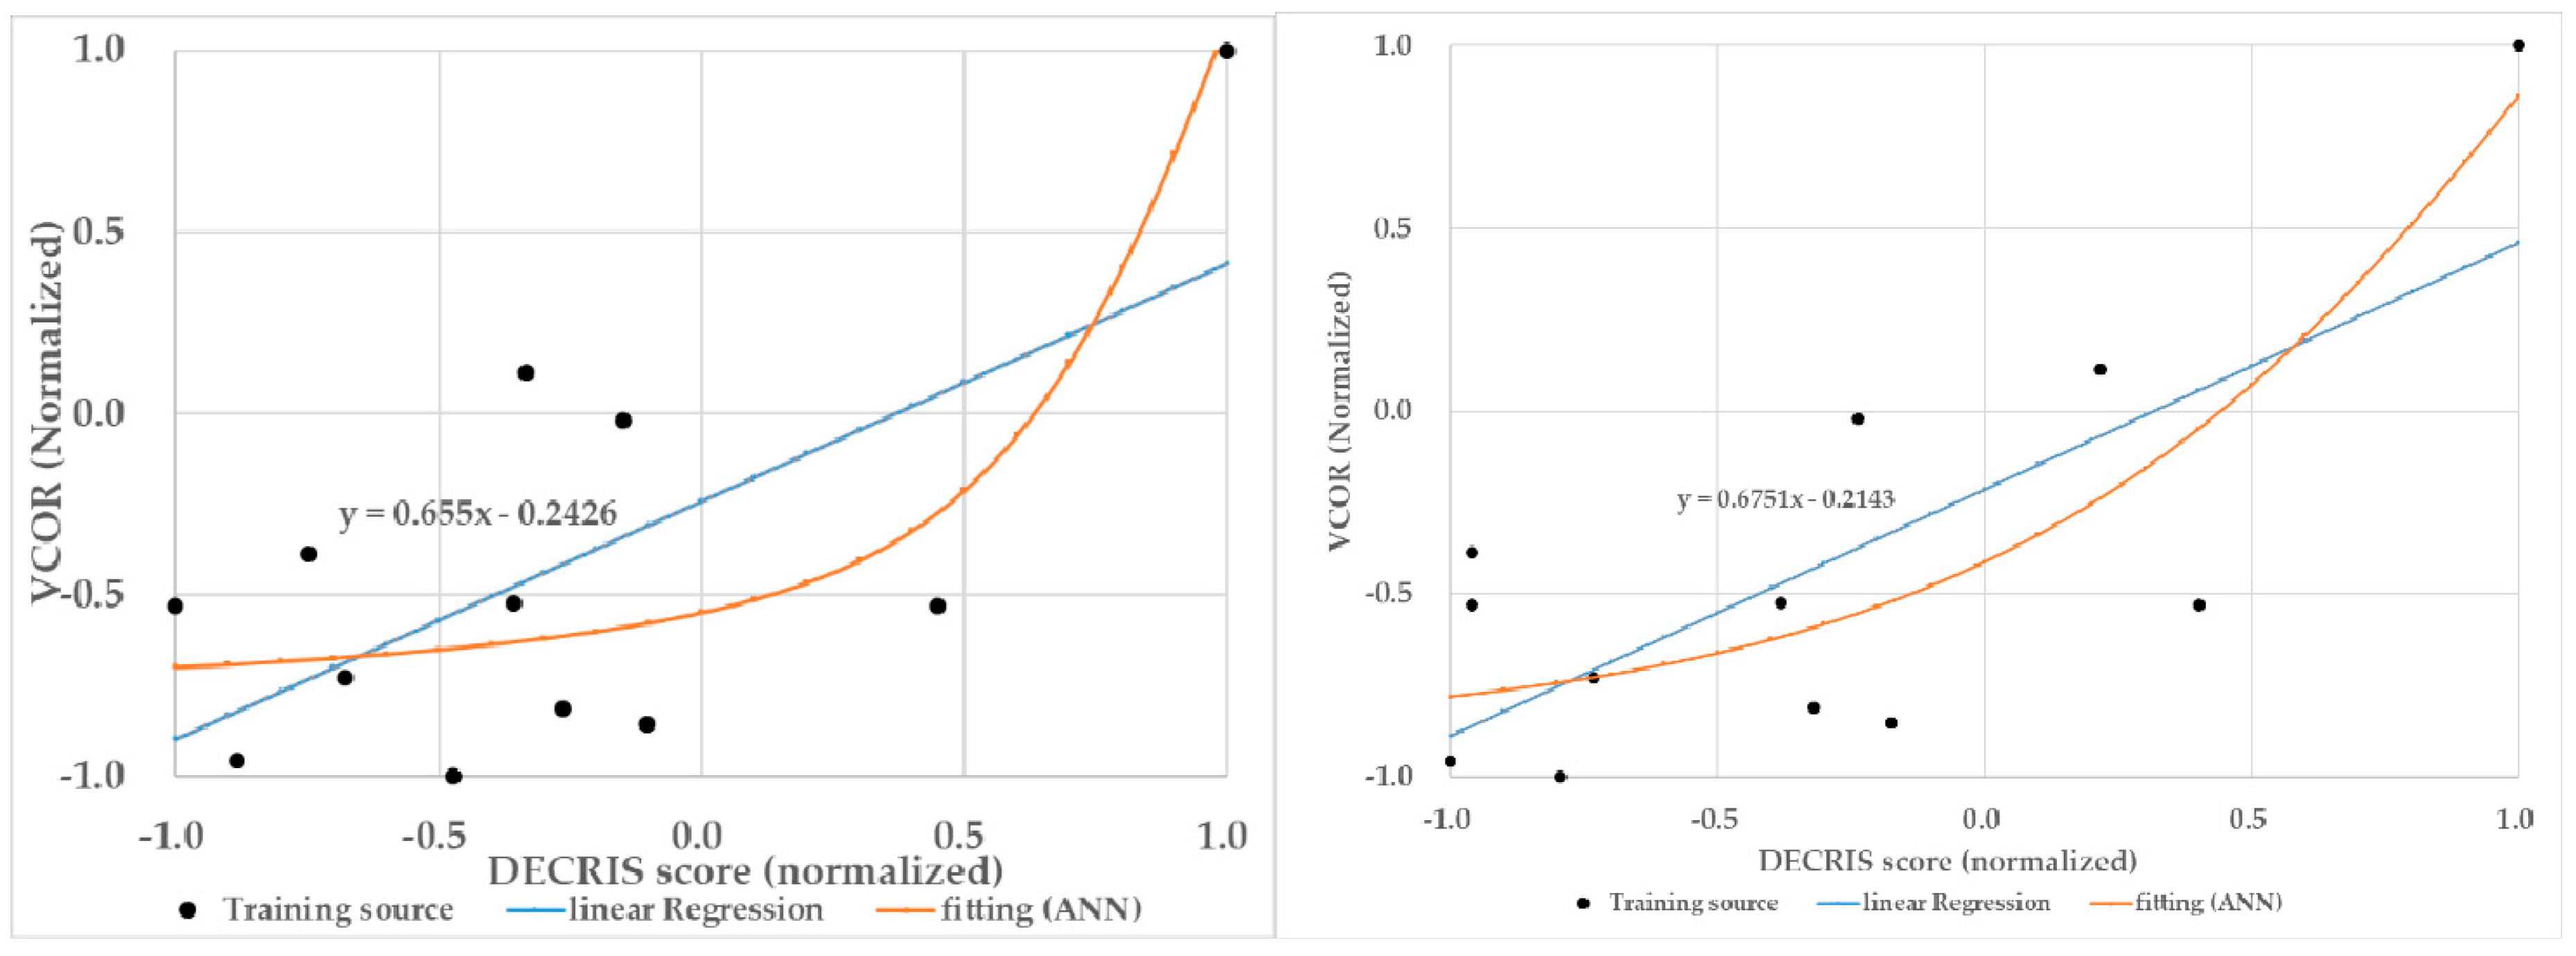
3.3. Forecasting Procurement Performance Using Artificial Neural Network

The purpose of using a neural network technique is to find an optimum curve fit that explains the relationship between engineering maturity (calculated by the DECRIS model) and procurement cost performance (defined as VCOR). With an appropriate fitting curve, contractors can predict the project’s procurement cost performance for the major equipment. A multi-layer perceptron model with supervised learning was selected, and Hebbian learning was used for backpropagation algorithm. As for linear regression, the input of the network is the DECRIS score and the output is VCOR. There are two possible methods of data normalization to perform learning through the neural network efficiently, i.e., by min–max normalization and by Z-score normalization. In this paper, both normalizations were initially applied. It was concluded that the min-max normalization procedure is better due to the narrower range of the normalized input data (−1 to 1) than from the Z-score normalization (−1.07 to 2.49). The next step of the neural network model was to determine the number of neurons. We first attempted to use the various numbers of neurons (such as 2, 3, 5, and 10) to find the best-fit model that maximizes R2. We concluded that use of five neurons at the hidden layer (in Figure 3) gave the best performance. The detailed results are discussed in Section 5. The weight initialization was performed using the Widrow and Nguyen method as described in the previous section.
The log-sigmoid function was selected as the transfer function for the hidden layer and a linear function was used for the output layer to distribute the result in the range of −1 to 1, as shown in Figure 4. After 100 iterations were carried out on the 12 project data sets (in random order), the following curve fit was found after continuous set of ANN iterations and fine-tuning of learning rate to provide the greatest R2.
As per the designed neural network model, the following vector formula could be established as shown in the following Equation (6). Equation (7) also show the learned formula as an algebraic expression for the relationship between DECRIS score and VCOR at FEED verification (gate 1).
a2 = G(W2F(W1p+b1) + b2)
where, a2 is the calculated VCOR value [1 × 1], W1 [5 × 1] and W2 [1 × 5] are vector of weight factors of 1st and 2nd neuron layer and b1 [5 × 1] and b2 [1 × 1] are bias of 1st and 2nd layer.
y = 1.075/(1 + e−(1.617x − 2.130)) + 0.929/(1 + e−(1.430x − 2.041)) + 1.088/(1 + e−(1.631x − 2.138)) +
0.239/(1 + e−(0.513x − 1.971)) + 1.467/(1 + e−(2.012x − 2.458)) − 0.893
where, x is DECRIS score, y is VCOR.

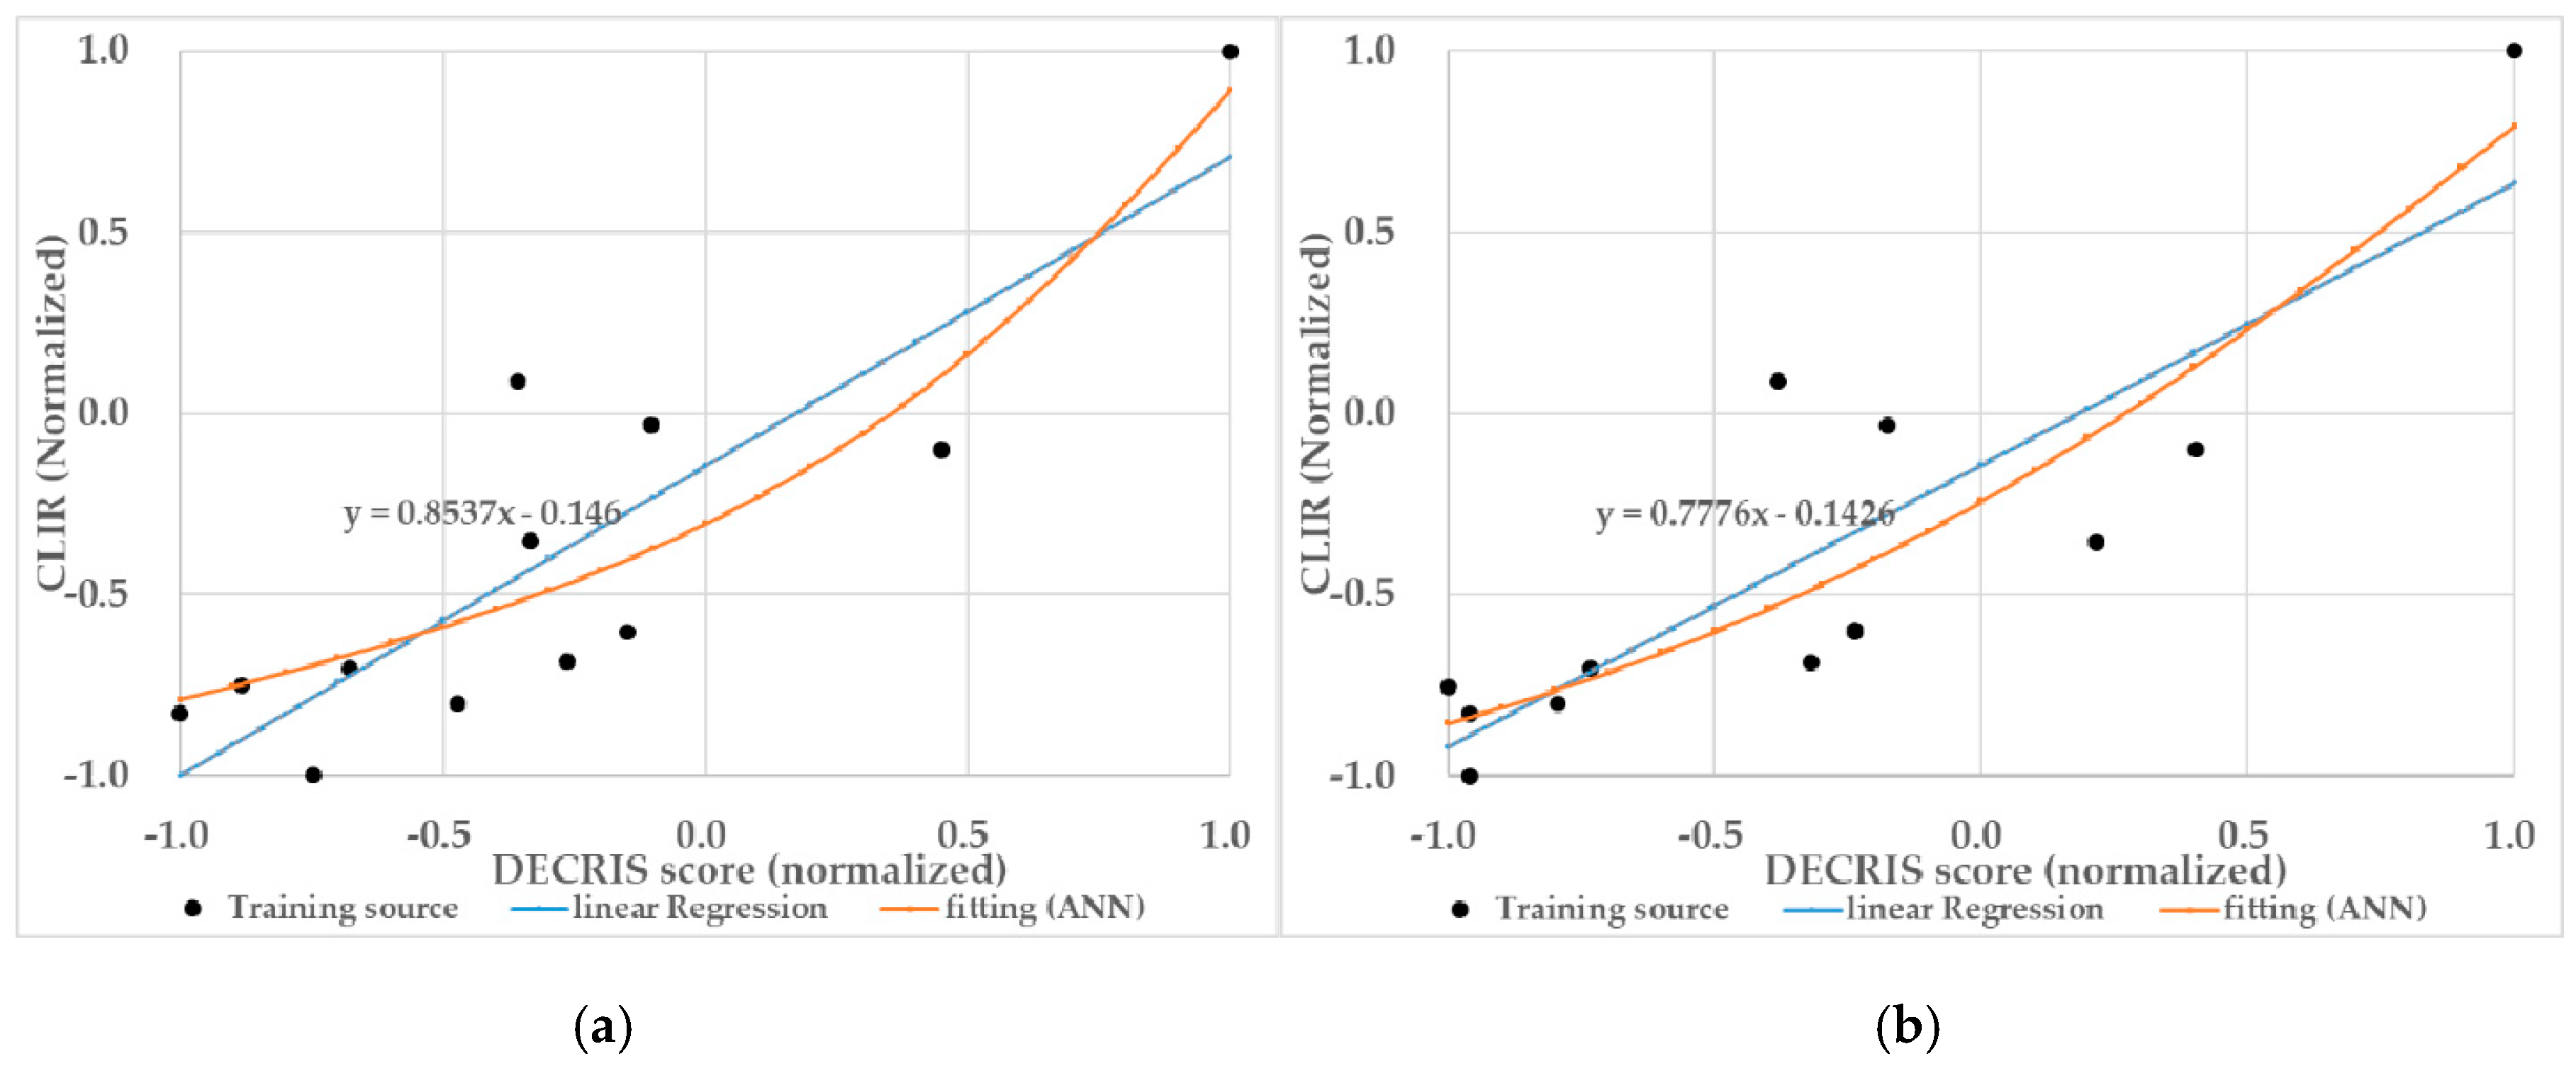
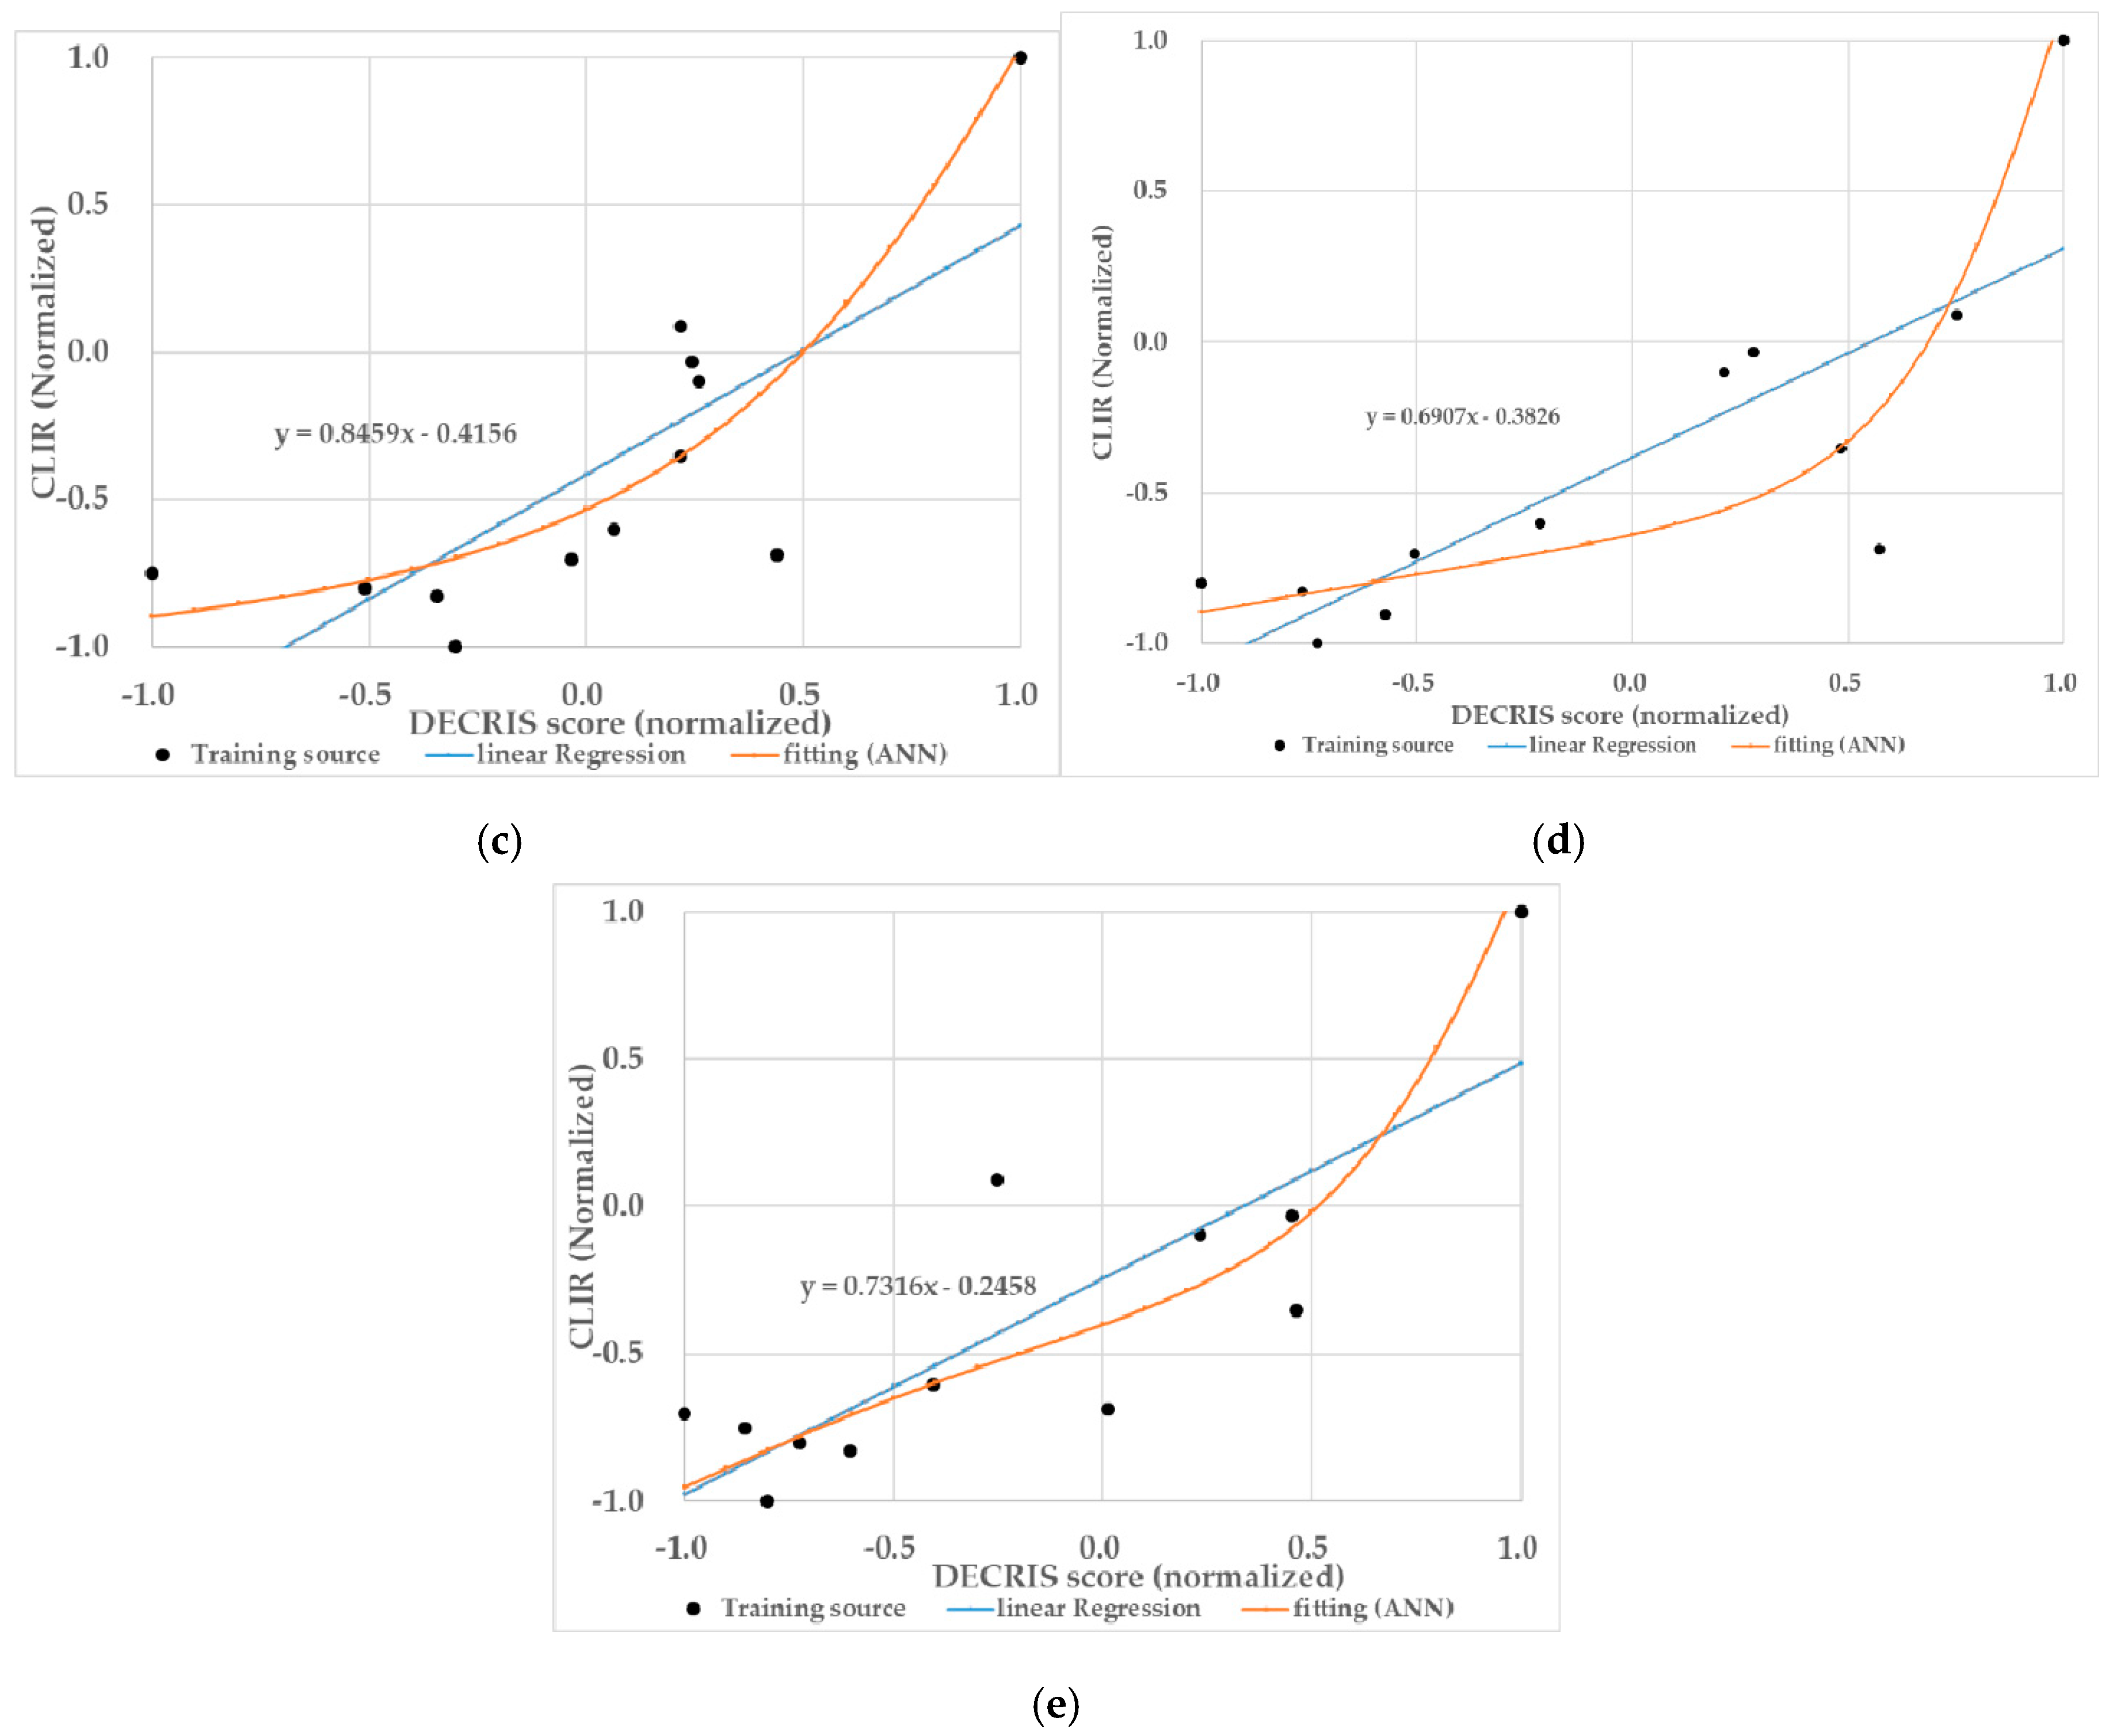
3.4. Forecasting Construction Performance Using Artificial Neural Network

Similarly, the neural network was applied to establishing a best-fit function for the relationship between the DECRIS score and the project construction performances at each of the five key engineering gates. The DECRIS score at each gate and the CLIR (which was calculated in the previous study by Kim et al. [34]) were applied to the ANN model. The repeated learning using 100 iterations with a learning factor adjustment was carried out, and the best-fit functions found are shown in Figure 5. Network test result using two test projects and R2 comparison will be discussed later.
Table 3 specified the SSE value of last five iterations of ANN. For all seven sets of ANN, differences of SSE between iterations are lower than 0.001, i.e., less than 1% of SSE. As shown in the previous Figure 4 and Figure 5, the ANN curves were not over-fitted and SSE is converged.

4. Case Study: Forecasting Cost Performance of an EPC Project at Bidding Stage

4.1. DECRIS Assessments of a Sample Project

In order to review the performance of the ANN functions to define the relationship between DECRIS scores and the project cost performances, three projects were randomly selected amongst the 15 historical projects, which were DECRIS assessed in the researchers’ previous study, as described in Section 4. The brief details are shown in Table 4, below.

4.2. Sample Project Performance Prediction (ANN Network Test)

Using the ANN function, the predicted procurement/construction cost performance of major equipment and the predicted construction cost performance were calculated. Figure 6 shows the predicted performance and actual VCOR of the Project E, G, and O, as summarized in Table 4.
Table 5 describes that ANN forecast value of CLIR and VCOR. On Project G, CLIR values forecasted by ANN model at gates 1 to 5 were 4.10%, 5.01%, 6.32%, 2.76%, and 6.51%, respectively. On the other hand, in the same project, VCOR at gate 1 and 2 were calculated as 5.93% and 6.53% as well. The prediction result shows that the deviations for both CLIR and VCOR were ranged between 0.07 to 0.42 sigma except for CLIR on gate 4. This indicates that the ANN model can properly forecast the project procurement and construction cost risks for Project G. The data on gate 4 could be explained by the time gap of gate 4 (AFC P&ID) and gate 5 (Steel Cutting) on Project G is just 17 days, consequently the DECRIS score at the gate 4 (360) did not decrease substantially in gate (346). This relatively short time gap (between gate 4 and 5) on Project G is an offset from the normal project schedule with about a 3 months gap between the gates (i.e., 4 and 5). These results suggest that the project cost risks cannot be properly mitigated due to the low engineering maturities at the steel cutting session on Project G. The comparison between Actual versus the ANN forecast model for Project E showed a similar trend. In more detail, the deviations between Actual and ANN model for Project E showed the range of −0.27 to 0.71.
Overall, the VCOR deviations for Project E were larger than the ones for Project G, as compared in Table 5 below. The procurement tracking history for Project E revealed that one major equipment package was removed as a result of the final detailed engineering, after the purchase order was already in place. Consequently, the scope reduction should be made in equipment purchasing, which resulted in the total VCOR for Project E being relatively larger than other projects.

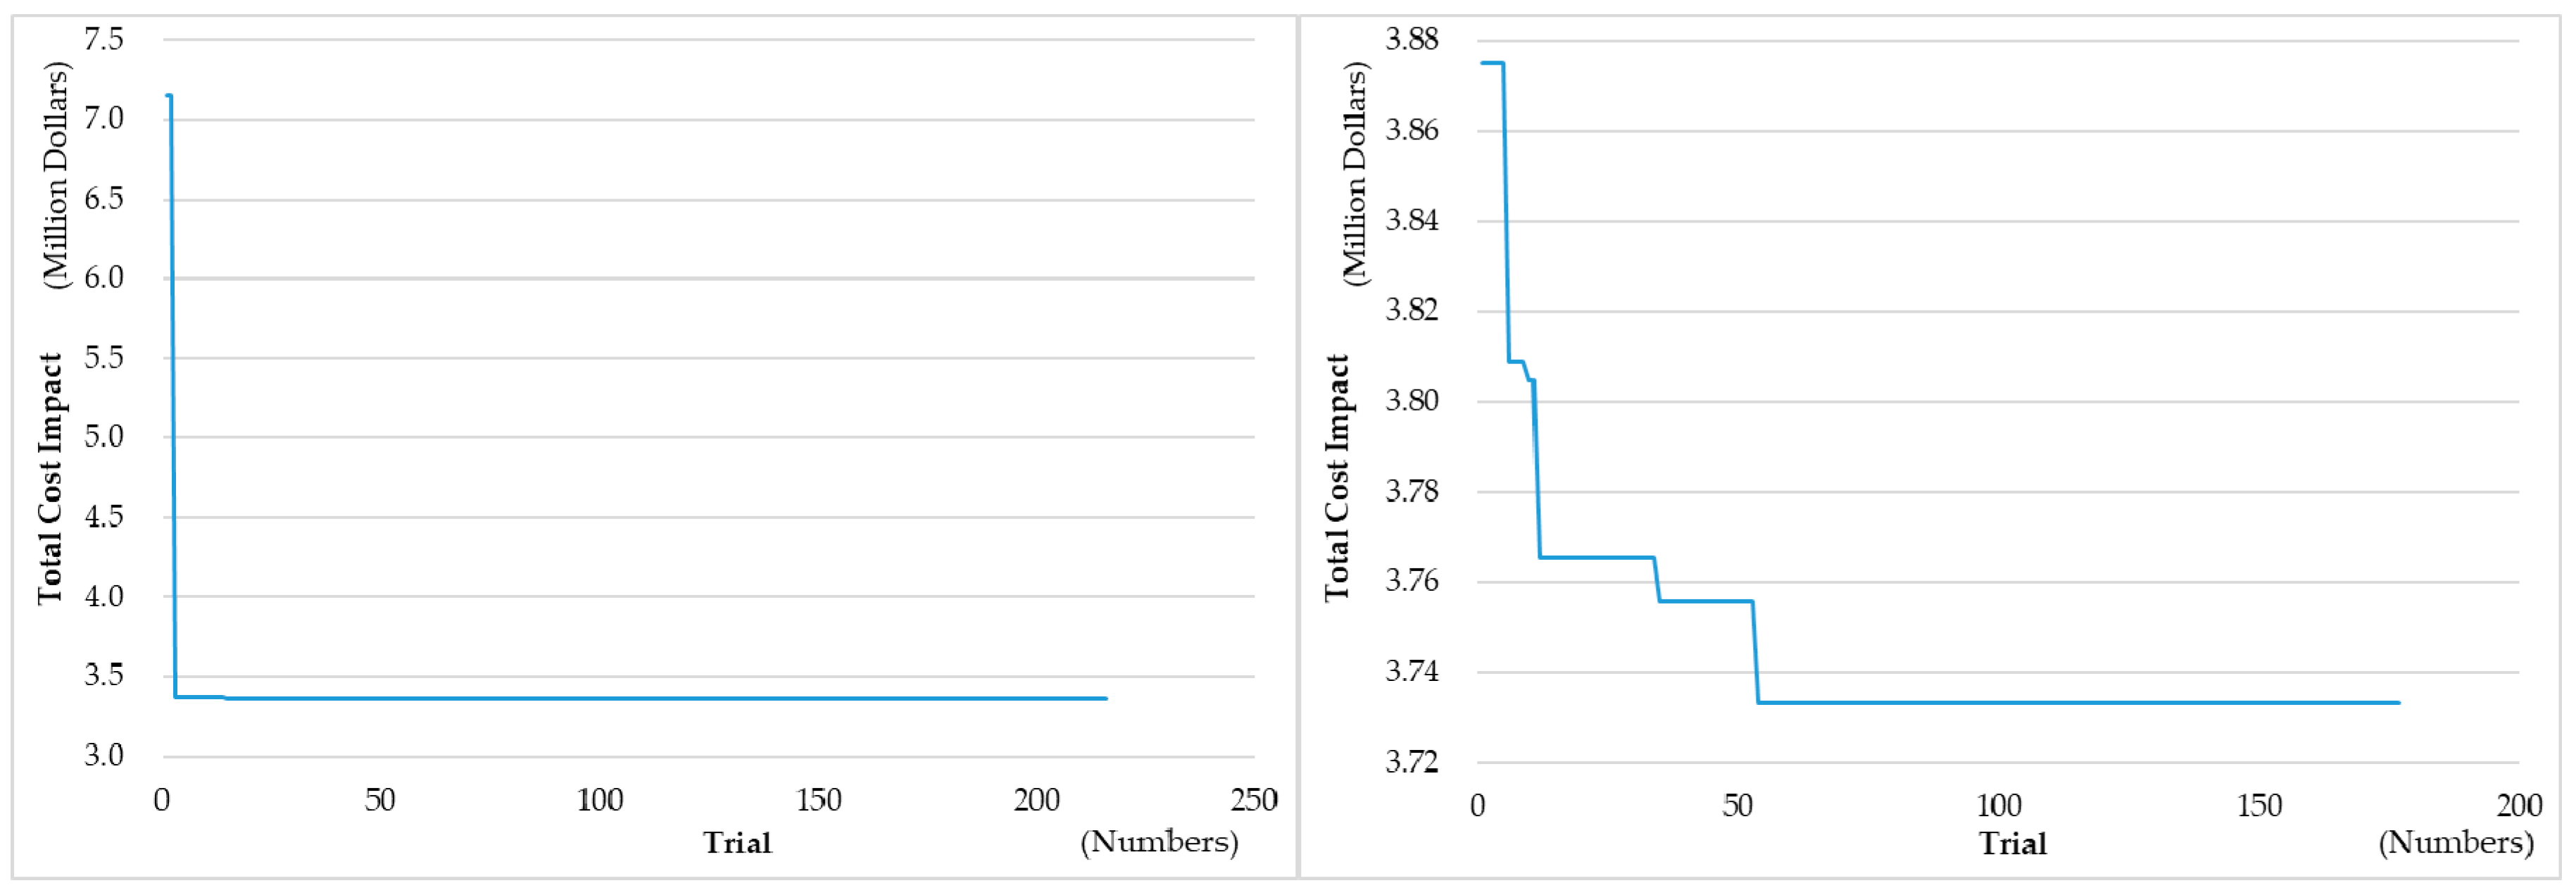
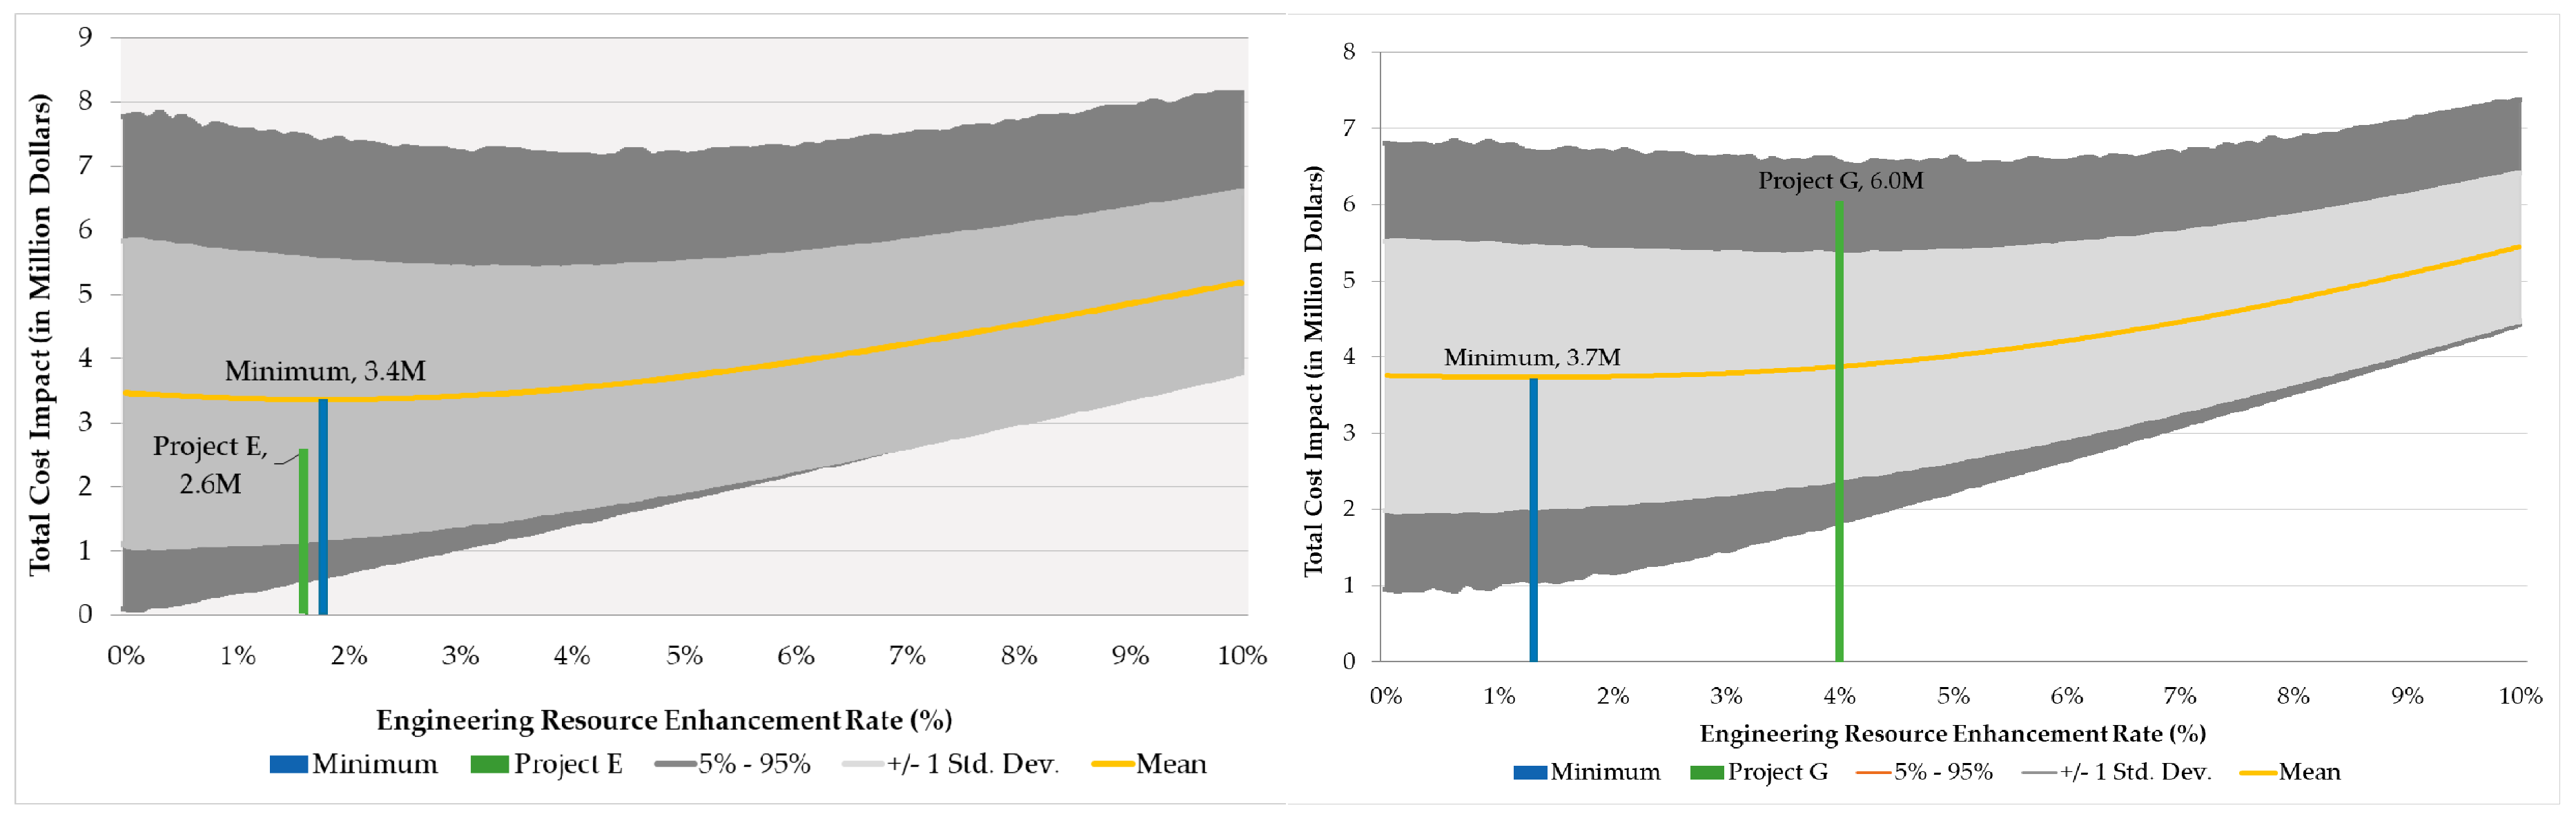
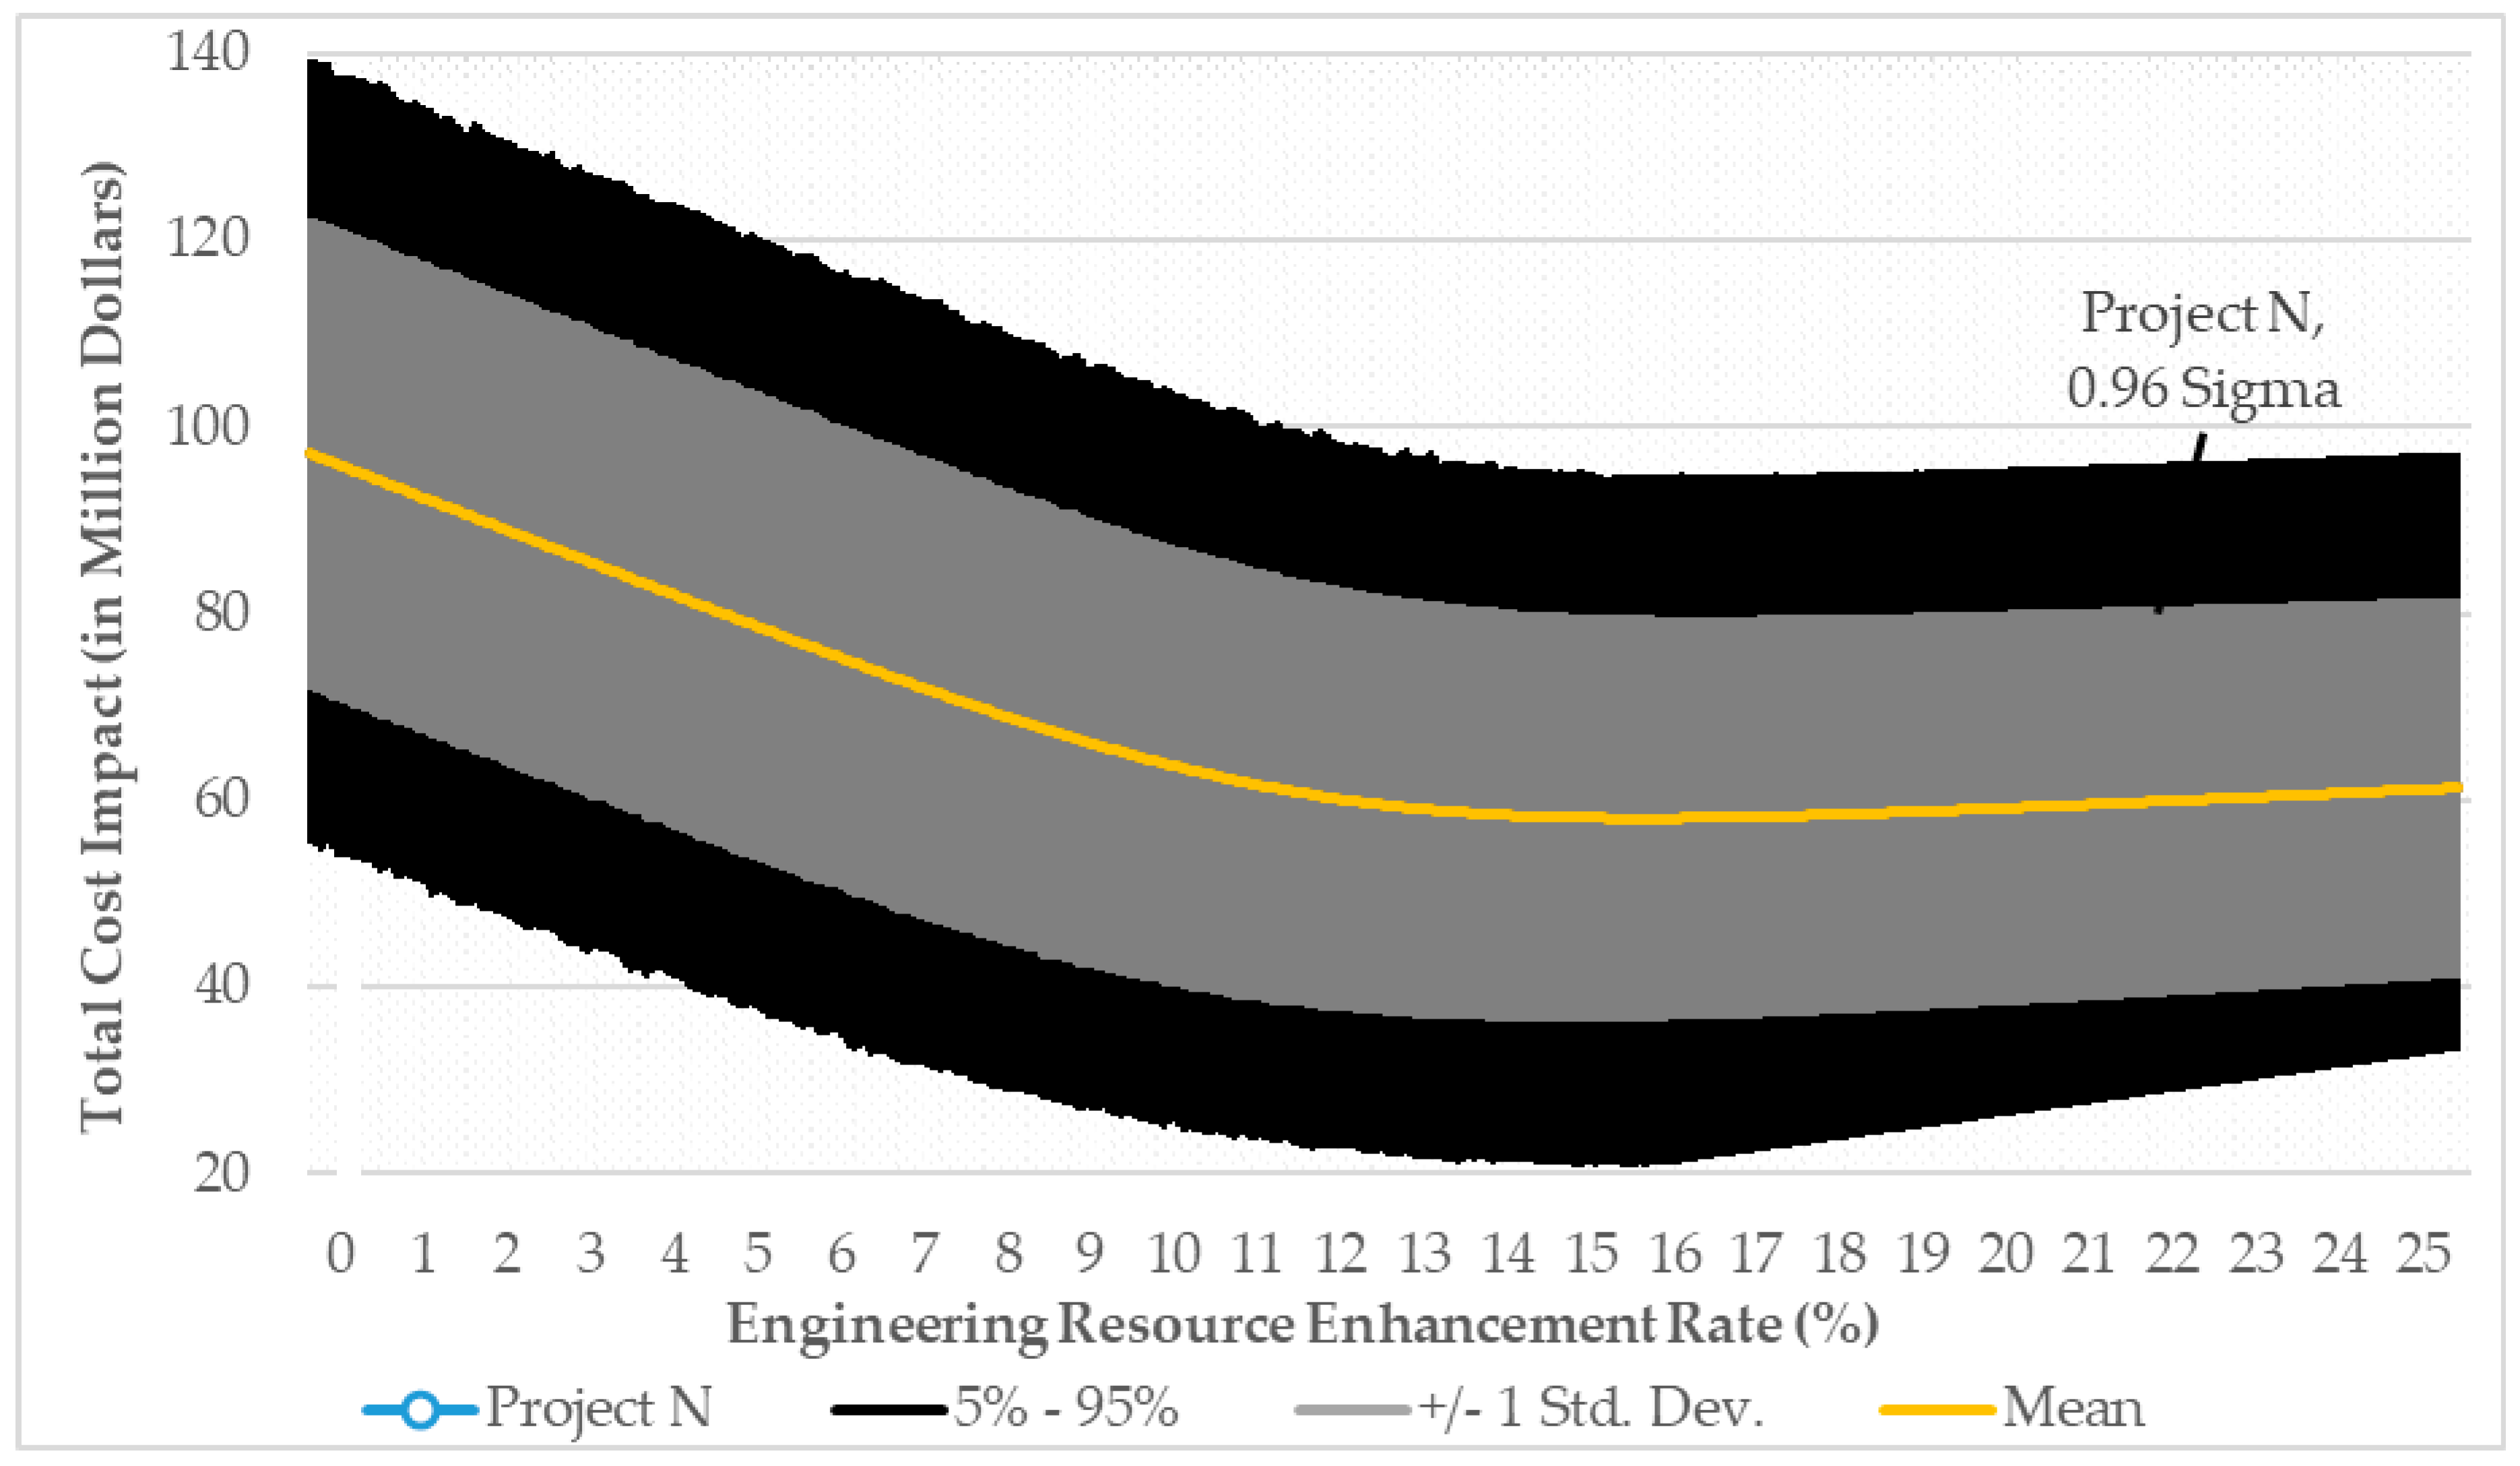
4.3. Mitigation Plan Using Trade-Off Optimization

At this point, all datasets to define the mitigation plan were prepared. In order to determine the optimum point for a trade-off between engineering, procurement, and construction cost impacts, A Monte-Carlo simulation was performed. Several assumptions were needed to ensure the simulation model convergence.
  • Input parameters taken from historical projects are distributed as normal distribution. Its appliance was already verified as shown in the research of Kim et al. [34].
  • Ibbs described that productivity in the design phase is decreased up to 80%~93% of normal productivity when project changes occur [8]. In this research, 80% efficiency was considered in case of engineering resource enhancement.
  • The slope of input variables against DECRIS scores is not linear as shown in the previous section taken by neural network. However, we used the constant slope of the trend line of linear regression to perform the trade-off optimization.
  • 10,000 iterations were considered per one simulation.
  • For verification purposes, optimization using at-Risk commercial program was also performed with genetic algorithm.
Three (3) variables were collected. “A” is the ERER, “B” is CLIR and “C” is VCOR. The following deterministic algebraic formula was set to calculate an optimum point of the trade-off model. At the specific gate, the cost impact of the VCOR and CLIR is estimated using ANN fitting functions. The engineering maturities at the next gate are improved if additional engineering resources and labor hours are committed. In this case, additional cost impacts due to engineering resource enhancement are spent and cost deduction on VCOR and CLIR are expected with the faster decrease of DECRIS values than a normal case. If a slope of VCOR and CLIR deduction is stiffer than a slope of ERER, the total cost impacts can be reduced. When the engineering is sufficiently matured, the DECRIS scores are lower and predict a lesser cost impact in procurement and construction. The cost of further enhancement of engineering resource will be a burden of the EPC contractors. The optimum point could be expected at the point that the slope of VCOR plus that of the CLIR is the same as for ERER. The trade-off concept can be described as below.
Total Cost Impact = CVCOR + CCLIR + CERE − CVCORD − CCLIRD
where, CVCOR (Cost of VCOR) = Total Equipment Cost (US$) × C (%); CCLIR (Cost of CLIR) = Total Construction Labor hours (MH) × B (%) × Construction MH cost (US$/MH); CERE (Cost of ERER) = Total Engineering Labor hours (MH) × A (%) × Engineering MH cost (US$/MH); CVCORD (VCOR Deduction) = Total Equipment Cost (US$) × VCOR Deduction due to Engineering Enhancement (%); CCLIRD (CLIR Deduction) = Total Construction Labor hours (MH) × Construction MH cost (US$/MH) × CLIR Deduction due to Engineering Enhancement (%)
The trade-off results are shown in Figure 7. The optimal point of total change order for Project E and G was calculated with genetic algorithm (50% crossover rate, 10% mutation rate, 1000 trials and 10,000 iterations per trial). The simulation was finished when maximum changes within 100 trials were less than 0.01%. Figure 8 describes the optimization progress through the number of trials. The total cost impacts of the Project E and G were 3.4 million dollars (at 1.76%) and 3.7 million dollars (at 1.26%), respectively.
To check the trade-off optimization in mega EPC projects, the authors selected one more project sample, the largest project amongst the 15 historical projects as judgment sampling and the same trade-off model was calculated. Figure 9 shows the probabilistic results of the set of simulations between 0 to 25% of ERER. The optimum point is around 15.5%. Using a genetic algorithm with 200 trials and 10,000 iterations per trial, the optimum point was calculated. Crossover rate and mutation rates were set 0.5 and 0.1 respectively. The optimum ERER was simulated as 15.47% with 57.03 million dollars total cost impact.
From this study, the authors had two major observations. First, the effect of ERER is larger when higher DECRIS scores at gate 1 (FEED verification) were assessed. Second, three case study results commonly describe that ERER up to an optimum point could reduce the uncertainty in the total cost impact. A 95% boundary (1.96 sigma) was narrowed from 70 million dollars (no ERER) to 40 million at the optimum trade-off point. It can be explained that sufficient engineering resources were essentially required to decrease cost impacts on the major portion of project costs in procurement and construction.

5. Application and Validation

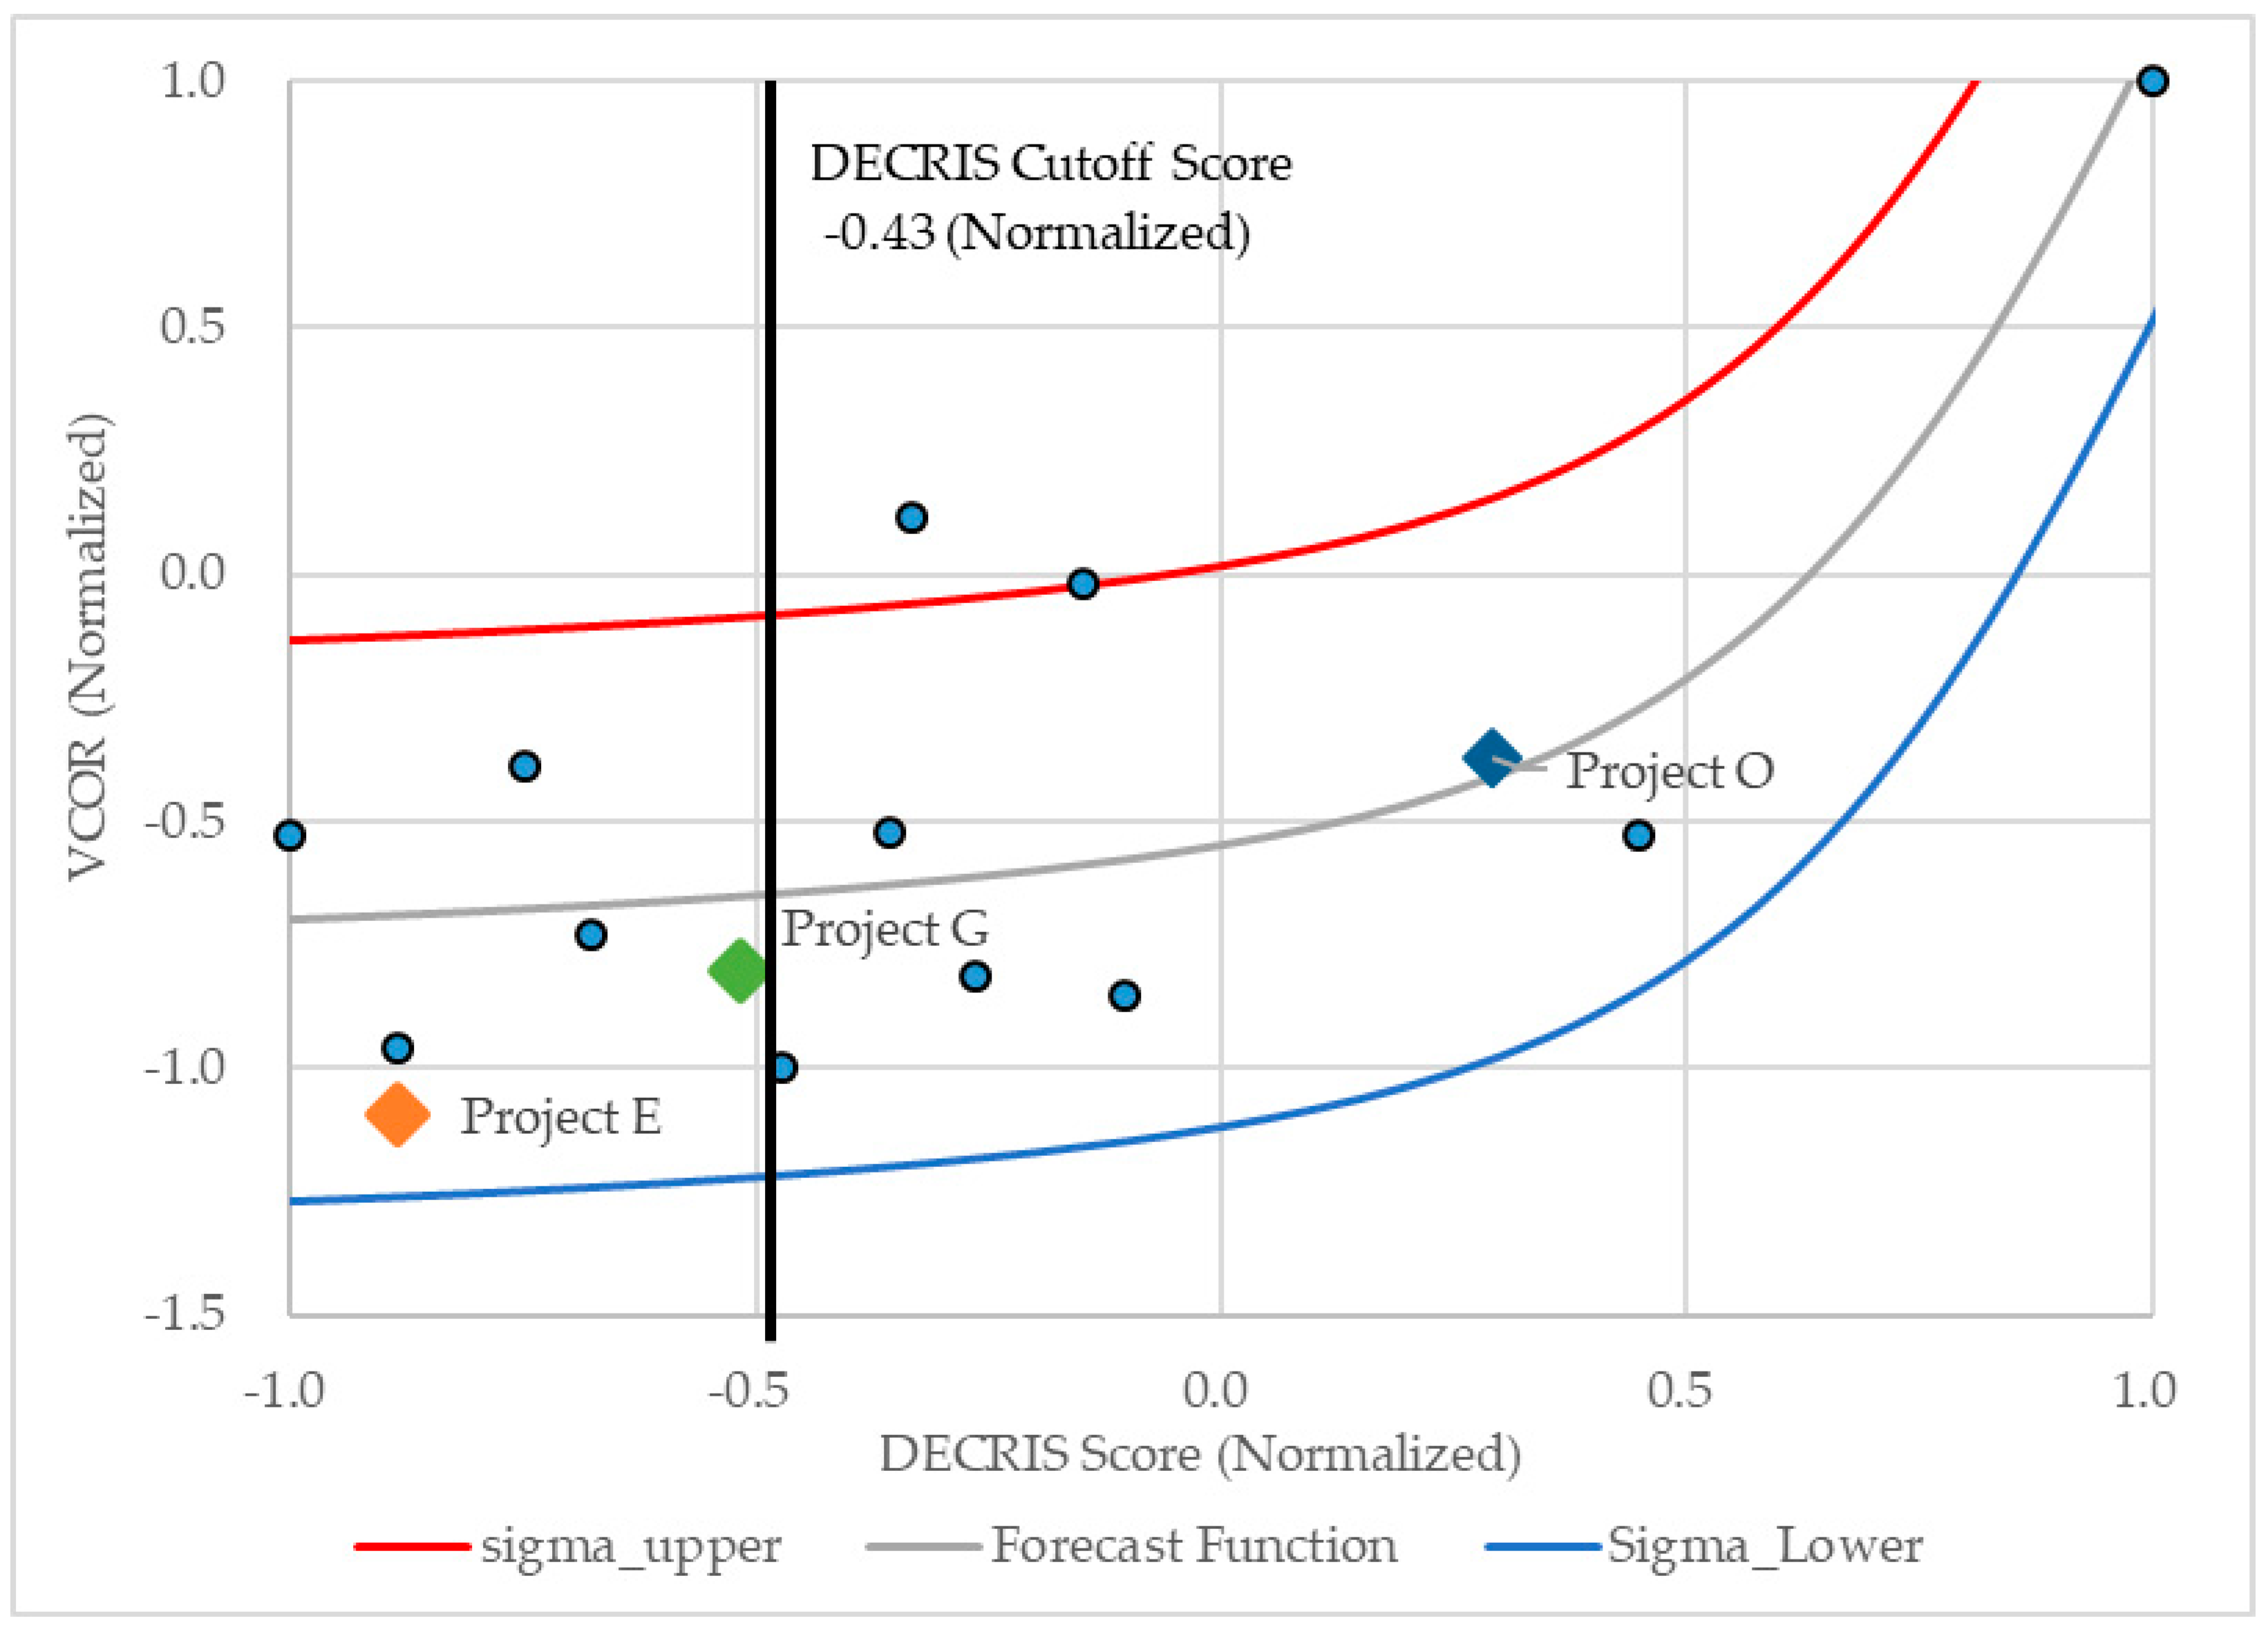
5.1. Validation of DECRIS Cut-Off Score

Kim et al. [34] explained that the DECRIS cut-off score (to ensure proper construction cost and schedule performance) could be successfully validated. In this study, DECRIS cut-off scores at each engineering key gate were rechecked to define a relationship between the project cost performance and the DECRIS cut-off score. The entire VCOR data on 15 historical projects were selected, and included of 324 items. This data was divided into two groups, variable 1 (VCOR of the equipment procured after the DECRIS cutoff score is achieved) and variable 2 (VCOR of the equipment procured before the DECRIS cutoff score is achieved). At FEED verification (gate 1), 324 items divided with 115 items in variable 1 and 209 items in variable 2. Through F-test of two samples for variances, P value was calculated as 0.0000054, much smaller than 0.05. This means that the variance of each sample set is unequal. In addition, the independent t-test result shows that the P-value of two-tail calculation is 0.016, which is also less than 0.05. Therefore, the two samples that were divided with the DECRIS cutoff score (810) statistically differ.
The same F-test and T-test were performed at gate 2, and the P-values of F-test and T-test were calculated as 0.0000063 and 0.038 respectively for the two-sample divided with DECRIS cutoff score (660). Therefore, DECRIS cutoff scores at gate 1 and gate 2 were validated.

5.2. Statistical Comparison of ANN and Regression Result

Through the ANN model, correlation functions between DECRIS score and CLIR at the five key engineering gates and another set of correlation functions between DECRIS score and VCOR at two key engineering gates was found. For validating the model performance, R2 values and mean error values of seven ANN correlation functions were compared with the same values of seven linear regression results.
As shown in Table 6, R2 of linear regression ranged between 0.425 and 0.739 with a mean value, 0.626. The values of ANN function are from 0.611 to 0.796 with a mean value, 0.739. R2 values of ANN functions are 20.2% higher than linear regressions on average. In addition, the mean error values at the seven gates using ANN fitting curve were 19.7% lower than linear regressions on average. The detailed mean error values are summarized in Table 6 below. With two kinds of statistical parameters, the researchers found that performance of non-linear regression using ANN is superior in comparison with the previous method.

6. Conclusions

6.1. Summaries and Contributions

The objective of this study was to expand the DECRIS prediction and mitigation model from construction performance to engineering, construction and procurement performances. Using procurement data for over 300 items in 15 historical EPC mega projects, correlations between the engineering maturities and actual project cost performances were determined. In addition, statistical differences of VCOR at the two groups divided by DECRIS cutoff score have proven using statistical tools.
The predictive function was enhanced with an ANN model, which resulted in 20.2% higher R2 values and 19.7% lower mean error values compared with linear regression. Through a case study using the ANN model, we found that predicted construction and procurement performances are well matched with the actual project cost performances in three test projects.
In order to provide the suggestion of DECRIS application to EPC contractors, a trade-off optimization using Monte-Carlo simulation was performed. The trade-off optimization result showed that the optimum point of engineering enhancement could be calculated and that the procurement and construction risks could be effectively mitigated using additional engineering resources to quickly mature detail engineering and design. The total cost impact could be reduced by about 40% based on the simulation results. The actual cost impacts of three historical projects were found to be within the 95% range of statistical significance.
The research indicates that the DECRIS model can properly predict the project procurement and construction risks; and by the use of enhanced engineering resources, the total cost impact on engineering, procurement and construction activities could be optimized. EPC contractors or clients can adapt the DECRIS model at the following project activities.
  • At the bidding session, proposal teams of EPC contractors can review the FEED engineering maturities using the DECRIS model and can estimate the project procurement and construction risks as cost units. Then, EPC contractors can decide whether the cost risks are to be taken or to be incorporated into their bid price as contingency or allowance.
  • On the project starting session, project management teams of EPC contractors can calculate the optimum range of engineering resources to minimize the cost impact risks during project execution.
  • Before major equipment procurement, purchasing teams of EPC contractors can predict the VCOR and decide when purchase orders of the major equipment could be placed. If the detailed engineering is pre-matured and the expected delivery of the equipment has some free float by comparing a “required on site” date, and then they can adjust the date of the purchase order, when feasible.
  • At the construction starting stage that is the most important decision of EPC execution, the EPC contractor’s decision maker can make a macroscopic review of the detailed engineering maturities and judge “go” or “no-go” decision for steel cutting. If construction cost risks caused by poor engineering maturities is not within the acceptable range, they can adjust the steel cutting and continue the engineering progress up to the DECRIS cut-off score.
  • During the early stage of EPC execution, clients can monitor the project risks using the DECRIS model. Engineering progress or material procurement status shows just the details of EPC activities; however, it is not easy to project the project cost or the schedule risks with only limited information. With the involvement of a DECRIS assessment team, they can properly monitor the engineering, procurement, and construction risks and request mitigation plans to EPC contractors for reducing DECRIS score over the threshold at each engineering key gate.

6.2. Discussions and Future Research

The authors have tried to make the DECRIS model applicable and sustainable. With an additional learning process of a neural network, a fitting function to predict the project procurement and construction performance could be continuously updated using the neural network whenever new input (project CLIR and VCOR result) comes. In addition, trade-off optimization of total cost impact is active values along with the engineering key gate and the DECRIS score measured by the assessment team.
The historical data of the current DECRIS model is limited to the EPC project results from the offshore mega-project in South Korea. Applicability of the DECRIS model to the other industrial fields or to the other nations, which have different company organizations or project characteristics, has not been established. The DECRIS model can be enhanced/developed for a variety of project types with additional study.

Author Contributions

The contributions of the authors are as follows: conceptualization, M.-H.K. and E.-B.L.; methodology, M.-H.K.; software, M.-H.K.; validation, M.-H.K. and E.-B.L.; formal analysis, M.-H.K.; writing—original draft preparation, M.-H.K.; writing—review and editing, M.-H.K. and E.-B.L.; visualization, M.-H.K.; supervision, E.-B.L.; project administration, E.-B.L.; and funding acquisition, E.-B.L.

Funding

The authors acknowledge that this research was sponsored by the Ministry of Trade Industry and Energy (MOTIE/KEIT) Korea through the Technology Innovation Program funding for: (1) Artificial Intelligence Big-data (AI-BD) Platform for Engineering Decision-support Systems (grant number = 20002806); and (2) Intelligent Project Management Information Systems (i-PMIS) for Engineering Projects (grant number = 10077606).

Acknowledgments

The authors of this study would like to thank Hyundai Heavy Industries Co for their informational support and technical cooperation. The authors would like to thank D. S. Alleman (a Ph.D. candidate in University of Colorado at Boulder) for their academic inputs and feedback on this research. The views expressed in this paper are solely those of the authors and do not represent those of any official organization.

Conflicts of Interest

The authors declare no conflict of interest. The funders had no role in the design of the study; in the collection, analyses, or interpretation of data; in the writing of the manuscript, or in the decision to publish the results.

Abbreviation

ANNArtificial Neural Network
CLIRConstruction Labor-hour Increase rate
DECRISDetailed Engineering Completion Rating Index System
EPCEngineering, Procurement and Construction
EREREngineering Resource Enhancement Rate
FEEDFront-End Engineering and Design
SSESum Squared Error
VCORVendor Change Order Rate

References

  1. Kim, M.-H.; Lee, E.-B.; Choi, H.-S. Detail Engineering Completion Rating Index System (DECRIS) for Optimal Initiation of Construction Works to Improve Contractors’ Schedule-Cost Performance for Offshore Oil and Gas EPC Projects. Sustainability 2018, 10, 2469. [Google Scholar] [CrossRef]
  2. Shibani, A.; Arumugam, K. Avoiding cost overruns in construction projects in India. J. Manag. Stud. 2015, 3, 192–202. [Google Scholar]
  3. Hsieh, T.-Y.; Lu, S.-T.; Wu, C.-H. Statistical analysis of causes for change orders in metropolitan public works. Int. J. Proj. Manag. 2004, 22, 679–686. [Google Scholar] [CrossRef]
  4. Ssegawa, J.; Mfolwe, K.M.; Makuke, B.; Kutua, B. Construction variations: A scourge or a necessity. In Proceedings of the First International Conference of CIB W107, Stellenbosch, South Africa, 15–17 November 2002. [Google Scholar]
  5. Kaming, P.F.; Olomolaiye, P.O.; Holt, G.D.; Harris, F.C. Factors influencing construction time and cost overruns on high-rise projects in Indonesia. Constr. Manag. Econ. 1997, 15, 83–94. [Google Scholar] [CrossRef]
  6. Frimpong, Y.; Oluwoye, J.; Crawford, L. Causes of delay and cost overruns in construction of groundwater projects in a developing countries; Ghana as a case study. Int. J. Proj. Manag. 2003, 21, 321–326. [Google Scholar] [CrossRef]
  7. Creedy, G.D.; Skitmore, M.; Wong, J.K. Evaluation of risk factors leading to cost overrun in delivery of highway construction projects. J. Constr. Eng. Manag. 2010, 136, 528–537. [Google Scholar] [CrossRef]
  8. Ibbs, C.W. Quantitative impacts of project change: Size issues. J. Constr. Eng. Manag. 1997, 123, 308–311. [Google Scholar] [CrossRef]
  9. Wang, T.; Tang, W.; Qi, D.; Shen, W.; Huang, M. Enhancing design management by partnering in delivery of international EPC projects: Evidence from Chinese construction companies. J. Constr. Eng. Manag. 2015, 142, 04015099. [Google Scholar] [CrossRef]
  10. Thomas, H.R.; Napolitan, C.L. Quantitative effects of construction changes on labor productivity. J. Constr. Eng. Manag. 1995, 121, 290–296. [Google Scholar] [CrossRef]
  11. Kumaraswamy, M.M.; Chan, D.W. Contributors to construction delays. Constr. Manag. Econ. 1998, 16, 17–29. [Google Scholar] [CrossRef]
  12. Long, N.D.; Ogunlana, S.; Quang, T.; Lam, K.C. Large construction projects in developing countries: A case study from Vietnam. Int. J. Proj. Manag. 2004, 22, 553–561. [Google Scholar] [CrossRef]
  13. Elhag, T.; Boussabaine, A.; Ballal, T. Critical determinants of construction tendering costs: Quantity surveyors’ standpoint. Int. J. Proj. Manag. 2005, 23, 538–545. [Google Scholar] [CrossRef]
  14. Acharya, N.K.; Im, H.-M.; Lee, Y.-D. Investigating delay factors in construction industry: A Korean perspective. Korean J. Constr. Eng. Manag. 2006, 7, 177–190. [Google Scholar]
  15. Arain, F.M.; Pheng, L.S. Knowledge-based decision support system for management of variation orders for institutional building projects. Autom. Constr. 2006, 15, 272–291. [Google Scholar] [CrossRef]
  16. Moura, H.M.P.; Teixeira, J.M.C.; Pires, B. Dealing with cost and time in the Portuguese construction industry. In Construction for Developement: Proceedings of the CIB World Building Congress; CIB WORLD BUILDING CONGRESS: Cape Town, South Africa, 2007. [Google Scholar]
  17. Harisaweni. The Framework for Minimizing Construction Time and Cost Overruns in Padang and Pekanbaru, Indonesia; Universiti Teknologi Malaysia: Johor Bahru, Malaysia, 2007. [Google Scholar]
  18. Oladapo, A. A quantitative assessment of the cost and time impact of variation orders on construction projects. J. Eng. Des. Technol. 2007, 5, 35–48. [Google Scholar] [CrossRef]
  19. Azhar, N.; Farooqui, R.U.; Ahmed, S.M. Cost overrun factors in construction industry of Pakistan. In Proceedings of the First International Conference on Construction in Developing Countries (ICCIDC–I) “Advancing and Integrating Construction Education, Research & Practice”, Karachi, Pakistan, 4–5 August 2008. [Google Scholar]
  20. Le-Hoai, L.; Dai Lee, Y.; Lee, J.Y. Delay and cost overruns in Vietnam large construction projects: A comparison with other selected countries. KSCE J. Civ. Eng. 2008, 12, 367–377. [Google Scholar] [CrossRef]
  21. Abd El-Razek, M.; Bassioni, H.; Mobarak, A. Causes of delay in building construction projects in Egypt. J. Constr. Eng. Manag. 2008, 134, 831–841. [Google Scholar] [CrossRef]
  22. Enshassi, A.; Arain, F.; Al-Raee, S. Causes of variation orders in construction projects in the Gaza Strip. J. Civ. Eng. Manag. 2010, 16, 540–551. [Google Scholar] [CrossRef]
  23. Ameh, O.J.; Soyingbe, A.A.; Odusami, K.T. Significant factors causing cost overruns in telecommunication projects in Nigeria. J. Constr. Dev. Ctries. 2010, 15, 49–67. [Google Scholar]
  24. Memon, A.H.; Rahman, I.A.; Abdullah, M.R.; Azis, A.A.A. Factors affecting construction cost in Mara large construction project: Perspective of project management consultant. Int. J. Sustain. Constr. Eng. Technol. 2011, 1, 41–54. [Google Scholar]
  25. Mohammad, N.; Ani, A.I.C.; Rakmat, R.A.O.K.; Yusof, M.A. Investigation on the causes of variation orders in the construction of building project–a study in the state of Selangor, Malaysia. J. Build. Perform. 2010, 1, 73–81. [Google Scholar]
  26. Rahman, I.A.; Memon, A.H.; Karim, A.T.A. Significant factors causing cost overruns in large construction projects in Malaysia. J. Appl. Sci. 2013, 13, 286–293. [Google Scholar]
  27. Halwatura, R.N.; Ranasinghe, N.P.N.P. Causes of variation orders in road construction projects in Sri Lanka. ISRN Constr. Eng. 2013, 2013, 381670. [Google Scholar] [CrossRef]
  28. Gunduz, M.; Maki, O.L. Assessing the risk perception of cost overrun through importance rating. Technol. Econ. Dev. Econ. 2018, 24, 1829–1844. [Google Scholar] [CrossRef]
  29. Yadeta, A.E. Causes of Variation Orders on Public Building Projects in Addis Ababa. Int. J. Eng. Res. Gen. Sci. 2016, 4, 242–250. [Google Scholar]
  30. Ogunsanmi, O. Effects of procurement related factors on construction project performance in Nigeria. Ethiop. J. Environ. Stud. Manag. 2013, 6, 215–222. [Google Scholar] [CrossRef]
  31. Baloi, D.; Price, A.D. Modelling global risk factors affecting construction cost performance. Int. J. Proj. Manag. 2003, 21, 261–269. [Google Scholar] [CrossRef]
  32. Iyer, K.C.; Jha, K.N. Factors affecting cost performance: Evidence from Indian construction projects. Int. J. Proj. Manag. 2005, 23, 283–295. [Google Scholar] [CrossRef]
  33. Dikmen, I.; Birgonul, M.T.; Han, S. Using fuzzy risk assessment to rate cost overrun risk in international construction projects. Int. J. Proj. Manag. 2007, 25, 494–505. [Google Scholar] [CrossRef]
  34. Kim, M.-H.; Lee, E.-B.; Choi, H.-S. A Forecast and Mitigation Model of Construction Performance by Assessing Detailed Engineering Maturity at Key Milestones for Offshore EPC Mega-Projects. Sustainability 2019, 11, 1256. [Google Scholar] [CrossRef]
  35. Yoo, W.S.; Yang, J.; Kang, S.; Lee, S. Development of a computerized risk management system for international NPP EPC projects. KSCE J. Civ. Eng. 2017, 21, 11–26. [Google Scholar] [CrossRef]
  36. Kim, G.-H.; Yoon, J.-E.; An, S.-H.; Cho, H.-H.; Kang, K.-I. Neural network model incorporating a genetic algorithm in estimating construction costs. Build. Environ. 2004, 39, 1333–1340. [Google Scholar] [CrossRef]
  37. Hagan, M.T.; Demuth, H.B.; Beale, M.H.; De Jesús, O. Neural Network Design; PWS Publising Co.: Boston, MA, USA, 1996; ISBN 0-534-94332-2. [Google Scholar]
  38. Burmaster, D.E.; Anderson, P.D. Principles of good practice for the use of Monte Carlo techniques in human health and ecological risk assessments. Risk Anal. 1994, 14, 477–481. [Google Scholar] [CrossRef] [PubMed]
Figure 1. Research process. DECRIS: detailed engineering completion rating index system, ANN: artificial neural network.
Energies 12 02295 g001
Figure 2. Multilayer perceptron.
Energies 12 02295 g002
Figure 3. ANN Model for DECRIS vs. VCOR or CLIR.
Energies 12 02295 g003
Figure 4. ANN fitting curve (DECRIS vs. VCOR) at gate 1 (left) and 2 (right).
Energies 12 02295 g004
Figure 5. ANN Fitting Curve (DECRIS vs. CLIR) at gate 1 to 5. (a) FEED verification (gate 1); (b) Equipment procurement (gate 2); (c) 60% modeling review (gate 3); (d) 90% modeling review (gate 4); (e) Steel cutting (gate 5).
Energies 12 02295 g005aEnergies 12 02295 g005b
Figure 6. Sample project cost performance prediction and actual VCOR result. VCOR: Vendor Change Order Rate.
Energies 12 02295 g006
Figure 7. Trade-off optimization in mitigating EPC cost risks on Project E (left) and Project G (right).
Energies 12 02295 g007
Figure 8. Optimization progress on Project E (left) and Project G (right).
Energies 12 02295 g008
Figure 9. Trade-off optimization for mitigating EPC cost risks on Project N.
Energies 12 02295 g009
Table 1. Researches specifying inaccurate cost estimate and design changes as main reason of cost impact.
AuthorsProject LocationInaccurate Cost EstimateDesign Changes *
Thomas and Napolitan [10]- O
Kaming et al. [5]IndonesiaOO
Kumaraswamy et al. [11]Hong Kong O
Ssegawa et al. [4]South Africa O
Frimpong et al. [6]GhanaOO
Hsieh et al. [3]Taipei O
Long at al [12]VietnamO
Elhag et al. [13]UK O
Acharya et al. [14]KoreaOO
Arain and Pheng [15]Singapore O
Moura et al. [16]Portugal O
Harisaweni [17]IndonesiaOO
Oladapo [18]Nigeria O
Azhar et al. [19]PakistanOO
Le-Hoai et al. [20]VietnamOO
El-Razek et al. [21]Egypt O
Enshassi et al. [22]Gaza StripOO
Ameh et al. [23]Nigeria O
Memon et al. [24]Malaysia O
Mohammad et al. [25]Malaysia O
Rahman et al. [26]MalaysiaOO
Halwatura and Ranasinghe [27]Sri LankaOO
Shibani and Arumugam [2]IndiaOO
Gunduz and Maki [28]-OO
Yadeta [29]EthiopiaOO
Ogunsanmi [30]Nigeria O
Creedy et al. [7]AustraliaOO
Baloi and Price [31]Developing CountriesOO
Iyer and Jha [32]IndiaOO
Table 2. DECRIS score and actual vendor change order rate (VCOR) on fifteen historical projects.
ProjectDECRIS Score
at Gate1
DECRIS Score
at Gate2
VCORSampling
A8176614.36%training
B87272522.22%training
C7856307.14%training
D82266512.17%training
E7906441.59%test
F81468713.48%training
G8066614.46%test
H8246683.94%training
I7906282.93%training
J7996415.18%training
K8086382.51%training
L7966308.55%training
M8136587.21%training
N8486967.15%training
O8417018.11%test
Table 3. SSE value for final five iterations during ANN learning.
RisksGateSSE
n-4n-3n-2n-2n *
CLIR#10.08610.08610.08610.08620.0862
#20.09670.09660.09650.09640.0963
#30.09650.09650.09640.09630.0963
#40.10250.1020.10150.10110.1006
#50.09230.09210.09190.09160.0914
VCOR#10.16260.16260.16260.16260.1626
#20.16330.16310.16300.16280.1626
* n is the number of iterations. CLIR: construction labor hours increase rate.
Table 4. Sample project brief for cast study. EPC: engineering, procurement, and construction. EPCIC: Engineering, Procurement, Construction, Installation and Commissioning. EPCI: Engineering, Procurement, Construction and Installation.
ProjectProject EProject GProject O
AreaSouth-East AsiaWest AfricaSouth-East Asia
Project typeFixed PlatformFloaterFloater
Project contract typeEPCEPCICEPCI
Project period35 months32 months39 months
DECRIS score (Gate 1)790806841
Actual VCOR1.59%4.46%8.11%
Table 5. Comparison of ANN and actual results on Projects G and E.
CLIRVCOR
GateGate 1Gate 2Gate 3Gate 4Gate 5Gate 1Gate 2
Project GANN Forecasting4.10%5.01%6.32%2.76%6.51%5.93%6.53%
Actual6.02%6.02%6.02%6.02%6.02%4.46%4.46%
Difference1.91%1.01%−0.30%3.26%−0.49%−1.47%−2.07%
Deviation0.42 σ0.22 σ−0.07 σ0.7 σ−0.11 σ−0.26 σ−0.37 σ
Project EANN Forecasting2.87%3.27%3.09%Outlier *4.57%5.55%5.34%
Actual1.61%1.61%1.61%Outlier1.61%1.59%1.59%
Difference−1.26%−1.66%−1.48%Outlier−2.96%−3.96%−3.75%
Deviation−0.27 σ−0.36 σ−0.32 σOutlier−0.65 σ−0.71 σ−0.67 σ
* On Project E, actual date of the gate 4, 90% modeling, are later than gate 5, work order.
Table 6. Statistical comparison of ANN and regression analysis for Project G.
CLIRVCOR
GateGate 1Gate 2Gate 3Gate 4Gate 5Gate 1Gate 2
R2 (Linear Regression)0.7390.7310.5940.6600.6860.4250.545
R2 (ANN)0.7710.7640.7600.7920.7960.6110.681
R2 Increase4.33%4.51%28.0%20.0%16.0%44.0%24.9%
Mean Error (Linear Regression)0.2420.2390.2860.2280.2380.3660.314
Mean Error (ANN)0.2030.2130.2020.1810.1840.2800.268
Mean Error Increase−16.1%−10.9%−29.4%−20.6%−22.7%−23.5%−14.6%

