Article

Exploring the Introduction of Plug-In Hybrid Flex-Fuel Vehicles in Ecuador

1
Escuela Superior Politécnica del Litoral, ESPOL, Facultad de Ingeniería en Ciencias de la Tierra, Campus Gustavo Galindo Km. 30.5 Vía Perimetral, P.O. Box 09-01-5863, Guayaquil, Ecuador
2
Instituto Dom Luiz, Faculdade de Ciências, Universidade de Lisboa, 1749-016 Lisbon, Portugal
*
Author to whom correspondence should be addressed.
Energies 2019, 12(12), 2244; https://doi.org/10.3390/en12122244
Submission received: 21 March 2019 / Revised: 27 May 2019 / Accepted: 8 June 2019 / Published: 12 June 2019
(This article belongs to the Special Issue Smart Mobility and Energy Transitions)

Abstract

:
In Europe, diesel combustion is being banned due to the NOx and PM2.5 emissions impact on air quality. The bus sector is being electrified and is increasing its use of alternative fuels, such as natural gas (in spark ignition engines) and bioethanol (in compression ignition engines), to reduce such harmful emissions. Even if a diesel bus is equipped with selective catalytic reduction (SCR), its NOx emissions are reduced its but produces more NH3 emissions that are PM2.5 precursors. In developing countries, the air quality is still barely monitored, however, the air quality issue is well known and is being addressed. Moreover, the Ecuadorian sugar cane industry is seeking ways to increase its ethanol production. This is the ideal framework to explore a new technology and energy source in developing economies such as Ecuador. This paper explores the impact of the Ecuadorian diesel bus fleet conversion to hybrid compression ignition ethanol (HEV-ED95), hybrid diesel and plug-in hybrid flex-fuel using electricity and internal combustion engine ICE-E20 and ICE-E100. The impacts are measured in terms of final energy consumption, criteria pollutant emissions (NH3, NOx, PM2.5) and 100 years global warming potential in a well-to-wheels framework. For the tank-to-wheels data the method follows the typical values of conversion efficiency from final to useful energy (cross checked with a microsimulation model), the Tier 2 European Environmental Agency approach combined with ethanol influence on compression ratio, lower heating value, criteria emissions taken from a literature review, and well-to-tank emission factors for electricity (10–58% thermal natural gas or coal powerplant contribution), for ethanol from banana industry wastes (ED95, E20 and E100), gasoline and diesel from US databases. A discussion on whether sugarcane biorefineries are necessary is highlighted in the results. All input parameters have an uncertainty range between a minimum and a maximum and the probability for each is giving by a uniform distribution.

Graphical Abstract

1. Introduction

The transport sector contribution to crude oil depletion, climate change, and air quality degradation is worrisome. For example, according to the International Energy Agency (IEA) in 2016 the transport sector was accountable for 25% of greenhouse gas (GHG) emissions. According to the same source, it also consumes 98% of crude oil-based fuels. Additionally, road transport represents 40% of NOx emissions, and is the main source of PM2.5 in cities.
It is very likely that the focus on reducing NOx emissions cause an increase in NH3 slip aggravated by catalyst ageing [1,2]. Ammonia is an inorganic compound that, in presence of acid gases, can generate atmospheric ammonium aerosol salts [3]. Knowledge of NH3 tailpipe emissions is therefore important.
The road transportation sector in Ecuador is characterized by its use of fossil fuels as the main source of energy. According to INEC (the Spanish acronym for Instituto Nacional de Estadísticas y Censos—National Institute of Statistics and Census in English), the transportation sector emitted 18.5 million tons of GHG, which correspond to 42% of the emissions from all sectors [4]. Due to the accelerated urbanization in the main Ecuadorian cities, local governments have been forced to implement new transport systems such as bus rapid transit (BRT). The most economical way to commute in Ecuador is by bus, which is also the most used means of transport. Counting regional, urban, public and international buses, there are approximately 23,400 buses where 98% (23,056) correspond to diesel-based buses and the other 2% (380) are gasoline-based buses, mainly used by schools. Recently, a bus line in Guayaquil purchased 20 electric buses for its daily operations, becoming the second South American city to have an electric bus fleet.
In 2010, the Eco País E5 Pilot Program (E5 = 5% ethanol content in gasoline type rated above 85 octanes) started in the cities of Guayaquil and Durán. Initially, the government aimed to increase the ethanol blend with gasoline from 5 to 15% by 2016. However, in order to reach this target, 400 million litres (L) of ethanol are needed per year. The sugarcane cultivated area must add 66 thousand hectares to the existing 79 thousand hectares. By 2015, this program covered 86 percent of demand for extra fuel in the Guayas Province. Ecuadorian sugarcane and alcohol producers were able to produce 80 million L of ethanol. Ecuador’s three major sugarcane companies produce most of this ethanol: Valdez with Codana, San Carlos with Soderal and Coazucar with Producargo.
Banana industry wastes were explored as another potential source of ethanol [5,6]. These studies claim that Ecuador has the potential to produce an additional 118–266 L ethanol/ha on a yearly basis from this feedstock. Considering the roughly 150,000 ha in banana production, this would mean an extra 40 million L of ethanol a year.
Ecuador is also experiencing a change in electric power generation, moving heavily to renewables [7]. By 2014, Ecuador had an installed capacity of 5299 MW, with a thermal-based capacity share of 21%, an internal combustion engine share of 25%, a hydro-based capacity of 42%, and the remainder from biomass, solar and wind-based capacity. The government forecasted that this capacity would be approximately 7800 MW by 2018, with the main contribution coming from large-scale hydro. In 2017 the mix was 56.1% renewables and 43.9% non-renewables with distribution losses of 12.1%.
By May 2017, Ecuador presented its National Plan of Energy Efficiency (PLANEE, for its acronym in Spanish) whose objective was to use electricity in an efficient way and to include the promotion of new technologies in the transportation sector [8,9]. To the best of our knowledge, there is no information regarding possible pollutants mitigation achievements in the mass transportation sector in Ecuador.
This paper aims at exploring different bus concept options and their impacts on final energy consumption, air quality and 100 years global warming impact. The bus concepts are: compression ignition running on diesel (ICEVCI), hybrid with compression ignition engine running on diesel HEVdiesel, hybrid with compression ignition engine running on ethanol-based fuel for diesel engines (ED95) HEVED95, and plug-in hybrid with flex-fuel spark ignition engine, running on ethanol E20 and E100 PHEVflex.
The impacts are measured in terms of final energy consumption, NOx, PM2.5 and NH3 (converted to PM2.5 equivalent), and CO2eq through different replacement scenarios. NH3 is already included in standards by imposing a limit of 10 ppm, for SCR equipped buses and based on Equation (3) from Stelwagen and Ligterink [2], this would probably mean 46 mg/km NH3 slip. Ecuador follows European emission standards so we are going to stick with European emission models for the tank-to wheels (TTW) data.

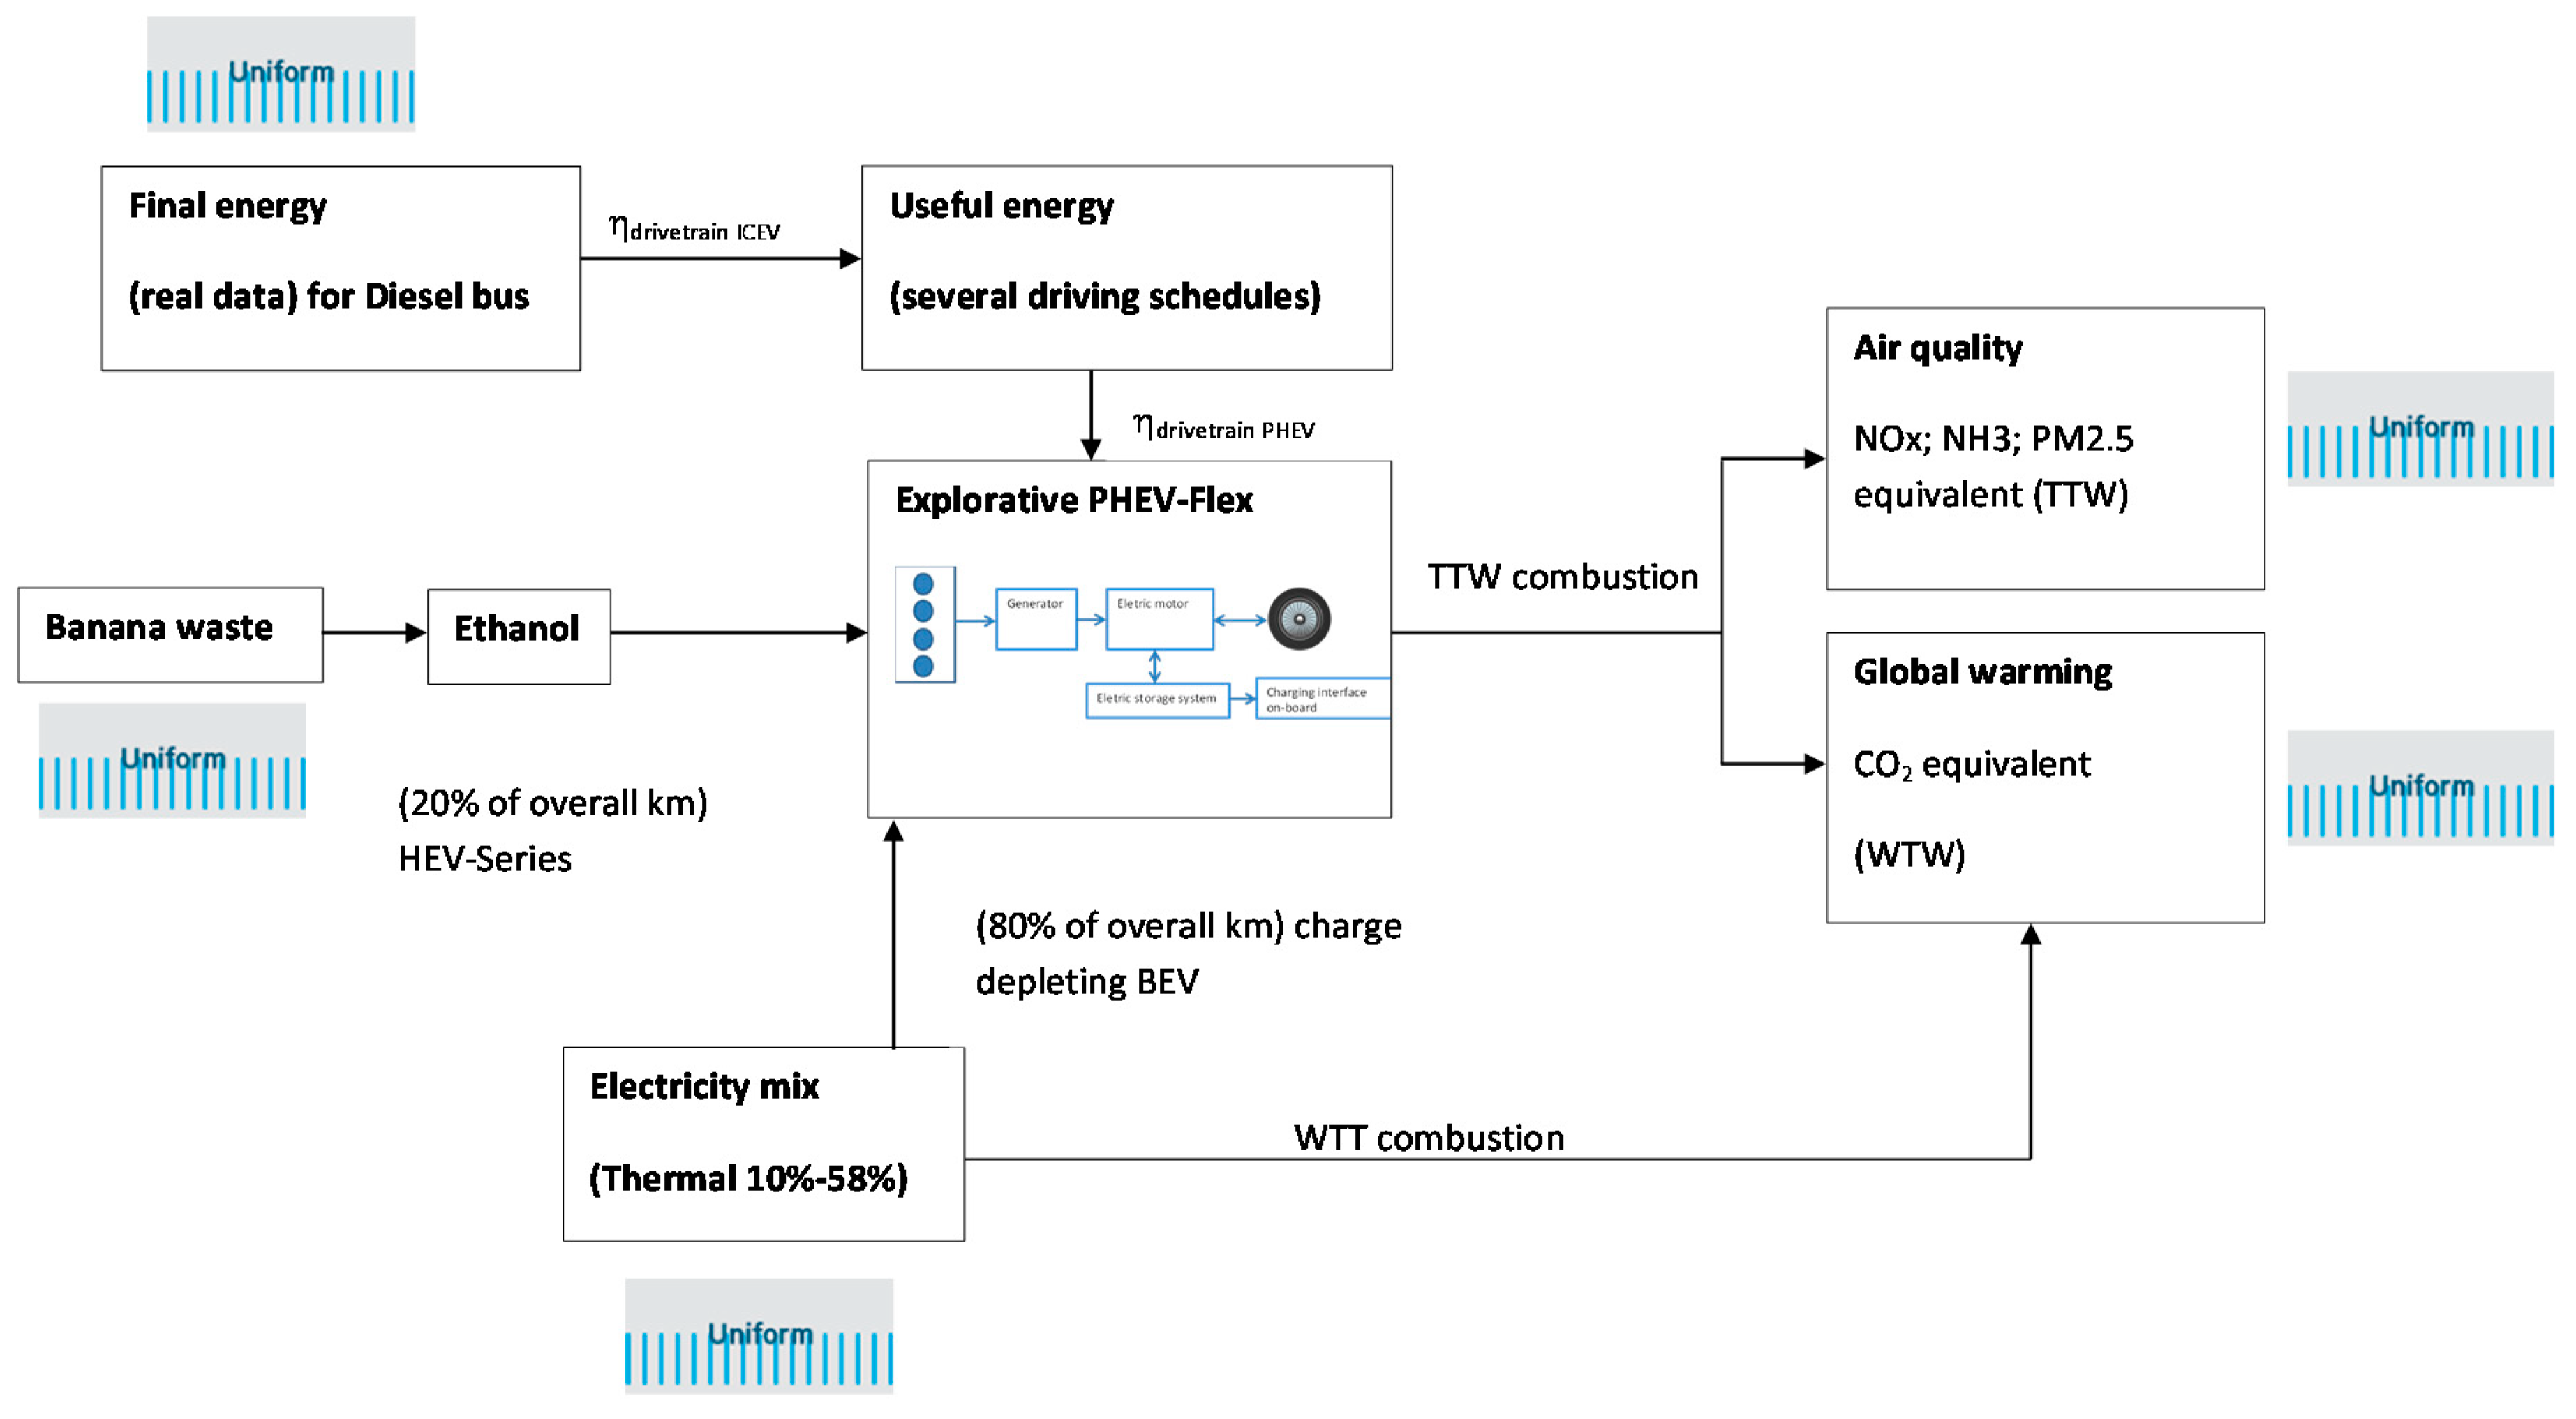
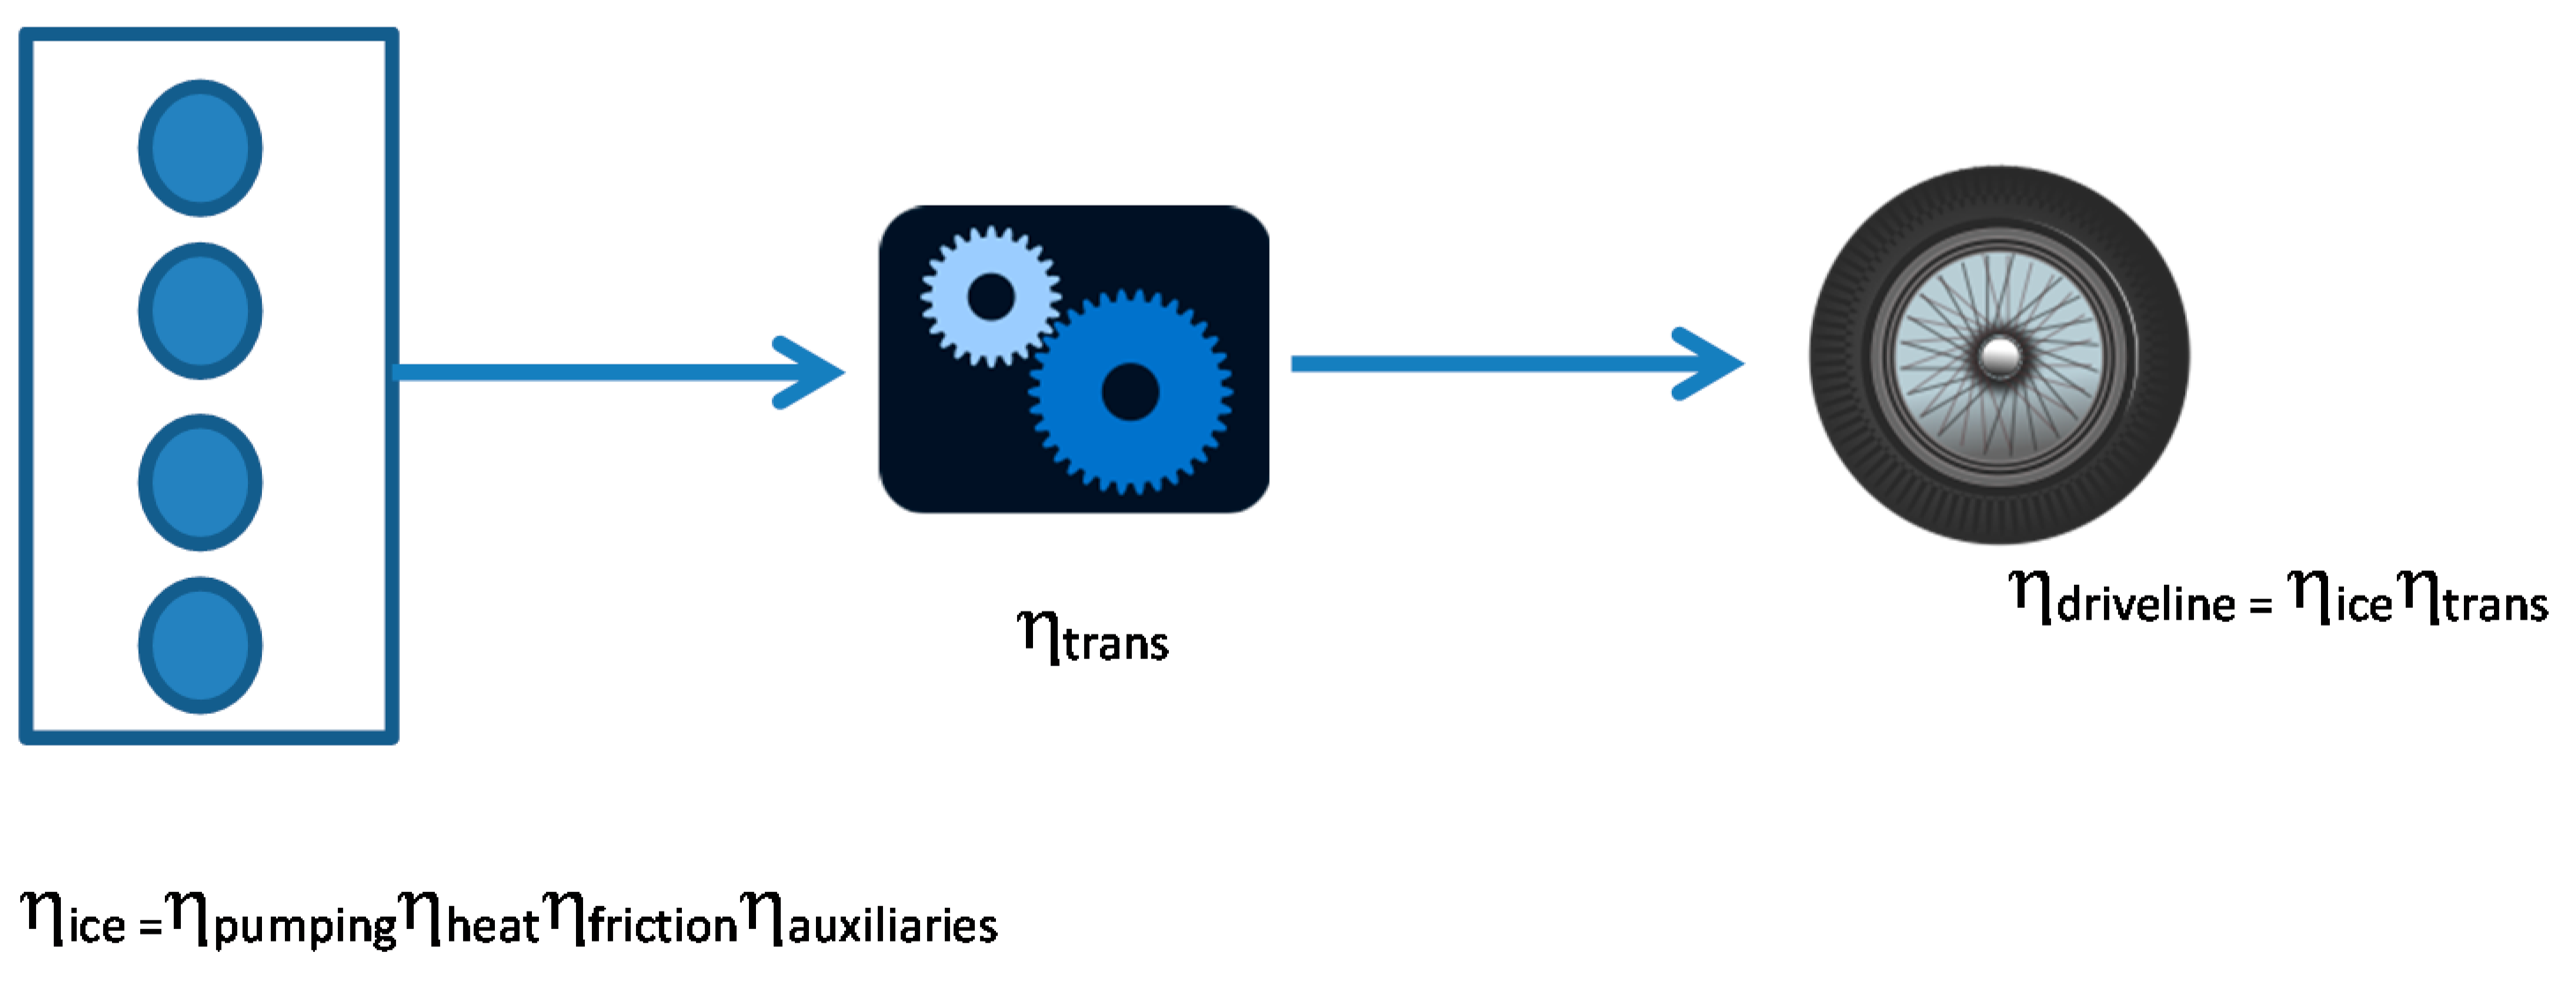
2. Materials and Methods

The aim of this study is to compare the final energy consumption and local environmental impacts of six scenarios considering different fuels (diesel, ethanol blend and electricity) and bus technologies (compression ignition, spark ignition and plug-in hybrid flex-fuel) (Table 1). The scope of the study is the so called well-to-wheels (WTW) analysis. It is divided into tank-to-wheels (TTW) according to the matrix of powertrains/fuels in Table 1 and well-to-tank (WTT) according to Table 2.
The general formulation for final energy consumption (TTW) of a fleet with several powertrain technologies and vehicle ages (equivalent to standard) is:
E C = y m   ( l i q u i d / g a s   f u e l ) ( N V m , y , z × M m , y , z × F I y , z , m L H V m ρ m ) + y ( N V e l e c t r i c , y , z × M y , e l e c t r i c × F I y , z , e l e c t r i c 3.6 )
where EC stands for the final energy consumption of the fleet (MJ/year); Mm,y,z (km/year), is the average annual distance driven per vehicle of category y, standard z, and fuel m, excluding electric miles; Nm,y,z is the number of vehicles of category y, standard z, and fuel m; FIy,z,m is the average fuel intensity of the vehicle (L/km or kWh/km); and LHVm is the lower heating value of the liquid/gas fuel m.
The general model for emission, Ex, where x stands for each pollutant, NOx, PM2.5 or NH3 is:
E x = m ( l i q u i d / g a s   f u e l s ) y z ( N V m , y , z × M m , y , z × E F x , m , y , z )
where, EFx,y,z (g/km), is the specific emission factor of pollutant x, for vehicle category y, emission standard z and liquid fuel m; Ex is the emissions of pollutant x.
Ammonia is a colourless gas present in the atmosphere, which reacts with acid gases (H2SO4, HNO3, etc.) to produce atmospheric ammonium aerosol salts and particles such as ammonium sulfate ([NH4]2SO4), ammonium bisulphate (NH4HSO4), ammonium nitrate (NH4NO3), and ammonium chloride (NH4Cl). Knowledge of NH3 tailpipe emissions is therefore important. To convert NH3 tailpipe emissions into PM2.5 equivalent the following chemical reactions will be considered:
2NH3(gas) + H2SO4 ⇔ (NH4)2SO4 (particle)

NH3(gas) + HNO3 (gas) ⇔ NH4NO3 (particle)

NH3(gas) + HCl (gas) ⇔ NH4Cl (particle)
The mass to mass ratio of particle to NH3 for these equations is, respectively, 132.14/34.062, 80.043/17.031 and 53.491/17.031. An average factor of 3.91 is assumed for the PM2.5 equivalent. Fuel consumption and emissions for new technologies will be compared with the baseline scenario to analyse their future insertion.
Our approach is based on real data from conventional bus fuel intensity to which we then applied final to useful energy efficiencies to get our exploratory flex-fuel engine PHEV final ethanol and electricity consumption. This is a simplified approach and was “cross checked” against the ADVISOR microsimulation model [10,11,12] for ICEV, HEV and PHEV over a specific driving cycle (driving schedule). Figure 1 presents the procedure schematic.
As a “cross check” of the final to useful energy conversion efficiencies, the driving cycle was the World Harmonized Heavy Duty cycle [14], with 40 km/h average speed, 20 km distance and 12 stop-&-go situations.

2.1. Reference Scenario-100% ICEV Diesel Fleet

The inventory of the number of bus vehicles in Ecuador and the fuel used was obtained from the Transport Statistics Yearbook published by the Instituto Nacional de Estadísticas y Censos (INEC) [4]. The fuel consumption, Equation (1) and emissions, Equation (2), were estimated using a bottom-up approach and following the guidelines of the Tier 2 methodology of the European Environmental Agency (EEA) (previous CORINAIR) [15].
The average annual distance was calculated using a 2016 database provided by the Ecuador Municipal Transit Authority of Guayaquil. The database presents odometer readings from several buses during inspection. Most of the buses have more than one inspection during the year, thus, two mileage records. Hence, the subtraction of two mileages recorded at different times divided by the time between both records gives us the average daily distance travelled. The other inputs needed for fuel consumption and emission calculations such as fuel intensity and emissions factors are shown in Table 7. The overall efficiency is a product of the powertrain components efficiency.
The efficiency of the diesel bus engine (ICEV buses, Figure 2) was assumed to be 38–47% [16,17], including heat losses, friction, pumping work and auxiliaries like lights, power steering, brake booster and a sound system, etc. The transmission efficiency is typically 70–80% [18]. Therefore, we assume 26.6–37.6% for the diesel driveline (TTW efficiency) diesel density is 0.845 kg/L, with an LHV of 42 MJ/kg [19]. These values are to be “cross checked” using microsimulation software. Diesel engine technology will be referred to as compression ignition (CI) and spark ignition (SI) engine technology.

2.2. Hypothetical Scenarios HEV with ED95

It is already possible to run a CI engine with ethanol by using a higher compression ratio and additives. This HEV-ED95 runs on 95% ethanol and 5% additives to help self-ignition. A bus with this technology is commercialized by Scania. The OmniLink ethanol hybrid bus is based on series hybrid technology (S-HEV) (Figure 3 and Table 3).
For real measurements, we only found a VTT Technical Research Centre of Finland Ltd. study where an HEV-ED95 bus was measured using a chassis dynamometer roller bench., recording 16.5 MJ/km for empty bus fuel consumption, 5.58 g/km for NOx, and 0.037 g/km for PM [20]. This data is available through the LIPASTO traffic emissions database. In terms of TTW efficiency, and according to this report, the real measured fuel consumption was 0.73 L/km.

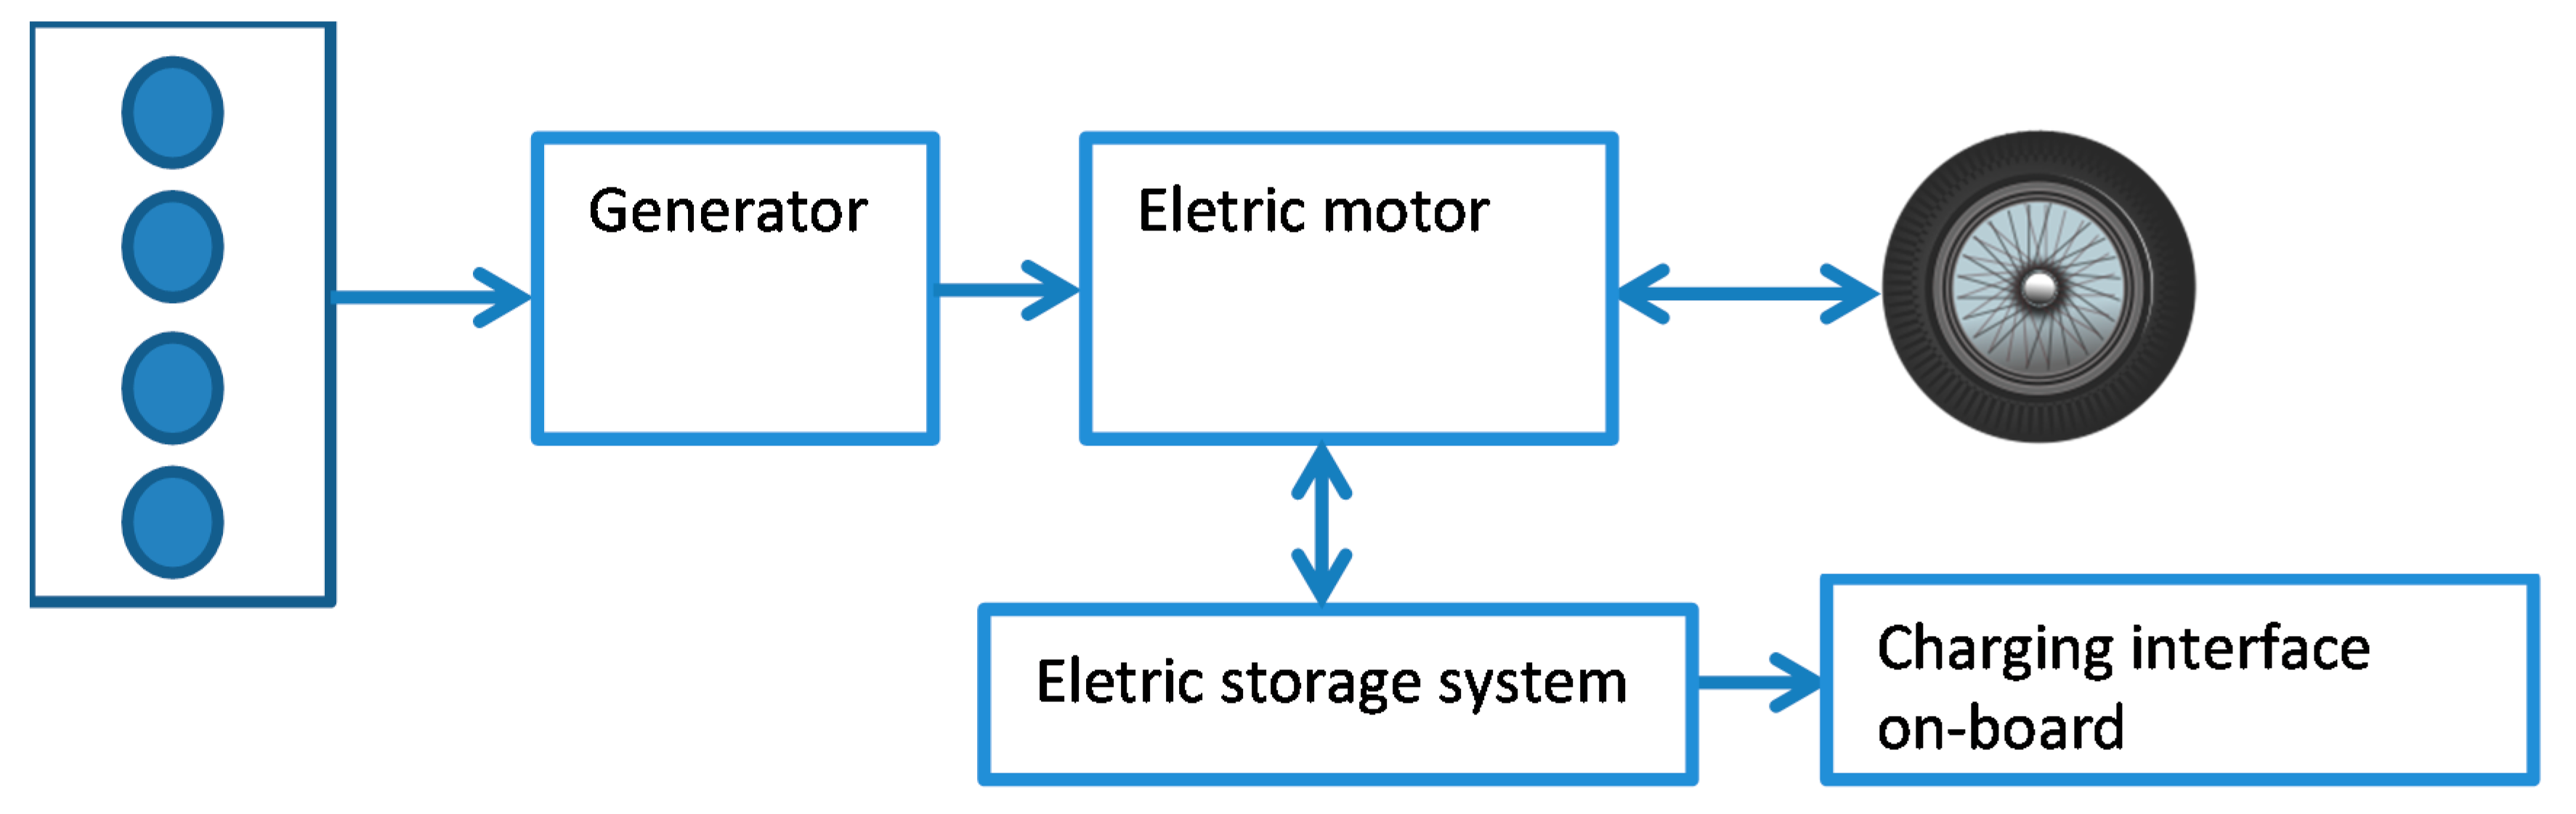
2.3. Hypothetical Scenarios PHEV with E20 and E100
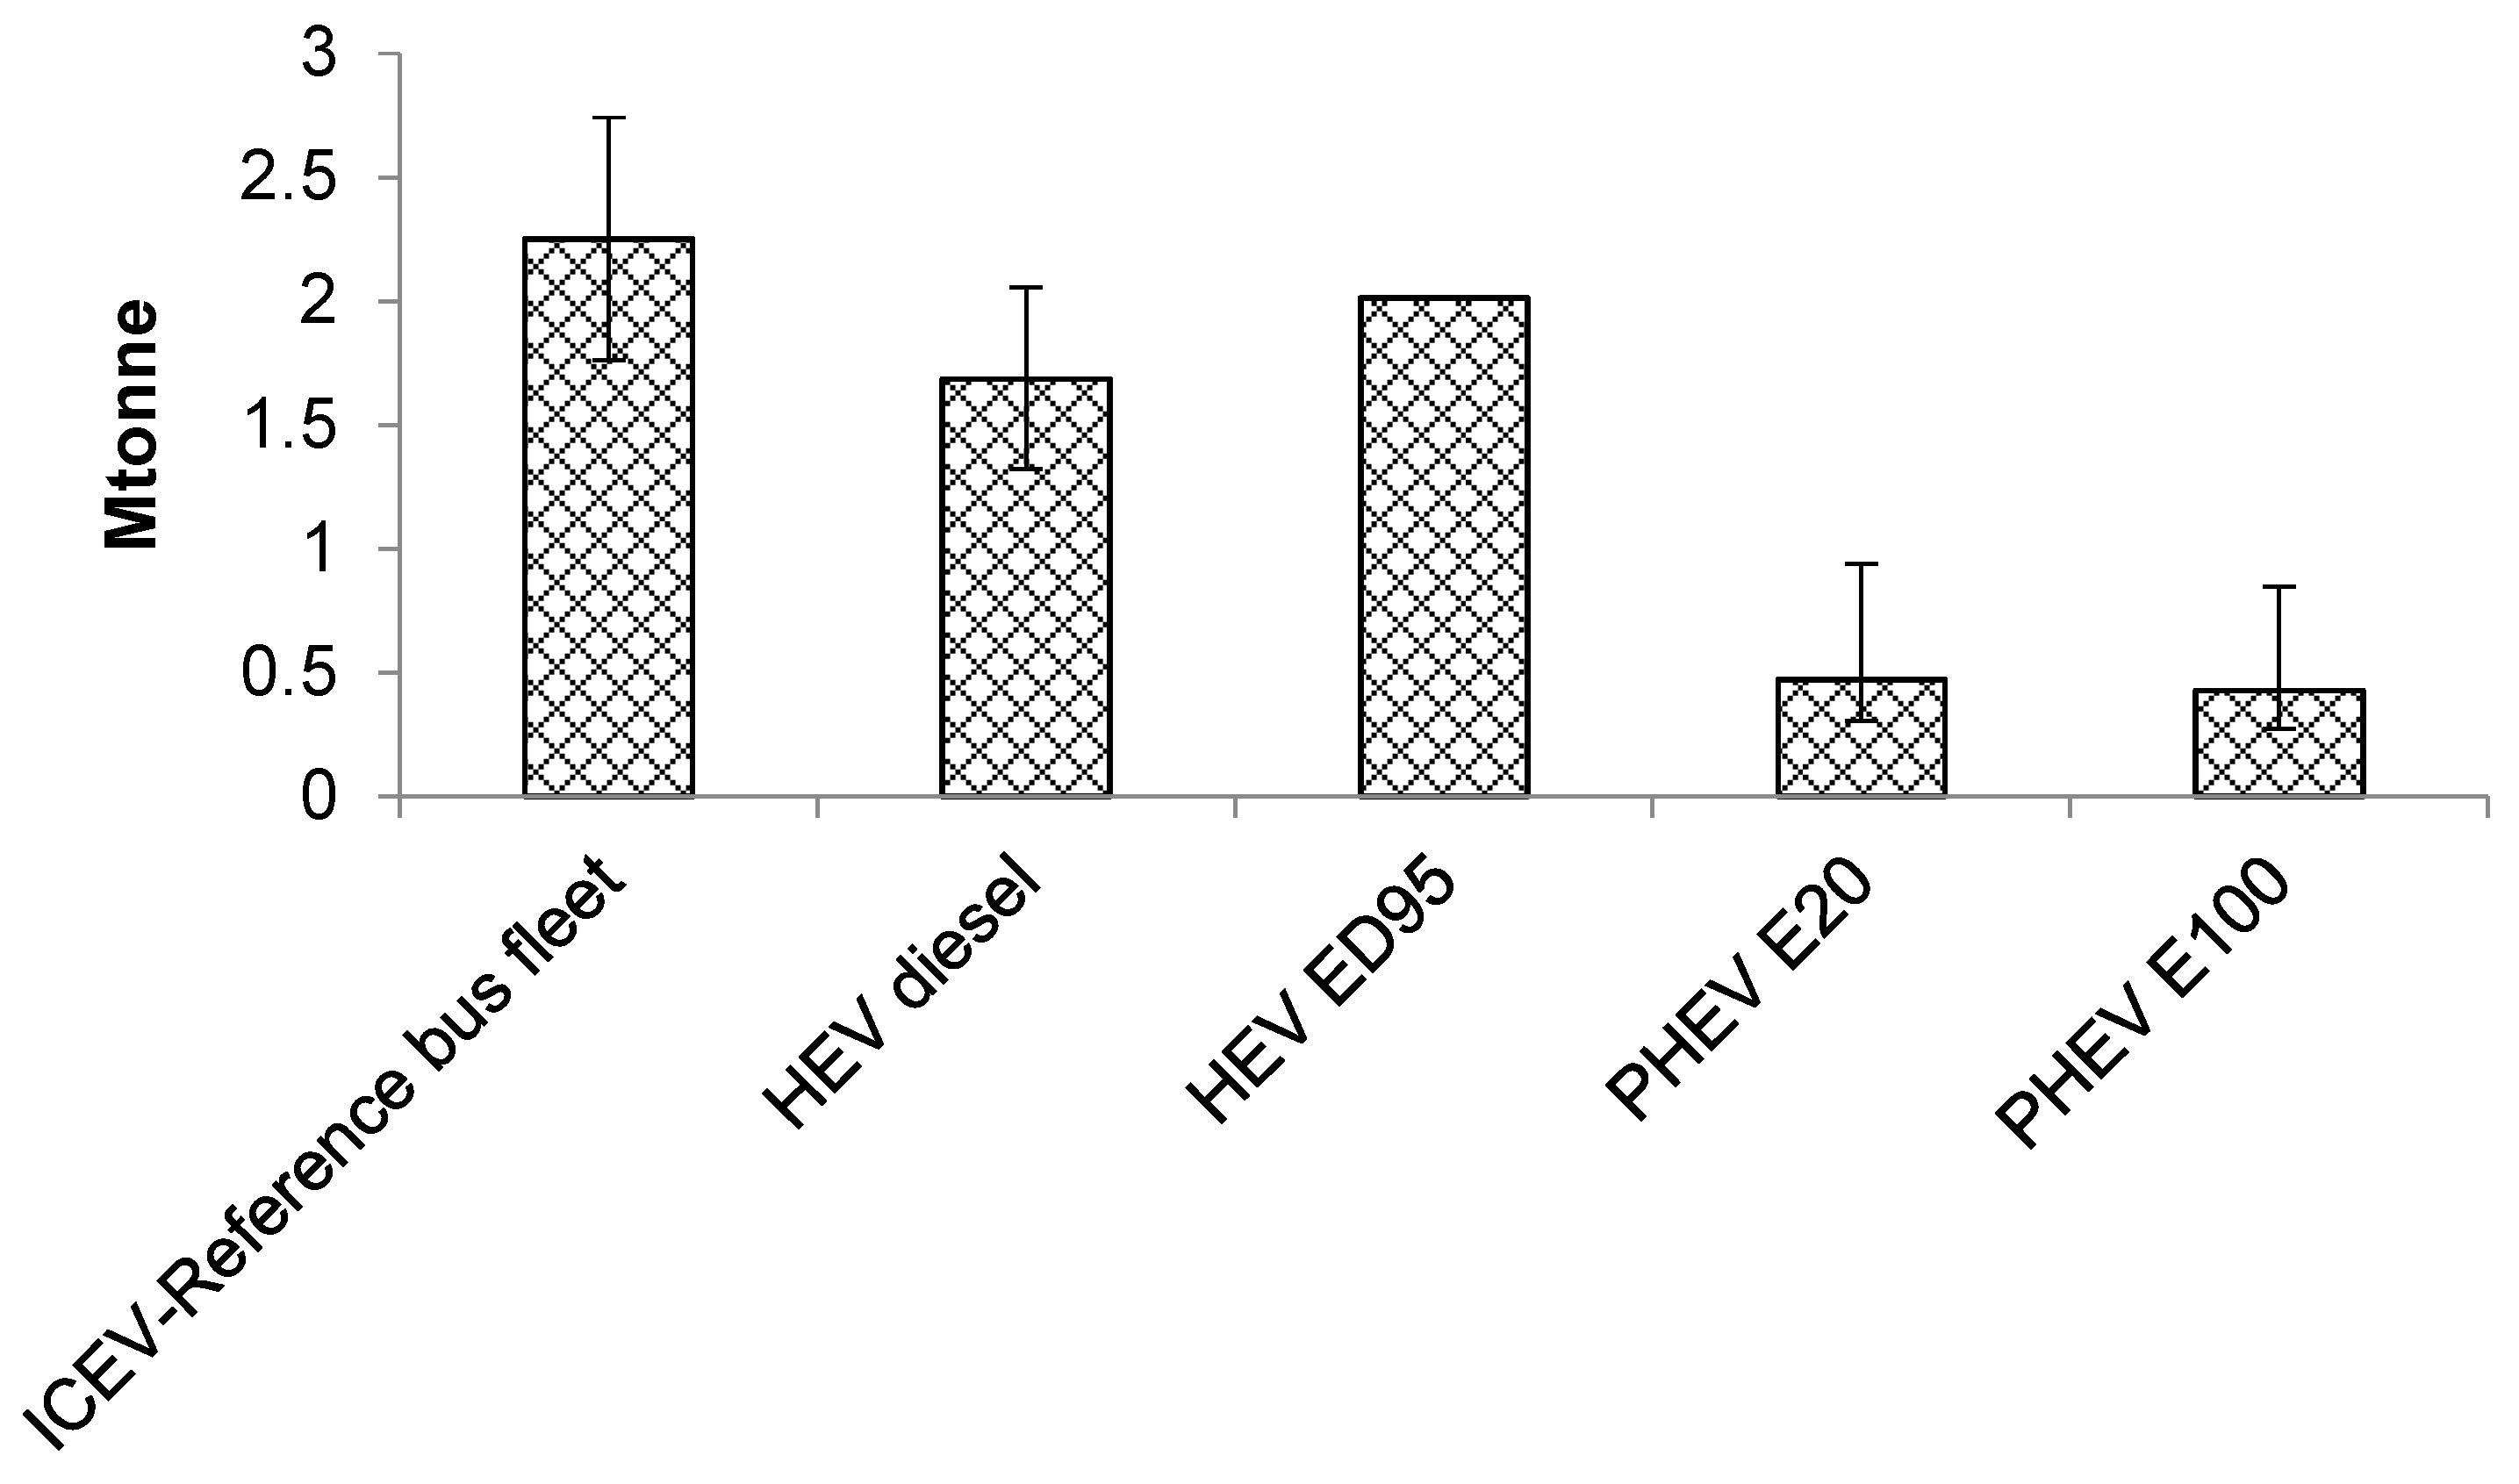
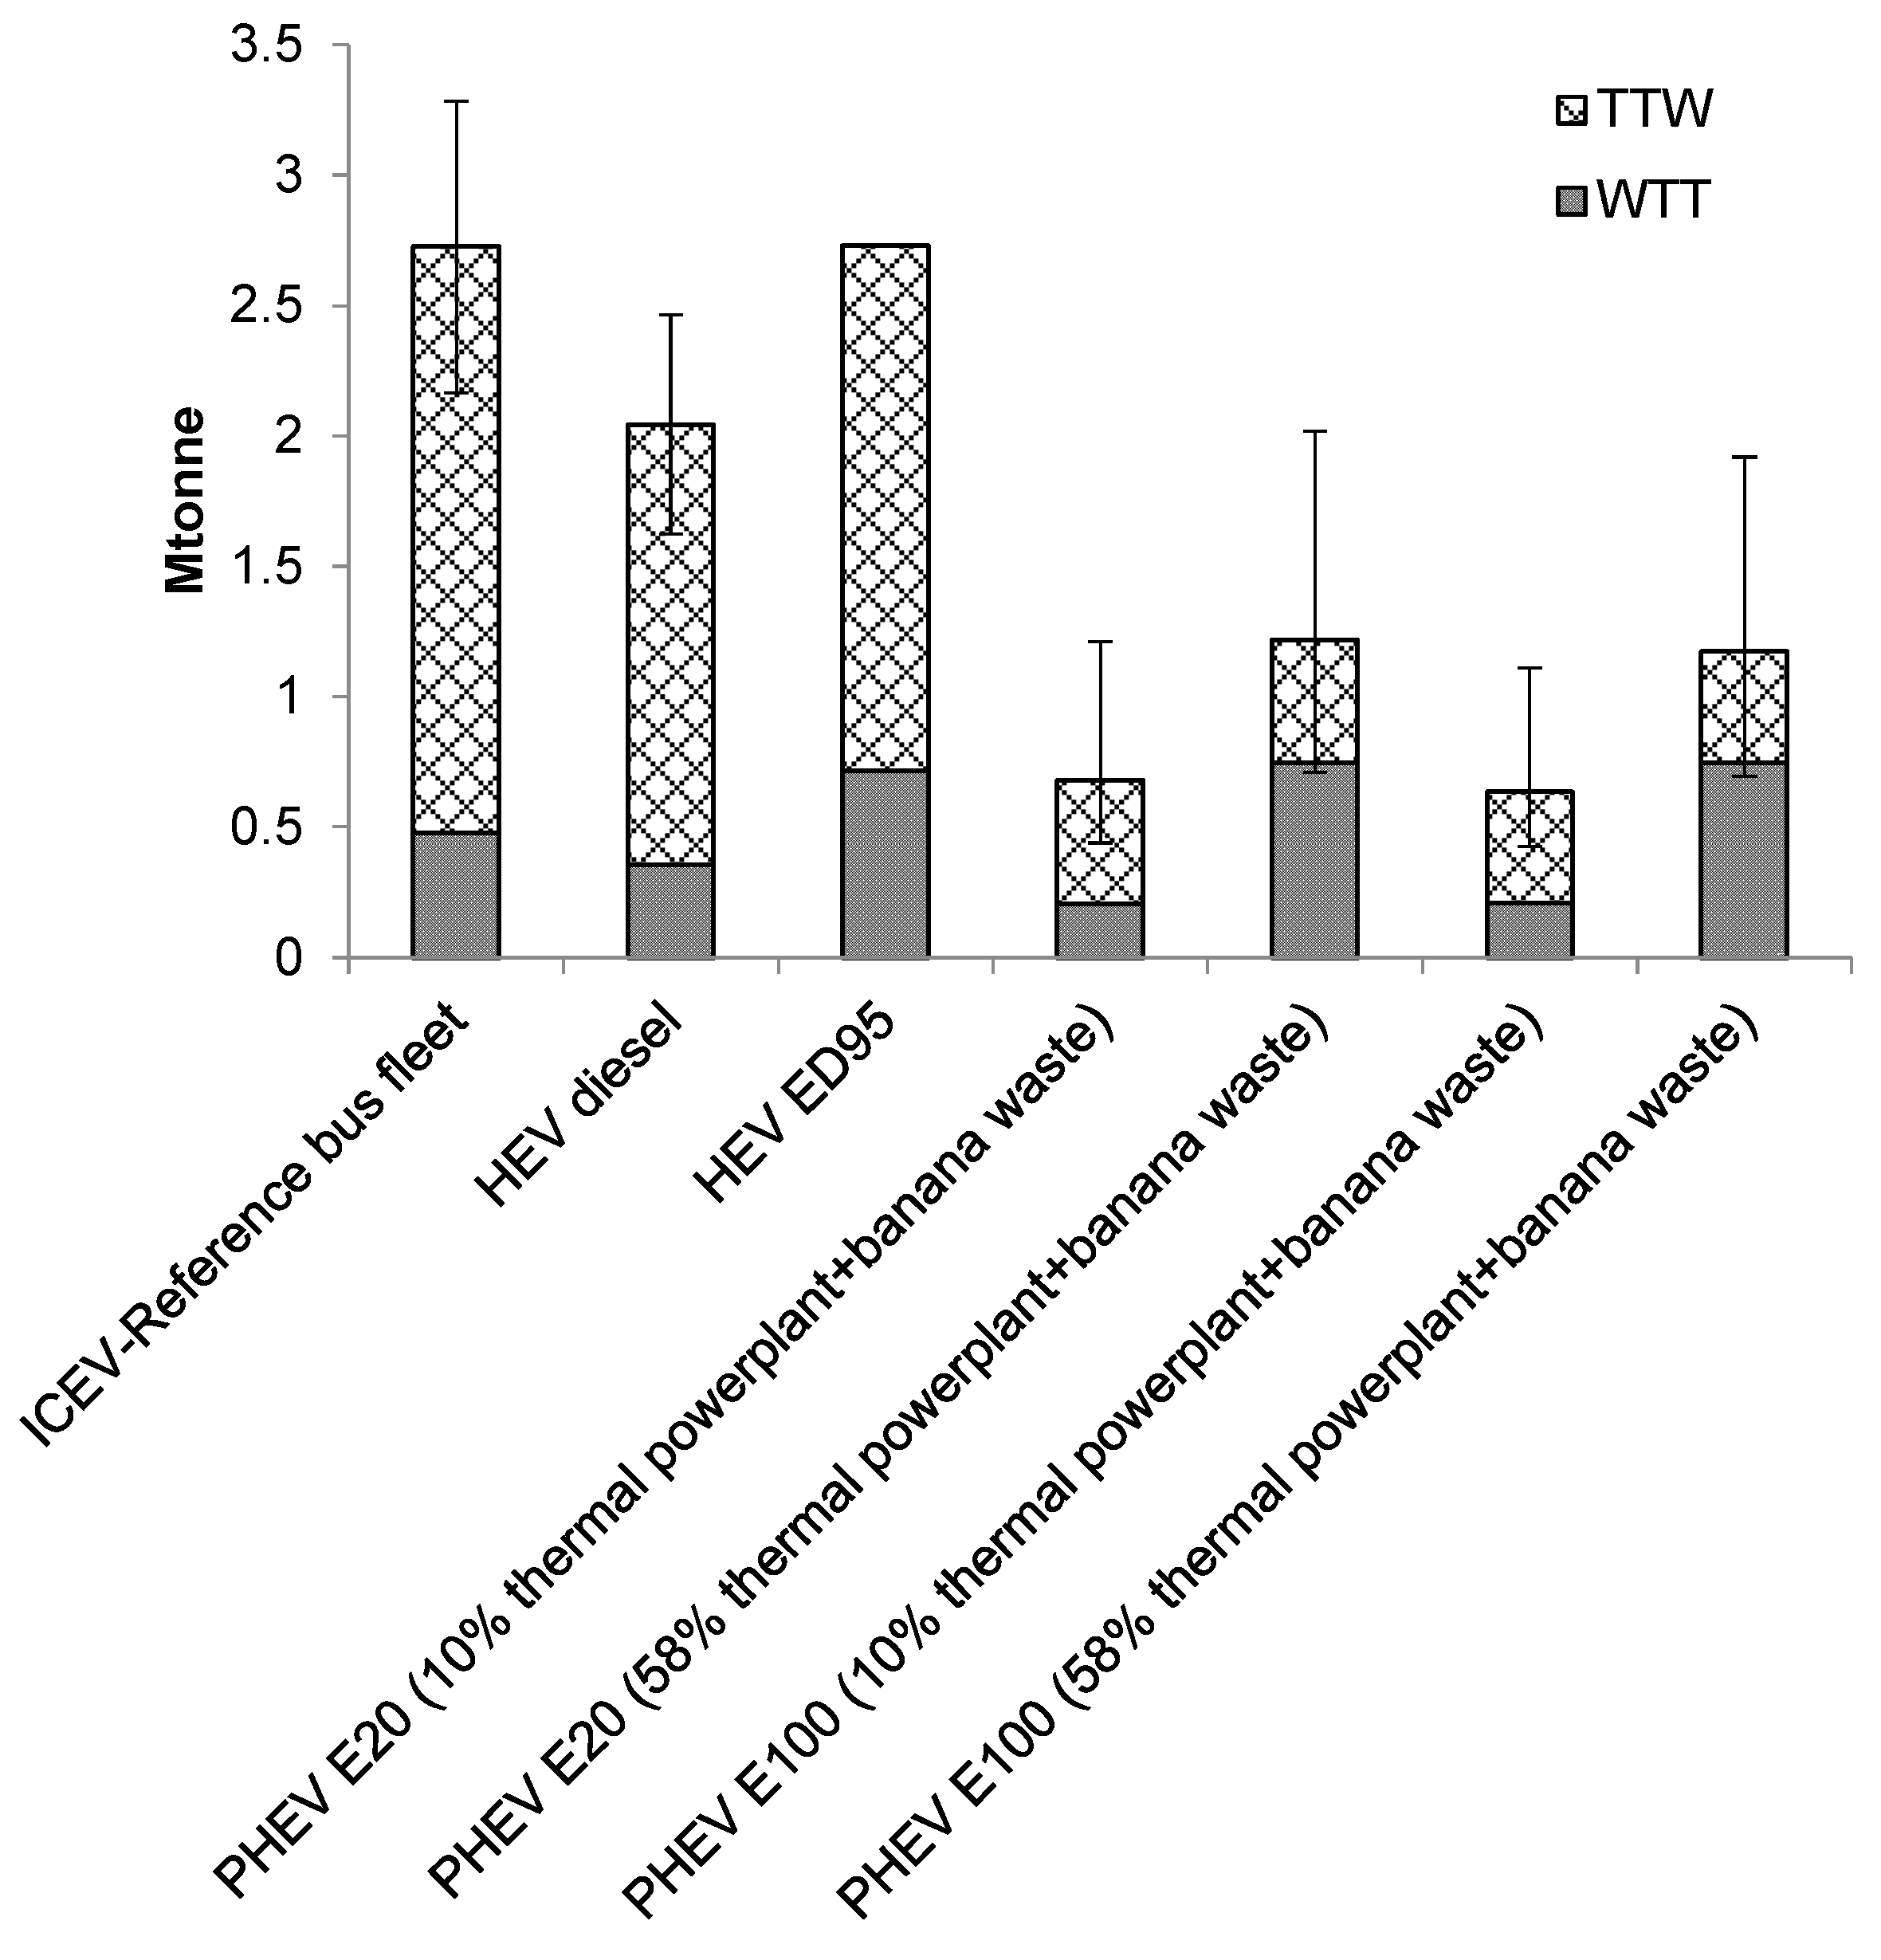
The flex-fuel SI engine in a hybrid powertrain is already being addressed by passenger car manufacturers, e.g., Toyota presented an initial design of the first hybrid flexible-fuel vehicle (Hybrid FFV), in Sao Paulo, Brazil. The efficiency gains could be up to 6% with ethanol blends [21]. However, this technology is not yet available on buses. This is the reason our study is exploratory and we do not have experimental data on this new hypothetical bus type. Additionally, since there are several energy management strategies for the PHEV powertrain, the flex emission data must be estimated based on emission factors. Our reasoning is therefore supported by efficiency logic and available literature data.
Usually, the efficiency of a diesel engine is 30% higher than ηice of SI engines [22]. Hence the TTW efficiency for the hypothetical flex-fuel driveline is (26.6/1.3 * 1.06_37.6/1.3 * 1.06; or 21.7_30.7%). The driveline efficiency ratio between SI and CI is near the 85% found in literature [23].
The lower heating value of the blend is calculated by Equation (4), where “blend” stands for ethanol %, e.g., E20 would be 20%:
LHVblend = (1 − blend/100) * LHVgasoline + blend/100 * LHVethanol
The density follows the same procedure. Ethanol density is 794 kg/m3 and LHV 28.8 MJ/kg [19]. Gasoline 755 kg/m3 and 44 MJ/kg [19]. The effect ethanol blends have on CO2 emissions is direct from combustion mass balance (assuming C8H18 for gasoline), the equation is:
ECO2 [kg/kgfuel] = (1 − blend/100) × 3.0877 + blend/100 × 1.9130 = 0.0117 * blend + 3.0877
For the effect of ethanol blend on NOx, NH3 and PM2.5 criteria pollutant emissions were reviewed in the literature. Due to the lack of data for buses, the effect was taken from experimental studies on light-duty vehicles by Suarez-Bertoa et al. [24] which indicate absolute emission factors for E5, E10, E15, E75, and E85. Hubbard, Anderson and Wallington [25] indicated relative differences between E0 and E10, E20, E30, E40, E55, and E80. Additionally Table 4 [26] includes several studies for finding E10 and E20 impacts on NOx and PM2.5 and shows an average impact of −11.8% and −17.1% for NOx; and −6% and −36% for PM, respectively. From Table 4, we assume E80 impacts to be the same as for E100, or −49% for NOx and 153% for NH3. In our study we assume the correction factors, stated in Table 5. The tendency for NH3 to increase with ethanol blends and NOx and PM2.5 decrease is noteworthy.
Criteria pollutants were obtained using Table 4 correction factors applied to Tier 2 emission factors for SI technology buses.
The new plug-in hybrid bus technology was based on the plug-in 7900 Electric Hybrid bus from Volvo (Table 6 and Figure 4). The internal combustion engine was replaced by a SI engine with the same rated power. Efficiency reasoning is used. In the literature [27,28,29,30]. The TTW efficiency varies but typically we may find 70–85% for a pure electric vehicle, BEV, depending on the driving cycle.
According to the all-electric efficiency range assumed, 80% of the mileage is electric and 20% flex-fuel, were assumed to have an efficiency of 70–85% for all-electric and 21.7–30.7% for flex-fuel. That is, we assume a charge depleting energy management strategy and the 80% of km are like a pure electric vehicle, depleting the battery while the internal combustion engine is switched-off. The remaining km are like a hybrid internal combustion engine vehicle. The range is necessary because in our approach we want to cover most possible real driving situations and not just a specific driving cycle. The overall inputs to Equations (1) and (2) are given in Table 7.
The uncertainty sources were identified: fuel consumption/drivetrain efficiencies; and criteria emission factors. A maximum and minimum range in inputs were reflected in the model outcomes. CO2 emissions as a function of the fuel consumption had the same uncertainty levels. Regarding NH3, the minimum PM2.5 equivalency factor was 3.16 and the maximum 4.70. This gave us a PM2.5 equivalent range. For NOx and PM2.5, the literature report usual uncertainties of 16% on average [31], without fuel correction and using the Tier 3 approach from EEA. A Tier 2 approach such as ours should have higher levels of uncertainty. Nevertheless, we stick to 16%, to at least have a range of emissions. Uncertainty in the model input parameters is considered and is reflected in the results, by a uniform distribution (a minimum and maximum range).

3. Results

Runs of the ADVISOR microsimulation model [10,11,12], for one specific driving cycle with 12 stops, were crosschecked with reviewed literature data on powertrain component efficiency (Figure 5). The fuel converter (ICE) efficiency of a conventional diesel bus, an HEV and a PHEV (with charge depleting management strategy) buses are depicted, as well as their powertrain component efficiencies.
As we can see in Figure 5, the efficiencies fall in the ranges reviewed so we stick with our simplified approach for the analysis of WTW. Considering the macro approach of fuel intensity and powertrain efficiency ratio seems to be suitable and intends to cover as much of driving situations as possible. Considering this macro approach, the final energy consumption is depicted in Table 8 for the reference and alternative scenarios.
So, if Ecuador decides to hybridize the bus fleet on ED95, it will have to produce roughly 1326 million litres of ethanol a year to satisfy the final energy demand. This means that the potential ethanol production either from sugarcane (80 million L a year) or banana industry waste (40 million L a year) will not be enough. If the option is to move forward with a PHEVflex fleet, the ethanol demand is much lower, 41–281 million L, which could not yet be met by banana industry waste. Ethanol production through the sugarcane industry could meet around 42% of the maximum ethanol production required for this case. The sugarcane industry must, in any case, provide most of the required fuel.
In terms of air quality, of course, the PHEV scenarios would be better because it was assumed that 80% of the mileage is all-electric, with zero local emissions. Nevertheless, the introduction of ethanol could increase NH3 particle precursors and if we look to the equivalent PM2.5 in Table 9, the hybrid ED95 fleet could be the worst-case scenario. The higher NH3 emissions in HEVdiesel are due to the SCR NOx exhaust aftertreatment system and the reduced PM2.5 to the particle filters.
The TTW CO2 emissions are a part of a future study on a WTW approach and are depicted in Figure 6. It is worth noting that there is considerable mitigation of TTW CO2 emissions, around 78–80% when conventional fleet buses are replaced with plug-in hybrid buses It is interesting to note that the HEVED95 has higher TTW CO2 emissions due to the higher fuel consumption phenomena that overlap the lower CO2 formation per litre of ethanol burned in comparison to diesel fuel (1.5 kgCO2/L ethanol versus 2.7 kgCO2/L diesel). The diesel-ethanol HEV-ED95 technology energy consumption and CO2 emissions were derived from the LIPASTO database on-road measurements and have no reported uncertainty.
Additionally, observing the WTW values in Figure 7, clearly electrification of the bus fleet has more positive impacts on the air quality and global warming impact than moving to a bioeconomy bus fleet system. However, the flexibility of supplying a PHEV with three possible energy sources instead of just electricity is noteworthy.

4. Discussion

These are preliminary results due to the limitations/constraints of the work. One main limitation is the lack of hybrid CI diesel and hybrid ED95 bus data in the EEA emission inventory guidebook [15]; therefore the bus technologies are not compared using the same database. The ethanol effect on PM2.5 in flex-fuel engines is also barely reported in the literature and should be explored experimentally. NH3 emissions need more experimental data because are they are particle precursors and are already limited in new European and American regulations to 10 ppm in exhaust gases. These values are barely seen in the reviewed literature. However, the uncertainty given in the results could partially reflect these weaknesses and be taken as a preliminary result indicating whether Ecuador should pursue a bioeconomy.
In this context, the food vs. biofuels discussion will be intensified. However, Ecuador may choose to continue producing sugar and its derivatives and producing ethanol through surplus bagasse, in a biorefinery context. For example, Cavalett et al. [36] and and Corrêa do Lago et al. [37] definitely demonstrate the positive sugarcane conditions for the development of second generation ethanol (non-food competitive) at least at the Brazilian context. Again the flexibility of a vehicle running on three possible fuels is highlighted. Moving heavily to renewables in the future and having only 10% of electricity provided by thermal powerplants (coal or natural gas) should be addressed.

5. Conclusions

As an explorative study this paper shows some novel concepts in terms of a new possible PHEV bus powertrain and a conversion factor for NH3 emissions to PM2.5 equivalent emissions. The simplified model of using a range of fuel intensities and typical final to useful energy conversion efficiencies was crosschecked with a microsimulation model that allows the efficiency data variation at various speeds and acceleration/deceleration rates.
The metrics calculated in this research were, final energy consumption (by source), air quality related pollutants, NOx (as NO2 equivalent), NH3, and PM2.5 equivalent, and 100 years global warming potential (as CO2eq).
If the diesel energy source is to be kept, hybrid technology is a good option for a replacement, reducing fuel consumption and TTW CO2 emissions by 25%, but, despite the particle filters, only reducing 7% the PM2.5 equivalent emissions.
If an ethanol energy source is seen as the future, and energy supply flexibility to the bus is a priority, the best option to reduce emissions will be the plug-in hybrid flex-fuel vehicles. However, Ecuador still needs more investment in ethanol production. The current capacity (considering ethanol production through sugarcane and banana waste) will not be enough to satisfy the demand and it will be imperative to boost ethanol production through larger extensions of cultivated area and sugarcane biorefineries. These new technologies will provide a 55–77% CO2eq reduction, even if coal is used in the thermal powerplant, on a heavy renewables penetration scenario.
A future study on sugarcane biorefineries sustainability in Ecuador will bring the carbon footprint (well-to-wheels) benefits of such PHEV flex-fuel bus system to the discussion.

Author Contributions

D.A. as Ph.D. student did the calculations, C.S. as supervisor guided the calculations and contributed to the writing.

Funding

This research received no external funding.

Acknowledgments

Publication supported by FCT- project UID/GEO/50019/2019—Instituto Dom Luiz. This paper is also supported by Escuela Superior Politécnica del Litoral (ESPOL). We wish to acknowledge the Municipal Transit Agency of Guayaquil (ATM) for providing us the information to develop this study. Thanks to the English proofreading service that helped with the English quality of the manuscript.

Conflicts of Interest

The authors declare no conflict of interest.

References

  1. Oliveira, M.L.M.; Silva, C.M.; Moreno-Tost, R.; Farias, T.L.; Jiménez-López, A.; Rodríguez-Castellón, E. Modelling of NOx emission factors from heavy and light-duty vehicles equipped with advanced aftertreatment systems. Energy Convers. Manag. 2011, 52, 2945–2951. [Google Scholar] [CrossRef]
  2. Stelwagen, U.; Ligterink, N. NH3 Emission Factors for Road Transport; TNO: Ultrecht, The Netherlands, 2015. [Google Scholar]
  3. Baek, B.H.; Koziel, J.A.; Aneja, V.P. A preliminary review of gas-to-particle conversion monitoring and modelling efforts in the USA. Int. J. Glob. Environ. Issues 2015. [Google Scholar] [CrossRef]
  4. INEC. Anuario de Transporte 2015. Inf. Anu. 2015, 46. [Google Scholar]
  5. Graefe, S.; Dufour, D.; Giraldo, A.; Muñoz, L.A.; Mora, P.; Solís, H.; Gonzalez, A. Energy and carbon footprints of ethanol production using banana and cooking banana discard: A case study from Costa Rica and Ecuador. Biomass Bioenergy 2011, 35, 2640–2649. [Google Scholar] [CrossRef]
  6. Guerrero, A.B.; Muñoz, E. Life cycle assessment of second generation ethanol derived from banana agricultural waste: Environmental impacts and energy balance. J. Clean. Prod. 2018. [Google Scholar] [CrossRef]
  7. Ponce-Jara, M.A.; Castro, M.; Pelaez-Samaniego, M.R.; Espinoza-Abad, J.L.; Ruiz, E. Electricity sector in Ecuador: An overview of the 2007–2017 decade. Energy Policy 2018. [Google Scholar] [CrossRef]
  8. MEER. Plan Nacional De Eficiencia Energética—PLANEE (Versión 2016–2035); Ministerio de Eletricidade y Energia Renovable: Quito, Ecuador, 2017. [Google Scholar]
  9. Samaniego, M.P.; Abad, J.E. Eficiencia energética y ahorro de energía en el Ecuador; Universidad Cuenca: Cuenca, Ecuador, 2015. [Google Scholar]
  10. Ribau, J.P.; Silva, C.M.; Sousa, J.M.C. Plug-in hybrid vehicle powertrain design optimization: Energy consumption and cost. Lect. Notes Electr. Eng. 2013, 191, 595–613. [Google Scholar]
  11. Silva, C.M.; Farias, T.L.; Frey, H.C.; Rouphail, N.M. Evaluation of numerical models for simulation of real-world hot-stabilized fuel consumption and emissions of gasoline light-duty vehicles. Transp. Res. Part D Transp. Environ. 2006, 11, 377–385. [Google Scholar] [CrossRef]
  12. Markel, T.; Brooker, A.; Hendricks, T.; Johnson, V.; Kelly, K.; Krämer, B.; O’Keefe, M.; Sprik, S.; Wipke, K. ADVISOR: A systems analysis tool for advanced vehicle modeling. J. Power Sources 2002, 110, 255–266. [Google Scholar] [CrossRef]
  13. Cooney, G.; Jamieson, M.; Marriott, J.; Bergerson, J.; Brandt, A.; Skone, T.J. Updating the U.S. life cycle GHG petroleum baseline to 2014 with projections to 2040 using open-source engineering-based models. Environ. Sci. Technol. 2017. [Google Scholar] [CrossRef]
  14. DieselNet. 2014. Available online: www.dieselnet.com (accessed on 1 May 2019).
  15. Kouridis, C.; Samaras, C.; Hassel, D.; Mellios, G.; Mccrae, I.; Hickman, J.; Zierock, H.; Keller, M.; Rexeis, M.; Andre, M.; et al. EMEP/EEA Air Pollutant Emission Inventory Guidebook; European Environment Agency: Luxemburg, 2018. [Google Scholar]
  16. Kogo, T.; Hamamura, Y.; Nakatani, K.; Toda, T.; Kawaguchi, A.; Shoji, A. High Efficiency Diesel Engine with Low Heat Loss Combustion Concept—Toyota’s Inline 4-Cylinder. SAE Int. 2016. [Google Scholar] [CrossRef]
  17. Thiruvengadam, A.; Pradhan, S.; Thiruvengadam, P.; Besch, M.; Carder, D.; Delgado, O. Heavy-Duty Vehicle Diesel Engine Efficiency Evaluation and Energy Audit. In Center for Alternative Fuels, Engines & Emissions: West Virginia University Final Report; West Virginia University: Morgantown, WV, USA, 2014. [Google Scholar]
  18. Zheng, J.; Song, C.; Peng, Q.; Wang, Z. Experimental Study on Transmission Efficiency of Hybrid Electric Bus Transmission with Synthetic Box Assembly. In Proceedings of the 2012 Asia-Pacific Power and Energy Engineering Conference, Shanghai, China, 27–29 March 2012. [Google Scholar] [CrossRef]
  19. Heywood, J.B. Internal Combustion Engine Fundamentals; McGraw-Hill: Singapore, 1988. [Google Scholar]
  20. Nylund, N.O.; Laurikko, J.; Laine, P.; Suominen, J.; Anttonen, M.P.A. Benchmarking heavy-duty ethanol vehicles against diesel and CNG vehicles. Biomass Convers. Biorefin. 2013. [Google Scholar] [CrossRef]
  21. Leone, T.G.; Anderson, J.E.; Davis, R.S.; Iqbal, A.; Reese, R.A.; Shelby, M.H.; Studzinski, W.M. The Effect of Compression Ratio, Fuel Octane Rating, and Ethanol Content on Spark-Ignition Engine Efficiency. Environ. Sci. Technol. 2015. [Google Scholar] [CrossRef]
  22. Edwards, K.D.; Wagner, R.M.; Briggs, T.E.; Theiss, T.J. Defining Engine Efficiency Limits. In Proceedings of the 17th DEER Conference, Detroit, MI, USA, 3–6 October 2011. [Google Scholar]
  23. Wang, R.; Wu, Y.; Ke, W.; Zhang, S.; Zhou, B.; Hao, J. Can propulsion and fuel diversity for the bus fleet achieve the win–win strategy of energy conservation and environmental protection? Appl. Energy 2015, 147, 92–103. [Google Scholar] [CrossRef]
  24. Suarez-Bertoa, R.; Zardini, A.A.; Keuken, H.; Astorga, C. Impact of ethanol containing gasoline blends on emissions from a flex-fuel vehicle tested over the Worldwide Harmonized Light duty Test Cycle (WLTC). Fuel 2015, 143, 173–182. [Google Scholar] [CrossRef]
  25. Hubbard, C.P.; Anderson, J.E.; Wallington, T.J. Ethanol and air quality: Influence of fuel ethanol content on emissions and fuel economy of flexible fuel vehicles. Environ. Sci. Technol. 2014. [Google Scholar] [CrossRef] [PubMed]
  26. Mueller, S.; Unnasch, S.; Keesom, B.; Mohan, S.; Goyal, L. The Impact of Higher Ethanol Blend Levels on Vehicle Emissions in Five Global Cities; University of Illinois: Chicago, IL, USA, 2018. [Google Scholar]
  27. Silva, C.; Ross, M.; Farias, T. Analysis and simulation of “low-cost” strategies to reduce fuel consumption and emissions in conventional gasoline light-duty vehicles. Energy Convers. Manag. 2009, 50, 215–222. [Google Scholar] [CrossRef]
  28. Eaves, S.; Eaves, J. A cost comparison of fuel-cell and battery electric vehicles. J. Power Sources 2004. [Google Scholar] [CrossRef]
  29. Righolt, H.C.; Rieck, F.G. Energy chain and efficiency in urban traffic for ICE and EV. In Proceedings of the 2013 World Electric Vehicle Symposium and Exhibition, Barcelona, Spain, 17–20 November 2013. [Google Scholar] [CrossRef]
  30. Kappel, J.; Mathiesen, B.V. Screening of Tank-to-Wheel Efficiencies for CNG, DME and Methanolethanol Fuel Blends in Road Transport; Aalborg University: Aalborg, Denmark, 2013. [Google Scholar]
  31. Kouridis, C.; Gkatzoflias, D.; Kioutsioukis, I.; Ntziachristos, L.; Pastorello, C.; Dilara, P. Uncertainty Estimates and Guidance for Road Transport Emission Calculations; European Commission Joint Research Centre, Institute for Environment and Sustainability: Ispra, Italy, 2010. [Google Scholar]
  32. Bradley, M.J. Bus Technology & Alternative Fuels Demonstration Project; FINAL Phase 1—TEST PROGRAM REPORT; M.J. Bradley & Associates: Washington, DC, USA, 2006. [Google Scholar]
  33. Zhang, S.; Wu, Y.; Liu, H.; Huang, R.; Yang, L.; Li, Z.; Fu, L.; Hao, J. Real-world fuel consumption and CO2 emissions of urban public buses in Beijing. Appl. Energy 2014, 113, 1645–1655. [Google Scholar] [CrossRef]
  34. Keramydas, C.; Papadopoulos, G.; Ntziachristos, L.; Lo, T.S.; Ng, K.L.; Wong, H.L.; Wong, C. Real-World Measurement of Hybrid Buses’ Fuel Consumption and Pollutant Emissions in a Metropolitan Urban Road Network. Energies 2018, 11, 2569. [Google Scholar] [CrossRef]
  35. Hallmark, S.L.; Wang, B.; Sperry, R. Comparison of on-road emissions for hybrid and regular transit buses. J. Air Waste Manag. Assoc. 2013, 63, 1212–1220. [Google Scholar] [CrossRef] [PubMed]
  36. Cavalett, O.; Chagas, M.F.; Seabra, J.E.A.; Bonomi, A. Comparative LCA of ethanol versus gasoline in Brazil using different LCIA methods. Int. J. Life Cycle Assess. 2013. [Google Scholar] [CrossRef]
  37. Corrêa do Lago, A.; Bonomi, A.; Cavalett, O.; Pereira da Cunha, M.; Pinheiro Lima, M.A. Sugarcane as a carbon source: The Brazilian case. Biomass Bioenergy 2012. [Google Scholar] [CrossRef]
Figure 1. Simplified model scheme for air quality indicators tank-to-wheels (TTW) and global warming impact well-to-wheels (WTW) evaluation/graphical abstract.
Energies 12 02244 g001
Figure 2. Conventional compression ignition/spark ignition powertrain.
Energies 12 02244 g002
Figure 3. HEV-ED95 hybrid powertrain.
Energies 12 02244 g003
Figure 4. PHEV flex fuel powertrain.
Energies 12 02244 g004
Figure 5. ADVISOR model efficiencies for a specific driving cycle and PHEV energy management (average speed 40 km/h, distance 20 km, 12 stop-&-go situations). “Cross check” of efficiency assumptions.
Energies 12 02244 g005
Figure 6. TTW CO2 emissions for the Ecuadorian bus fleet in millions ton/year, with uncertainty (range based with uniform distribution).
Energies 12 02244 g006
Figure 7. WTW CO2 emissions for Ecuadorian bus fleet in millions ton/year, with uncertainty (range based with uniform distribution).
Energies 12 02244 g007
Table 1. Matrix for TTW energy consumption and emissions calculations.
Technology/FuelDieselE20E100Electricity
ICEV compression ignition (CI)x
HEV (CI)x x
PHEV spark ignition (SI) xxx
Table 2. Matrix for WTT CO2eq emission factors.
Energy SourceMinMax
Diesel [13] (gCO2eq/MJ)17.5 (621.1 *)23.5 (834.0 *)
Gasoline [13] (gCO2eq/MJ)19.7 (654.4 *)26.3 (873.4 *)
electricity (10% thermal based) g/kWh34.1 (natural gas)102.4 (coal)
electricity (58% thermal based) g/kWh198.0 (natural gas)593.9 (coal)
ethanol from banana waste [6] (g/MJ)23.6 (540.2 *)23.6 (540.2 *)
* g/L; using 794 kg/m3 and LHV 28.8 MJ/kg for ethanol; 0.845 kg/L, with LHV of 42 MJ/kg for diesel; 0.755 kg/L and LHV of 44 MJ/kg for gasoline.
Table 3. Technical specifications of Scania Omnilink HEV-ED95 bus.
Electric MotorVoith TFM Max 150 kW/Max 2750 Nm
Energy Storage SystemMaxwell supercapacitor 0.4 kWh
Passenger Capacity114
Curb weight16 ton
EngineMax. output 270 hp (198 kW)
Max. torque between 1250 Nm
No. of cylinders 6
Displacement 9 dm3
Compression ratio of 28:1
Table 4. Emission factors found in the literature for flex-fuel vehicles [24,25].
[24][25]
NOx (mg/km) WLTP CycleNH3 (mg/km) WLTP CyclePM2.5 (mg/km) WLTP CycleNOx (g/mile) FTP CycleNH3 (g/mile) FTP CyclePM2.5 (g/mile) FTP Cycle
E0NANANA0.05440.0353NA
E5626NANANANA
E104216NA0.04720.0408NA
E155114NANANANA
E20NANANA0.03160.0638NA
E30NANANA0.02450.0642NA
E40NANANA0.02090.0705NA
E55NANANA0.02930.0968NA
E80NANANA0.02610.0896NA
E851926NANANANA
Table 5. NOx, NH3 and PM2.5 assumed correction factors.
NOxNH3PM2.5
E10−12%+10%−6%
E20−17+52%−36%
E80−49+153%–36%
E100−49+153%–36%
Table 6. Technical specifications of plug-in 7900 Electric Hybrid bus from Volvo (PHEV).
Electric MotorMax 160 kW/Max 1200 Nm
Energy Storage SystemLithium ion battery 76 kWh
TransmissionVolvo 2-speed automatic transmission
Charging SystemOpportunity charging—conductive charging system—roof mounted. Fully automatic, fast charging. Fast charging time: up to six minutes.
Passenger Capacity83
Curb weight12 ton
Engine Volvo D5K240 EU6Max. output 240 hp (177 kW)
Max. power at 2200 rpm
Max. torque between 1200–1600 rpm 918 Nm
No. of cylinders 4
Bore 110 mm
Stroke 135 mm
Displacement of 5.1 dm3
Compression ratio of 17.5:1
Oil-change volume, including oil filters approx. 18.7 L
Table 7. Inputs for fuel consumption and emissions calculations.
Technology
y
Standard
z
Fuel
m
M
Annual mileage (km/y)
N
Number of Buses
FI
L/km or kWh/km 1)
EFNOx 2)
(g/km)
EFPM2.5
(g/km)
EFNH3
(g/km)
conventional ICEV (compression ignition)Euro IIIDiesel78,76723,056 FI diesel = 0.4–0.56 [32]
0.36 tier 2
0.46 VTT
Capturing variations with the driving cycle
9.380.2070.0029
conventional ICEV (compression ignition)Euro VDiesel78,76723,056 FI diesel 3.090.04620.011
HEV (compression ignition)-Diesel78,76723,0560.3–0.42 (less 25% than FIDiesel [33])0.98 [34]0.0231 less 50% than conventional ICEV [35]0.0046 [34]
HEV compression ignitionEuro VE9578,76723,0560.73 [20]5.58 [20]0.037 [20]NA 3)
ICEV (spark ignition) reference for applying Table 3-----2.5 (spark ignition urban bus [15])0.005 (spark ignition urban bus [15])0.0019 (spark ignition heavy-duty vehicle [15])
PHEV-electricity80% of 78,76723,056 FI diesel ρ diesel LHV diesel η driveline   Diesel 3.6 η driveline Eletric 000
PHEV-E2020% of 78,76723,056 FI diesel ρ diesel LHV diesel η driveline   Diesel ρ E 20 LHVE 20 η driveline   E 20 2.0
applying Table 3
0.003
applying Table 3
0.0029
applying Table 3
PHEV-E10020% of 78,76723,056 FI diesel ρ diesel LHV diesel η driveline   Diesel ρ E 100 LHVE 100 η driveline   E 100 1.3
applying Table 3
0.003
applying Table 3
0.0048
applying Table 3
1) When electricity; 2) NO2 equivalent; 3) 10 ppm limit in Euro VI, equivalent to a minimum of 0.05 g/km assuming the stoichiometric combustion ratio of 9, a lambda of 18, typical for idle, and exhaust molar mass of 29 kg/kmol.
Table 8. Final energy consumption by source and per year, with uncertainty.
Electricity GWhDiesel MLGasoline MLEthanol ML
ICEVdiesel-Reference Euro III bus fleet-835.38 (654–1017)--
HEVdiesel-626.54 (490–763)--
HEVED95---1325.72
PHEVflexE202215.99 (1642–4385)-164.73 (105–326)41.18 (26–82)
PHEVflexE1002215.99 (1624–4385)--281.34 (179–557)
Table 9. Criteria pollutants for the Ecuadorian bus fleet in ton/year, with uncertainty.
NO2PM2.5NH3PM2.5 Equivalent
ICEV-Reference Euro III bus fleet17,034.6 (14,309–19,760)375.9 (318–434)5.3396.5 (338–455)
HEV diesel1779.7 (1495–2065)42.0 (35–49)83.5368.3 (364–376)
HEV ED9510,133.6 (8512–11,755)67.2 (78–95)95.3439.7 (429–450)
PHEV E20753.7 (633–874)1.2 (1–1.3)1.05.3 (5.1–5.4)
PHEV E100463.1 (389–537)1.2 (1–1.3)1.78.0 (7.8–8.2)

