Article

Field Measurements and Numerical Simulation for the Definition of the Thermal Stratification and Ventilation Performance in a Mechanically Ventilated Sports Hall

1
Faculty of Civil Engineering and Architecture, Kaunas University of Technology, Studentu str. 48, LT-51367 Kaunas, Lithuania
2
Department of Environmental Technology, Kaunas University of Technology, Radvilenu str. 19, LT-50254 Kaunas, Lithuania
3
School of Engineering, Frederick University, Nicosia 1036, Cyprus
*
Authors to whom correspondence should be addressed.
Energies 2019, 12(12), 2243; https://doi.org/10.3390/en12122243
Submission received: 26 April 2019 / Revised: 8 June 2019 / Accepted: 8 June 2019 / Published: 12 June 2019
(This article belongs to the Special Issue Energy Performance and Indoor Climate Analysis in Buildings)

Abstract

:
Sports halls must meet strict requirements for energy and indoor air quality (IAQ); therefore, there is a great challenge in the design of the heating, ventilation, and air conditioning (HVAC) systems of such buildings. IAQ in sports halls may be affected by thermal stratification, pollutants from different sources, the maintenance of building, and the HVAC system of the building, as well as by the activities performed inside the building. The aim of this study is to investigate thermal stratification conditions in accordance with the performance of the HVAC systems in the basketball training hall of Žalgirio Arena, Kaunas in Lithuania. Field measurements including temperature, relative humidity, and CO2 concentration were implemented between January and February in 2017. The temperature and relative humidity were measured at different heights (0.1, 1.7, 2.5, 3.9, 5.4, and 6.9 m) and at five different locations in the arena. Experimental results show that mixing the ventilation application together with air heating results in higher temperatures in the occupied zone than in the case of air heating without ventilation. Computational fluid dynamics (CFD) simulations revealed that using the same heating output as for warm air heating and underfloor heating, combined with mechanical mixing or displacement ventilation, ensures higher temperatures in the occupied zone, creating a potential for energy saving. An increase of air temperature was noticed from 3.9 m upwards. Since CO2 concentration near the ceiling was permissible, the study concluded that it is possible to recycle the air from the mentioned zone and use it again by mixing with the air of lower layers, thus saving energy for air heating.

1. Introduction

Large, open indoor spaces are found in shopping malls, arenas, sports halls, theatres, factory workshops, railway stations, airports, etc. This type of building is usually mechanically ventilated to ensure appropriate indoor air quality (IAQ) conditions. IAQ is influenced by several factors, including thermal stratification, pollutants from different sources, the building’s maintenance, the ventilation type, and the activities performed inside the building. Large spaces must meet requirements for energy and IAQ; therefore, the design of heating, ventilation, and air conditioning (HVAC) systems in such buildings constitutes a major challenge. Poorly designed mechanical ventilation in large spaces may result to insufficient IAQ and energy losses [1]. Mainstream research about the thermal conditions of large indoor spaces focuses on IAQ and health problems, as well as on HVAC systems and energy efficiency.
The parameters that affect the indoor thermal conditions in sports halls are well documented in the literature [2]. Andrade et al. [3] present a review of 1281 scientific studies in 18 countries related to IAQ of environments used for physical activities. The analysis of scientific papers considered studies published from 1975 [4] onwards. Most of the articles discuss health, respiratory problems, and pollutants in environments used for physical exercise and sport activities. Physical activities implemented in polluted indoor spaces set people at health risk, as the air is inhaled through the mouth, and not through the nose, remaining in this manner unfiltered [4]. Branis et al. [5] deals with the indoor–outdoor relationship and the potentially negative effect on the health of schoolchildren, aged 11–15 years, when exercising in naturally ventilated sports halls of elementary schools. The concentration of indoor particulate matter of aerodynamic diameter less than 2.5 µm (PM 2.5) was an indicator of potentially negative health risks. In that study, it was revealed that the amount of particulate matter in the respiratory tract during inhalation might be five times higher during intensive exercise compared with the steady conditions. The results of measured PM 2.5 concentration showed that concentrations exceeded World Health Organization (WHO) recommendations on 50% of measure days indoors and 48.6% of measured days outdoors. The concentration of indoor particles was found to depend on the season, the location of the school, and the amount of people in the sports hall.
Several studies have been performed to evaluate the IAQ and ventilation effectiveness when different ventilation types are installed in large indoor spaces. Although mixing ventilation dominates in large indoor spaces, in the literature studies considering alternative ventilation solutions are also found, including natural and mechanical ventilation [1,6,7,8], displacement ventilation [8,9], and changing of the position of extract fans [10,11]. The use of mechanical ventilation with the contributions of different heat-gain sources [12] are also reported in the literature.
Some studies were implemented in large space buildings with glass facades, where high intensity solar radiation must also be considered [13]. Studies employing new methods for assessing ventilation in large spaces, aiming to measure the local age of the air by tracer gas step-down or the decay method inside a control volume, were also implemented [1]. In most cases, field measurements were implemented. Computational fluid dynamics (CFD) methods are usually employed to further expand the investigated cases; however, in some cases studies are based merely on computational analysis [14,15]. Indoor thermal conditions indicators, such as the predicted mean vote (PMV) and the predicted percentage of dissatisfaction (PPD), introduced by Fanger in 1970 [16] and adopted by ISO Standard 7730:1994 [17], were also extracted in some cases [8,14].
Stathopoulou et al. [6] conducted their research in two large sports halls. The investigated halls had different ventilation types (natural and mechanical). Also, one hall was surrounded by heavy traffic. The temperature levels in the sports hall with the mechanical ventilation system were not stratified, and stratification was not intense. Although pollution stratification was observed in both halls, this phenomenon was more intense in the naturally ventilated hall. Air stratification results from the influence of buoyancy and the stack effect [18]. Rajagopalan and Elkadi [11] present a study, based on CFD simulation, which aims to test the thermal and ventilation performance of a sports hall within an aquatic center, located in Australia. Seven different scenarios were investigated, which were based on the different positioning of extract fans and the incorporation of natural ventilation. The results showed that the lower the position of the exhaust fans, the better the comfort at the occupants’ level. Also, the scenario with the exhaust fans located on the roof was the most undesirable. Similar conclusions were also determined for natural ventilation. Rajagopalan and Luther [7] present the results of a study performed in a naturally ventilated (sometimes assisted with exhaust fans) sports hall, using field measurements and CFD simulations. The results showed that for those periods that the hall was occupied, the CO2 concentration in the hall was below 800 ppm, which is an indication of good ventilation and IAQ. According to Kamar et al. [8], installing exhaust fans with a 1 m diameter, at the height of 6 m from the floor, has the potential to reduce the PMV index by 75–95% and the PPD index by 87–91%. Another important aspect that significantly affects the indoor thermal conditions of sport halls concerns air recirculation. The analysis of energy efficiency measures in the study of Nord et al. [19] shows that air recirculation has the greatest effect on total energy use in sports halls, and that air recirculation could give an energy savings of 27% when 50% of the indoor air is recirculated. Even though the use of the PMV and the PPD index is regularly found in studies concerning the thermal comfort of sports halls, the outcome of the study of Revel and Arnesano [20] demonstrates that these indicators cannot be applied in sports halls. The same team investigated the problem of indoor temperature distributions in large sport spaces and its impact on energy efficiency and thermal comfort [21].
Another recent trend in the scientific literature of sports halls energy assessment concerns the indoor air conditions of passive buildings. In the study of Kisilewicz and Dudzińska [22], under high ambient air temperature and switched-off ventilation, acute overheating was observed. Due to the widespread implementation of the nearly-zero-energy building concept, often-observed overheating is expected to become an important issue concerning the indoor thermal conditions of sports halls. In that study, it was also determined that indoor thermal condition measurements are affected by window location and solar radiation geometry. In the field of passive buildings, innovative air-supported membrane structures have also been recently employed in low-energy sports halls to investigate their physical and thermal behavior. In the study of Suo et al. [23], it was proven that such double-layered envelopes allow savings of 11–18% of the heating energy compared to single-layer. Moreover, in that study further energy-saving strategies are proposed and quantified, considering low-emissivity coatings, reduction of cracks’ areas, and modifying indoor air set points.
The literature review reveals that although there is a significant number of previous studies concerning the assessment of the IAQ conditions in sports halls, a comprehensive assessment concerning the optimal HVAC configurations for achieving ideal IAQ is missing. The definition and choice of HVAC systems in sports halls in the scientific literature is not based on a specific rationale and is rather arbitrary. This aspect is particularly important, in view of the European challenge of 2021 to achieve nearly-zero-energy buildings, including commercial buildings and sports halls. The necessity of studies that will focus on a comparative assessment between different HVAC technologies and their performance for sports halls is obvious. To this end, the aim of this study is to investigate IAQ conditions in accordance with thermal stratification and the performance of the HVAC systems in the basketball training hall of Žalgirio Arena, Kaunas in Lithuania, with the use of field measurements (temperature and CO2), and to test different ventilation scenarios with the application of CFD simulations.

2. Methodology

For this investigation, the following methods were used:
  • Field measurements for the measurement of the temperature, relative humidity, and the CO2 concentration;
  • CFD simulations for the calculation of the temperature distribution in the training hall.
In this section, a short description of the adopted methods is presented.

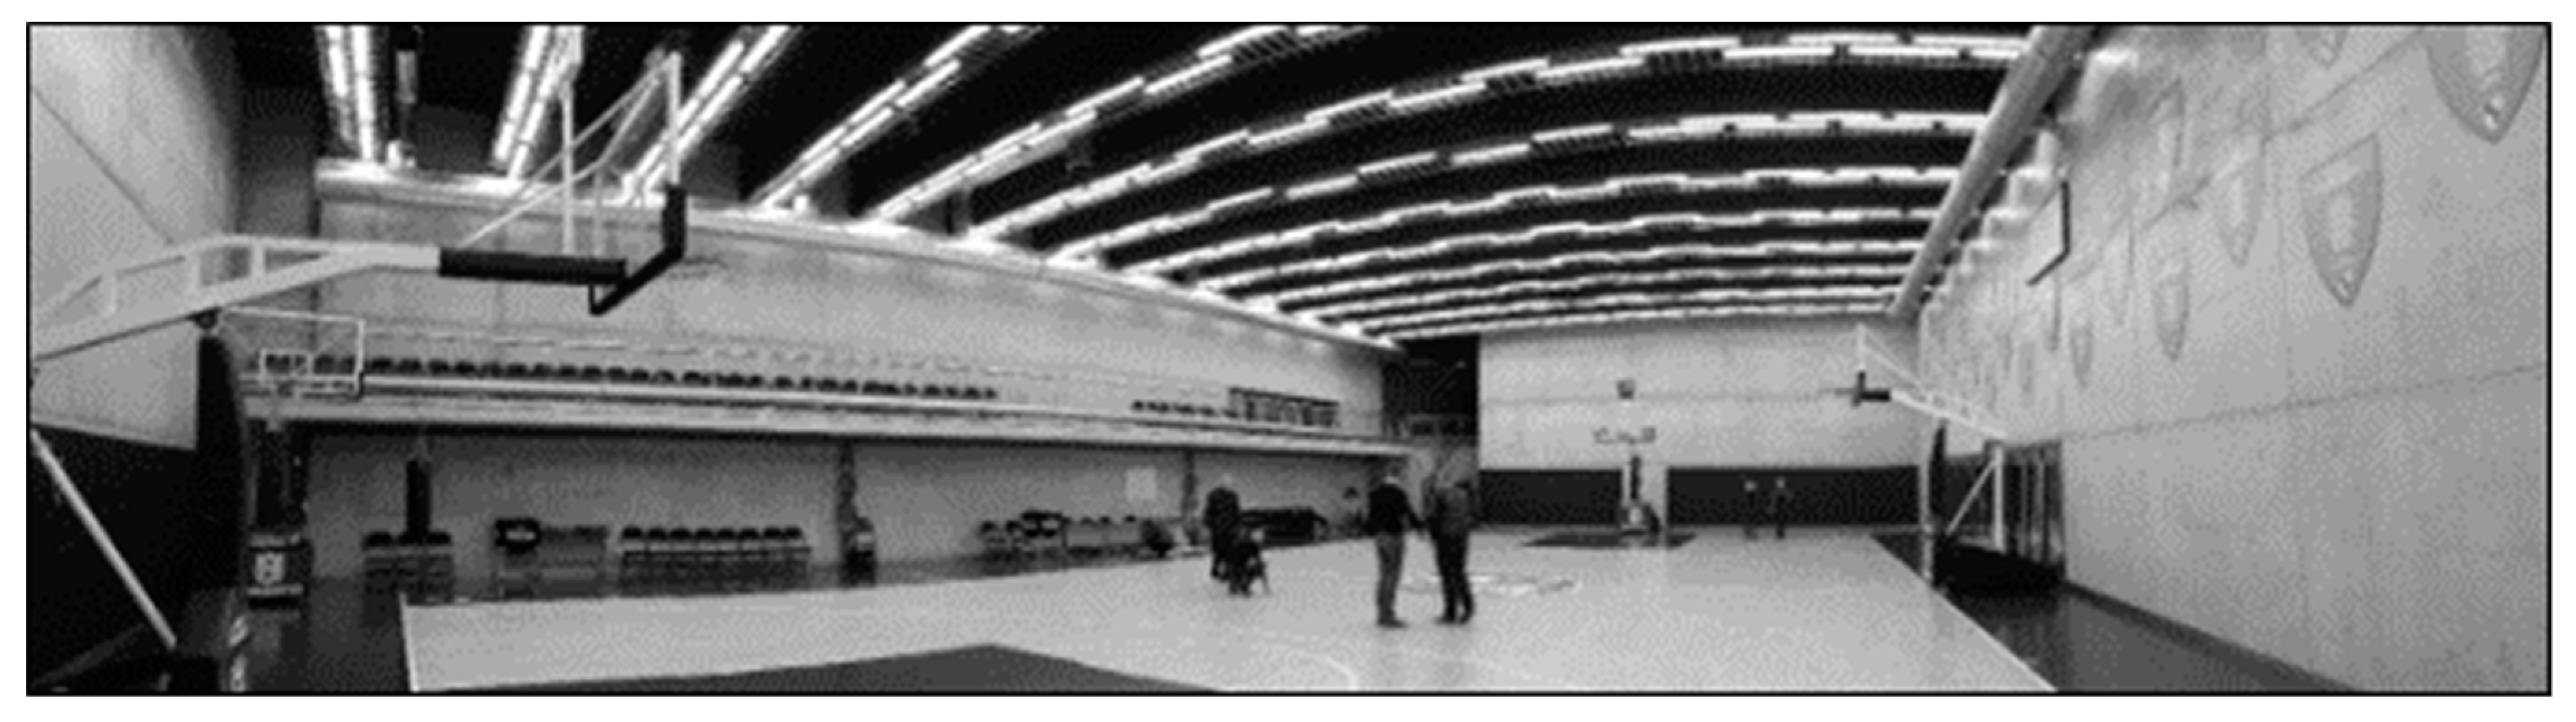
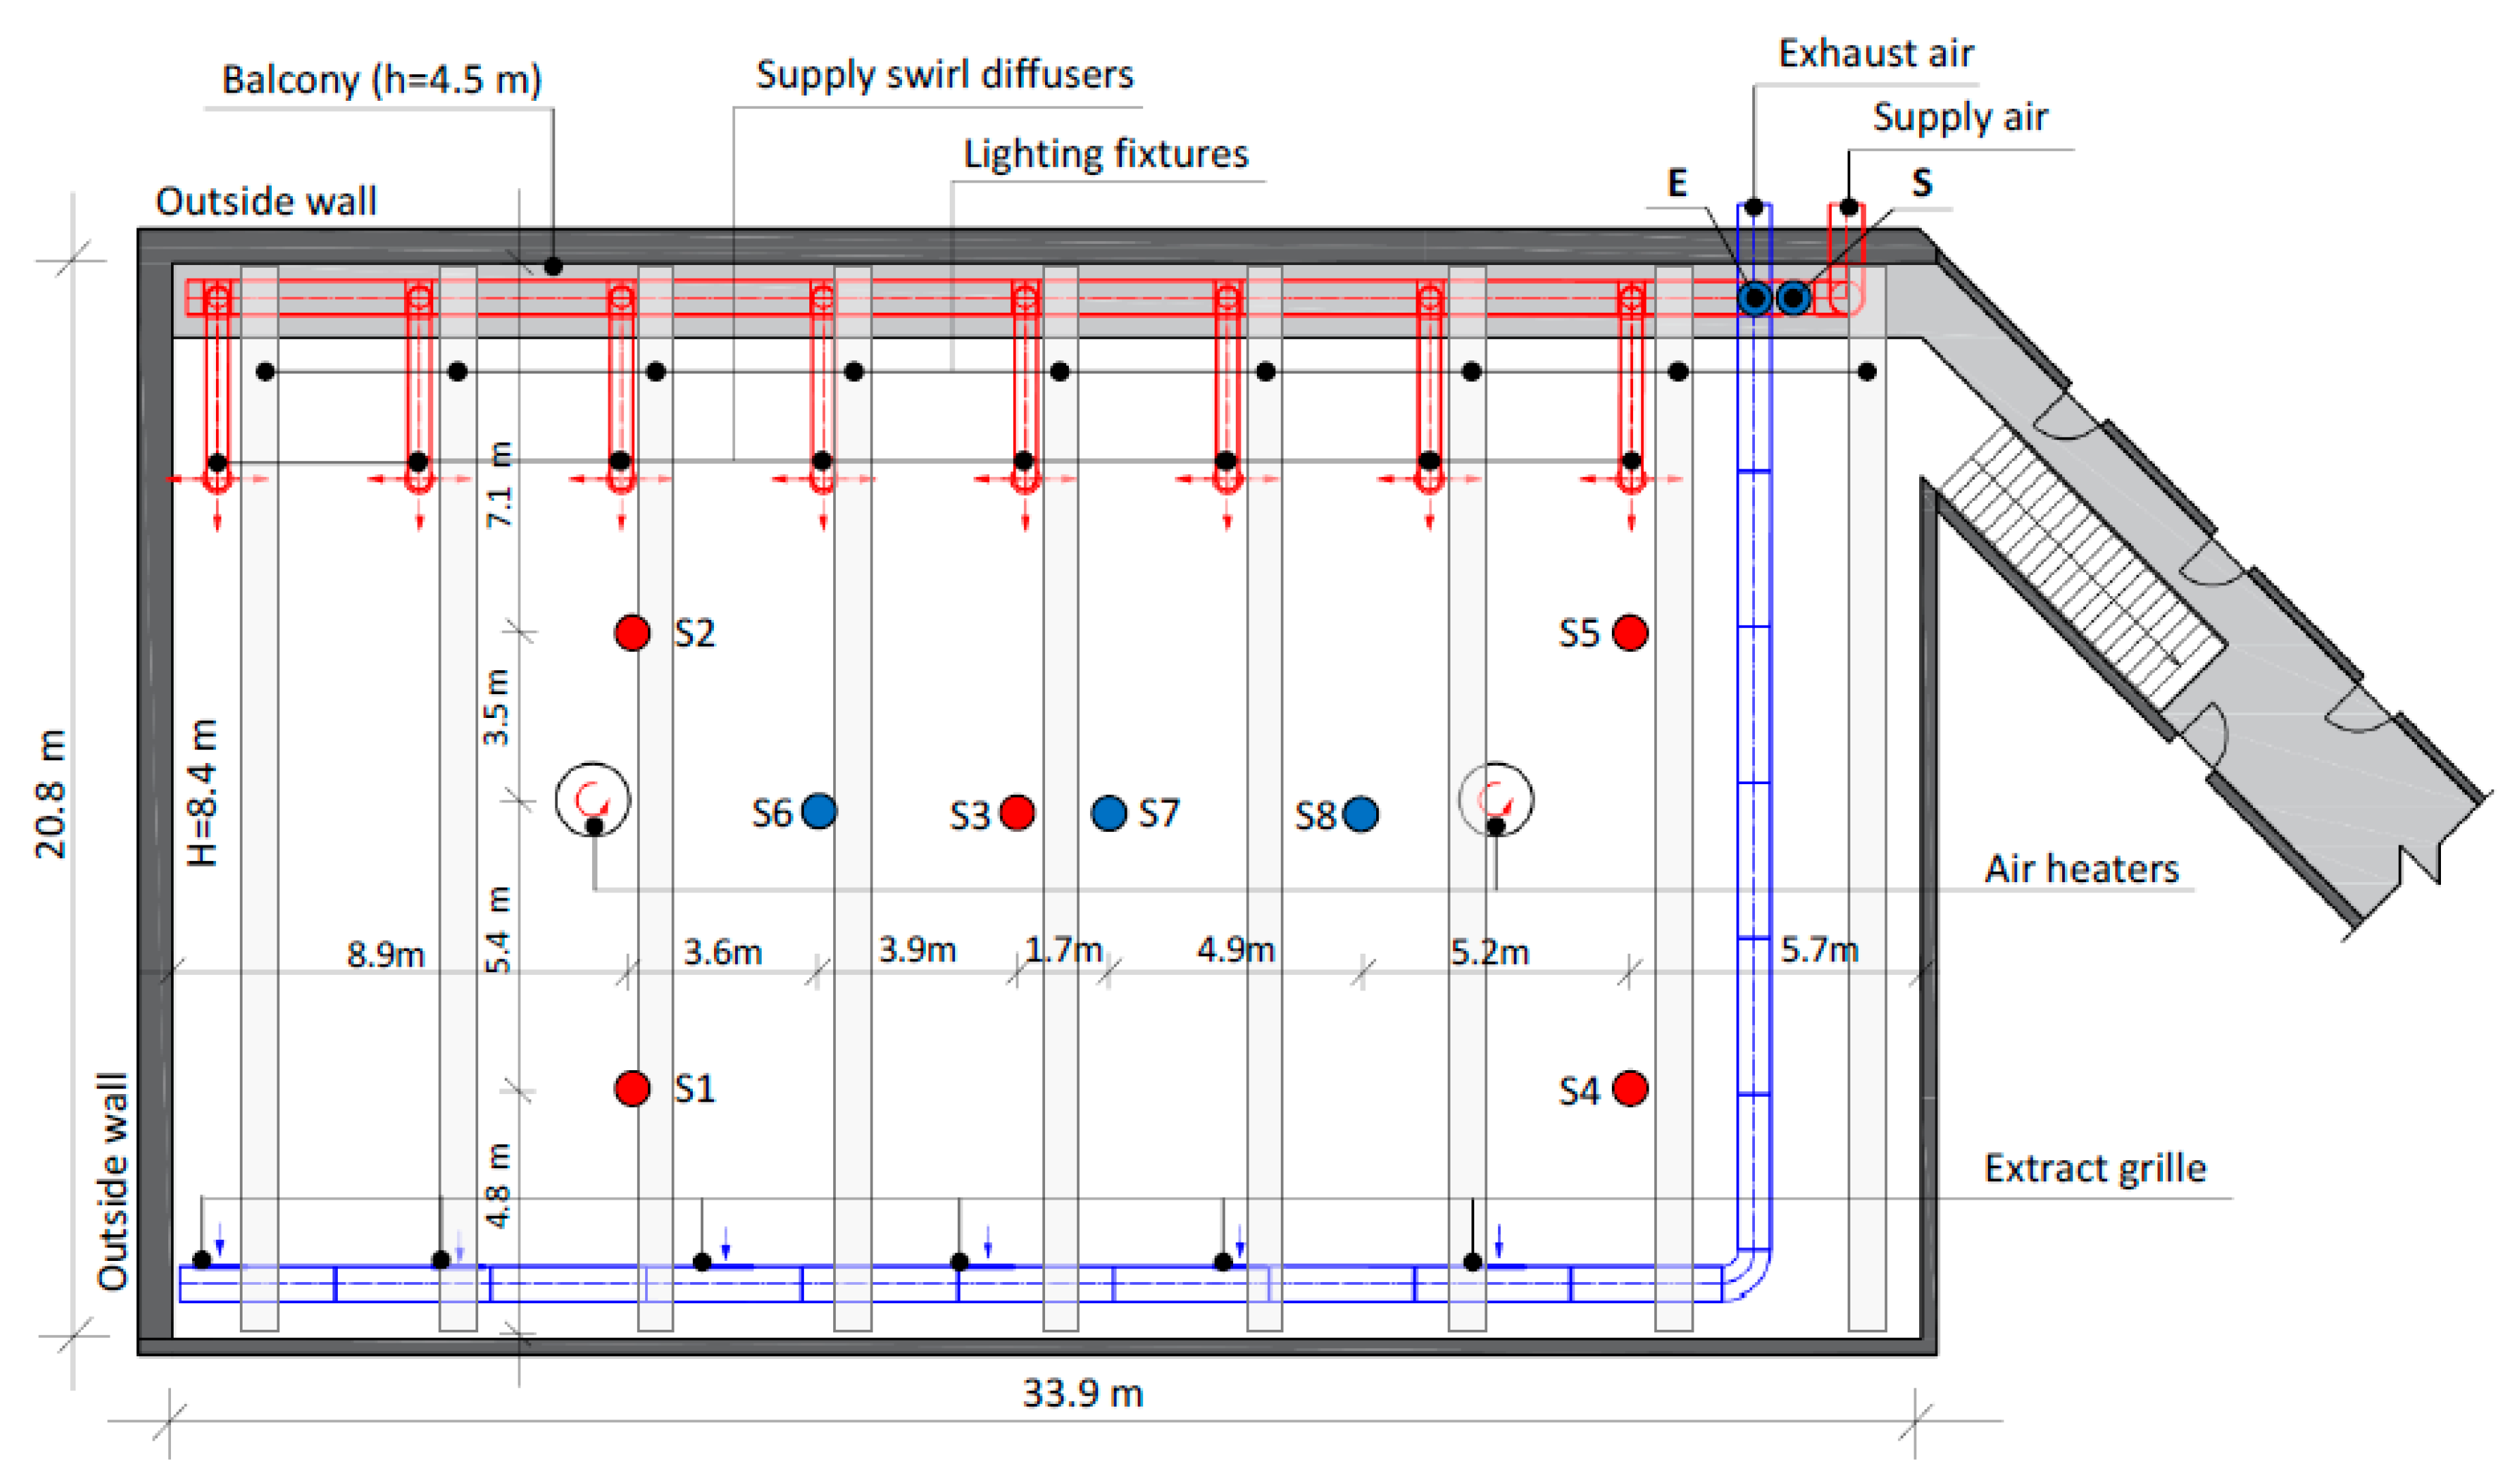
2.1. Žalgirio Arena Basketball Training Hall

Žalgirio Arena is one of the biggest multifunctional arenas in the Baltic region, located on Nemunas Island in the centre of the city of Kaunas in Lithuania. Different events, including basketball games, volleyball games, handball games, and ice-skating competitions, as well as theatrical events and expos are organized on a regular basis in Žalgirio Arena. The building also hosts offices, sport clubs, restaurants, an amphitheater, and a training hall. The total area of the building is 39,684.2 m2, of which the arena’s area is 2841.72 m2 and the heated area is 28,297.75 m2. There are up to 20,000 seats for concerts, and up to 15,708 seats for basketball games.
The basketball training hall (Figure 1) has dimensions of 20.8 × 33.9 × 8.4 m. The floor area of the training hall is 705 m2, and the volume of the hall is 5923 m3. The training hall has a 1.5 m width balcony along the longer side of the hall. The distance between the balcony and the floor is 4.5 m. The walls and the ceiling of the hall are made of concrete. The training hall is illuminated by florescent, hanging light fixtures. The temperature of the lighting fixtures during the time of measurements was around 72 °C. The training hall has two exposed and two internal walls. During the measurement campaign, the temperature of the exposed walls and floors was 18 °C, and the temperature of the interior walls and the ceiling was 21 °C. The arena construction started in 2008. At that period, in Lithuania, according to the valid regulations, the heat transfer coefficients for walls, floors in contact with soil, roofs, and windows were 0.25, 0.30, 0.20, and 1.60 W/(m2·K) respectively.
The training hall is ventilated by a mechanical ventilation system. Air is supplied by eight swirl diffusers of 0.4 m diameter located at 6.6 m height. Diffusers ensure mixing ventilation airflow patterns. For air extraction, six duct grills are used, with dimensions of 0.225 m × 1.025 m and located at 6.2 m height. The air change rate in the training hall was 1.1 h−1. The flow rate for both the air supply and the extracted air was 6600 m3/h. The training hall is equipped with two air heaters that have axial flow fans and water-based heating coils. Each heater has a heating capacity of 10.25 kW.

2.2. Field Measurements

The field measurements were performed between January and February 2017. The parameters measured were the air temperature, relative humidity (RH), and CO2 concentration. The layout of the heating and ventilation equipment, as well as the measurement equipment, are presented in Figure 2. The temperature and the relative humidity were measured on five stands (S1–S5) at six heights (0.1, 1.7, 2.5, 3.9, 5.4, and 6.9 m) above the floor. The measurements were conducted for the conditions described in Table 1.
For temperature and relative humidity measurement, HOBO MX1101 data loggers (±0.2 °C, ±2% RH accuracy) were used. CO2 concentration was measured at four locations: in the occupied zone at a height of 1.7 m (S6 and S8), in the ceiling zone at a height of 7.1 m (S7), in the main extract air duct (E), and in the main supply air duct (S). For measurements of CO2 concentrations, IAQ-CALC 7545 IAQ meters (TSI, United States), with an accuracy of ±3% were used. The temperature of the surfaces was measured with a thermal camera (Type Fluke Tir1). The air velocity was measured in the occupied zone at a height of 1.7 m. The temperature and the relative humidity were recorded at 5 min intervals, and the CO2 concentration at 1 min intervals. During the period of field measurements, according to the local weather station, the average outside temperature in Kaunas city varied between −7 and +4 °C. The lowest average temperature varied between −11 and −17 °C.

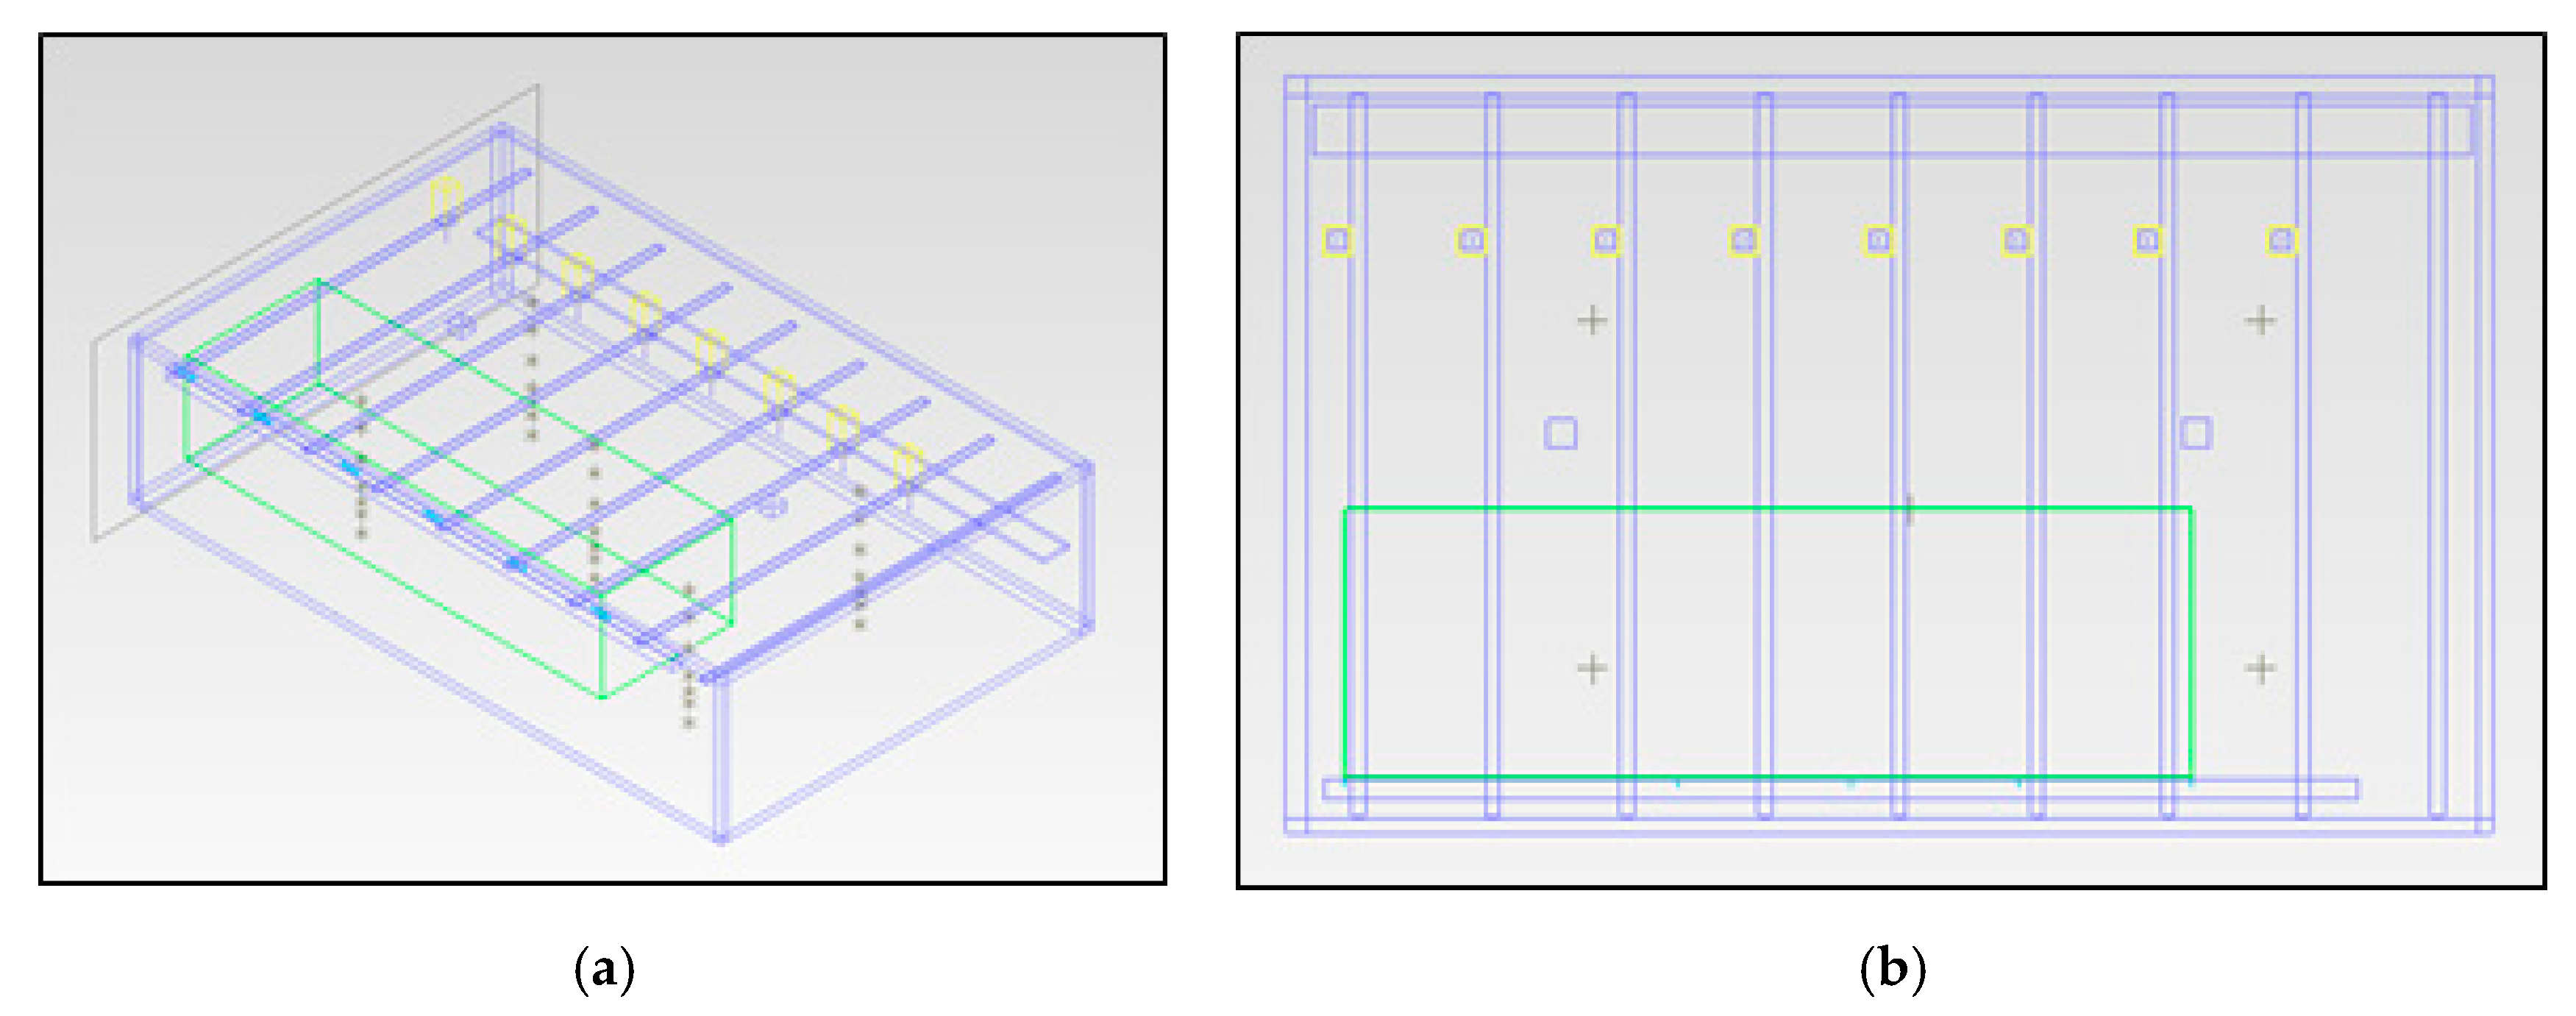
2.3. Numerical Method

The commercial CFD tool FloVENT (Mentor Graphics, United States) was chosen to visualise and calculate the temperature distribution in the training hall. FloVENT is a tool used to investigate the airflow, contamination, and heat performance of both individual thermal zones and whole buildings. In this study, the k-ε turbulence model (LVEL k-ε) was employed. The k-ε turbulence model shows good performance in predicting the behavior of indoor airflows, temperatures, and contaminant distribution in buildings [24]. To achieve steady-state simulation results, the double-precision solver of FloVENT was applied. Flovent’s function of “kE model stratification” was employed to include buoyancy generation terms. Contaminants were not modelled in CFD calculations, as the idea of CFD simulations were to visualise and calculate the temperature distribution in the training hall. CFD simulations were performed for the conditions before basketball training, with operating heating and ventilation systems, and without people.
The basketball training hall of the Žalgirio Arena was replicated in a three-dimensional CFD model (Figure 3). All boundary and initial conditions replicate parameters measured during field measurements. The temperature for all the exposed walls and the floor of the training hall was set to 18 °C. For the internal walls and the ceiling, the temperature was set to 21 °C. Swirl diffusers and fixed flow openings were used to create the supply and extract air terminals (diffusers and grilles), respectively. Supply airflow was set to 825 m3/h for each swirl diffuser, for the case of mixing ventilation. Displacement ventilation diffusers were modelled as fixed-flow air supply openings with a 0.7 free area ratio, and supply airflow was set to 2200 m3/h. Supply air temperature, in cases with mechanical mixing ventilation, was set at 18 °C, and at 19 °C in cases with mechanical displacement ventilation. In all cases, the air exhaust grilles were designed with the 0.5 free area ratio, and exhaust airflow was set at 1100 m3/h for each grille. These airflows ensured an air change rate of 1.1 h−1. A solid cuboid with a thermal attribute of 30 W/m2 was used to simulate underfloor heating. Solid cuboids were also used to simulate the lighting fixtures, with a thermal attribute of 72 °C.
A variable Cartesian grid was used to divide the geometry into regions. The density of the grid was increased close to the air supply terminals, the heated floor, and the exposed walls. As grid quality in CFD simulations is an important factor that affects the results, a grid sensitivity analysis was also performed, concluding that a 100,000-cell grid would be appropriate for this study. Refining the grid further gives negligible changes in results and complicates the calculation.
Three cases with different heating and ventilation systems were studied:
  • The AH+MMV case, in which the simulation was in accordance with the field measurements. Mechanical mixing ventilation combined with warm air heating was presumed.
  • The UFH+MMV case, which considered mechanical mixing ventilation combined with underfloor heating.
  • The UNF+MDV case, which represented mechanical displacement ventilation combined with underfloor heating.
SPSS 23 (IBM Corp., Armonk, NY, USA) and Excel 365 (Microsoft Corp., Albuquerque, NM, USA) packages were used for post-processing of the numerical results. Data was tested for distribution using the Shapiro–Wilk test. Nonparametric Kruskal-Wallis (for multiple samples) and Mann–Whitney (for two unpaired groups) tests were also used to test the hypothesis of the difference in means, setting a 5% level of significance.

3. Results and Discussion

3.1. Field Results

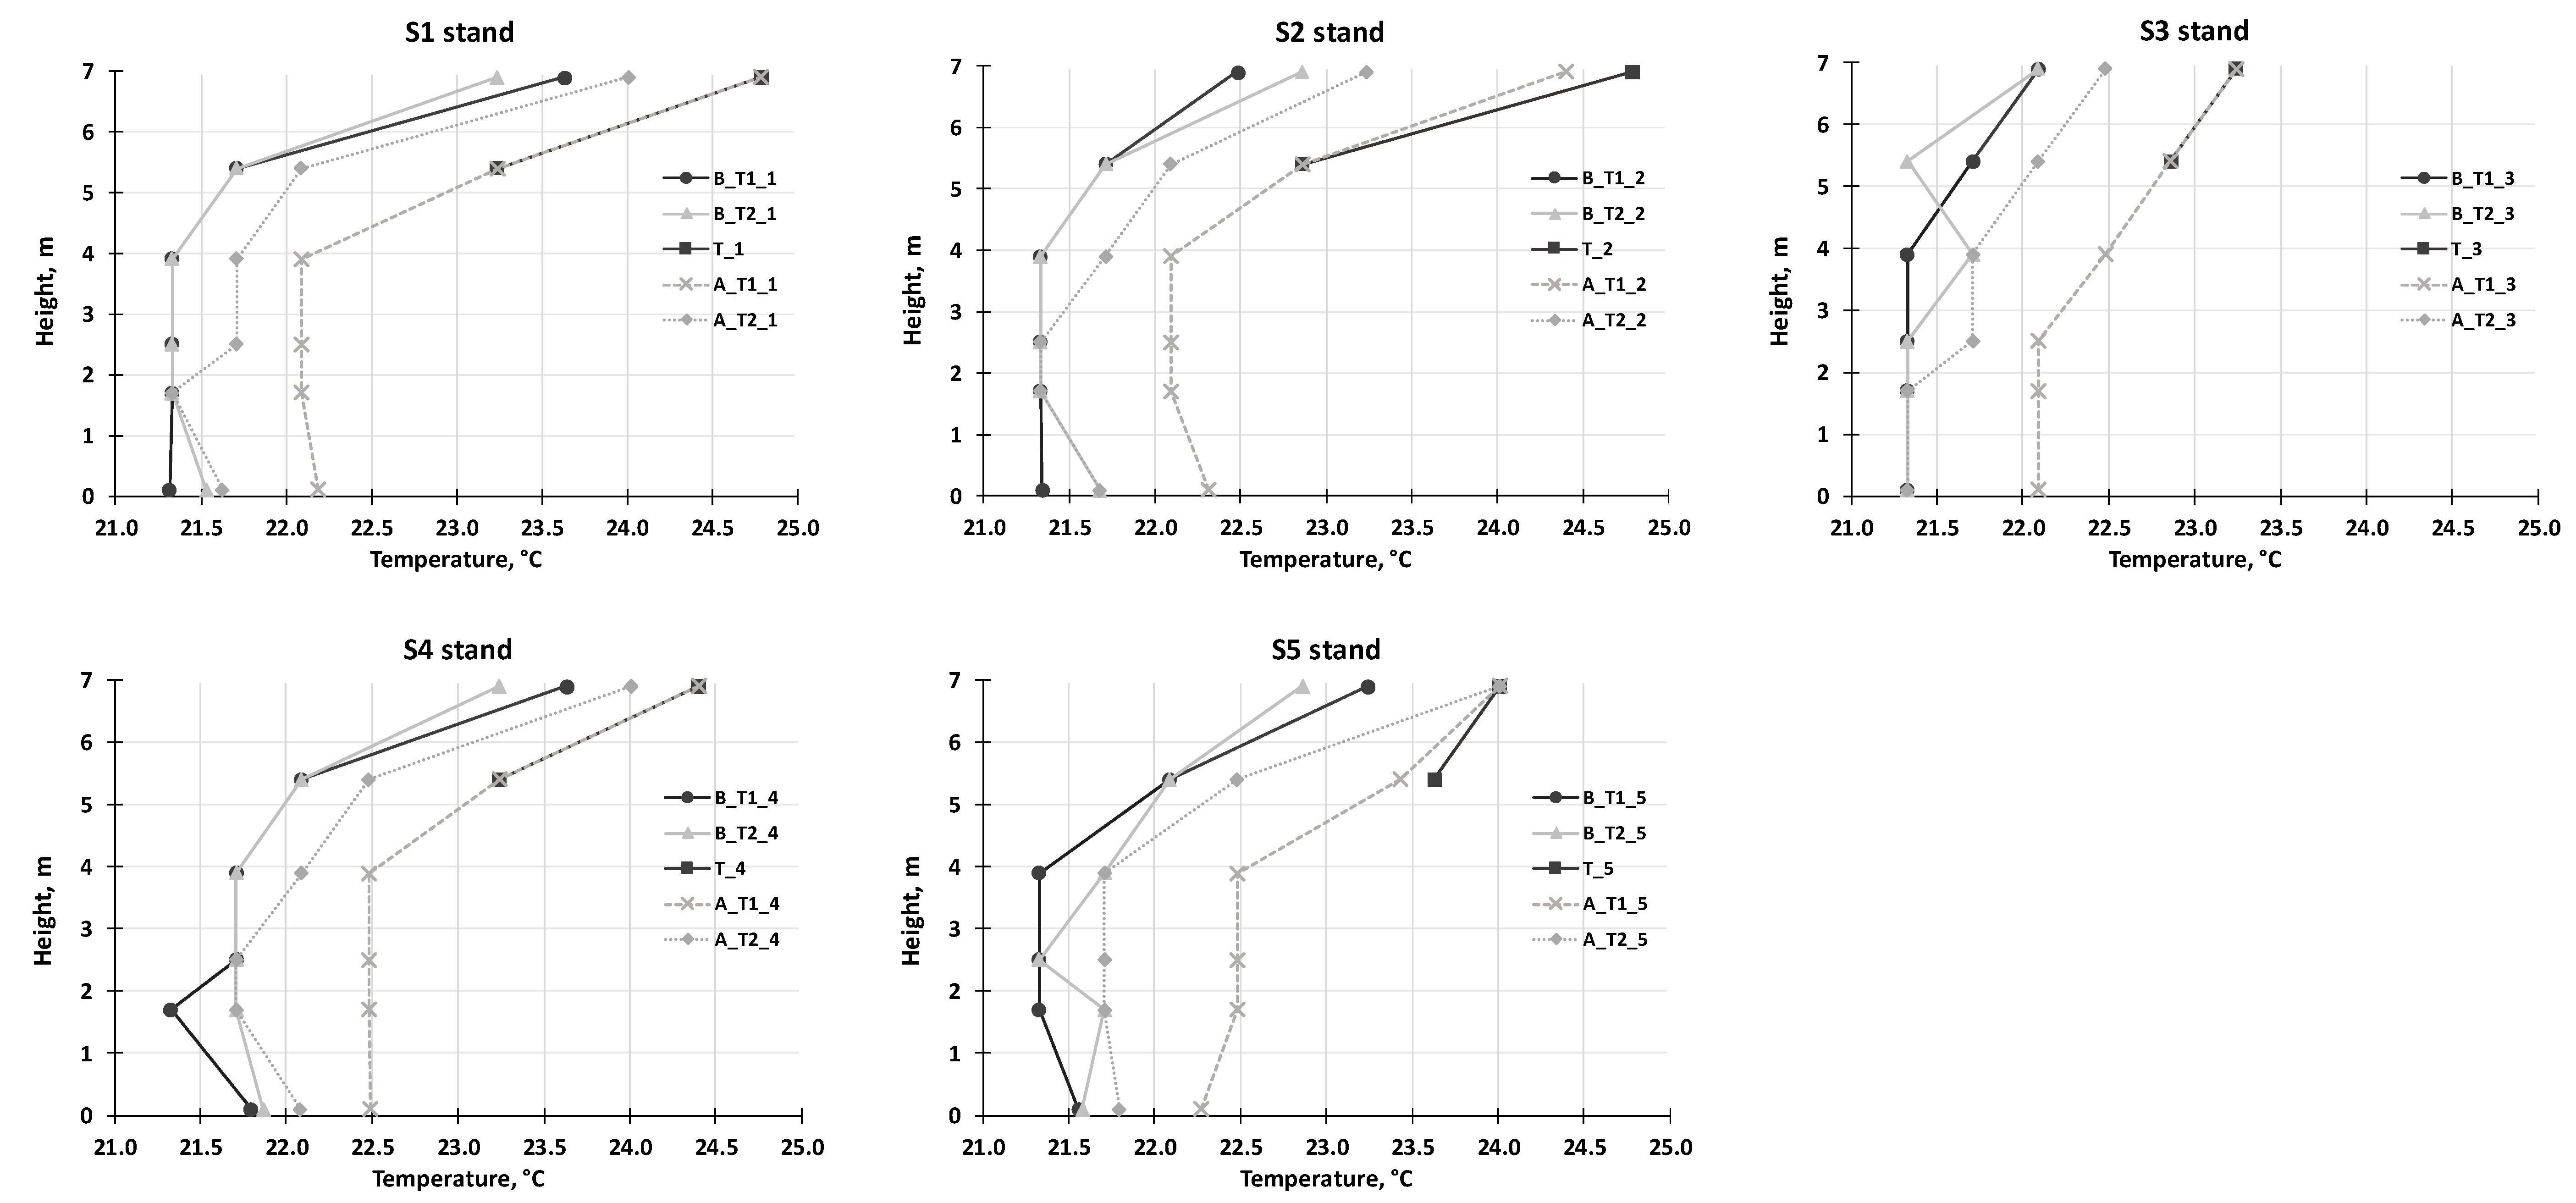
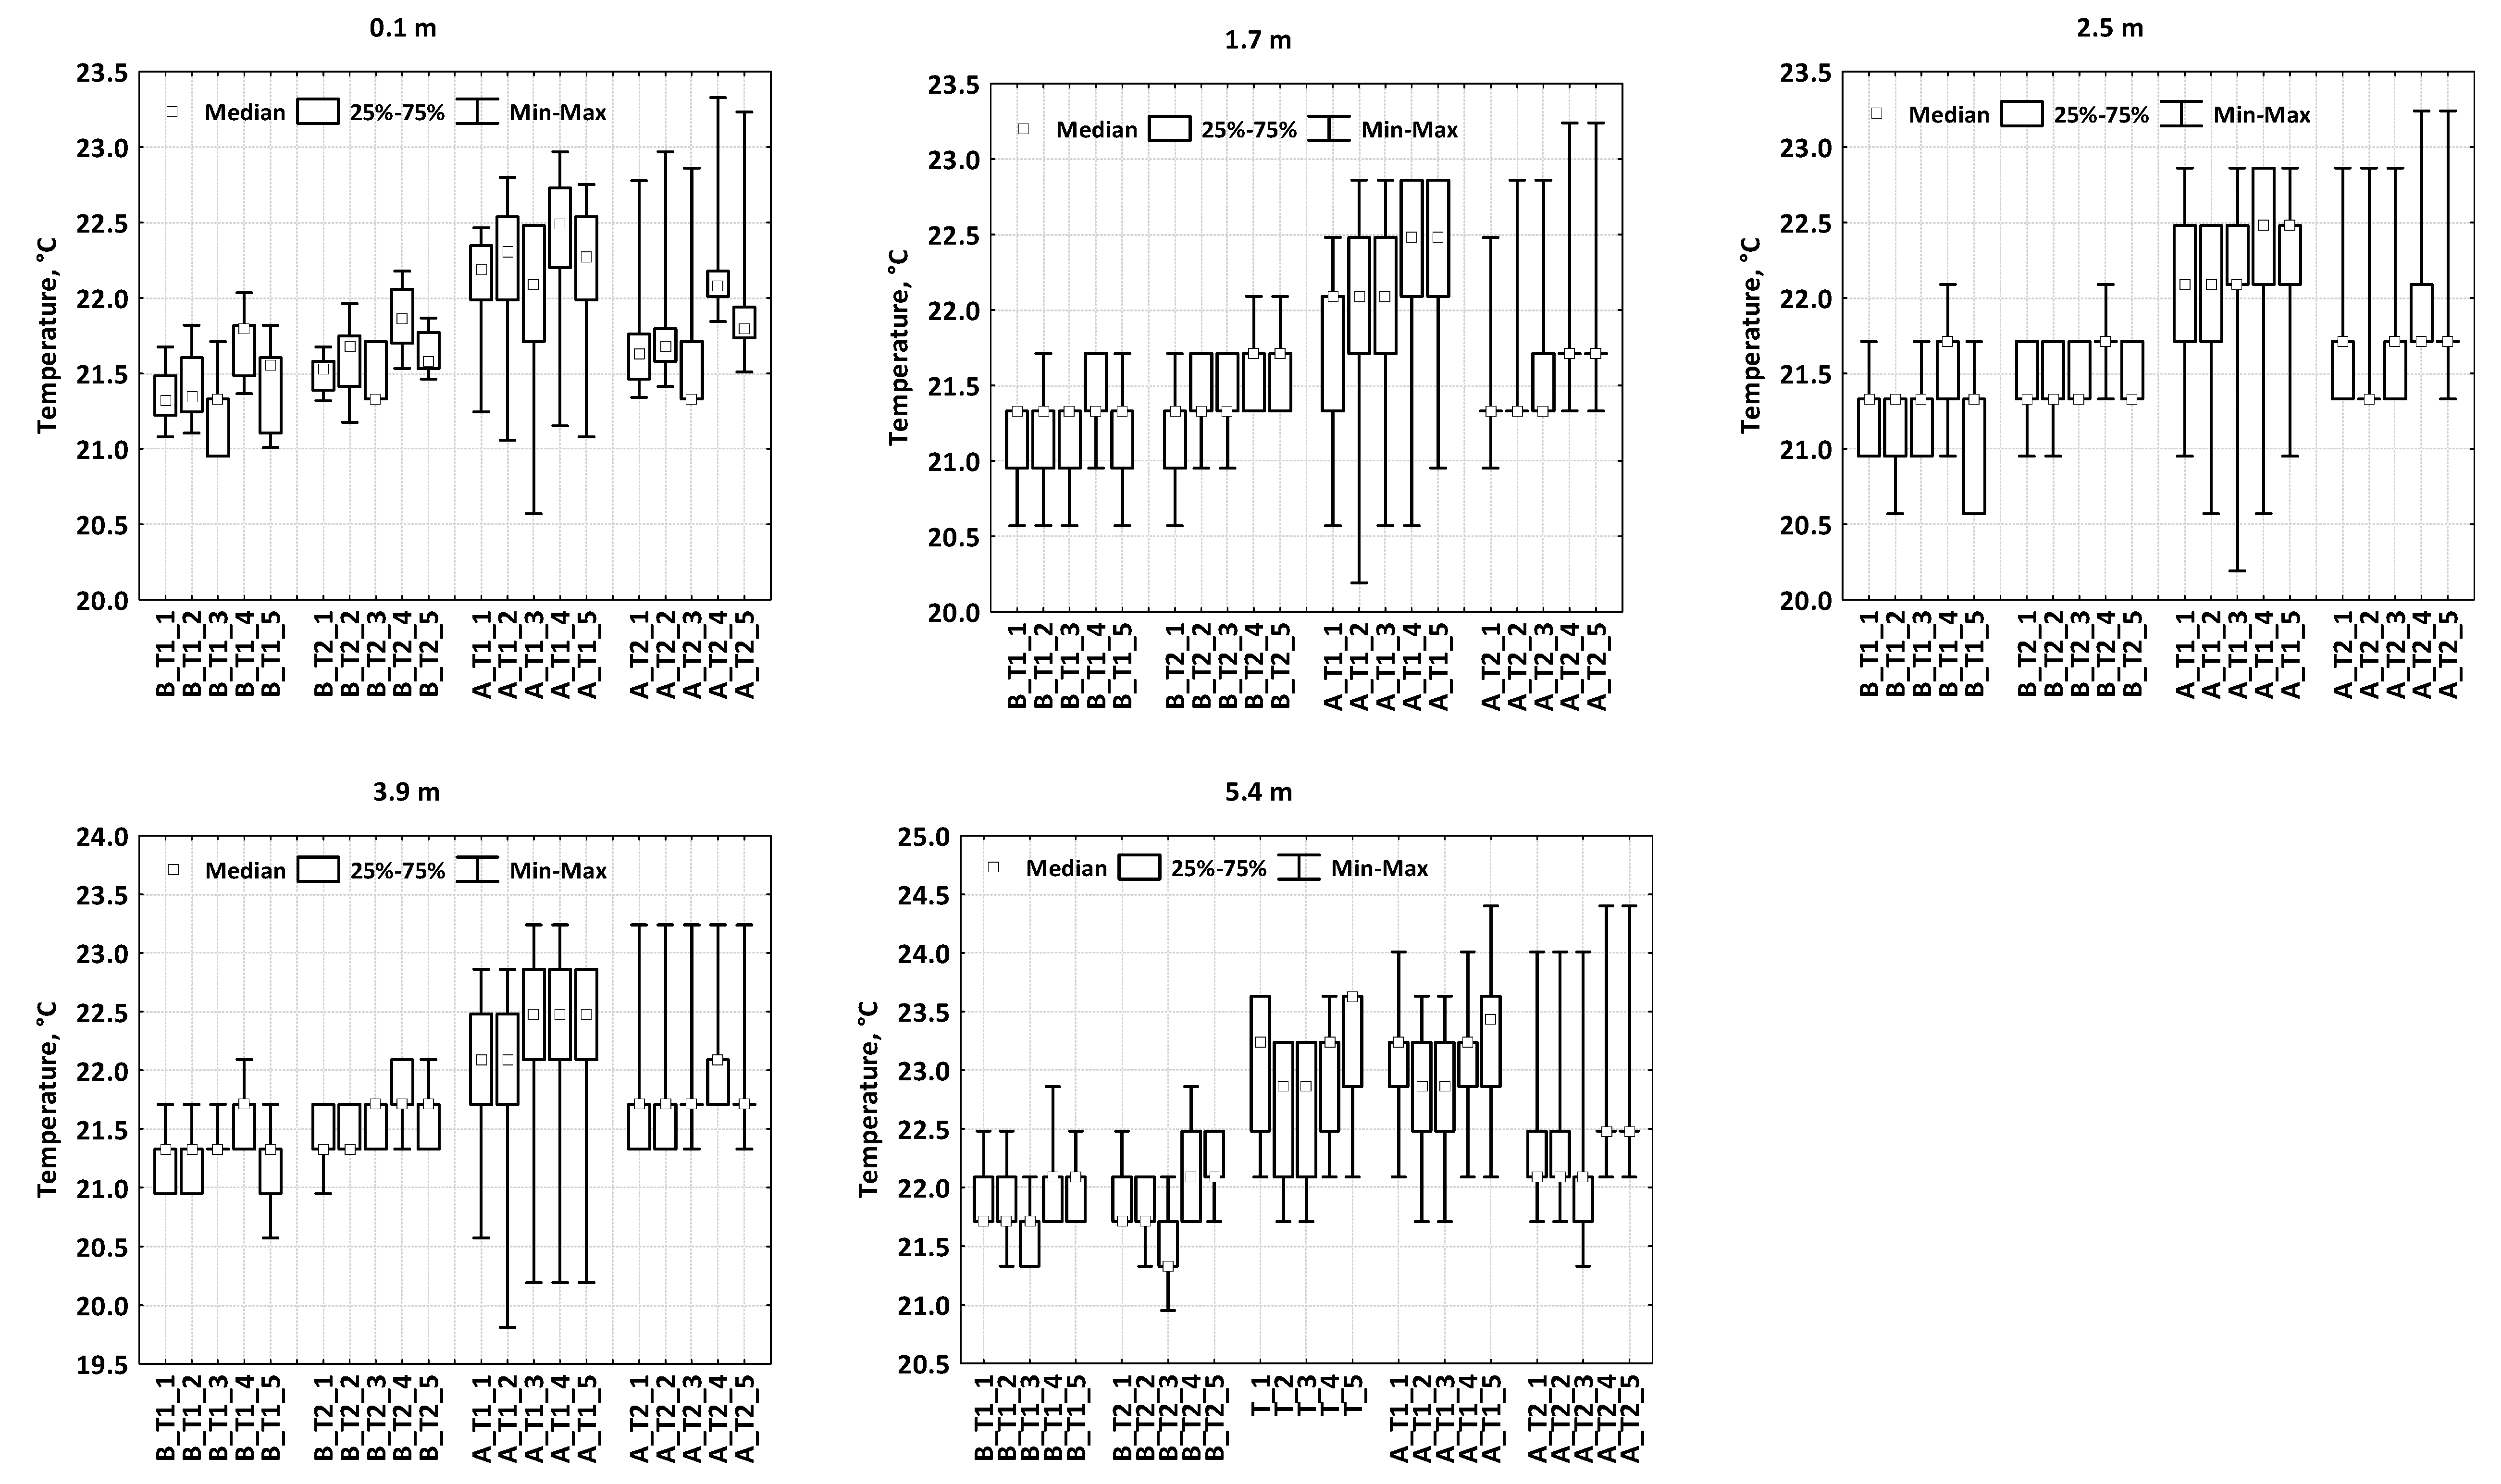
3.1.1. Indoor Temperature

In Figure 4, the indoor temperature measured at different conditions for the same location is presented. Figure 5 presents the indoor temperature measurements at the same height for different conditions. The indoor temperature measurements before the beginning of the basketball training, with operating ventilation systems and without people in the hall (scenario B_T2), was statistically analyzed. A significant difference in the spatial distribution of the indoor temperature in the basketball training hall, considering all measurement stands at the same height at once, was observed (p < 0.05). This data is presented in Table 2. The paired data from the stands also revealed statistically significant differences in most, except for stands 2 and 3 at a height of 1.7 m and 5.4 m, respectively, as well as for stands 3 and 4 at heights of 0.1, 1.7, and 5.4 m, respectively. Similarly, a significant difference in the overall stratification distribution of the indoor temperature (p < 0.05) as measured in each stand was revealed. The p-value represents the maximal probability that, when the null hypothesis is true, the statistical summary would be greater than or equal to the actual observed results. In Table 3, the Kruskal-Wallis test statistics for stratification distribution are presented. Pairwise, in each stand the temperature differed significantly between heights of 0.1 and 1.7 m (all stands), 1.7 and 2.5 m (except stands 2 and 5), 2.5 and 3.9 m (except stands 1, 2 and 5), 3.9 and 5.4 m (all stands), and 5.4 and 6.9 m (all stands).

3.1.2. Relative Humidity and CO2 Concentration

There was no significant difference in the measured relative humidity (RH). The average RH values ranged between a minimum value of 23.4% and a maximum value of 25.5%. The range of the measured CO2 concentrations in the extract air was found between 372–868 ppm, in the supply air from 365–457 ppm, in the occupied zone from 386–951 ppm, and in the ceiling zone from 417–629 ppm. The measured CO2 values are lower than 1000 ppm. Therefore, the indoor air quality is assigned to medium air quality class (IDA2) in accordance with the EN 13779 standard [25].

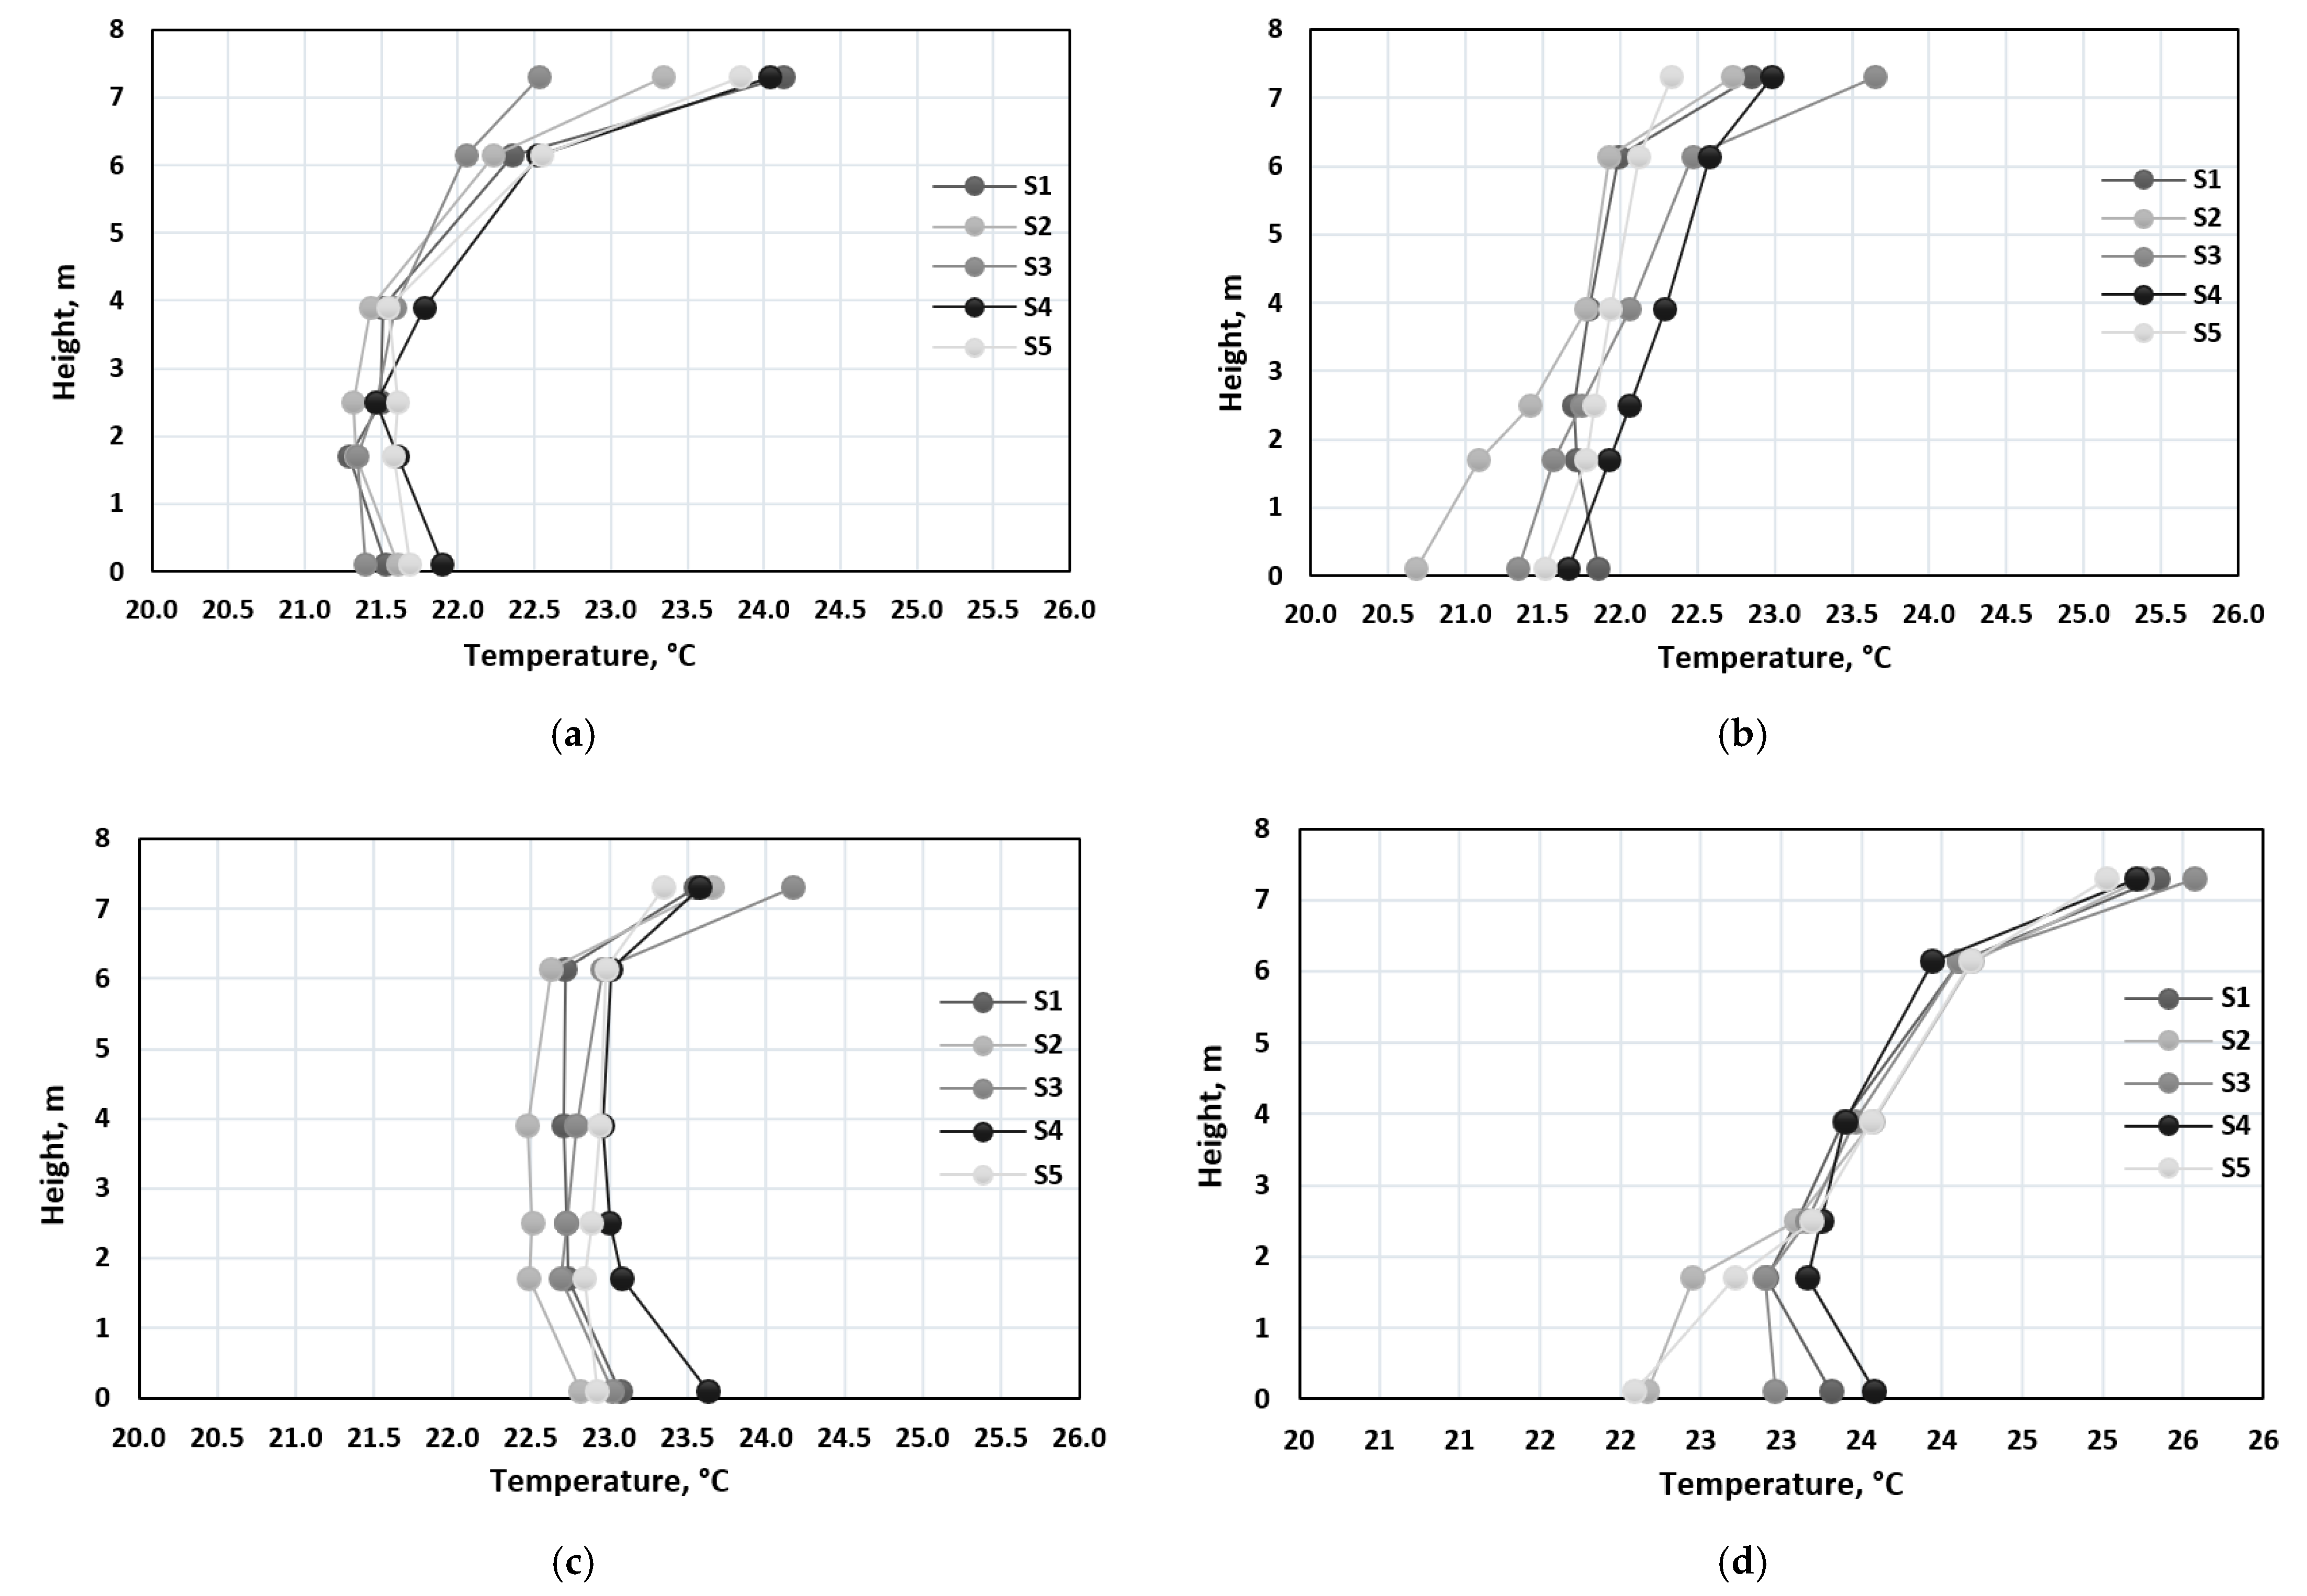
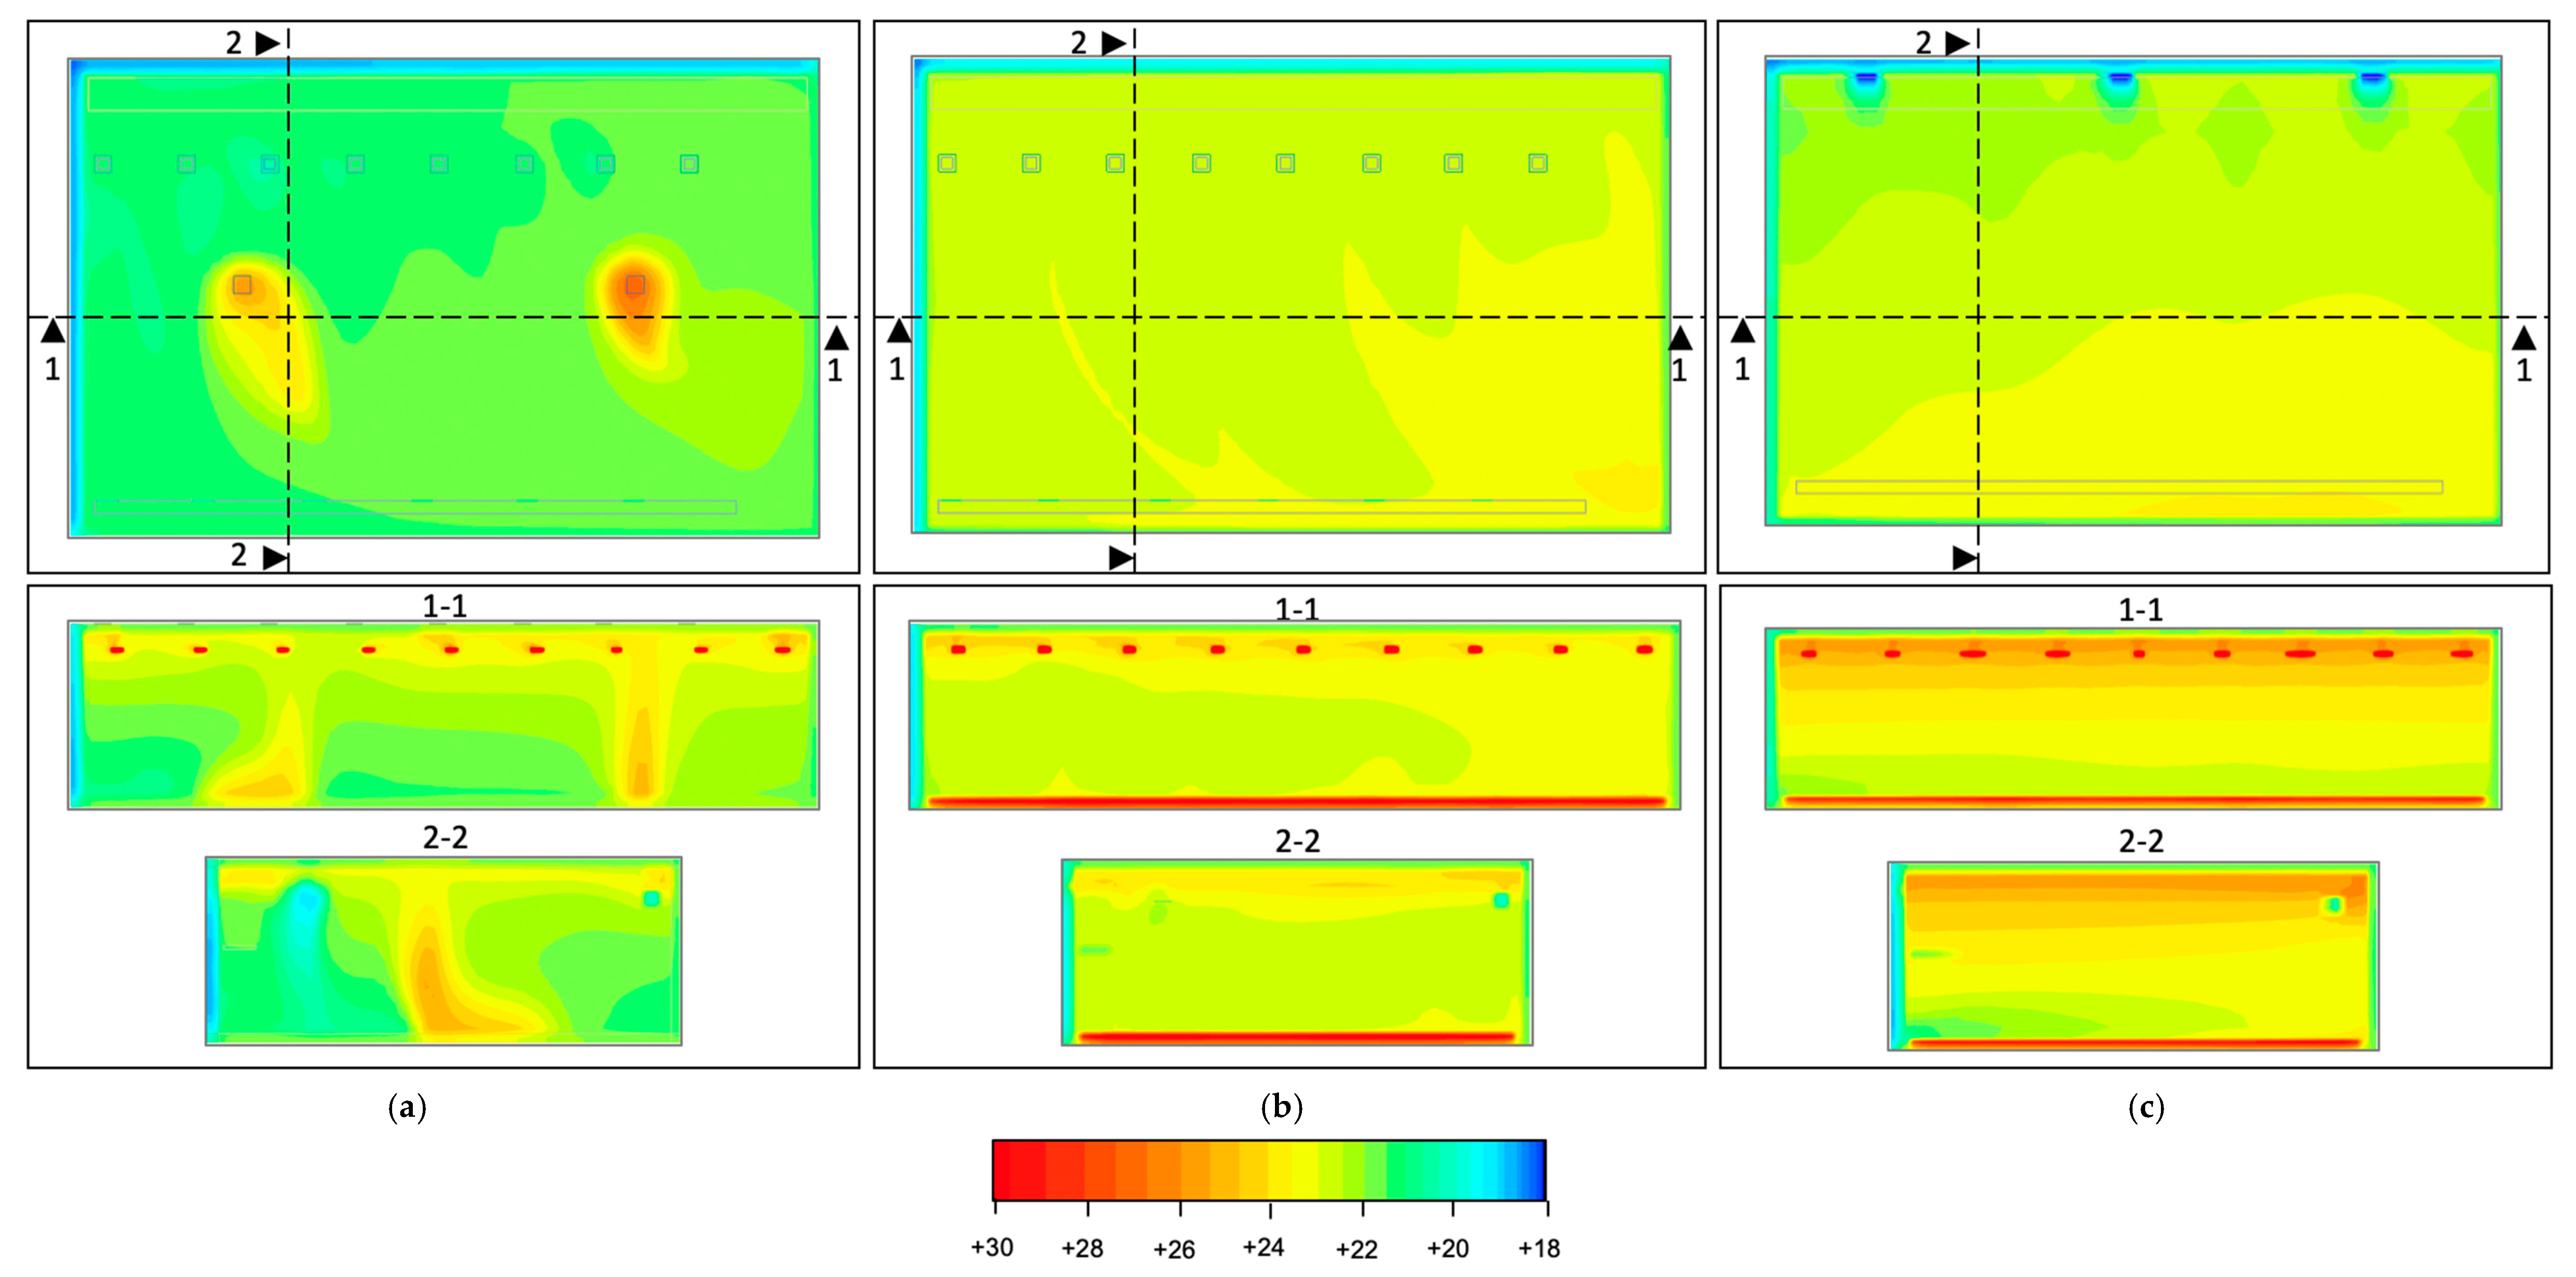
3.2. Numerical Results

The vertical indoor temperature gradient was also numerically calculated with a CFD simulation, and the results were compared with the measured values. Figure 6 presents the vertical temperature gradient for the following cases:
(a)
air heating combined with mechanical mixing ventilation from field measurements;
(b)
air heating combined with mechanical mixing ventilation from CFD predictions;
(c)
underfloor heating combined with mechanical mixing ventilation from CFD predictions;
(d)
underfloor heating combined with mechanical displacement ventilation from CFD predictions.
According to the field measurements, the vertical gradient of the case with air heating combined with mechanical mixing ventilation was measured to be 0.26 °C/m. The vertical temperature gradient, according to the CFD simulation, was calculated to be 0.16 °C/m, being in a good agreement with the measured value of 0.27 °C. In Figure 6, the vertical temperature gradients calculated for other HVAC configurations are presented. The vertical temperature gradient for the case with underfloor heating and mechanical mixing ventilation was calculated at 0.11 °C/m, and at 0.12 °C/m for the case with underfloor heating combined with mechanical displacement ventilation. As can be seen from the graphs presented in Figure 6, the temperature at the height of 1.7 m was calculated to be 22 °C with air heating combined with mechanical mixing ventilation. In the case of underfloor heating and mechanical mixing or displacement ventilation, the temperature at the same height was 23 °C. Lower temperatures in occupied zones is common in rooms heated by warm air heating systems. This difference shows that a lower heating load could be needed in cases with underfloor floor heating.
Figure 7 presents the vertical temperature distribution in the training hall for all analysed cases. CFD predictions show that more intense temperature stratification occurs in cases when air heating or displacement ventilation is used. Underfloor heating and the mixing ventilation pattern ensure an even distribution of the temperature in the hall. In the case of displacement ventilation, higher temperatures occur in the higher parts of the hall. The analysis of the results of the temperature measurement at the basketball training hall showed a slight change of the indoor temperature in the layer from the floor to a height of 3.9 m. An increase of the indoor temperature was observed in the zone from 3.9 m to the ceiling. In this layer, measurements were provided at heights equal to 5.4 m and 6.9 m. These indoor thermal conditions are in line with the Lithuanian norm requirement to keep indoor temperature between 15 °C and 25 °C.
Since CO2 concentration near the ceiling is permissible, it is possible to recycle the air from this zone and reuse it, thus saving energy for air heating. Another important criterion of the optimal heating and ventilation performance is the exploitation energy cost. Indoor temperature measurements at a height of 6.9 m show that temperature stratification indicates energy saving potential for high premises that could be combined with the option of periodic heating application, as the sport halls have quite uneven workload.
The installation of additional engineering equipment, such as destratification fans, can be analyzed for sports halls in order to achieve the most energy-effective solutions for such a type of premises. More intensive temperature stratification in the analyzed cases between 5.4 and 6.9 m height might be caused by the artificial lighting, since the analyzed hall has no natural lightning and all the experiments were performed with the lights switched on.
Despite high expectations for indoor air quality for professional athletes, soft floor surfaces are important, to avoid physical trauma. Soft floor surfaces can be achieved by keeping the surface warm, which avoids moisture condensation and ensures faster sweat evaporation. Fast sweat evaporation is especially relevant during the intensive workouts of basketball games, cases when the area employment is relatively dense. Additional analysis of relative humidity distribution and air movement speed at nearly ground level (0.1 m) would allow us to predict and evaluate the best heating and ventilation systems case for the sports hall.

4. Conclusions

In this study, the indoor thermal conditions in terms of thermal stratification in the basketball training hall of Žalgirio Arena, Kaunas in Lithuania, was assessed with the use of field measurements and numerical simulation. The main conclusions of this study can be summarized as follows:
  • Lithuanian normal requirements to keep indoor temperatures between 15 °C and 25 °C are met in the analyzed sports hall space for heights up to 5.4 m, using an air heating and mechanical mixing ventilation combination.
  • CO2 concentration was measured at a maximum value of 951 ppm in the occupied zone, indicating that the combination of the air heating and the mechanical mixing ventilation ensures high indoor air quality, with an air change rate of 1.1 h−1.
  • The experimental results show that the mixing ventilation application, together with air heating, allows higher temperatures in the occupied zone than in the case of air heating without ventilation.
  • CFD simulations revealed that using the same heating output for air heating, underfloor heating combined with mechanical mixing, or displacement ventilation ensures higher temperatures in the occupied zone, creating the potential for energy savings.
  • The numerical analysis also showed that the highest temperature in the 0.1 m level to avoid a slippery floor surface could be reached with an underfloor heating and mechanical mixing ventilation combination case.
The findings of this study support the necessity for the integration of numerical assessment methods into the design stage of large spaces and public buildings. This practice would assist in the optimal choice of HVAC equipment for large halls, as well as other design aspects, such as the optimal position or operational conditions of the equipment. In view of the pan-European target for nearly-zero-energy buildings, the findings of this study emphasize the gaps and limitations of the energy performance of sports halls. Future work on this subject should include the investigation of additional HVAC systems, as well as the measurement and simulation of more properties of sports halls, including air pollutants, radiant temperature, and air velocities. The hypothesis that the comfort indicators of the Fanger system may not apply in sports halls should also be further investigated in a future work.

Author Contributions

Conceptualization, L.S. (Lina Seduikyte); L.S. (Laura Stasiulienė); methodology, L.S. (Lina Seduikyte); L.S. (Laura Stasiulienė); validation, T.P., D.M., M.D.; formal analysis, L.S. (Lina Seduikyte); L.S. (Laura Stasiulienė); investigation, J.Č., T.Ž., M.D.; resources, D.M., T.P., M.D.; data curation, T.P., D.M., J.Č., T.Ž., M.D.; writing—original draft preparation, L.S. (Lina Seduikyte); L.S. (Laura Stasiulienė); writing—review and editing, P.F.; visualization, L.S. (Laura Stasiulienė); supervision, L.S. (Lina Seduikyte), P.F.; project administration, L.S. (Lina Seduikyte), P.F.

Funding

This research received no external funding.

Conflicts of Interest

The authors declare no conflict of interest.

References

  1. Chow, W.K.; Fung, W.Y.; Wong, L.T. Preliminary studies on a new method for assessing ventilation in large spaces. Build. Environ. 2002, 37, 145–152. [Google Scholar] [CrossRef]
  2. Trianti-Stourna, E.; Spyropoulou, K.; Theofylaktos, C.; Droutsa, K.; Balaras, C.A.; Santamouris, M.; Papanikolaou, N. Energy conservation strategies for sports centers: Part A. Sports halls. Energy Build. 1998, 27, 109–122. [Google Scholar] [CrossRef]
  3. Andrade, A.; Dominski, F.H.; Coimbra, D.R. Scientific production on indoor air quality of environments used for physical exercise and sports practice: Bibliometric analysis. J. Environ. Manag. 2017, 196, 188–200. [Google Scholar] [CrossRef] [PubMed]
  4. Johnson, C.J.; Moran, J.C.; Paine, S.C.; Anderson, H.W.; Breysse, P.A. Abatement of toxic levels of carbon monoxide in Seattle ice-skating rinks. Am. J. Public Health 1975, 65, 1087–1090. [Google Scholar] [CrossRef] [PubMed]
  5. Braniš, M.; Šafránek, J.; Hytychová, A. Exposure of children to airborne particulate matter of different size fractions during indoor physical education at school. Build. Environ. 2009, 44, 1246–1252. [Google Scholar] [CrossRef]
  6. Stathopoulou, O.I.; Assimakopoulos, V.D.; Flocas, H.A.; Helmis, C.G. An experimental study of air quality inside large athletic halls. Build. Environ. 2008, 43, 834–848. [Google Scholar] [CrossRef]
  7. Rajagopalan, P.; Luther, M.B. Thermal and ventilation performance of a naturally ventilated sports hall within an aquatic centre. Energy Build. 2013, 58, 111–122. [Google Scholar] [CrossRef]
  8. Kamar, H.M.; Kamsah, N.B.; Ghaleb, F.A.; Alhamid, M.I. Enhancement of thermal comfort in a large space building. Alex. Eng. J. 2019, 58, 49–65. [Google Scholar] [CrossRef]
  9. Mateus, N.M.; Da Graça, G.C. Simulated and measured performance of displacement ventilation systems in large rooms. Build. Environ. 2017, 114, 470–482. [Google Scholar] [CrossRef]
  10. Gil-Lopez, T.; Galvez-Huerta, M.A.; O’Donohoe, P.G.; Castejon-Navas, J.; Dieguez-Elizondo, P.M. Analysis of the influence of the return position in the vertical temperature gradient in displacement ventilation systems for large halls. Energy Build. 2017, 140, 371–379. [Google Scholar] [CrossRef] [Green Version]
  11. Rajagopalan, P.; Elkadi, H. Thermal and Ventilation Performance of a Multi-functional Sport Hall within an Aquatic Centre. In Proceedings of the Building Simulation 2011: 12th Conference of International Building Performance Simulation Association, Sydney, Australia, 14–16 November 2011; pp. 2815–2821. [Google Scholar]
  12. El-Kadi, E.W.M.A.; Fanny, M.A. Architectural designs and thermal performances of school sports-halls. Appl. Energy 2003, 76, 289–303. [Google Scholar] [CrossRef]
  13. Zhao, K.; Liu, X.H.; Jiang, Y. Application of radiant floor cooling in large space buildings—A review. Renew. Sustain. Energy Rev. 2016, 55, 1083–1096. [Google Scholar] [CrossRef]
  14. Stamou, A.I.; Katsiris, I.; Schaelin, A. Evaluation of thermal comfort in Galatsi Arena of the Olympics Athens 2004 using a CFD model. Appl. Therm. Eng. 2008, 28, 1206–1215. [Google Scholar] [CrossRef]
  15. Tsoka, S. Optimizing indoor climate conditions in a sports building located in Continental Europe. Energy Procedia 2015, 78, 2802–2807. [Google Scholar] [CrossRef]
  16. Fanger, P.O. Thermal Comfort; Danish Technical Press: Copenhagen, Denmark, 1970; p. 242. [Google Scholar]
  17. ISO. Moderate Thermal Environments—Determination of the PMV and PPD Indices and Specifications of the Conditions for Thermal Comfort; International Organization for Standardization: Geneva, Switzerland, 1994; Standard 7730:1994. [Google Scholar]
  18. Fokaides, P.A.; Jurelionis, A.; Gagyte, L.; Kalogirou, S.A. Mock target IR thermography for indoor air temperature measurement. Appl. Energy 2016, 164, 676–685. [Google Scholar] [CrossRef]
  19. Nord, N.; Mathisen, H.M.; Cao, G. Energy cost models for air supported sports hall in cold climates considering energy efficiency. Renew. Energy 2015, 84, 56–64. [Google Scholar] [CrossRef] [Green Version]
  20. Revel, G.M.; Arnesano, M. Perception of the thermal environment in sports facilities through subjective approach. Build Environ. 2014, 77, 12–19. [Google Scholar] [CrossRef]
  21. Arnesano, M.; Revel, G.M.; Seri, F. A tool for the optimal sensor placement to optimize temperature monitoring in large sports spaces. Autom. Constr. 2016, 68, 223–234. [Google Scholar] [CrossRef]
  22. Kisilewicz, T.; Dudzińska, A. Summer overheating of a passive sports hall building. Arch. Civ. Mech. Eng. 2015, 15, 1193–1201. [Google Scholar] [CrossRef]
  23. Suo, H.; Angelotti, A.; Zanelli, A. Thermal-physical behavior and energy performance of air-supported membranes for sports halls: A comparison among traditional and advanced building envelopes. Energy Build. 2015, 109, 35–46. [Google Scholar] [CrossRef]
  24. Nielsen, P.V. Fifty years of CFD for room air distribution. Build. Environ. 2015, 91, 78–90. [Google Scholar] [CrossRef]
  25. EN 13779:2007. Ventilation for Non-residential Buildings—Performance Requirements for Ventilation and Room-conditioning Systems; European Committee for Standardization: Brussels, Belgium, 2007. [Google Scholar]
Figure 1. Basketball training hall view.
Energies 12 02243 g001
Figure 2. Heating and ventilation equipment, as well as measurement equipment locations in the training hall (S1–S8: locations of stands; E, S: locations of CO2 m).
Energies 12 02243 g002
Figure 3. Example of training hall geometry in a computational fluid dynamics (CFD) model (isometric view (a) and plan (b) of the case with warm air heating and mechanical mixing ventilation). The “+” indicates the location of the monitor points.
Energies 12 02243 g003
Figure 4. Indoor temperature measured at different conditions for the same location.
Energies 12 02243 g004
Figure 5. Indoor temperature measured at different conditions for the same height.
Energies 12 02243 g005
Figure 6. Numerical calculation of the vertical temperature gradient for the case with warm air heating combined with mechanical mixing ventilation from field measurements (a), warm air heating combined with mechanical mixing ventilation from CFD predictions (b), underfloor heating combined with mechanical mixing ventilation from CFD predictions (c), and underfloor heating combined with mechanical displacement ventilation from CFD predictions (d).
Energies 12 02243 g006
Figure 7. Temperature distribution for the cases with warm air heating combined with mechanical mixing ventilation (a), underfloor heating combined with mechanical mixing ventilation (b), and underfloor heating combined with mechanical displacement ventilation (c).
Energies 12 02243 g007
Table 1. Conditions under which the field measurements of indoor temperature were conducted.
SymbolCondition
B_T1Before basketball training, without operating ventilation systems or people
B_T2Before basketball training, with operating ventilation systems, without people
TDuring basketball training, with operating ventilation systems and people (at heights above 5.4 m)
A_T1After basketball training, with operating ventilation systems, without people
A_T2After basketball training, without operating ventilation systems or people
Table 2. Kruskal-Wallis test statistics for spatial distribution.
Measurement Points
S1S2S3S4S5
Kruskal-Wallis H256.616193.943130.158211.743239.548
df55555
Asymp. Sig. (p-values)p < 0.01p < 0.01p < 0.01p < 0.01p < 0.01
Table 3. Kruskal-Wallis test statistics for stratification distribution.
Measurement Height
0.1 1.72.53.95.46.9
Kruskal-Wallis H104.04486.20454.54282.484133.129204.204
df444444
Asymp. Sig. (p-values)p < 0.01p < 0.01p < 0.01p < 0.01p < 0.01p < 0.01

