Article

Wave Power Output Smoothing through the Use of a High-Speed Kinetic Buffer

1
Electrical Engineering Department, Universidad Carlos III de Madrid, 28911 Madrid, Spain
2
Division of Electricity, Department of Engineering Sciences, The Angstrom Laboratory, P.O. Box 534, SE-75121 Uppsala, Sweden
*
Author to whom correspondence should be addressed.
Energies 2019, 12(11), 2196; https://doi.org/10.3390/en12112196
Submission received: 13 April 2019 / Revised: 6 May 2019 / Accepted: 6 June 2019 / Published: 10 June 2019

Abstract

:
In this paper, a new control strategy for power output smoothing in a hybrid wave energy installation coupled to a flywheel energy storage system (FESS) is proposed. The control scheme is composed by three stages: a wave generator clustering process at the farm connection point; a power filtering process; and the control of the flywheel energy storage in order to improve the power output of the hybrid wave farm. The proposed control is validated at the existing Lysekil Wave Energy Site located in Sweden, by using real generator measurements. Results show that the application of the flywheel energy storage system reduces the maximum peak power output from the wave energy installation by 85% and the peak/average power ratio by 76%. It is shown that the proposed system can reduce grid losses by 51%, consequently improving the energy efficiency of the power network. The application of the proposed control strategy allows the hybrid wave power plant to follow a power reference signal that is imposed by the grid operator. In addition, the study demonstrates that the application of the proposed control allows the hybrid wave power plant to follow a power reference signal that is imposed by the grid operator. In addition, the study demonstrates that the application of the proposed control enables a wave farm with flywheel energy storage to be a controllable, flexible resource in order to fulfill future grid code requirements for marine energy installations.

1. Introduction

In 2016, the World Energy Council stated that the global marine generation capacity was 92 PWh/year, which points to the possibility that wave energy could become more competitive compared with other forms of renewable generation in the future [1]. Nevertheless, despite its viability, the costs are still high. The installation and operation of grid-connected wave energy plants still need to overcome technological barriers and gaps in important knowledge to meet economy of scale criteria. Apart from the problems derived from generation unit costs, wave energy sources also face a variety of environmental, infrastructural, and socioeconomic obstacles, such as the uncertainty of grid-connected infrastructures, obstacles related to integration with the electricity market, and power quality problems.
One of the most important barriers to effective wave energy integration with power networks is the high variability in the power generated by wave energy sources. It must be highlighted that these energy installations are located in coastal areas, which generally have weak grids that necessitate strategies to manage their associated issues; such actions include voltage regulation, frequency leveling, power factor correction, and harmonic mitigation. In addition, these wave energy installations lack specific grid code technical requirements that define their specific power capabilities. Consequently, the existing grid codes have proved to be inadequate for wave energy installations [2].
The aforementioned barriers show that there is a need for efficient control tools to enhance the regulation of power output by wave energy sources [2]. Comparatively few research has been dedicated to power smoothing at wave energy installations. Most of the research publications related to marine installations have focused on the design of the wave front-end interface [3,4,5], the study of the transmission technology [6], or the mechanical design [7,8,9,10,11].
Very few techniques have been proposed to improve the wave power output, and these can be classified on the basis of whether they use an electrical energy storage system (ESS) to accomplish their goal [12]. Some studies have proposed clustering a set of wave energy converters (WECs) in order to generate power that can be injected into the grid with reduced oscillations without needing to use an ESS. Power output aggregation also improves the on-shore connection system [13]. Other studies have used ESSs to mitigate short-term voltage fluctuations. However, in these applications, it has been found that the rating of the ESSs increases as the installed WEC power increases [14,15,16]. In [17], supercapacitors were used to improve wave farm power output at laboratory installations. However, only regular waves were considered, and the behavior of synthetic regular waves differs greatly from real wave conditions. From this aspect, it must be noted that the use of ESSs has proved to be effective for smoothing wave power output. In spite of this, the use of flywheels in marine energy installations is very rare, mainly because it is not easy to coordinate the operation of wave energy generators by controlling the energy stored in the flywheel.
The contributions of this paper are threefold:
  • The development of control methods for power output regulation at hybrid wave energy installations combined with a flywheel is presented. The proposed control strategy can be used for wave power output regulation in order to satisfy future grid codes for marine energy sources.
  • The proposed control considers the application of flywheel ESSs for wave energy plants to smooth the power output delivered to the grid.
  • It is worth highlighting that the developed control strategies were applied using data from an existing wave emplacement, namely, the Lysekil Wave Energy Site located in Sweden.
The proposed control is able to improve not only the power injected into the grid but also the power following capabilities of the wave power installation. The modeling and control were validated at the experimental wave power plant located at the Lysekil Wave Energy Site developed by Uppsala University in Sweden. To this end, data gathered from the real emplacement were later utilized to implement the developed control algorithms.

2. Wave Energy Characteristics

Wave energy resources are three times the size of currently available resources and almost double the energy density, and they offer higher forecast accuracy when compared with wind and solar renewable sources [3]. With respect to the annual production ratio, WECs work 90% of the hours of the year; this ratio is significantly greater than the 20–30% of other renewable generation technologies, such as solar and wind [12]. It is estimated that 10% of the energy consumed by the European continent could be supplied solely by marine energy by the year 2050. However, despite the advantages that wave energy presents and the availability of its resources, it is necessary to overcome a series of challenges: to become a competitive technology, a great investment in marine energy development must be made so that the installation costs can be reduced, grid integration can be optimized, and grid code requirements can be met [18].
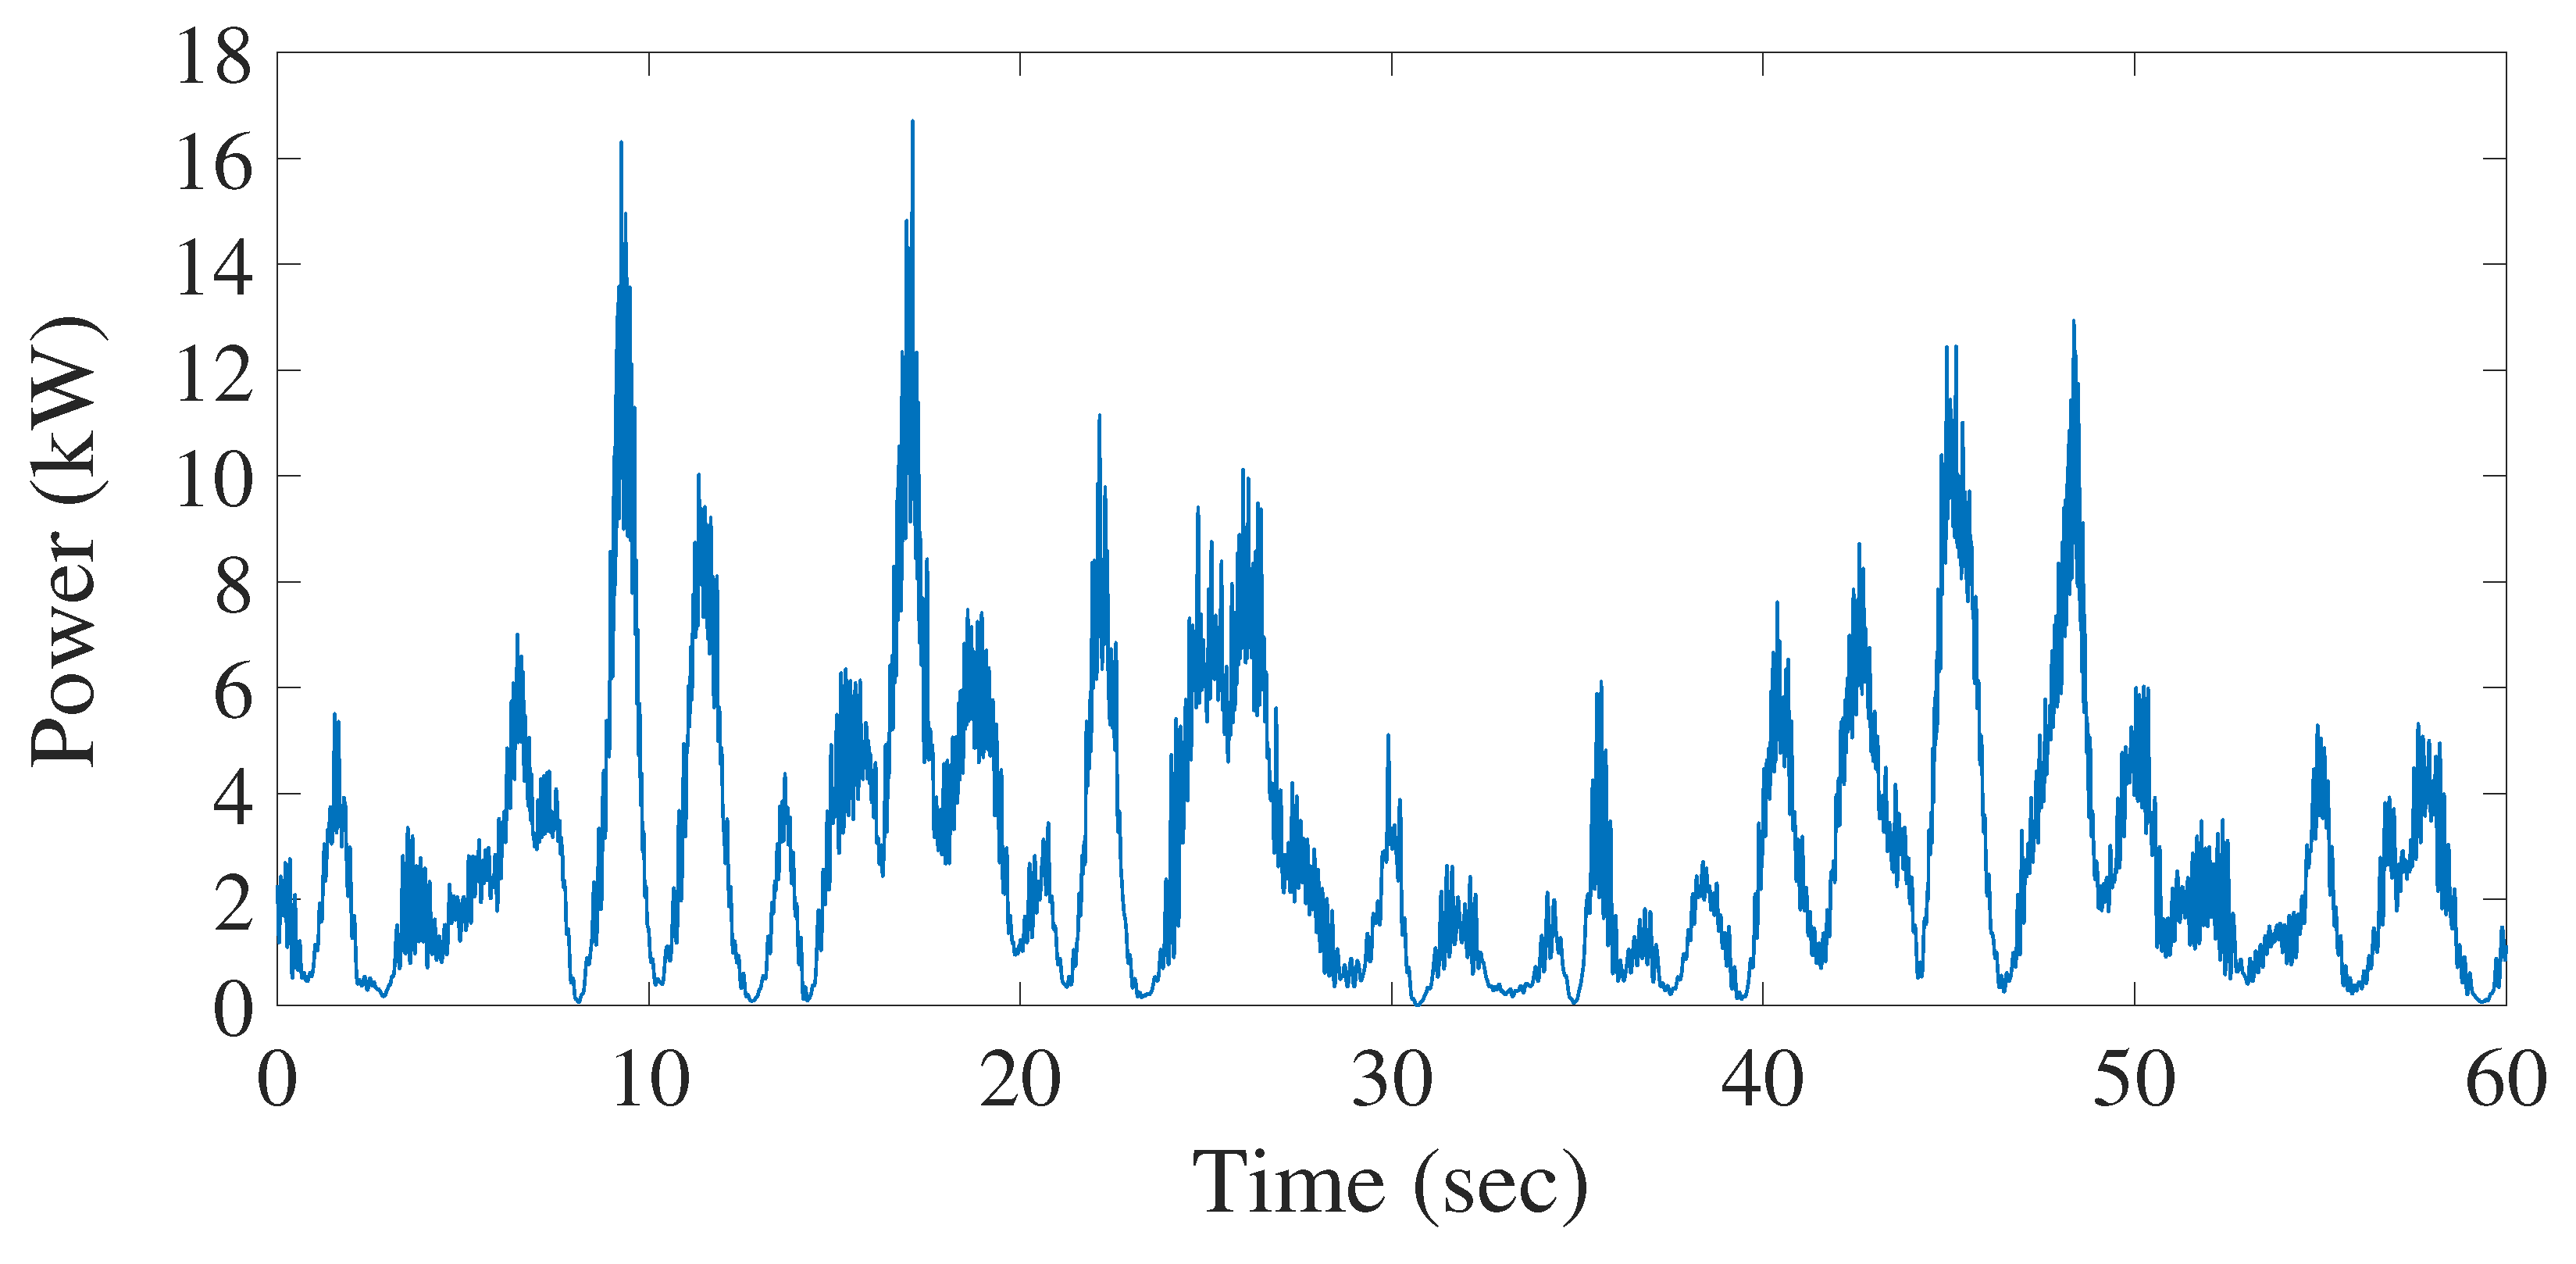
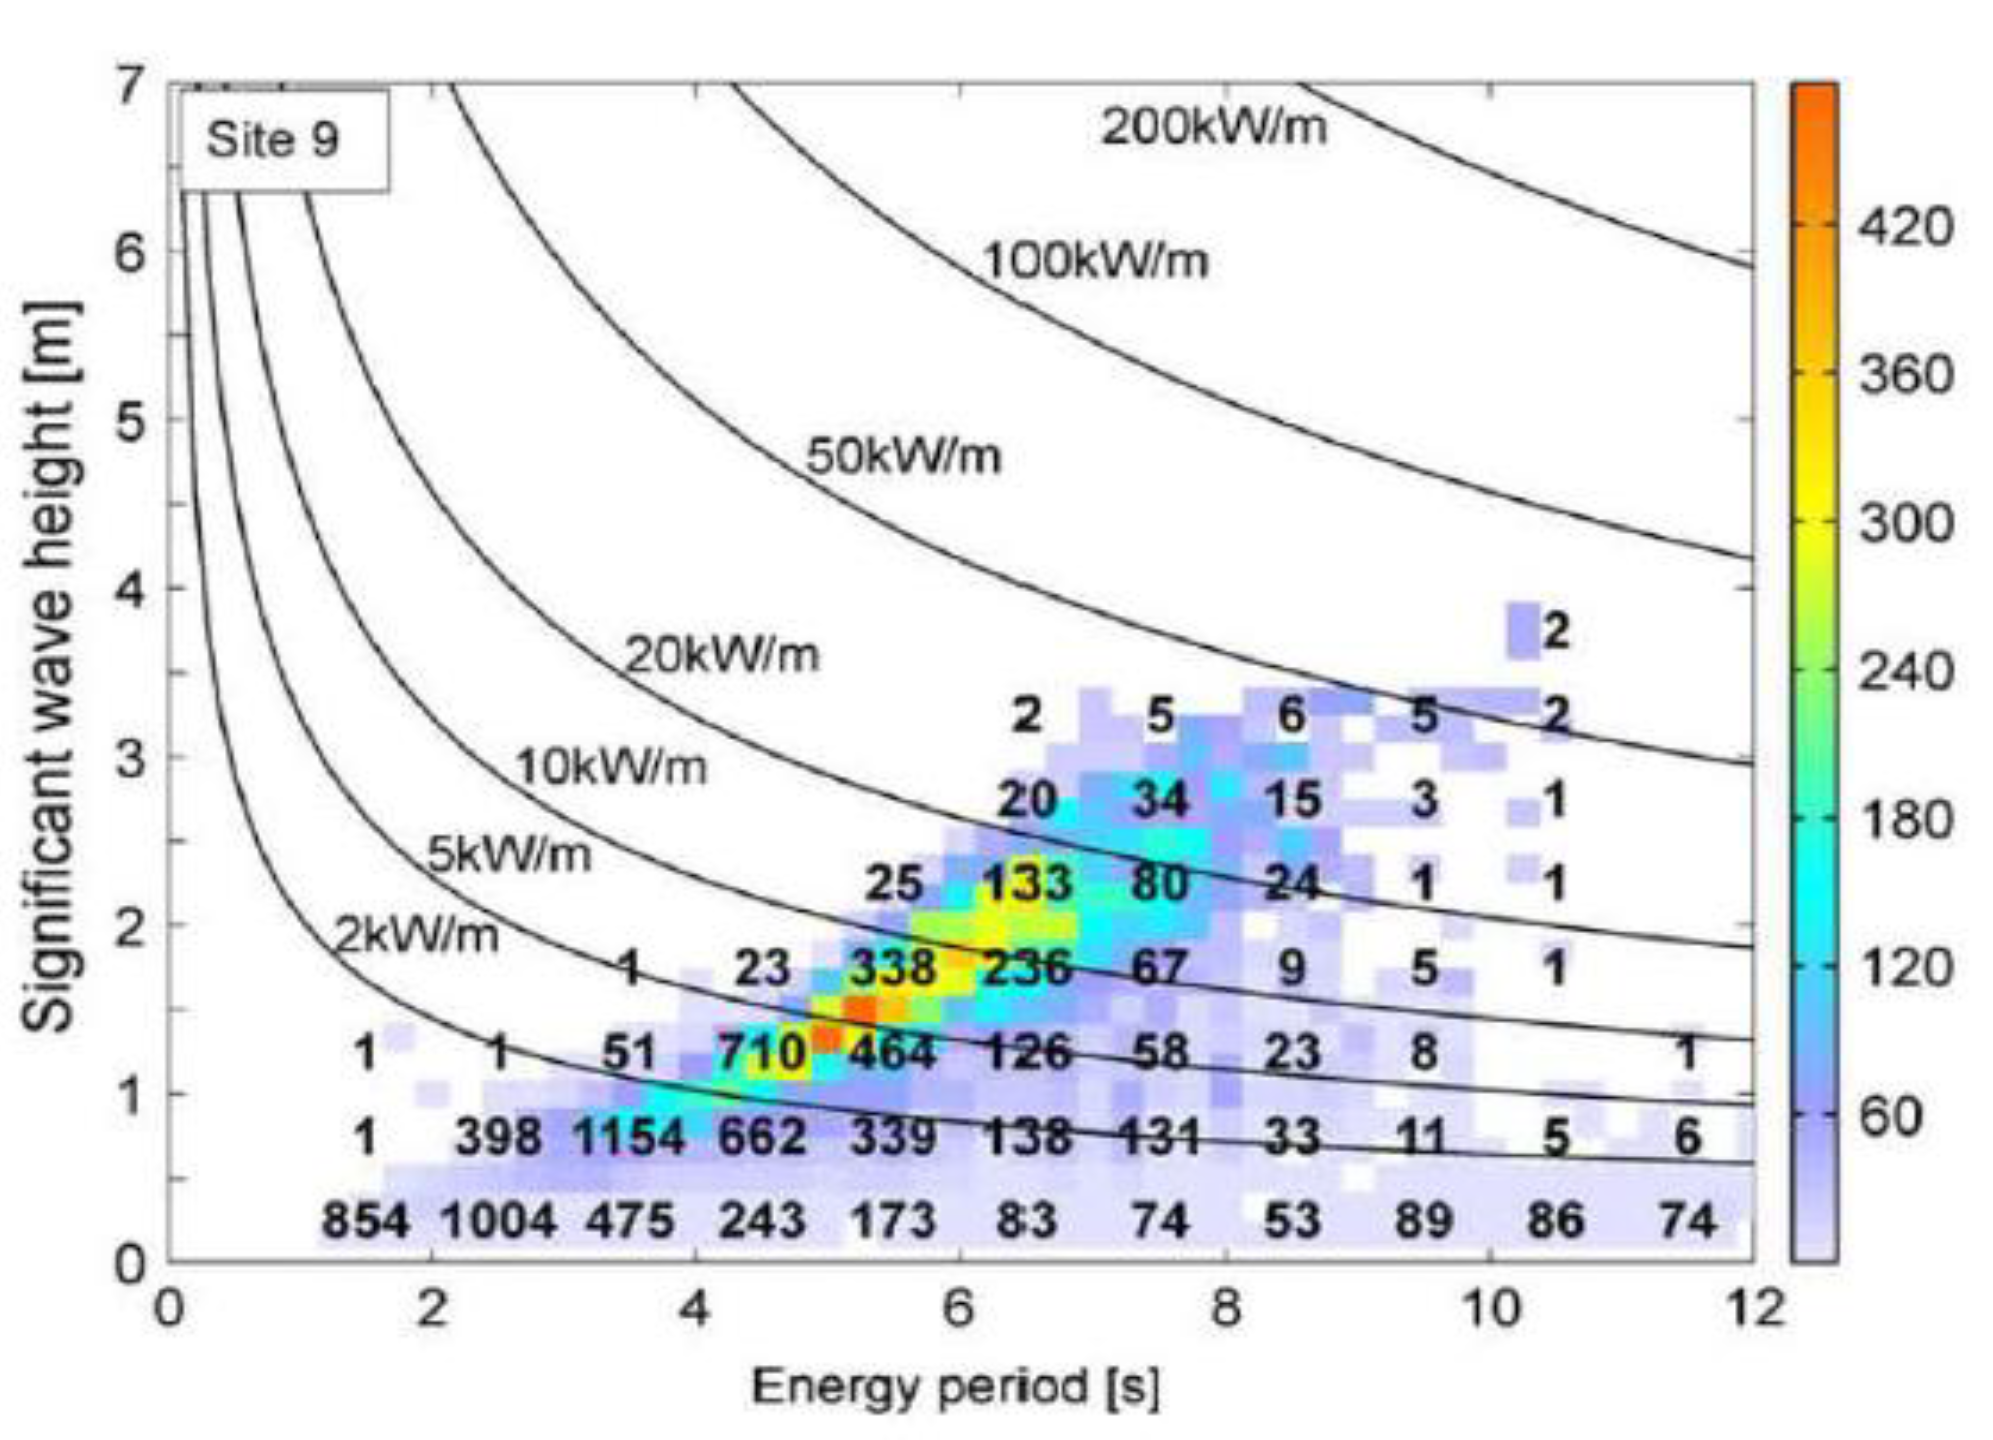
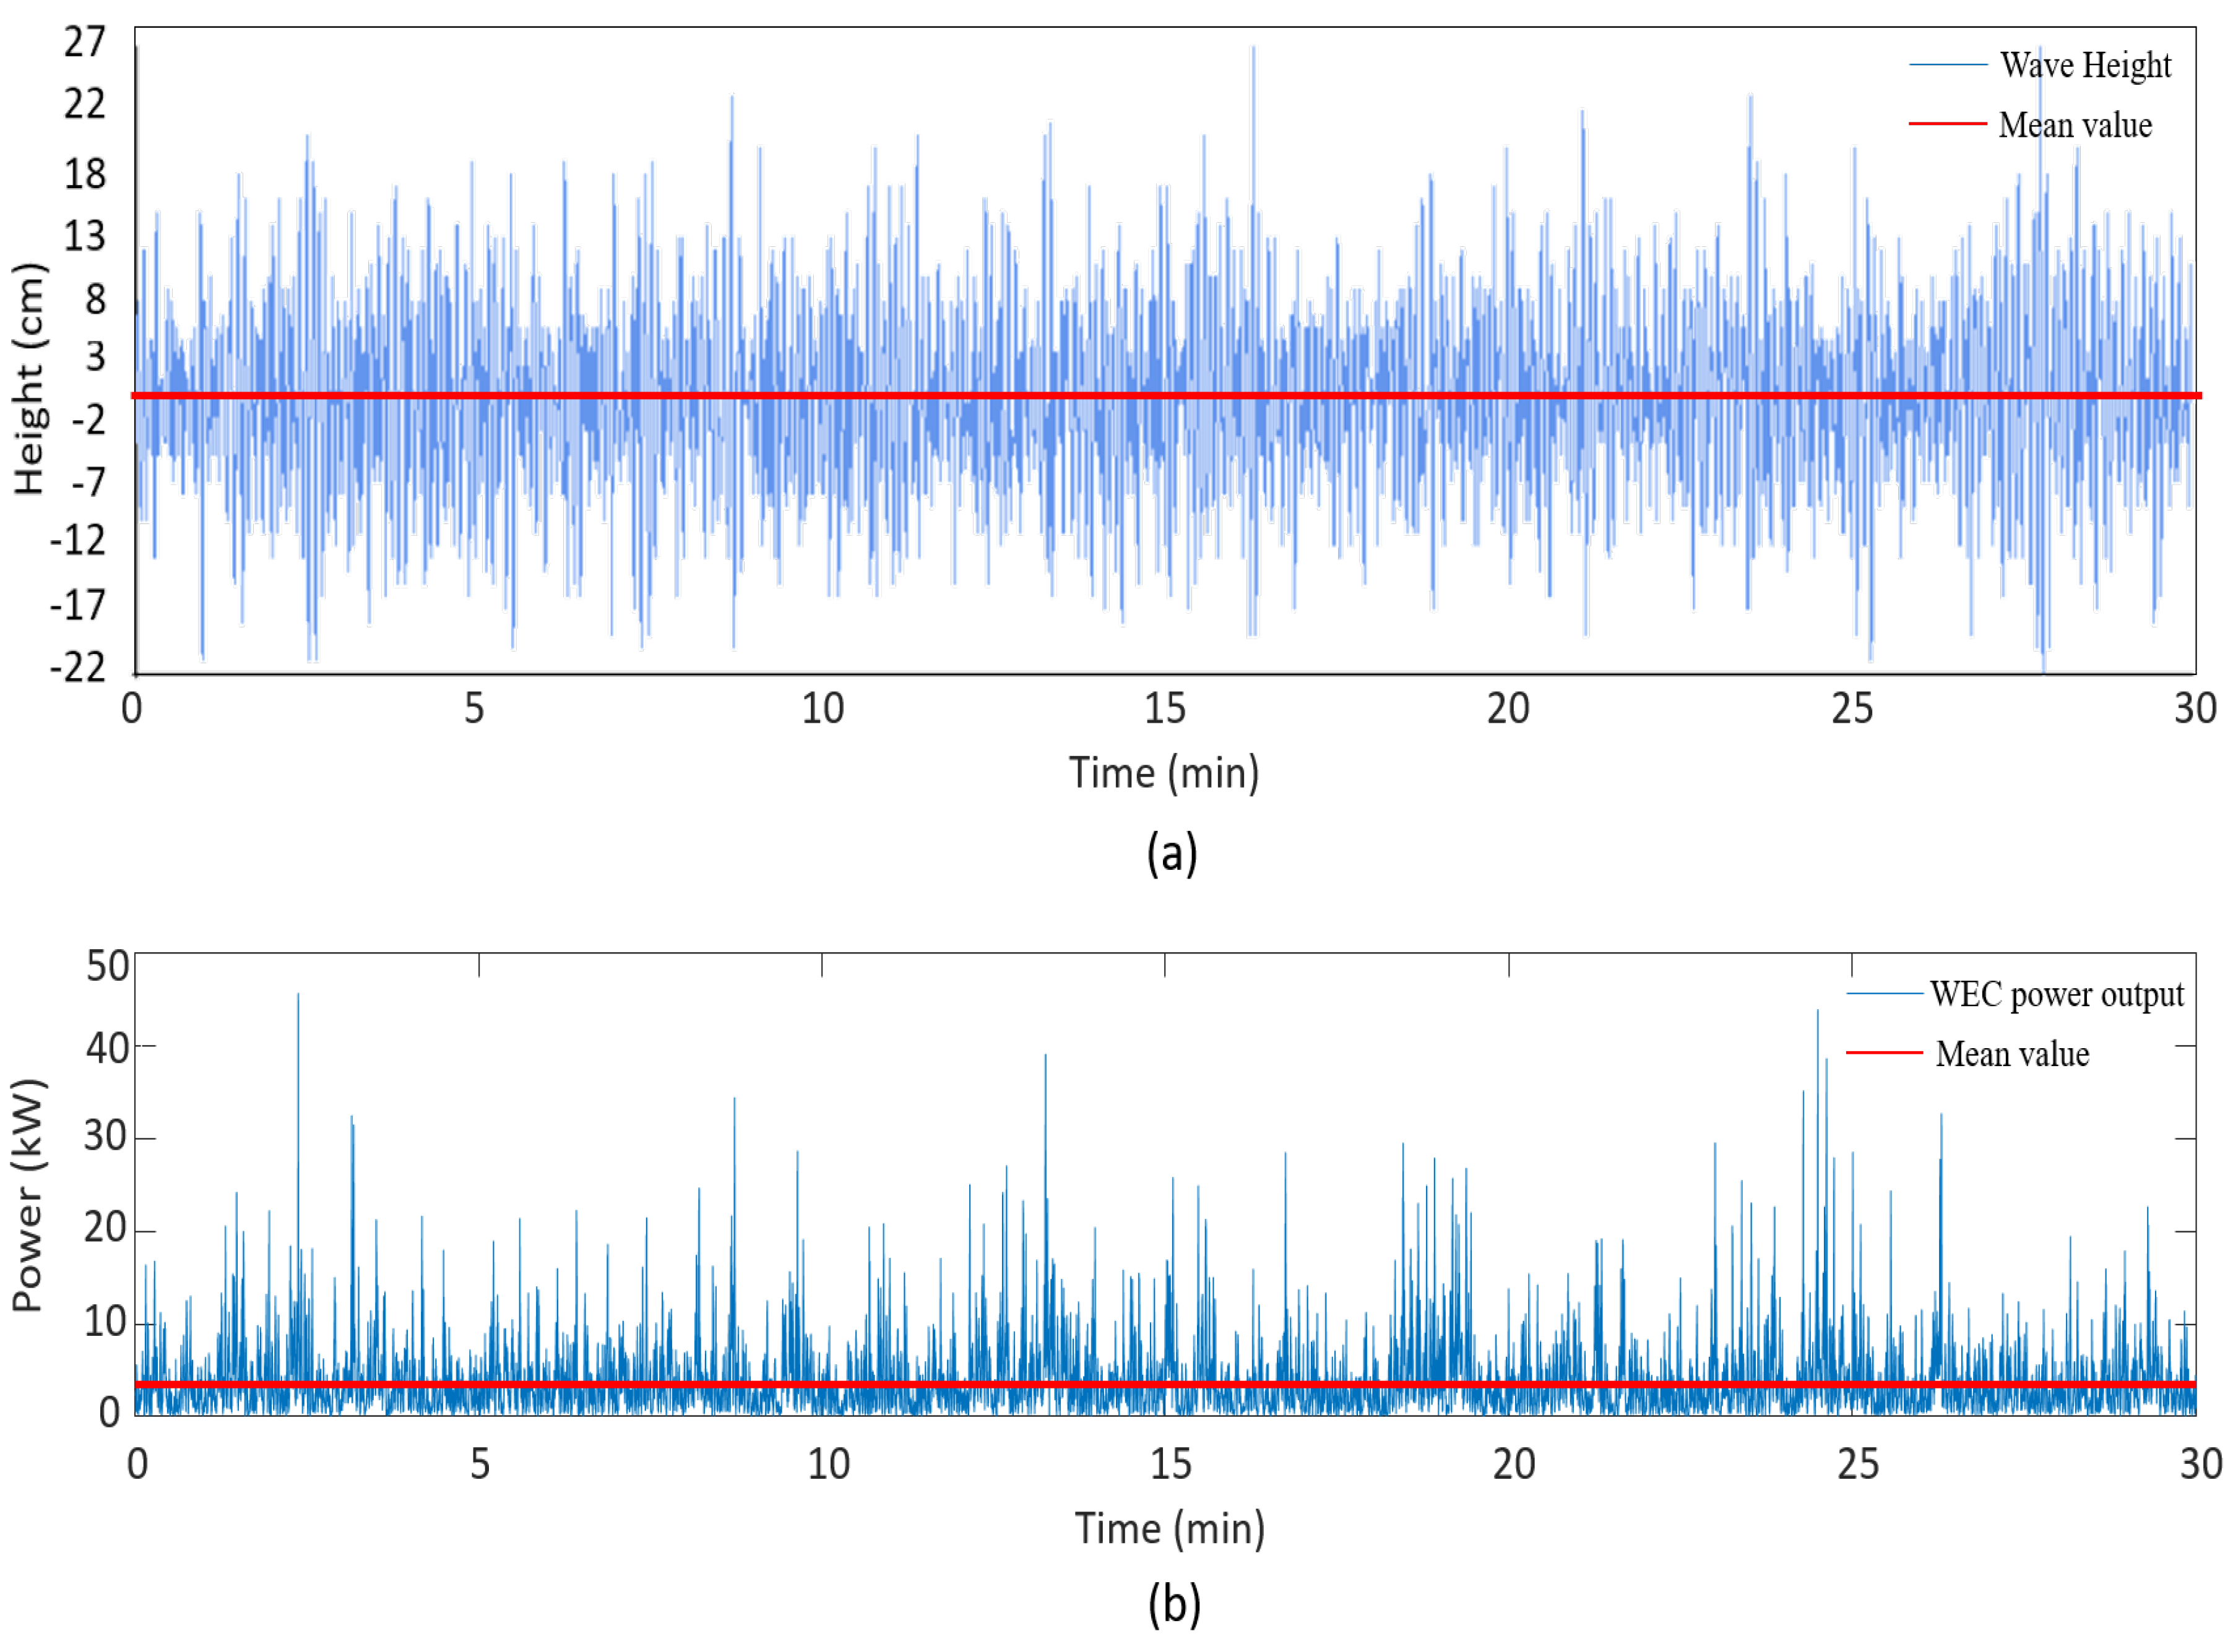
  • Wave energy is characterized by the height and frequency of the waves, which experience constant variation; as a result, a marine installation’s power output does not comply with the quality criteria required for electric grids. To improve the power quality of the delivered energy, it is possible to install storage systems in marine emplacements or even group wave generators in a way that allows oscillations of the power output of some units to be compensated by the power output of other units in the same cluster.
  • Wave direction is very changeable, and for this reason, it is necessary to carry out exhaustive studies to determine the optimal location of the marine generation units’ mooring systems.
  • With respect to grid connection requirements, there are no grid codes regulating the coupling of marine generation emplacements; therefore, the codes that have been used for wind installations are applied instead. However, the variability in the power output that marine installations inject into the grid must be considered because their behavior differs greatly from other installations.
Figure 1 shows an example of the power output that corresponds to the permanent magnet linear generator WEC installation at the Lysekil Marine Platform in Sweden. In this case, there are three WEC units that are formed by a surface buoy connected to a linear generator moored to a foundation on the seabed [19,20,21]. It can be seen in Figure 1 that in a one-minute time interval, the power output of the marine installation shows great power oscillations. As it can be noted, marine production presents a peak power about 17 kW, which is equivalent to more than 5.8 times the mean power delivered to the grid, i.e., 2.88 kW. There is great irregularity found in a WEC’s power production as a consequence of the variability in wave natural energy resources, and this irregularity makes the grid integration of this technology difficult to achieve.

3. Wave Power Output Signal Improvement

Converting wave energy into electricity involves three fundamental steps: wave resource absorption, wave power transmission, and electricity generation (Figure 2). However, wave power is a non-controllable and intermittent energy source. This huge variability in the power output attributed to wave energy emplacements necessitates the implementation of a fourth step with respect to the conversion process. The application of signal conditioning devices in this state is particularly crucial in installations that use direct-driven wave energy converters. The reason for this is that there is no mechanical stage between wave resource absorption and electricity generation that can absorb the oscillations caused by wave motion.
To improve the wave power output, several techniques have been implemented, and these can be classified on the basis of whether they use electrical energy storage systems to accomplish their goal [12].
Techniques that do not employ storage systems to improve the power output include the following:
  • The first approximation consists of clustering a set of WECs at the same connection point (PCC) in order to generate power that can be injected into the grid with reduced oscillations. This power output aggregation also improves the on-shore connection system [22].
  • Another option is the control of the wave power converter. The active control of the power take-off (PTO) system can improve the power output of a grid-connected marine emplacement [23].
  • In those cases in which hydraulic PTOs are used, it is possible to reduce the power output oscillations by means of water accumulators at sea level [24]. The system utilized by overtopping reservoirs allows for a small power output regulation. Nevertheless, storing wave energy in its hydraulic form in other types of installations could lead to extra installation costs [25].
Among ESSs that have been used to mitigate short-term voltage fluctuations are the following examples:
  • Capacitors were used in [26], in which a power converter controlled the charge/discharge operation to smooth the power output oscillations of the marine installation. It was demonstrated that the size of the capacitor depends on the size of the installed WEC power. Consequently, its use is restricted to small wave energy plants.
  • In [17], supercapacitors were used to improve the wave farm power output of laboratory installations, and synthetic regular waves were used as input signals (see Figure 3).
Energy storage systems coupled with wave installations must handle very a fast reaction time and must be able to cope with hundreds of charge/discharge cycles per day [27].

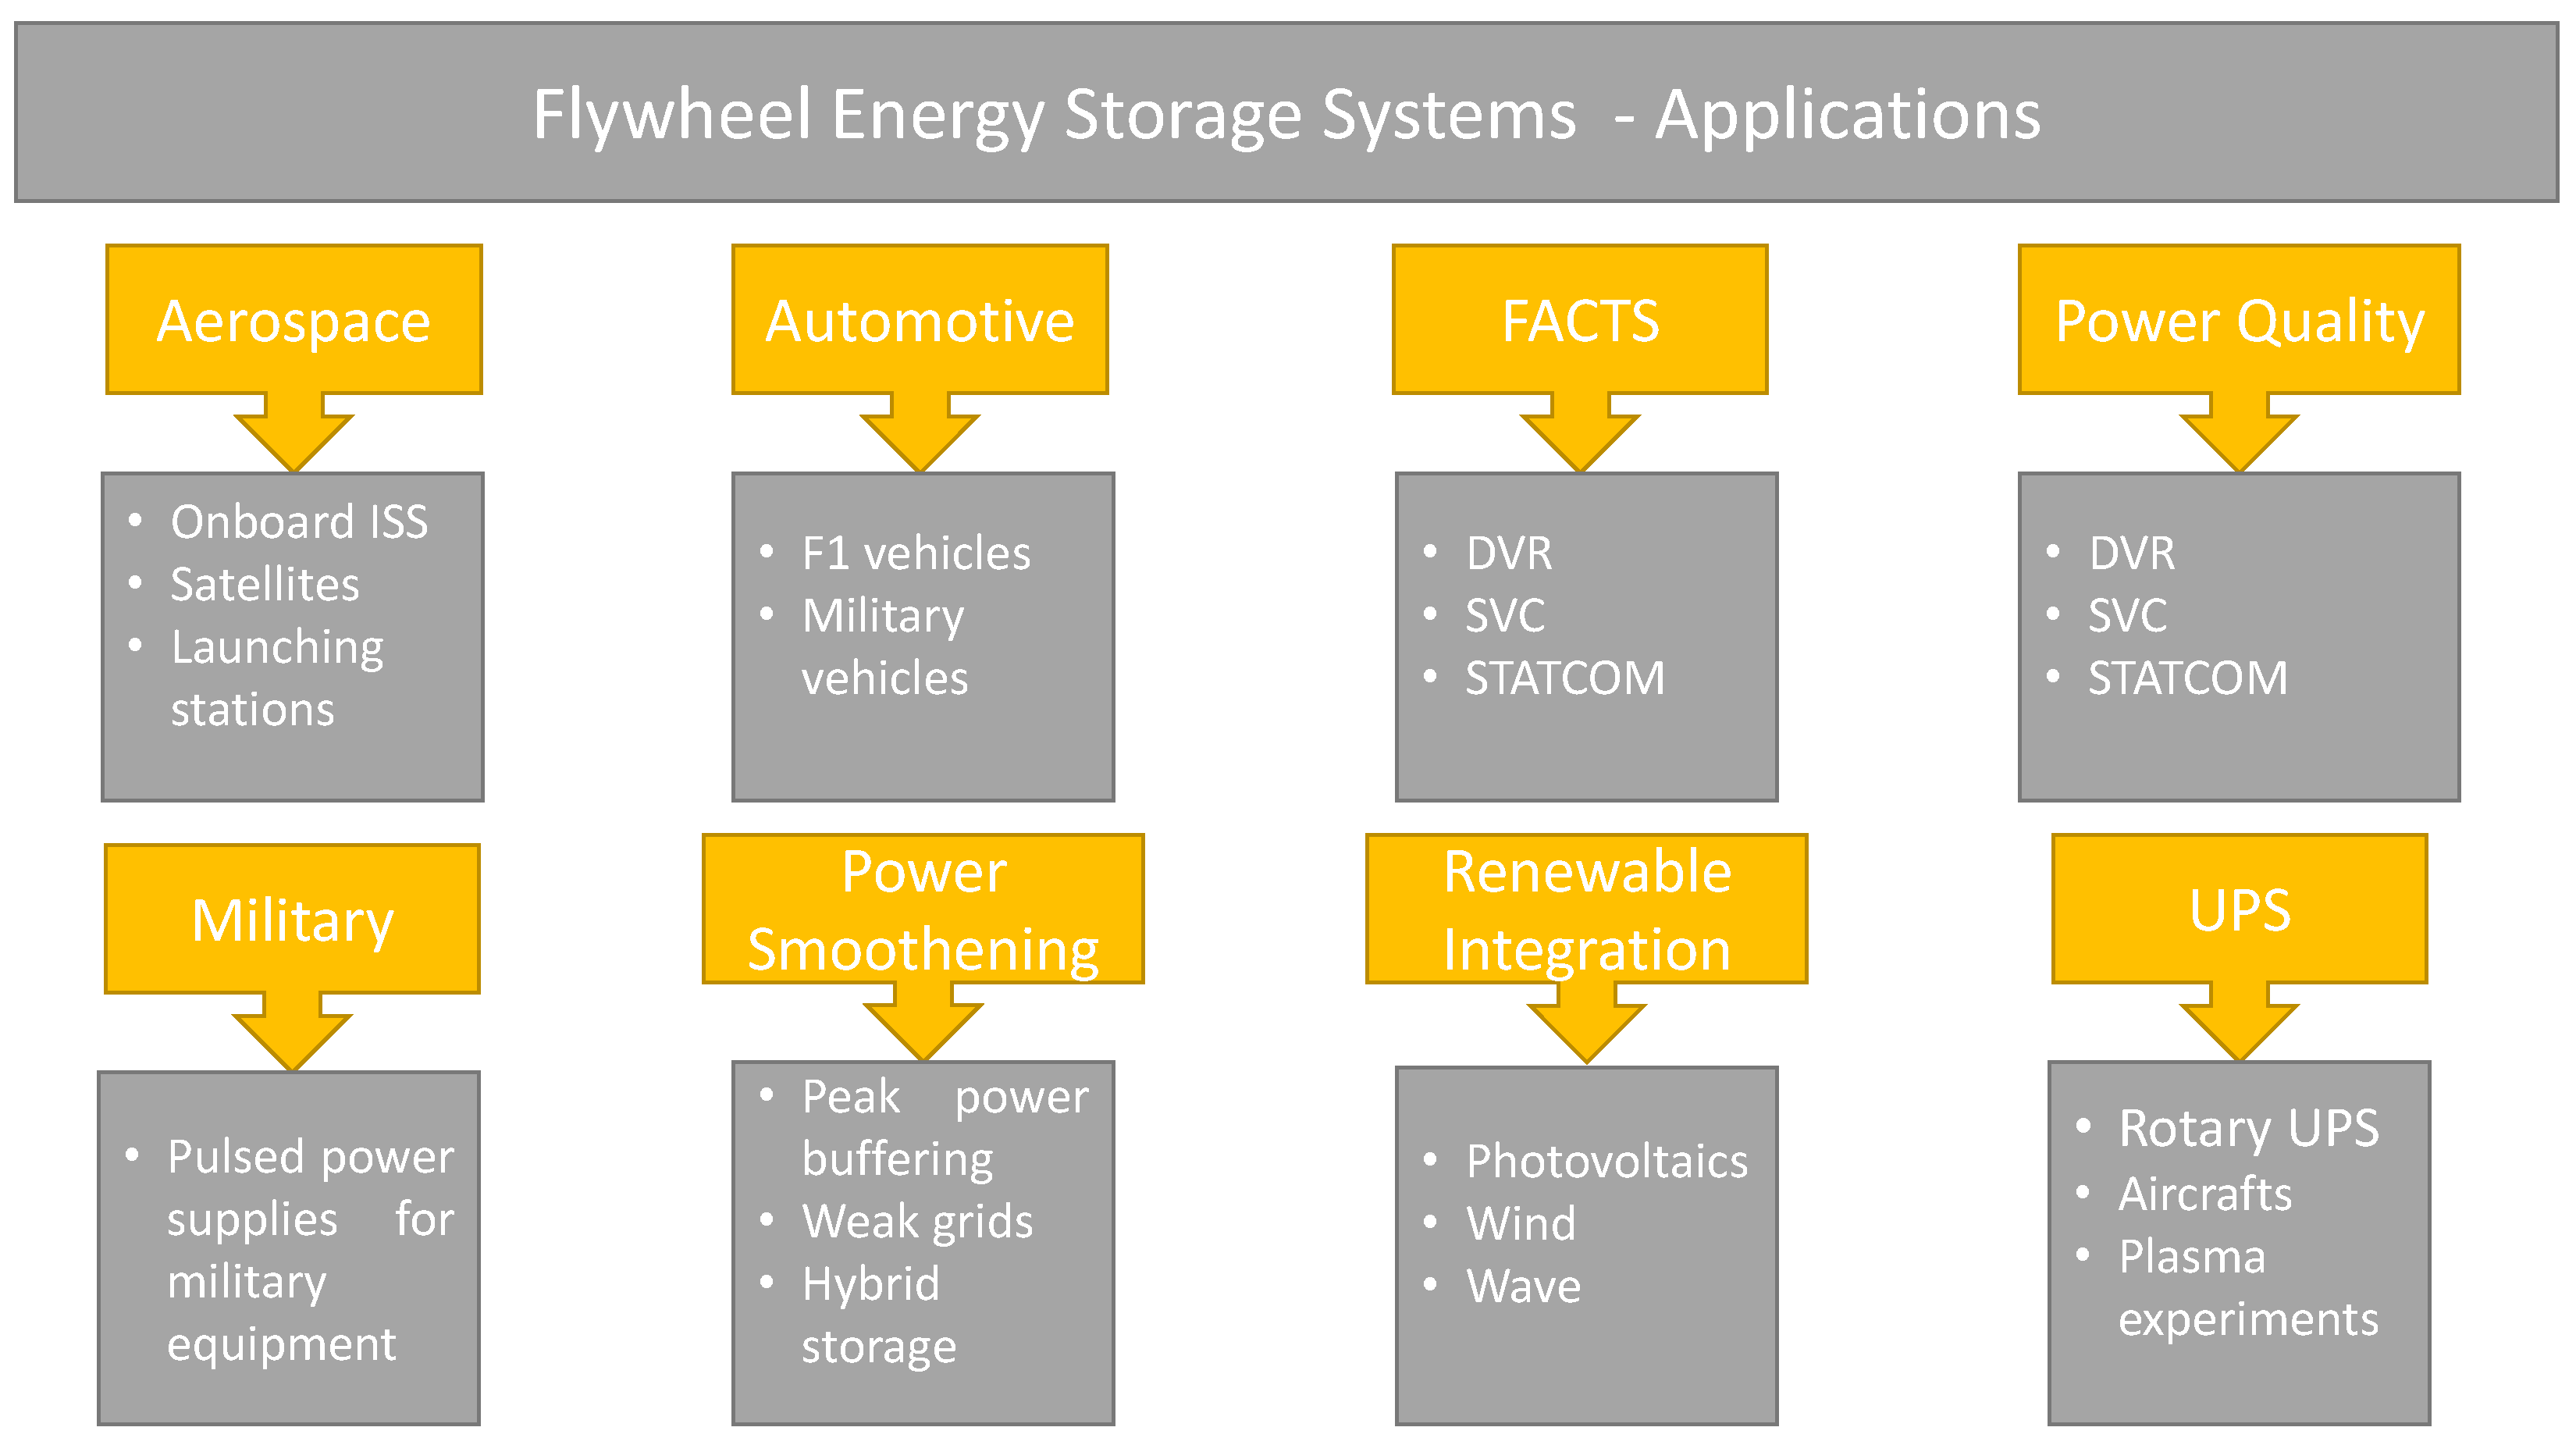
4. Flywheel Energy Storage Systems

Power systems are currently experiencing a high penetration of small stochastic distributed generation units. Energy storage systems present themselves as promising alternatives for addressing the great variability associated with the power output variability and power quality delivered to the grid. This is because ESSs can either deliver a great amount of energy in short time periods or provide energy to the power systems over longer periods [28]. According to [29], there are at least 11 types of energy storage systems with different specifications and different market shares. Overall, batteries are the cheapest and most extended storage system, but flywheels have emerged as a very competitive technology. Power electronic converters have been applied extensively in wind power installations [30]. They can be used for controlling variable-speed wind turbines and also for improving the reactive power capability at the connection point [31]. The use of power electronic converters for power quality applications is normally related to voltage waveform quality [32] and the continuity of supply, but they are not able to perform power smoothing without an additional storage system. This is an important distinction from a flywheel energy storage system (FESS), which can be used for either power quality purposes (as can be performed by power electronic equipment) or power output smoothing (which cannot be performed by power electronic equipment). An FESS consists of a rotational mass that is capable of storing an amount of kinetic energy that is directly proportional to the mass and the square of its rotational speed. For energy production purposes, these rotational masses either store or deliver electricity by means of converting the kinetic energy into electrical energy when coupled with a motor or generator.
The main components of an FESS are as follows [33] (Figure 4):
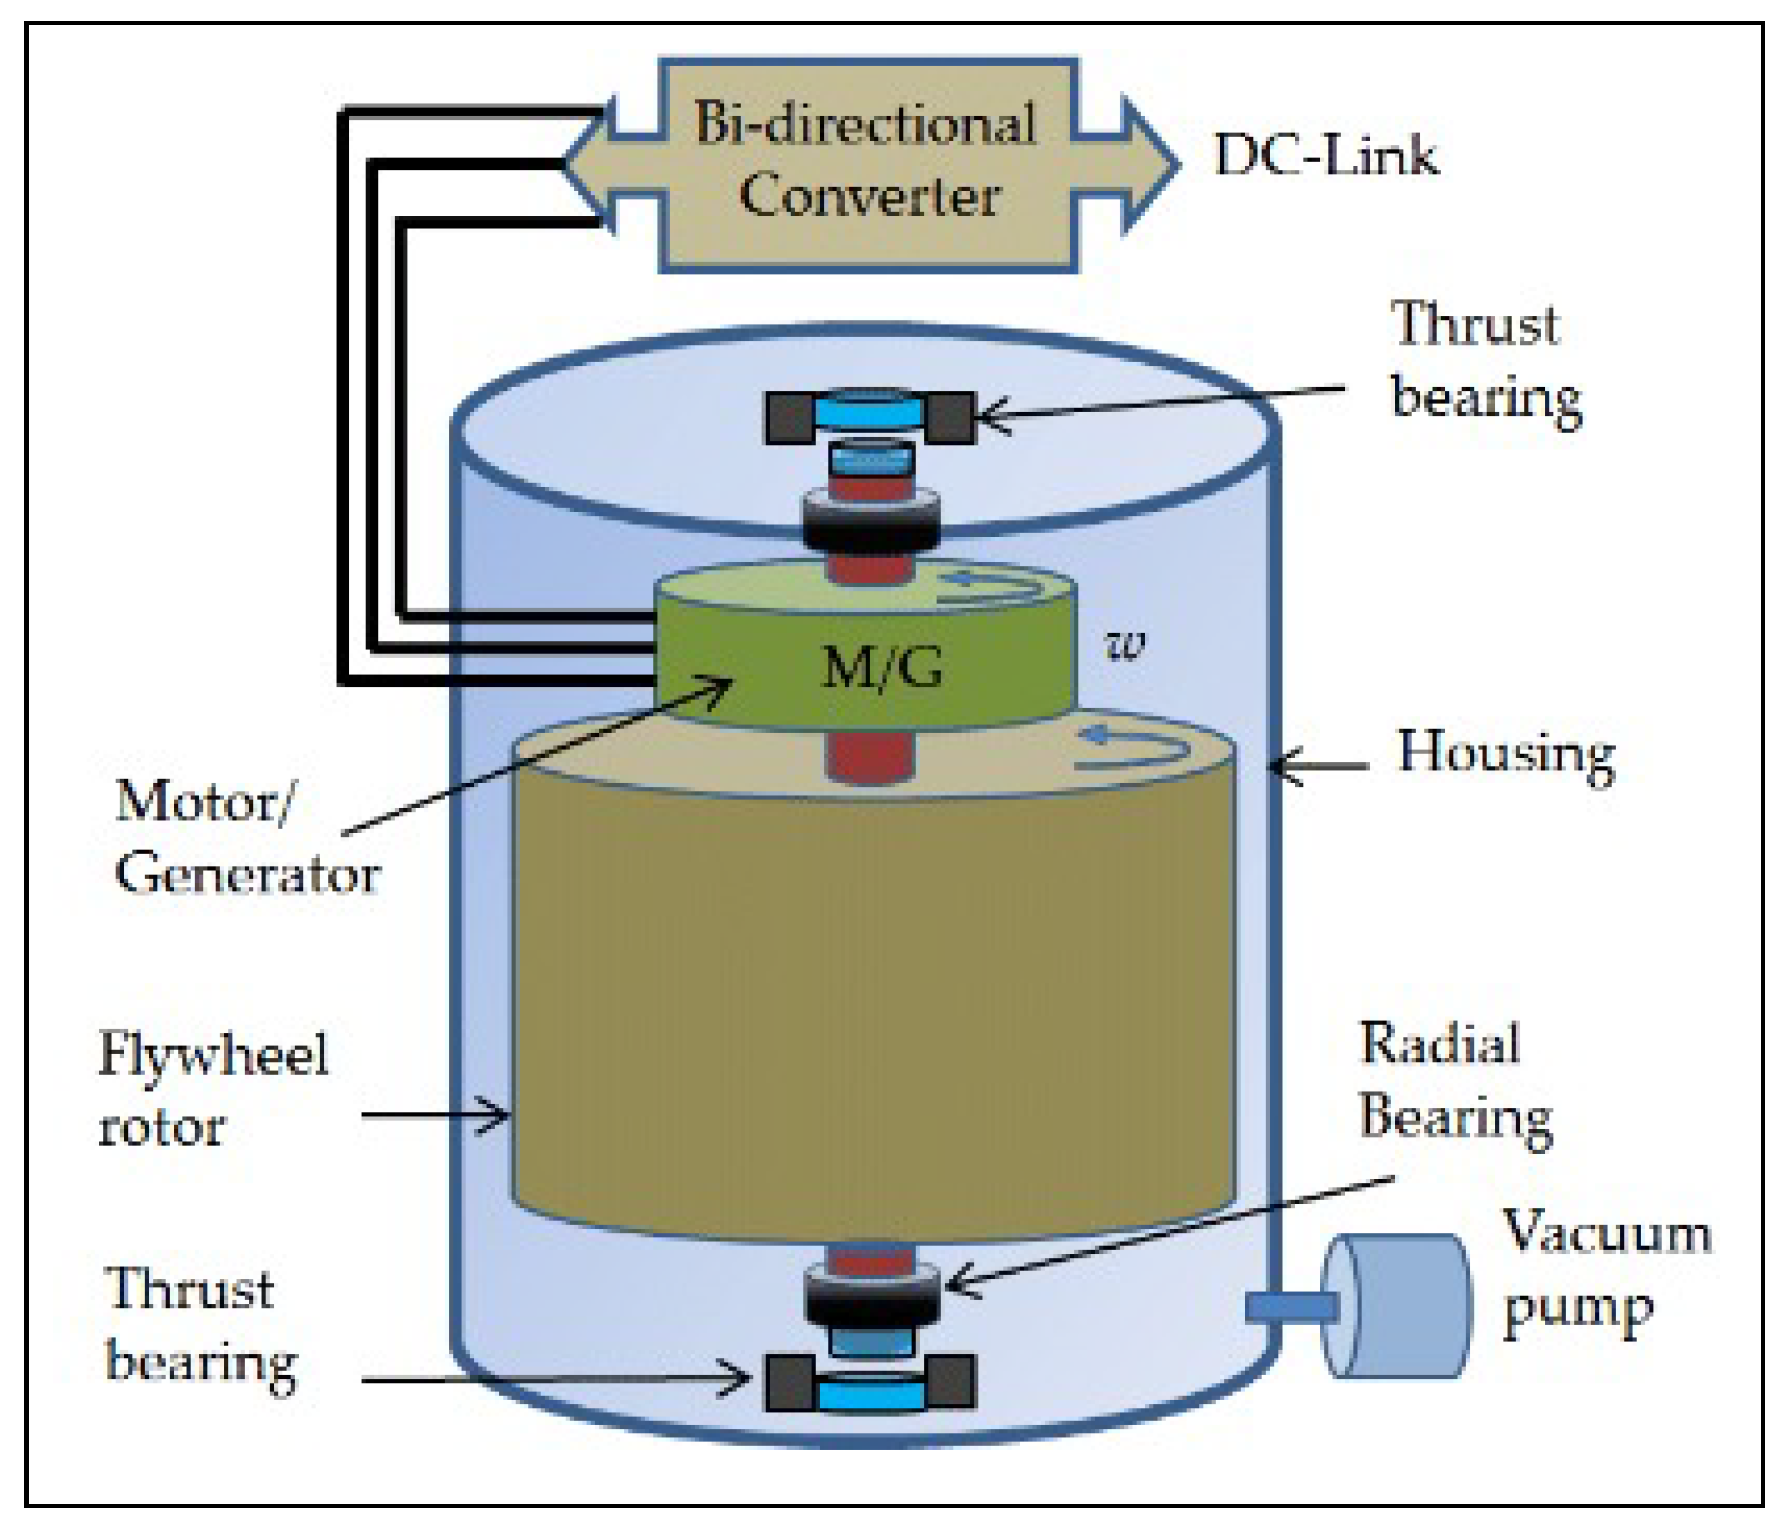
  • The primary component is a rotating mass that is commonly known as a flywheel. The rotating mass is able to store kinetic energy, so the bigger the size of the flywheel, the greater the stored energy. The stored kinetic energy is strongly dependent on the mass rotational speed.
  • An electrical machine is in charge of transforming the mechanical energy to electrical energy or vice versa (generator/motor).
  • Power electronics are used for controlling the performance of the electrical machine.
  • Magnetic bearings hold the flywheel’s weight.
  • An external inductor is used for improving the Total Harmonic Distortion (THD) that is created by the generators of the permanent magnets in the electrical machine.
Several types of electrical machines can accompany the flywheel when the charge/discharge process takes place. These types of machines include the permanent magnet synchronous machine (PMSM) [34], brushless DC electrical machine (BLDCM) [35], induction machine (IM) [36], switched reluctance machine (SRM) [37], homopolar machine (HM) [38], synchronous machine (SM) [39], or bearingless electrical Machine (BM) [40]. Rotor bearings are classified as permanent (Passive) magnetic (PMB), active magnetic (AMB), and superconducting magnetic (SMB). Mechanical bearings have practically fallen into disuse since the implementation of their magnetic counterparts.
In general, FESSs are connected to the grid by means of power converters that help to control the energy storage operation. The back-to-back topology represents a scheme in which there is an AC/DC converter after the grid that is coupled with a flywheel storage system, and there is also one placed after an AC/DC converter. This topology is seen in [41].
Flywheels also have several applications aside from merely ensuring power quality and load management, as seen in Figure 5 [27,42,43,44]. Flywheels have high standby losses. These are due to friction losses and are unavoidable. This is the reason that flywheels are only applied in cases of frequent charge/discharge cycles. However, this disadvantage is only relevant for applications with long standby periods.
Flywheels present some advantages when compared with electrical batteries:
  • First, flywheels do not require chemical components, so they have less impact on the environment and are considerably low-maintenance [27,29].
  • Moreover, flywheels have a higher power and energy density [27].
  • They also have a shorter charging time. This translates to a power output that can come from primary sources with high variability in a short period of time, such as wind and wave power [27].
  • Furthermore, they have higher efficiency (90–95%) [33]: for the same number of cycles, advanced Lead–Acid batteries have an efficiency between 75 and 90%, whereas Li-ion batteries register an efficiency of around 87% [29].
  • Flywheel ESSs are cheaper compared with other batteries storage systems, such as Li-ion and flow batteries [45], and because their performance does not degrade over time, they do not need to be replaced, contrary to the requirements of battery devices. In general, the economics of flywheel units is superior compared with battery technologies; for example, for one cycle per day, the battery cost of a Li-ion and flow battery can be up to 14.2% and 24% higher than the flywheel cost, respectively. This difference increases for three or more cycles per day, as shown in [45].
From the construction point of view, flywheel systems installed with WECs as part of an underwater installation require additional material treatment because they can be affected by water corrosion [46]. Moreover, two of the most important challenges in flywheel development are the weight and safety rotational speed, which limits its maximum energy capacity. Although implementation costs increase as the flywheel size increases, the initial construction costs can be offset by relevant savings associated with grid ancillary services, such as load shifting, demand response, congestion management, or energy savings.

4.1. Flywheel Components

Figure 4 depicts a typical flywheel’s structure and components. Three substructures are clearly differentiated, namely, a vacuum pump, a DC link, and flywheel housing. The vacuum pump regulates the removal of air inside the flywheel housing, and the DC link is connected to the motor/generator inside the housing by means of a bidirectional AC/DC converter.
The flywheel housing has several components, namely, the flywheel rotor and the motor/generator, which converts the kinetic energy stored in/delivered by the flywheel rotor into electrical energy. This energy is later sent to the DC link when it is working in generator mode. Both rotating masses are connected by means of their central shaft, whereas the electrical connection between the housing and rotating components is achieved by both thrust and radial bearings, which can be brushless or non-brushless depending on the technology.

4.1.1. Flywheel Rotating-Mass

The flywheel’s rotating mass is the key component of the FESS, and it consists of a disc capable of storing electrical energy in the form of kinetic energy. This energy storage makes it possible to smooth the power output of the installations, which are characterized by the high variability in a natural energy resource. The selection of the disc material is extremely important for establishing the operative characteristics of the device. Steel was used to manufacture flywheels when they were first fabricated, but this material presents stress limitations. In the 1970s, composite materials started being utilized for flywheel manufacturing because they can work at high speeds and support a large degree of the fatigue induced by rotational stress. For this reason, small, composite-based flywheels are used for functionalities that require performance speeds that are above 10,000 rpm, while those made of steel are utilized for applications that do not require such high speeds (up to 10,000 rpm).
Power and energy are decoupled in flywheel storage systems. The power rate is defined by the electrical machine that is coupled to the flywheel. Kinetic energy, E k , is defined by the moment of inertia J and the square of the rotational speed ω , as shown in (1).
E k = 1 2 J ω 2
From (1), it can be deduced that to increase the kinetic energy stored in the flywheel, actions need to be applied to change its moment of inertia or its angular speed. The moment of inertia is dependent on the mass and the disc ratio of the flywheel, as given in (2). Moreover, because the cylinder volume is directly proportional to the ratio r and the height h, the moment of inertia can be calculated according to (3), where ρ m is the material density of the flywheel’s rotating mass.
J = 1 2 m r 2
J = 1 2 ρ m π h r 4
Similarly, useful energy can be obtained in two different ways. The first way is by using the difference between the maximum and minimum rotational speeds, as defined in (4). The second way, which is given in (5), is based on the moment of inertia’s decomposition for a hollow cylinder, where m is the cylinder mass, r o u t e r is the outer radius, and r i n n e r is the inner radius [33].
E k = 1 2 J ( ω m a x 2 - ω m i n 2 )
E k = 1 2 m ω 2 ( r o u t e r 2 - r i n n e r 2 )

4.1.2. Magnetics Bearings

Magnetic bearings are located inside the FESS cavity, especially at the upper and lower parts of the disc that contains the flywheel’s rotating mass. The main function is to hold the weight of the flywheel disc, so it can thus be considered the main mechanical component of the FESS. The flywheel disc is maintained between the two magnetic bearings by the repelling electromagnetic forces that are generated inside the housing, and there is no need for them to be in contact with the disc. For this reason, flywheels that employ magnetic bearings have less frictional force than their mechanical counterparts; in addition, they can reach a higher rotational speed and have a longer life cycle and capacity with minimal maintenance [28]. To limit the friction of the elements contained in the housing, the housing is filled with low-pressure air or helium [47]. The main inconvenience with magnetic bearings is their control mechanism. When there are failures in the control system or overloads, it is necessary to have an additional mechanical bearing system.
There are currently three types of magnetic bearings: passive, active, and superconducting.
  • Passives: The main advantages of these elements are their low friction losses and low cost [48]. However, they are used as backup bearings because their performance presents instabilities.
  • Actives: These bearings are used as additional units to reduce rotor vibrations. Their main advantage is that they present higher controllability and longer life cycles than passive ones, but active magnetic bearings do present higher losses due to the existence of bias currents. Combining active and mechanical bearings is a good choice in terms of controllability, stability, viability, and costs [41].
  • Lastly, superconducting magnetic bearings are the most widely utilized type in applications that require high speed since they have more stability, longer life cycles, and lower losses. The main inconvenience is their very low operating temperature, which requires the addition of a cryogenic system that can provide these low temperatures. Consequently, the cost of the equipment increases [41].

4.1.3. Electrical Machine

The electrical machine plays a key role in FESSs because it acts as an electromechanical device in charge of establishing the energy interchange between the flywheel and the grid. At the same time, it converts electrical energy into mechanical energy and vice versa. In other words, the electrical machine works as a generator when the electric grid demands energy from the flywheel, in which case the speed of the flywheel is reduced; when the machine needs to act as a motor to store energy in the flywheel, its acceleration is increased. Permanent magnet synchronous machines (PMSGs) are the most commonly utilized electrical machines in FESSs because they present lower rotor losses, higher energy densities, and higher efficiency compared with other electrical machines. They are used in applications that require rotational speeds of about 50,000 rpm, but there are current developments that can reach ultrahigh velocities (150,000–300,000 rpm) [49].

4.1.4. Power Converters

Figure 6a shows the basic electrical scheme of a flywheel device. It can be observed that the flywheel disc is connected to an electrical machine that performs the electromechanical conversion. The electrical machine is connected to the grid by a back-to-back converter. In general, the flywheel’s electronic converters perform an AC/DC/AC conversion, with the back-to-back configuration being the most commonly used for FESSs [41]. The grid-side converter converts the AC voltage to DC. After the DC stage, the machine-side converter converts the DC voltage back to AC. Because the electrical machine works as a generator or a motor, grid-connected converters are bidirectional. The machine-side converter is in charge of controlling the rotational speed and the power interchange by means of active power regulation. On the other hand, the grid-side converter takes care of maintaining the DC-link voltage at constant levels. When the electrical machine works as a motor, the machine-side converter works as a power inverter, while the grid-side converter works as a rectifier. When working as a generator, the machine-side and grid-side converters work as a rectifier and inverter, respectively. When the flywheel is utilized to improve the power output of the DG units, which can be wind or wave energy, the flywheel can use the machine-side converter only, and it is connected to the DC link of the back-to-back DG converters (see Figure 6b). In this case, the grid-side converter should account for the rated capacity of both the DG and the flywheel [41].

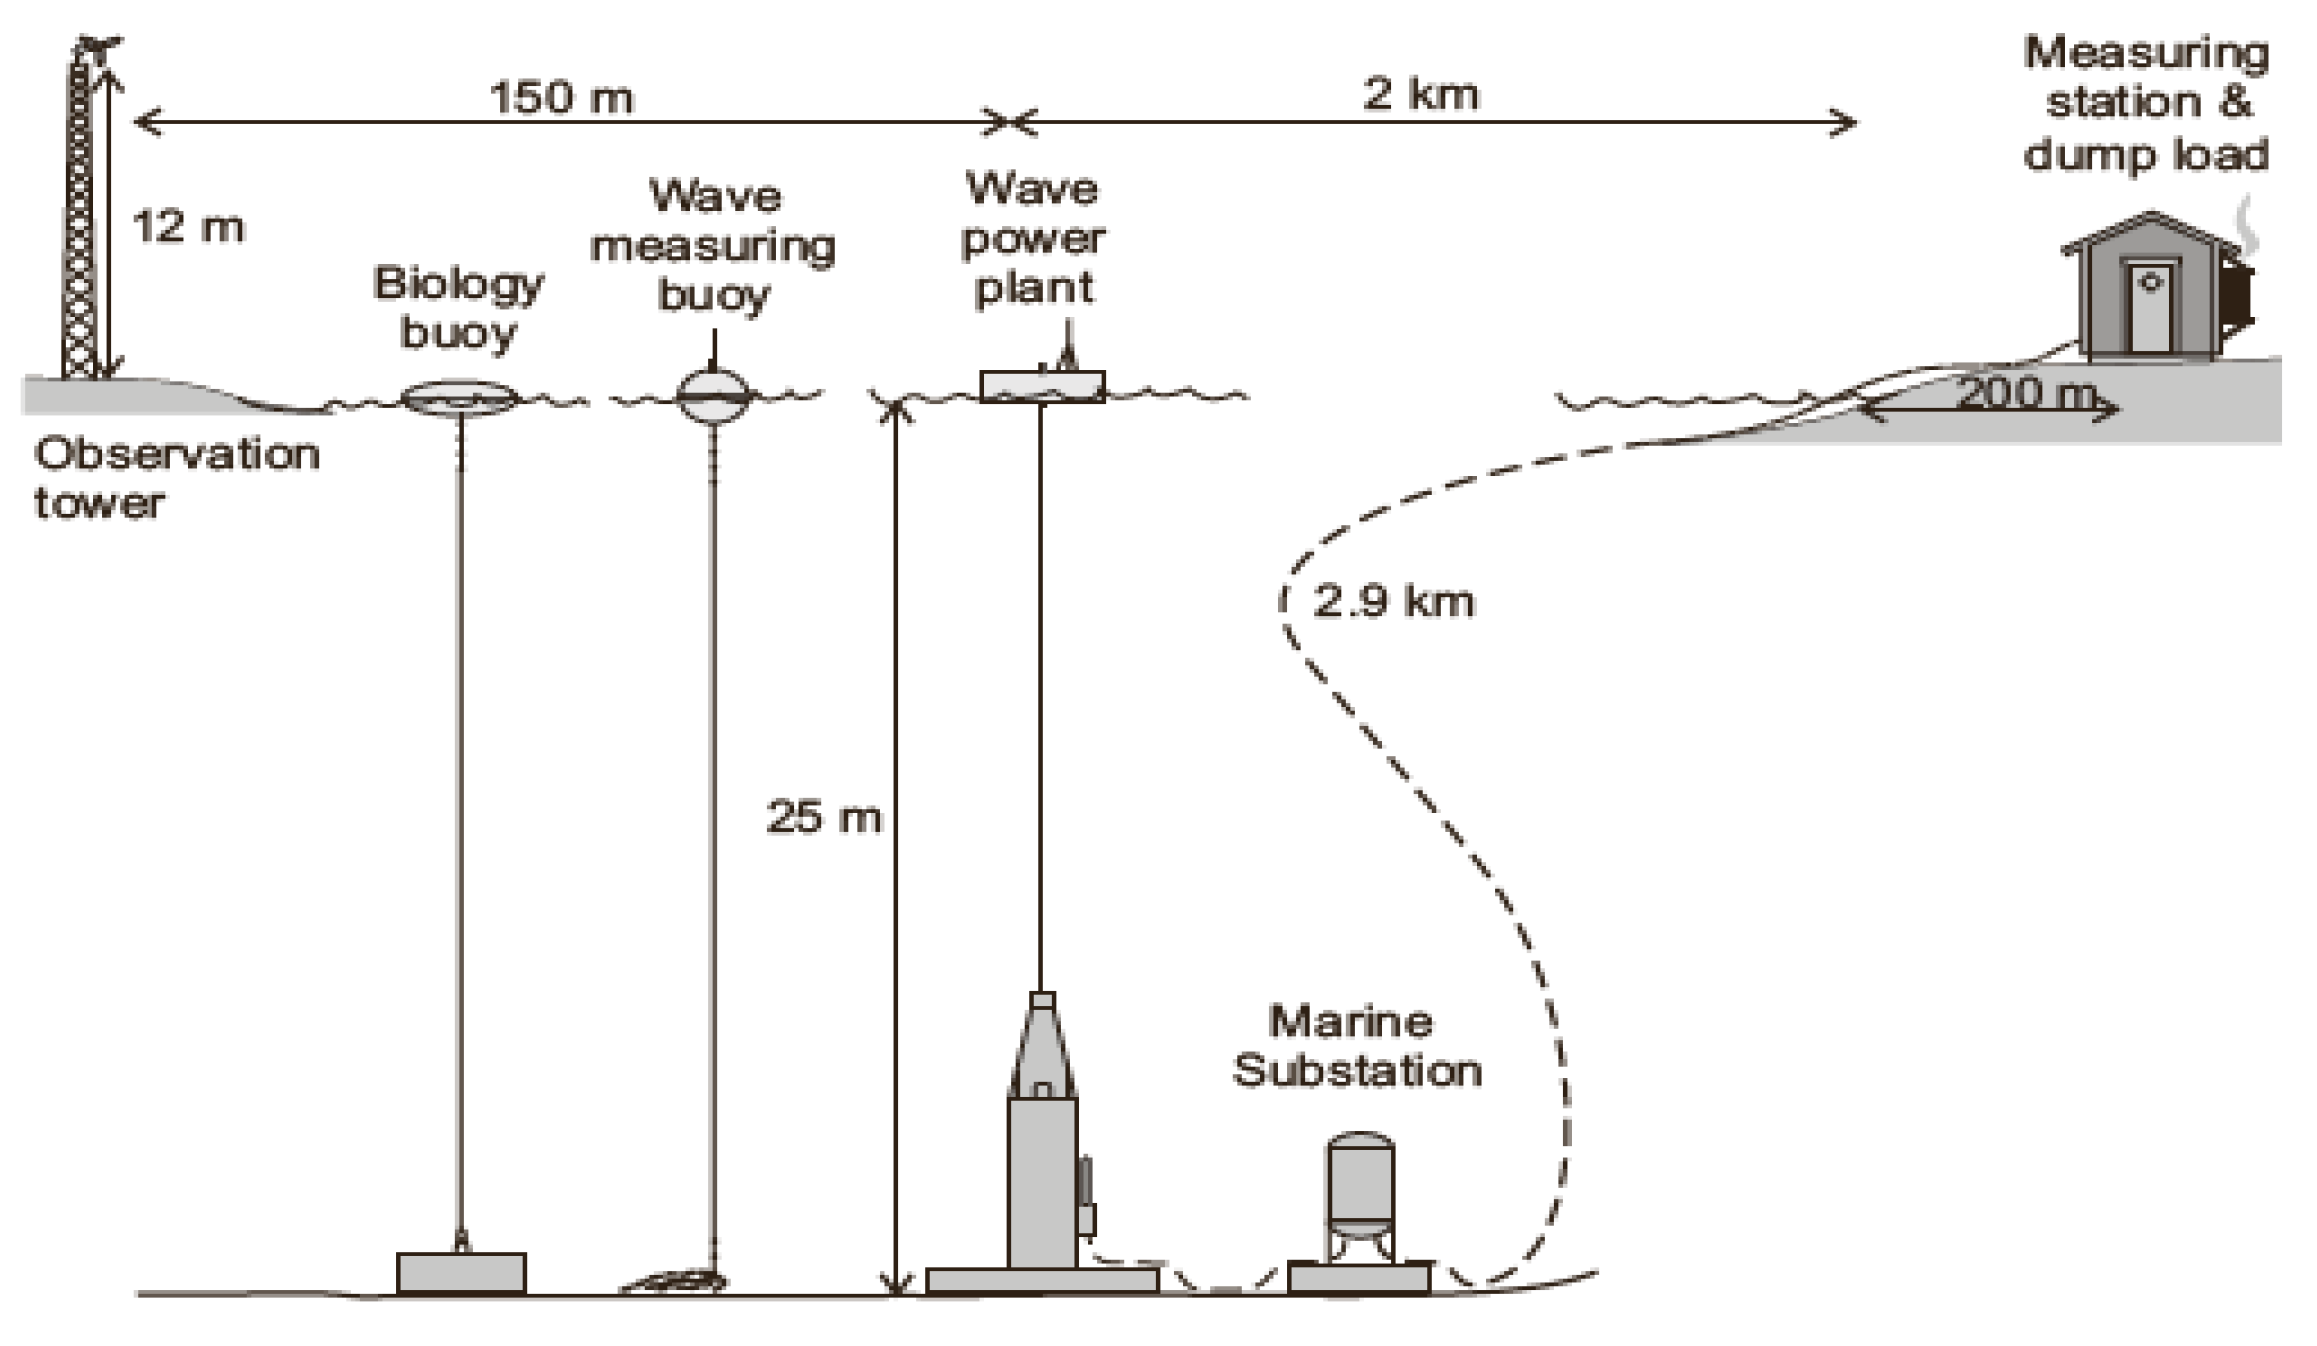
5. Lysekil Research Site

5.1. Location

According to the classification established by [50], the Lysekil wave farm (Lysekil Research Site, LRS) can be included in the group of the last “pre-commercial stage gate requirements test sites”. The installation is located on the west coast of Sweden, 100 km from the southwestern part of Göteborg city and 2 km from the coast of Lysekil city. The location encompasses a surface of 40,000 m 2 with coordinates of 58°11 850 N 11°22 460 E and 58°11 630 N 11°22 460 E. The sea bottom is located at a depth of 24–25 m, and optimal conditions are created for mooring WEC devices [51]. The location of the LRS is surrounded by islands; this allows the wave farm to have a good sea state, even in winter, with an energy density of 2.6 ± 0.3 kW/m [52]. Figure 7 shows the location of the installation and the sea state in the surroundings of the LRS. Figure 8 shows the wave climate matrix that corresponds to the Lysekil wave farm location.
The LRS started its operation in 2003, and the first measurements related to its sea states were taken in 2004. In March 2006, the LRS installed the first buoy, known as L1; a 2.9-km-long wire connects it to the measurement substation that is located on the Hermanö island at the southern point of the LRS. In 2009, two additional WEC devices, namely, L2 and L3, were installed [55]. Together with the WECs, 21 environmental buoys were installed in 2007; the intention was to measure the impact of the WEC units on the marine surroundings of the installation and vice versa. Between 2009 and 2010, five new WEC units (L4, L5, L7, L8, and L9) were installed, and three more WEC units (L10, L11, and L12) were installed in 2015. As of November 2015, all of them were grid-connected, with an installed capacity of 200 kW [55]. To date, more than ten WEC models have been analyzed at the LRS [56]. In the summer of 2008, the LRS was completed with the installation of a measurement tower, which is situated 150 m away from the LRS. The measurement tower includes a camera that makes it possible to correlate the wave motion captured in the images with the installation’s power output. Figure 9 lists (from left to right) the components in the LRS scheme and the scheme itself: namely, the observation tower, the biological buoy, the buoy for the measurement of the sea state by means of wave characteristics, the WEC coupled with its energy absorber buoy and the linear generator for electricity conversion, the marine substation, and the off-shore measurement station.

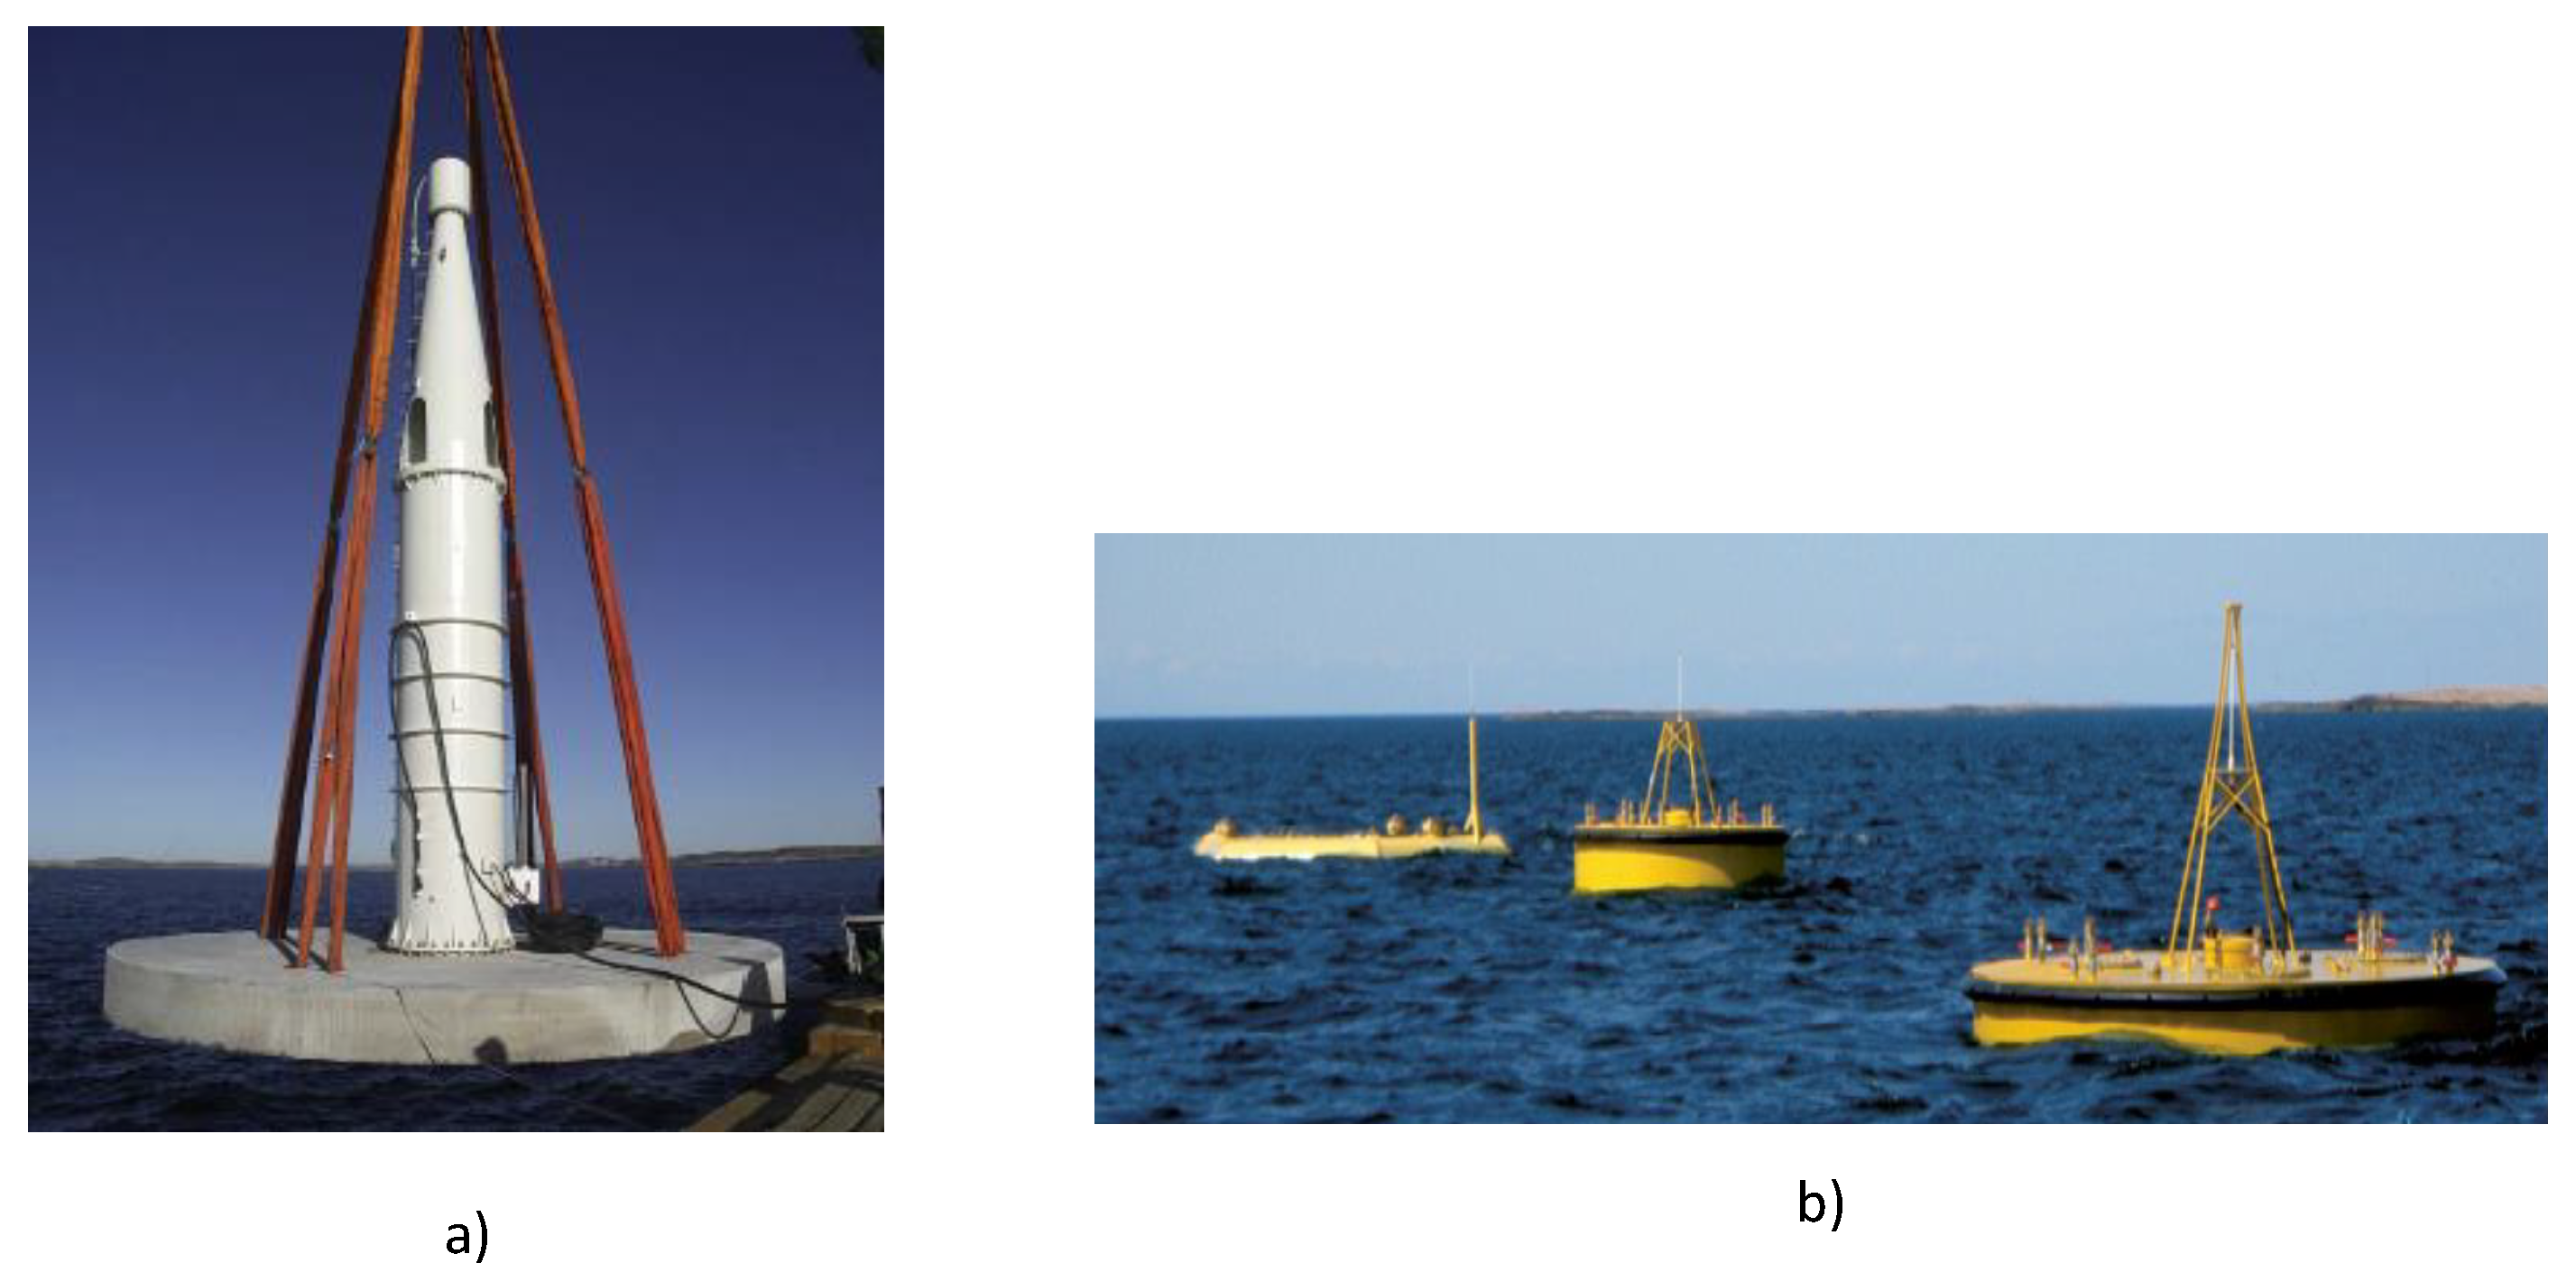
5.2. Technology Used

In the LRS, point absorbers are used to extract energy from the waves, while the conversion of wave energy into electrical energy is performed using a direct-driven linear generator (DDLG). The movement of the waves is transmitted from the point absorber to the generator translator through a cable. To improve the performance of the generators in extreme wave conditions, WEC units are provided with springs in their upper part that limit the translator motion inside the DDLG’s cavity. Because the LRS is a research installation, several DDLGs (Figure 10a) and point absorber buoys (Figure 10b) have been tested [19].
The technical characteristics of both the L1 and L9 models are described in [51].

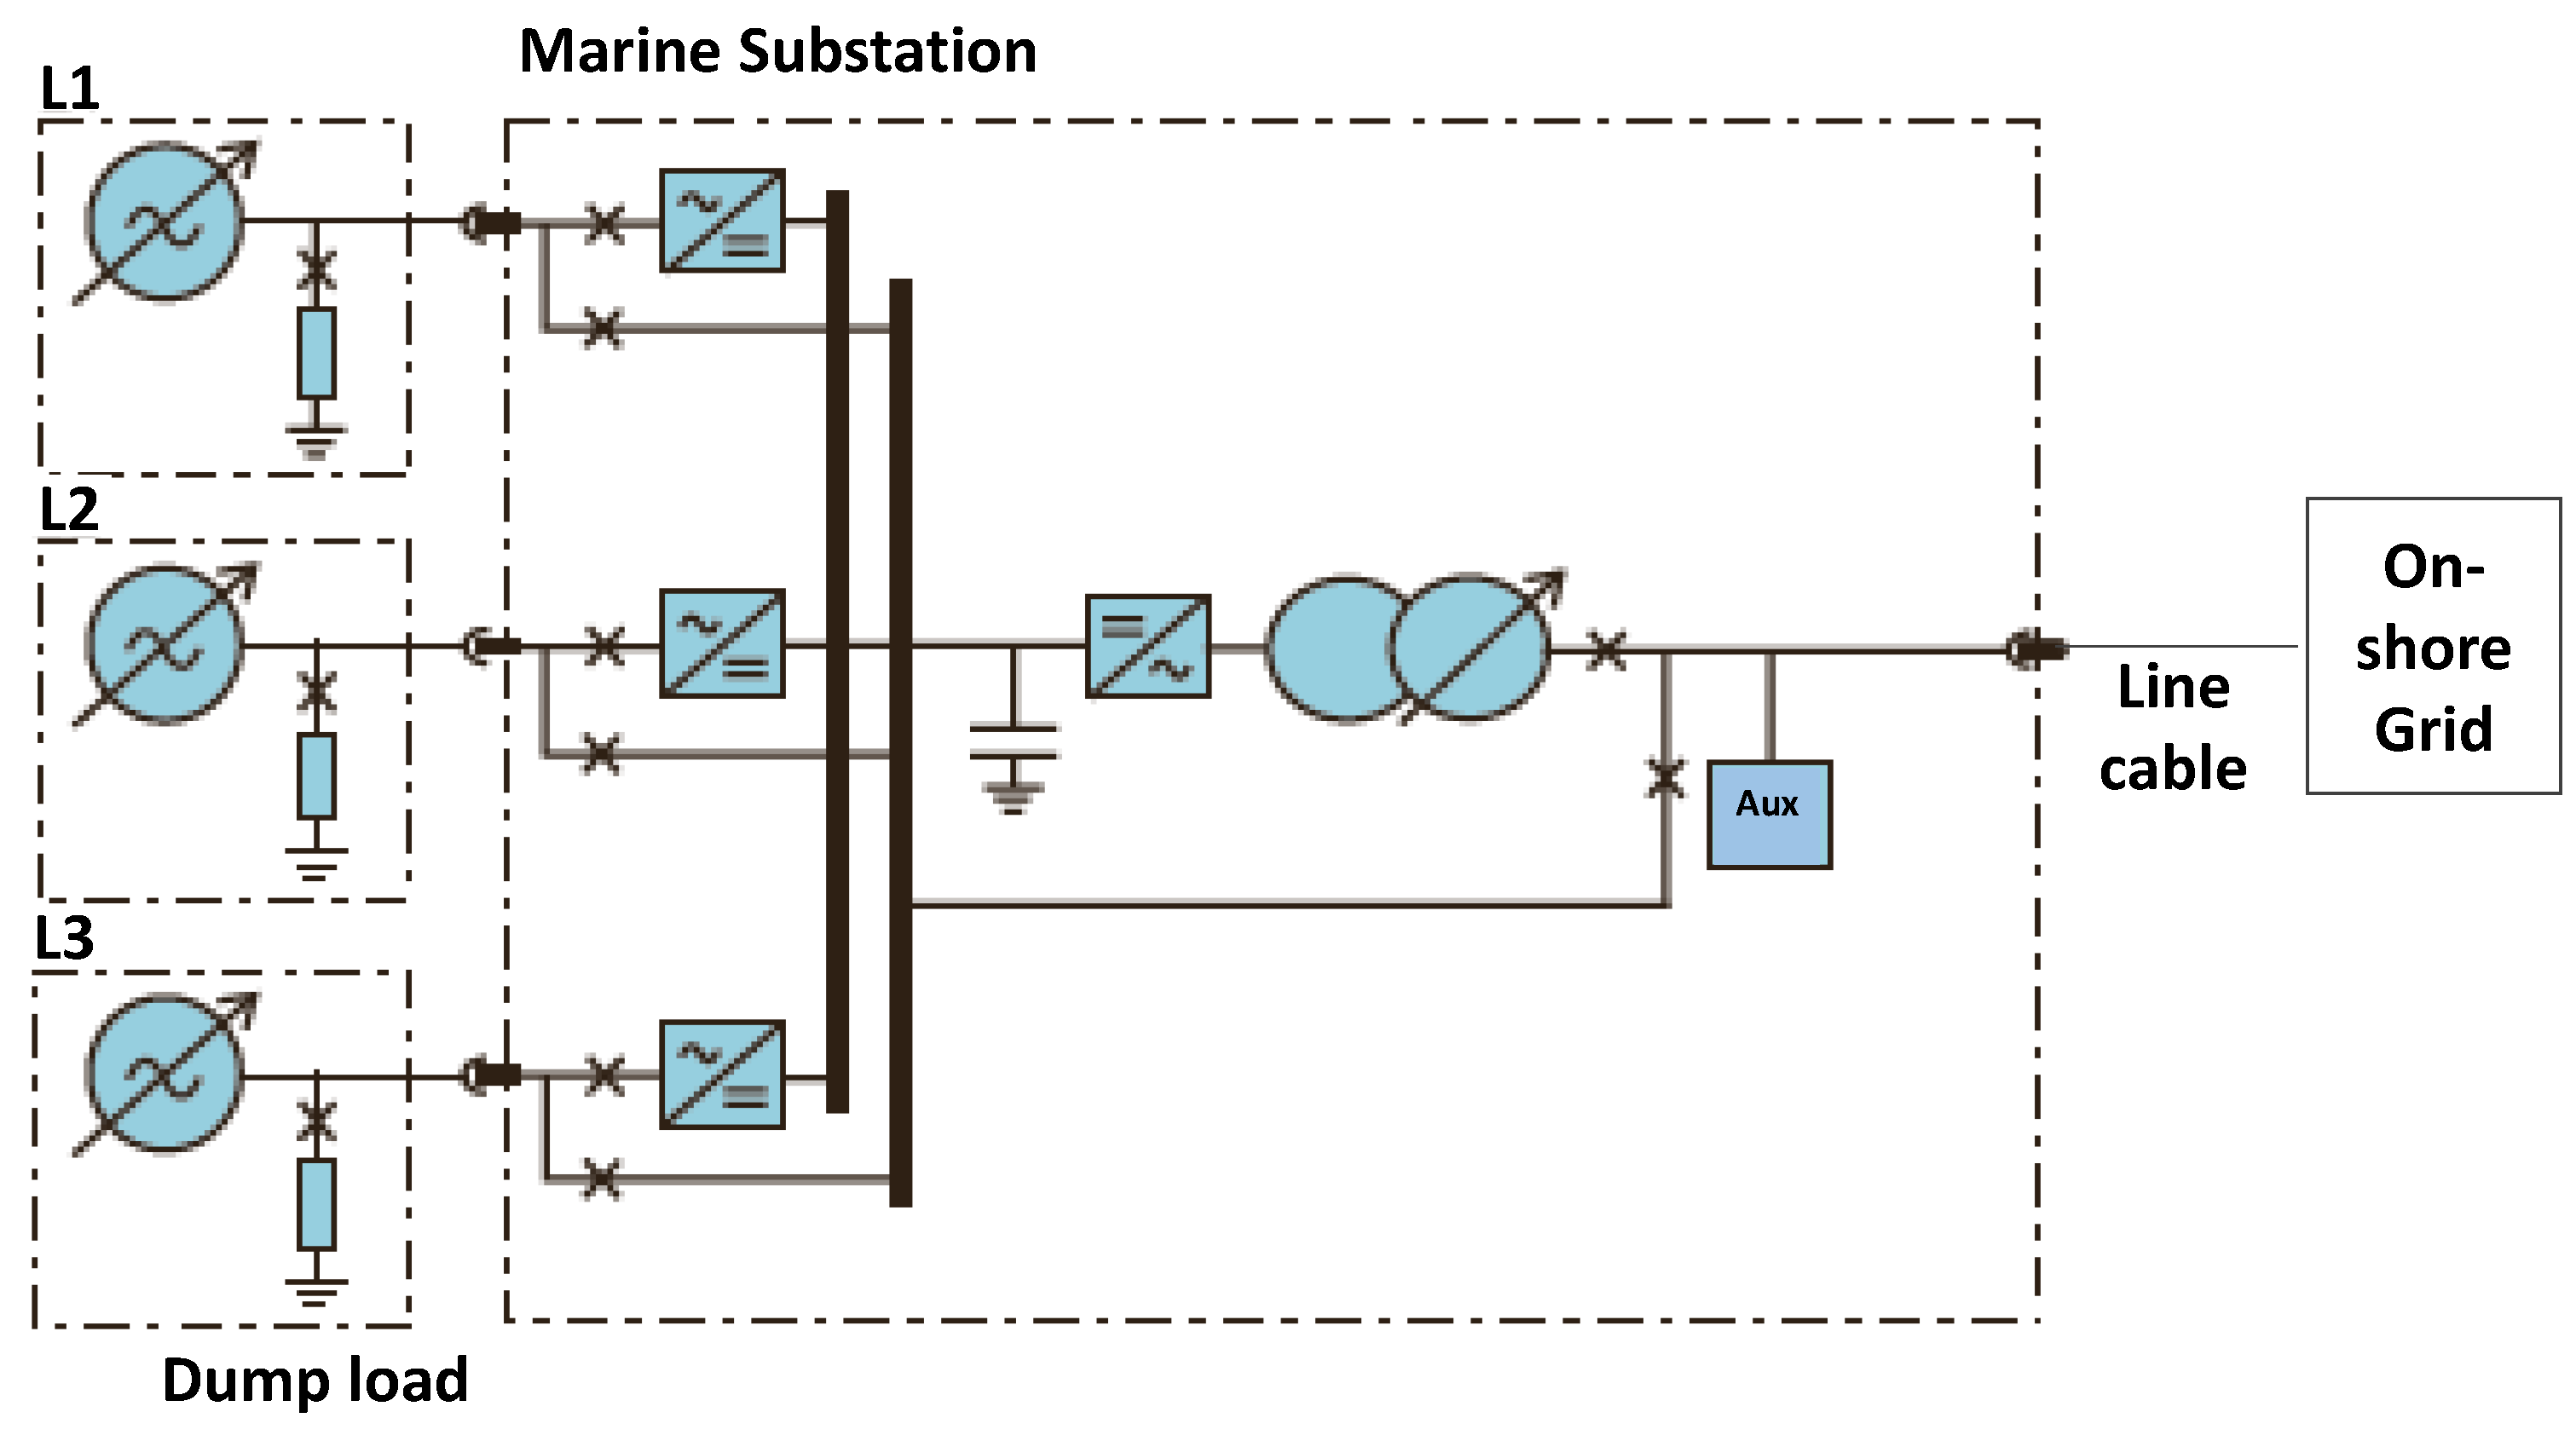
5.3. Marine Substation

The LRS installation is grid-connected through a marine substation, with a rated power of 96 kVA, and a 2.9-km-long wire (see Figure 11) that is used for the configuration of the first WEC units [53].
The wave power generators are provided with a 12- Ω dump load, which handles the dissipation of the energy delivered by the WEC units when they are disconnected from the substation.
The power output of each WEC unit is rectified by a six-diode bridge converter. In the marine substation’s DC stage, the WEC units are interconnected in parallel. The electrolytic aluminum capacitors in the DC stage allow for the smoothing of the output signal that is sent from the installation to the inverter. The AC voltage at the output of the inverter is increased to the grid voltage (1000 V). This is done using a Y-Y power transformer that is provided with tap regulation (80-100-125-250/1000 V) and a tap-changing mechanism composed of off-load circuit breakers. The elements that make up the substation are confined within a 3 m 3 nitrogen filling system at a 3-bar pressure [53].
The marine substation is completed by an auxiliary system, a resonant circuit, and a measurement station. The main function of the auxiliary system is to distribute the power generated by the WEC units among the control systems and the circuit breakers. This installation is fed by the WEC generators, or it can be fed by the off-shore system when feeding by the WEC generators is not possible. The resonant circuit enables increased production by the installation. Lastly, the measurement station is supplied with different loads so that the LRS performance and its remote control can be widely studied.
This entire system has been subjected to several control mechanisms, such as Programmable Automation Controllers (PACs) for both the marine substation and the power inverter, as well as a Data Acquisition System, which was implemented for gathering electrical outputs from each wave converter [59].

6. Lysekil Research Site Modelling for Power Output Smoothen

6.1. LRS Input Data

The data used in this research were gathered from three linear generators, and each is attached to a cylindrical buoy (L1, L2, and L3) [51]. The voltage and current measurements from the three linear generators were sampled at 256 frames per second (921,600 frames in total). The data used were gathered from Uppsala University on 20 July 2009, at 22:00 h [60]. A boxplot analysis was carried out to determine the trends in each phase of the three generators, as shown in Figure 12. Taking into account the number of outliers in the quartiles, it can be inferred that the wave energy converters were subjected to recurrent overloading conditions, and the influence of such conditions on the power output should not be dismissed [61,62]. It is important to point out that when there are dips in the power output, the translator needs to reach a high speed to overcome this condition and deliver energy to the system [61]. This point was validated by the results in Figure 13 for Generator 1; the sample time was 10 s.
At the Lysekil test site, several storage systems have been applied to reduce the power fluctuations from the wave generators, as fully explained in [21]. The alternative options for energy storage systems in the DC link include batteries and supercapacitors connected through a DC/DC converter. It was demonstrated in [21] that the installation of batteries and supercapacitors at the Lysekil test site can minimize the fluctuations in the power supplied to the grid. However, both storage systems present some limitations. The performance of batteries degrades over time, causing increased maintenance and increased costs. Supercapacitors are not suitable for power smoothing because the wave period is on the order of 10 s, necessitating over 5000 charge/discharge cycles per day, which is unattainable for supercapacitors since they have a much lower energy density. For this reason, in this study, the application of a Flywheel ESS was tested at the Lysekil test site in order to smooth the power output without offering mechanical degradation, even with multiple charge/discharge cycles.

6.2. LRS Modelling

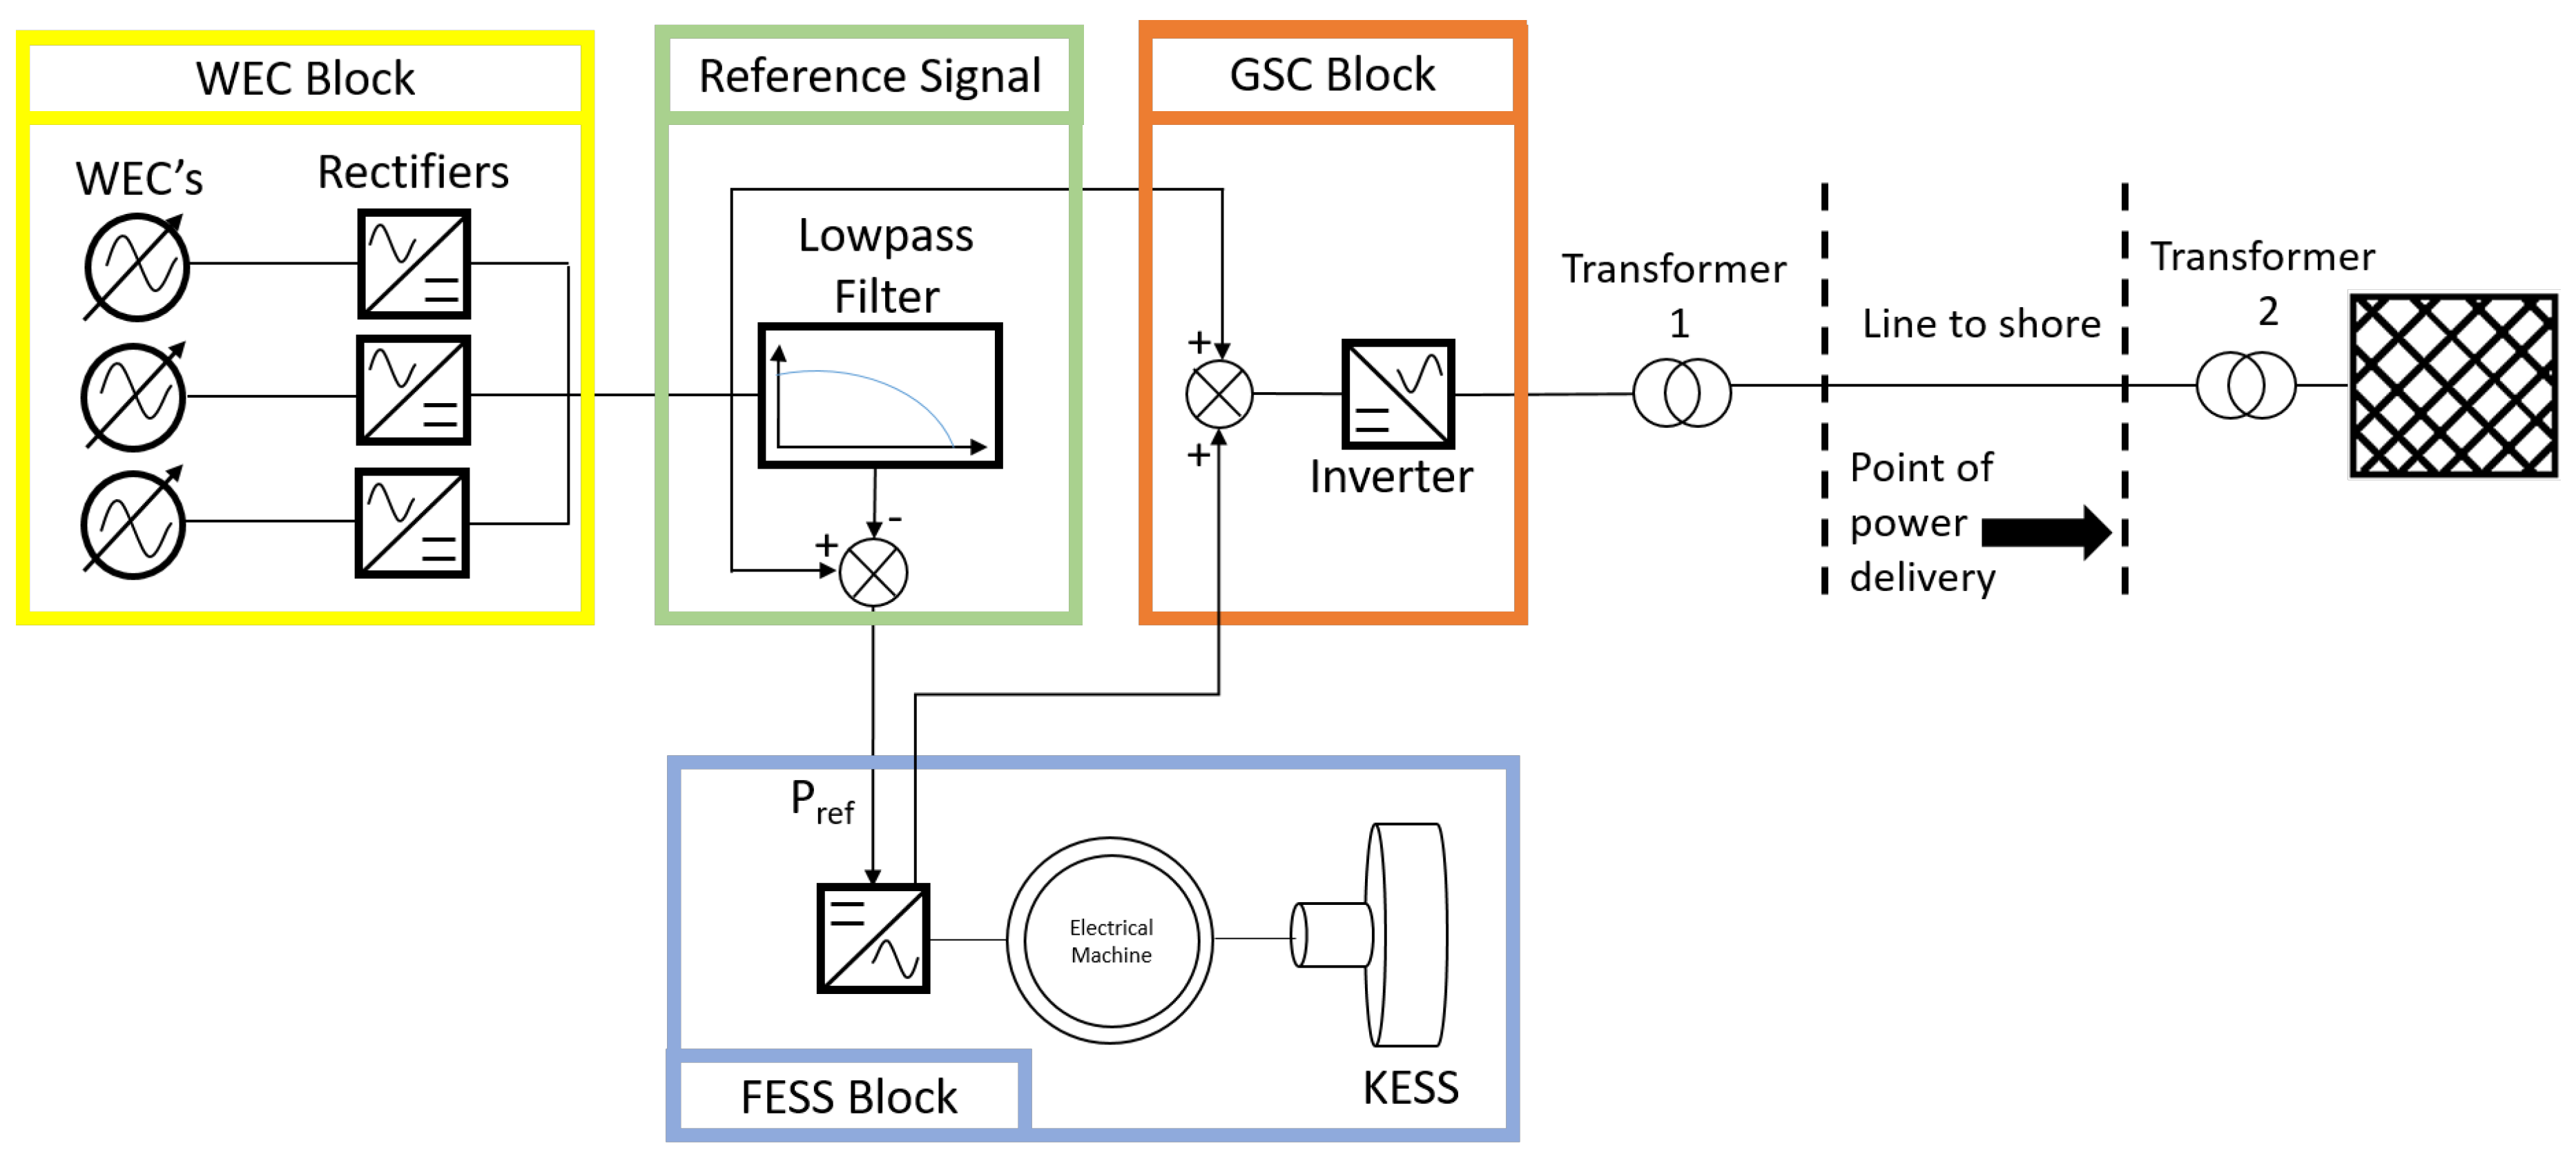
6.2.1. General Description

The general structure of the Lysekil Wave Farm and the proposed wave power smoothing system is shown in Figure 14, which includes a wave farm, a filter, a Kinetic Energy Storage System (KESS), a DC/AC converter, and a marine transformer. Each block in the wave farm is described below:
  • The wave power farm consists of three WECs. For wave power output smoothing, the WECs were modeled with the measurement data collected from the three WECs located at the Lysekil Test Site (see Figure 14, WEC’s Block) [56].
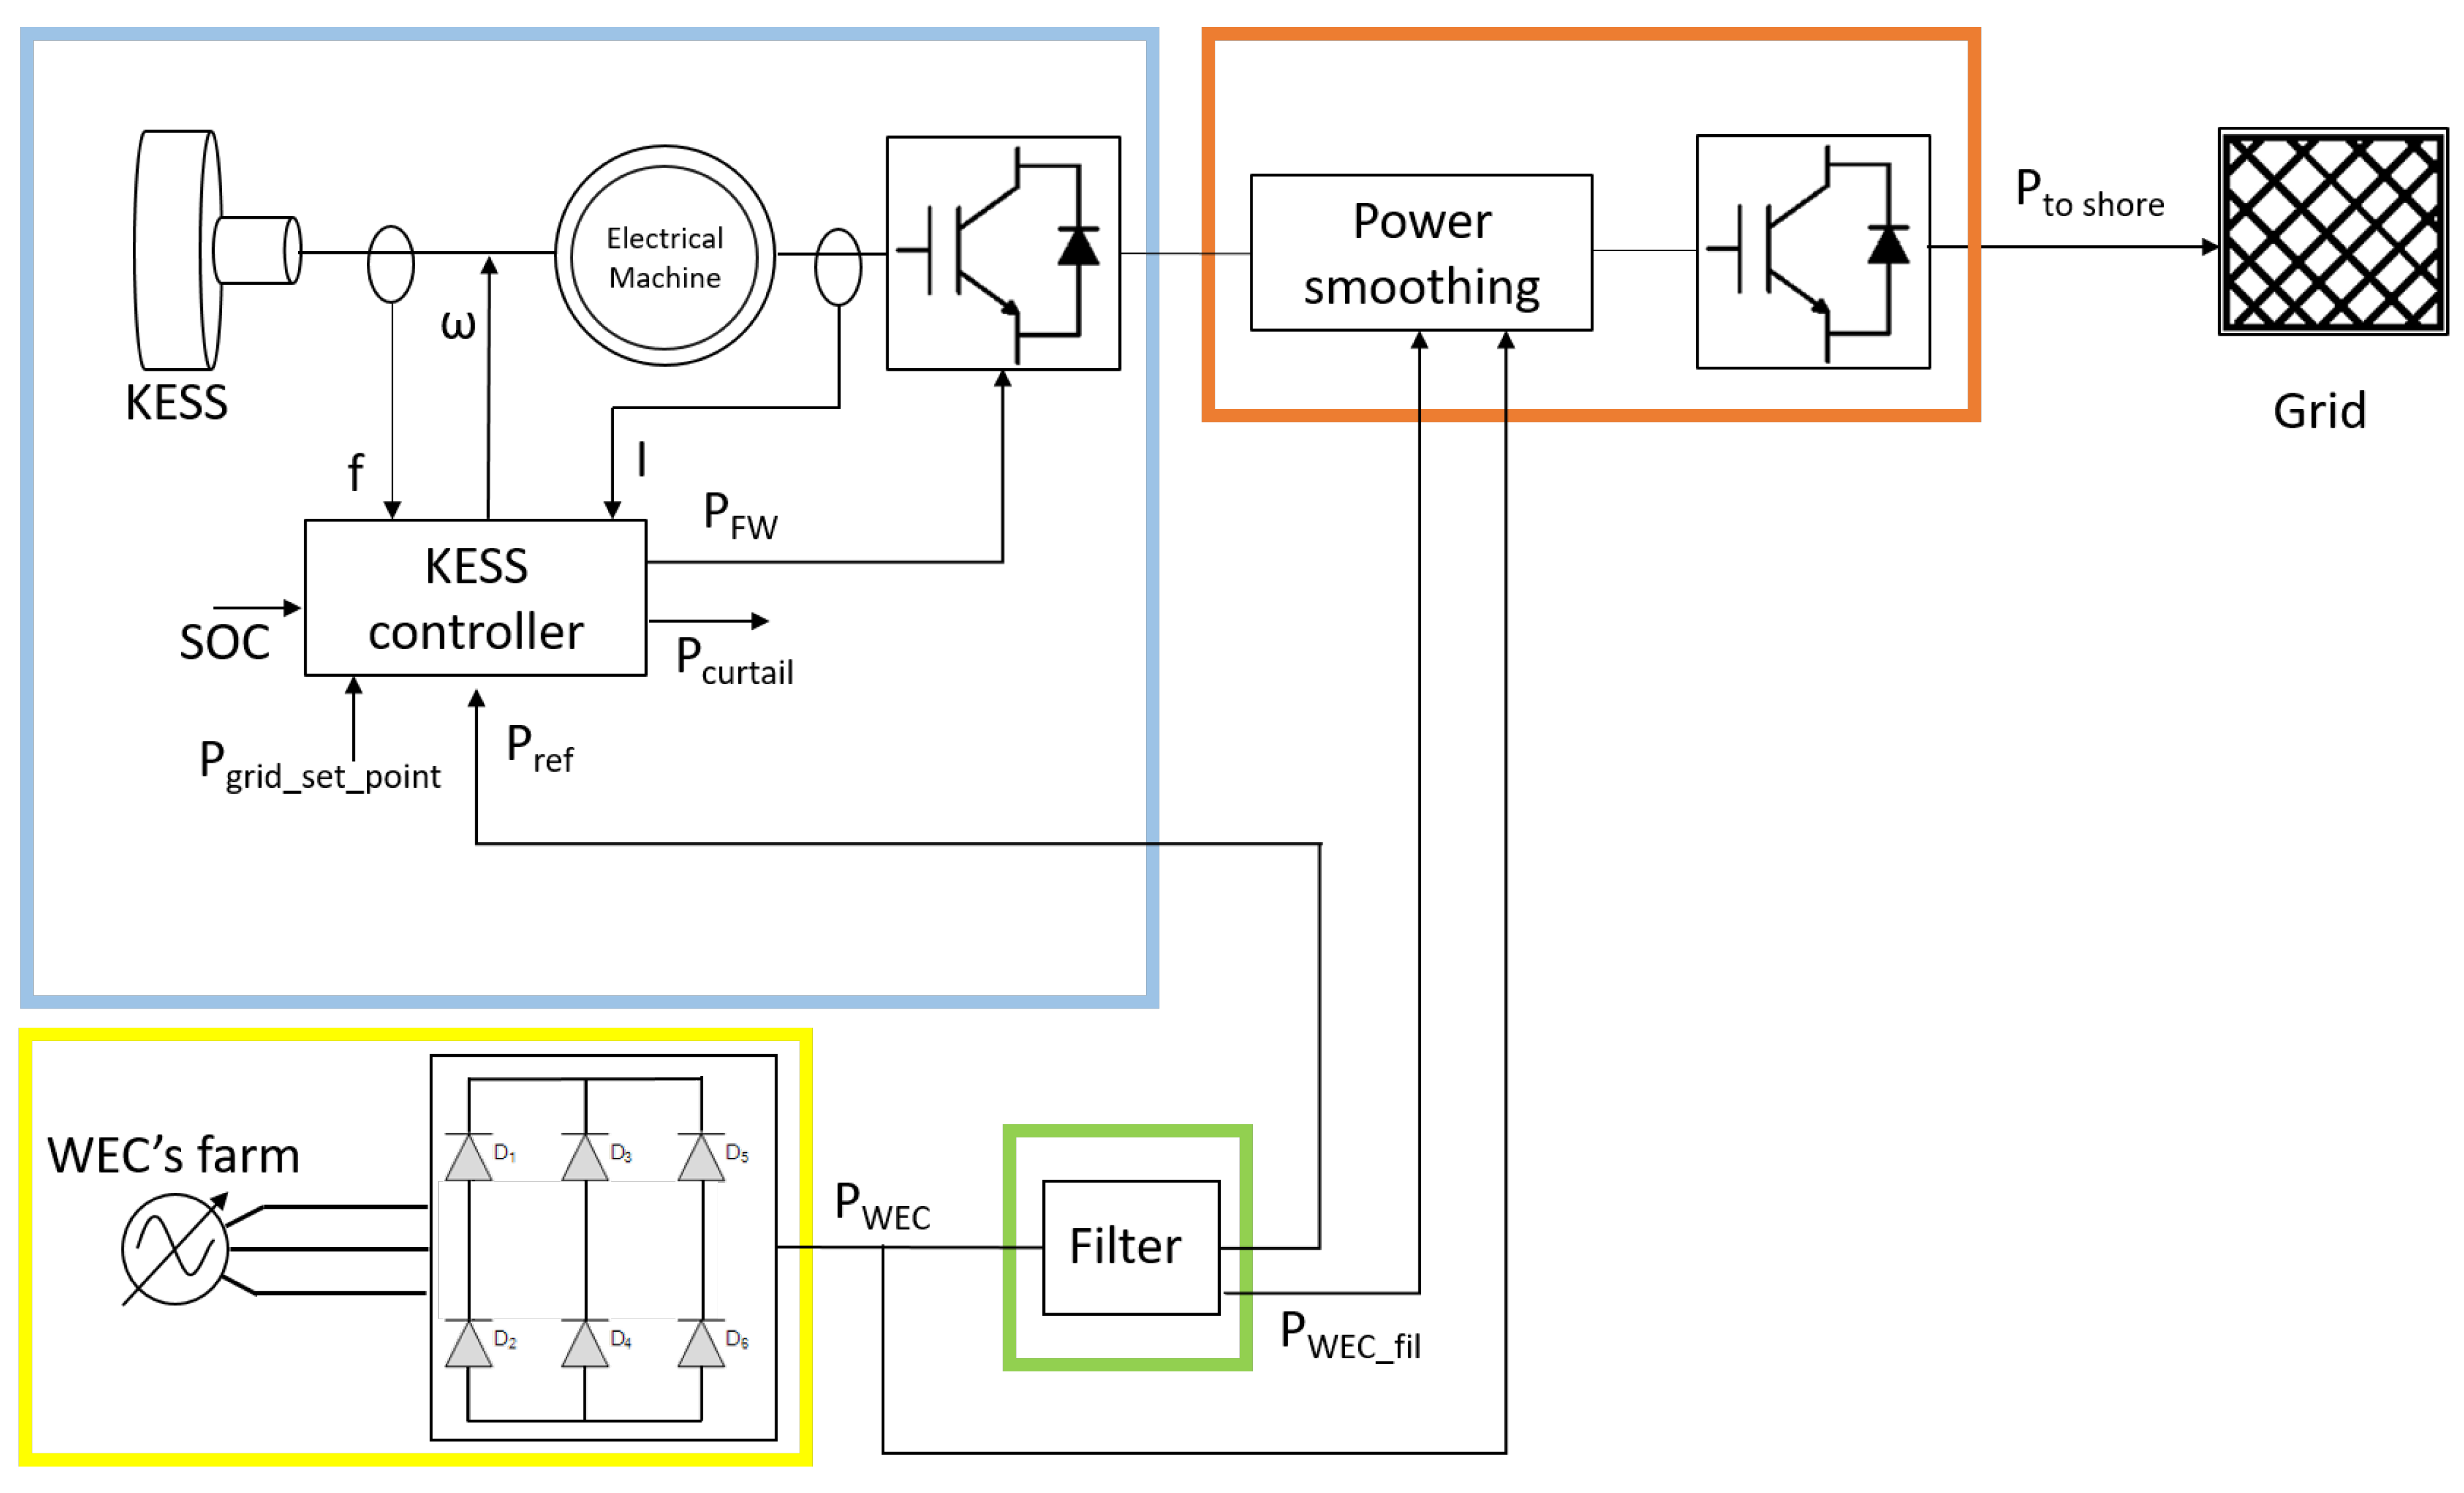
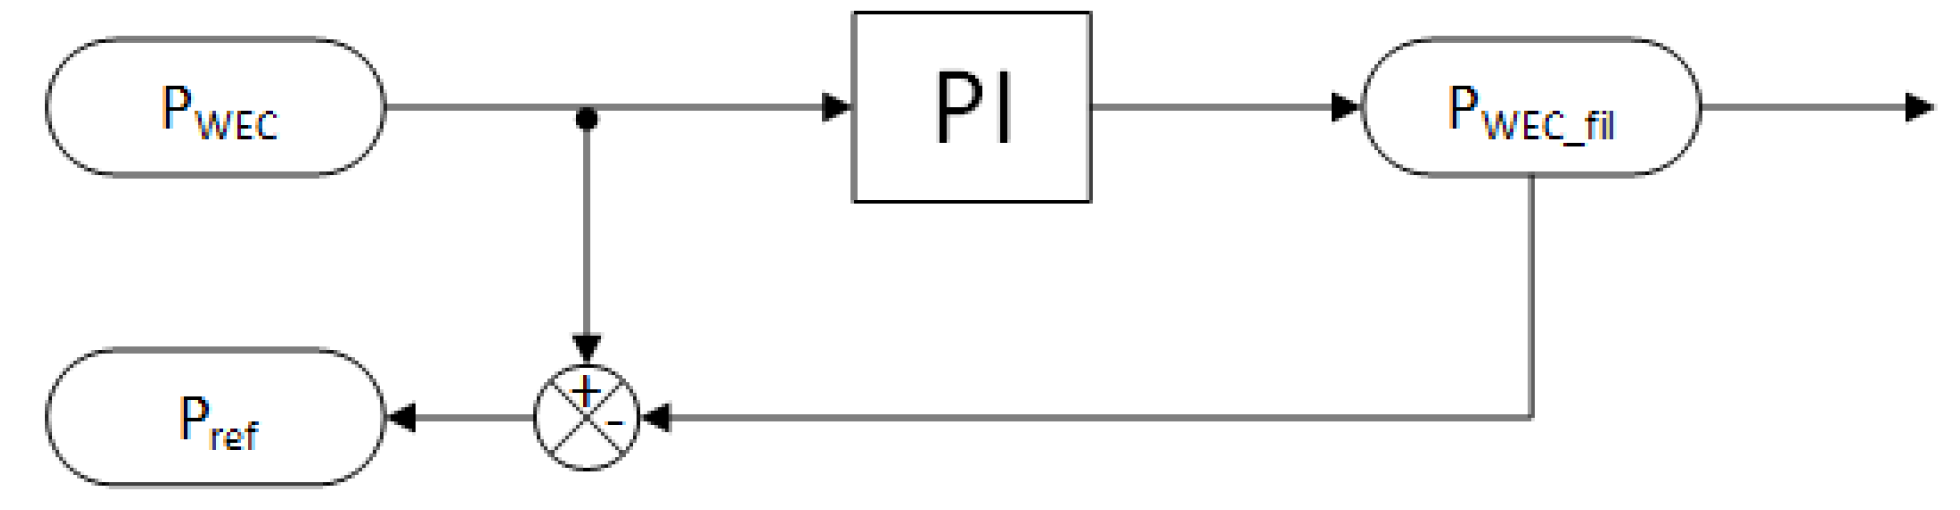
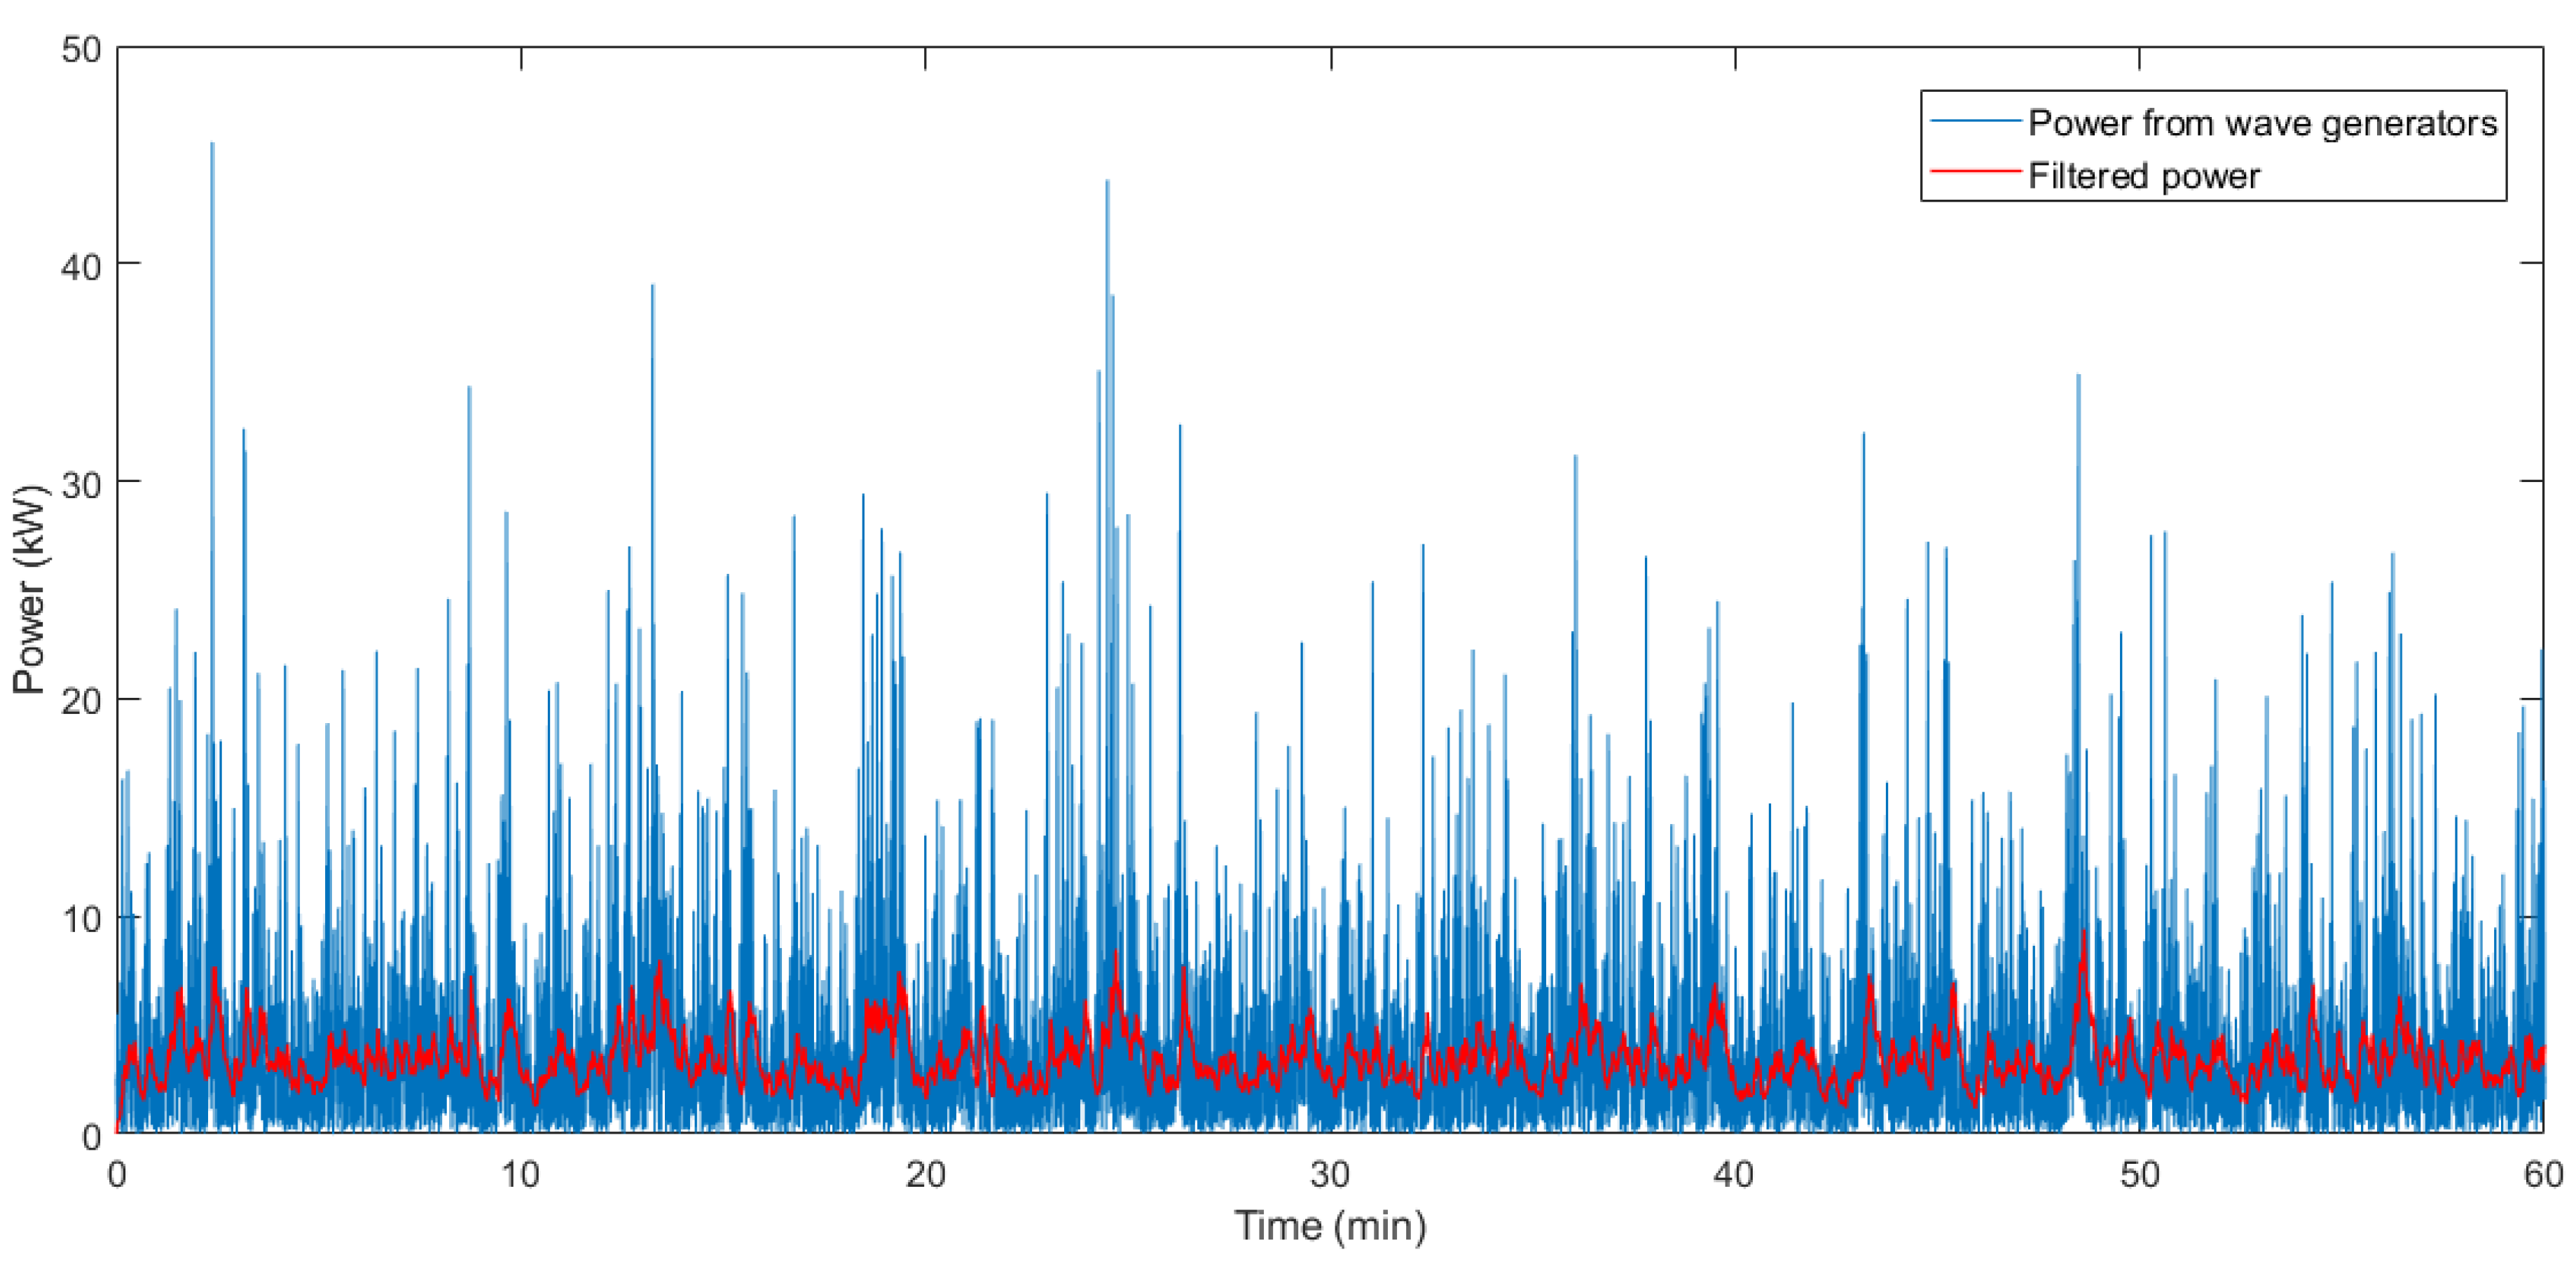
  • Filter: the purpose of the filter is to create a reference signal for the FESS in order to store wave energy in this device. To accomplish that, the filter decomposes the input signal (power from WECs) into two components: one that corresponds to the smoothed power output and another that corresponds to the fluctuating part of the signal and that must be stored in the FESS (Figure 14, Reference signal Block).
  • The KESS is formed by a high-speed flywheel that is connected to the DC link (see Figure 14, FESS Block).
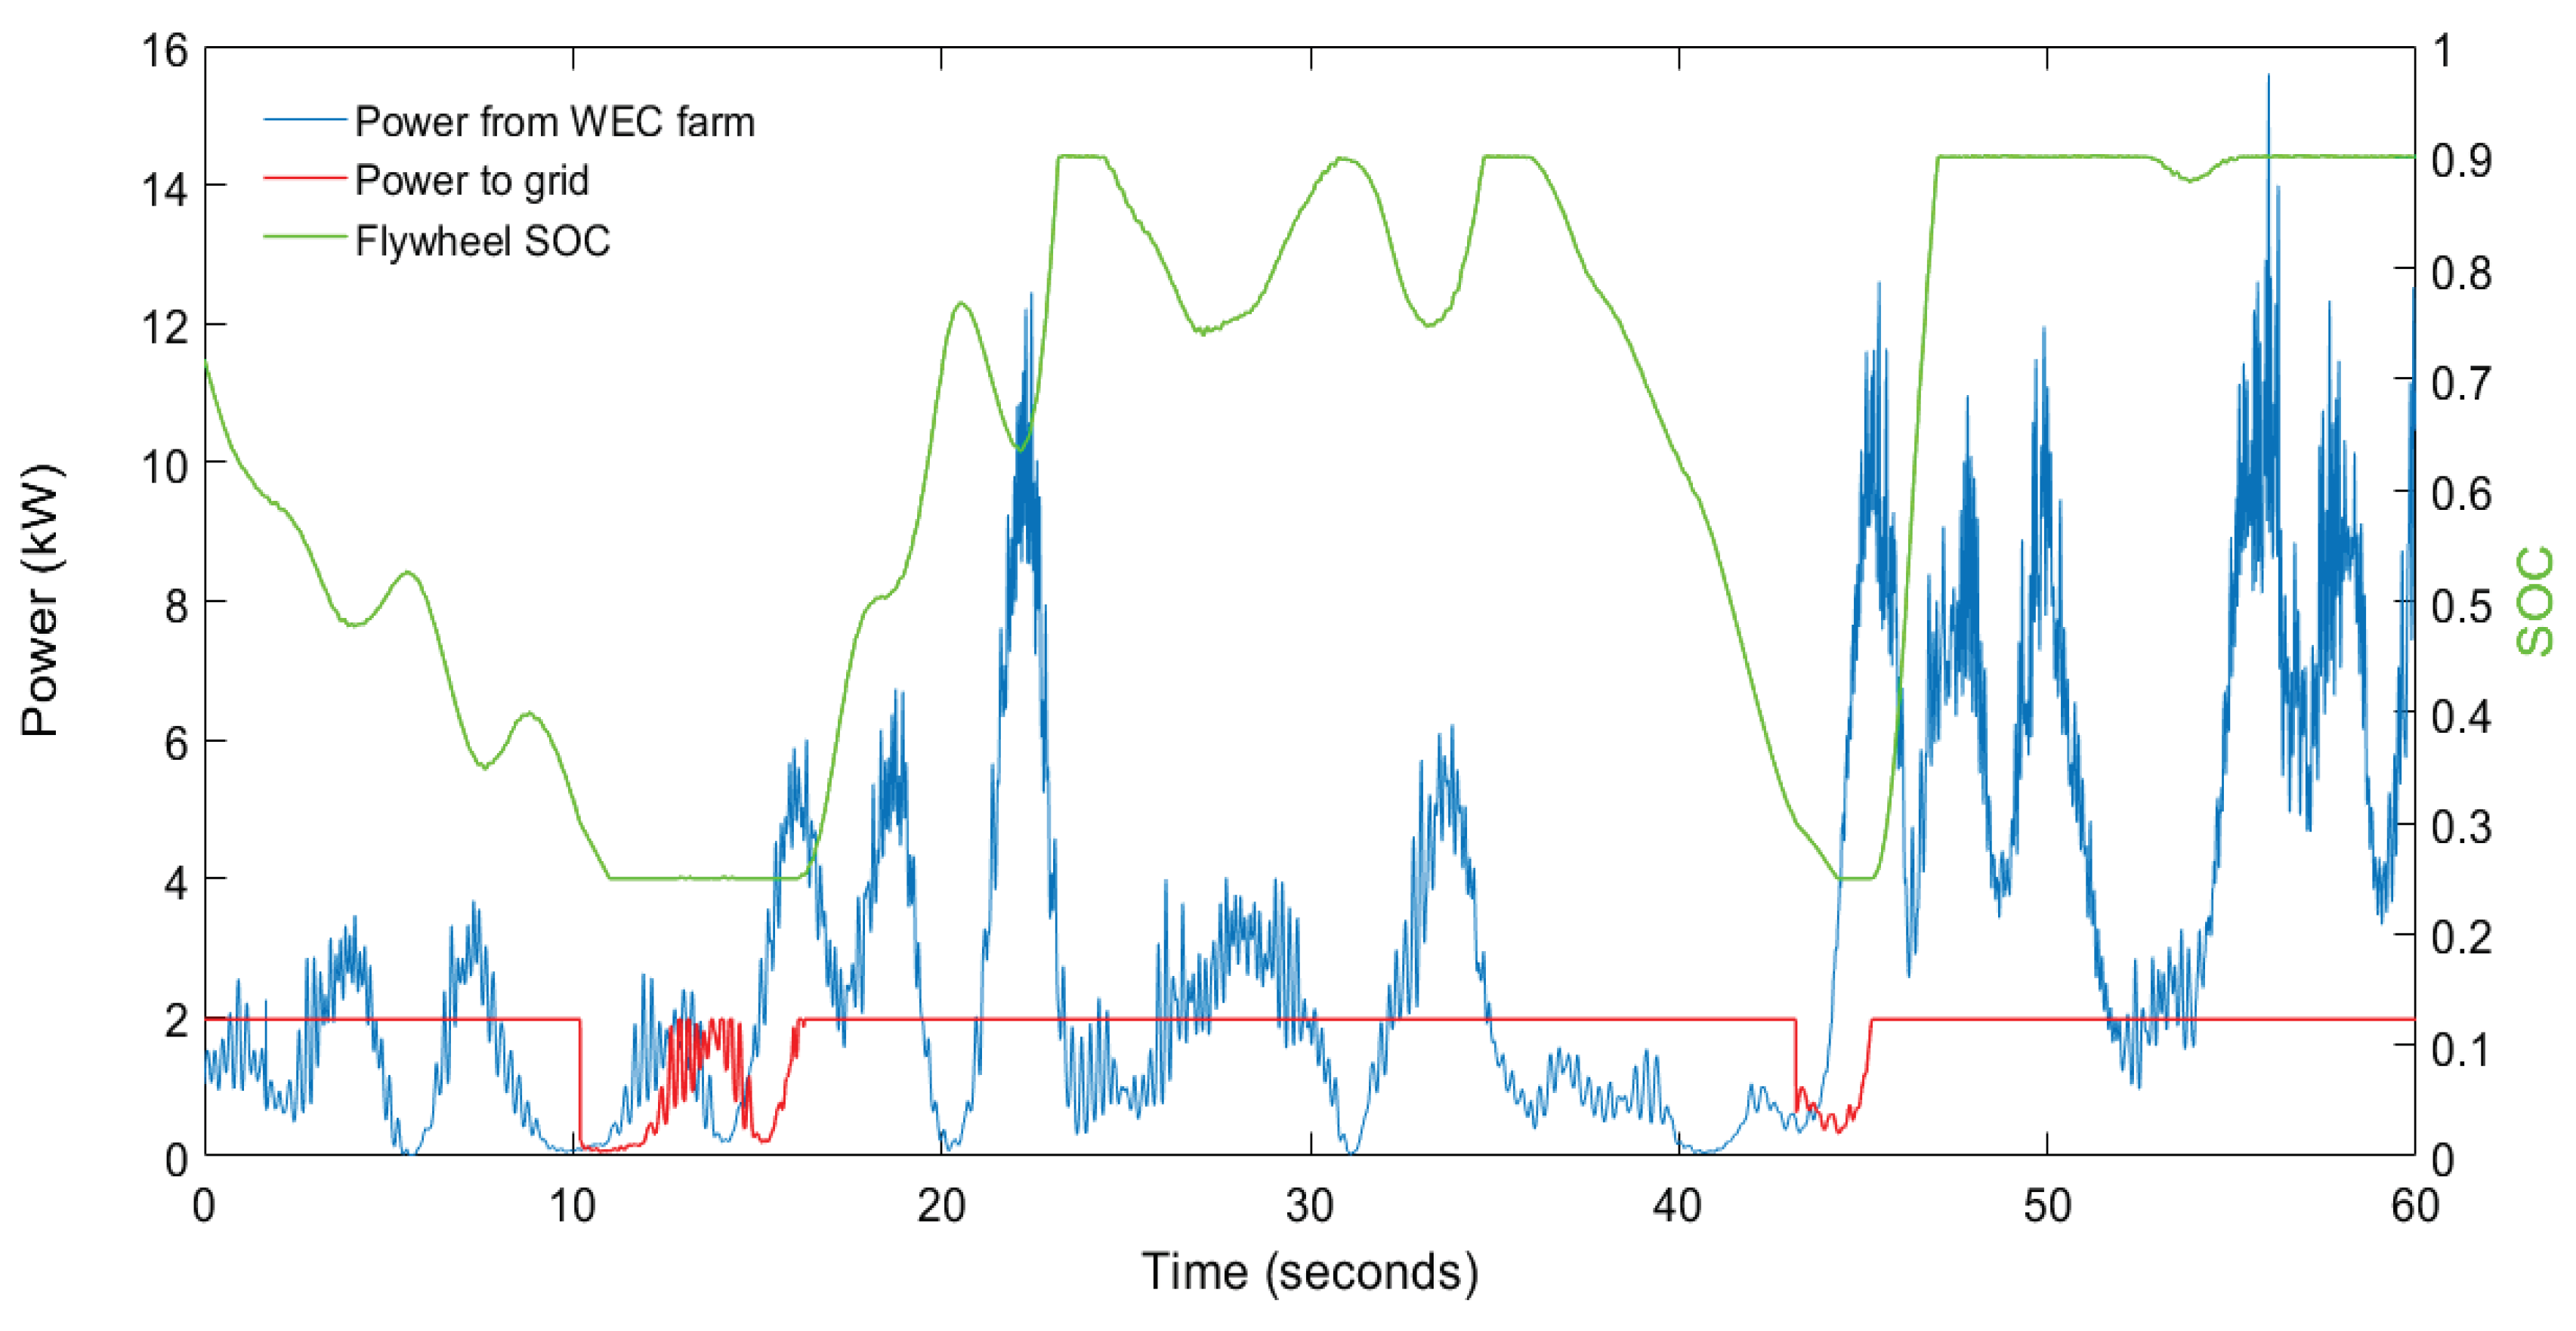
  • The DC/AC inverter is an IGBT inverter that improves the wave farm power output by filling the power valleys with the energy stored in the KESS (see Figure 14, Grid-Side Converter Block).
  • Marine transformers are used for integrating the wave power output to the on-shore power grid. The transmission network at the Lysekil emplacement consists of two power transformers with five winding taps connected at each extreme of a submarine transmission line. In this study, only the first transformer was considered [63].
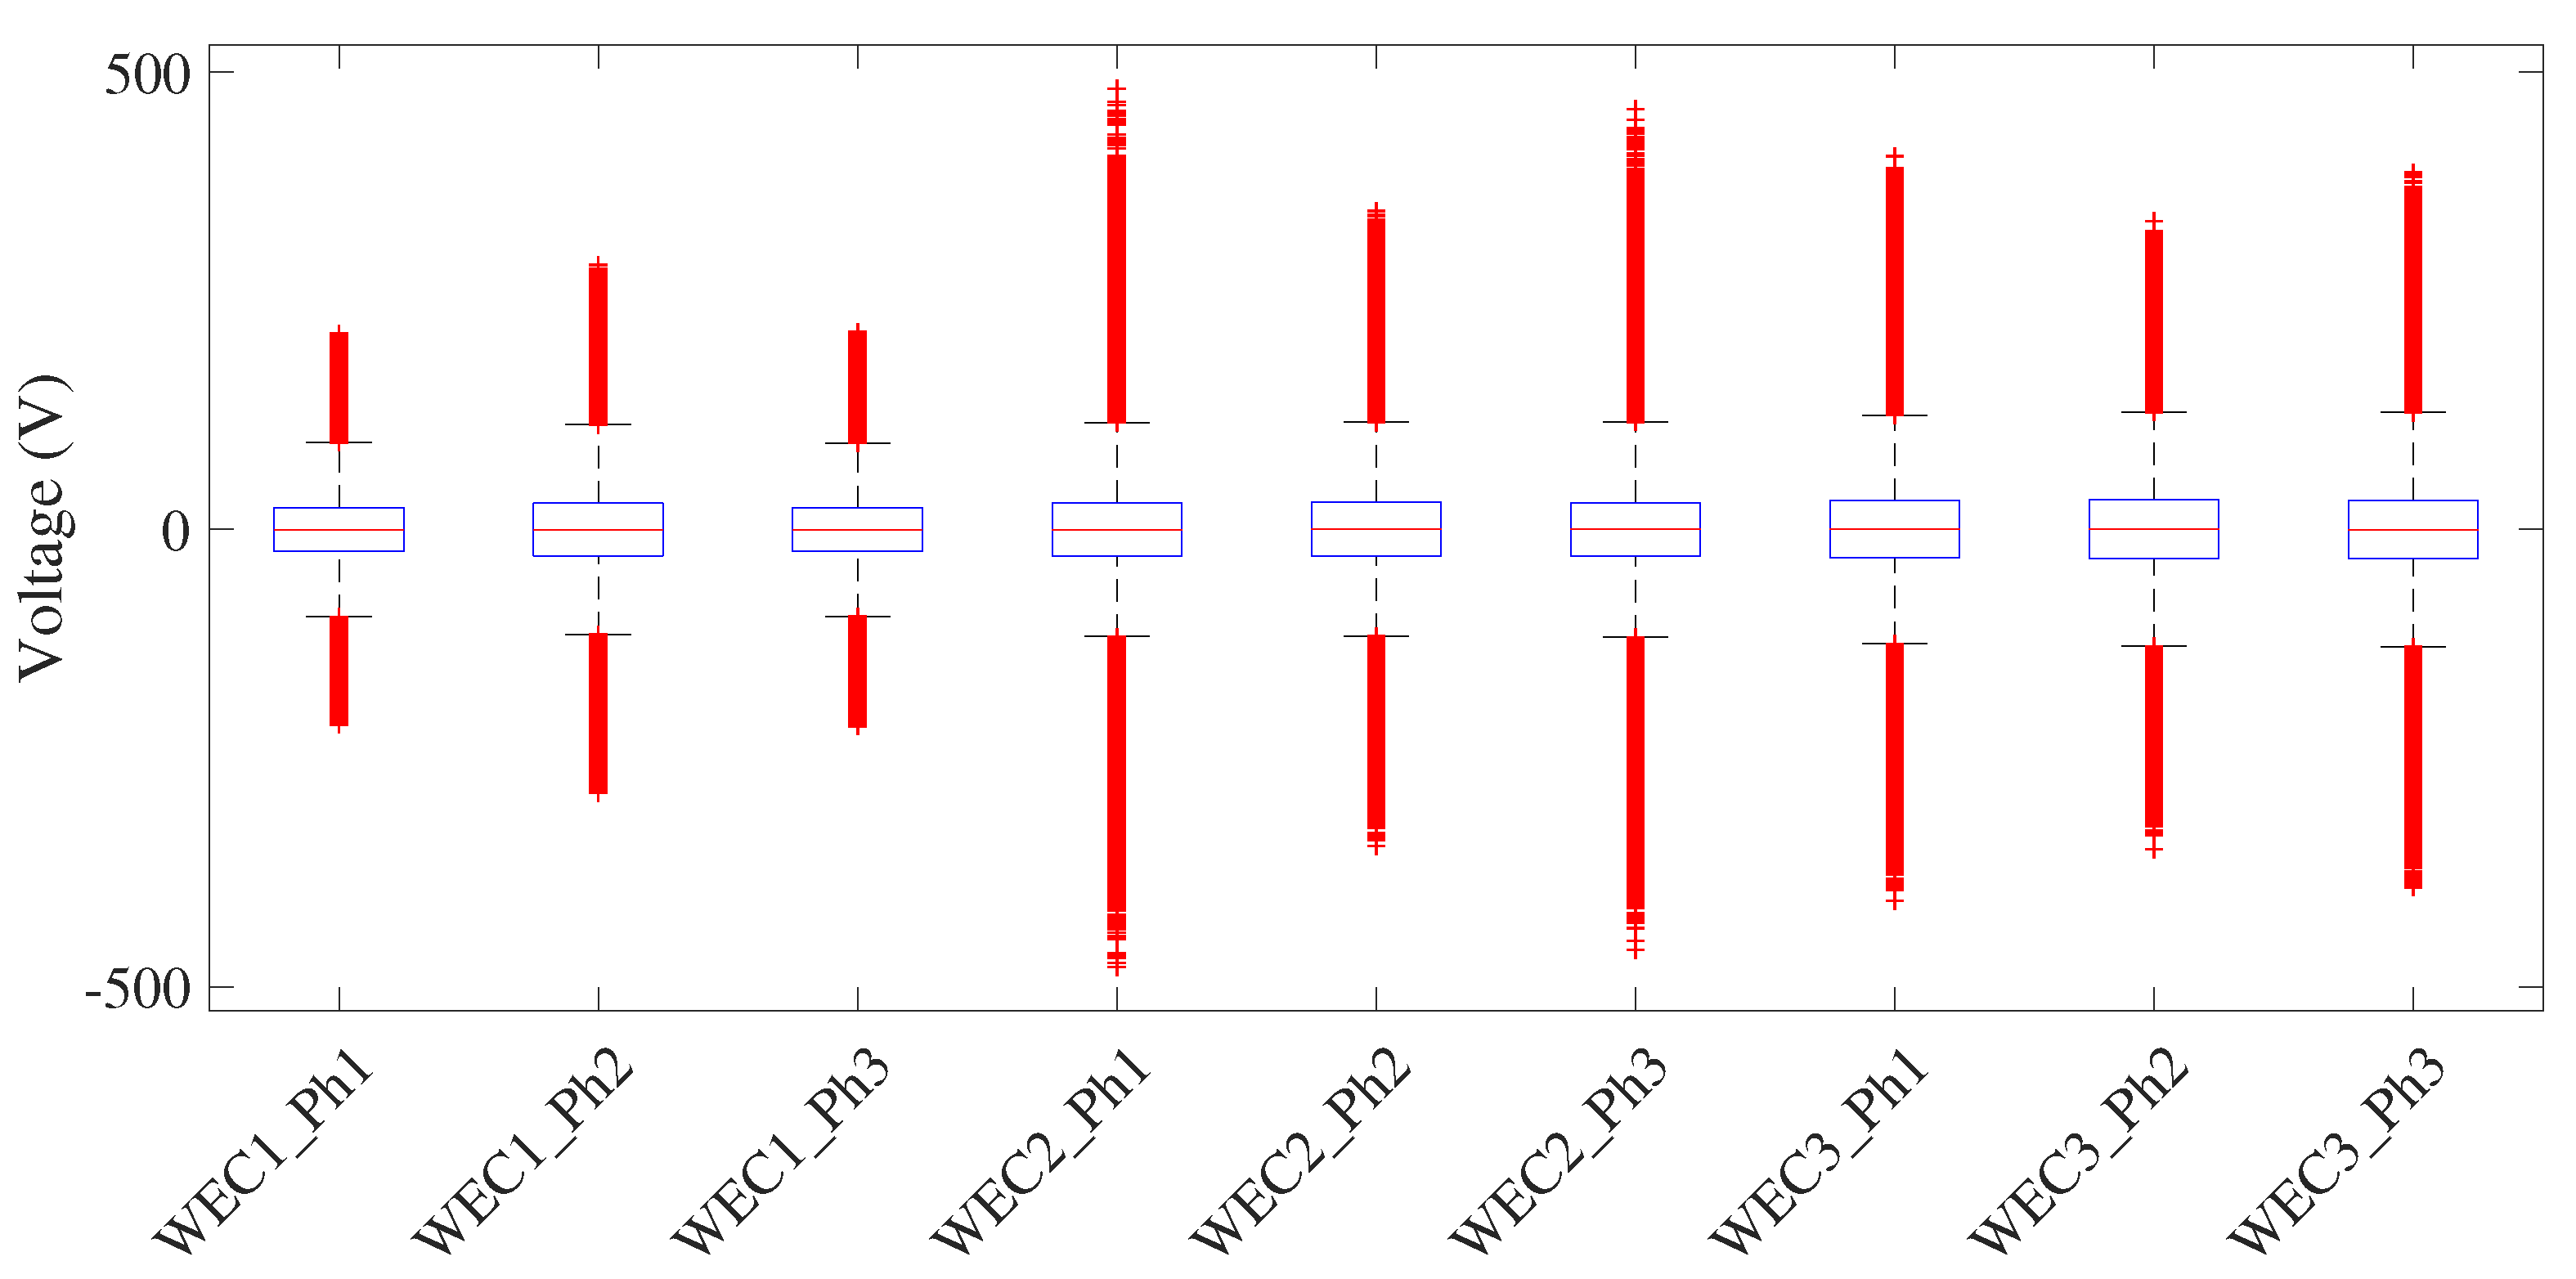
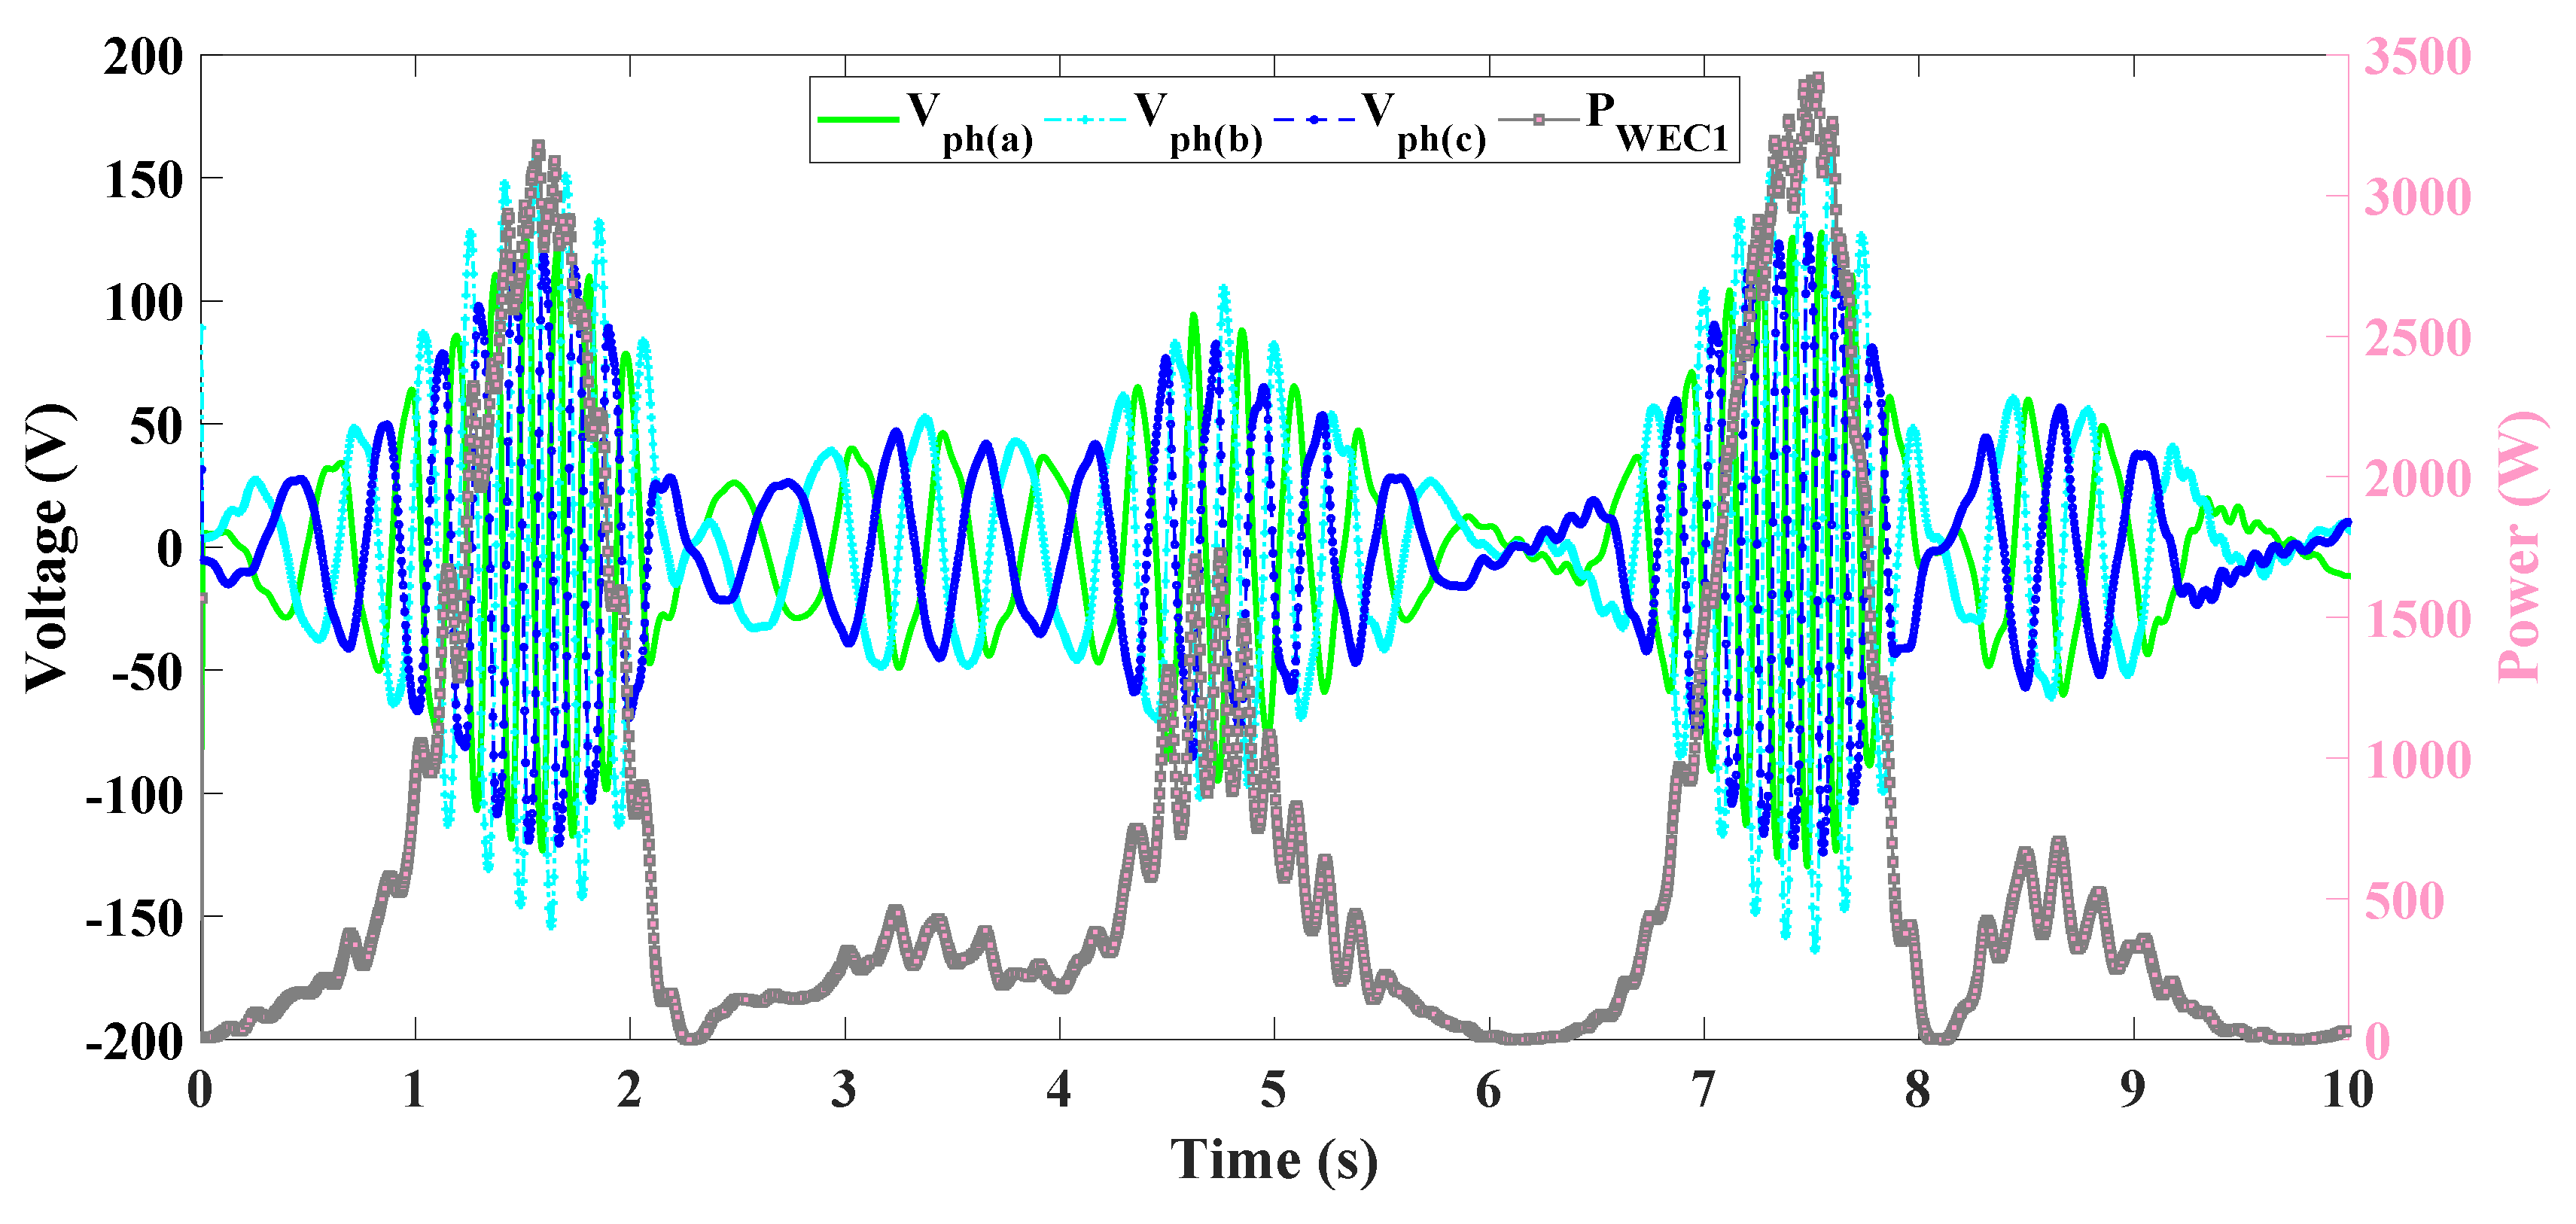
The aforementioned elements can function collectively to feed an isolated or grid-connected system.

6.2.2. WEC Units

Real power measurements of the three WEC units are used to demonstrate the KESS’s ability to smooth the wave power output. Figure 15a) shows the sea state in terms of the buoy’s wave elevation during the first half-hour of the study [60], and Figure 15b) represents the WEC power output registered during the first half-hour of the study. As can be seen in Figure 15a), the hour of study corresponds to a calm sea with a wave height that ranges between 27 and −22 cm, and Figure 15b) demonstrates that the medium power output is 2.55 kW.

6.2.3. Flywheel Model

In this study, the design data of a flywheel prototype, developed by Uppsala University, were used [64]. This prototype comprises a hollow cylinder, radial magnetic bearings, and an electrical machine that is capable of acting as either a motor or a generator. The kinetic energy that the FESS delivers is governed by (1), and it has an established maximum discharge depth of 25% with respect to the FESS’ storage capacity.
To minimize the device’s losses, two aspects were considered during the development of the model:
(a)
First, the flywheel rotor is located inside a chamber, and it is suspended by magnetic bearings that allows them to work at quasi-vacuum conditions. Therefore standby losses are minimized [65].
(b)
Secondly, the PMSM that is used as a motor/generator is composed of a coreless stator [66].
Finally, losses can be grouped and categorized as drag, electrical machine, and magnetic bearings losses.
  • Drag losses occur when the FESS model is operated between 15 and 30 krpm. In this speed range, the air in the flywheel chamber develops a turbulent velocity regime. Under this condition, the power that dissipates because of the drag losses from a rotating cylinder in a concentrically cylindrical case can be expressed as (6) [67]:
    P d = ω R F d
    where R is the cylinder radius, and F d is the frictional force on the cylinder. The force induced by the viscous drag is expressed as (7):
    F d = λ ρ π R 3 L ω 2
    where λ is the friction factor or drag coefficient obtained experimentally at low speed [64], ρ is the air density [64], and L is the cylinder length.
  • For electrical machine losses in the FESS model, an electrical machine whose stator is coreless is considered; thus, the main source of losses in the machine is Joule losses, as expressed in (8):
    P i = R I 2
  • Lastly, the magnetic bearing losses associated with the magnetic bearing that is responsible for sustaining the flywheel rotor can be classified as hysteresis losses or eddy losses. At high flywheel speeds, the eddy losses are those that surpass the hysteresis losses [64]; thus, for the developed FESS model, magnetic bearing losses are calculated according to (9), and these losses are directly proportional to the square of the flywheel rotational speed.
    P e d d y = K e d d y B ^ 2 f 2
    where K e d d y is a constant that depends on both the geometry and the material used in the magnetic bearing’s design, B ^ is the maximum magnetic flux, and f is the flywheel frequency.

6.2.4. Grid Connection

Both the KESS and WECs are connected to the grid through a grid-side converter (GSC) that is rated to the nominal power of the KESS and WECs at the farm. The GSC is assumed to have a constant efficiency of 98.5% (see Figure 14). The 2.9 km sea transmission line that connects the offshore and onshore substations is a pi model with a line resistance of 0.21 Ω /km [51].

7. LRS Power Output Smoothening

The power output smoothing process presented in this paper has three main steps. In the first step, the power output of several WECs is clustered at the wave farm connection point. Next, a filter is applied to the output signal of the clustering process in order to determine the power reference signal that must be stored in the flywheel. In the final step, a process of filling power valleys is implemented in order to achieve the reference power output signal given by a grid operator.
Figure 16 shows the complete block diagram of the proposed power output smoothing process. The experimental Lysekil Marine Platform in Sweden that is analyzed in this paper is formed by a permanent magnet linear generator WEC. Data used in this analysis come from a passive rectifier connected to a load. The total power of the wave farm is equal to the sum of the power injected by each individual WEC. Because there is no WEC regulation, the power output is highly stochastic, and this necessitates the use of the FESS system for power smoothing purposes. The flywheel control is only coordinated with the filtering stage. The PI controller has been designed using the pole placement technique tuned for the nominal values and results in Kp = 0.212 and Ki = 3.6. The yellow box corresponds to the first step, the green box corresponds to the second step, and the blue box corresponds to the last step of the developed power smoothing process.

7.1. First Stage: Generators Clustering

In this stage, the effect of clustering generators was analysed using several parameters. To do this, each generator (WEC1, WEC2, and WEC3) and its delivered wave active power were studied separately. Then, every two generators are clustered. Finally, the three converters were aggregated to a common node. The Lysekil WEC model is fully explained in [19], and it is composed of three WEC units, each of which is formed by a surface buoy connected to the permanent magnet linear generator moored to a foundation on the seabed [68]. The main parameters associated with the model are specified in Appendix.
The effect of the wave active power aggregation is summarized in Table 1, and it was examined in the context of the key performance indicators (KPIs), which are described below.
  • Peak Power, Average Power, and Peak/Average Ratio.
    As the number of generators clustered at the grid connection point increases, both the peak and average power values of the power output from the wave energy plant increase, leading to a simultaneous decrease in the peak/average power ratio.
  • Normalized Standard Deviation (nSD).
    The normalized standard deviation is measured in p.u. and gives a measure of the relative power output fluctuations. This value is more intuitive than the value of absolute fluctuations.
  • Point of delivery KPIs.
    Table 1 shows the power delivered to the grid by the wave energy farm at the grid connection point. From the results, it can be concluded that clustering the WEC units improves the power output in terms of the peak/average ratio and standard deviation. Nevertheless, the power output variability is not completely improved. Consequently, additional techniques need to be carried out in order to achieve this goal; these techniques include filtering and valley filling, and their procedures are fully shown in Table 1.

7.2. Second Stage: Filtering and KESS Stage

To further improve the power output signal from the wave farm at Lysekil, a low-pass filter was designed. The filter has minimal complexity for its implementation in the real installation. The proposed filter is composed of a low-pass filter with a zero-order hold block. The combined filter is governed by (10), where f f i l is the filter’s frequency. Figure 17 shows the block diagram of the filter control step.
T = 1 2 π f f i l s + 1
Wave energy is characterized by highly stochastic behavior, including variable and random wave energy frequency, amplitude, and direction. At the Lysekil wave power plant, there are no generator controllers, and consequently, the high variability in wave natural energy resources translates into high variability in the power that is injected into the grid, as reported in [19,57]. Figure 18 shows the power output from the linear generators and the filtered power in the intermediate filtering stage. Note that the filtered signal corresponds to an intermediate stage before the KESS process since the flywheel is connected to the DC bus and the harmonic content at this stage is not an issue for the grid because it is located after the inverter.
As previously mentioned, the wave power plant offers large oscillations for short time periods. For this reason, the storage system to be used should meet certain criteria, such as quick charge/discharge cycles with no electrochemical degradation, a high power density, and a high capability of meeting stipulated requirements [69].
In this research, high-speed buffering was applied to the wave power prototype located at the Lysekil Test Site. The Lysekil flywheel was modeled as a hollow cylinder, as presented in [42,64]. The size of the flywheel can be selected according to the energy required on the basis of minimum and maximum thresholds.
Figure 19 shows the block diagram of the flywheel energy storage control, and the charge and discharge control strategy of the KESS is shown in Figure 20. A reference signal ( P r e f - F W ) is used to control the energy storage of the flywheel. The difference between the output power of the WEC array ( P W E C f a r m ) and the filtered power ( P f i l ) is used as the power reference signal ( P r e f - F W ) of the flywheel. If P W E C f a r m is larger than P f i l ( P r e f - F W = P W E C f a r m - P f i l > 0 ), the difference between both signals is sent as P r e f - F W to the KESS, and the flywheel stores energy. Once the KESS achieves its maximum state of charge (SOC) (0.9 p.u.), the excess power is curtailed ( P c u r t = P r e f - F W - P n o m F W ). If P r e f - F W = P W E C f a r m - P f i l < 0 , then the KESS is in discharge mode and the power injected into the system is equal to P r e f - F W . The KESS discharges energy until the S O C m i n limit is achieved. In this study, the S O C m i n = 0.25 p.u. If S O C m i n is reached, there is no possibility for the KESS to inject energy into the system, so the P W E C is sent to the shore. This control strategy will be linked with the wave generator controller to smooth the wave power farm output.
Figure 21 and Figure 22 show an example of the control strategy in two different periods of time. The lines in Figure 21 (i.e., A, B, and C) and the lines in Figure 22 (i.e., D, E, and F) represent the time intervals in which the flywheel performance experiences a change. The space between lines A and B corresponds to the KESS charge mode, in which the reference signals are positive ( P r e f - F W , orange line). Once the KESS achieves the maximum SOC ( S O C m a x =0.9* S O C n o m ) at line B, the power is then curtailed, and the power to shore ( P o u t , blue line) remains constant with the energy fed by the KESS. At point C, the reference signal becomes negative, and the KESS system is in discharge mode. Figure 22 shows a period of time in which the KESS charge and discharge mode is around the minimum KESS SOC. At the initial instance portrayed in Figure 22, the FESS SOC is situated at its minimum value ( S O C m i n =0.25* S O C n o m ). In the first instance of the simulation (i.e., up to line D), the installation’s power output ( P o u t , blue line) roughly follows the output reference signal of the wave emplacement once it has been filtered. This is because the KESS experiences constant charge/discharge cycles around its S O C m i n , and this is caused by the zero-crossing oscillations associated with the KESS’ reference signal. The KESS is charged during the time interval that ranges from line D to line E because of the positive reference signal, which allows the wave installation to maintain a constant power output of 3 kW until the time at which line F is reached. From this point, it is observed that the KESS does not possess enough stored energy to keep the installation’s power output at a constant value, so it tracks back the filtered signal of the power output ( P f r o m f a r m , green line).
Several simulations were performed (see Figure 23), and these simulations involved a filtered frequency range between 256 and 2048 Hz and a flywheel with a moment of inertia varying between I n o m and 5* I n o m . It must be noted that the flywheel control is linked to the filter control. Consequently, the optimal flywheel size depends not only on the inverter capacity but also on the cut-off frequency filter. Therefore, it can be deduced that a filter with a cut-off frequency of 256 Hz is the frequency that offers the minimum curtailment, the maximum energy to the shore, and greater mean power to the shore.
Once the optimal filter frequency for this installation was selected ( f f i l o p t = 256 Hz), a new experiment with a variable moment of inertia between 1 and 8 times the nominal inertia moment was performed. The objective of this experiment was to determine the optimal size of the flywheel.
Figure 24 shows this experiment’s results, which illustrate the relative improvement in the three KPIs. It can be seen that the improvement in the energy curtailed ranges from 20% ( I f w = 2* I n o m ) to 11% (for I f w higher than 5* I n o m ) compared with the I n o m value. The improvement in the energy to the shore varies from 6% to 1%, and it is almost constant from I f w = 2* I n o m . For the reduction in energy losses, the more drastic reduction is found between I f w = 2* I n o m and I f w = 4* I n o m , and from I f w = 5* I n o m , the reduction improvement decreases slowly. It can be concluded that the best size of the flywheel for this application is the one with a moment of inertia of I f w o p t = 5* I n o m . For the optimal flywheel size, the cylinder height is calculated by (11), where h is the height in meters of the prototype located at the Lysekil Test Site [70,71]:
h F W o p t = 2 * E F W m a x * h r e f I F W o p t * ω 2
The optimal cylinder height is h F W o p t = 0.9 * h , where h r e f is the flywheel’s height in the original prototype, E F W m a x is the maximum energy delivered by the flywheel, and I F W o p t is the optimal moment of inertia of the device. The operating speed ranges from ω m i n = 15 krpm to ω m a x = 30 krpm, with a minimum and maximum SOC of S O C m i n = 25 % and S O C m a x = 90 % , respectively.

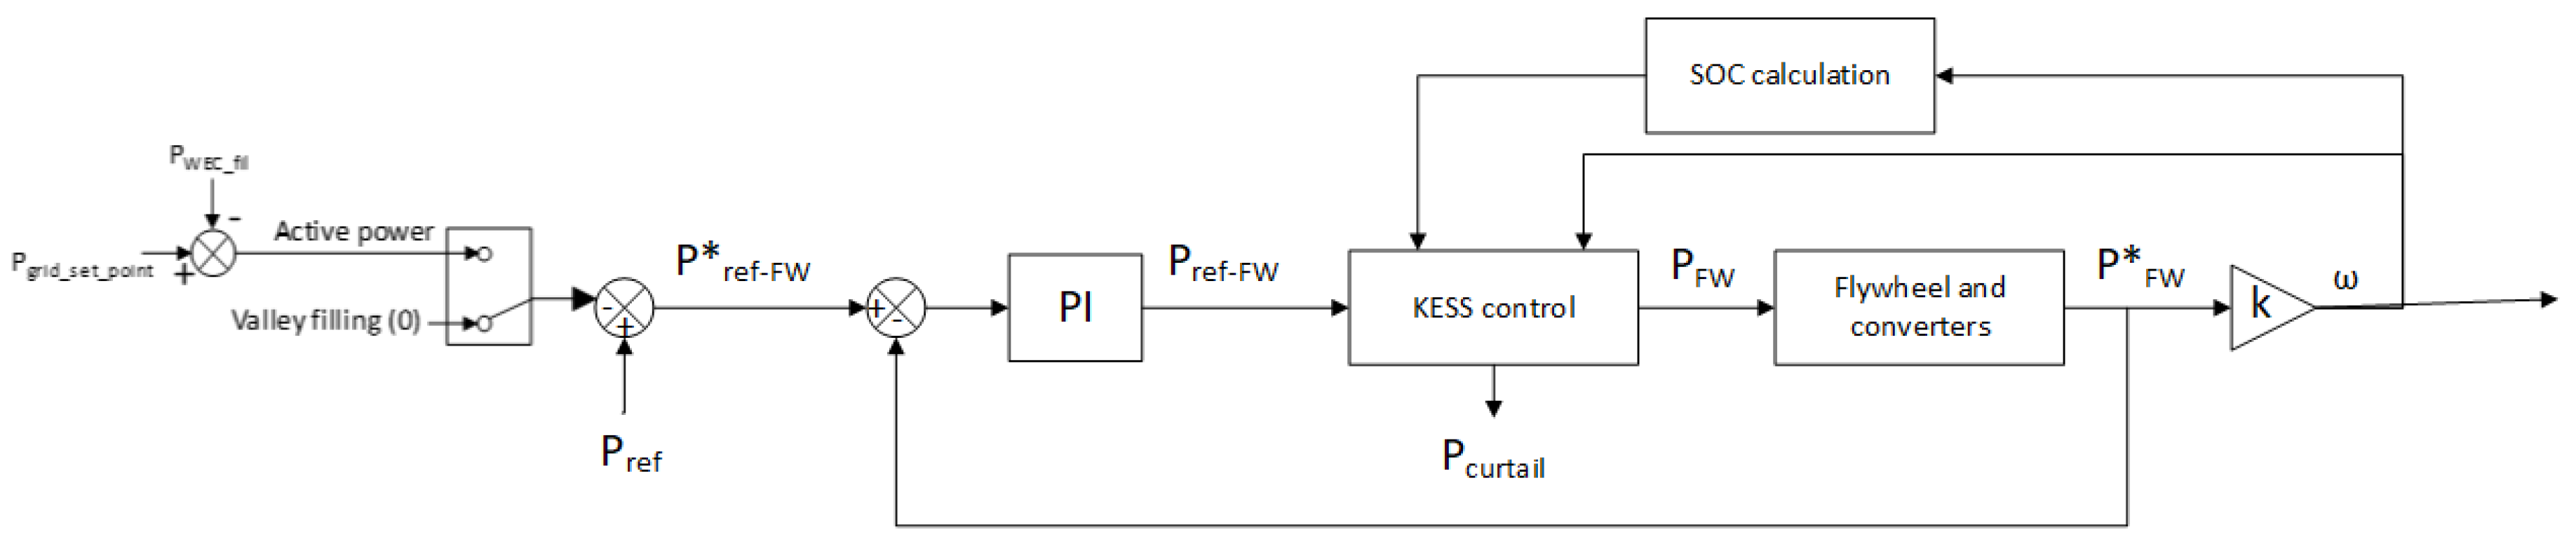
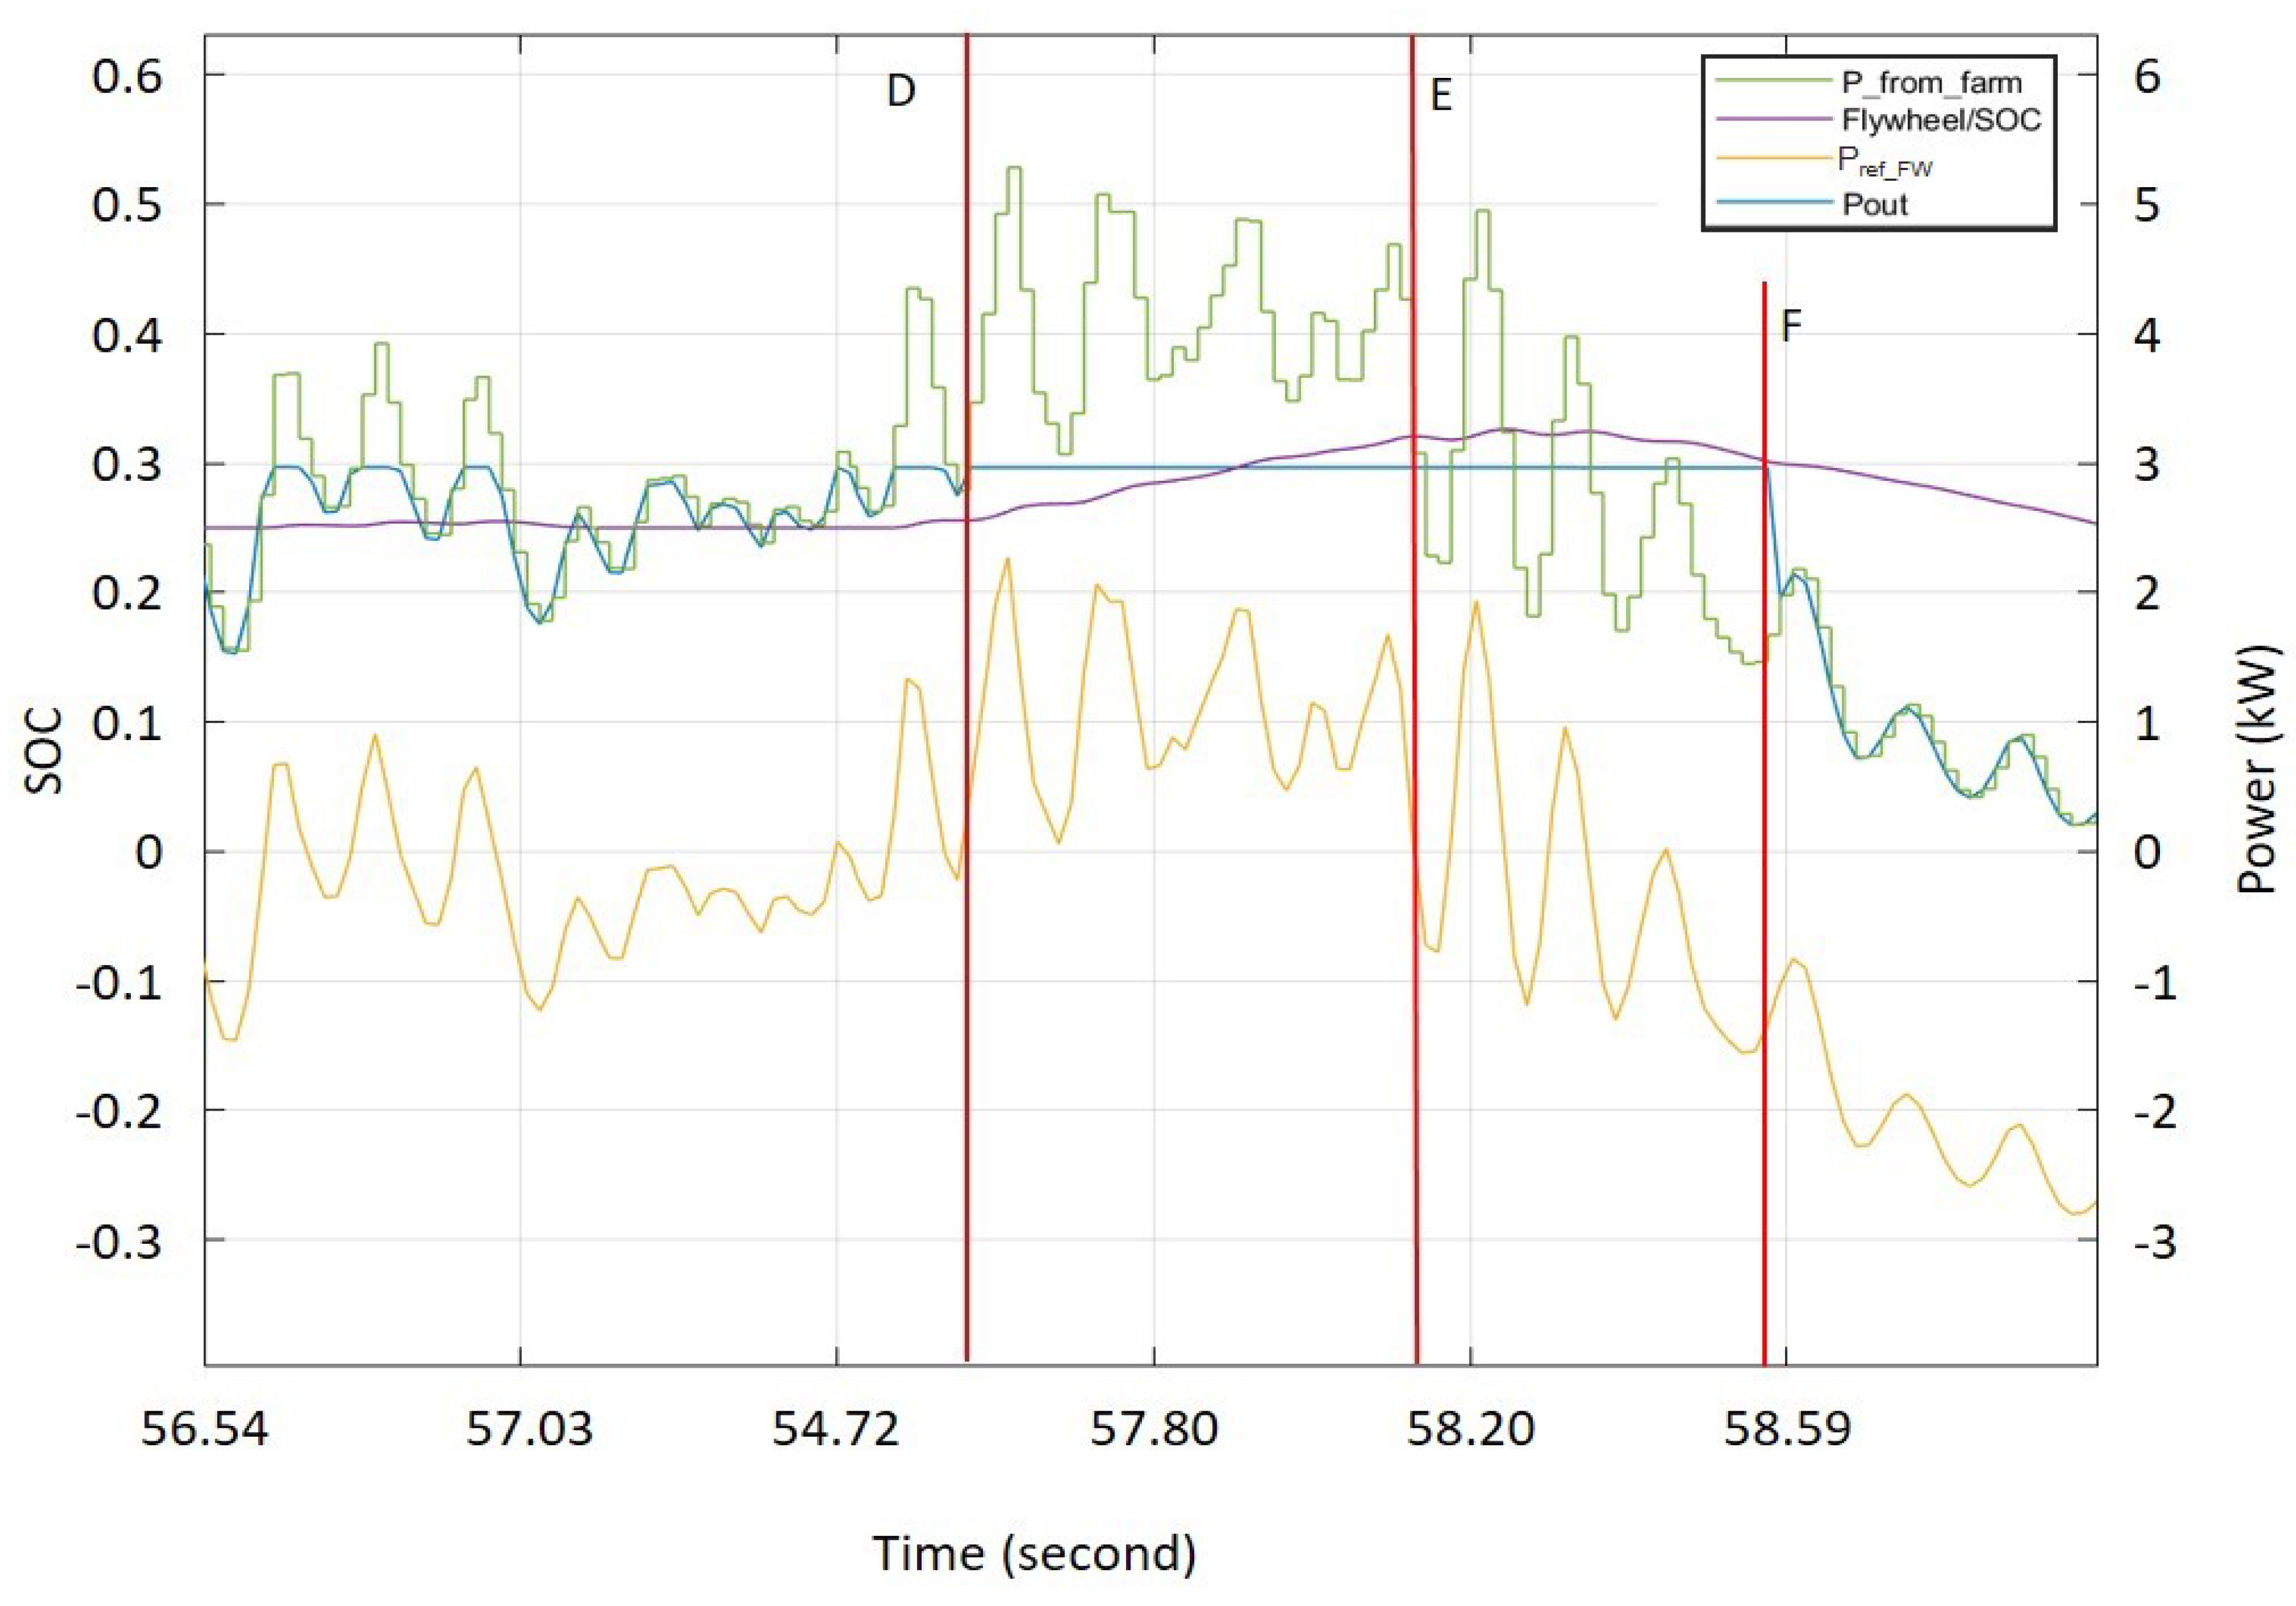
7.3. Active Power Control

The above sections describe both the filters and flywheel that were used to improve the LRS’s output signal. This subsection analyzes the capacity of the proposed hybrid wave energy farm’s flywheel system for tracking a certain power set-point given by the grid operator. The blue curve in Figure 25 shows the WEC output power delivered to the grid, the red curve shows the power delivered by the grid-connected wave-flywheel, and the green curve represents the flywheel’s SOC. It can be seen that the hybrid wave-flywheel system can deliver the 2 kW set-point established by the grid operator. However, during the time intervals in which the flywheel does not have enough stored energy, the hybrid installation is not capable of tracking the set-point established by the grid, and at this point, there is a need to regulate the energy stored in the flywheel.

8. Discussion

Table 2 summarizes the KPIs associated with the wave power smoothing control proposed in this paper. In analyzing Table 1 and Table 2, the following conclusions can be drawn:
  • First, aggregating a group of generators into one cluster results in a decreased Peak/Average power ratio and an improved normalized standard deviation (nSD).
  • In addition, two clustered wave generators share the same magnitude order when referencing the peak values; this results in a notable increase in both the energy losses and the energy delivered to the grid (to the shore). This can be seen in Table 1, in which the results of aggregating Generators 2 and 3 are reported.
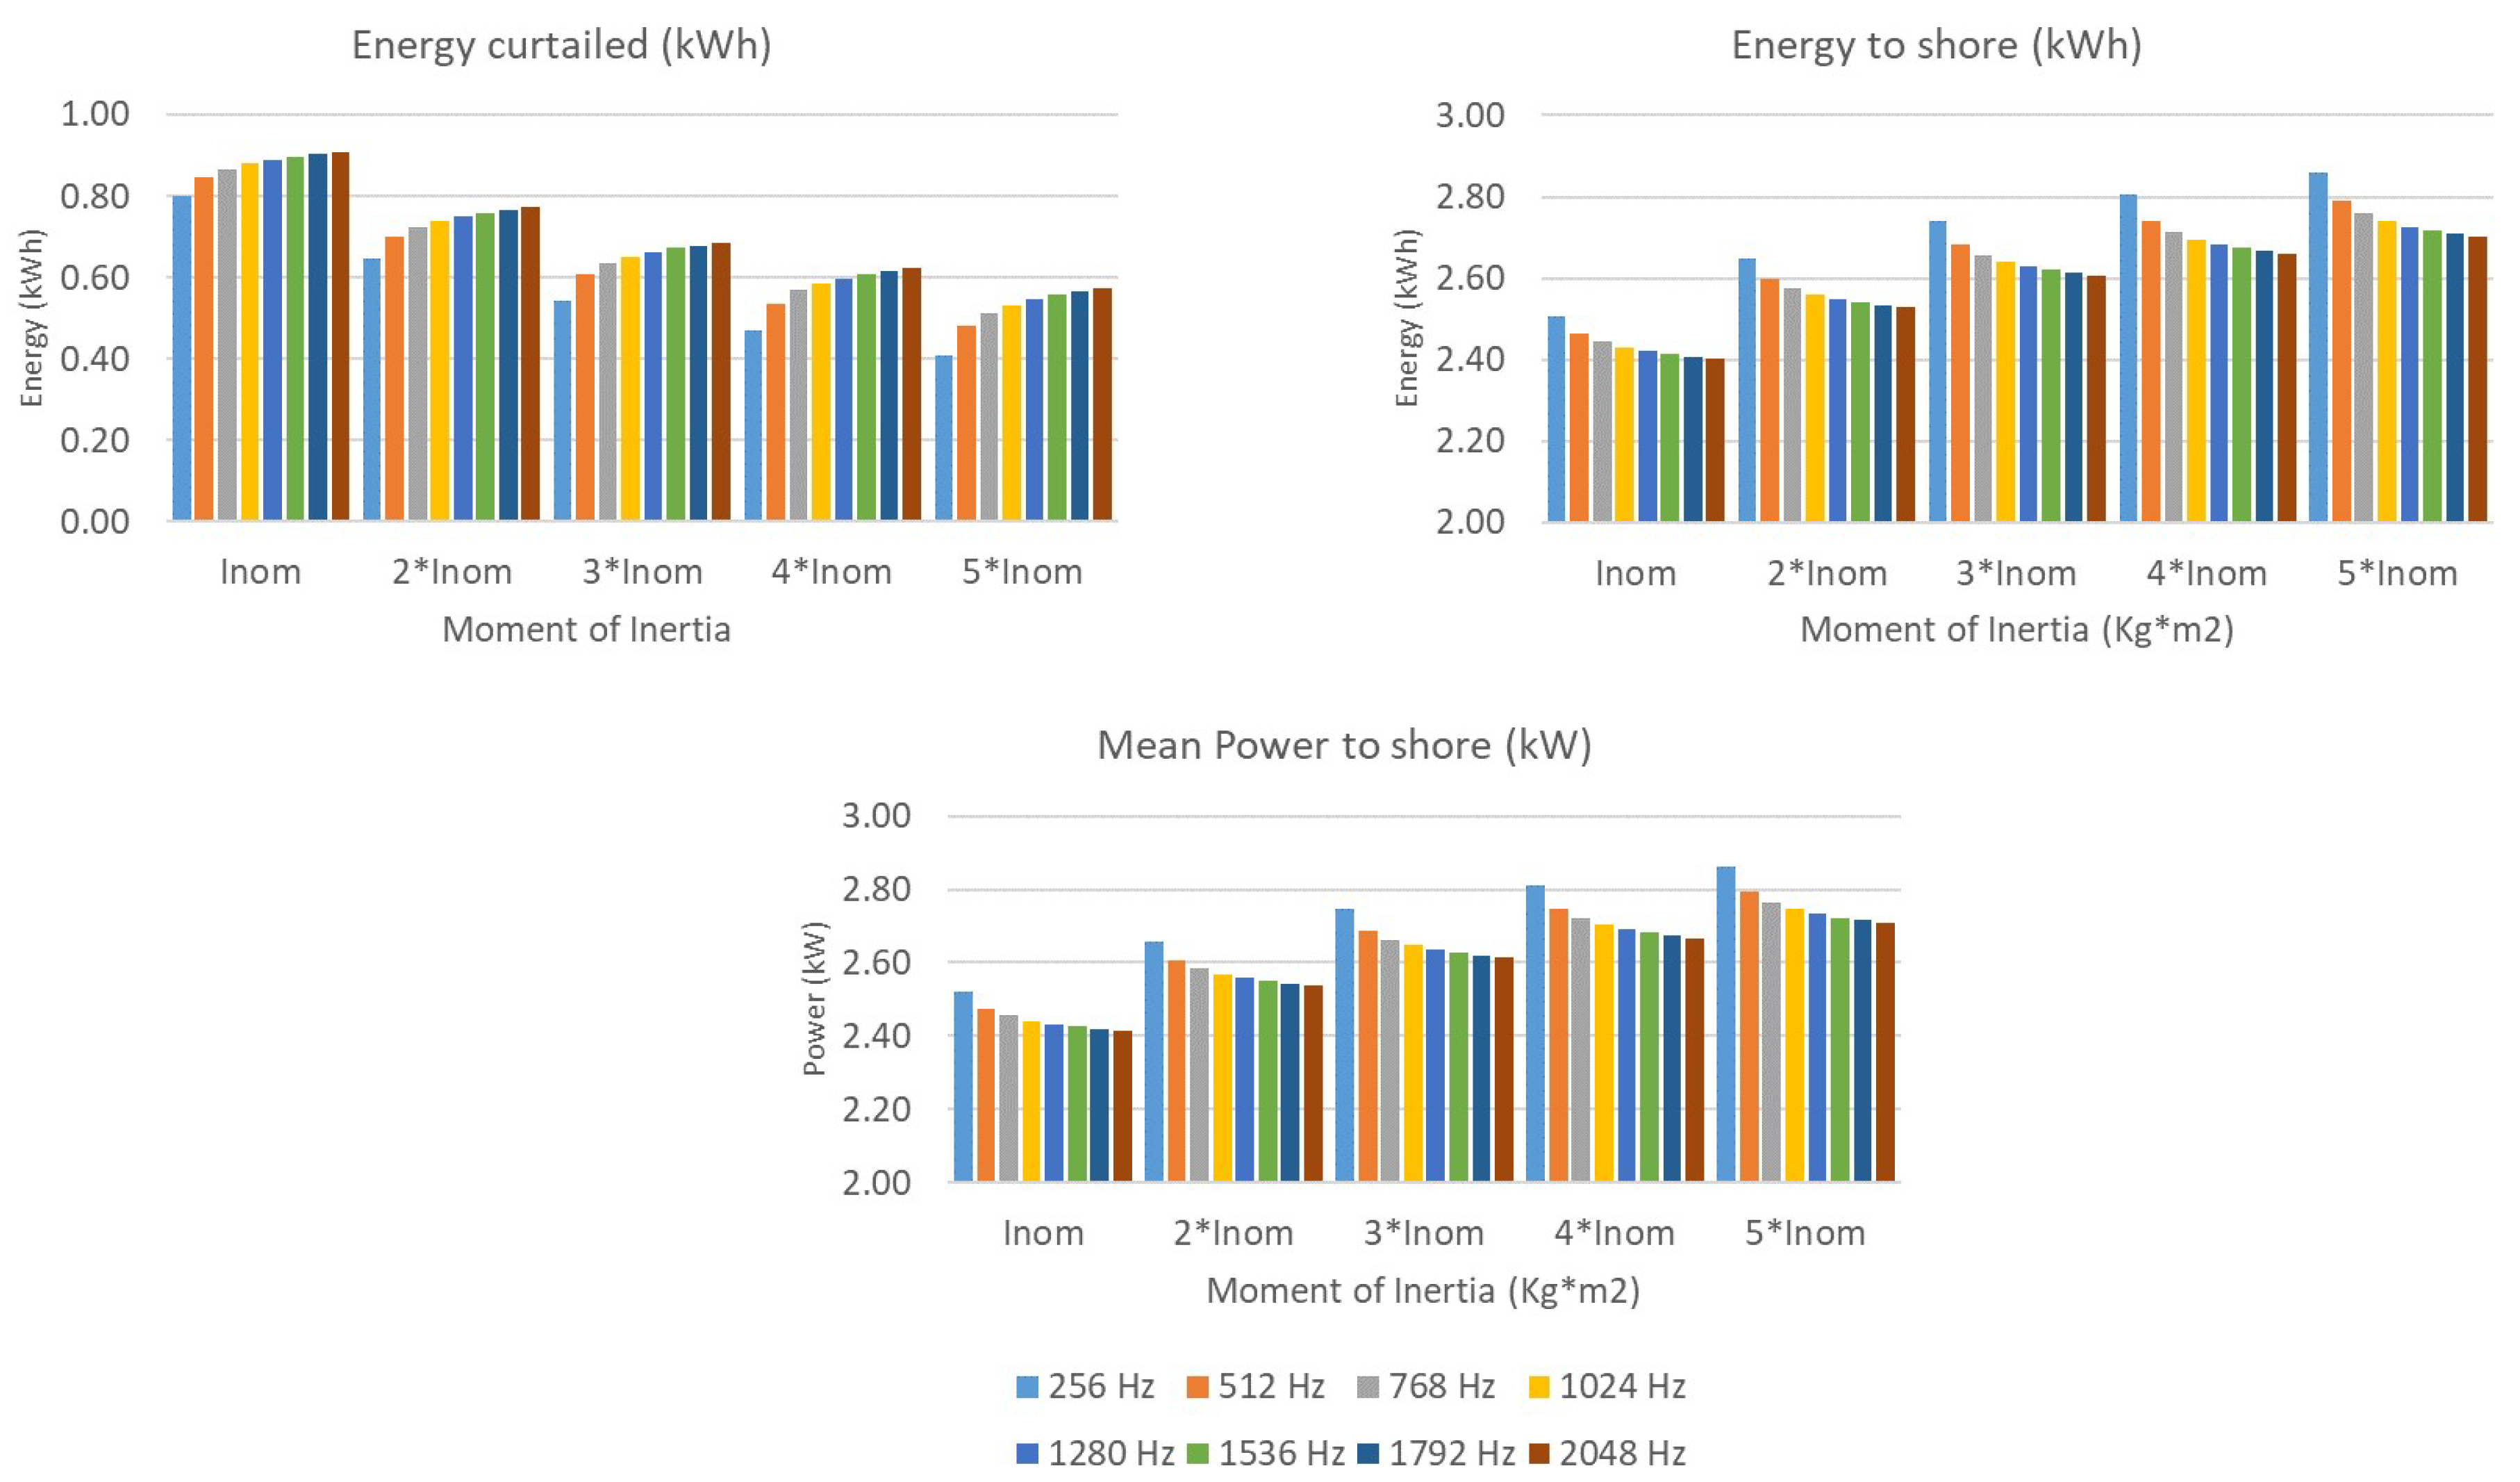
  • Furthermore, the cut-off frequency of the low-pass filter is critical for the smoothing process. The study found an optimal cut-off frequency of 256 Hz; it not only filters the output power but also reduces the energy curtailment. Increasing the cut-off frequency of the filter above this optimal value does not decrease the losses in the substation or flywheel, but it increases the energy curtailment, which is not efficient.
  • Moreover, increasing the moment of inertia of the flywheel (that is, increasing the cylinder height) results in a considerable decrease in the energy curtailment. Nevertheless, an appropriate criterion for choosing the cylinder size could be based on the related improvement in (1) the energy that is delivered to the shore and (2) the curtailed energy. This optimal value is achieved for a moment of inertia that is equal to 3.18 kg m 2 , which corresponds to a flywheel size that is roughly 10% of the inverter’s size.
  • In conclusion, almost all of the analyzed KPIs are considerably improved if the aforementioned smoothing techniques are carried out, such as the peak power to the shore, peak/mean power to the shore ratio, normalized standard deviation, and grid connection losses, all of which are decreased. These findings are a clear indicator of the effectiveness of the proposed simulated approach.

9. Conclusions

Flywheels are found to be a good option for the smoothing process. It was confirmed that utilizing flywheel systems coupled to wave farms improves the power output, and the grid integration of this technology is improved accordingly.
In this paper, a hybrid wave/KESS installation control is proposed. This control combines wave energy generator clustering and filtering techniques with the control of a flywheel in order to improve the power output of the hybrid installation. The proposed control was applied at the Lysekil Wave Energy Site located in Sweden by using real measurements gathered from the wave energy generators. It was established that the proposed control smooths the power output delivered by the marine energy installation to the grid and allows the connection of the wave/FESS installation to power grids, even weak ones. Moreover, it was shown that the hybrid plant can follow a power reference signal imposed by the grid operator. Consequently, the proposed combination of the wave energy farm control and flywheel energy storage system can be grid-connected as a controllable distributed energy resource. Therefore, the hybrid system is capable of offering enough flexibility to the distributed system operator in terms of ancillary services.

Author Contributions

All authors contributed to the design and implementation of the research, to the analysis of the results and to the writing of the manuscript.

Funding

This research received no external funding

Conflicts of Interest

The authors declare no conflict of interest.

Appendix A

WEC main parameters
Nominal power at 0.7 m/s10 kW
Voltage (line to line, rms at 0.7 m/s), V d 200 V
Generator resistance, R G 0.44 ± 1% O m e g a
Generator inductance, L S 11.7 mH
Air gap3 mm
Size of the magnet block6.5 × 35 × 100 mm 3
Pole width, w p 50 mm
Number of stator sides4
Vertical stator length1264 mm
Vertical translator length1867 mm
Transator resp. stator width400 mm
Translator weight1000 kg

References

  1. Organization for Economic Cooperation and Development (OECD). World Energy Outlook; Technical Report; International Energy Agency: Paris, France, 2016; ISBN 978-92-64-26495-3. [Google Scholar]
  2. Uihlein, A.; Magagna, D. Wave and tidal current energy—A review of the current state of research beyond technology. Renew. Sustain. Energy Rev. 2016, 58, 1070–1081. [Google Scholar] [CrossRef]
  3. Falnes, J. A review of wave-energy extraction. Mar. Struct. 2007, 20, 185–201. [Google Scholar] [CrossRef]
  4. Prakash, S.; Mamun, K.; Islam, F.; Mudliar, R.; Pau’u, C.; Kolivuso, M.; Cadralala, S. Wave Energy Converter: A Review of Wave Energy Conversion Technology. In Proceedings of the 3rd Asia-Pacific World Congress on Computer Science and Engineering, Nadi, Fiji, 5–6 December 2016; pp. 71–77. [Google Scholar]
  5. Marine Energy—Wave Device The European Marine Energy Centre. 2019. Available online: http://www.emec.org.uk/marine-energy/wave-devices/ (accessed on 24 February 2019).
  6. Hong, Y.; Waters, R.; Boström, C.; Eriksson, M.; Engström, J.; Leijon, M. Review on electrical control strategies for wave energy converting systems. Renew. Sustain. Energy Rev. 2014, 31, 329–342. [Google Scholar] [CrossRef]
  7. Leijon, J. Simulation of a Linear Wave Energy Converter with Different Damping Control Strategies for Improved Wave Energy Extraction. Master’s Thesis, Uppsala University, Uppsala, Sweden, 2016. [Google Scholar]
  8. Babarit, A.; Guglielmi, M.; Clément, A.H. Declutching control of a wave energy converter. Ocean Eng. 2009, 36, 1015–1024. [Google Scholar] [CrossRef] [Green Version]
  9. Brito, M.; Teixeira, L.; Canelas, R.B.; Ferreira, R.M.; Neves, M.G. Experimental and Numerical Studies of Dynamic Behaviors of a Hydraulic Power Take-Off Cylinder Using Spectral Representation Method. ASME J. Tribol. 2017, 140, 021102. [Google Scholar] [CrossRef]
  10. De, O. Falcão, A.F. Modelling and control of oscillating-body wave energy converters with hydraulic power take-off and gas accumulator. Ocean Eng. 2007, 34, 2021–2032. [Google Scholar]
  11. De, O. Falcão, A.F. Phase control through load control of oscillating-body wave energy converters with hydraulic PTO system. Ocean Eng. 2008, 35, 358–366. [Google Scholar]
  12. Howlader, A.M.; Urasaki, N.; Yona, A.; Senjyu, T.; Saber, A.Y. A review of output power smoothing methods for wind energy conversion systems. Renew. Sustain. Energy Rev. 2013, 26, 135–146. [Google Scholar] [CrossRef]
  13. Rahm, M.; Svensson, O.; Boström, C.; Waters, R.; Leijon, M. Experimental results from the operation of aggregated wave energy converters. IET Renew. Power Gener. 2012, 6, 149–160. [Google Scholar] [CrossRef] [Green Version]
  14. Venugopal, V.; Smith, G.H. The effect of wave period filtering on wave power extraction and device tuning. Ocean Eng. 2007, 34, 1120–1137. [Google Scholar] [CrossRef]
  15. Godoy-Diana, R.; Czitrom, S.P. On the tuning of a wave-energy driven oscillating -water-column seawater pump to polychromatic waves. Ocean Eng. 2007, 34, 2374–2384. [Google Scholar] [CrossRef]
  16. Bedard, R.; Hagerman, G. E2I EPRI Assessment Offshore Wave Energy Conversion Devices; Electrical Innovation Institute: Washington, DC, USA, 2004. [Google Scholar]
  17. Moreno-Torres, P.; Blanco, M.; Navarro, G.; Lafoz, M. Power smoothing system for wave energy converters by means of a supercapacitor-based energy storage system. In Proceedings of the 2015 17th European Conference on Power Electronics and Applications (EPE’15 ECCE-Europe), Geneva, Switzerland, 8–10 September 2015; pp. 1–9. [Google Scholar]
  18. Blavette., A.; O’Sullivan, D.L.; Lewis, T.; Egan, M.G. Grid Integration of Wave and Tidal Energy. In Proceedings of the International Conference on Offshore Mechanics and Arctic Engineering, Rotterdam, The Netherlands, 19–24 June 2011; pp. 749–758. [Google Scholar]
  19. Lejerskog, E.; Boström, C.; Hai, L.; Waters, R.; Leijon, M. Experimental results on power absorption from a wave energy converter at the Lysekil wave energy research site. Renew. Energy 2015, 77, 9–14. [Google Scholar] [CrossRef]
  20. Ma, T.; Yang, H.; Lu, L. Development of hybrid battery–supercapacitor energy storage for remote area renewable energy systems. Appl. Energy 2015, 153, 56–62. [Google Scholar] [CrossRef]
  21. Parwal, A.; Fregelius, M.; Temiz, I.; Göteman, M.; de Oliveira, J.G.; Boström, C.; Leijon, M. Energy management for a grid-connected wave energy park through a hybrid energy storage system. Appl. Energy 2018, 231, 399–411. [Google Scholar] [CrossRef]
  22. Krings, A.; Soulard, J. Overview and comparison of iron loss models for electrical machines. J. Electr. Eng. 2010, 10, 162–169. [Google Scholar]
  23. Barranger, J. Hysteresis and Eddy-Current Losses of a Transformer Lamination Viewed as an Application of the Poynting Theorem; NASA Technical Note (TN-D-3114); National Aeronautics and Space Administration: Washington, DC, USA, 1965.
  24. Henderson, R. Design, simulation, and testing of a novel hydraulic power take-off system for the Pelamis wave energy converter. Renew. Energy 2006, 31, 271–283. [Google Scholar] [CrossRef]
  25. Zhao, X.; Yan, Z.; Zhang, X.P. A wind-wave farm system with self-energy storage and smoothed power output. IEEE Access 2016, 4, 8634–8642. [Google Scholar] [CrossRef]
  26. Maslen, E.H.; Schweitzer, G. Magnetic Bearings: Theory, Design, and Application to Rotating Machinery; Springer: Berlin, Germany, 2009. [Google Scholar]
  27. Bolund, B.; Bernhoff, H.; Leijon, M. Flywheel energy and power storage systems. Renew. Sustain. Energy Rev. 2007, 11, 235–258. [Google Scholar] [CrossRef]
  28. Arani, A.K.; Karami, H.; Gharehpetian, G.; Hejazi, M. Review of Flywheel Energy Storage Systems structures and applications in power systems and microgrids. Renew. Sustain. Energy Rev. 2017, 69, 9–18. [Google Scholar] [CrossRef]
  29. Infield, D.; Hill, J. Literature Review: Electrical Energy Storage for Scotland; University of Strathclyde: Glasgow, UK, 2015. [Google Scholar]
  30. Amaris, H.; Alonso, M.; Alvarez, C. Reactive Power Management of Power Networks with Wind Generation; Springer: Berlin, Germany, 2013. [Google Scholar]
  31. Amaris, H.; Alonso, M. Coordinated reactive power management in power networks with wind turbines and FACTS devices. Energy Convers. Manag. 2011, 52, 2575–2586. [Google Scholar] [CrossRef]
  32. Asociación Española de Normalización. UNE-EN 50160: Voltage Characteristics of Electricity Supplied by Public Electricity Networks; Technical Report; Asociación Española de Normalización: Madrid, Spain, 2011; 2011/A1:2015. [Google Scholar]
  33. Amiryar, M.E.; Pullen, K.R. A review of flywheel energy storage system technologies and their applications. Appl. Sci. 2017, 7, 286. [Google Scholar] [CrossRef]
  34. Diaz-Gonzalez, F.; Bianchi, F.D.; Sumper, A.; Gomis-Bellmunt, O. Control of a flywheel energy storage system for power smoothing in wind power plants. IEEE Trans. Energy Convers. 2014, 29, 204–214. [Google Scholar] [CrossRef]
  35. Gurumurthy, S.R.; Agarwal, V.; Sharma, A. Optimal energy harvesting from a high-speed brushless DC generator-based flywheel energy storage system. IET Electr. Power Appl. 2013, 7, 693–700. [Google Scholar] [CrossRef]
  36. Wang, L.; Yu, J.Y.; Chen, Y.T. Dynamic stability improvement of an integrated offshore wind and marine-current farm using a flywheel energy-storage system. IET Renew. Power Gener. 2011, 5, 387–396. [Google Scholar] [CrossRef]
  37. Park, J.D.; Kalev, C.; Hofmann, H.F. Control of high-speed solid-rotor synchronous reluctance motor/generator for flywheel-based uninterruptible power supplies. IEEE Trans. Ind. Electron. 2008, 55, 3038–3046. [Google Scholar] [CrossRef]
  38. Li, W.; Chau, K.; Ching, T.; Wang, Y.; Chen, M. Design of a high-speed superconducting bearingless machine for flywheel energy storage systems. IEEE Trans. Appl. Supercond. 2015, 25. [Google Scholar] [CrossRef]
  39. Sihler, C.; Miri, A.M. A stabilizer for oscillating torques in synchronous machines. IEEE Trans. Ind. Appl. 2005, 41, 748–755. [Google Scholar] [CrossRef]
  40. Recheis, M.N.; Schweighofer, B.; Fulmek, P.; Wegleiter, H. Selection of magnetic materials for bearingless high-speed mobile flywheel energy storage systems. IEEE Trans. Magn. 2014, 50, 1–4. [Google Scholar] [CrossRef]
  41. Faraji, F.; Majazi, A.; Al-Haddad, K. A comprehensive review of Flywheel Energy Storage System technology. Renew. Sustain. Energy Rev. 2017, 67, 477–490. [Google Scholar]
  42. Abrahamsson, J.; Hedlund, M.; Kamf, T.; Bernhoff, H. High-speed kinetic energy buffer: Optimization of composite shell and magnetic bearings. IEEE Trans. Ind. Electron. 2014, 61, 3012–3021. [Google Scholar] [CrossRef]
  43. Ibarra-Berastegi, G.; Sáenz, J.; Ulazia, A.; Serras, P.; Esnaola, G.; Garcia-Soto, C. Electricity production, capacity factor, and plant efficiency index at the Mutriku wave farm (2014–2016). Ocean Eng. 2018, 147, 20–29. [Google Scholar] [CrossRef]
  44. Tedeschi, E.; Santos-Mugica, M. Modeling and control of a wave energy farm including energy storage for power quality enhancement: The bimep case study. IEEE Trans. Power Syst. 2014, 29, 1489–1497. [Google Scholar] [CrossRef]
  45. California Energy Commission. Flywheel Systems for Utility Scale Energy Storage: A Transformative Flywheel Project for Commercial Readiness; Technical Report; California Energy Commission: Union City, CA, USA, 2019.
  46. Zhou, Z.; Benbouzid, M.; Charpentier, J.F.; Scuiller, F.; Tang, T. A review of energy storage technologies for marine current energy systems. Renew. Sustain. Energy Rev. 2013, 18, 390–400. [Google Scholar] [CrossRef] [Green Version]
  47. Hebner, R.; Beno, J.; Walls, A. Flywheel batteries come around again. IEEE Spectr. 2002, 39, 46–51. [Google Scholar] [CrossRef] [Green Version]
  48. Bleuler, H.; Sandtner, J.; Regamey, Y.J.; F Barrot, A. Passive Magnetic Bearings for Flywheels. Solid Mechanics and Its Applications 2005. Available online: http://www.researchgate.net/publication/228554073_Passive_Magnetic_Bearings_for_Flywheels (accessed on 24 February 2019).
  49. Wang, W.; Hofmann, H.; Bakis, C.E. Ultrahigh speed permanent magnet motor/generator for aerospace flywheel energy storage applications. In Proceedings of the IEEE International Conference on Electric Machines and Drives, San Antonio, TX, USA, 15 May 2005; pp. 1494–1500. [Google Scholar]
  50. International Energy Agency. Implementing Agreement on Ocean Energy Systems; Technical Report; IEA-OES Executive Committee: Lisbon, Portugal, 2009. [Google Scholar]
  51. Boström, C. Electrical Systems for Wave Energy Conversion. Ph.D. Thesis, Uppsala University, Uppsala, Sweden, 2011. [Google Scholar]
  52. Waters, R.; Engström, J.; Isberg, J.; Leijon, M. Wave climate of the Swedish west coast. Renew. Energy 2009, 34, 1600–1606. [Google Scholar] [CrossRef]
  53. Rahm, M.; Boström, C.; Svensson, O.; Grabbe, M.; Bulow, F.; Leijon, M. Offshore underwater substation for wave energy converter arrays. IET Renew. Power Gener. 2010, 4, 602–612. [Google Scholar] [CrossRef]
  54. Rémouit, F.; Chatzigiannakou, M.A.; Bender, A.; Temiz, I.; Sundberg, J.; Engström, J. Deployment and Maintenance of Wave Energy Converters at the Lysekil Research Site: A Comparative Study on the Use of Divers and Remotely-Operated Vehicles. J. Mar. Sci. Eng. 2018, 6, 39. [Google Scholar] [CrossRef]
  55. Melo, A.B.; Villate, J.L. Annual Report 2016; Technical Report; Executive Committee of Ocean Energy Systems: Lisbon, Portugal, 2016. [Google Scholar]
  56. Lysekil Wave Energy Site. 2018. Available online: https://tethys.pnnl.gov/annex-iv-sites/lysekil-wave-energy-site (accessed on 6 May 2018).
  57. Leijon, M.; Boström, C.; Danielsson, O.; Gustafsson, S.; Haikonen, K.; Langhamer, O.; Strömstedt, E.; Stålberg, M.; Sundberg, J.; Svensson, O.; et al. Wave energy from the North Sea: Experiences from the Lysekil research site. Surv. Geophys. 2008, 29, 221–240. [Google Scholar] [CrossRef]
  58. Lejerskog, E.; Gravråkmo, H.; Savin, A.; Strömstedt, E.; Tyrberg, S.; Haikonen, K.; Krishna, R.; Boström, C.; Rahm, M.; Ekström, R.; et al. Lysekil research site, Sweden: A status update. In Proceedings of the 9th European Wave and Tidal Energy Conference, Southampton, UK, 5–9 September 2011. [Google Scholar]
  59. Svensson, O.; Boström, C.; Rahm, M.; Leijon, M. Description of the control and measurement system used in the low voltage marine substation at the Lysekil research site. In Proceedings of the 8th European Wave and Tidal Energy Conference, Uppsala, Sweden, 7–10 September 2009. [Google Scholar]
  60. Mätdata-Islandsberg. 2018. Available online: http://islandsberg.angstrom.uu.se/ (accessed on 22 April 2018).
  61. Boström, C.; Waters, R.; Lejerskog, E.; Svensson, O.; Stalberg, M.; Stromstedt, E.; Leijon, M. Study of a wave energy converter connected to a nonlinear load. IEEE J. Ocean. Eng. 2009, 34, 123–127. [Google Scholar] [CrossRef]
  62. Castellucci, V.; García-Terán, J.; Eriksson, M.; Padman, L.; Waters, R. Influence of sea state and tidal height on wave power absorption. IEEE J. Ocean. Eng. 2017, 42, 566–573. [Google Scholar] [CrossRef]
  63. Waters, R.; Stålberg, M.; Danielsson, O.; Svensson, O.; Gustafsson, S.; Strömstedt, E.; Eriksson, M.; Sundberg, J.; Leijon, M. Experimental results from sea trials of an offshore wave energy system. Appl. Phys. Lett. 2007, 90, 034105. [Google Scholar] [CrossRef]
  64. Hedlund, M. Electrified Integrated Kinetic Energy Storage. Ph.D. Thesis, Uppsala University, Uppsala, Sweden, 2017. [Google Scholar]
  65. Hedlund, M.; Abrahamsson, J.; Pérez-Loya, J.J.; Lundin, J.; Bernhoff, H. Eddy currents in a passive magnetic axial thrust bearing for a flywheel energy storage system. Int. J. Appl. Electromagn. Mech. 2017, 54, 389–404. [Google Scholar] [CrossRef] [Green Version]
  66. Hedlund, M.; Lundin, J.; de Santiago, J.; Abrahamsson, J.; Bernhoff, H. Flywheel energy storage for automotive applications. Energies 2015, 8, 10636–10663. [Google Scholar] [CrossRef]
  67. Gorland, S.H.; Kempke, E.E., Jr.; Lumannick, S. Experimental Windage Losses for Close Clearance Rotating Cylinders in the Turbulent Flow Regime; Technical Report; NASA Technical Memorandum: Washington, DC, USA, 1970.
  68. Bostrom, C.; Leijon, M. Operation analysis of a wave energy converter under different load conditions. IET Renew. Power Gener. 2011, 5, 245–250. [Google Scholar] [CrossRef]
  69. Larsson, K. Investigation of a Wave Energy Converter with a Flywheel and a Corresponding Generator Design. Master’s Thesis, Chalmers University of Technology, Göteborg, Sweden, 2012. [Google Scholar]
  70. Abram, N.J.; McGregor, H.V.; Tierney, J.E.; Evans, M.N.; McKay, N.P.; Kaufman, D.S.; Thirumalai, K.; Martrat, B.; Goosse, H.; Phipps, S.J.; et al. Early onset of industrial-era warming across the oceans and continents. Nature 2016, 536, 411. [Google Scholar] [CrossRef]
  71. Tornelli, C.; Zuelli, R.; Marinelli, M.; Rezkalla, M.M.; Heussen, K.; Morch, A.Z.; Cornez, L.; Zaher, A.S.; Catterson, V. Key Requirements for Future Control Room Functionality; Technical Report, The ELECTRA EU Research Project; University of Oldenburg: Oldenburg, Germany, 2015. [Google Scholar]
Figure 1. WEC’s power output for the Lysekil wave farm.
Energies 12 02196 g001
Figure 2. Transformation of wave resources into electrical energy.
Energies 12 02196 g002
Figure 3. Regular and real (irregular) waves’ waveform comparison.
Energies 12 02196 g003
Figure 4. Structure and components of a flywheel. (Reproduced with permission from the authors [33]).
Energies 12 02196 g004
Figure 5. Applications of Flywheel Energy Storage Systems [27,42,43,44].
Energies 12 02196 g005
Figure 6. Electric schemes of a grid-connected flywheel. (a) back-to-back topology (b) back-to-back wind-FESS combined topology [41].
Energies 12 02196 g006
Figure 7. Location and state of the sea at the Lysekil marine facility [51,53].
Energies 12 02196 g007
Figure 8. Wave climate matrix at Lysekil research site [54].
Energies 12 02196 g008
Figure 9. Outline of the basic components of the LRS [57].
Energies 12 02196 g009
Figure 10. DDLG (a) and point absorber (b) buoys at the LRS [19,51].
Energies 12 02196 g010
Figure 11. Electrical diagram of the LRS on-shore connection [58].
Energies 12 02196 g011
Figure 12. Boxplot analysis of each phase of the wave converters (WEC1, 2, and 3).
Energies 12 02196 g012
Figure 13. Voltages and power of P W E C 1 .
Energies 12 02196 g013
Figure 14. Circuit diagram applied of a linear wave energy system located in Lysekil Test Site.
Energies 12 02196 g014
Figure 15. Buoy wave elevation (a) and WECs’ power output (b) for the Lysekil wave farm.
Energies 12 02196 g015
Figure 16. Schematic representation of the power output smoothening process.
Energies 12 02196 g016
Figure 17. Block diagram of the filtering process.
Energies 12 02196 g017
Figure 18. Results of the filtering control system over the wave power output.
Energies 12 02196 g018
Figure 19. Block diagram of the FESS control process.
Energies 12 02196 g019
Figure 20. KESS control flowchart.
Energies 12 02196 g020
Figure 21. Example of the KESS Control’s performance I.
Energies 12 02196 g021
Figure 22. Example of the KESS Control’s performance II.
Energies 12 02196 g022
Figure 23. Comparison of energy curtailed, energy to shore, and mean power to shore between different filtered frequencies and flywheel moments of inertia.
Energies 12 02196 g023
Figure 24. Relative improvements in KPIs.
Energies 12 02196 g024
Figure 25. Power-to-shore following a grid set-point.
Energies 12 02196 g025
Table 1. Wave power data analysis from the three generators and the effect of aggregation.
Peak
P shore
(kW)
Mean
P shore
(kW)
Peak/Ave.
P shore
Normalized
Standard
Deviation
Energy
to Shore
(kWh)
Grid
Losses
(Wh)
WEC19.940.8112.281.540.810.85
WEC240.821.2932.711.751.252.42
WEC330.091.3522.321.521.352.48
WEC (1 + 2)42.832.0620.821.232.054.12
WEC (1 + 3)33.982.1615.751.122.154.26
WEC (2 + 3)45.302.6017.451.162.596.20
All WECs45.583.4113.390.963.48.840
Table 2. Summarized results for different smoothening stages.
Peak
P shore
(kW)
Mean
P shore
(kW)
Peak/Ave.
P shore
Grid
Losses
(Wh)
Curtailed
Energy
(kWh)
Energy
to Shore
(kWh)
Normalized
Standard
Deviation
WEC
clustering
45.583.4113.398.843.400.96
LPF at 256 Hz9.232.523.6612.722.510.58
KESS (3.18 kg.m2)9.232.913.174.370.362.920.49
Active power control4.562.681.713.470.702.680.44

