Article

Wave-to-Wire Power Maximization Control for All-Electric Wave Energy Converters with Non-Ideal Power Take-Off

by
Marios Charilaos Sousounis
* and
Jonathan Shek
School of Engineering, Institute for Energy Systems, The University of Edinburgh, Faraday Building, The King’s Buildings, Colin Maclaurin Road, Edinburgh EH9 3DW, UK
*
Author to whom correspondence should be addressed.
Energies 2019, 12(15), 2948; https://doi.org/10.3390/en12152948
Submission received: 19 May 2019 / Revised: 17 July 2019 / Accepted: 29 July 2019 / Published: 31 July 2019

Abstract

:
The research presented in this paper investigates novel ways of optimizing all-electric wave energy converters for maximum wave-to-wire efficiency. In addition, a novel velocity-based controller is presented which was designed specifically for wave-to-wire efficiency maximization. In an ideal wave energy converter system, maximum efficiency in power conversion is achieved by maximizing the hydrodynamic efficiency of the floating body. However, in a real system, that involves losses at different stages from wave to grid, and the global wave-to-wire optimum differs from the hydrodynamic one. For that purpose, a full wave-to-wire wave energy converter that uses a direct-drive permanent magnet linear generator was modelled in detail. The modelling aspect included complex hydrodynamic simulations using Edinburgh Wave Systems Simulation Toolbox and the electrical modelling of the generator, controllers, power converters and the power transmission side with grid connection in MATLAB/Simulink. Three reference controllers were developed based on the previous literature: a real damping, a reactive spring damping and a velocity-based controller. All three literature-based controllers were optimized for maximum wave-to-wire efficiency for a specific wave energy resource profile. The results showed the advantage of using reactive power to bring the velocity of the point absorber and the wave excitation force in phase, which was done directly using the velocity-based controller, achieving higher efficiencies. Furthermore, it was demonstrated that maximizing hydrodynamic energy capture may not lead to maximum wave-to-wire efficiency. Finally, the controllers were also tested in random sea states, and their performance was evaluated.

1. Introduction

Wave energy has the potential to supply significant amounts of clean and renewable energy to the electrical grid. Adding wave energy into the energy mix of an electrical system can potentially enhance reliability of supply to isolated island communities, while also decreasing transmission losses, as the energy is generated locally. According to [1], the technically available resource is estimated, in the worst-case scenario, to be 146 TWh/yr, with an installed capacity of 500 GW. The total installed and planned capacity of wave energy converter (WEC) projects is approximately 1 GW, which is well below the worst-case scenario for the technically available resource. One of the main challenges wave energy exploitation faces, according to [2], is the technology cost, which can vary between 330 € to 630 €/MWh, and is significantly higher compared to the approximately 142 €/MWh for offshore wind. It is, therefore, of crucial importance to reduce the cost of energy. The approach taken in this research paper in order to reduce the cost of wave energy conversion is to increase the production of energy by implementing control methods that aim at maximizing energy at the point that energy is sold. In addition, the increase in power output of a WEC should not affect the cost of production, should include system constraints for rated values, and should be able to be easily applied to devices without the need for significant additional hardware.
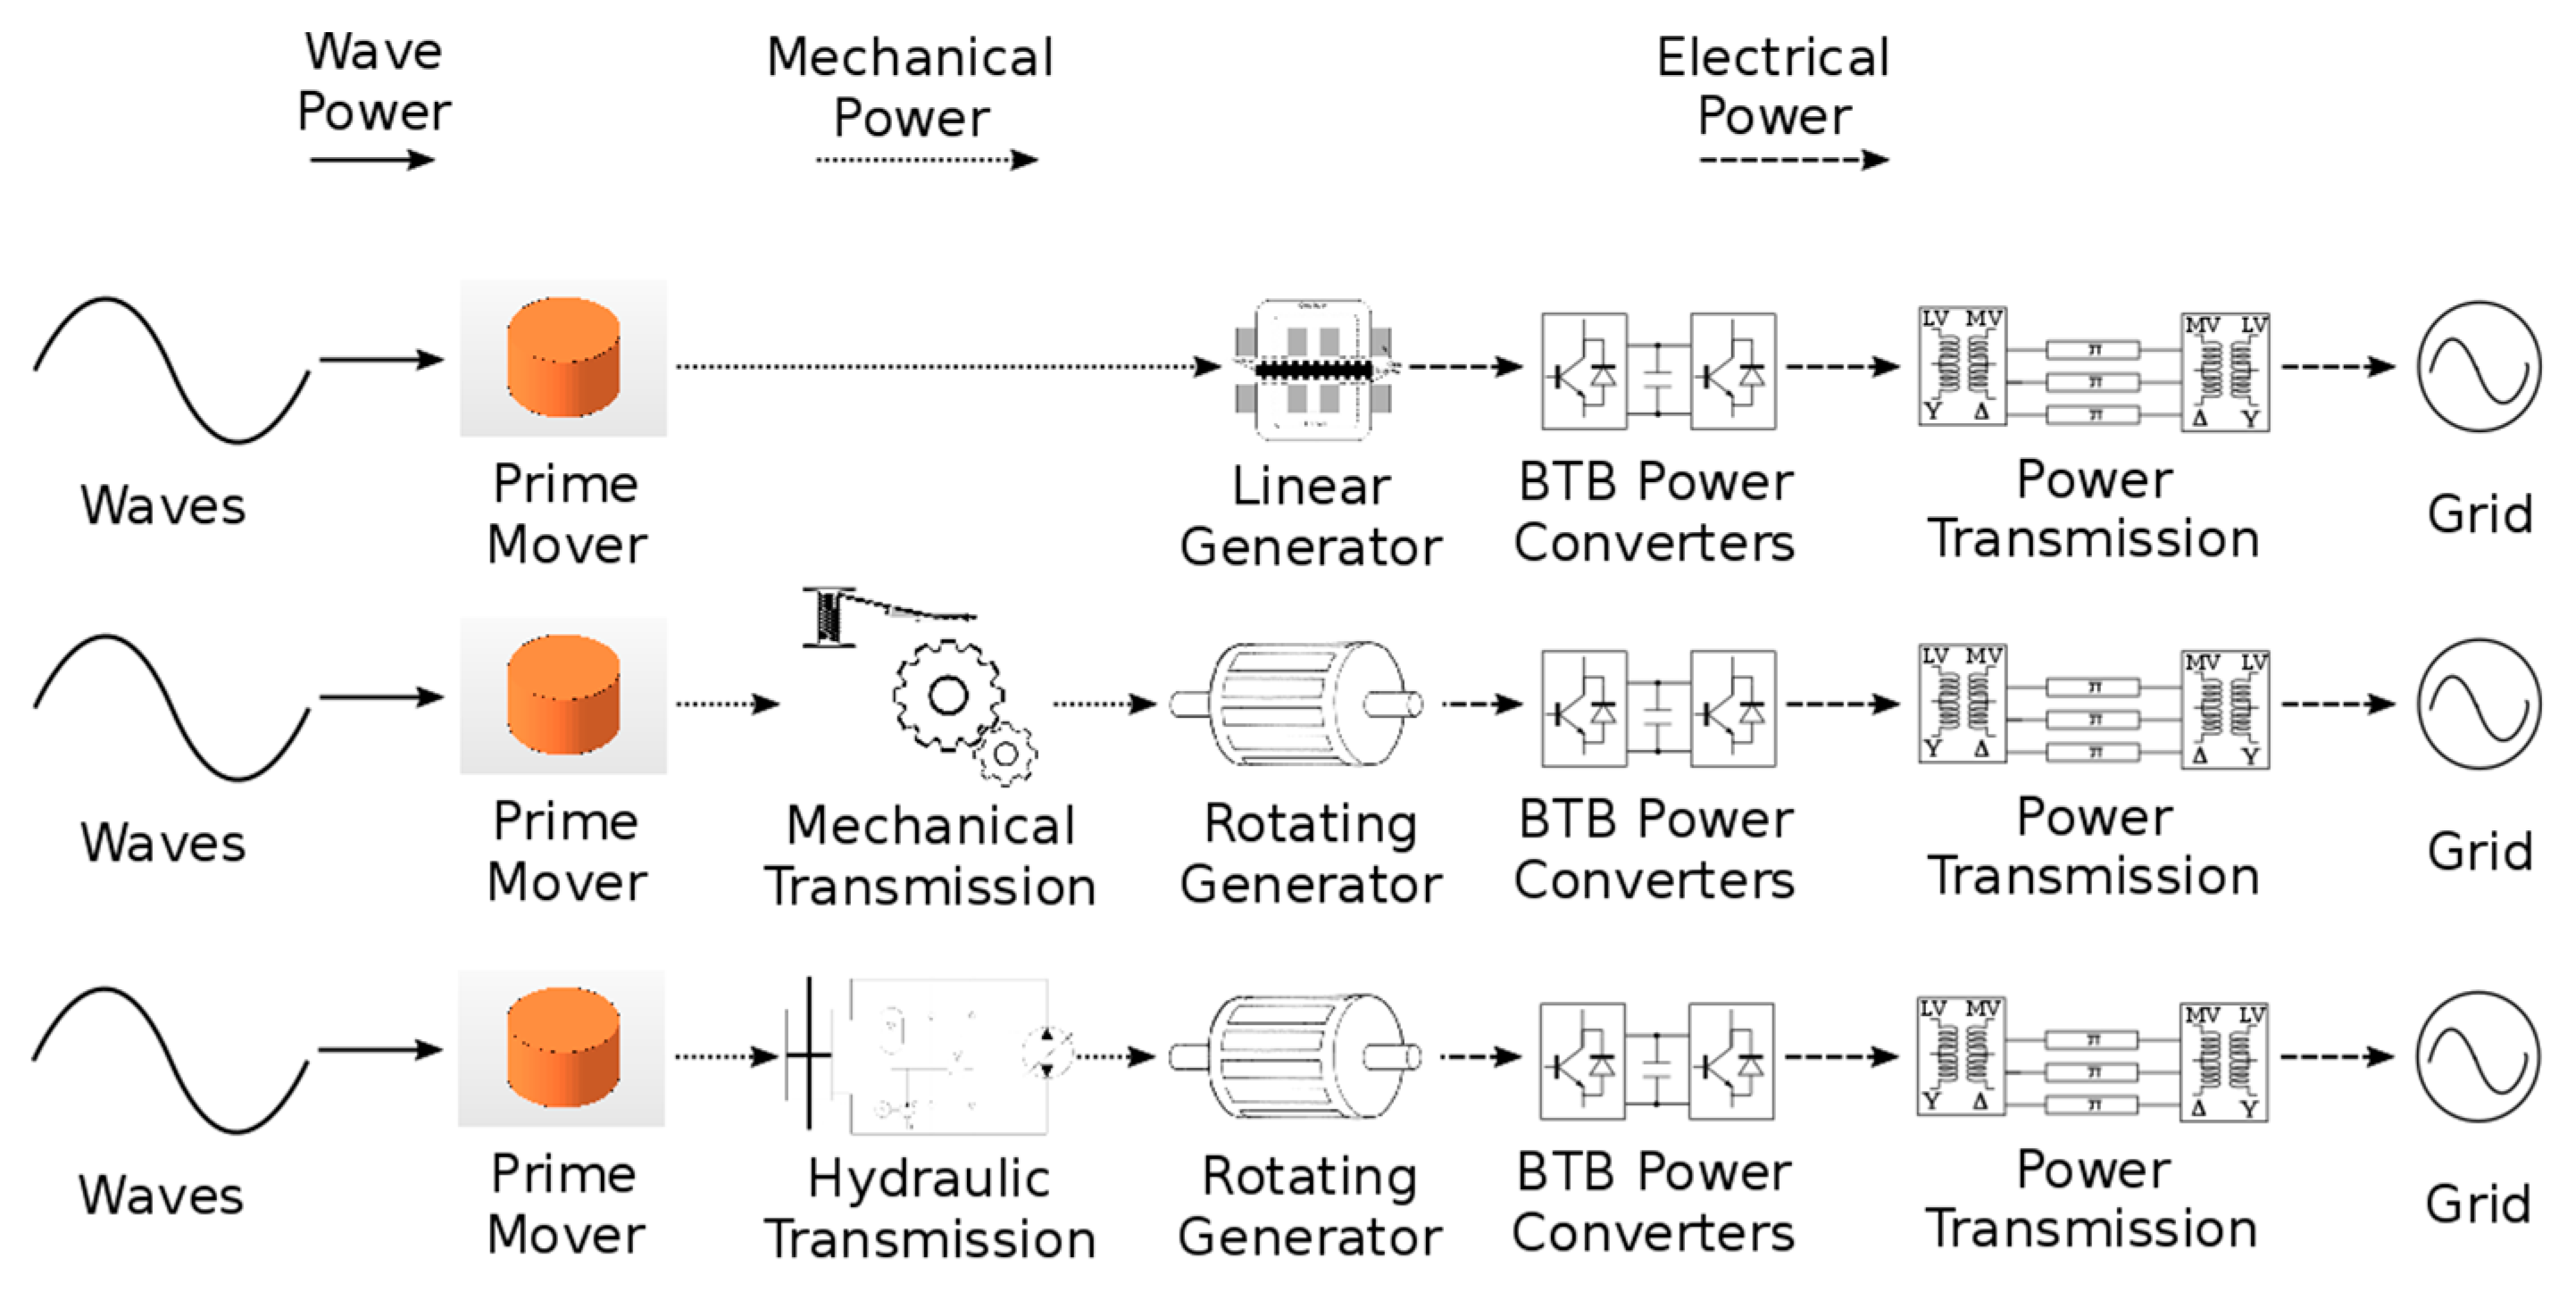
At present, several different WEC designs exist, and these can be categorized based on the way they extract energy from the waves, depth of operation, distance to shoreline and power take-off (PTO) type. In this research paper, the focus is given to modelling single-body point absorber WECs with all-electric PTO. Single-body absorbers are chosen because they are more mature, can be designed more easily to suit a specific sea state, and a large number of demonstration projects have been implemented [3]. The use of an all-electric PTO is crucial for the final goal of this research. By using an all-electric PTO with a direct drive (DD) permanent magnet linear generator (PMLG), the conversion stages between wave energy and electrical energy are minimized, which gives the opportunity for higher conversion efficiencies [4,5]. In addition to PMLG, linear switched reluctance generators can also be used, as presented in [6]. The use of hydraulic PTO systems is quite common in WECs, but they introduce a hydraulic transmission interface between the prime mover and the electrical generator. The hydraulic transmission may operate at constant or variable pressure, using low- and high-pressure accumulators [7,8]. Another common approach is to use similar components to those used in the wind and tidal energy industry, such as high-speed electrical generators, permanent magnet synchronous, or induction with a gearbox. The disadvantage of this method, for wave energy, is that an additional component is required, usually a winch, to convert the linear motion of the waves to rotational motion. The winch cylinder can be attached to a gearbox to multiply the speed to appropriate levels for the high speed generator [9,10,11]. Figure 1 summarizes the conversion stages for the different cases above and shows the inherent advantage of using an all-electric approach for the efficiency of the WEC. Even though the DD All-Electric approach is preferred in this research, the control strategies developed for power maximization can be applied to all types of PTOs with some modifications.
Many research papers and groups are focused on maximizing the wave energy captured by the WECs. The majority of previous research has been focused on maximizing the capture of wave energy from the prime mover and its conversion to mechanical energy. This research is summarized in [12] for several different designs, and an in-depth explanation is given of the process of maximizing the power captured by the prime mover and states the importance of machine learning and model predictive control (MPC) in wave energy. In [13], the author proposed several causal sub-optimal reactive controllers in order to maximize the power captured from the waves without the need for measuring the frequency of the incoming waves. Similar research presented in [14] investigated an optimum reactive controller for DD WEC with PMLG when the wave frequencies are measured. The authors in [15] tried to eliminate the need for advance knowledge of the wave frequency by implementing several frequency estimation methods. Reactive control for maximizing wave energy capture was also the main focus in [16] for phase control. The authors in [16] also tested their phase controller in an experimental setup by emulating the WEC through a motor. MPC has been the focus of many researchers for optimizing the hydrodynamic efficiency of the WEC. Their use was recently summarized in [17]. However, due to the complexity of the MPC controller, uncertainty over its stability and, most importantly, the high computational needs for their improved performance, researchers have also considered simpler approaches with similar characteristics. The controller proposed in [18] aims at replacing an MPC with filters and transfer functions, which are less computationally intensive to run in real time. The results suggest that the performance of such a controller may be sub-optimal, but with only small differences when compared to an MPC. Another control strategy was presented in [10], and explored the option of linking the power factor of the generator to the load with the aim of highest possible average power with the least peak power generated. In this paper, the reactive power controllers developed in [13] will be presented theoretically and designed for a specific test case.
An aspect of crucial importance in WEC modelling and control is the use of constraints. Several constraints can be set, such as peak phase voltage, peak phase current, peak electrical power output from the generator, maximum velocity and displacement of the translator. The authors in [19] set out some of the electrical requirements in modelling a WEC. They present a novel flux weakening control method for PMGs in order to limit the peak power output to the rated value. The flux weakening method for power limitation, along with constraints set to an MPC for maximum force input, is discussed in [7]. In this paper, a different approach will be taken to limit the power of the generator by applying a mechanical brake. The power limitation constraint is considered in the optimization process and the use of the mechanical brake is minimized. The maximum velocity can monitored by manipulating the PTO force and the maximum displacement is ensured by having an end-stop which provides an increasing opposing force to the translator of the PMLG [13,20]. However, the use of the end-stop for limiting the displacement should only be considered as a back-up, due to the slamming forces that may be applied by the end-stop system to the translator. The controller of the electrical generator should be able to constrain the displacement of the translator, as was presented in [18].
The aim of this paper is to present a comprehensive method for optimizing a wave-to-wire WEC controller in order to maximize the average power delivered to the connection point. For this purpose, existing controllers were tested and optimized but also a novel velocity-based controller was developed. This differs significantly from maximizing the power capture from the waves. This is due to the fact that, in order to maximize hydrodynamic power, the velocity of the translator must be in phase with the excitation force with an appropriate amplitude. In an irregular sea state, this process may consume significant power to move the translator and therefore limiting the average electrical power produced despite the increased hydrodynamic efficiency. Wave-to-wire optimization can also be realized by observing Figure 1. The efficiencies of all the conversion stages between the waves and the grid have to be taken into account in order to achieve maximum electrical output at the grid terminals. This is the point at which the modelling of a non-ideal PTO is crucial. The effect of a non-ideal PTO has been studied in several hydraulic-based WEC systems. In [21], the authors showed that a two-body point absorber WEC can have higher efficiencies compared to a single-body WEC when a non-ideal PTO system is considered. Their approach was based on mathematical modelling and estimated PTO efficiencies for several different PTO damping and stiffness coefficients as well as different body sizes. A similar approach was used in [22] for single-body WEC but the estimated efficiencies assumed a grid connection. In [23], the hydraulic-based WEC system was implemented in a laboratory setup and showed that in all cases an optimally designed reactive controller is beneficial even if the PTO efficiency is as low as 60%. The researchers in [24] thoroughly reviewed wave-to-wire control strategies and stated the importance of having coupled hydrodynamic, mechanical and electrical systems in order to accurately model the operation of WEC systems. The researchers in [7] and [25] developed a high-fidelity wave-to-wire WEC system using a hydraulic PTO, and validated the electrical generator and the control structure. In [26], the MPC is implemented in order to maximize the electrical power output of the generator for a DD system with electrical PTO. The authors defined different stage efficiencies, which helped them perform a cost estimation of the WEC under different cases. Finally, the researchers in [27] presented a novel hill-climbing control method for maximizing the electrical power output.
To achieve the aim of maximizing the power at the point of grid connection, a detailed wave-to-wire single-body point absorber WEC system was developed using multibody physical modelling. Using multibody physical modelling is a novel aspect compared to the above-mentioned literature, because all of the different conversion stages are considered to be non-ideal, including the hydrodynamics, the PTO and the electrical part with the grid connection. The hydrodynamic, mechanical and electrical modelling process is discussed in Section 2. Section 3 presents the controller considered in this research and the subsequent optimization process for power maximization at the grid connection. In addition, Section 3 presents in detail the velocity-based controller developed specifically for the wave-to-wire power maximization, which was based on the research presented in [28]. Section 4 presents the implementation of the methodology of Section 2 and Section 3 using a realistic test case based on the waters of China. Finally, Section 5 summarizes the contributions of this research paper.

2. Modelling an All-Electric Wave Energy Converter

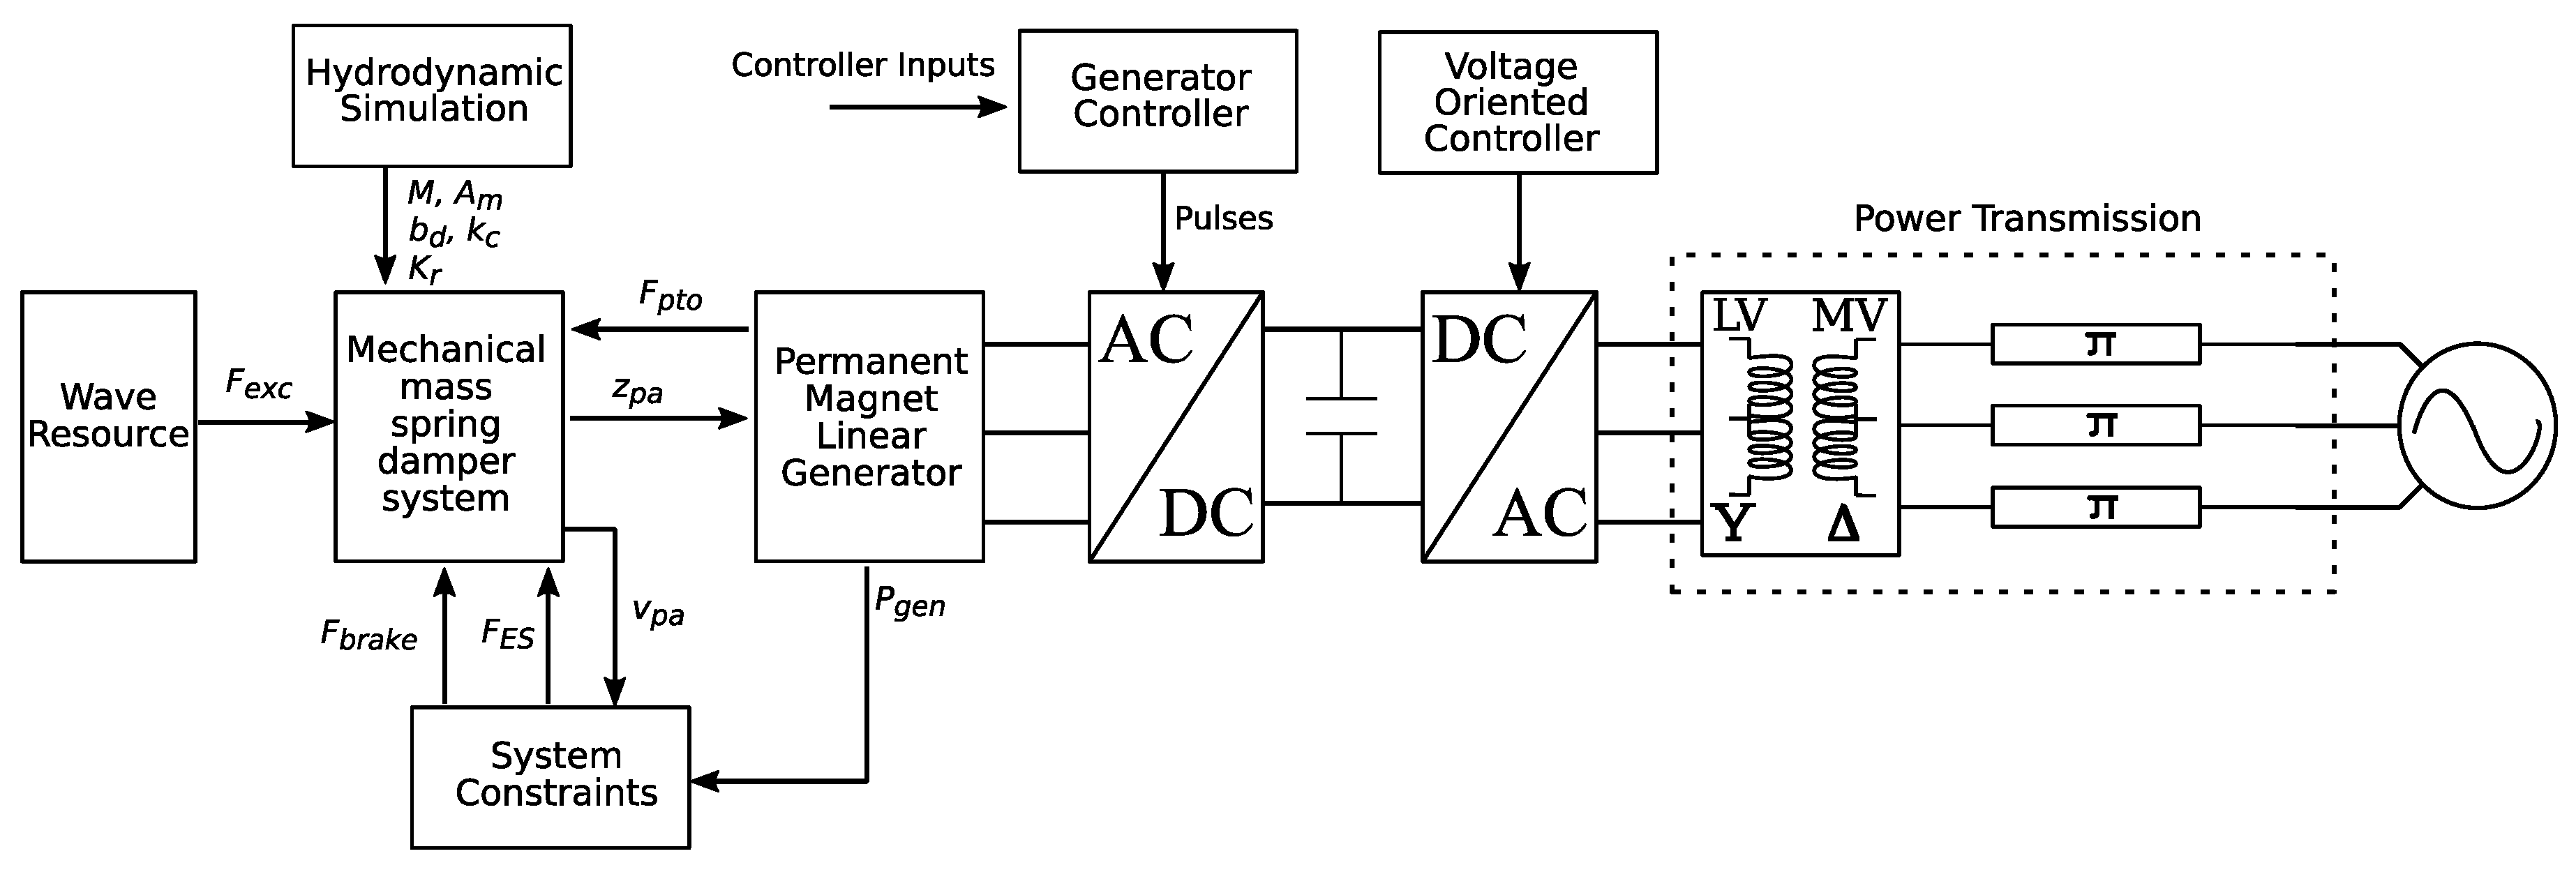
The all-electric wave-to-wire WEC model developed for the purposes of this research can be seen in Figure 2. The wave resource model generates a wave excitation force (Fexc), which is used as an input to the mechanical model of the point absorber (pa). The hydrodynamic parameters of the point absorber are generated by NEMOH, a Boundary Element Methods code dedicated to the computation of first order wave loads on offshore structures developed by researchers at Ecole Centrale de Nantes in France. The electrical generator model uses the displacement of the point absorber to generate the PTO force (Fpto), which is fed back to the mechanical model. The voltage at the generator terminals is controlled by a voltage source converter (VSC) using a generator controller strategy. The generator control strategies will be discussed in detail in Section 3. On the grid side, the inverter is controlled by the Voltage Oriented Controller (VOC). In this study, power transmission components have also been included prior to grid connection.

2.1. Hydrodynamic Simulation

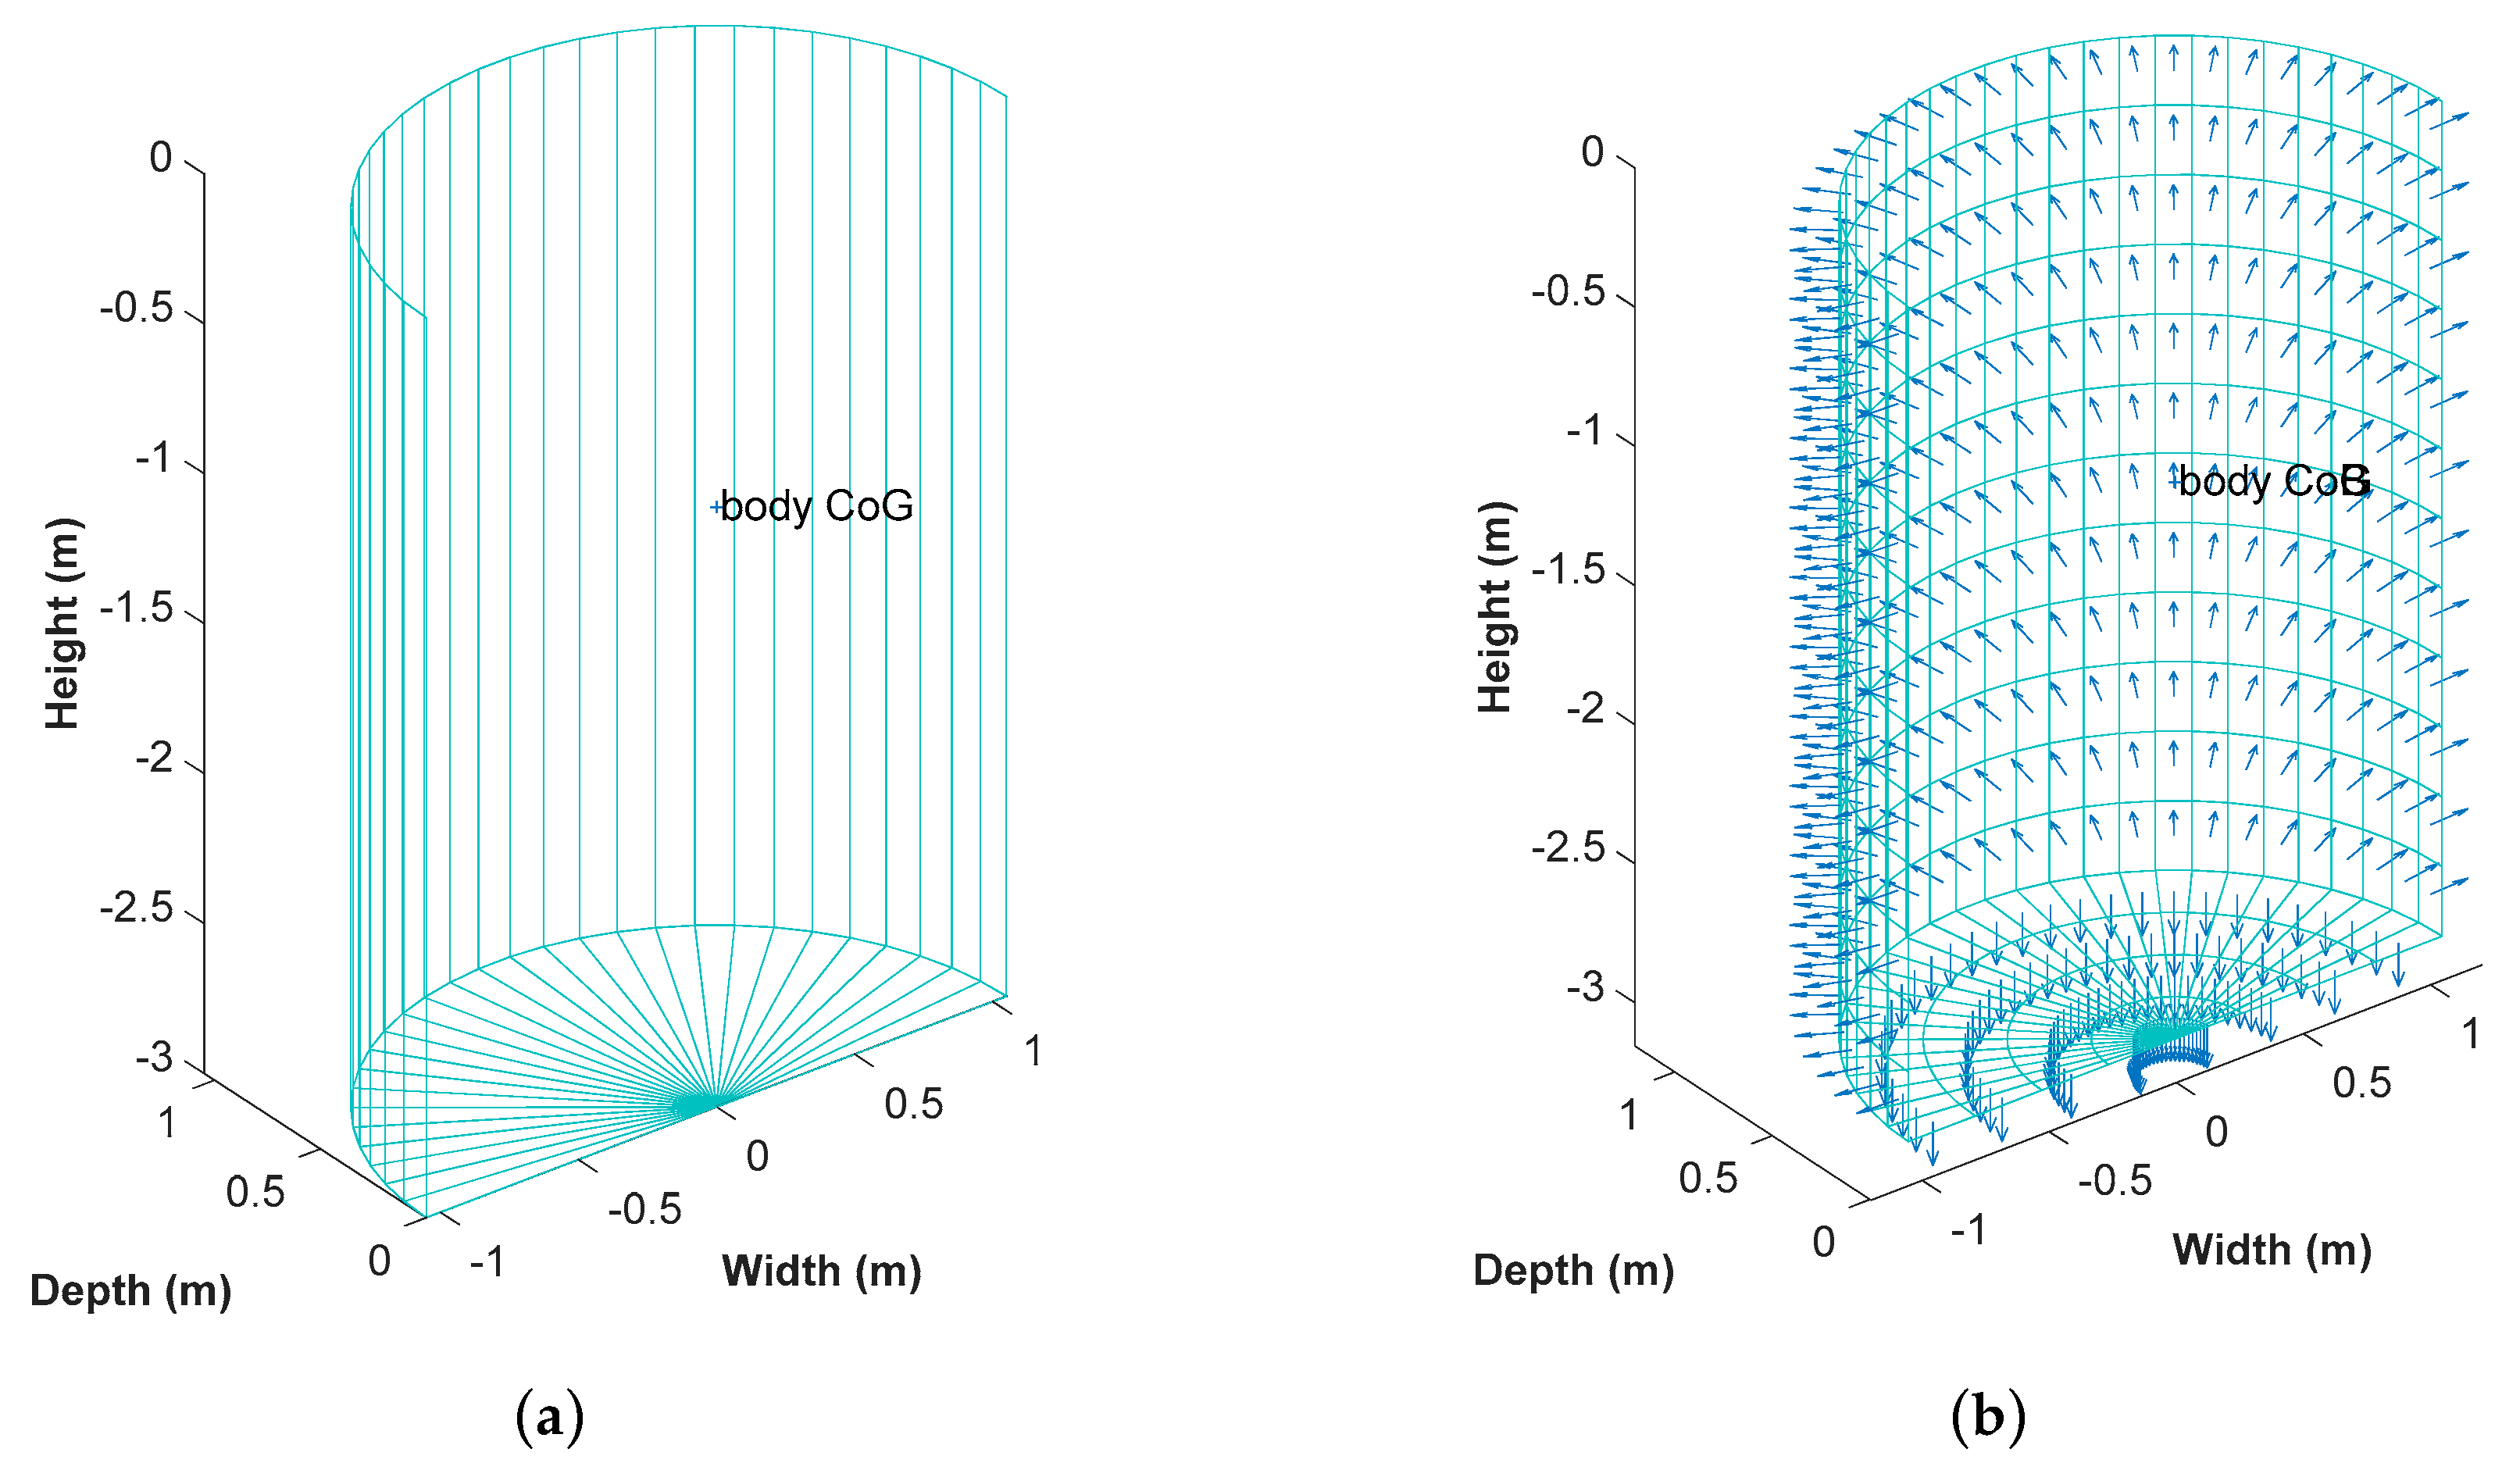
The hydrodynamic simulation of the point absorber was performed by the Edinburgh Wave Systems Simulation Toolbox (EWST) [29], which uses NEMOH and can also generate a refined mesh for simple structures appropriate for hydrodynamic simulation. Figure 3 shows the design and refined mesh of a cylinder generated by EWST which will be used as a point absorber. The radius of the cylinder is 1.05 m and the draft is 3 m. The total height of the cylinder is 4 m.
The hydrodynamic simulation is performed for a wide range of wave frequencies and produces several outputs from which the mass (M), added mass (Am), linear restoring coefficient or stiffness (kc), linear damping (bd) and the radiation force (Frad) are used in the point absorber model to form the mass-spring-damper system. Radiation damping and added mass as a function of the wave frequency input are given in Figure 4. The constant hydrodynamic parameters are given in Table 1. As part of this work, a simple cylinder design was considered as a point absorber. This is due to the fact that the main aim of this research is to demonstrate a control process to maximize wave-to-wire power through the control of the electrical generator. Optimizing the structure of the point absorber was deemed outside the main scope of this study.

2.2. Point Absorber Model and System Constraints

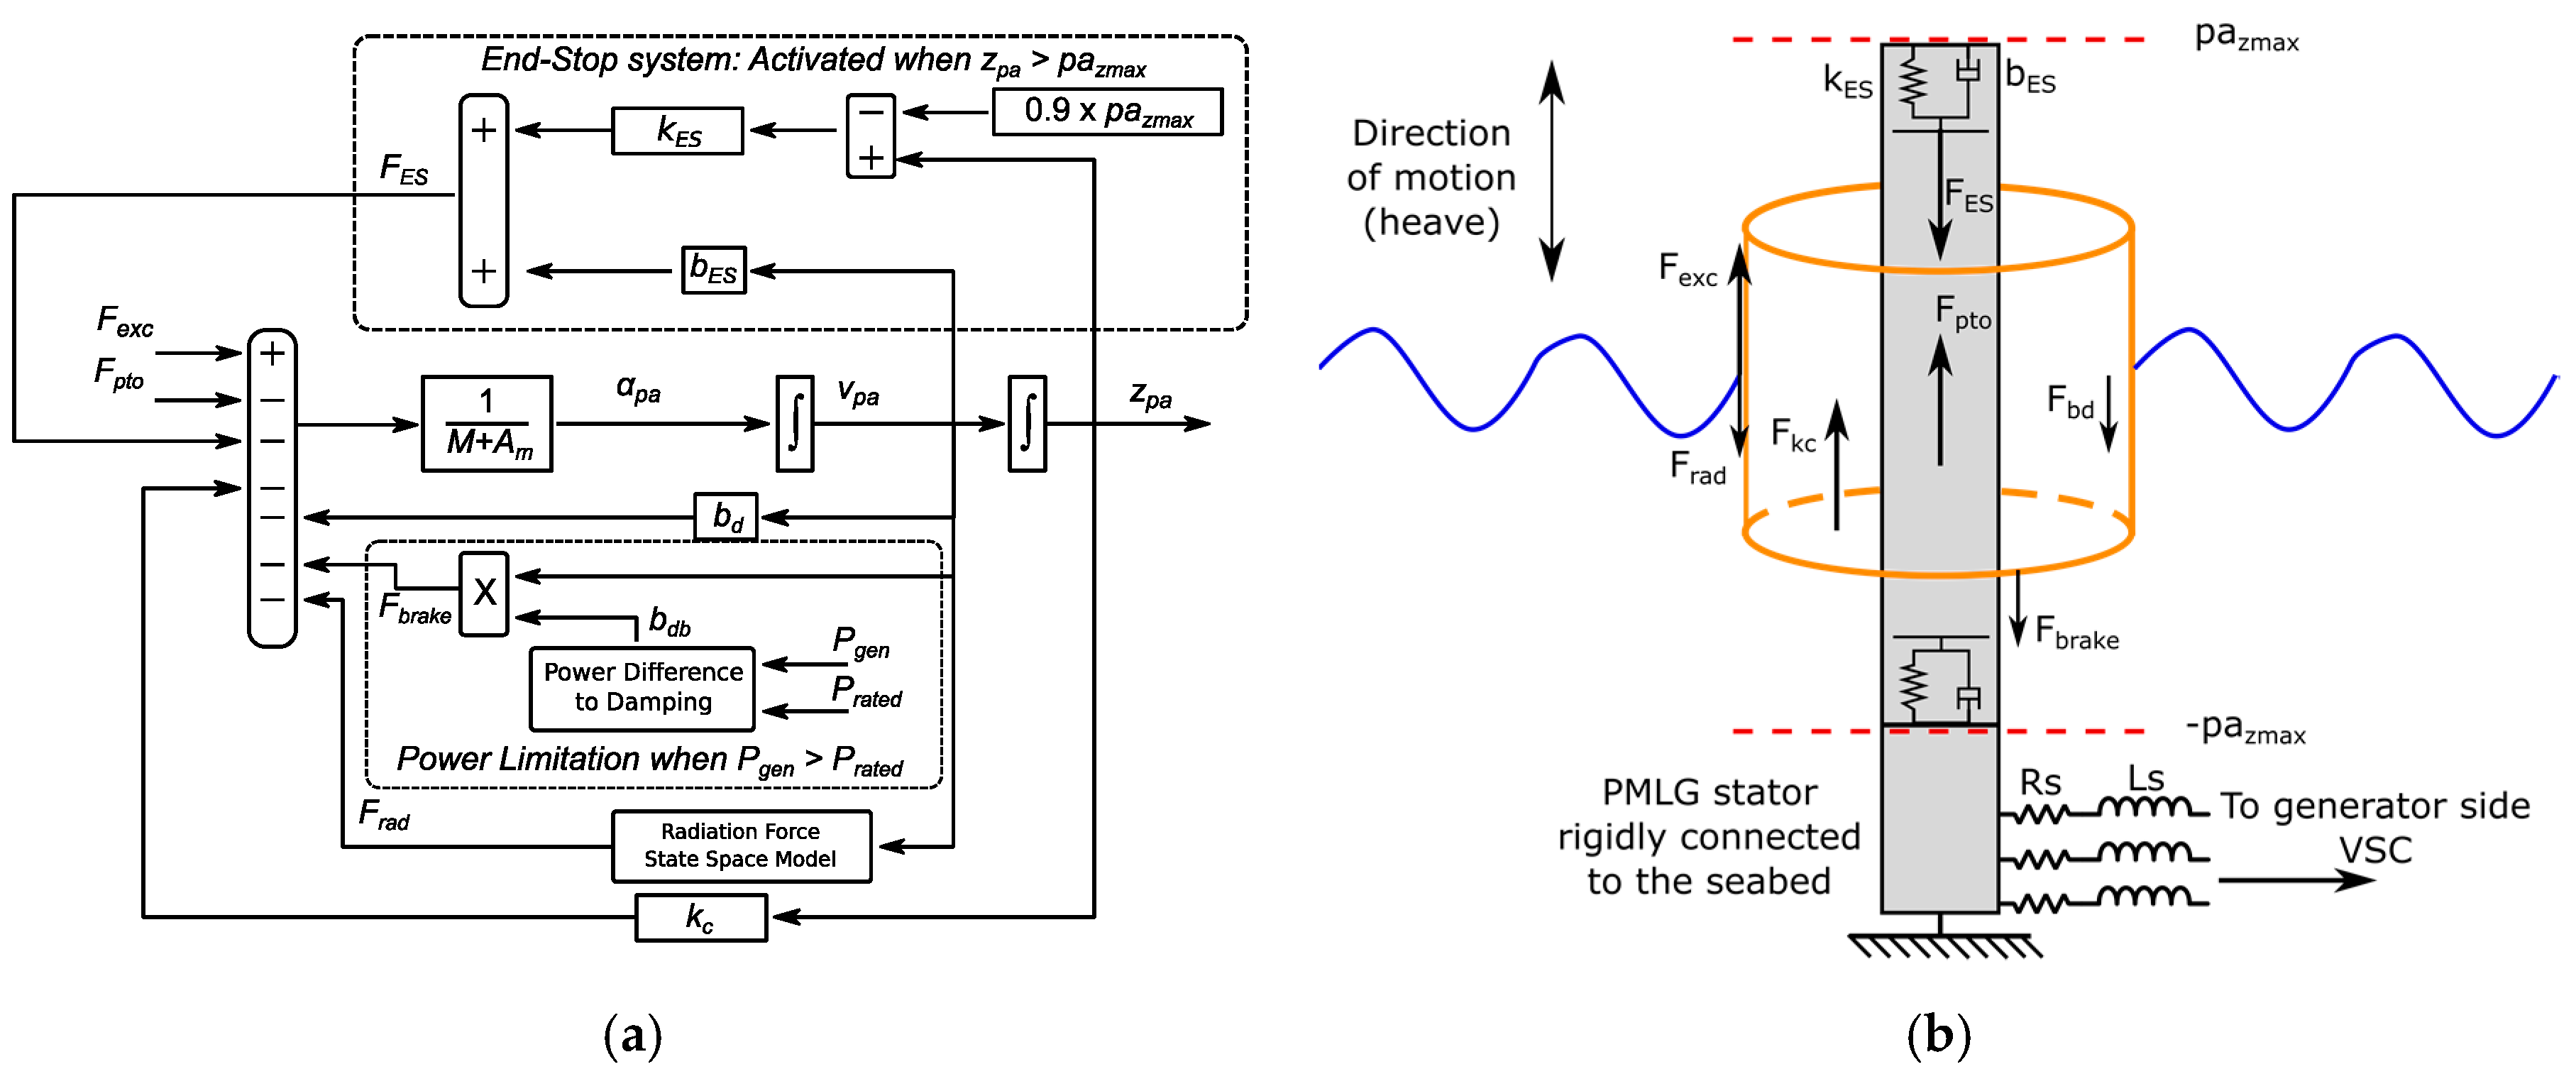
The single-body point absorber model in this paper is represented using a mass-spring-damper system which moves on the heave (z-axis) direction only. It is assumed that the salt water is inviscid and incompressible, and the flow is irrotational. Based on the above assumptions, the interaction between the point absorber model and the incoming waves can be studied using linear wave theory. The time-domain equation of motion of the point absorber is given in Equation (1), and the mechanical system developed in MATLAB/Simulink is given in Figure 5a.
M a p a ( t ) = F e x c ( t ) F p t o ( t ) F r a d ( t ) z p a ( t ) k c v p a ( t ) b d F b r a k e F E S
where αpa is the acceleration and vpa the velocity of the point absorber. Frad is the force as a result of wave radiation and is estimated using a State Space model. The parameters of the State Space model are taken from the hydrodynamic simulation and are based on the convolution integral formulation of the radiation impulse response function (Kr) of the point absorber and is shown in Equation (2).
F r a d ( t ) = 0 t K r ( t τ ) v p a ( τ ) d τ
The added mass (Am), linear damping (bd) and stiffness (kc) are considered constants and their values are given in Table 1, along with point absorber parameters. Linear damping generates a linear damping force (Fbd) and stiffness generates a buoyancy force (Fkc). The Fexc is generated by the wave resource model, and the Fpto is generated by the PMLG, which is discussed in detail in Section 2.3.
Two systems that constrain the operation of the point absorber system have been implemented. The first constraint is the end-stop (subscript ES) system, which limits the displacement (zpa) to its maximum value (pazmax). The ES system operates only when the zpa has reached 90% of the pazmax, and generates the end-stop force (FES), which slows down the translator. The FES is generated by taking into account that the end-stop spring has a damping coefficient (bES) and a stiffness coefficient (kES). The values for the end-stop system are given in Table 1. The second constraint implemented is the electrical power limitation mechanism. In order to avoid overrated devices, keep the cost of the device low, and avoid excessive peaks of current that could cause damage to the WEC, a power limitation mechanism is essential. In this research paper, the power limitation mechanism is based on a simple braking force (Fbrake) that is generated when the instantaneous electrical power generated from the PMLG (Pgen) is larger than the rated power of the device (Prated). The power difference is converted to a damping coefficient (bdb), which can be implemented in reality by using standard brakes. The conversion of the power difference to bdb can be modelled either with a linear relationship or with a proportional-integral (PI) controller. For this study, using a power limitation mechanism is of crucial importance. To maximize the electrical power delivered to the grid, it should to be taken into account that sudden peaks in wave power may have to be limited, and therefore will not result in an increase in electrical generation. It has to be noted that even though the optimized controllers developed in this research paper take into account the power limitation for power production the same does not apply for the displacement constraint. Further development of the system will focus on making the controllers aware of the displacement constraint and avoid the end-stop system slamming forces. The PMLG and the parameters of the electrical generator are discussed in Section 2.3 and shown in Table 2, respectively.

2.3. The Permanent Magnet Linear Generator

The PMLG model receives as input the displacement from the point absorber model and produces the Fpto, which is used in the mechanical mass-spring-damper system. The PMLG is modelled using Equations (3)–(5) [28,30]:
{ E M F a = N t π τ p Φ sin ( π τ p z ) d z d t E M F b = N t π τ p Φ sin ( π τ p z 2 π 3 ) d z d t E M F c = N t π τ p Φ sin ( π τ p z 4 π 3 ) d z d t
F p t o = 3 2 π τ p Φ N t I cos φ
{ i a = I sin ( π τ p z + φ ) i b = I sin ( π τ p z 2 π 3 + φ ) i c = I sin ( π τ p z 4 π 3 + φ )  
The EMF of the generator is produced by implementing (3). Nt is the number of turns around a tooth, Φ is the flux in the tooth and τp is the pole pitch. As shown in (3), the EMF of the PMLG is a function of the displacement of the translator, which is taken from the point absorber model discussed in Section 2.2. The EMF is transferred to the SimPowerSystems physical modelling environment, and the voltage at the terminals of the PMLG is acquired by taking into account the stator resistance (Rs) and inductance (Ls). The Fpto can be calculated using Equation (4), where I is the peak current and the current leads the EMF with an angle φ. The generation of the three-phase currents is given in Equation (5) and is a function of displacement.
The voltage at the PMLG terminals is controlled through the generator-side VSC, which operates based on a control strategy. Several control strategies have been discussed in this paper in Section 1. The main aim of this paper is to study and explore generator-side control strategies that will aim to maximize electrical power at the point of grid connection. This process is shown in detail in Section 3. In Section 2.4, the modelling and design of the grid-side power converter controller (Voltage Oriented Controller) is presented, and this ensures power transfer to the grid side. Finally, Section 2.4 also gives the details of the power transmission system for a single WEC.

2.4. Voltage Oriented Controller and Power Transmission

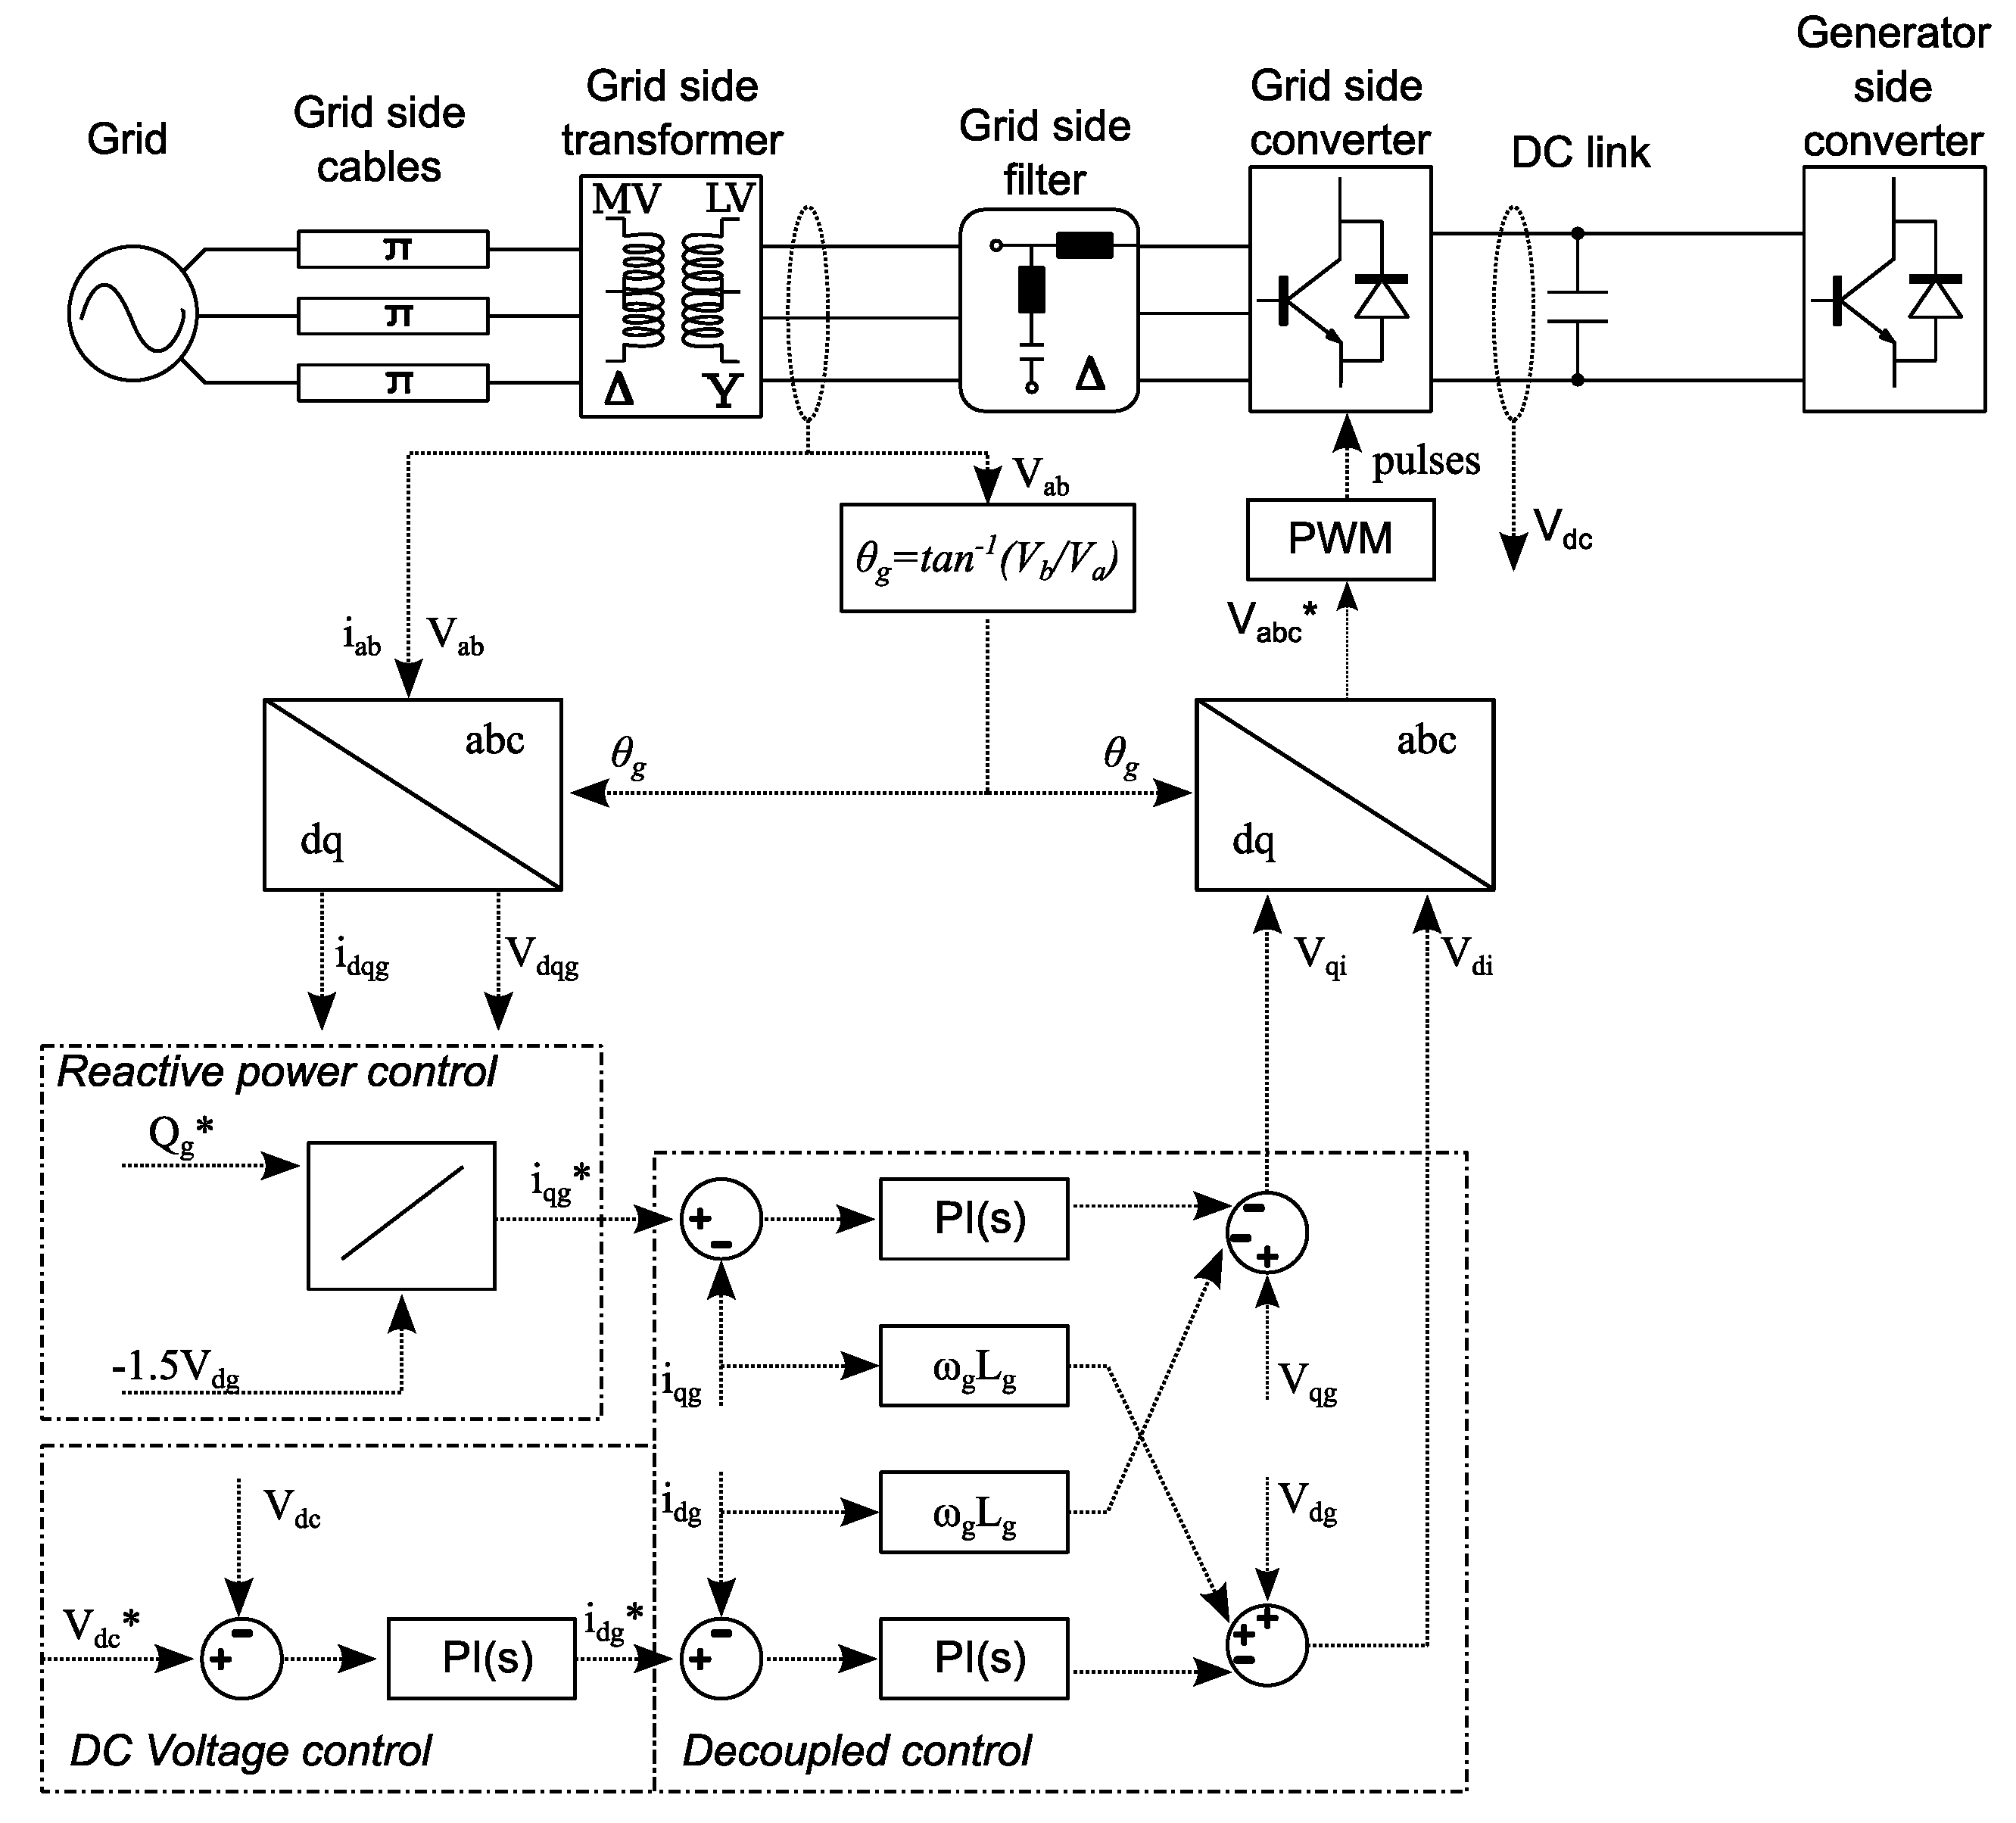
The power generated by the WEC is delivered to the power transmission system using Back-to-Back (BTB) power converters. The grid-side VSC of the BTB power converters is connected to the grid through several components; a line reactor to reduce line current distortion, a filter that reduces harmonics and a step-up transformer from 400 V to 11 kV. The inverter is controlled by a PWM scheme called voltage oriented control (VOC) with decoupled controllers, which maintains a constant DC link voltage, constant frequency output of 50 Hz on the AC side and control over the amount of reactive power flowing based on grid requirements. The switching frequency of the PWM scheme is set at 2.5 kHz. The VOC scheme is based on the time-domain equations given in (6) [31].
{ V d i ( t ) = [ K P I ( i d g i d g ) + K I I ( i d g i d g ) d t ] + ω g L g i q g + V d g V q i ( t ) = [ K P I ( i q g i q g ) + K I I ( i q g i q g ) d t ] ω g L g i d g + V q g
where ω g is the angular frequency of the grid, L g is the line inductance between the VSC and the point of measurement, i d g and i q g are the dq-axis currents at the point of measurement,   i d g and i q g are the dq-axis reference currents, V d g and V q g are the dq-axis voltages at the point of measurement. K P I and K I I are the “Decoupled Control” proportional and integral gains of the PI controller. V d i and V q i are the reference voltages in the dq-axis frame which control the grid-side VSC. V d i and V q i are converted to three-phase reference voltages Vabc* with the inverse park transformation by using the angle at the point of measurement θg. Figure 6 depicts the block diagram of the VOC scheme as it was implemented in MATLAB/Simulink.
The different parts of the VOC scheme can be seen in Figure 6. Three distinct sub-blocks can be identified in the VOC scheme. The “Reactive power control” takes as input the potential reactive power requirements from the grid side in order to produce the appropriate q-axis reference current. In the VOC scheme, the q-axis current controls the flow of reactive power to and from the VSC and d-axis current controls the flow of active power. Therefore, by changing the i q g , the reactive power flow can be controlled directly. For the purposes of this research, it is assumed that there is no need for the VSC to generate any reactive power, and therefore i q g = 0 . The “DC Voltage control” ensures that the DC link voltage is kept constant at 800 V. To do that, the PI controller in the “DC Voltage control” has to produce an appropriate i d g , which will ensure that the active power flowing from the generator side will be transferred to the grid side. Finally, the “Decoupled control” compares reference and actually measured currents to produce the reference voltages. The parameters of the BTB power converters and VOC scheme are given in Table 3.
The power transmission system is composed of a step-up transformer to increase the voltage from 400 V to 11 kV, as well as three-phase cables that are directly connected to an 11 kV strong grid. The three-phase cables are modelled as a network of π-sections. One section per km of cable length was chosen in order to represent the harmonic resonance. The parameters of the power transmission system are given in Table 4.

3. Control Strategies for Wave-to-Wire Power Maximization

The main aim of this research paper is to present ways of maximizing the power delivered to the grid through appropriate generator-side control. As shown in Section 1, a lot of focus has been given to maximizing the hydrodynamic power captured by a WEC. However, this is not always the optimum solution for power generation, since reactive power is needed when maximizing hydrodynamic power. This means that the generator-side VSC needs to supply the generator with power, driving it as a motor, in order to bring the velocity of the prime mover in phase with the wave excitation force. Another important aspect for an optimum WEC controller is the availability of measurements and, more specifically, the incoming wave frequency measurement. Due to the difficulty of measuring the frequency of the incoming waves, the need for additional hardware and increased cost, this paper focusses on implementation of control strategies that do not require knowledge of the incoming wave frequency. The generator-side controller for WECs with PMLGs can be separated into two parts:
  • The reference Fpto controller; and
  • The pulse generator for the VSC.
The first part produces an instantaneous reference PTO force (Fpto*), which forces the point absorber model to move based on the requirements of the control strategy. Depending on the control strategy, Fpto* can bring, for example, the point absorber velocity into phase with the excitation force from the waves to maximize hydrodynamic power, or can only control the damping to maximize the power transfer without any phase control. As mentioned in Section 2, the W2W model is based on physical modelling of the mechanical and electrical quantities. This means that the Fpto* generated by the controller is not directly applied to the point absorber model which is a common practice. The Fpto* from the control strategy is used as an input to generate pulses for the generator-side VSC. The pulses that control the generator-side VSC will force the PMLG to produce the appropriate PTO force. The block diagram of the generator-side control strategy and the pulse generator are depicted in Figure 7. The pulse generator for the generator-side VSC is based on the zero d-axis current (ZDC) controller for PMLG.
The ZDC controller requires as inputs Fpto*, zpa, the reference d-axis current (ids*), and the measured three-phase current at the terminals of the PMLG (iabc). As shown in Figure 7b, the displacement is converted to electrical angle, and the Fpto* is converted to reference q-axis current (iqs*). Reference currents, ids* and iqs*, are compared to actually measured currents to produce errors. The current errors are fed to PI controllers to generate the appropriate reference voltage signals Vq* and Vd* to minimize the current error. The reference voltages are used as input to a PWM scheme for pulse generation for the generator-side VSC.
Regarding Figure 7a, the point absorber constant properties and instantaneous quantities depend on the specific reference PTO force control strategy and includes the properties given in Table 1 and instantaneous values of measured displacement, velocity and acceleration of the point absorber. In this section, three different types of reference Fpto controllers will be presented theoretically and tested for their ability to deliver maximum power to the grid. These control strategies are the real damping, reactive spring-damping and velocity controller. For all three different reference Fpto controllers the ZDC controller remains the same as a pulse generator for the generator-side VSC.

3.1. Real Damping Controller

The Real Damping Controller (RdC) is one of the most common reaction force control methods. The RdC only provides damping PTO force, which affects the amplitude of the velocity, but not the phase of the velocity. By providing damping PTO force, only real power is produced. The main advantage of this control method is that it is simple and easy to implement. In this research paper, it is implemented based on [13] by assuming that the PTO impedance only has a real part. The impedance matching ensures maximum power transfer from the waves to the mechanical mass-spring damper system. The reference PTO force generator for the RdC can be described using Equation (7).
F p t o R d C = v p a × b 2 ( ω p ) + ( ω p [ M + A m ( ω p ) ] k c / ω p ) 2
where F p t o R d C is the reference PTO force from the RdC method, b ( ω p ) is the total damping (radiation and linear) at the wave frequency peak energy in a specific wave climate. Using a variable wave frequency ωp to calculate the damping and added mass coefficients would lead to improved wave energy capture, but this would require continuous frequency measurements of the incoming waves. Using a single frequency value at which most energy exists for a specific wave climate will allow most of the wave energy for this specific climate to be efficiently converted to mechanical energy, but less energy will be converted overall compared to the use of a variable wave frequency. Simulation results of the W2W WEC system developed using the RdC method are given in Figure 8.
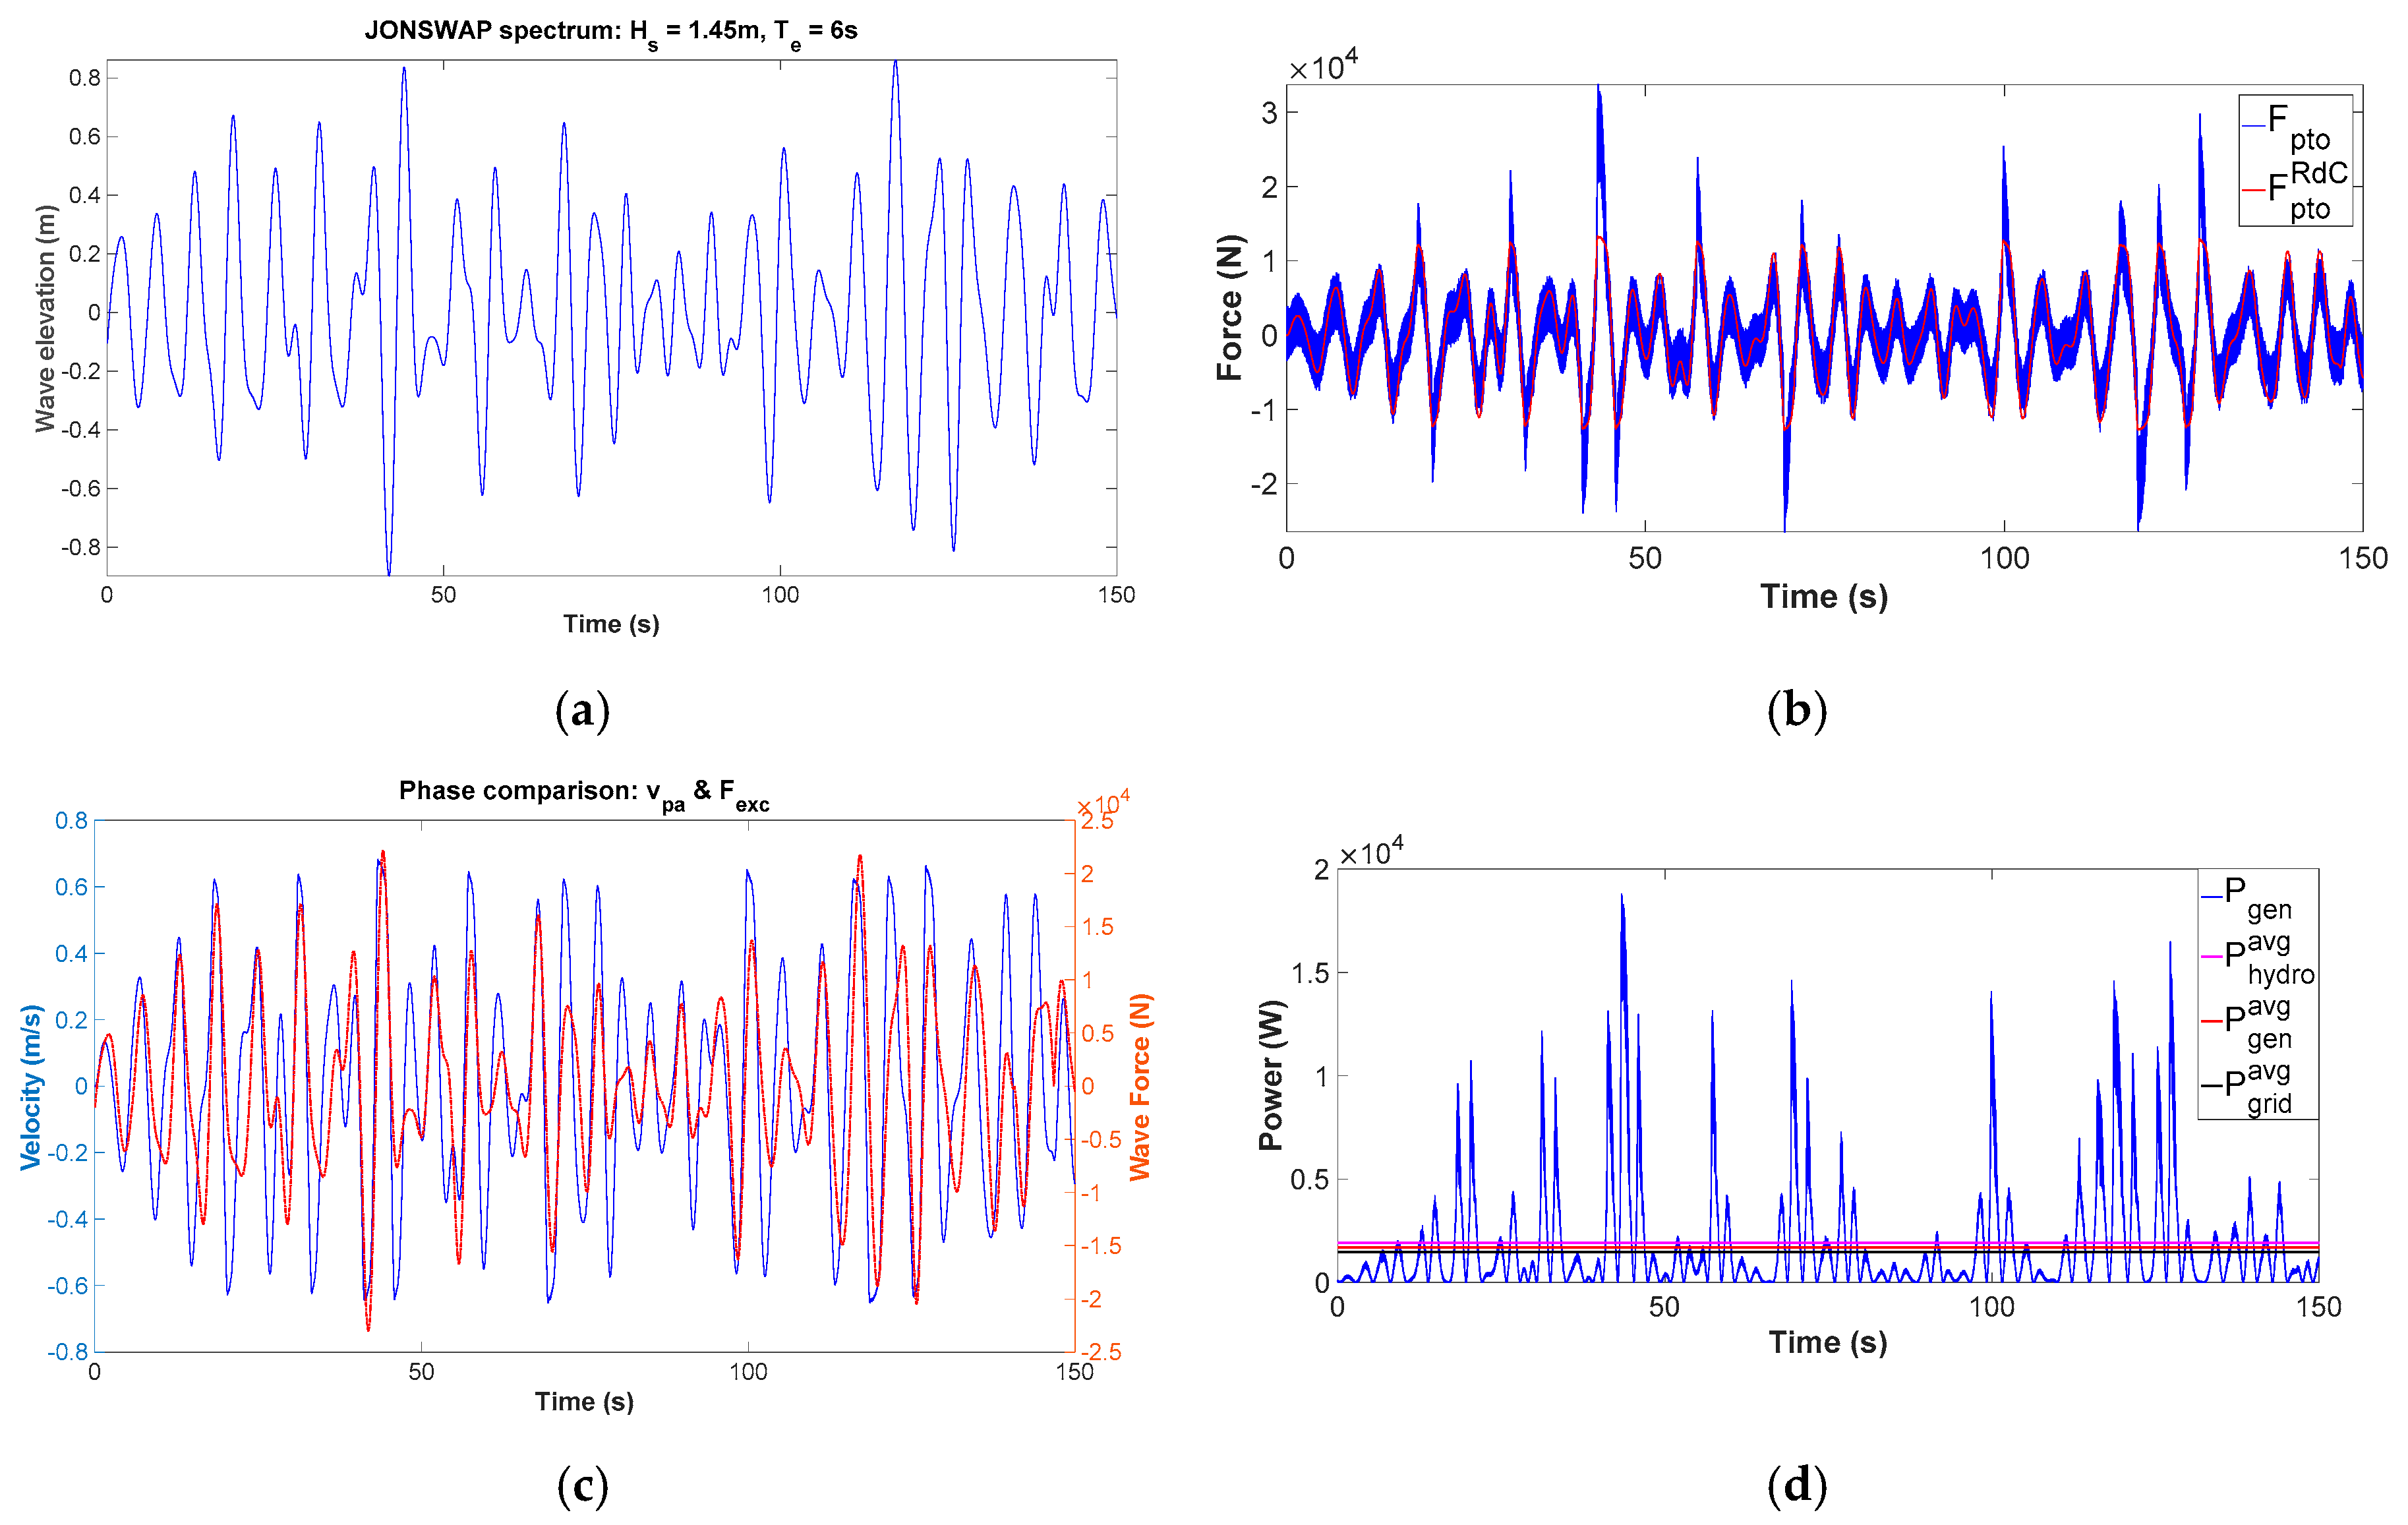
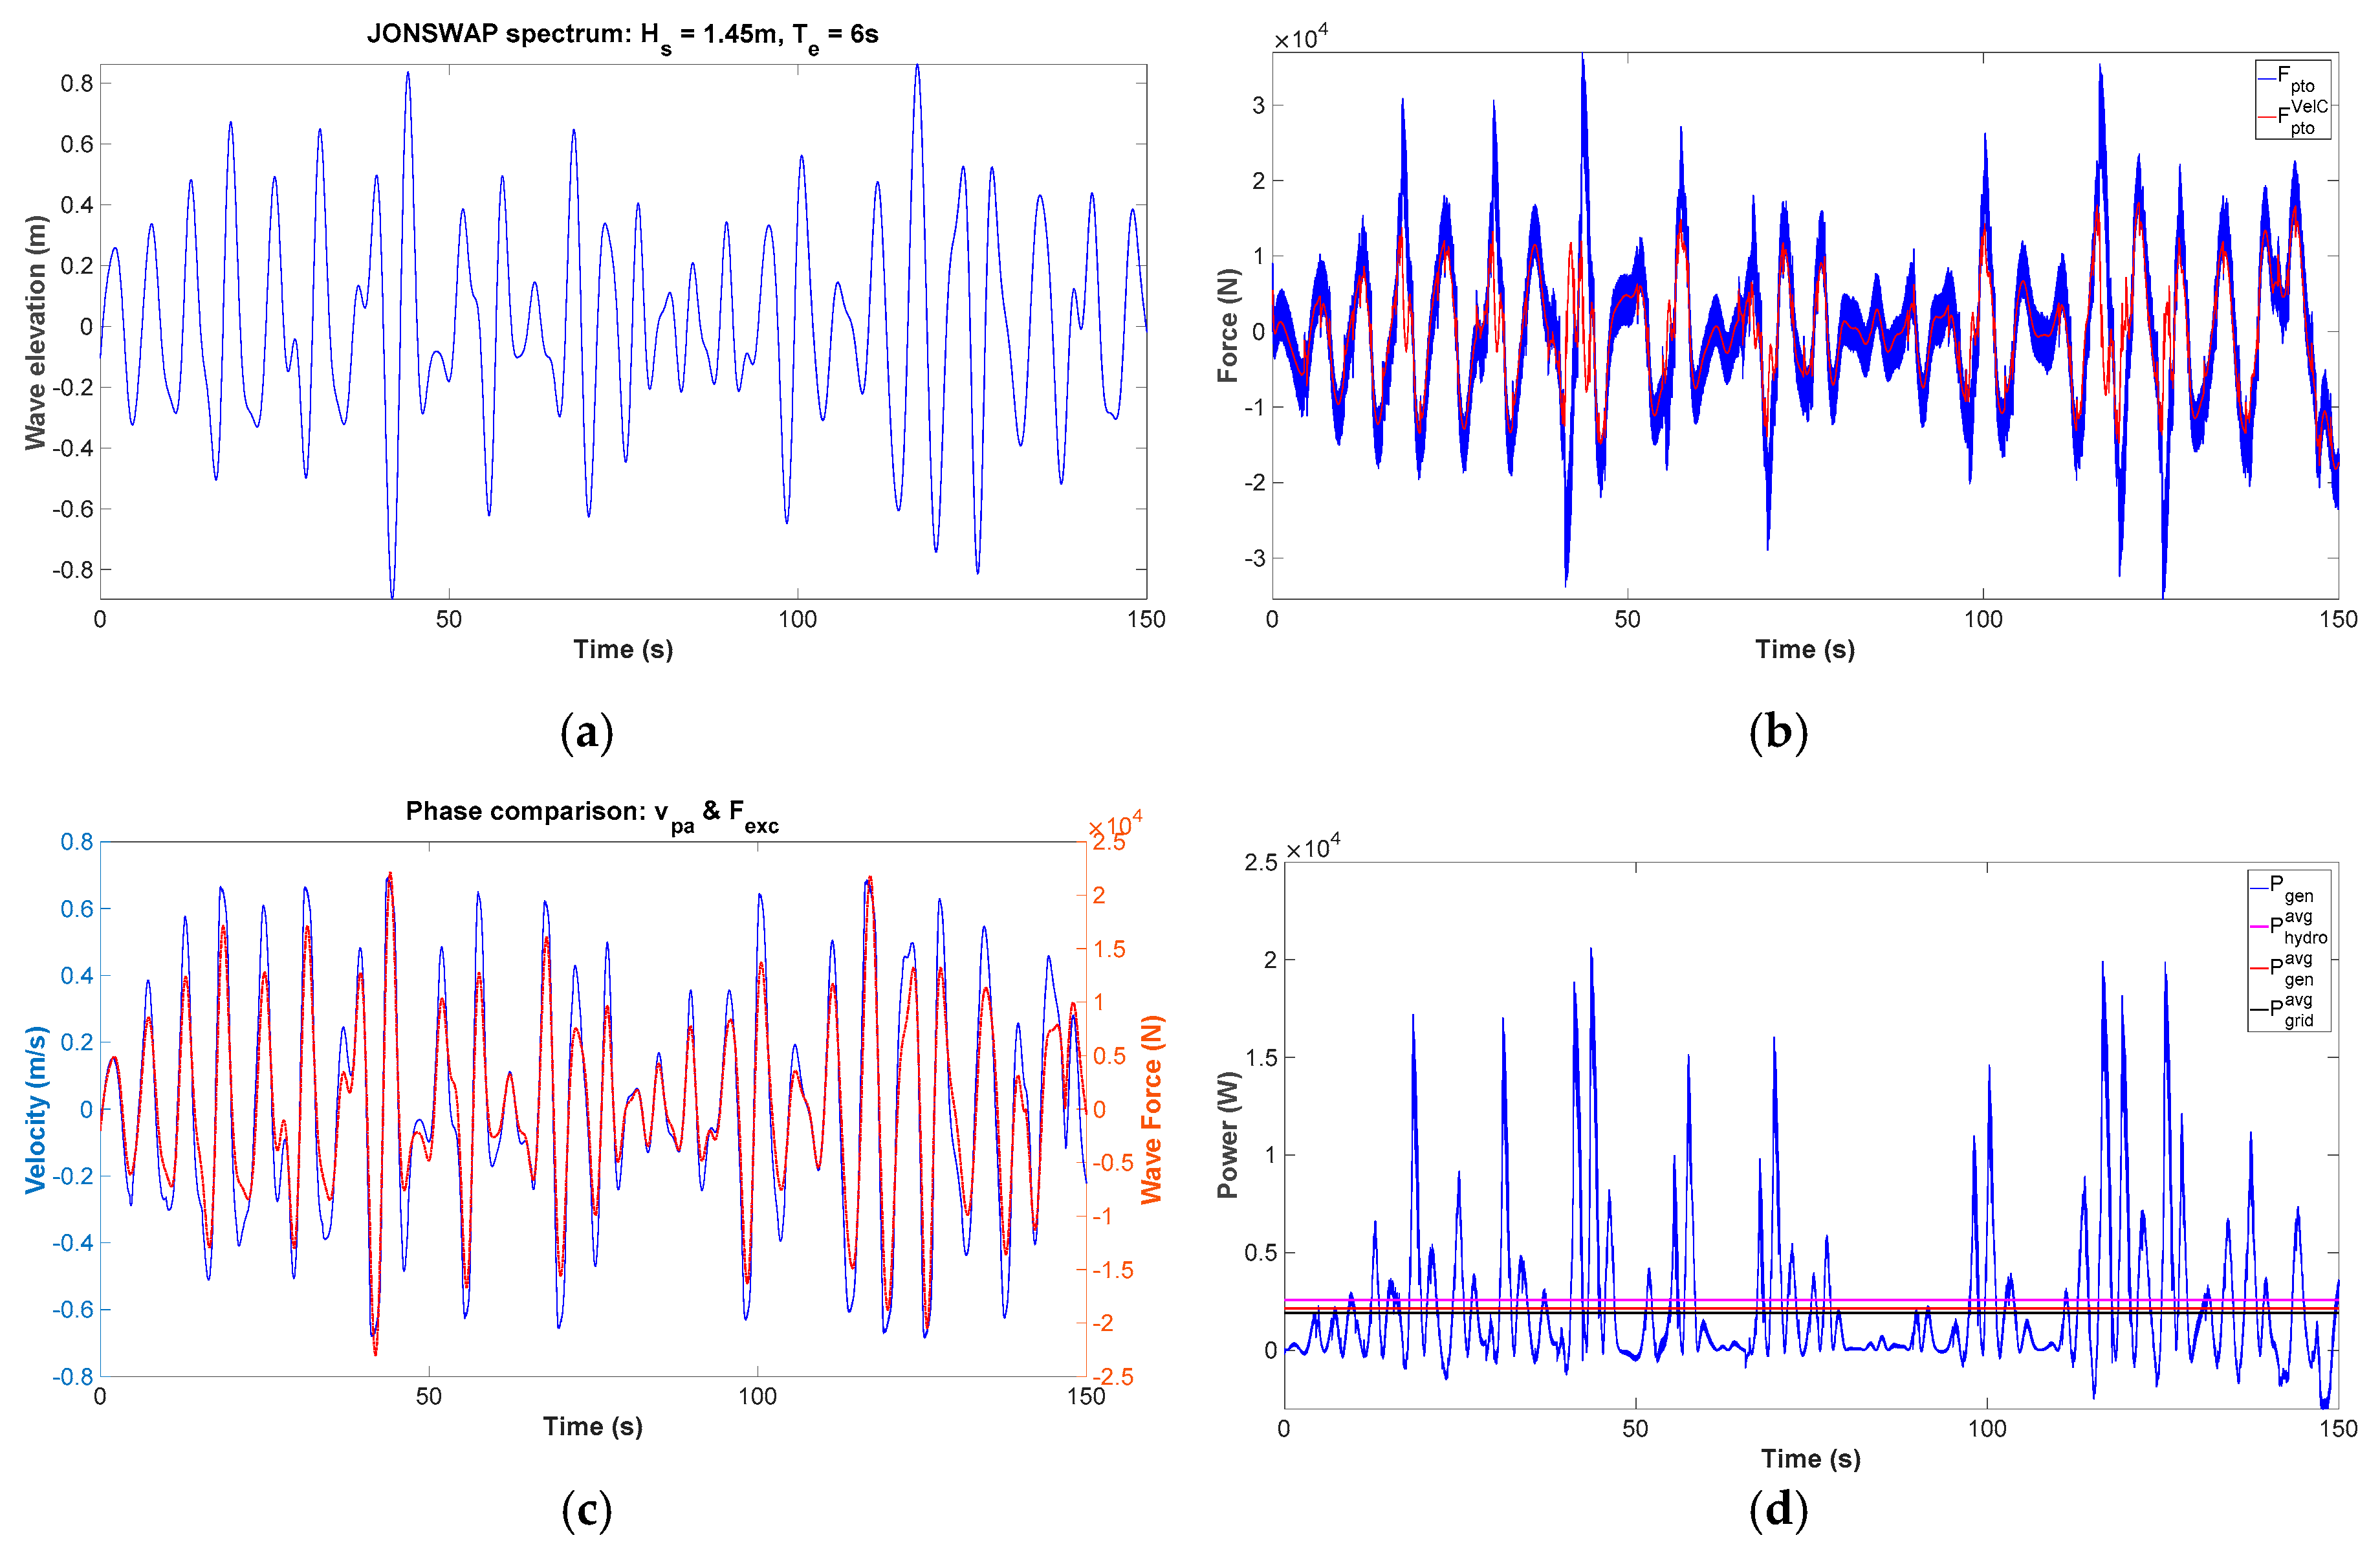
Figure 8a shows the wave elevation generated by a JONSWAP spectrum with significant wave height (Hs) 1.45 m and peak energy period (Te) 6 s. The wave power density for this spectrum in deep water can be calculated using Equation (8) in kW/m.
P W = 0.5 × H s 2 × T e
Using Equation (8), the incoming wave power can be calculated for the buoy under study in this specific sea state. Figure 8b shows the reference PTO force generated by the RdC method ( F p t o R d C ) and the actually generated PTO force from the linear generator. It can be observed that the Fpto closely follows the F p t o R d C , but they are not identical. Some differences appear when the force is above 12 kN. This may be the result of a sudden wave elevation peak. Figure 8c shows the synchronization of the velocity of the point absorber and wave excitation force. The RdC method does not provide any phase control, and therefore the synchronization is based only on the point absorber’s natural frequency and the incoming wave frequencies. The point absorber’s natural frequency is given in Table 1 as 1.8083 rad/s, which is larger than the 1.0467 rad/s peak energy frequency of the sea state used. For the calculation of the F p t o R d C using Equation (7), ωp was equal to 1.0467 rad/s, which is the peak energy frequency of the sea state used. Figure 8d presents the power output at different stages of the system. The peak instantaneous electrical generator power output (Pgen) is 19 kW, whereas the average values for the hydrodynamic power ( P h y d r o a v g ), generator power ( P g e n a v g ) and grid power ( P g r i d a v g ) are 1.9147 kW, 1.6909 kW and 1.4701 kW, respectively. This leads to a PMLG efficiency ( η P M L G ) of 88.3% and electrical system efficiency (generator output to grid) of 86.9% ( η E l e ). If we assume that the power of the incoming waves is PW, then the hydrodynamic efficiency ( η h y d r o ) can also be calculated as being 10.1%. The W2W efficiency ( η W 2 W ) is 7.8%. The different efficiencies can be calculated using Equation (9).
{ η h y d r o = P h y d r o a v g P W × 100 η P M L G = P g e n a v g P h y d r o a v g × 100 η E l e = P g r i d a v g P g e n a v g × 100 η W 2 W = P g r i d a v g P W × 100

Power Maximization Process for the Real Damping Controller

The main idea behind the power maximization process for the RdC is that Equation (7) has several constant parameters that are based on the point absorber constant hydrodynamic properties. Therefore, the constant hydrodynamic properties are also used for the calculation of the reference PTO force and this is to achieve maximum hydrodynamic efficiency η h y d r o .
However, several uncertainties in the constant hydrodynamic parameters may lead to sub-optimal performance. For example, the calculation of the total damping may not be accurate, since it has to contain hydrodynamic damping, which is not calculated as a single value, but rather as a state space model, and the linear damping of the PMLG. Difficulty in calculating these values will certainly lead to reduced performance. Another factor in the power maximization process is that, in order to reduce the cost of energy of WEC devices, it is necessary to maximize the power exported, rather than the hydrodynamic power. It is often assumed that by maximizing hydrodynamic power, the whole system power is maximized, and constant efficiencies for the electrical system are assumed. This is not always the case, as several parameters can affect the electrical power output and electrical efficiencies. For example, a sudden increase in the output current may lead to increased electrical losses due to the rise of temperature in the electrical equipment. Electrical equipment that is sensitive to increases in temperature due to the increased current includes both the power converters and the power transmission cables. Furthermore, as was previously stated in this study, the electrical power constraint is also included to avoid power output that can damage the electrical equipment. Finally, the location each WEC is installed has a specific wave energy climate. This wave energy climate can be measured and quantified so that the WEC installed at this specific wave climate may perform adequately. To summarize, the power maximization process is needed because:
  • The constant hydrodynamic parameters in the calculation of the reference PTO force may not be accurate.
  • The objective is to increase the power exported to the grid and not necessarily the power captured by the waves. The behavior of the electrical generator can change the losses in the electrical system.
  • The mechanical and electrical constrains have to be included in the generation of the reference PTO force.
  • Each WEC is installed for a specific wave climate. The reference PTO force has to be modified to reflect power maximization for this specific wave climate.
To perform power maximization, Equation (7) is re-written in Equation (10). Two constant hydrodynamic parameters are identified as the ones that are difficult to calculate and affect the calculation of the F p t o R d C significantly, the damping and the stiffness.
F p t o R d C = v p a × b R d C 2 + ( ω p [ M + A m ( ω p ) ] k c R d C / ω p ) 2
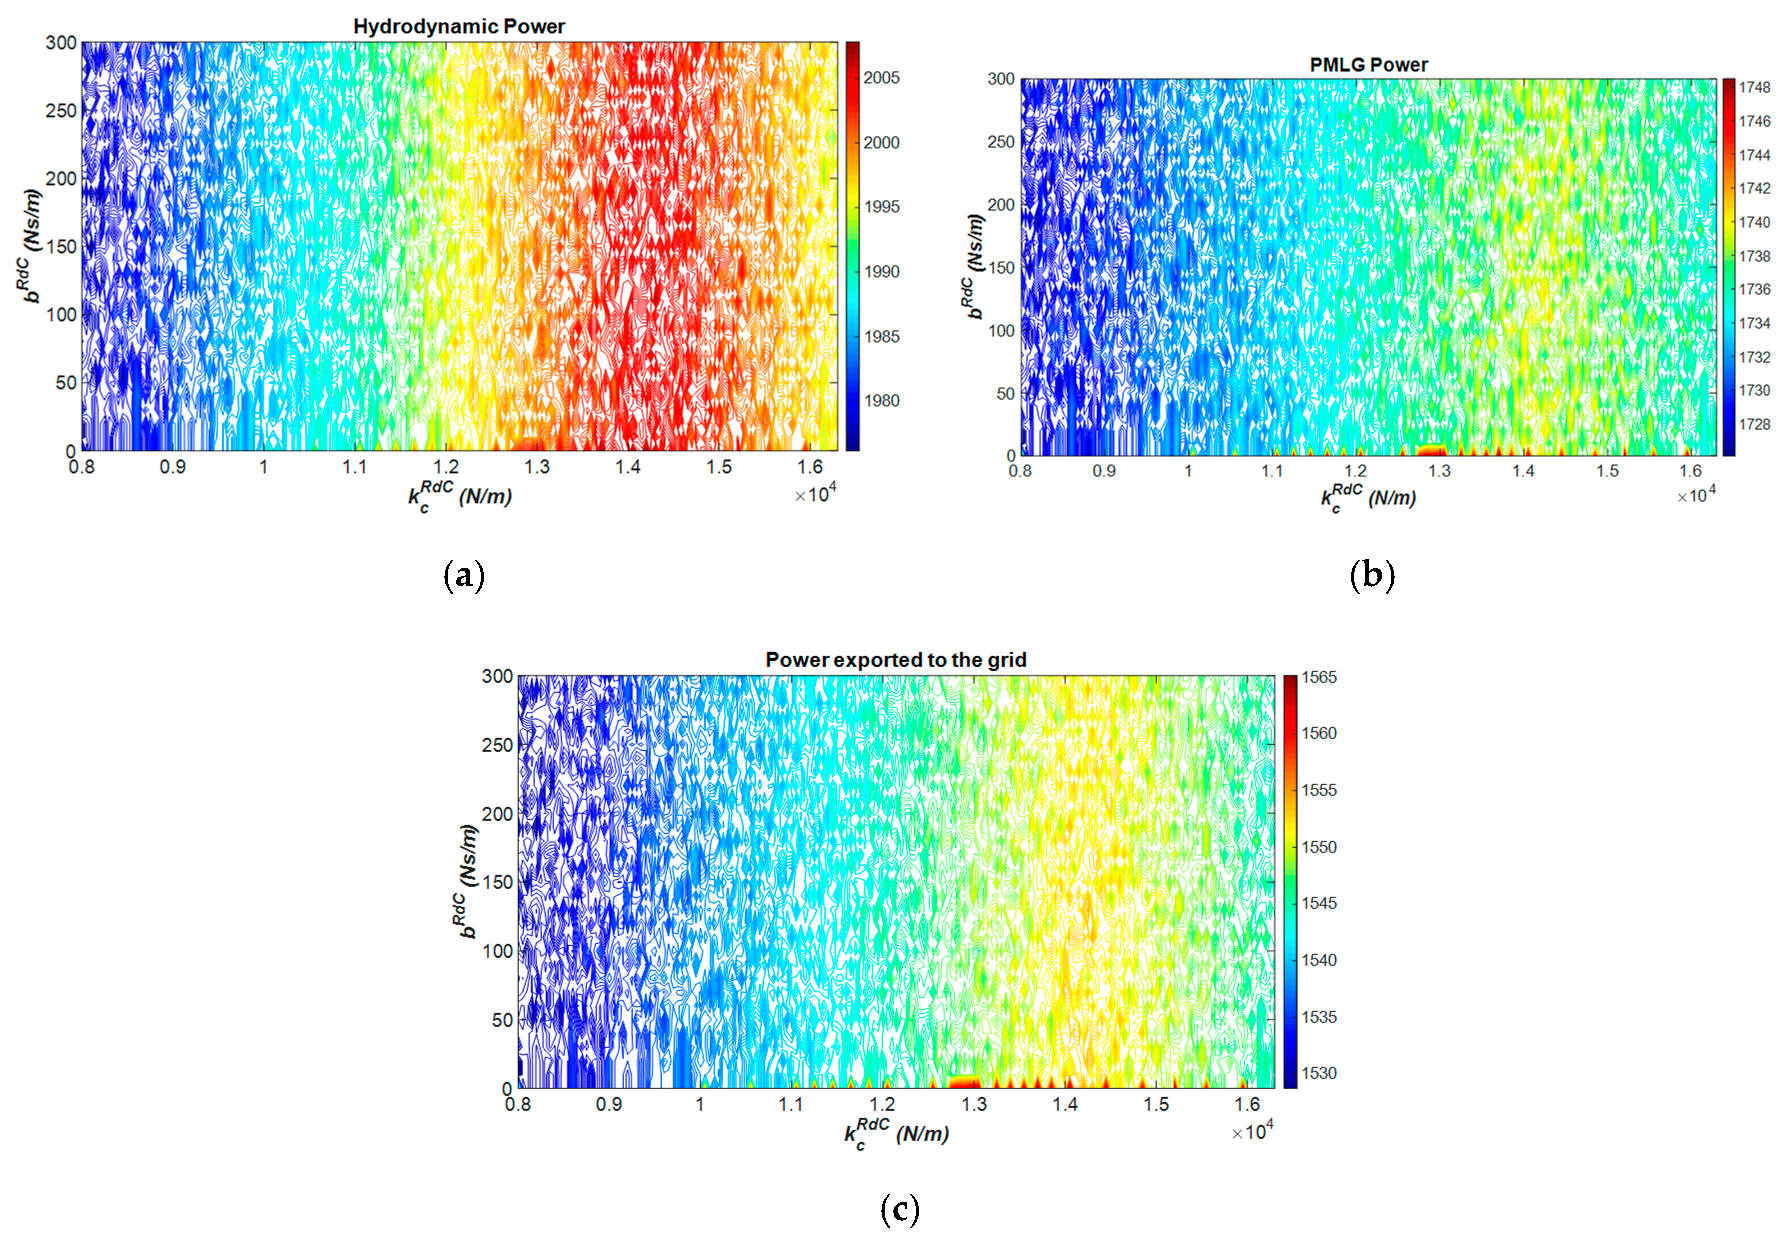
In Equation (10), the damping b R d C and stiffness k c R d C are considered unknowns, and are modified in order to maximize power exported to the grid. Using the constant hydrodynamic parameters as initial guesses, several optimization algorithms can be implemented in order to maximize P g r i d a v g . The optimization algorithms used in this study were implemented in MATLAB and are based on grid search and constrained non-linear algorithms such as sequential quadratic programming. The theory and formulation of these algorithms is outside the scope of this paper. Figure 9 presents the results of the grid search optimization process, which focuses on changing the b R d C and k c R d C with the aim of maximizing power at different points of the W2W WEC system.
It can be observed that k c R d C affects the output of the WEC system, whereas the effect of b R d C is quite small for the range of values used in the grid search optimization. The maximum power for all cases appears to be around 14,000 N/m, with the damping having minimum impact at this scale. Apart from the grid search optimization algorithm, which is time consuming and is based on fixed steps for the design variables, a gradient descent active-set algorithm was used to calculate the b R d C and k c R d C for maximum power at the grid. The summary of results for all the algorithms and the reference case are presented in Table 5. It should be noted that the optimization is based on a 150 s simulation using the wave energy resource presented in Figure 8a. Based on the results presented for optimizing the Real Damping Controller, higher W2W efficiencies can be achieved with minimal impact on the peak-to-average ratio of the generator power ( P g e n r a t i o ). It should be noted that, due to the fact that the WEC system presented has a power limitation mechanism, this is included in the optimization process to achieve maximum power at the point of grid connection.

3.2. Reactive Spring Damping Controller

The Reactive Spring Damping Controller (RsdC) is a sub-optimal complex conjugate controller that uses the constant peak energy frequency ωp of the sea state and does not include an inertia term in the calculation of the reference PTO force F p t o R s d C . The reference PTO force calculation for the RsdC is described in Equation (11).
F p t o R s d C = v p a × b ( ω p ) + z p a × { ω p 2 [ M + A m ( ω p ) ] k c }
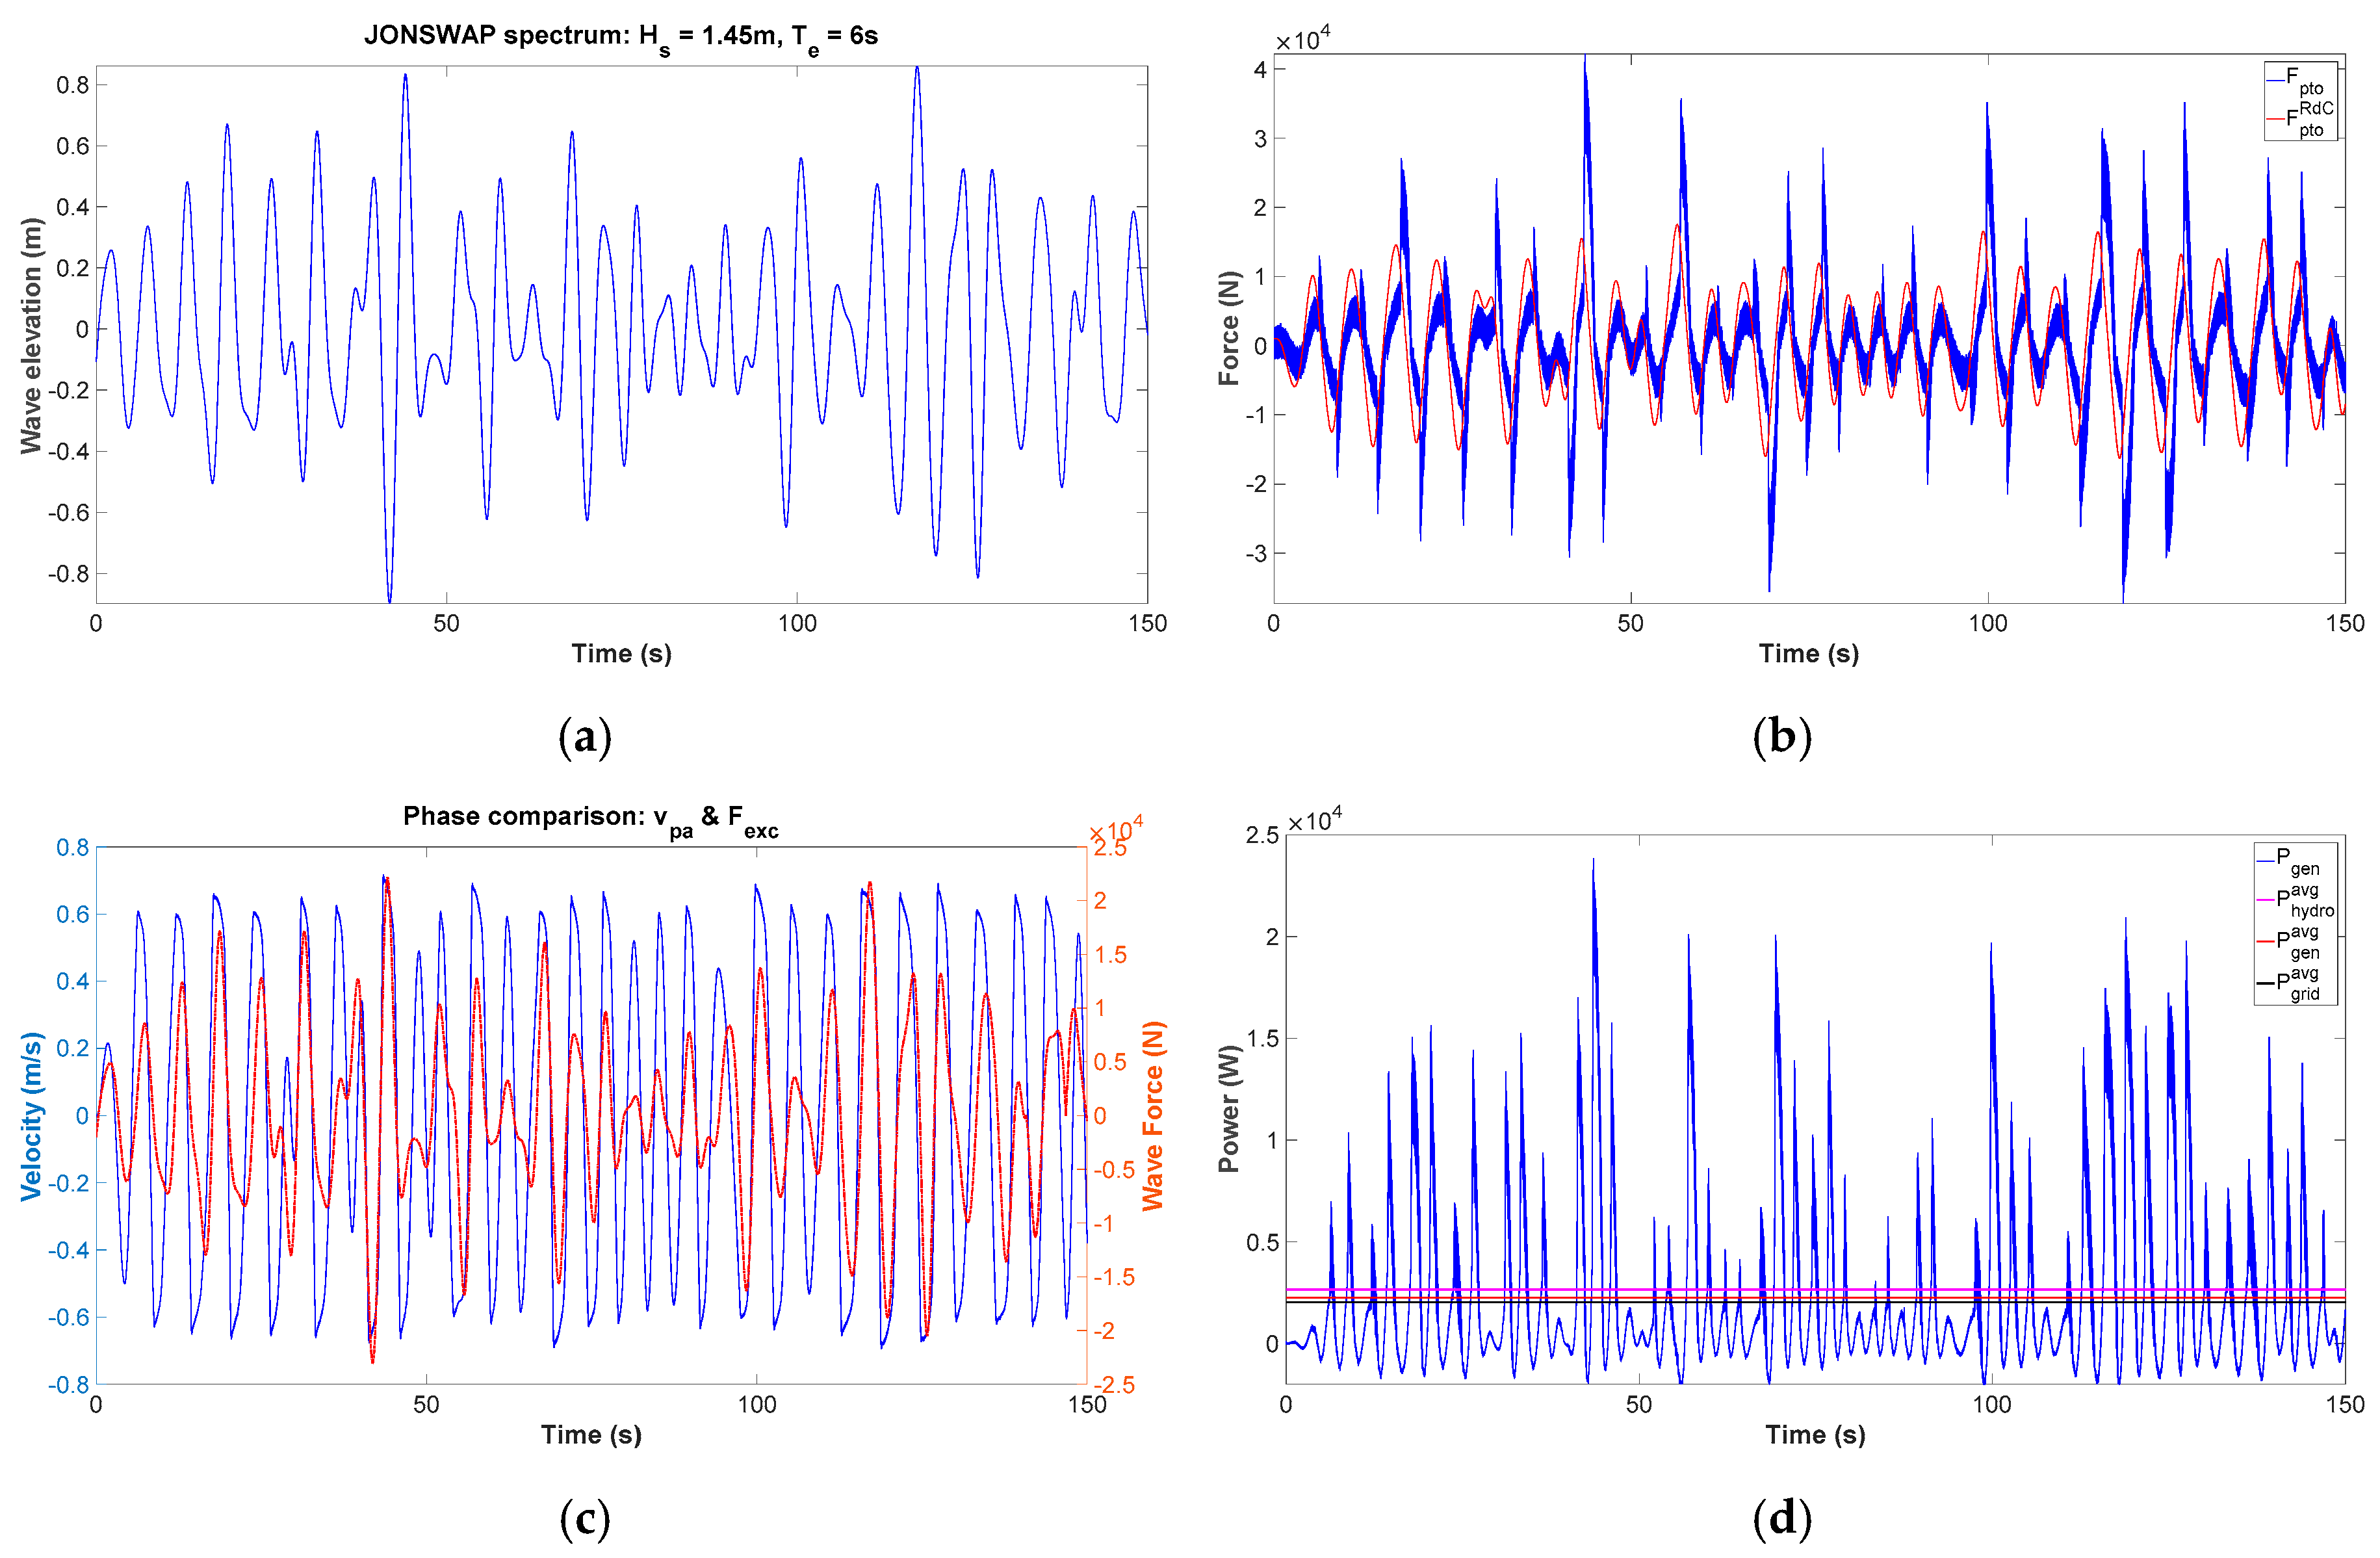
Simulation results of the W2W WEC system developed using the RsdC method are given in Figure 10.
The wave energy resource shown in Figure 10a is the same as the one for the Real Damping Controller. In Figure 10b, F p t o R s d C is compared with the actual Fpto generated by the PMLG. The PMLG PTO force does not follow the reference signal in all the cases. Several factors can affect this performance including PMLG design parameters such as the phase inductance. An additional observation is that Fpto has much higher values compared to Figure 8b. Regarding phase synchronization between the wave excitation force and the velocity of the point absorber, it is evident that the RsdC affects the v p a phase, especially when compared to Figure 8c. Apart from the phase control, the amplitude control of the RsdC is significant as well. The velocity of the point absorber reaches 0.6 m/s even at low excitation force amplitudes. Finally, the power at different stages can be seen in Figure 10d. The peak instantaneous electrical generator power output (Pgen) is 23.8 kW, whereas the average values for the hydrodynamic power ( P h y d r o a v g ), generator power ( P g e n a v g ) and grid power ( P g r i d a v g ) are 2.6549 kW, 2.2537 kW and 2.0247 kW, respectively. This leads to η P M L G = 84.9%, η E l e = 89.8%, η h y d r o = 14.1% and η W 2 G = 10.7%. The different efficiencies are calculated using Equation (9). In addition, reactive power flow can be seen in Figure 10d. The peak negative power at the generator terminals is around 2 kW, and the average negative power in a 150 s simulation is 680 W. By implementing the RsdC, total power to the grid is increased by 38% compared to RdC, despite the negative power consumed by the generator to perform phase control. In the following section, the RsdC is optimized in a similar way to the RdC in order to maximize the power exported to the grid.

Power Maximization Process for the Reactive Spring Damping Controller

The main idea behind the power maximization process for the RsdC is that Equation (11) has several constant parameters that are based on the point absorber constant hydrodynamic properties. Therefore, the constant hydrodynamic properties are also used for the calculation of the reference PTO force, and this is done in order to achieve maximum hydrodynamic efficiency, η h y d r o . The WEC controllers are optimized in order to maximize P g r i d a v g . An additional characteristic of the RsdC compared to the RdC is that it has reactive power, allowing it to carry out phase control of the point absorber. Reactive power control leads to power being consumed by the PMLG in order to bring the velocity of the point absorber into phase with the wave excitation force. The amount of power consumed can significantly affect the total power generated. The reasoning behind performing optimization in the RsdC is similar to the RdC, and is reproduced here with the addition of the control of the reactive power to achieve the desired target:
  • The constant hydrodynamic parameters in the calculation of the reference PTO force may not be accurate.
  • The objective is to increase the power exported to the grid, and not necessarily the power captured by the waves. The behavior of the electrical generator can change the losses in the electrical system.
  • The mechanical and electrical constraints have to be included in the generation of the reference PTO force.
  • Each WEC is installed in a specific wave climate. The reference PTO force has to be modified to reflect power maximization for this specific wave climate.
  • Reactive power control can bring the point absorber into phase with the wave excitation force for maximum power extraction from the waves, but may lead to excessive power being consumed by the WEC. The amount of reactive power has to be controlled through optimization.
To perform power maximization, Equation (11) is rewritten into Equation (12). Two constant hydrodynamic parameters are identified as being difficult to calculate and as significantly affecting the calculation of F p t o R s d C : damping and stiffness.
F p t o R s d C = v p a × b R s d C + z p a × { ω p 2 [ M + A m ( ω p ) ] k c R s d C }
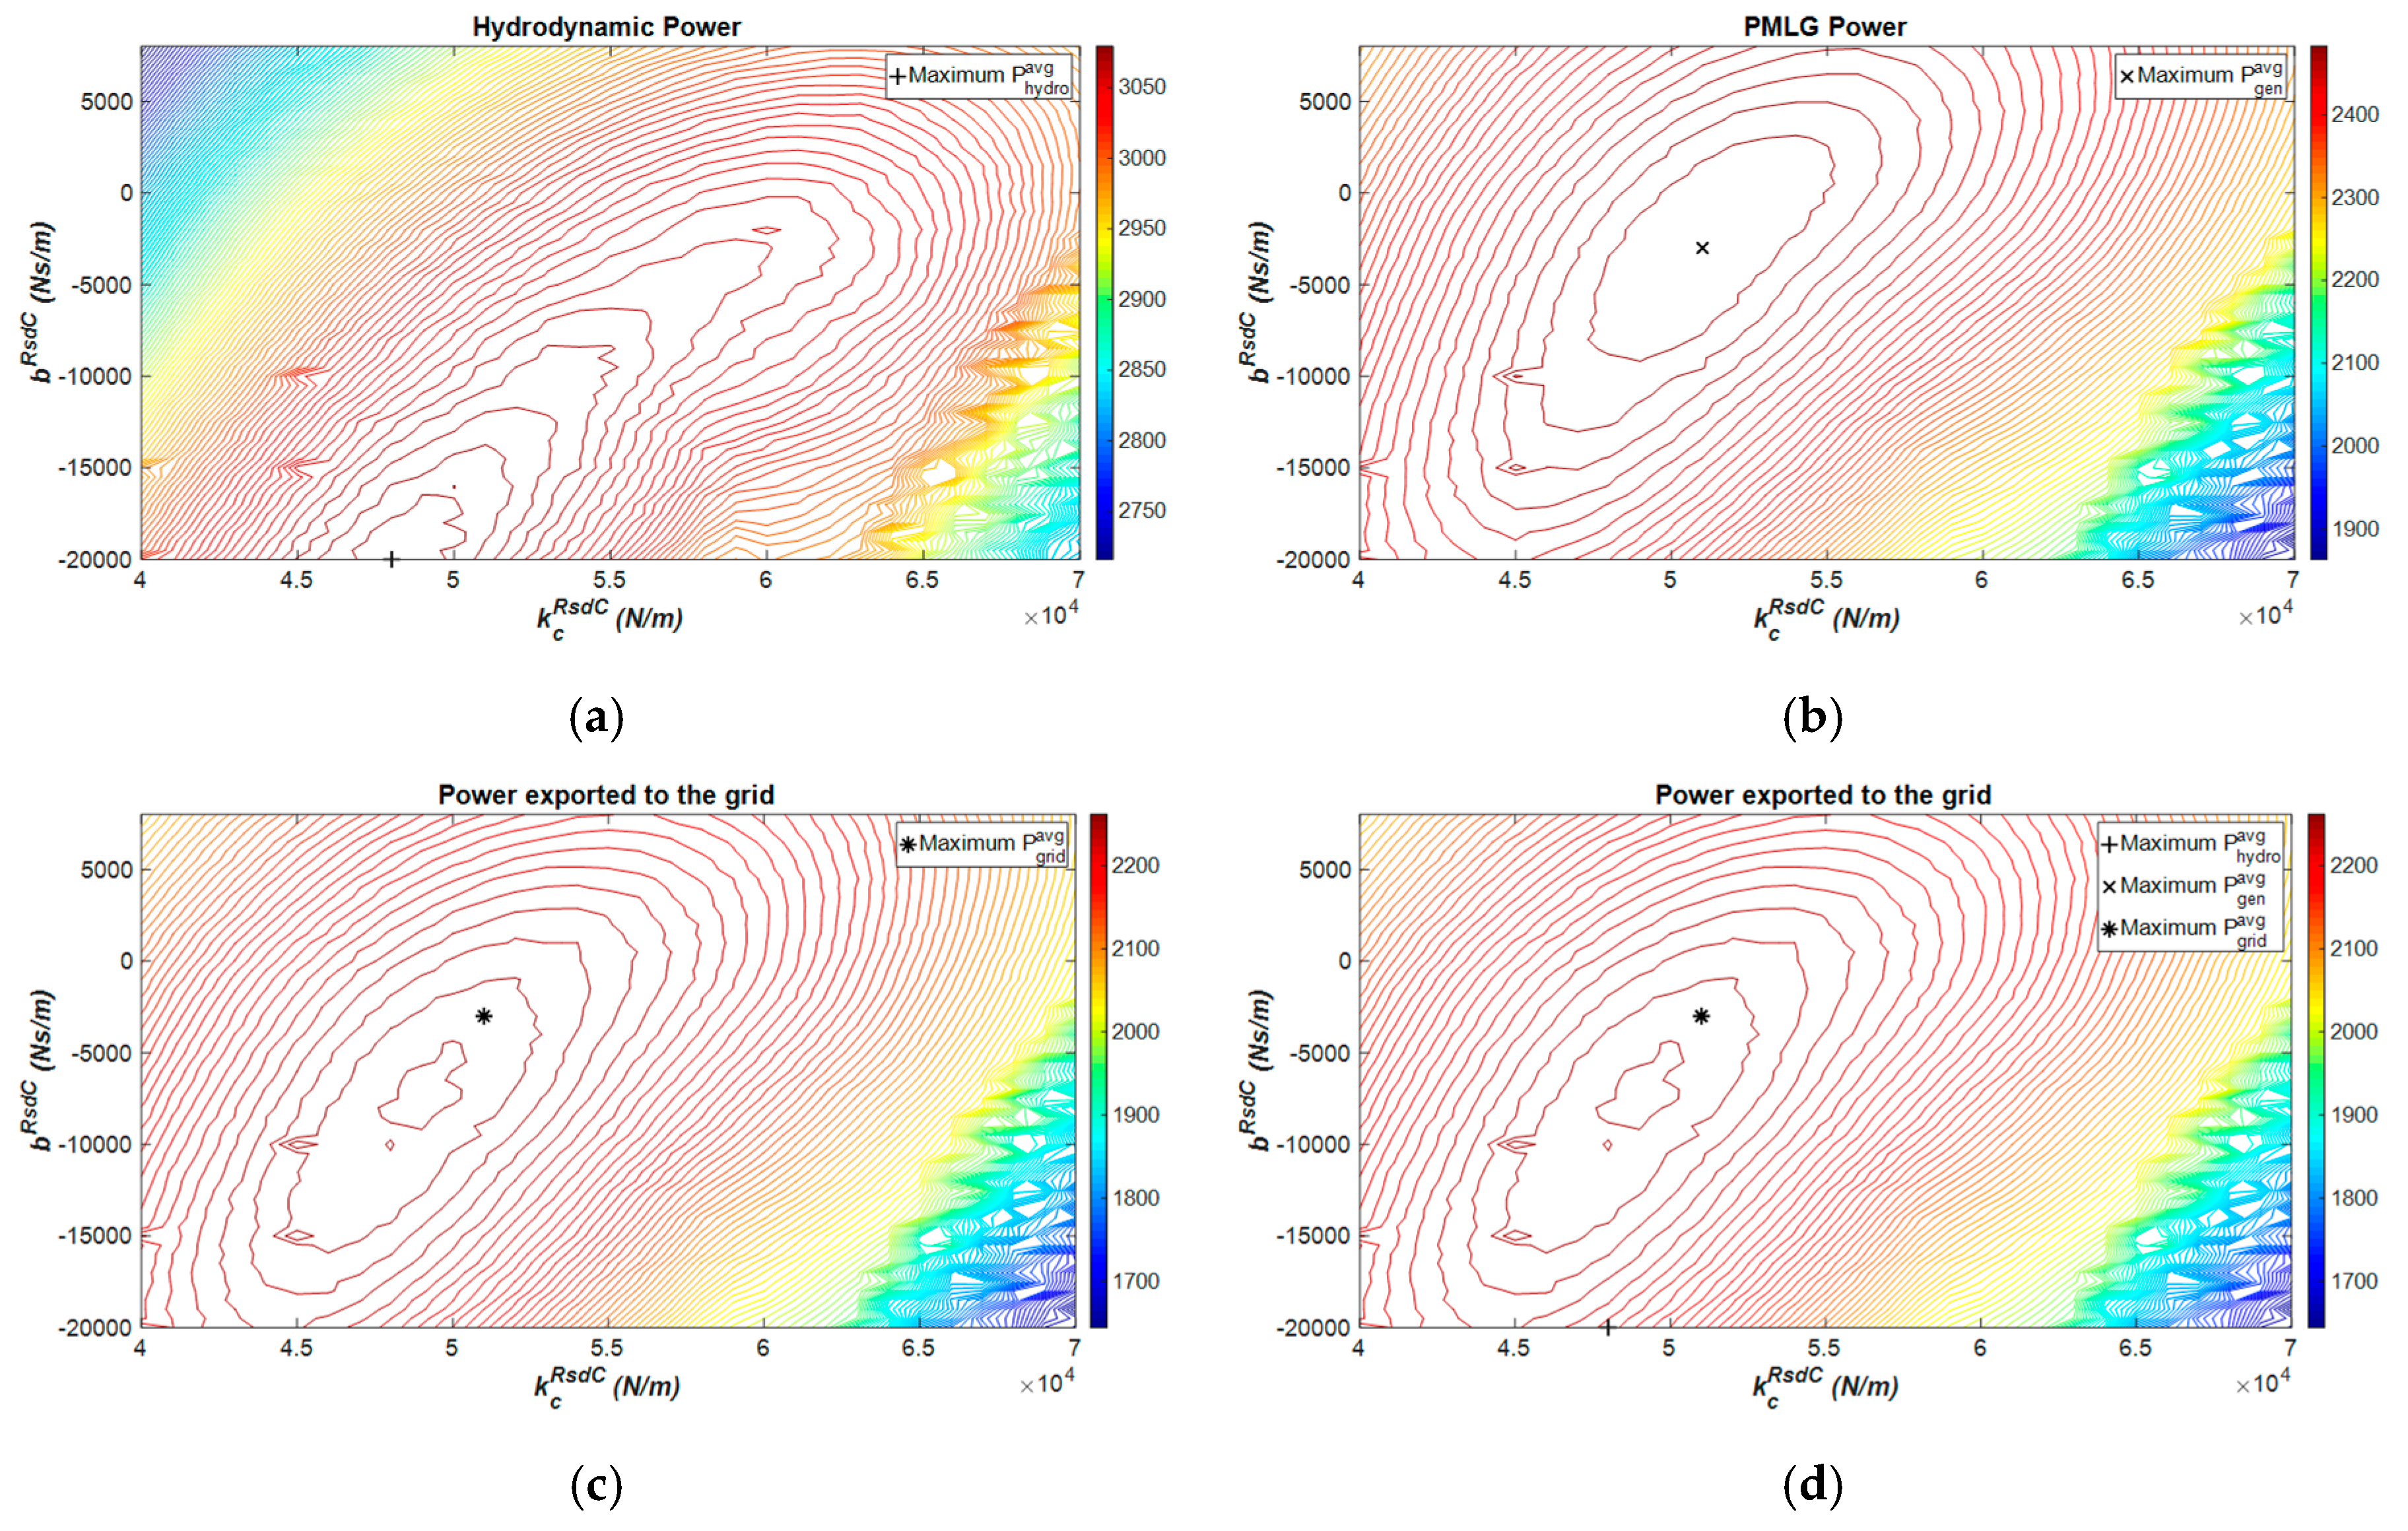
In Equation (12), damping b R s d C and stiffness k c R s d C are considered unknowns and are modified in order to maximize power exported to the grid. Using the constant hydrodynamic parameters as initial guesses, several optimization algorithms can be implemented in order to maximize P g r i d a v g . The optimization algorithms used in this study were implemented in MATLAB and are based on grid search and constrained non-linear algorithms such as the sequential quadratic programming. Figure 11 presents the results of the grid search optimization process which focuses on changing the b R s d C and k c R s d C with the aim of maximizing power at different points of the W2W WEC system.
Figure 11 depicts power output of the point absorber (Figure 11a), generator (Figure 11b) and grid (Figure 11c) for different parameters of b R s d C and k c R s d C . For each case, the b R s d C and k c R s d C that gives the maximum average power is identified, cross (+) for maximum P h y d r o a v g , cross mark (x) for maximum P g e n a v g , and asterisk (*) for maximum P g r i d a v g . In Figure 11d, the maximum power points are overlapped on the contour plot of power exported to the grid. It is shown that maximum power is achieved at different combinations of b R s d C and k c R s d C , which shows how much reactive power can affect the power output at different stages of the system. The maximum P g e n a v g and P g r i d a v g are at the same b R s d C and k c R s d C values, which indicates that optimizing generator power output may suffice for W2W optimization, but this is a single case and cannot be generalized.
Apart from the grid search algorithm visualized in Figure 11, a gradient descent algorithm was also used in a similar way as in the RdC. The results for a 150 s simulation are presented in Table 6. Based on the results presented, optimizing the Reactive Spring Damping Controller, higher W2W efficiencies can be achieved with small impact on the P g e n r a t i o .
In Table 6, it is shown that, when using the Grid Search Method for maximizing P h y d r o a v g , a maximum of 3.088 kW is absorbed by the point absorber. However, the average grid power in this case is 2.235 kW, which is lower than the Grid Search Method for maximizing P g r i d a v g . Therefore, it can be concluded that maximizing the mechanical power captured by the point absorber does not necessarily lead to the maximum power at the grid side. The Gradient Descent Method identifies more detailed values for b R s d C and k c R s d C in order to achieve P g r i d a v g maximization, but the difference is negligible compared to Grid Search. The only significant advantage of the Gradient Descent in this case is the reduced simulation time of the algorithm to find these specific values.

3.3. Velocity Controller

The velocity controller (VelC) was first introduced in [28] for an array of DD WEC with energy storage at the DC link. The main idea behind the velocity controller is based on the equations given in (13).
{ v p a o p t = F e x c / [ 2 R i ( ω ) ] P h y d r o = F e x c × v p a
The first equation in (13) relates to the optimum velocity, v p a o p t , the amplitude of the point absorber with the real part of the intrinsic impedance of the system, R i , and the phase of the optimum velocity with the wave excitation force F e x c . Both the wave excitation force and the real part of the intrinsic impedance of the system are changing depending on the frequency of the incoming waves. The second equation in (13) shows that, in order to achieve maximum P h y d r o , the F e x c and v p a need to be in phase. The block diagram of the components comprising the velocity controller for DD WEC is shown in Figure 12.
As is shown in Figure 12, the velocity controller is composed of three parts: Velocity Phase Control, Velocity Amplitude Control and the Speed Control. Velocity Phase Control uses the hydrodynamic parameters of mass, added mass and stiffness as well as the real time measurements of the point absorber acceleration ( a p a ) and displacement in order to estimate F e x c ( F e x c e s t ). The estimator uses Equation (14) to calculate F e x c e s t .
F e x c e s t =   a p a × ( M + A m ) + k c × z p a
The F e x c e s t is normalized by dividing it by the rated mechanical force F r a t e d to construct the phase component of F e x c . The damping component in the calculation of F e x c e s t is not considered due to its minimal effect on the phase component. In addition, it is desirable to reduce the dependency of F e x c e s t from the constant hydrodynamic parameters, which may change during the lifetime of the WEC. For this purpose, the use of Kalman filters may be considered for predicting the phase component of F e x c . The Velocity Amplitude Control of the velocity controller is mainly composed of a Look-up table, which generates the optimum velocity ( | v p a | ) amplitude as a function of the phase component of F e x c ( F e x c N ). The amplitude and phase are multiplied to create the optimum velocity of the point absorber v p a o p t . The v p a o p t and the actually measured velocity v p a are compared, and the velocity error is used as input to a PI controller. The output of the controller is the reference PTO force of the velocity controller, which aims to minimize the error between the optimum and the actually measured velocity.
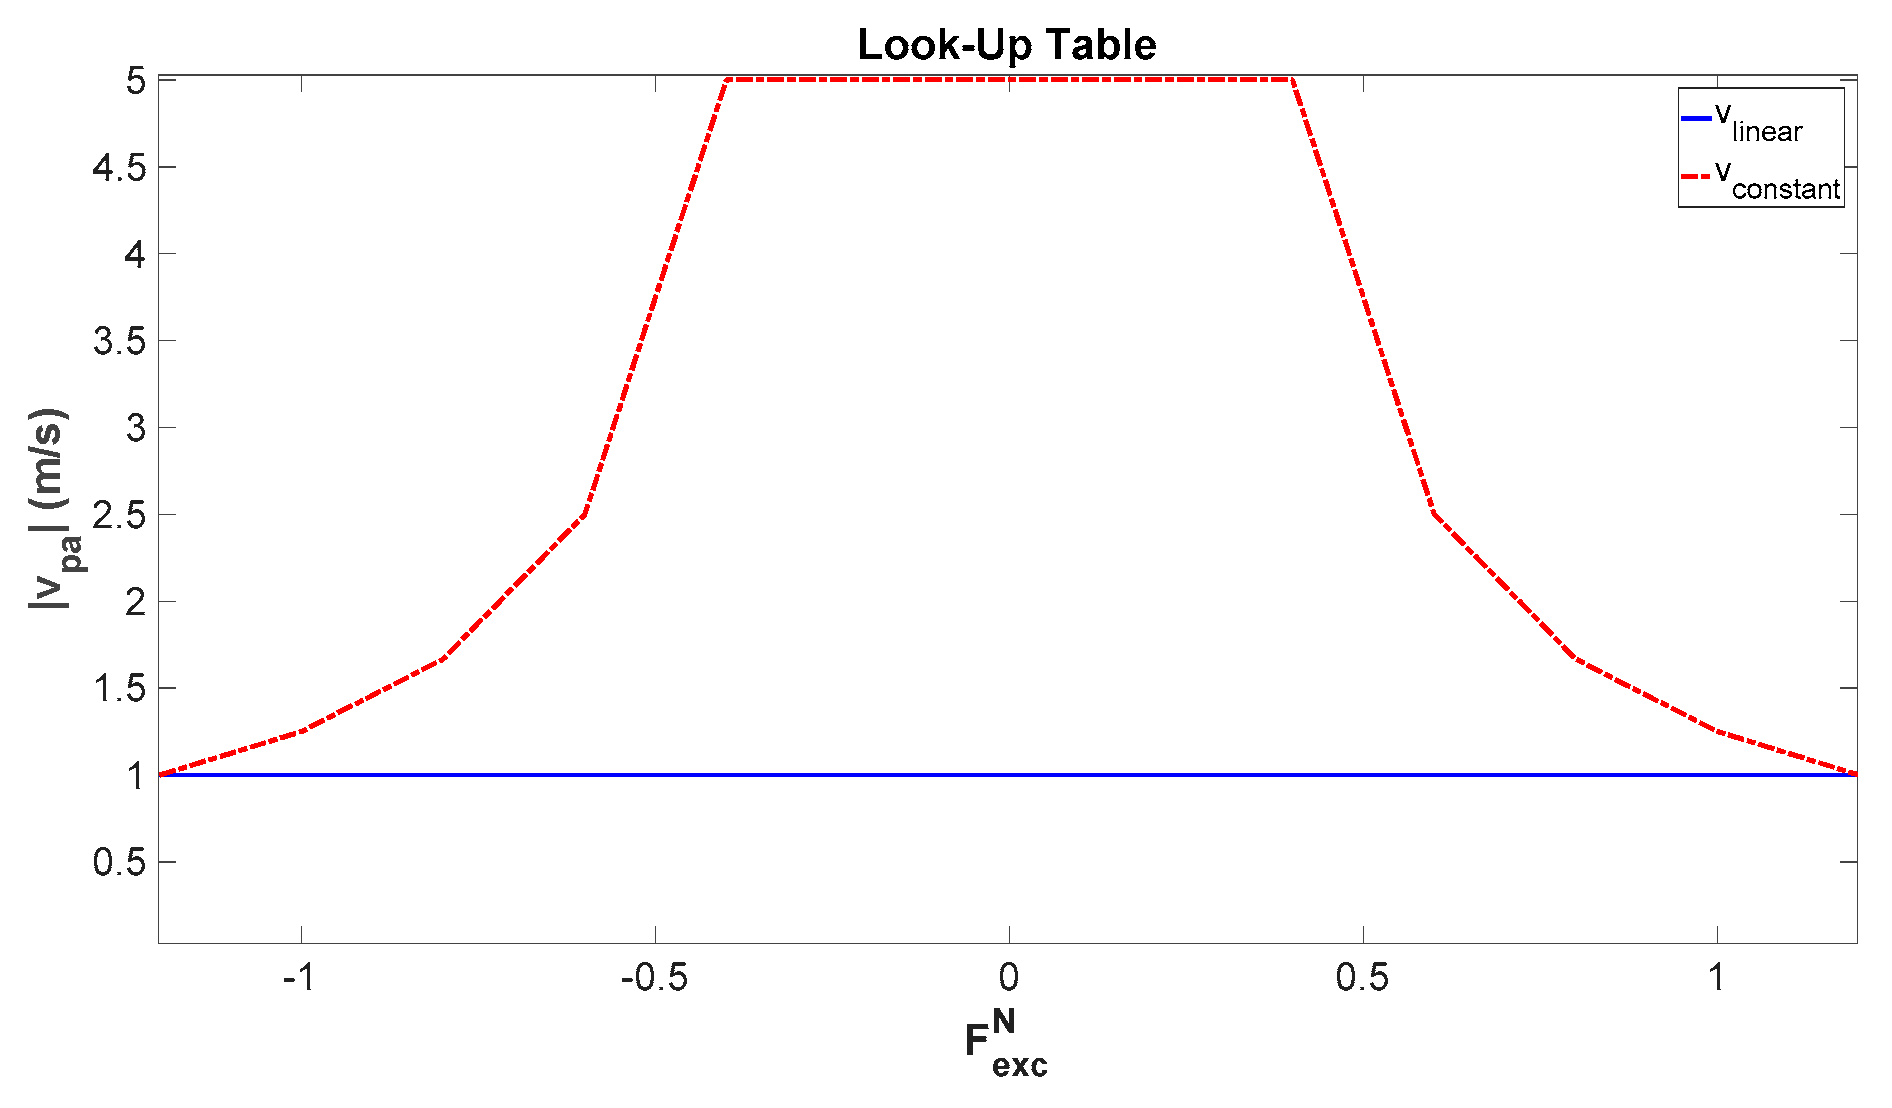
Two sets of parameters are not predetermined in the velocity controller, the Look-up table and the tuning of the Speed Controller. The Look-up table can be defined in two different ways: the first assumes a linear relationship between the optimum velocity amplitude and the optimum phase. The linear relationship is based on the peak velocity the point absorber can have, and for simplification, the Look-up table can be replaced with a gain block with the peak velocity of the point absorber as a parameter. The second method assumes that the optimum velocity amplitude needs to be constant regardless of phase. The Look-up tables created based on these two different assumptions are shown in Figure 13.
The vlinear approach uses the maximum velocity of the point absorber (1 m/s) for all the normalized excitation force input points. Therefore, at rated excitation force, the optimum velocity will be the maximum, and a linear approach is used for the rest of excitation force input points. The vconstant approach for the Look-up table aims at keeping the velocity of the point absorber near the maximum velocity, despite the low excitation force input. Therefore, at low F e x c N , the velocity magnitude is high, and at high F e x c N , the velocity magnitude tends to 1 m/s. The W2W WEC with the vlinear VelC is simulated under the same resource as the previous controllers, and the results are presented in Figure 14.
In Figure 14, it can be observed that a good match is achieved between the reference and actual PTO force. This helps to produce a synchronized instantaneous velocity with the F e x c N , which is an estimate of the input wave excitation force. In Figure 14c, this synchronization can be seen, and it can be observed that the instantaneous velocity of the point absorber follows the phase of the actual F e x c effectively. Figure 14d presents the power output at different stages of the W2W WEC. The peak instantaneous power of the PMLG is 20.5 kW, whereas the average values for the hydrodynamic power ( P h y d r o a v g ), generator power ( P g e n a v g ) and grid power ( P g r i d a v g ) are 2.5711 kW, 2.1479 kW and 1.9134 kW respectively. This leads to a η P M L G = 83.5%, η E l e = 89.1%, η h y d r o = 13.6% and η W 2 G = 10.2%. Finally, it is also shown that the VelC works in a similar way as a reactive controller which performs both phase and amplitude control. For that purpose, the PMLG absorbs power at some instances and in the 150 s simulation presented in Figure 14 the average negative power was 557 W. A summary of the results for the vlinear VelC and vconstant VelC, along with all the options presented in this paper, is given in Section 3.4.

Power Maximization Process for the Velocity Controller

The main idea behind the power maximization process for the velocity controller is that the Look-up table can significantly affect the efficiency of the controller. In Section 3.3, by using a simple linear relationship between F e x c N and | v p a | , the phase between v p a and F e x c was efficiently synchronized, but the amplitude of the velocity was not optimized. The gradient descent algorithm can be used to optimize the Look-up table of the VelC so that the W2W WEC system achieves maximum P g r i d a v g . As was stated in the optimization process of the RdC and RsdC, the following aspects are taken into account for the optimization of the VelC:
  • The objective is to increase the power exported to the grid, and not necessarily the power captured by the waves. The behavior of the electrical generator can change the losses in the electrical system.
  • The mechanical and electrical constrains have to be included in the generation of the reference PTO force.
  • Each WEC is installed in a specific wave climate. The Look-up table has to be modified to maximize power for the specific wave climate.
  • Reactive power can bring the point absorber into phase with the wave excitation force for maximum power extraction from the waves, but may lead to excessive power consumption by the WEC. The amount of reactive power has to be controlled through optimization.
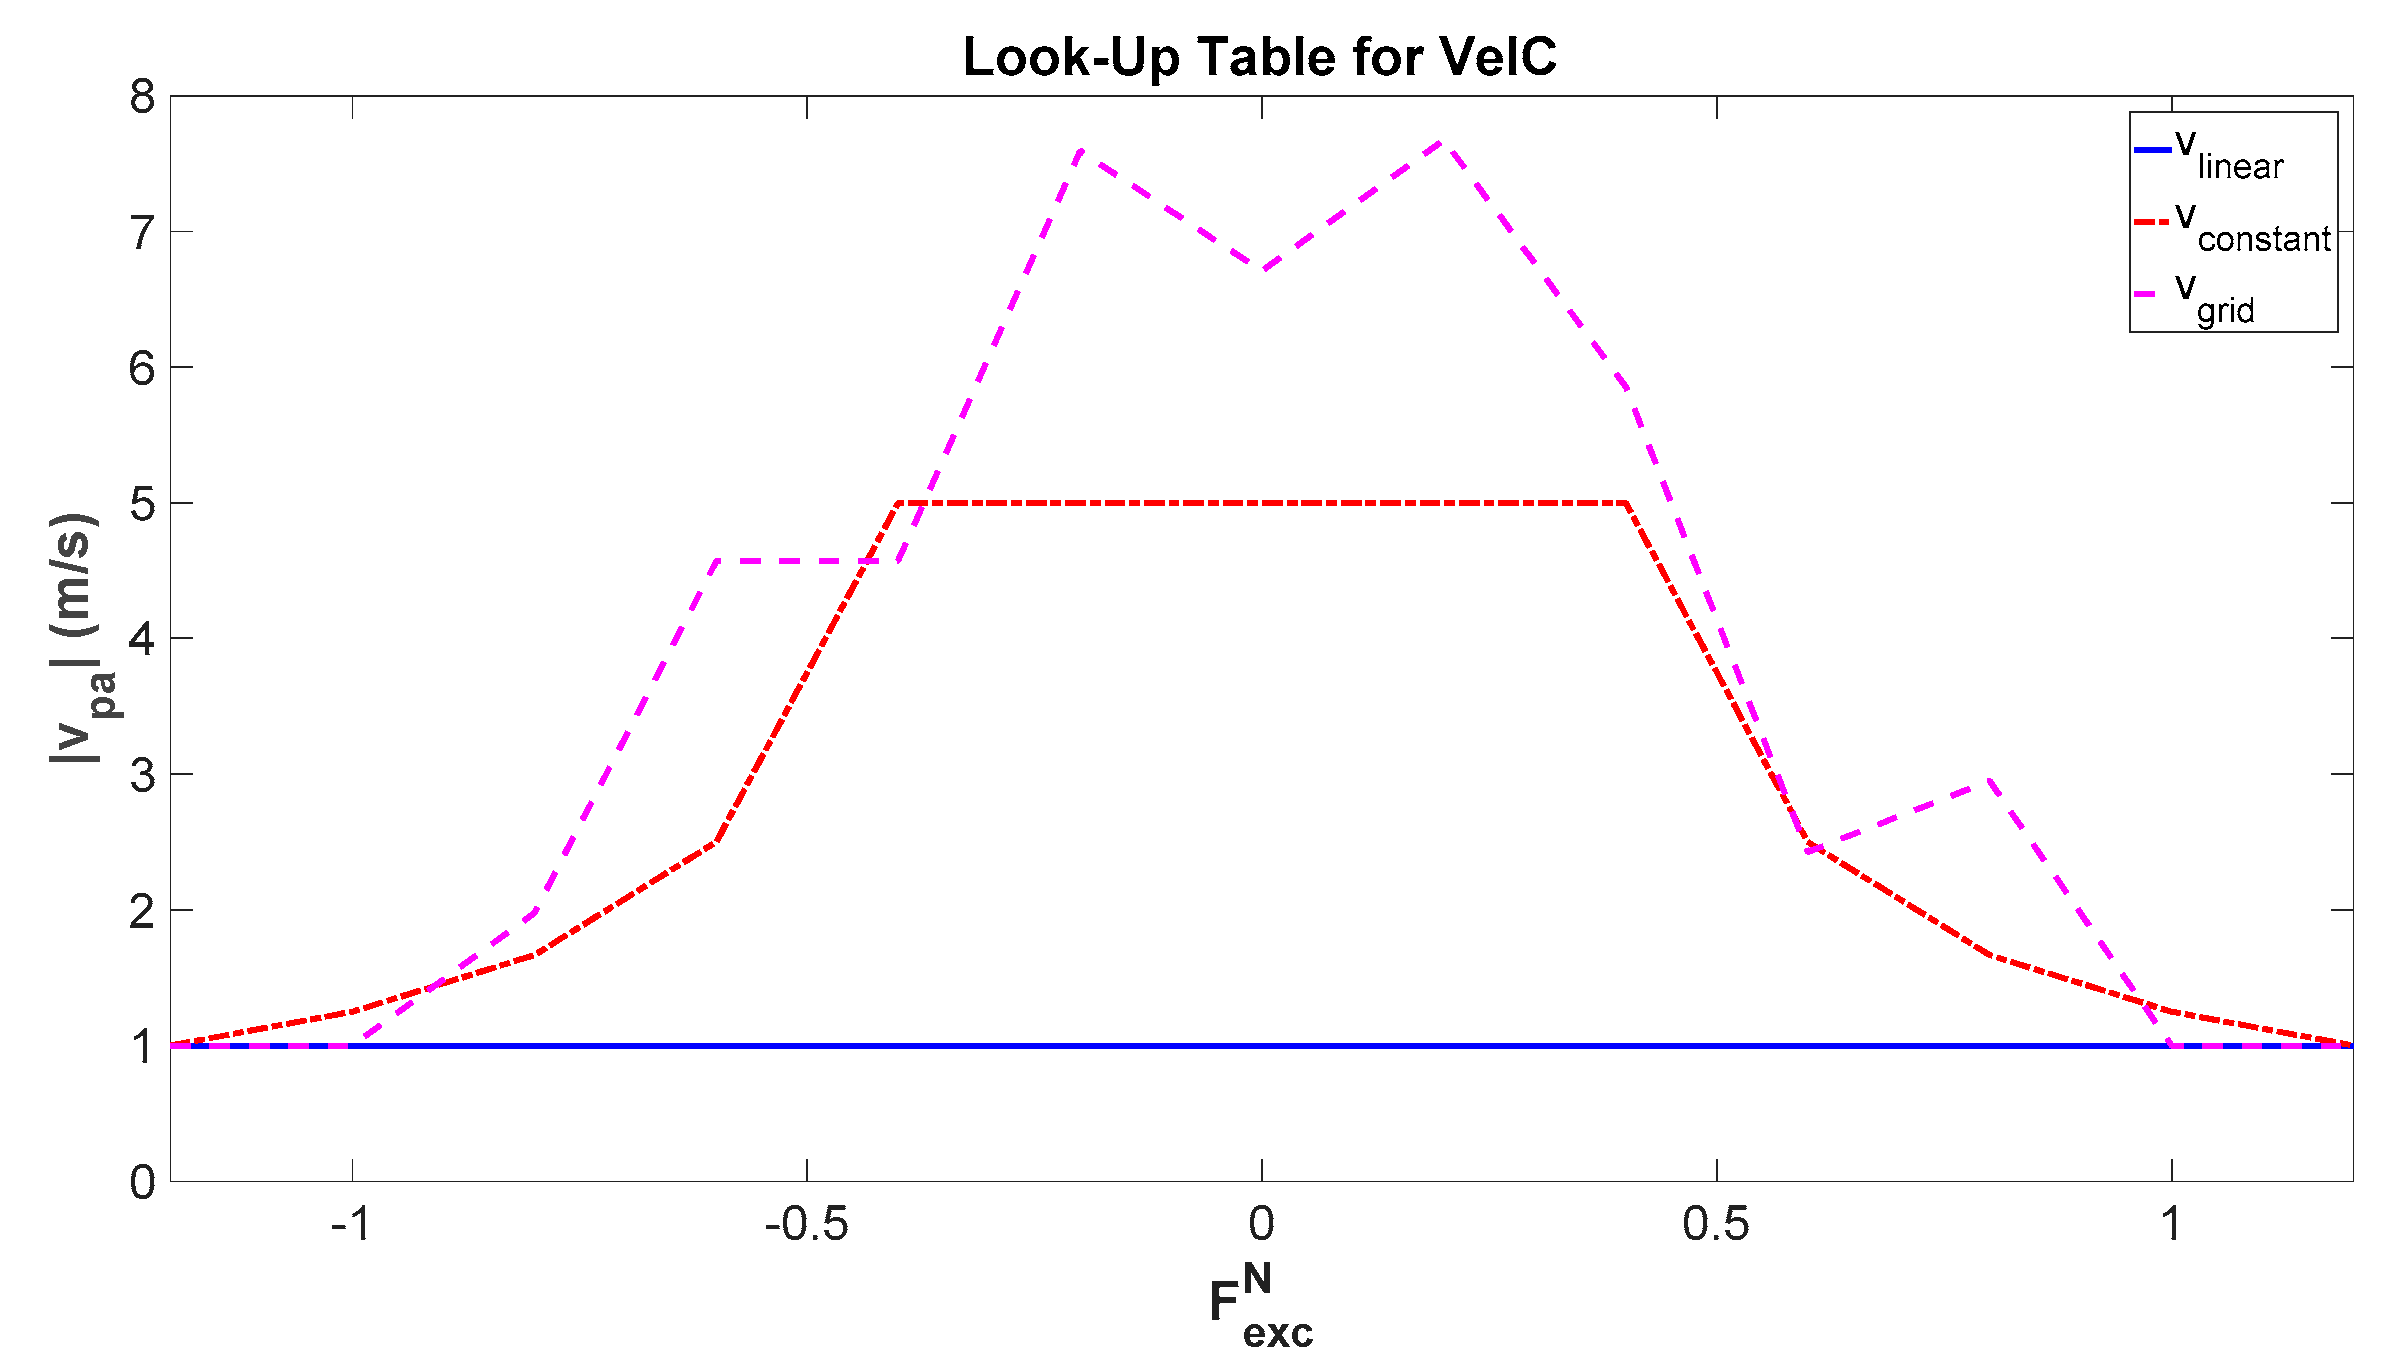
The optimized Look-up table for the 150 s wave resource shown in Figure 14a is given in Figure 15.
The results from the simulation of the different velocity controllers are presented in Table 7. Based on the results presented, the VelC achieves high W2W efficiencies in all cases with smaller P g e n r a t i o compared to RdC and RsdC keeping the control method cost efficient.

3.4. Summary of Controller Options

Table 8 summarizes the results obtained with the different controllers and compares the W2W efficiency between each controller and the RdC Reference. It is observed that the VelC vgrid has the highest W2W efficiency with an average of 2.498 kW for a 150 s simulation. The VelC vgrid achieved more than 5% extra efficiency, and an additional 1 kW power at the grid compared to the RdC Reference. High efficiencies were also achieved when the VelC vconstant, RsdC Gradient Descent and RsdC Grid Search were used.
4. Test Cases in a Realistic Environment

In the cases presented in Section 3, a complete simulation time of 150 s was used for the optimization of the controllers. However, WEC are expected to operate continuously for a much longer time. In this section, the controller variations with the highest W2W efficiency will be compared in a randomly generated sea state with the same significant wave height and energy period as the ones used for their optimization. In addition, low occurrence high-energy wave conditions will be examined in Section 4.2.

4.1. Dominant Operation Sea State

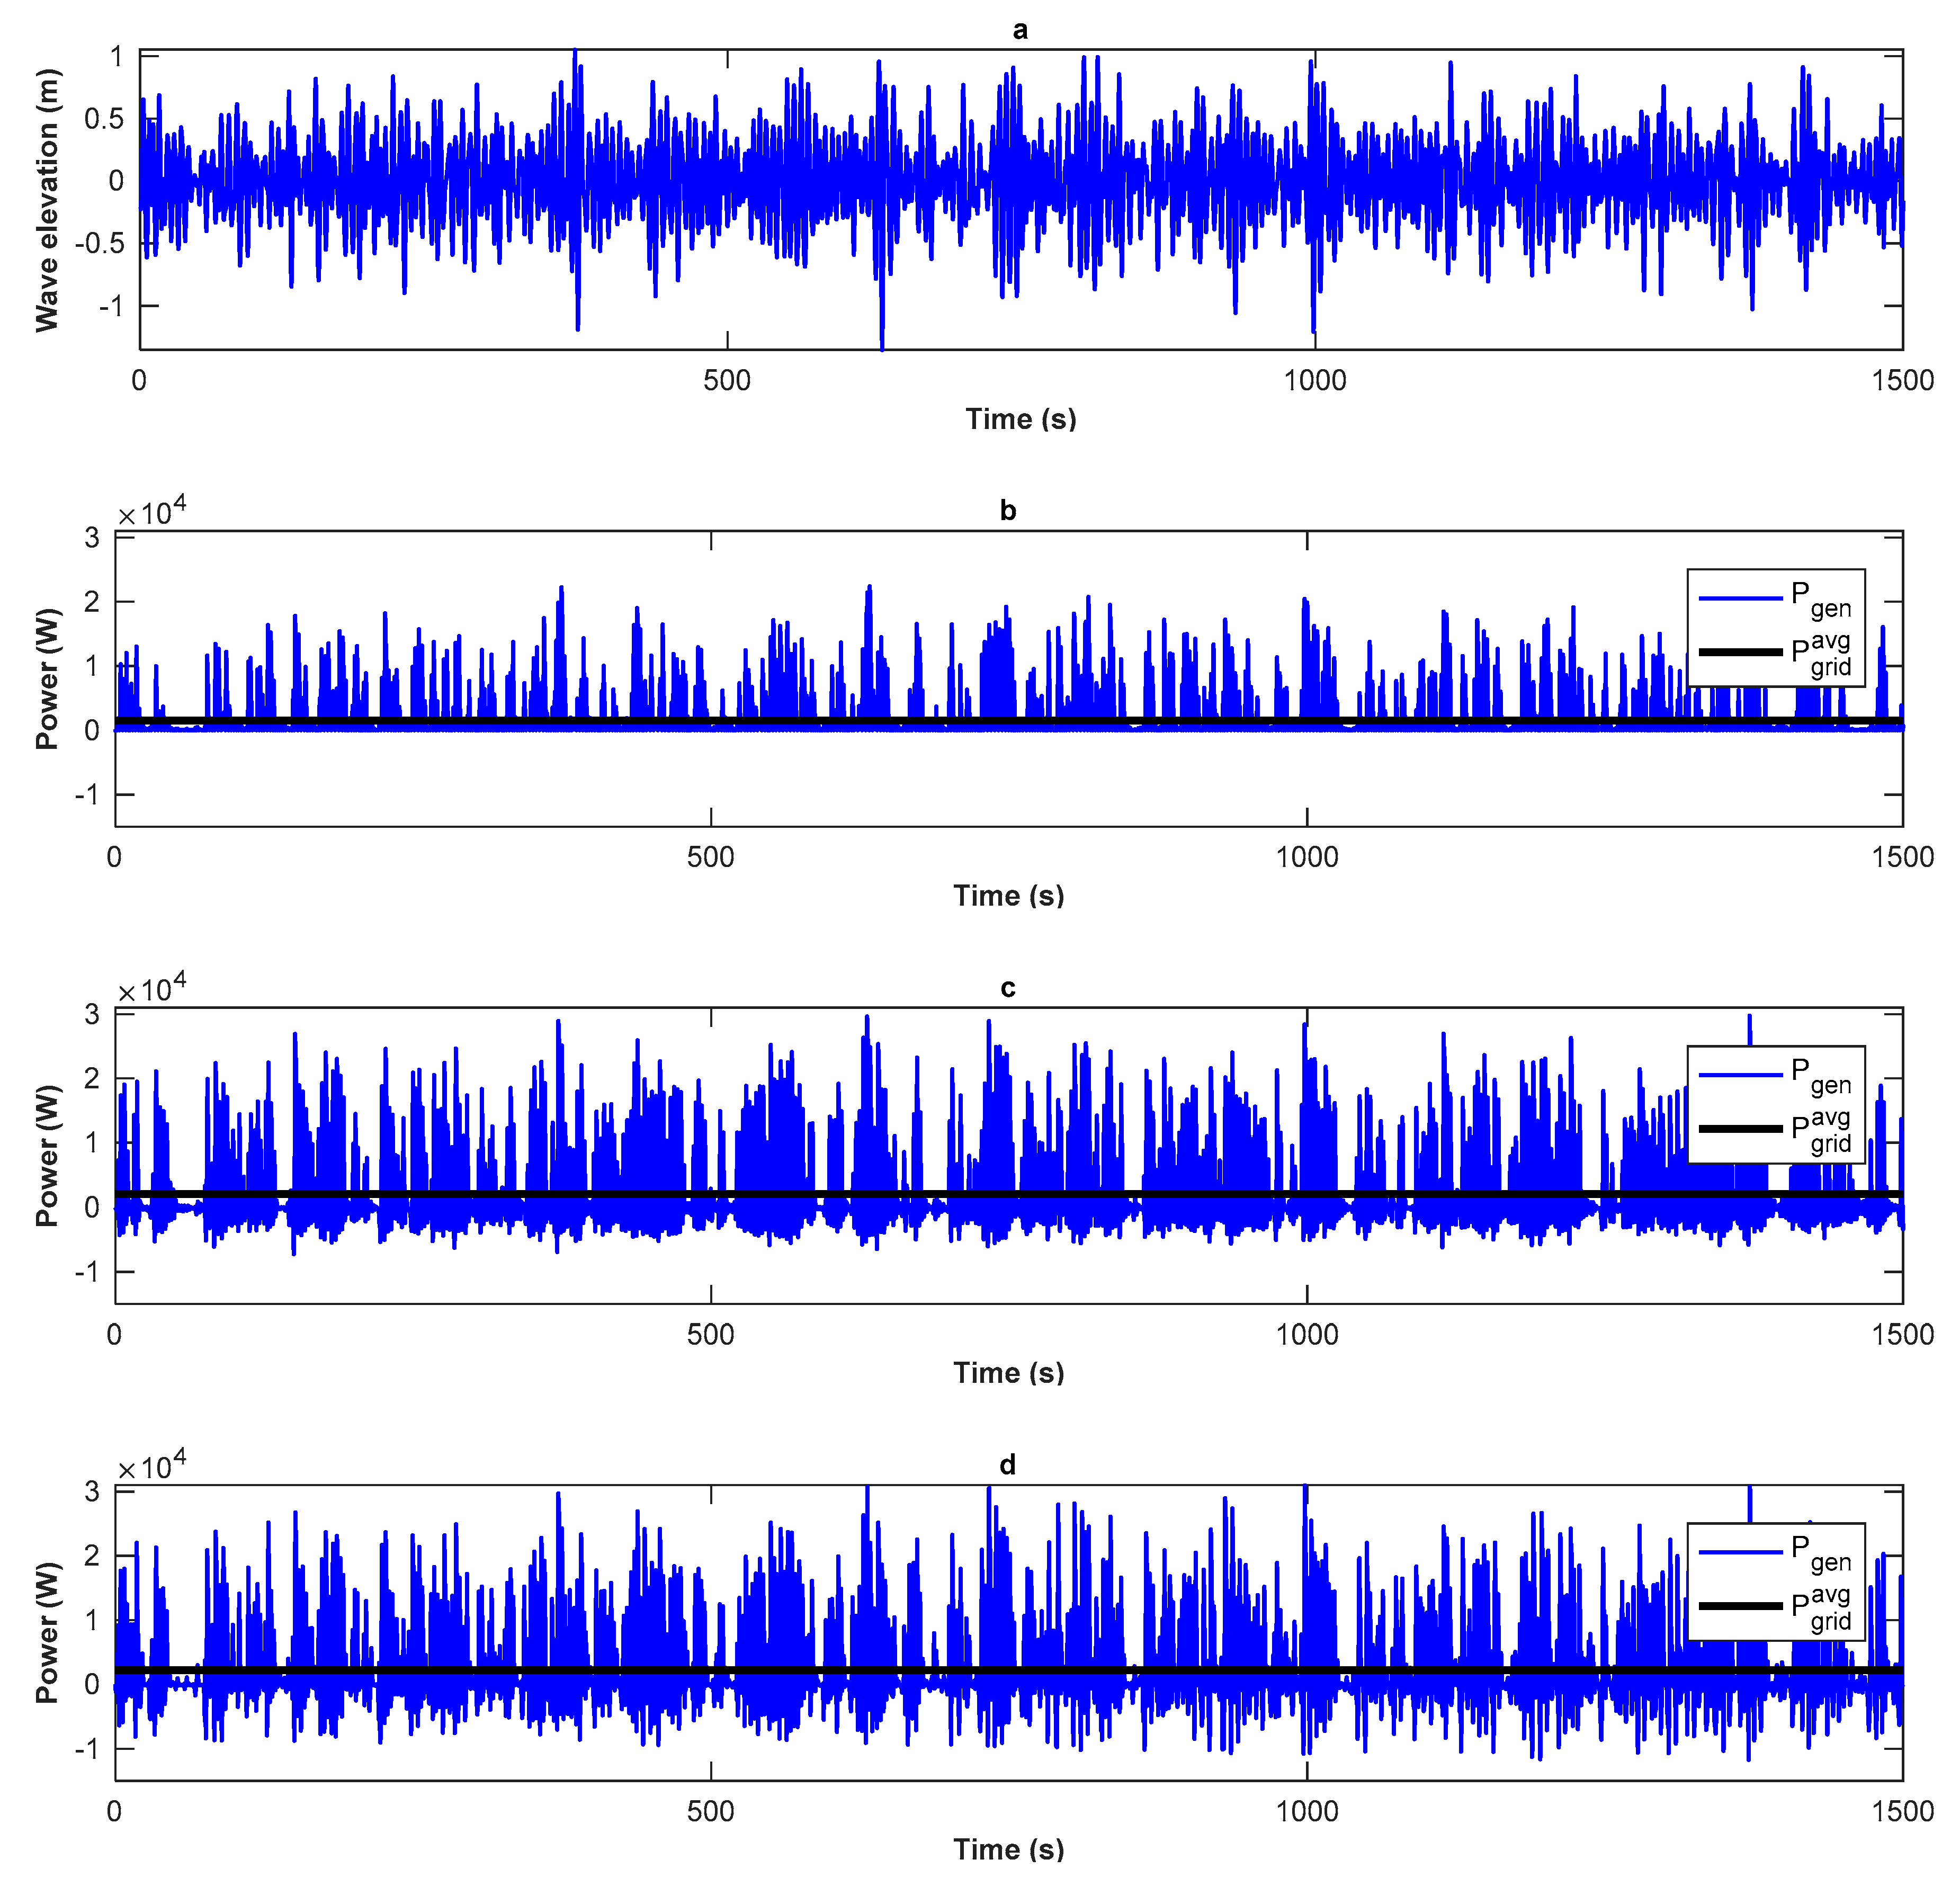
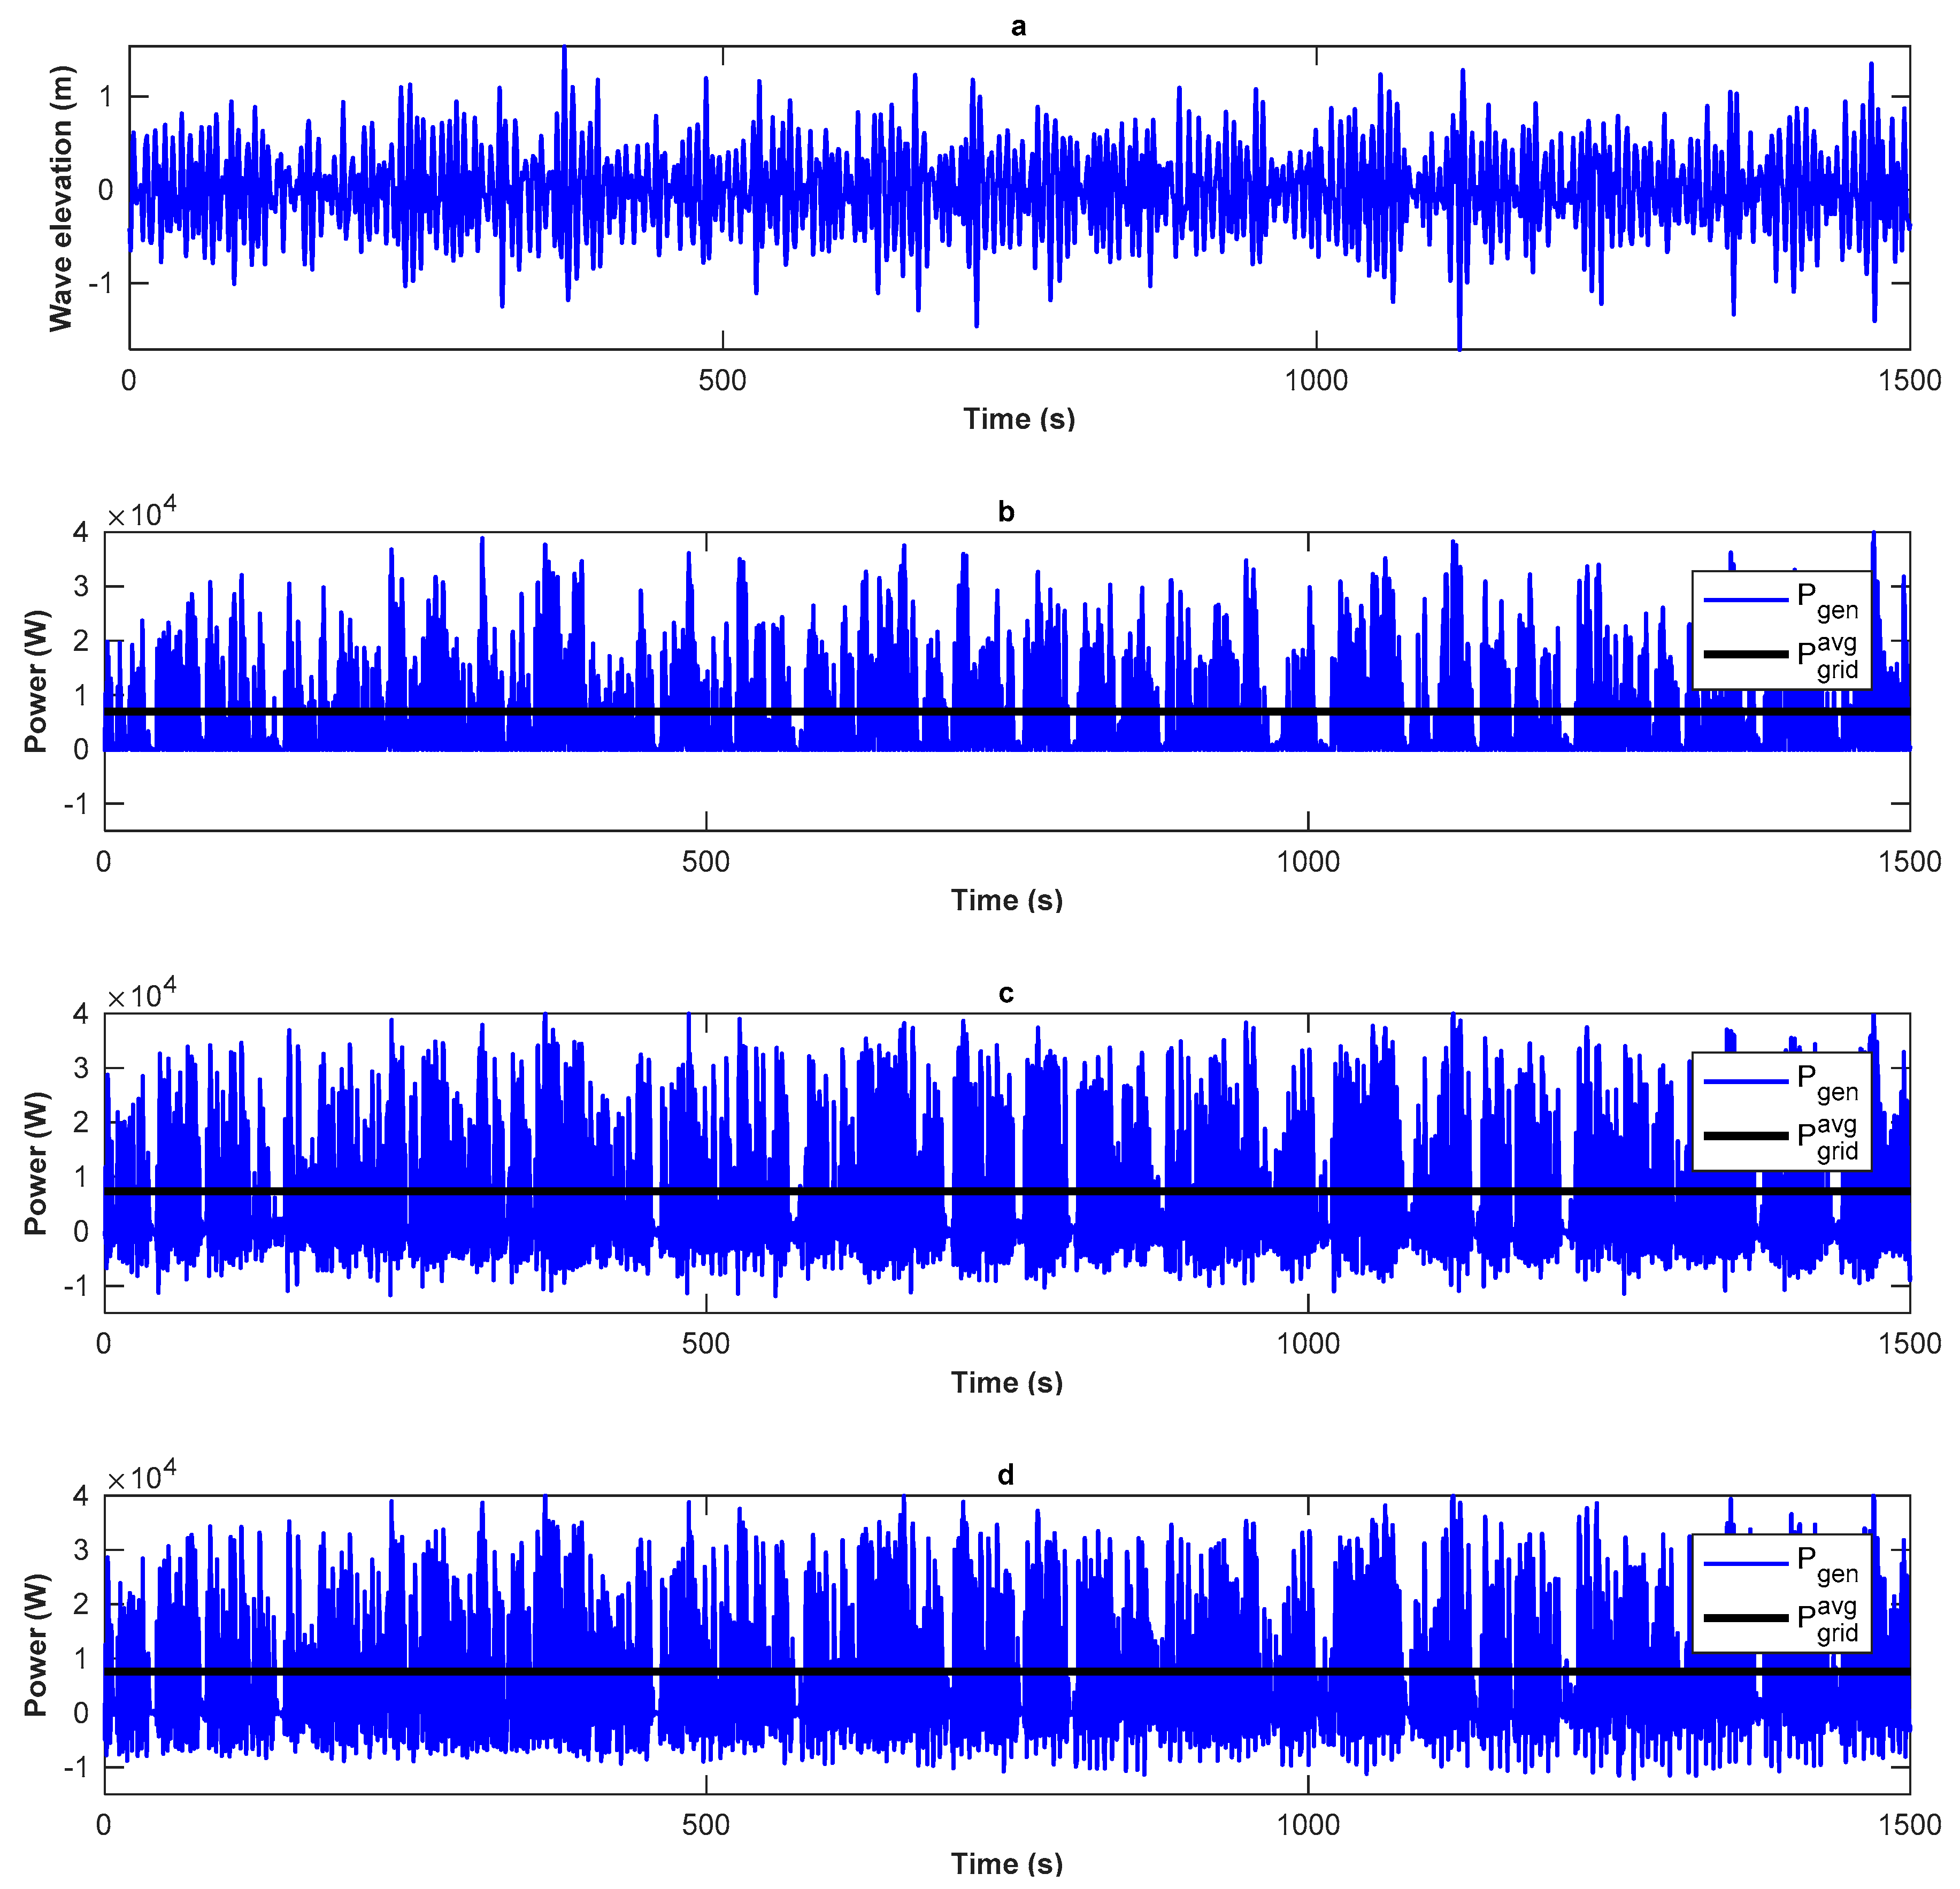
The realistic test case of the dominant operation sea state is based on the area of China around the Zhoushan Islands, which is presented in [32]. The average annual significant wave height is 1.45 m and the energy period is 6 s, which is representative of that area in China. The controllers tested in this section are optimized as described in Section 3 and are compared using a JONSWAP spectrum of the same significant wave height and energy period but randomized. Figure 16 presents the results of a 1500 s simulation for the RdC Gradient Descent, RsdC Gradient Descent and VelC vgrid controllers.
The results in Figure 16 show that the VelC requires significantly more negative power to increase the WEC efficiency compared to the RsdC. The average negative power for the VelC is 1.933 kW, whereas for RsdC it is 1.625 kW. The simulation results shown in Figure 16 are summarized in Table 9. It is noteworthy to mention that the P g e n r a t i o of the VelC is smaller than for both the RdC and RsdC, making the VelC case a cost-effective alternative. In the simulations presented in Figure 16, the displacement of the buoy was always below 90% of the pazmax, and FES was zero in all cases. On the other hand, the power limitation system was enabled in the VelC vgrid only at 630 s, 733 s, 998 s and 1371 s, in order to keep the instantaneous power output below 30 kW. Despite the power limitation system being enabled, the VelC vgrid achieved the lowest P g e n r a t i o and the highest W2G efficiency.
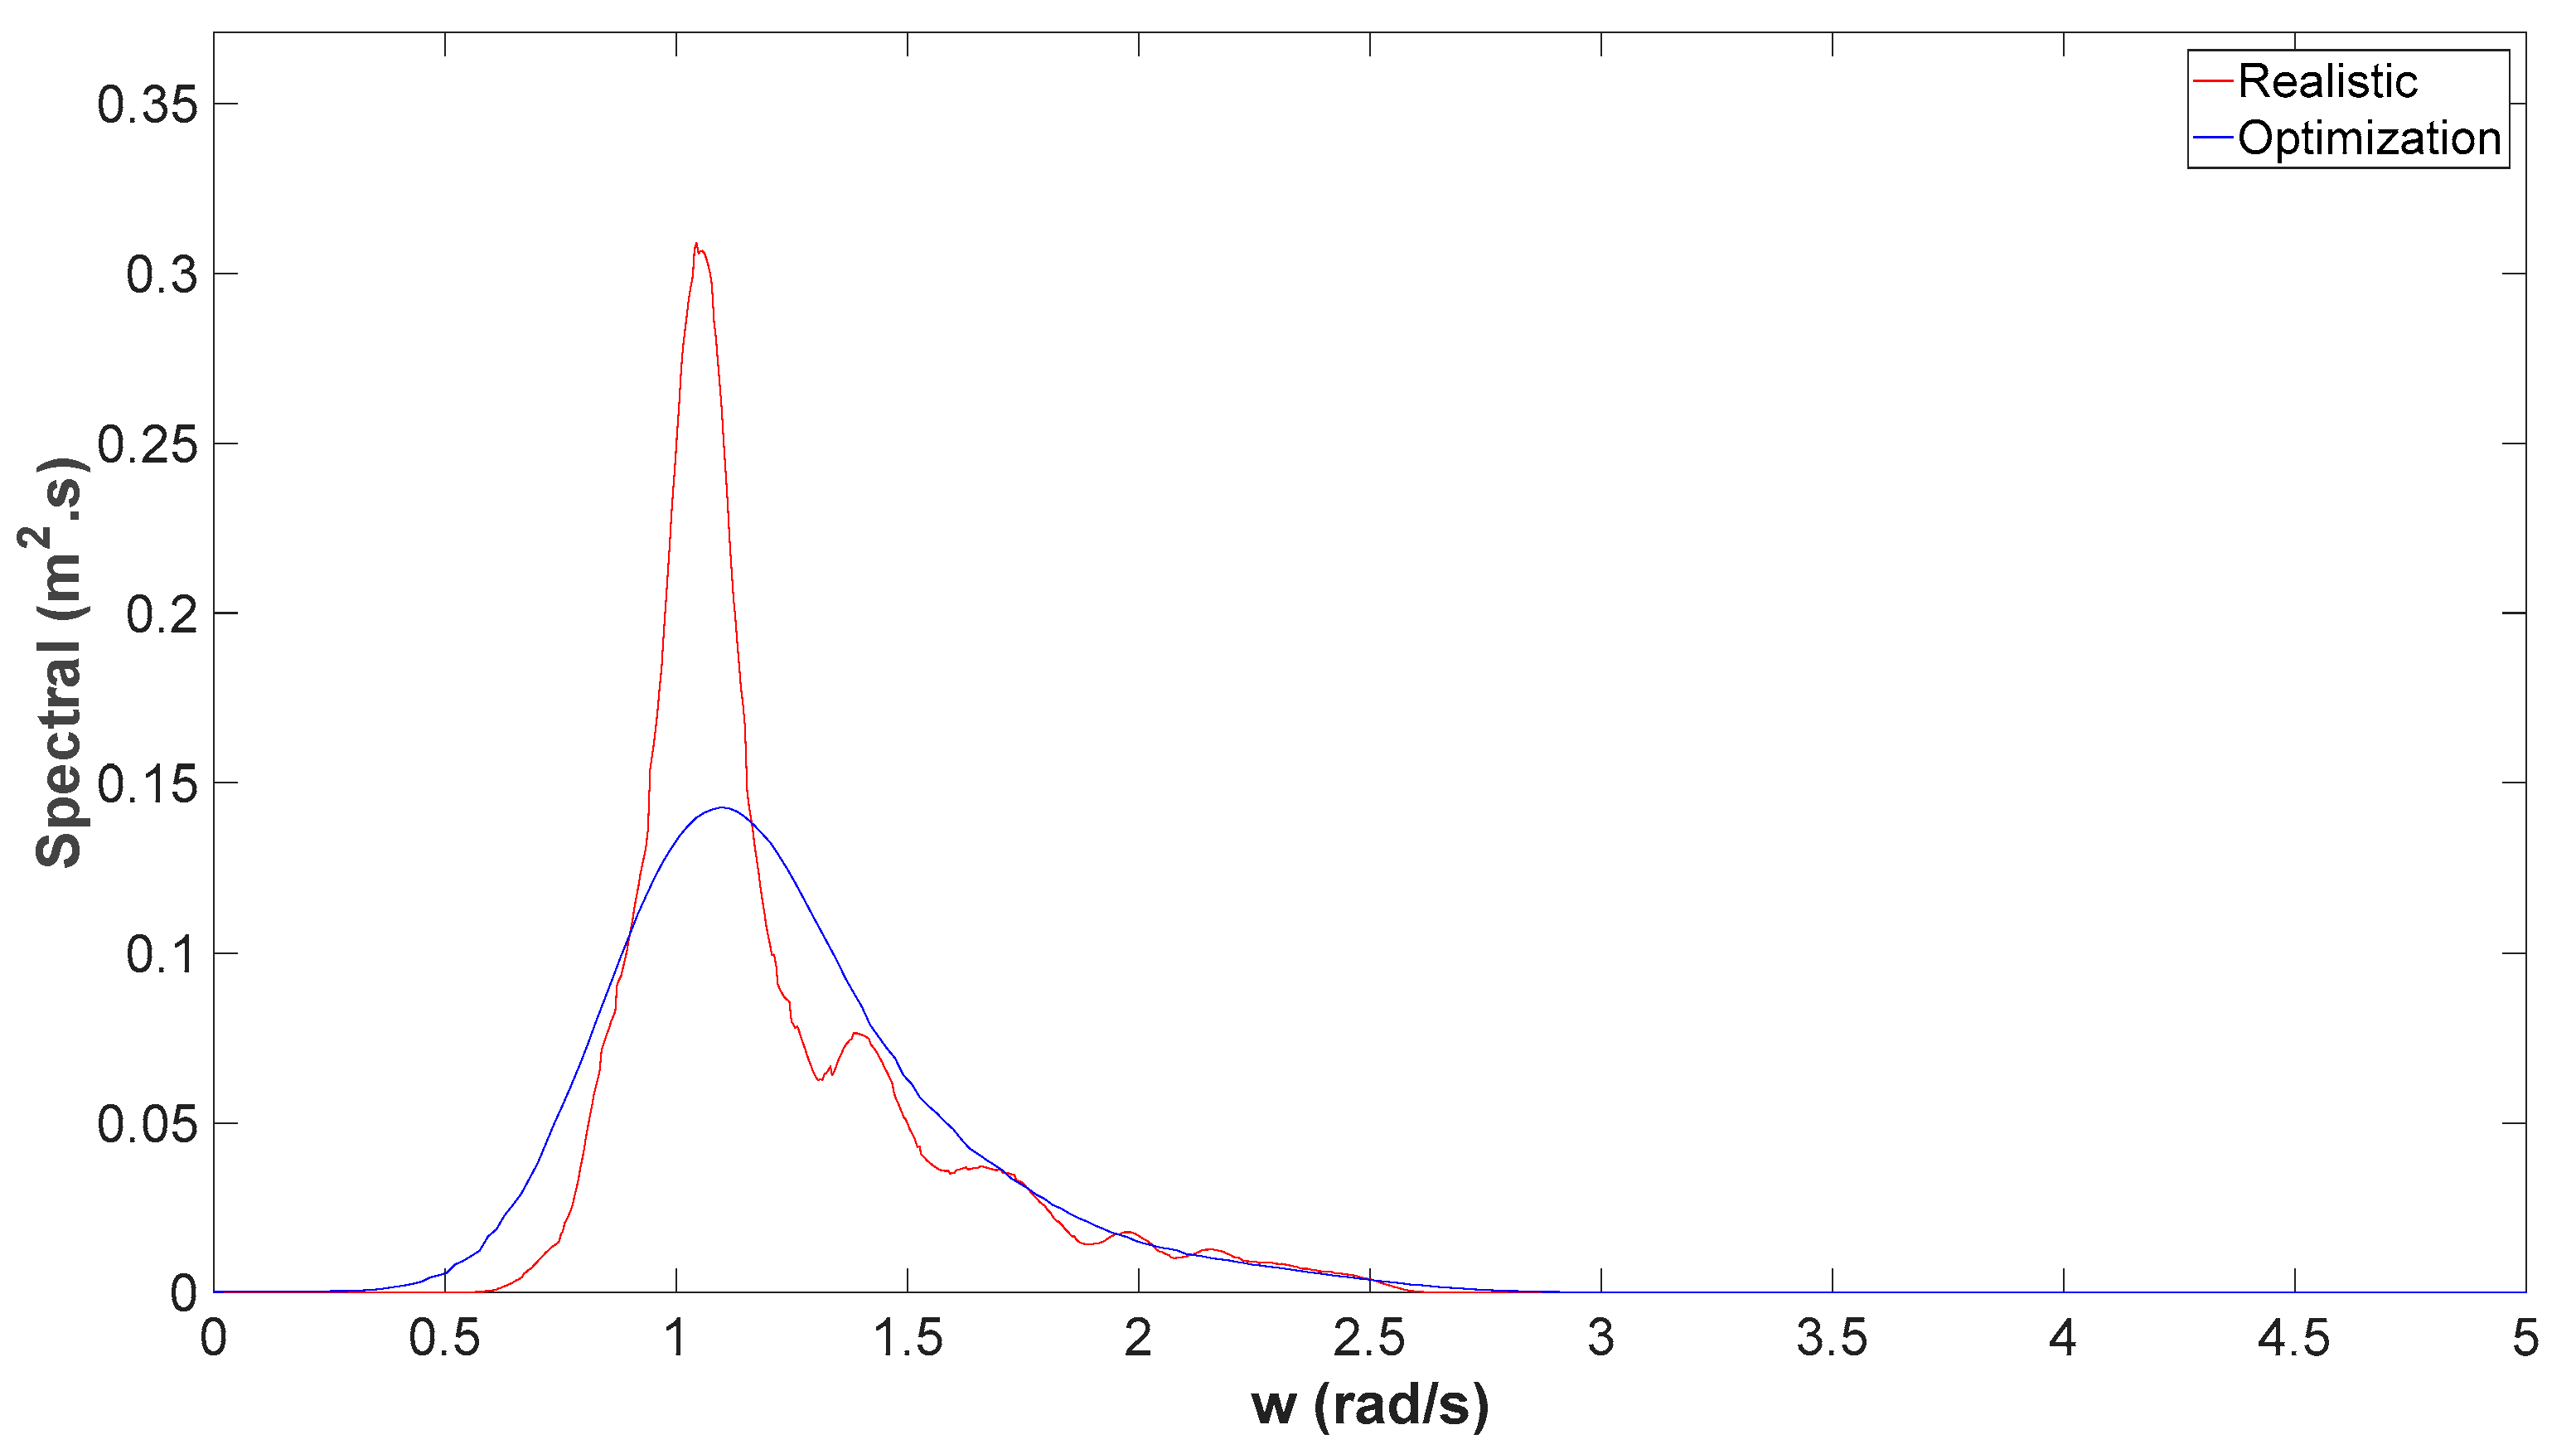
Figure 17 compares the spectral density of the wave energy resource in which the controllers were optimized and the spectral density of the wave energy resource the controllers were tested in the realistic test case.
It is observed that, despite the fact that the controllers were optimized in a wave energy resource that did not capture the peak spectral density, the efficiencies achieved in the 1500 s simulation were similar to those presented in Section 3, for which the controllers were tested in the resource they were optimized for. This shows that the controllers can efficiently operate in an environment that they were not optimized for, and that optimizing for one case does not restrict their ability to be efficient in a different wave energy resource.

4.2. High-Energy Sea State

In this Section the controllers are tested in a low occurrence high-energy sea state of the Zhoushan Islands. For the generation of the high-energy wave resource, the JONSWAP spectrum with significant wave height of 1.95 m and an energy period of 7 s is selected. This spectrum leads to a wave power potential per km 2.1 times larger than the dominant operation sea state. Figure 18 presents the 1500 s simulation results for the low occurrence high-energy sea state.
The results show a significant increase in the relative wave power generation in a high-energy sea state. The instantaneous wave power generation in all three cases, tested and shown in Figure 18, surpasses the 30 kW limit set by the power limitation mechanism discussed in Section 2.2. This demonstrates the difficulty of implementing a braking system only to limit the peak power generation in a WEC system that operates under high-energy wave conditions. Regarding the displacement constraint, the end-stop system was enabled a few times in all three cases, effectively limiting the displacement below pazmax. A summary of the results of the simulations presented in Figure 18 is given in Table 10. The peak-to-average ratio is kept a lot lower, almost half, compared to the averaged conditions tested in Section 4.1, and the efficiencies of all three controllers are significantly higher. Comparing the different controllers, it is observed that the trend is the same despite the fact that the controller settings are for averaged conditions. The VelC vgrid controller has the highest W2G efficiency and the lowest peak-to-average power ratio. The RsdC Gradient Descent Controller achieves a good efficiency, 0.78% more compared to the RdC Gradient Descent, but has the highest peak-to-average power ratio.

5. Conclusions

In this paper, a comprehensive method for optimizing three different W2G WEC controllers for maximum average power delivery to the connection point is presented. In addition to the optimization procedures and the WEC controller proposed in this paper, a full dynamic resource-to-grid hydrodynamic model is presented in detail, including power transmission and grid connection. A key contribution in this research paper is the proposal for a velocity controller as an alternative controller for WECs that does not require advance knowledge of the waves and frequency measurement of the incoming waves. The velocity controller requires the mass, added mass and linear restoring coefficient of the buoy in order to extract the optimum phase for the velocity. The amplitude of the velocity can be optimized for maximum power capture or maximum power to the grid. The velocity controller is compared with conventional controllers, the real damping controller and the reactive spring-damping controller. An optimization procedure for maximum power exported to the grid for the conventional controllers is also presented, and it shows that more power can be delivered with proper modification to the constant parameters of the reference PTO force generator. The simulation results show that the velocity controller can increase the efficiency of the W2W system more than 5% compared to the real damping controller with lower peak-to-average power ratio, increasing the cost-effectiveness of the components significantly. The RsdC also performs with increased W2G efficiency and the optimization process presented in this paper can improve its W2G efficiency by up to 2% with respect to the reference RsdC, and by more than 4% compared to the reference real damping controller. Finally, in the realistic simulation, it is shown that the optimized controllers can perform with high efficiencies in random environments, and without the need to be trained on a specific wave climate. Future research will focus on minimizing the electrical and mechanical stresses on highly energetic sea states by making the controller aware of the displacement and current constraints and a method to re-optimize the controllers presented during operation if the wave climate changes.

Author Contributions

Conceptualization, M.C.S.; Formal analysis, M.C.S.; Funding acquisition, J.S.; Investigation, M.C.S.; Methodology, M.C.S.; Project administration, J.S.; Supervision, J.S.; Visualization, M.C.S.; Writing—original draft, M.C.S.; Writing—review & editing, J.S.

Funding

The authors would like to acknowledge the support of the EPSRC in funding the work within this paper as part of the Joint UK–China Offshore Renewable Energy programme (EP/R007756/1).

Acknowledgments

The authors would like to acknowledge the support received for the hydrodynamic simulations by Richard Crozier and for the training of Edinburgh Wave Systems Toolbox.

Conflicts of Interest

The authors declare no conflict of interest. The funders had no role in the design of the study; in the collection, analyses, or interpretation of data; in the writing of the manuscript, or in the decision to publish the results.

References

  1. Ruud, K.; Frank, N. Wave Energy Technology Brief; International Renewable Energy Agency (IRENA): Abu Dhabi, UAE, 2014. [Google Scholar]
  2. World Energy Council. World Energy Council World Energy Resources | 2016; World Energy Council: London, UK, 2016; Volume 24. [Google Scholar]
  3. Al Shami, E.; Zhang, R.; Wang, X. Point absorber wave energy harvesters: A review of recent developments. Energies 2019, 12, 47. [Google Scholar] [CrossRef]
  4. Aderinto, T.; Li, H. Ocean Wave energy converters: Status and challenges. Energies 2018, 11, 1250. [Google Scholar] [CrossRef]
  5. Mueller, M.A. Electrical generators for direct drive wave energy converters. IEE Proc. Gener. Transm. Distrib. 2002, 149, 446–456. [Google Scholar] [CrossRef]
  6. Mendes, R.; Calado, M.; Mariano, S. Maximum Power Point Tracking for a Point Absorber Device with a Tubular Linear Switched Reluctance Generator. Energies 2018, 11, 2192. [Google Scholar] [CrossRef]
  7. Penalba, M.; Ringwood, J.V. A high-fidelity wave-to-wire model for wave energy converters. Renew. Energy 2019, 134, 367–378. [Google Scholar] [CrossRef]
  8. Balitsky, P.; Quartier, N.; Verao Fernandez, G.; Stratigaki, V.; Troch, P. Analyzing the Near-Field Effects and the Power Production of an Array of Heaving Cylindrical WECs and OSWECs Using a Coupled Hydrodynamic-PTO Model. Energies 2018, 11, 3489. [Google Scholar] [CrossRef]
  9. Tedeschi, E.; Santos-Mugica, M. Modeling and Control of a Wave Energy Farm Including Energy Storage for Power Quality Enhancement: The Bimep Case Study. IEEE Trans. Power Syst. 2014, 29, 1489–1497. [Google Scholar] [CrossRef]
  10. Tedeschi, E.; Molinas, M. Tunable Control Strategy for Wave Energy Converters With Limited Power Takeoff Rating. IEEE Trans. Ind. Electron. 2012, 59, 3838–3846. [Google Scholar] [CrossRef]
  11. Sjolte, J.; Sandvik, C.M.; Tedeschi, E.; Molinas, M. Exploring the potential for increased production from the wave energy converter lifesaver by reactive control. Energies 2013, 6, 3706–3733. [Google Scholar] [CrossRef]
  12. Ringwood, J.V.; Bacelli, G.; Fusco, F. Energy-Maximizing Control of Wave-Energy Converters: The Development of Control System Technology to Optimize Their Operation. IEEE Control Syst. 2014, 34, 30–55. [Google Scholar]
  13. Li, B. Reaction Force Control Implementation of a Linear Generator in Irregular Waves for a Wave Power System. Ph.D. Thesis, The University of Edinburgh, Edinburgh, Scotland, 2012. [Google Scholar]
  14. Shek, J.K.H.; Macpherson, D.E.; Mueller, M.A.; Xiang, J. Reaction force control of a linear electrical generator for direct drive wave energy conversion. IET Renew. Power Gener. 2007, 1, 17–24. [Google Scholar] [CrossRef] [Green Version]
  15. Garcia-Rosa, P.B.; Ringwood, J.V.; Fosso, O.; Molinas, M. The impact of time-frequency estimation methods on the performance of wave energy converters under passive and reactive control. IEEE Trans. Sustain. Energy 2018, PP, 1. [Google Scholar] [CrossRef]
  16. Park, J.S.; Gu, B.-G.; Kim, J.R.; Cho, I.H.; Jeong, I.; Lee, J. Active Phase Control for Maximum Power Point Tracking of a Linear Wave Generator. IEEE Trans. Power Electron. 2017, 32, 7651–7662. [Google Scholar] [CrossRef]
  17. Faedo, N.; Olaya, S.; Ringwood, J.V. Optimal control, MPC and MPC-like algorithms for wave energy systems: An overview. IFAC J. Syst. Control 2017, 1, 37–56. [Google Scholar] [CrossRef] [Green Version]
  18. Fusco, F.; Ringwood, J.V. A Simple and Effective Real-Time Controller for Wave Energy Converters. IEEE Trans. Sustain. Energy 2013, 4, 21–30. [Google Scholar] [CrossRef]
  19. Ammar, R.; Trabelsi, M.; Mimouni, M.F.; Ben Ahmed, H.; Benbouzid, M. Flux weakening control of PMSG based on direct wave energy converter systems. In Proceedings of the IEEE 2017 International Conference on Green Energy Conversion Systems (GECS), Hammamet, Tunisia, 23–25 March 2017; pp. 1–7. [Google Scholar]
  20. O’Sullivan, A.C.M.; Lightbody, G. Co-design of a wave energy converter using constrained predictive control. Renew. Energy 2017, 102, 142–156. [Google Scholar] [CrossRef]
  21. Falcão, A.F.O.; Henriques, J.C.C. Effect of non-ideal power take-off efficiency on performance of single- and two-body reactively controlled wave energy converters. J. Ocean Eng. Mar. Energy 2015, 1, 273–286. [Google Scholar] [CrossRef] [Green Version]
  22. Genest, R.; Bonnefoy, F.; Clément, A.H.; Babarit, A. Effect of non-ideal power take-off on the energy absorption of a reactively controlled one degree of freedom wave energy converter. Appl. Ocean Res. 2014, 48, 236–243. [Google Scholar] [CrossRef] [Green Version]
  23. Hansen, R.H. Design and Control of the PowerTake-Off System for a Wave Energy Converter with Multiple Absorbers. Ph.D. Thesis, Aalborg University, Esbjerg Aalborg, Denmark, 2013. [Google Scholar]
  24. Wang, L.; Isberg, J.; Tedeschi, E. Review of control strategies for wave energy conversion systems and their validation: The wave-to-wire approach. Renew. Sustain. Energy Rev. 2018, 81, 366–379. [Google Scholar] [CrossRef]
  25. Penalba, M.; Cortajarena, J.A.; Ringwood, J.V. Validating a wave-to-wire model for a wave energy converter-part II: The electrical system. Energies 2017, 10, 1002. [Google Scholar] [CrossRef]
  26. Kovaltchouk, T.; Rongère, F.; Primot, M.; Aubry, J.; Ben Ahmed, H.; Multon, B. Model Predictive Control of a Direct Wave Energy Converter Constrained by the Electrical Chain using an Energetic Approach. In Proceedings of the European Wave and Tidal Energy Conference, Nantes, France, 6–11 September 2015. [Google Scholar]
  27. Xiao, X.; Huang, X.; Kang, Q. A Hill-Climbing-Method-Based Maximum-Power-Point-Tracking Strategy for Direct-Drive Wave Energy Converters. IEEE Trans. Ind. Electron. 2016, 63, 257–267. [Google Scholar] [CrossRef]
  28. Sousounis, M.C.; Gan, L.K.; Kiprakis, A.E.; Shek, J.K.H. Direct drive wave energy array with offshore energy storage supplying off-grid residential load. IET Renew. Power Gener. 2017, 11, 1081–1088. [Google Scholar] [CrossRef]
  29. Crozier, R. RenewNet Foundry 1.6. Available online: https://sourceforge.net/projects/rnfoundry/ (accessed on 18 March 2019).
  30. Polinder, H.; Slootweg, J.G.; Hoeijmakers, M.J.; Compter, J.C. Modelling of a linear PM machine including magnetic saturation and end effects: Maximum force to current ratio. IEEE Trans. Ind. Appl. 2003, 39, 1681–1688. [Google Scholar] [CrossRef]
  31. Wu, B.; Lang, Y.; Zargari, N.; Kouro, S. Power Converters in Wind Energy Conversion Systems. In Power Conversion and Control of Wind Energy Systems; John Wiley & Sons, Inc.: Hoboken, NJ, USA, 2011; pp. 87–152. [Google Scholar]
  32. Wan, Y.; Fan, C.; Zhang, J.; Meng, J.; Dai, Y.; Li, L.; Sun, W.; Zhou, P.; Wang, J.; Zhang, X. Wave energy resource assessment off the coast of China around the Zhoushan Islands. Energies 2017, 10, 1320. [Google Scholar] [CrossRef]
Figure 1. The conversion of power at each stage for different concepts of PTO systems in point absorber WECs.
Energies 12 02948 g001
Figure 2. Wave-to-wire WEC model developed primarily in MATLAB/Simulink. The hydrodynamic simulations were performed in NEMOH. The model incorporates a DD All-Electric PTO system, system constraints, power transmission and grid connection.
Energies 12 02948 g002
Figure 3. Mesh design for the submerged part of a cylindrical buoy generated by EWST to perform NEMOH hydrodynamic simulation. (a) NEMOH mesh of the cylindrical buoy. The center of gravity (CoG) is visible; (b) Refined mesh of the cylindrical buoy with the normal pointing out. The center of buoyancy (CoB) is visible.
Energies 12 02948 g003
Figure 4. Hydrodynamic simulation outputs as a function of wave frequency for the cylindrical buoy of Figure 3: (a) Added mass; (b) Radiation damping.
Energies 12 02948 g004
Figure 5. (a) Block diagram of the mechanical mass-spring-damper model of the single buoy point absorber described in (1) developed in MATLAB/Simulink; (b) Diagram of the WEC and PTO configuration. All forces are acting on the heaving buoy (one degree of freedom).
Energies 12 02948 g005
Figure 6. Block diagram of the Voltage Oriented Controller as it was implemented in MATLAB/Simulink. The point of measurement for the electrical quantities is at the low voltage side of the power transmission transformer after the grid-side filter.
Energies 12 02948 g006
Figure 7. Block diagrams of (a) generator-side control strategy and (b) zero d-axis controller.
Energies 12 02948 g007
Figure 8. Simulation results using the RdC method: (a) Wave resource used as input; (b) Reference and actual PTO force; (c) Phase comparison between the velocity and wave excitation force; (d) Instantaneous generator power and average hydrodynamic, generator and grid power.
Energies 12 02948 g008
Figure 9. Grid search optimization of b R d C and k c R d C to maximize (a) hydrodynamic power P h y d r o a v g ; (b) PMLG power P g e n a v g ; and (c) power exported to the grid P g r i d a v g .
Energies 12 02948 g009
Figure 10. Simulation results using the RsdC method. (a) Wave resource used as input; (b) Reference and actual PTO force; (c) Phase comparison between the velocity and wave excitation force; (d) Instantaneous generator power and average hydrodynamic, generator and grid power.
Energies 12 02948 g010
Figure 11. Grid search optimization of b R s d C and k c R s d C to maximize: (a) Hydrodynamic power P h y d r o a v g ; (b) PMLG power P g e n a v g ; (c) Power exported to the grid P g r i d a v g ; (d) Power exported to the grid with overlapped peak power points of hydrodynamic and PMLG output.
Energies 12 02948 g011
Figure 12. Block diagram of the velocity controller.
Energies 12 02948 g012
Figure 13. Two different approaches for the Look-up table of Velocity Amplitude Control.
Energies 12 02948 g013
Figure 14. Simulation results using the vlinear VelC. (a) Wave resource used as input; (b) Reference and actual PTO force; (c) Phase comparison between the velocity and wave excitation force; (d) Instantaneous generator power and average hydrodynamic, generator and grid power.
Energies 12 02948 g014
Figure 15. Optimized Look-up table, vgrid, of the VelC for maximum P g r i d a v g in a specific wave climate. Comparison of vgrid with vlinear and vconstant.
Energies 12 02948 g015
Figure 16. Results from a 1500 s simulation. (a) Wave resource input generated from JONSWAP spectrum with significant wave height 1.45 m and energy period 6 s; (b) Instantaneous generator power and averaged grid power for the RdC Gradient Descent case; (c) Instantaneous generator power and averaged grid power for the RsdC Gradient Descent case; (d) Instantaneous generator power and averaged grid power for the VelC vgrid case.
Energies 12 02948 g016
Figure 17. Spectral density of the wave resource used for the optimization of the controllers (blue line) and for the realistic simulation (red line).
Energies 12 02948 g017
Figure 18. Results from a 1500 s simulation for a high-energy sea state. (a) Wave resource input generated from JONSWAP spectrum with significant wave height 1.95 m and energy period 7 s; (b) Instantaneous generator power and averaged grid power for the RdC Gradient Descent case; (c) Instantaneous generator power and averaged grid power for the RsdC Gradient Descent case; (d) Instantaneous generator power and averaged grid power for the VelC vgrid case.
Energies 12 02948 g018
Table 1. Hydrodynamic and point absorber constant parameters for the cylindrical buoy under study.
SymbolQuantityValueUnits
MMass10,630kg
AmAdded mass at 5 rad/s2354kg
bdLinear damping133Ns/m
kcStiffness34,760N/m
wnNatural frequency1.8083rad/s
parBuoy radius1.05m
pahBuoy height4m
F r a t e d Rated mechanical force30,000N
bESEnd-stop damping45Ns/m
kESEnd-stop stiffness11,650N/m
pazmaxTranslator maximum displacement1.5m
Table 2. Permanent magnet linear generator parameters.
SymbolQuantityValueUnits
PratedPMLG rated power30,000W
NtNumber of turns around a tooth250-
τpPole pitch0.1m
ΦFlux in the tooth0.1073Wb
RsStator resistance per phase2.9667Ω
LsStator inductance per phase0.0789H
Table 3. Parameters for the BTB power converters and VOC.
SymbolQuantityValueUnits
fgGrid side frequency50Hz
ω g Grid side angular frequency314rad/s
Vdc*DC link reference voltage800V
Qg*Reactive power reference0var
L g Line inductance0.0019H
RonIGBT on-state resistance0.01493Ω
VceIGBT collector emitter saturation voltage1.9V
Table 4. Parameters of the power transmission system.
SymbolQuantityValueUnits
PgtTransformer nominal power40,000W
VygtWye line RMS nominal voltage400V
VDgtDelta line RMS nominal voltage11,000V
RygtWye resistance0.0058pu
LygtWye inductance0.0612pu
RDgtDelta resistance0.0038pu
LDgtDelta inductance0.0151pu
lCCable length3km
RCCable resistance per km0.223Ω/km
LCCable inductance per km0.43mH/km
CCCable capacitance per km0.24μF/km
Table 5. Summarized Real Damping Controller results.
Method b R d C   ( Ns / m ) k c R d C   ( N / m ) P h y d r o a v g ( kW ) P g e n a v g ( kW ) P g e n r a t i o P g r i d a v g ( kW ) η W 2 W ( % )
Reference27434,7561.9151.69111.051.4707.77
Grid Search014,0502.0071.74711.781.5658.26
Gradient Descent0.0714,1442.0091.74811.761.5668.28
Table 6. Summarized Reactive Spring Damping Controller results.
Method b R s d C   ( Ns / m ) k c R s d C   ( N / m ) P h y d r o a v g   ( kW ) P g e n r a t i o P g e n a v g   ( kW ) P g r i d a v g   ( kW ) η W 2 G   ( % )
Reference27434,7562.65510.522.2542.02510.7
Grid Search P h y d r o a v g −20,00048,0003.08811.582.4442.23511.8
Grid Search P g r i d a v g −300051,0003.04310.782.4992.27212.0
Gradient Descent−574249,4523.04910.842.5012.27712.1
Table 7. Summarized Speed Controller results.
ControllerVariation P h y d r o a v g ( kW ) P g e n a v g ( kW ) P g e n r a t i o P g r i d a v g ( kW ) η W 2 W ( % )
VelCvlinear2.3142.03810.211.8299.67
VelCvconstant3.2142.6239.562.46012.99
VelCvgrid3.3532.64710.222.48913.15
Table 8. Summary of results for all the controller options presented.
ControllerVariation P h y d r o a v g (kW) η h y d r o (%) P g e n a v g (kW) P g r i d a v g (kW) η W 2 W (%) η W 2 W D i f f (%)
RdCReference1.91510.101.6911.4707.770
RdCGrid Search2.00710.531.7471.5658.26+0.49
RdCGradient Descent2.00910.611.7481.5668.28+0.51
RsdCReference2.65514.032.2542.02510.70+2.93
RsdCGrid Search3.04316.082.4992.27212.01+4.24
RsdCGradient Descent3.04916.112.5012.27712.03+4.26
VelCvlinear2.31412.232.0381.8299.67+1.99
VelCvconstant3.21416.982.6232.46012.99+5.22
VelCvgrid3.35317.722.6472.48913.15+5.38
Table 9. Summarized results from the 1500 s random wave simulation for RdC, RsdC and VelC.
ControllerVariation P h y d r o a v g   ( kW ) η h y d r o   ( % ) P g e n a v g   ( kW ) P g e n r a t i o P g r i d a v g   ( kW ) η W 2 G   ( % ) η W 2 G D i f f   ( % )
RdCGradient Descent1.95410.321.70813.051.5148.010
RsdCGradient Descent2.75814.582.24413.262.00510.59+2.58
VelCvgrid2.99915.852.41512.822.23411.81+3.80
Table 10. Summarized results from the 1500 s high-energy low occurrence wave simulation for RdC, RsdC and VelC.
ControllerVariation P h y d r o a v g ( kW ) η h y d r o   ( % ) P g e n a v g ( kW ) P g e n r a t i o P g r i d a v g ( kW ) η W 2 G   ( % ) η W 2 G D i f f   ( % )
RdCGradient Descent8.71422.997.1895.597.01118.490
RsdCGradient Descent9.96926.307.5335.617.30519.27+0.78
VelCvgrid10.11426.687.7395.487.55919.94+1.45