Article

Application of Water Fracturing in Geothermal Energy Mining: Insights from Experimental Investigations

1
College of Construction Engineering, Jilin University, Changchun 130026, China
2
Key Lab of Groundwater Resource and Environment Ministry of Education, Jilin University, Changchun 130026, China
3
Center for Hydrogeology and Environmental Geology Survey, China Geological Survey, Baoding 071051, China
4
Institute of Hydrogeology and Environmental Geology, Chinese Academy of Geological Sciences, Shijiazhuang 050061, China
5
National Hot Dry Rock Technology Innovation Platform Breeding Base, Shijiazhuang 050003, China
*
Authors to whom correspondence should be addressed.
Energies 2019, 12(11), 2138; https://doi.org/10.3390/en12112138
Submission received: 30 April 2019 / Revised: 26 May 2019 / Accepted: 28 May 2019 / Published: 4 June 2019

Abstract

:
Currently, water fracturing under deep geothermal conditions remains poorly understood because the reservoir rocks are usually high-strength crystalline rocks characterized by high temperatures. The aim of this study is to investigate the effects of rock properties, injection rates, and temperatures on hydraulic fracturing behavior and the induced crack characteristics through experimental investigations. A series of hydraulic fracturing experiments was conducted on two Indosinian granite types to investigate the differences in hydraulic fracturing behavior caused by rock properties. Among others, six samples were tested under a room-temperature condition at different injection rates from 1 to 30 mL/min to clarify the effect of the injection rate and three samples were tested under a high-temperature condition (150 °C) to simulate specific geothermal environments. The results indicated that granites with different rock properties have different injection rate thresholds. When the injection rate is below the threshold, the injection pressure finally reached a constant value without fracturing. For rocks with the same properties, the temperature effect can lead to a high injection rate threshold due to the occurrence of thermally-induced cracks. The number of acoustic emission events recorded during the room-temperature experiments increased linearly with increasing injection rate, while high-temperature tests increased sharply. The investigation results imply that a complex hydraulically-induced crack network is expected to be achieved in geothermal reservoirs by a high injection rate or high temperature differences (between injected fluid and rock). Additionally, the characteristics of the hydraulically-induced cracks were investigated by cutting through the sample blocks and measuring the residual pressure. The results indicated that the induced crack aperture can maintain a fluid conductivity of 0.1–0.8 mm/s at a closure pressure of 12 MPa.

1. Introduction

Granite is a common geothermal resource and rock masses whose temperature reaches the standard (150 °C) of hot dry rock (HDR) are almost all granitic. At present, the most effective means for developing HDR resources is the enhanced geothermal system (EGS) [1]. The principle of EGS is to create an artificial crack network that meets the requirements of fluid heat transfer in low-permeability high-temperature rock strata by hydraulic fracturing. Hydraulic fracturing techniques can be subdivided into three major fracturing approaches: (1) water fracturing, (2) hybrid fracturing, and (3) conventional gel-proppant fracturing [2]. Among them, water fracturing treatments have shown the most success in developing HDR systems in granites—e.g., Rosemanowes in the UK (1977–1991), Hijiori in Japan (1981–1986), Basel in Switzerland (2005–2006), and Soultz-sous Forêts in France (1987–present) [3,4,5]. Compared with the traditional hydrocarbon industry, HDR resources are characterized by deeper burial depth and higher temperature, making it difficult to conduct on-site hydraulic fracturing investigations in an EGS environment. Thus, it is important to use laboratory experiments for evaluations.
The experiments by Durham et al. [6] have demonstrated that it is possible for a self-propping fracture in granite to remain open and be significantly conducive to water flow under normal stresses at least as high as 160 MPa, which is a lithostatic load appropriate to mid-crustal depths. The experimental results of Chen et al. [7] indicated that average fracture conductivities of about 10 mDm can be expected for water fracturing in granite at confining pressures greater than 40 MPa. Experimental investigations by Caulk and Kamali-Asl et al. [8,9] found that chemical and physical effects lead to reduced permeability of the self-propping fracture, and thus reduced EGS system longevity. However, compared to the conventional gel fracturing, water fracturing is undoubtedly the most effective method to minimize self-propping fracture damage. In addition, numerical studies by Taherdangkoo et al. [10,11] have indicated that fracturing fluid may invade adjacent aquifers over a long period of time. Therefore, using water fracturing technology is currently the best option to enhance the heat exchange capacity of an HDR reservoir.
The factors affecting hydraulic fracturing in HDR reservoirs include the reservoir properties and conditions (the rock characteristics, the in-situ stress state, the natural fracture system, the formation temperature, etc.) and the construction techniques (injection rate, injection method, fluid viscosity, etc.) [12,13]. The experiments by Zoback et al. [14] indicated that the direction of hydraulic crack propagation was roughly parallel to the direction of the maximum principal stress. However, for a naturally fractured formation, Warpinski and Teufel [15] proposed that the extension of hydraulic fractures across natural fractures depends on the stress state and the location of the pre-existing fracture. The injection rate also has an impact on the fracturing effect. Some researchers proposed an increase in breakdown pressure with increasing injection rate in sandstone [14], shale [16], and granite [17], whereas others reported the opposite [18,19]. For instance, Solberg et al. [19] demonstrated that there was no significant difference in the breakdown pressures when the granite was tested for fracturing at a low injection rate of 0.0198–0.198 mL/min (0.33–3.3 mm3/s). However, some researchers found that rocks could not be hydrofractured with an injection rate lower than 1.5 mL/min (25 mm3/s) for Pocheon granite [20] and 5 mL/min for Strathbogie granite [13]; this is due to the fact that the lowest injection rate highly depends upon the hydraulic parameters of the rocks. In addition, laboratory studies showed that thermal cracking could change rock permeability [21,22], strength [23], elastic moduli [24], and other mechanical properties [25,26]. Although numerous experiments have been conducted to investigate the influencing factors of granite hydraulic fracturing, the results have not been consistent.
In experimental research on hydraulic fracturing of granite, only a limited number of studies have used real rocks and most studies have been conducted with artificial materials including concrete, cement mortar, and Perspex [27,28]. Even with real rock materials, most experiments used small cylindrical specimens (50 mm in diameter and 100 mm in height) for fracturing testing under a pseudo-3D confining pressure state [13,20]. In fracturing tests of such cylindrical samples, it is generally difficult to determine the morphological changes in the crack due to the small size of the sample. In addition, different types of granite subdivisions often have different rock properties, resulting in different fracturing characteristics. This difference in rock properties may be the main reason for the inconsistency in the results of studies investigating the aforementioned influencing factors. In addition, hydraulic fracturing experiments are generally conducted in room-temperature conditions and few studies have examined temperature influences during hydraulic fracturing. Therefore, significant knowledge gaps exist with respect to hydraulic fracturing of granite.
In this study, we conducted a hydraulic fracturing experiment using a true tri-axial test system with a cubic specimen cell of 300 × 300 × 300 mm. The tested granite specimens were collected from the Qiabuqia geothermal field in northwestern China. In order to investigate the effects of the rock properties and injection rate on hydraulic fracturing, we performed hydraulic fracturing tests at different injection rates for monzogranite and granodiorite rocks at room temperature. In order to understand the role of temperature in hydraulic fracturing, we performed a hydraulic fracturing test at 150 °C. Acoustic emission (AE) devices were used to monitor the occurrence of micro-damage inside the rock during the experiments. These combined experimental investigations provide information on the underlying mechanisms of geothermal reservoir rocks in terms of crack geometry, crack conductivity, hydraulically-induced damage, and thermally-induced damage. The results of the study provide reference data for the deep geothermal industry and assist in reservoir stimulation optimization.

2. Background

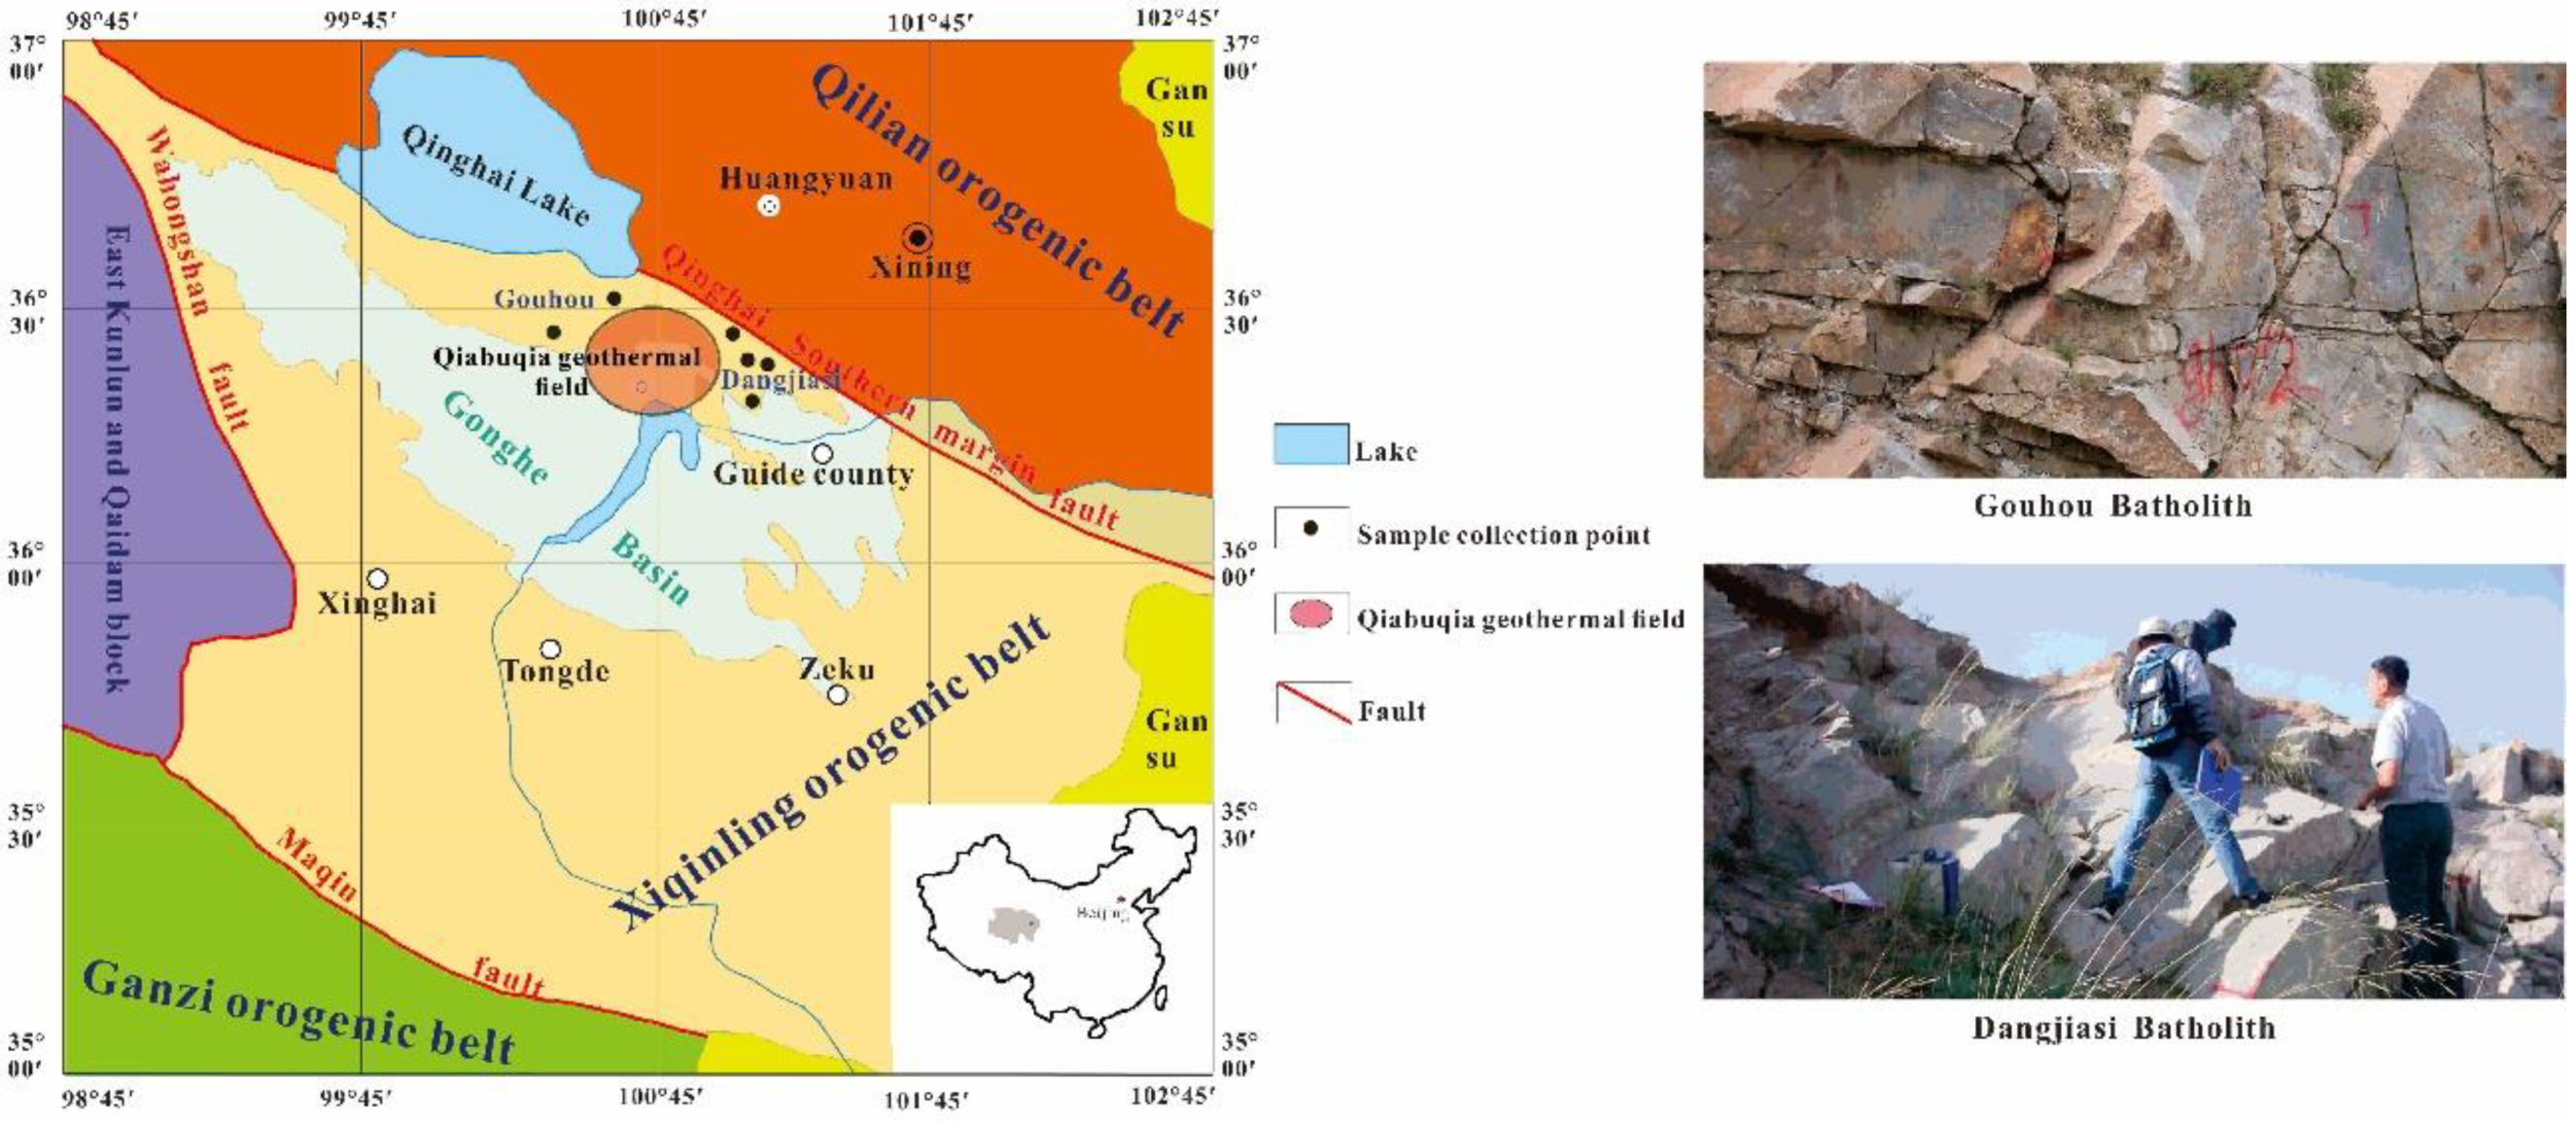
2.1. Geological Setting

The Qiabuqia geothermal field is located in the Gonghe Basin in northwestern China. The basin is surrounded by three orogenic belts: the West Qinling Mountains, the East Kunlun Mountains, and the Qilian Mountains (Figure 1). Due to frequent geological tectonic movement, deep magma invaded the shallow strata through faults in some places, resulting in geothermal anomalies. The high-temperature molten body formed by magma cooling is the heat source for this geothermal area. Existing deep faults are generally used as channels for heat transfer. The prominent features of the geothermal resources formed under such conditions are as follows: a crystalline rock thermal storage medium, and a relatively shallow depth and an obvious localised distribution of resources [29].
Geothermal drilling data have revealed that the granitic strata are mainly located below the depth of 1500 m in the Gonghe Basin in northwestern China, forming the base of the basin and providing a good medium for the storage of geothermal energy. The granitic lithologies are mainly granodiorite (1500–2300 m depth) and monzogranite (below 2300 m) and all are in the Triassic strata (Indosinian granite, T3γ). Three high-temperature geothermal fields have been discovered in the basin and the Qiabuqia geothermal field is the most famous. The formation temperature of the Qiabuqia geothermal field reached 150 °C at a depth of 2500 m, suggesting that there are abundant geothermal resources available for exploitation.

2.2. Experiment Material

The specimens of the Indosinian granite were obtained from the outcrop rock formation of the Qiabuqia geothermal field. The granodiorite samples were obtained from the Gouhou batholith and the monzogranite samples were collected from the Dangjiasi batholith. Due to the difficulty in collecting samples from the outcrops of the Gouhou batholith, only two pieces of the granodiorite samples were used for the fracturing test. Figure 2 shows the two collected granite types. Both granite types are fine-to medium-grained granite and the monzogranite has a coarser heterogeneous structure. Both granite types have similar mineralogy and the major mineral constituents are quartz, plagioclase feldspar, K-feldspar, and biotite with slightly different compositions, which were determined with the powder X-ray diffraction (XRD) method. The physical, petrographic, and mechanical properties of the granites are presented in Table 1.
As presented in Table 1, monzogranite is a moderately strong granite type (i.e., uniaxial compressive strength (UCS) of 131.0 MPa and elastic modulus of 40.7–43.5 GPa) with low porosity (2.49%), whereas the granodiorite is a comparatively weak granite (i.e., UCS of 109.0 MPa and elastic modulus of 32.6–35.6 GPa) with slightly higher porosity (4.59%). This is mainly due to the coarser texture, less weathering (few clay minerals) and fewer pre-existing microcracks in the monzogranite specimens. As shown in Figure 3, the microscopic features of the two types of granite were identified by scanning electron microscopy (SEM). It is evident that there are many natural microcracks in the granodiorite matrix, whereas there are more micropores in the monzogranite and the microcracks mainly occur around the large mineral grains. Thus, the selection of these two types of granite with similar mineralogy enabled us to understand the effect of natural microcracks on hydraulic fracturing. However, since the lithology of the target reservoir is a monzogranite, seven samples of the monzogranite and two granodiorite samples were used in the fracturing test.

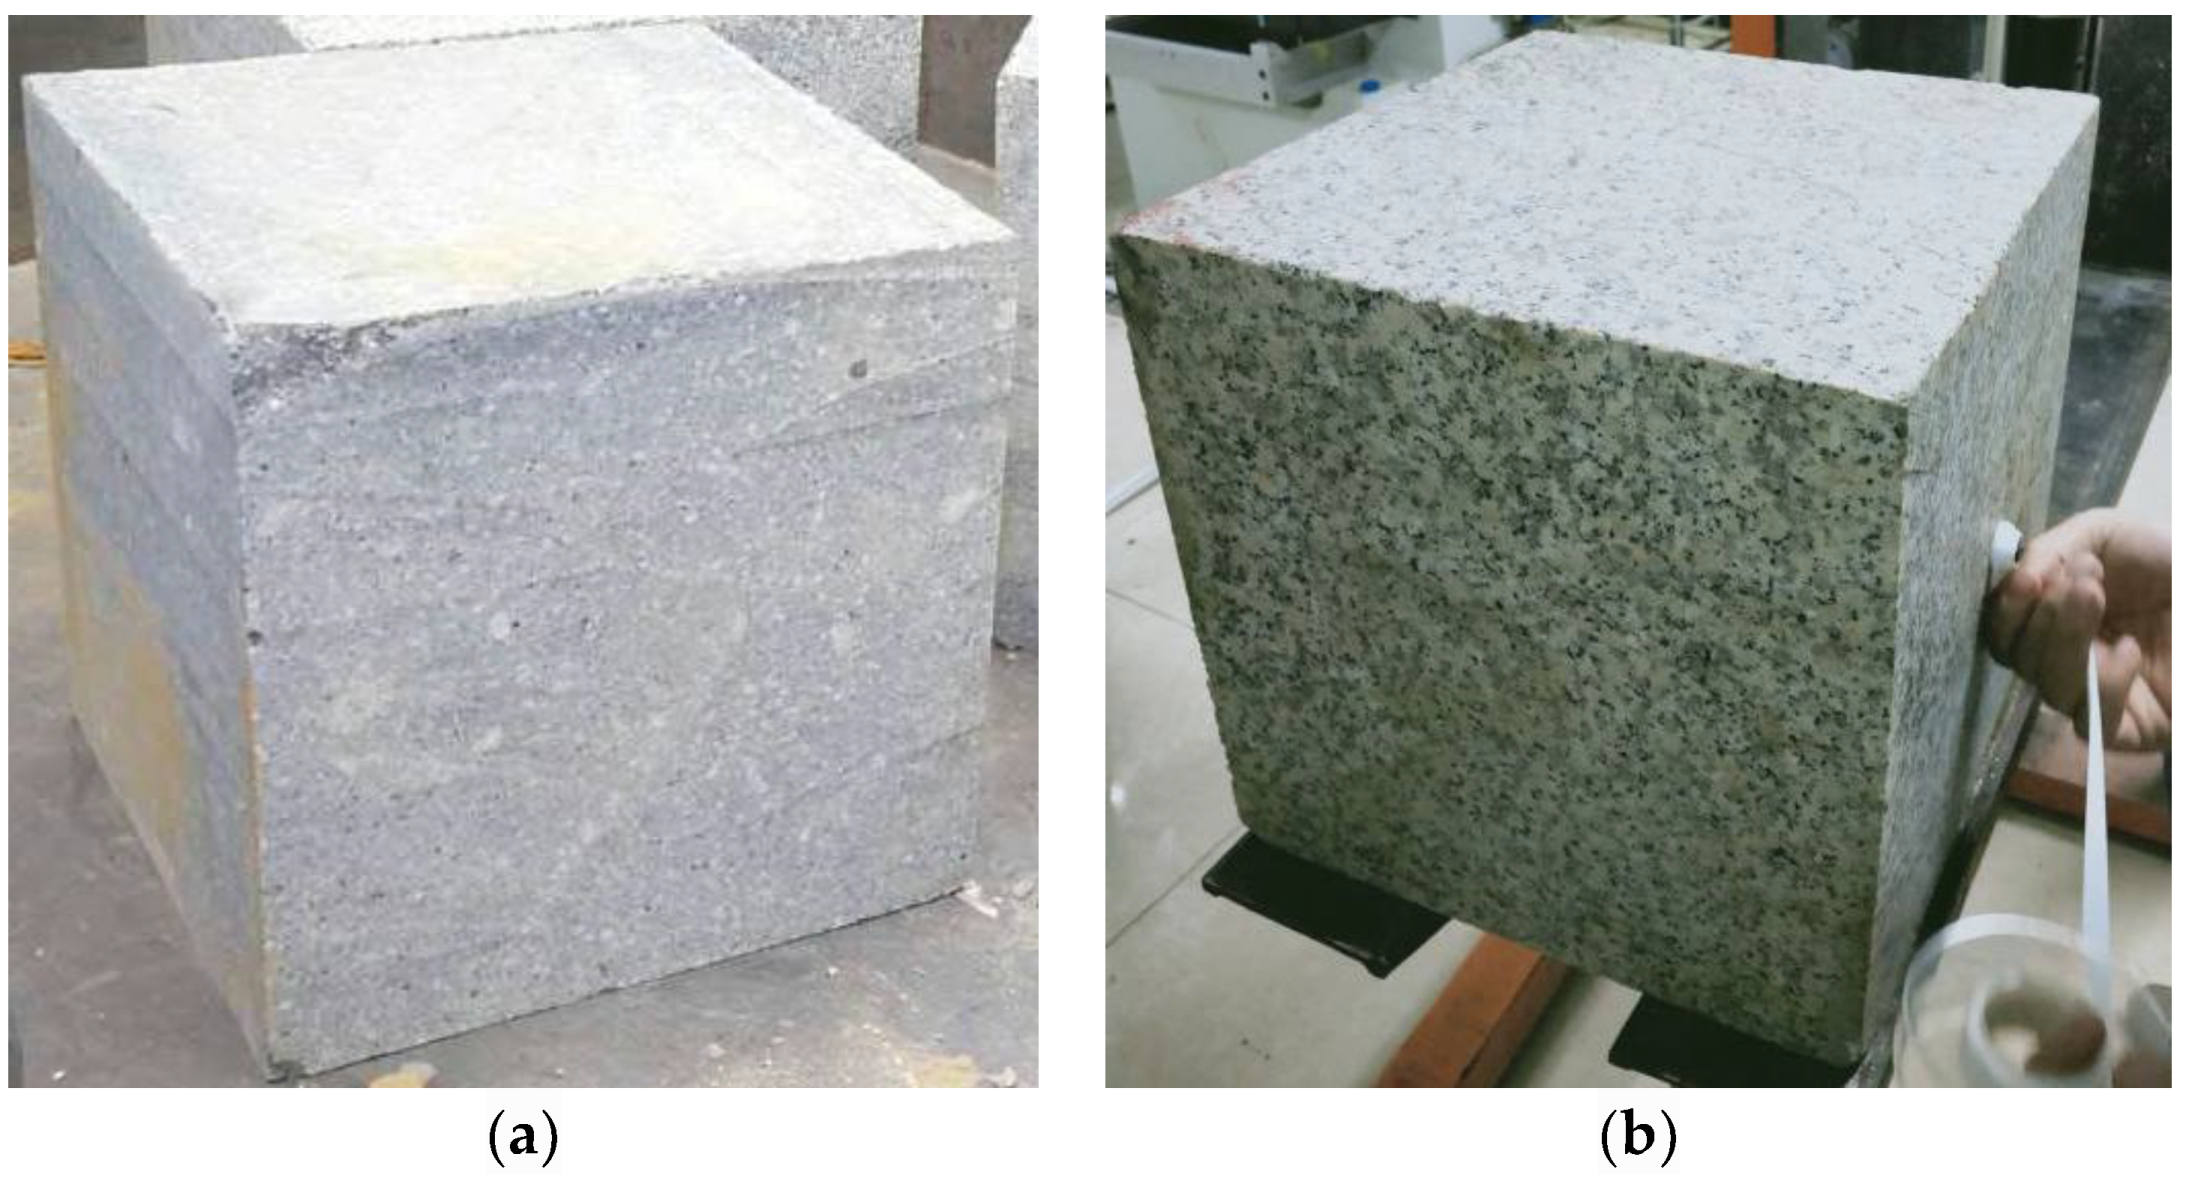
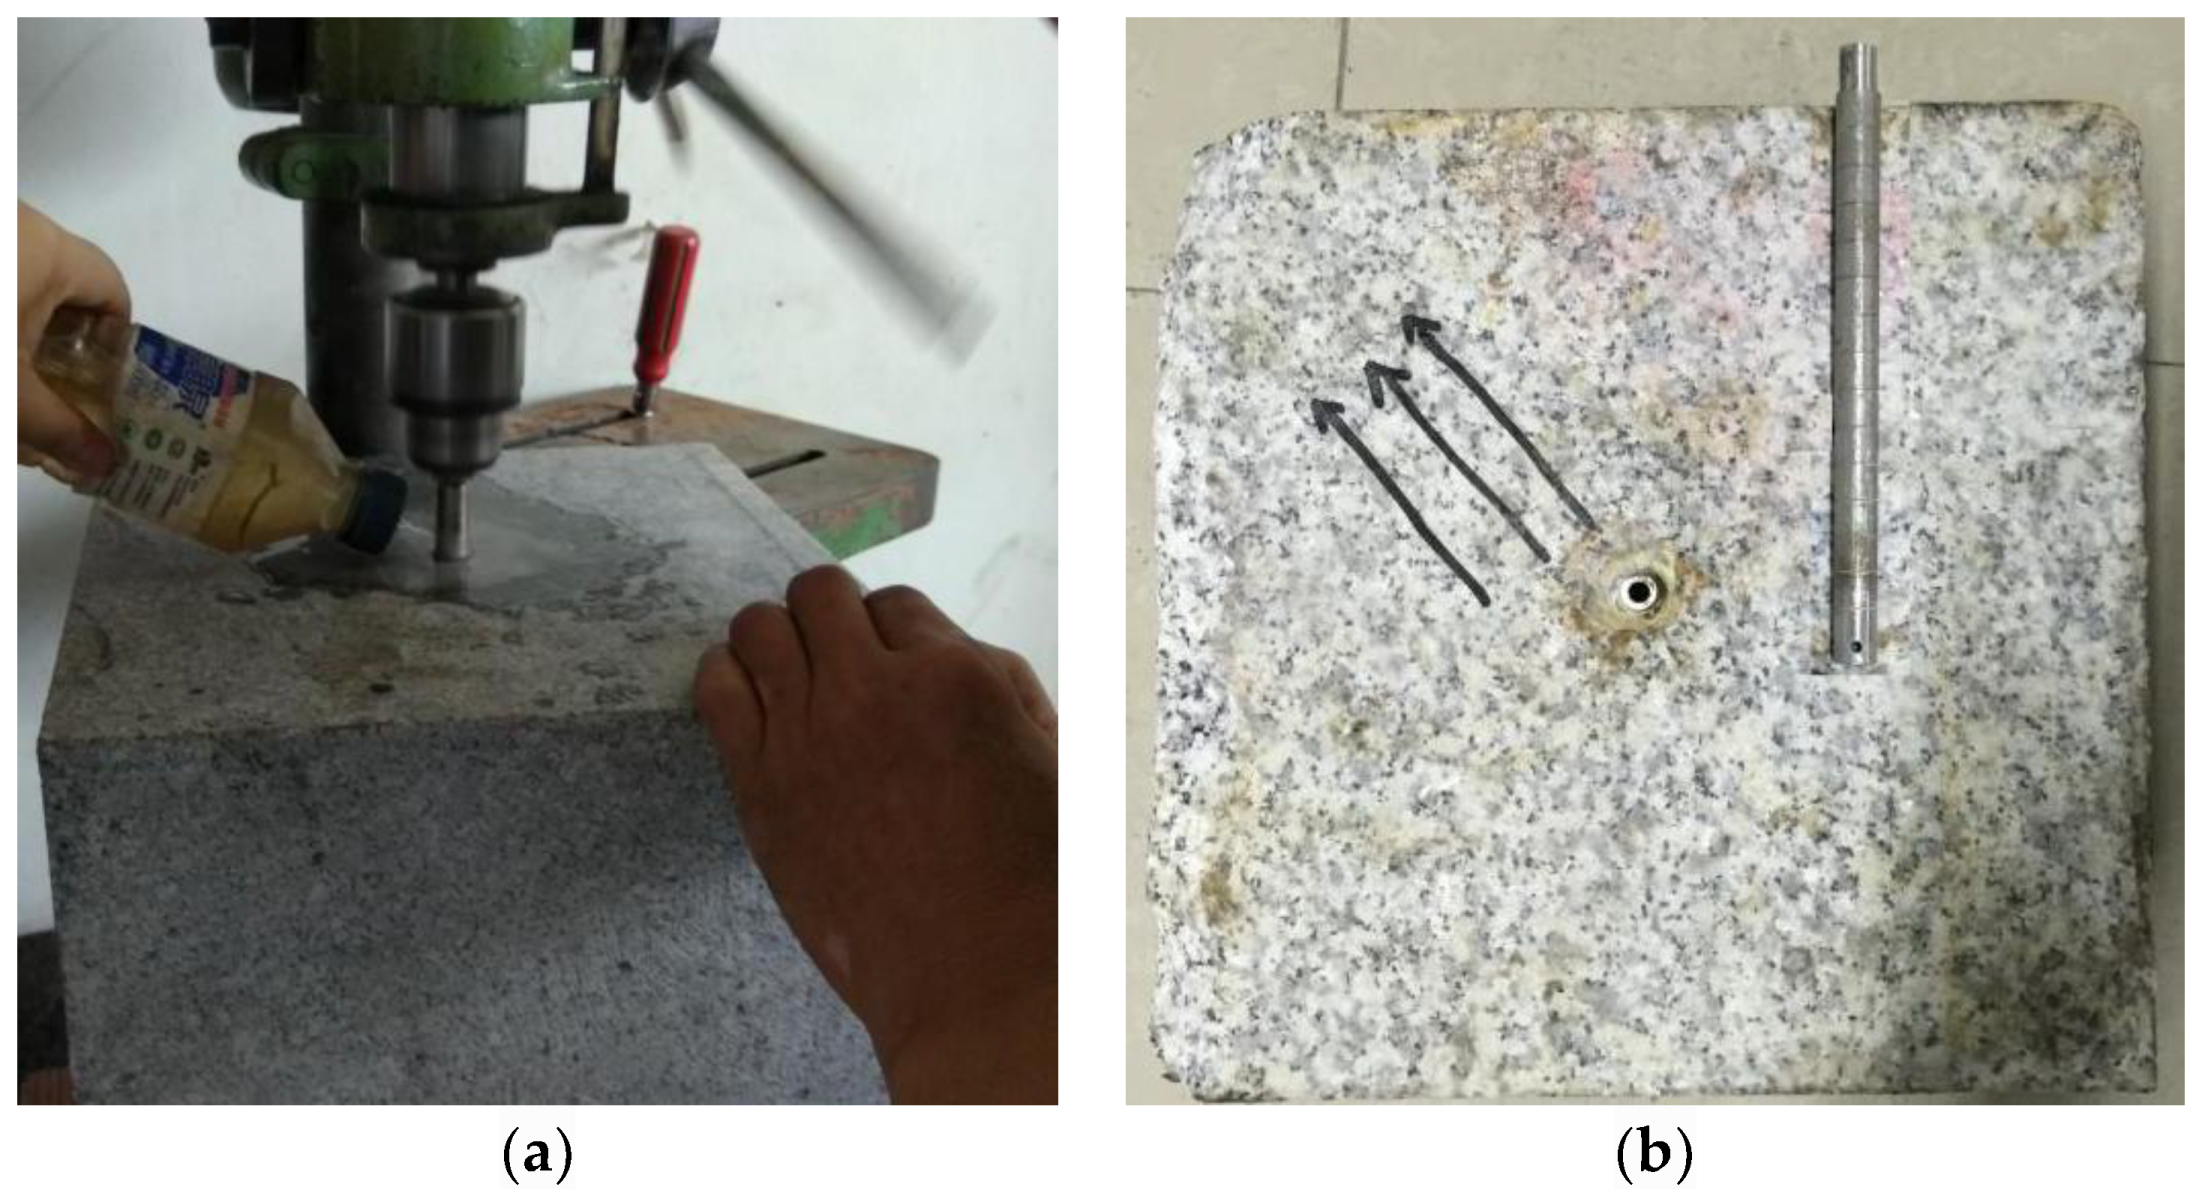
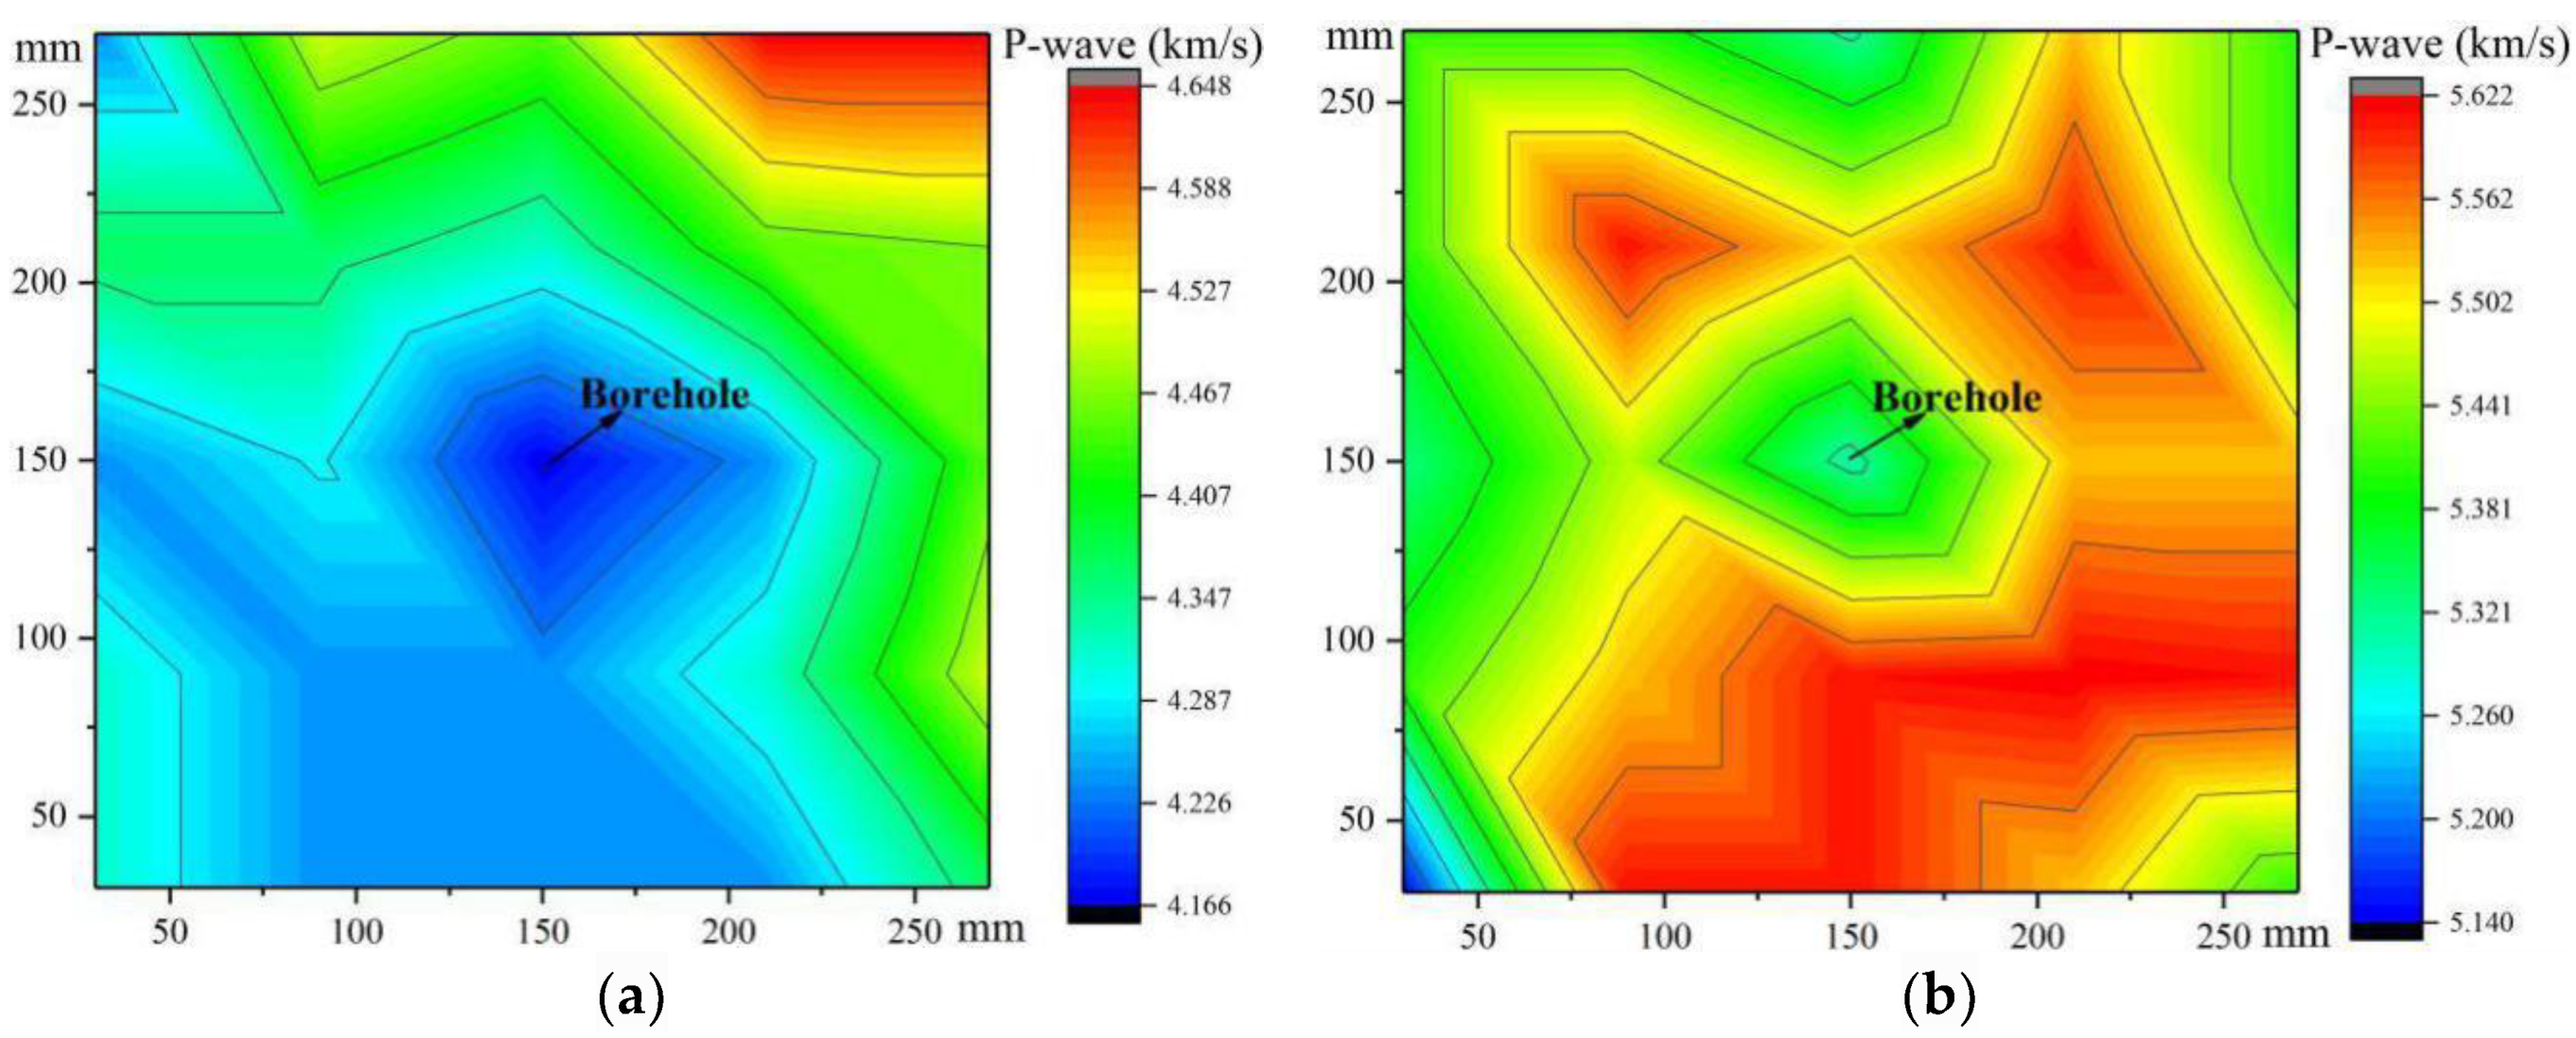
2.3. Sample Preparation

The collected granite blocks were processed into cubes of 300 × 300 × 300 mm. This sample size was required by our high-temperature high-pressure triaxial apparatus. Water was used as a lubricant during sample processing to minimize damage to the rock. The surfaces of the sample were carefully ground using a diamond face-grinding machine to prevent the sample from being confined unevenly during the test.
In order to simulate the wellbore and to initiate the hydraulic fracture, sample holes were drilled up to mid-depth (150 mm deep) using an 8-mm drill bit, as shown in Figure 4. In order to produce a smooth drill hole and minimize damage to the sample, water was used for lubrication and a low drilling speed was used. The diameter of the finished drill hole was 12 mm. A metal tube with a symmetrical notch at the bottom was then epoxied in the hole to a depth of about 140 mm, leaving a 10 mm bare hole to ensure hydraulic crack initiation.
In order to obtain a rough estimate of the homogeneity of the samples, we used an elastic wave velocity meter to detect the longitudinal waves in three directions in all samples. The P-wave velocity of the granodiorite samples (G-1 and G-2) was 4.103–4.700 km/s and that of the monzogranite samples (MG-3, MG-4, MG-5, MG-6, MG-7, MG-8, and MG-9) was 5.230–5.622 km/s. The P-wave velocity distributions of the two rock types are shown in Figure 5. Due to the presence of the drill hole, a low wave velocity anomaly occurred at the center of the specimen. The granodiorite samples had lower P-wave velocity values than the monzogranite samples but larger wave velocity range, suggesting that the granodiorite blocks were less compact and highly heterogeneous. However, it was difficult to distinguish the trajectory of the natural microcracks inside the rock block due to the low accuracy of the instrument.

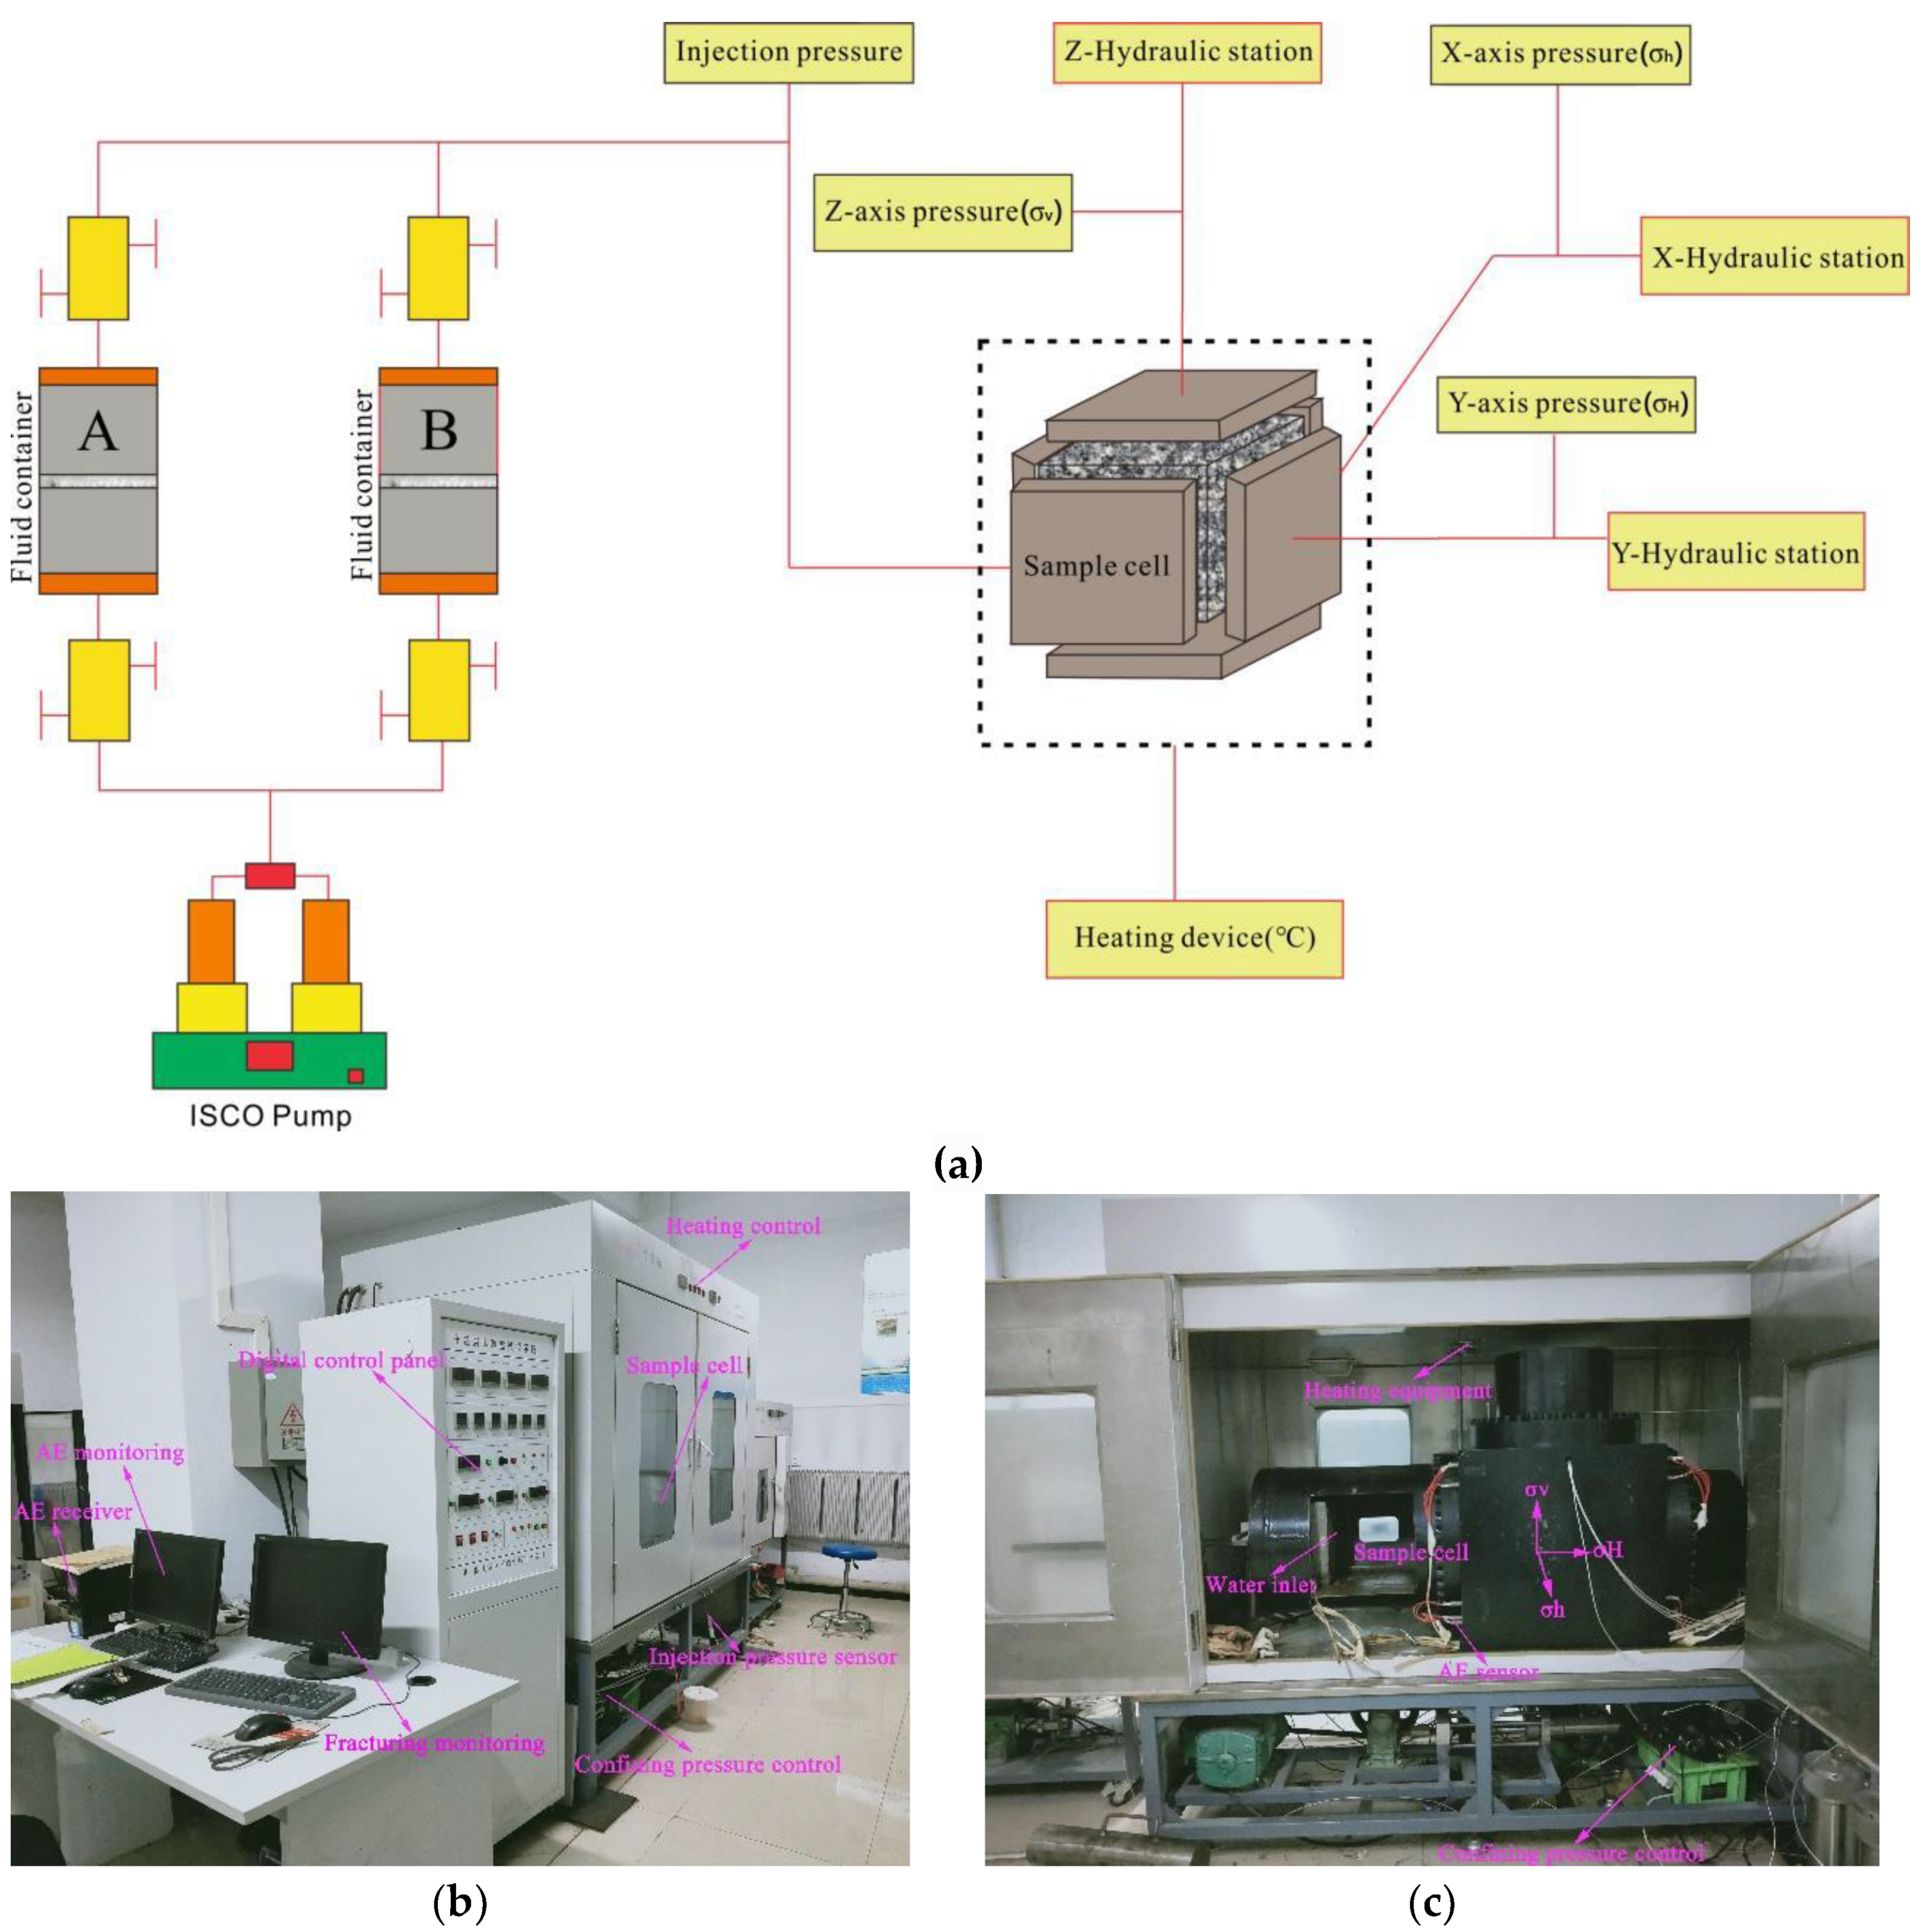
2.4. Hydraulic Fracturing Equipment

A true triaxial servo-controlled testing machine with a 70 MPa maximum injection pressure was utilized in the experiments (Figure 6). The advantages of this fracturing equipment are that it has a heating device to simulate the HDR temperature environment and AE devices to monitor crack propagation. The specimen cell of the instrument was specifically designed for the 300 × 300 × 300 mm cubes. In the triaxial cell, freely moving steel plates were used to apply confining pressure in each direction. The displacement accuracy of the steel plates was 0.001 mm and the displacement loading rate was between 1 and 0.001 mm/s. An 8-channel AE measurement system with probes located at the top and side of the specimen chamber was used to record the AE events generated during the fracturing tests.

2.5. Hydraulic Fracturing Experiments

Nine specimens were prepared for the experiment. The experiments investigated the influence of the injection rate, fluid injection method, and temperature on hydraulic crack propagation. Pure distilled water was used as a fracturing fluid during all tests. It is well known that that the in-situ stress state usually causes the deflection of hydraulic fractures into the direction of the maximum principal stress [30]. Therefore, in order to eliminate the influence of the stress state, the initial confining pressure was set to a constant low-pressure state in all tests. The injection rate was in the range of 1–30 mL/min and a constant flow injection method was used. The effects of room temperature (20 °C) and high temperature (150 °C) were investigated. The test conditions for the hydraulic fracturing test are shown in Table 2.
The experiment included five steps: (1) Checking the operation of the device. (2) Placing the specimen in the triaxial cell. (3) To avoid unbalanced loading of the tri-axial stresses, the three-dimensional stresses were first loaded to the maximum confining pressure (parallel to the borehole) at the same time and the intermediate and minimum confining pressures were increased to the pre-determined values. (4) The samples were heated to the set temperature (150 °C) during the high-temperature test and the temperature was maintained for about 5 h to establish the temperature equilibrium; subsequently, we injected the fluid at the given rate. (5) The three-dimensional distribution of the AE events was recorded. (6) The specimen was unloaded after the fracturing test was completed.

3. Experimental Results

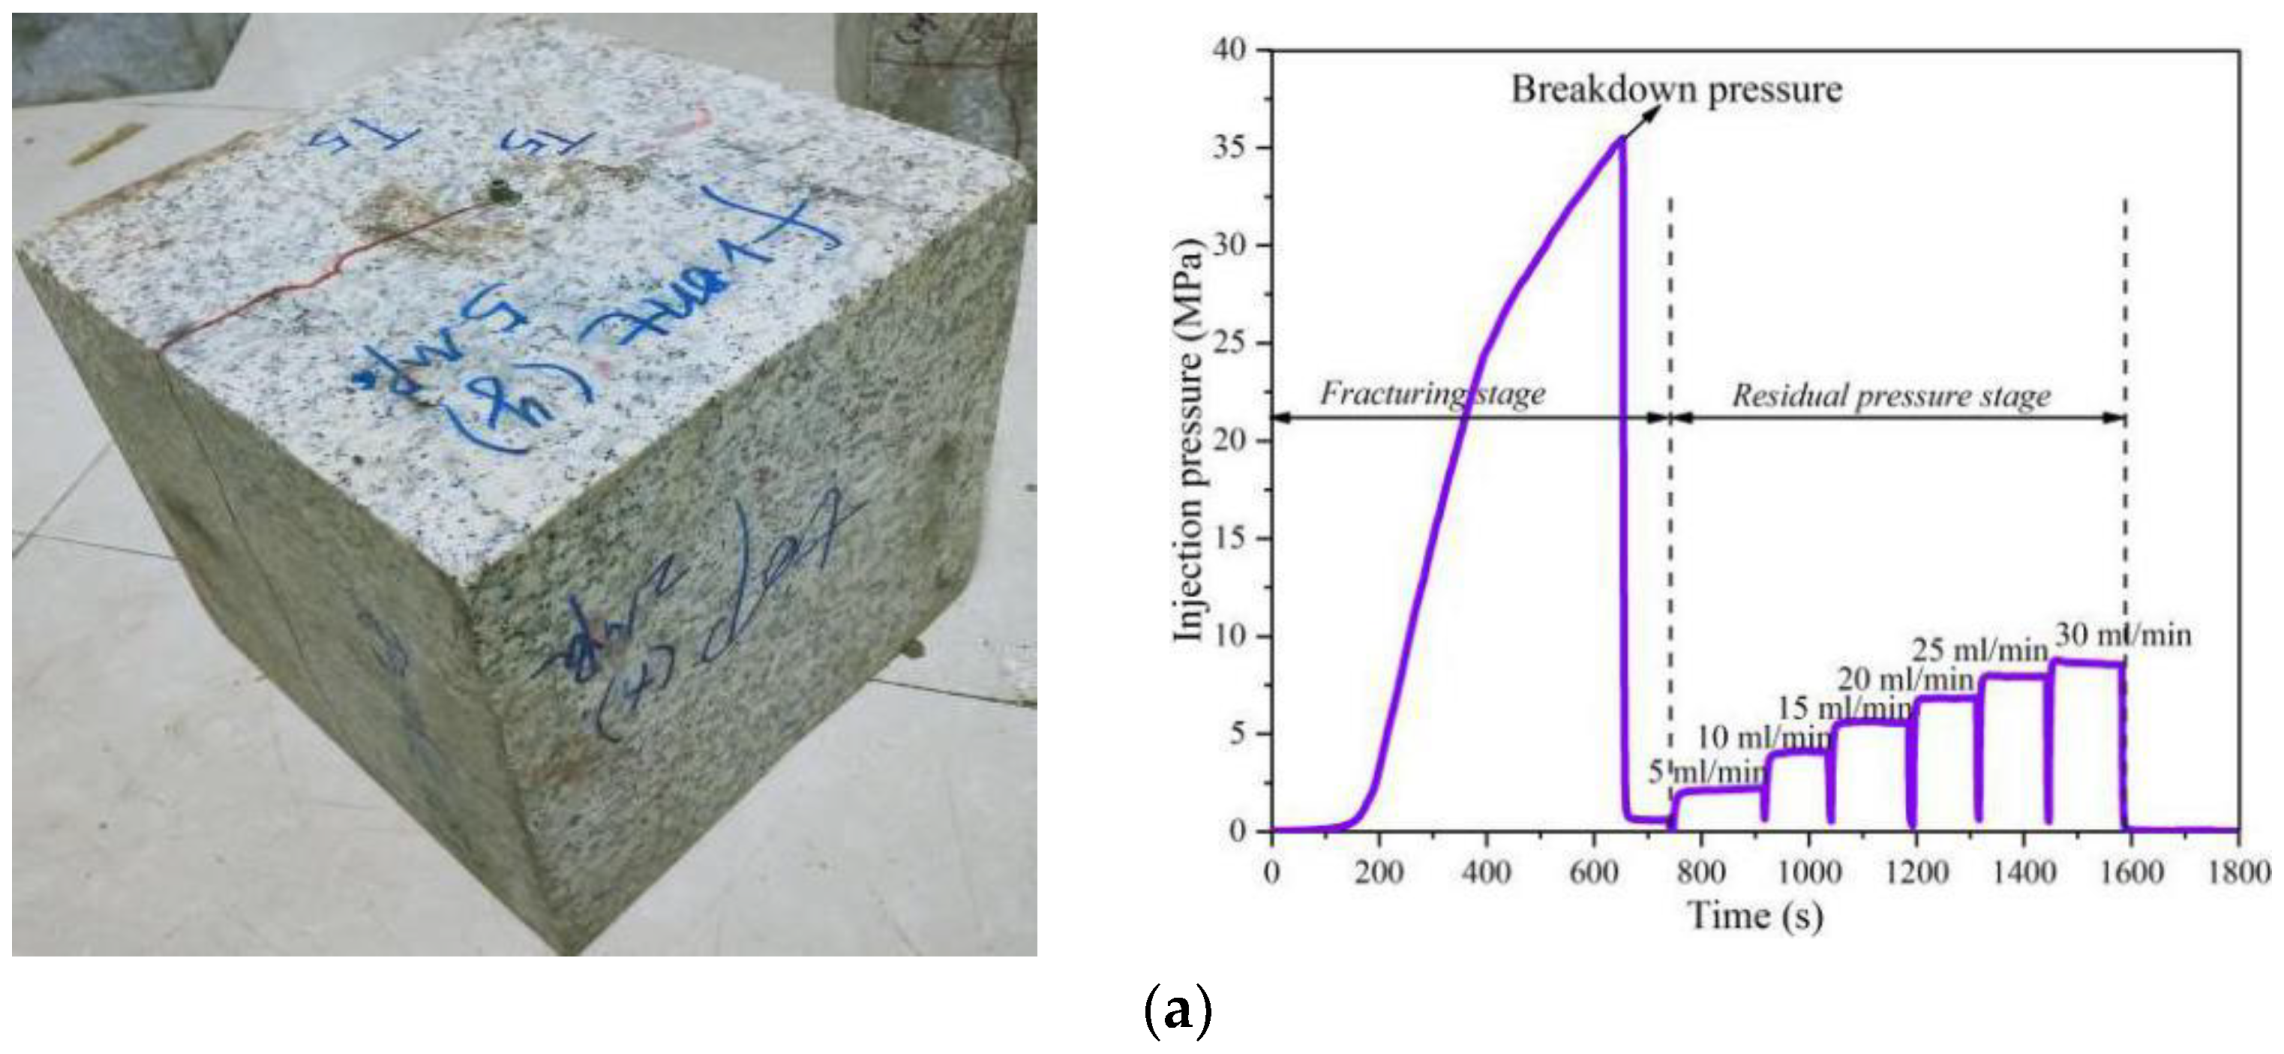
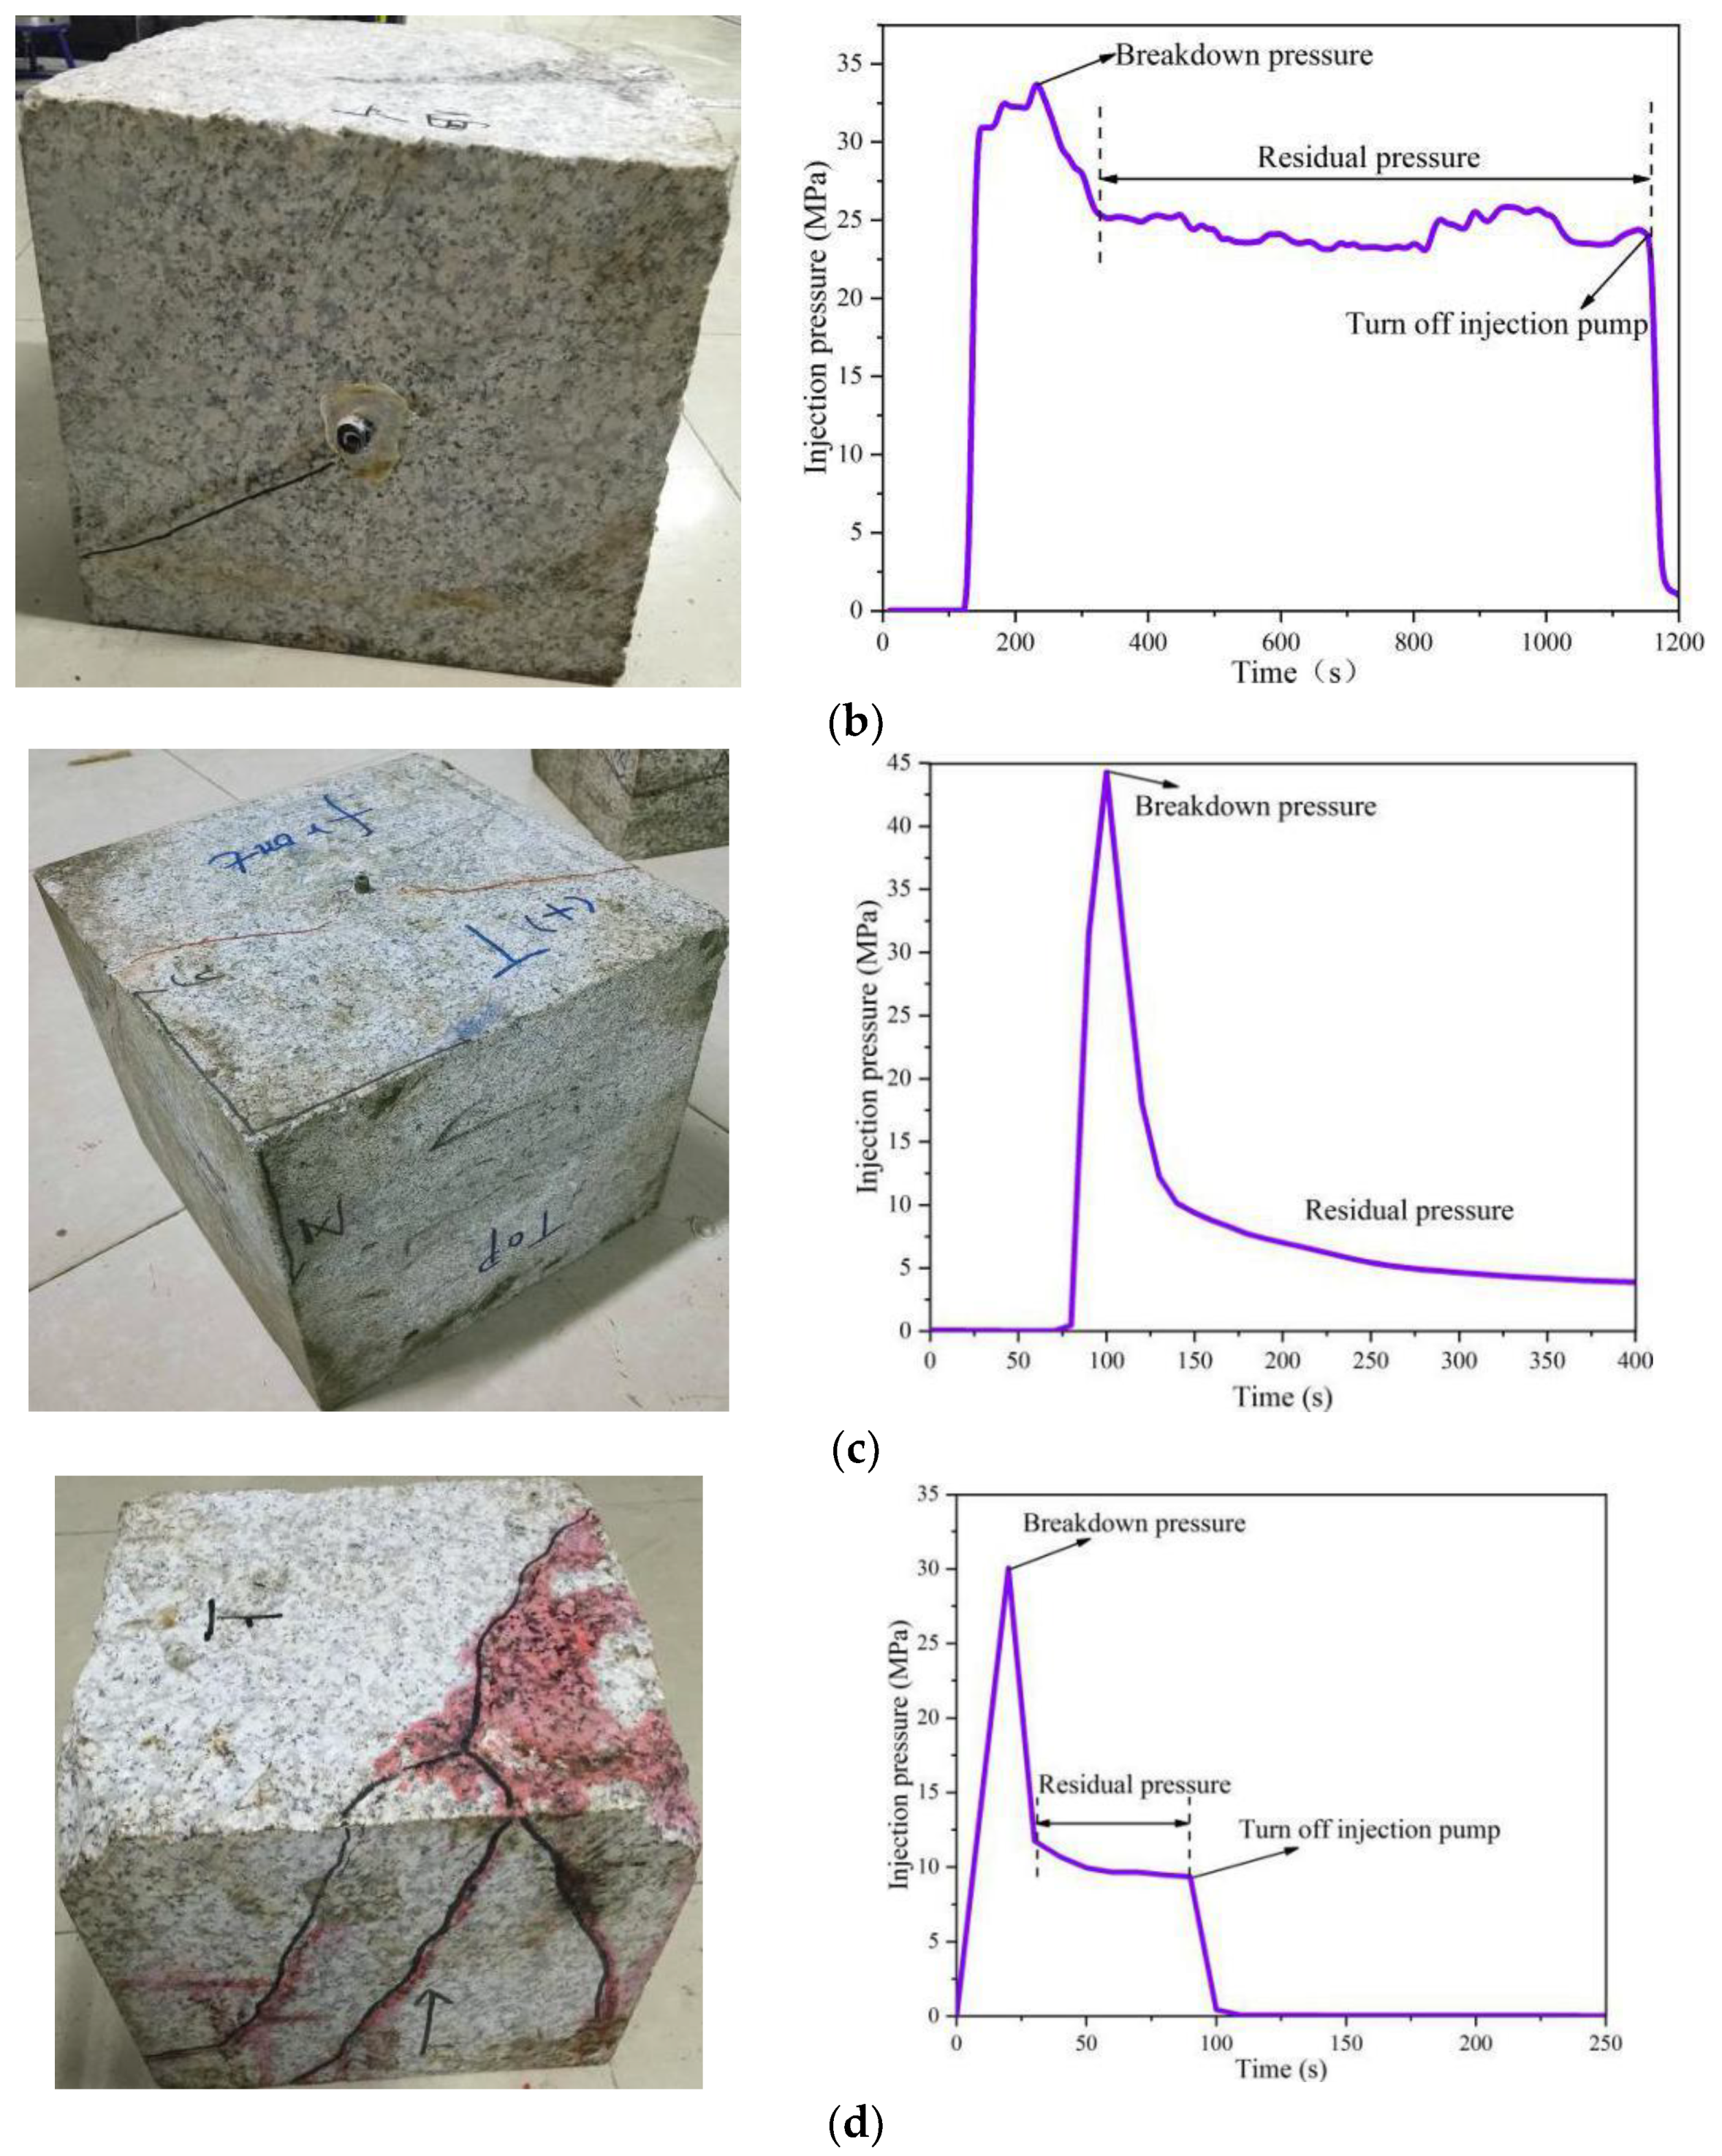
3.1. Room-Temperature Fracturing Test

Figure 7 and Figure 8 present the injection pressures over time in the granodiorite and monzogranite specimens. All injection pressures follow the typical pressure–time curves of the hydraulic fracturing tests conducted by Sarmadivaleh et al. [31], and exhibit a general increment of injection pressure over time until breakdown pressure is obtained, followed by a significant reduction due to hydraulic crack formation and the final residual stage. Sarmadivaleh et al. [31] used a cubic rock sample and a true triaxial stress cell to simulate hydraulic fracturing under true field stress conditions, which is basically consistent with the experimental ideas presented in this paper.
Samples G-1 and G-2 were initially fractured using an injection rate of 1 mL/min, but the samples did not hydrofracture. Therefore, we increased the injection rates to 5 mL/min and 10 mL/min to investigate the room-temperature fracturing behavior of granodiorite at different injection rates. The results of this experiment are depicted in Figure 7. The breakdown pressures of the samples were 17.8 and 23.3 MPa, respectively. Apparently, a high injection rate resulted in a high breakdown pressure in the granodiorite. After the breakdown pressures, the injection pressures both dropped rapidly to a stable value of about 0.6 MPa. The stable value was defined as the residual pressure when the crack was not fully closed. The pressure-time curves of the two samples are highly similar in shape. Only 2 and 7 AE events were recorded in the granodiorite samples G-1 and G-2 tests, respectively, and they both developed a symmetrical double-wing crack with the wellbore as the axis.
Four samples (MG-3, MG-4, MG-5, and MG-6) of monzogranite were used for the room-temperature fracturing test (Figure 8). Sample MG-3 was fractured using an injection rate of 1 mL/s, and its breakdown pressure was 35.8 MPa. A total of 15 AE events were recorded during the sample MG-3 fracturing test. Samples MG-4 and MG-5 were fractured using injection rates of 5 mL/min and 10 mL/min, respectively, and their respective breakdown pressures were 34.1 MPa and 44.3 MPa. During the testing of samples MG-4 and MG-5, 48 and 118 AE events were recorded, respectively. Sample MG-6 was fractured using an injection rate of 25 mL/min, and exhibited a breakdown pressure of 30.6 MPa. In the room-temperature fracturing test of the monzogranite, the breakdown pressure was not significantly related to the injection rate. However, for the development of hydraulic cracks in the monzogranite, it was apparent that the crack tended to become more complicated as the injection rate increased. When the injection rate was increased from 1 mL/min to 25 mL/min, the hydraulically-induced crack in the monzogranite specimens developed from a simple single-wing crack to a hydraulic crack network with many branch cracks.
Compared with granodiorite samples G-1 (5 mL/min) and G-2 (10 mL/min), the breakdown pressures of the monzogranite samples MG-4 (5 mL/min) and MG-5 (10 mL/min) were significantly higher at the same injection rates, and there were significantly more recorded AE events.
However, both samples G-1 and G-2 developed a double-wing crack, while the monzogranite samples MG-4 and MG-5 developed a single-wing crack and a double-wing crack, respectively. This means that the granodiorite is more easily hydrofractured at a certain injection rate. This is primarily due to the weaker mechanical properties of the granodiorite, including weaker tensile strength, weaker compressive strength and a lower elasticity modulus.

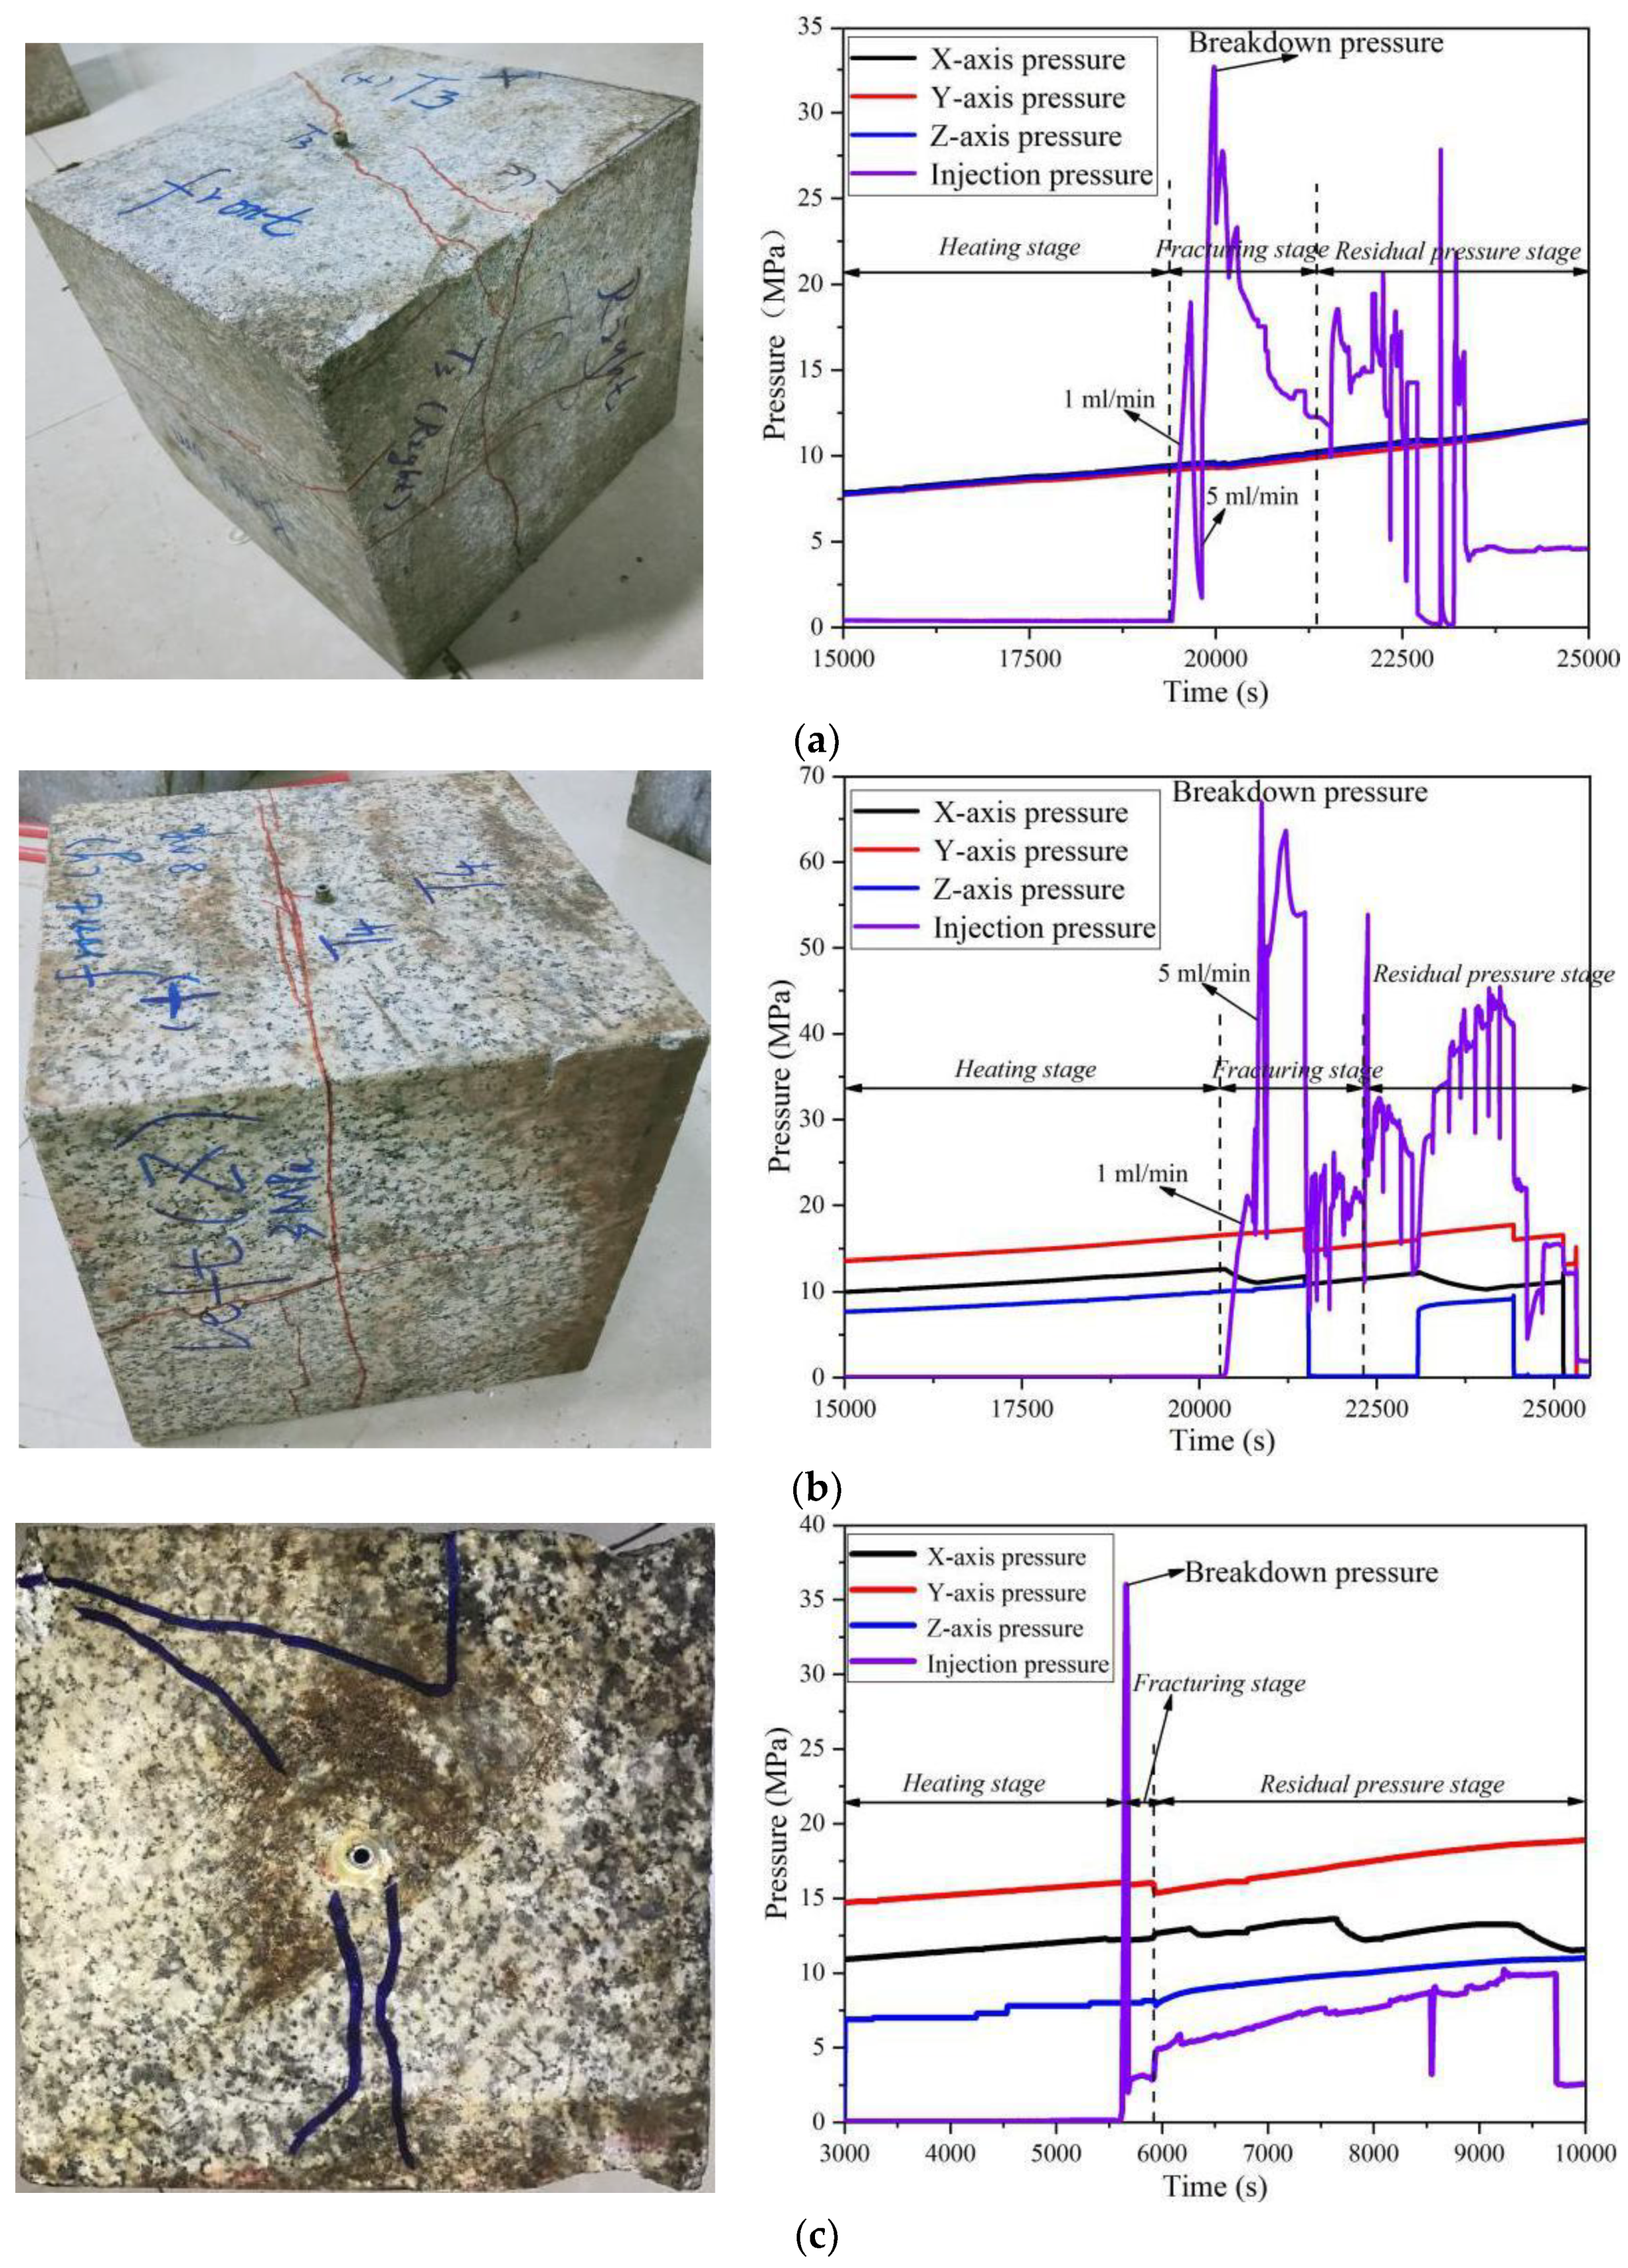
3.2. High-Temperature Fracturing Test

Samples MG-7, MG-8, and MG-9 were tested for fracturing at a high temperature of 150 °C (Figure 9). It took over 5 h for the sample to be heated from room temperature to the set temperature (150 °C). Thereafter, the sample cell temperature was kept constant at 150 °C for half an hour so that the internal temperature of the sample reached the set requirement. Sample MG-7 (Figure 9a) was initially fractured using an injection rate of 1 mL/min, but the injection pressure converged to a value of about 18.0 MPa. A peak injection pressure was not observed, which indicates that the specimen was not hydrofractured. Thus, we immediately changed the injection rate to 5 mL/min, after which the injection pressure continued to rise and then suddenly dropped after peaks of 32.5 MPa. This indicated that sample MG-7 was successfully fractured. A similar phenomenon also occurred in the room-temperature fracturing test of the granodiorite samples. As in the case of sample MG-7, sample MG-8 (Figure 9b) was also fractured at an injection rate of 5 mL/min, and exhibited a breakdown pressure of 66.0 MPa. Sample MG-9 (Figure 9c) was hydrofractured using a constant 25 mL/s injection rate, and its breakdown pressure was 36.0 MPa.
The high-temperature fracturing test of the monzogranite is more likely to exhibit a higher breakdown pressure than the fracturing test at room-temperature at the same injection rate (MG-4 compared to MG-8, and MG-6 compared to MG-9). However, no significant relation between the breakdown pressure and the injection rate was found in the high-temperature fracturing test of monzogranite. Regardless of the injection rate, monzogranite fracturing under a high-temperature condition results in a hydraulic crack network with many branch cracks, which is similar to the finding that monzogranite is fractured at a higher injection rate (25 mL/min) under a room-temperature condition.

4. Analysis

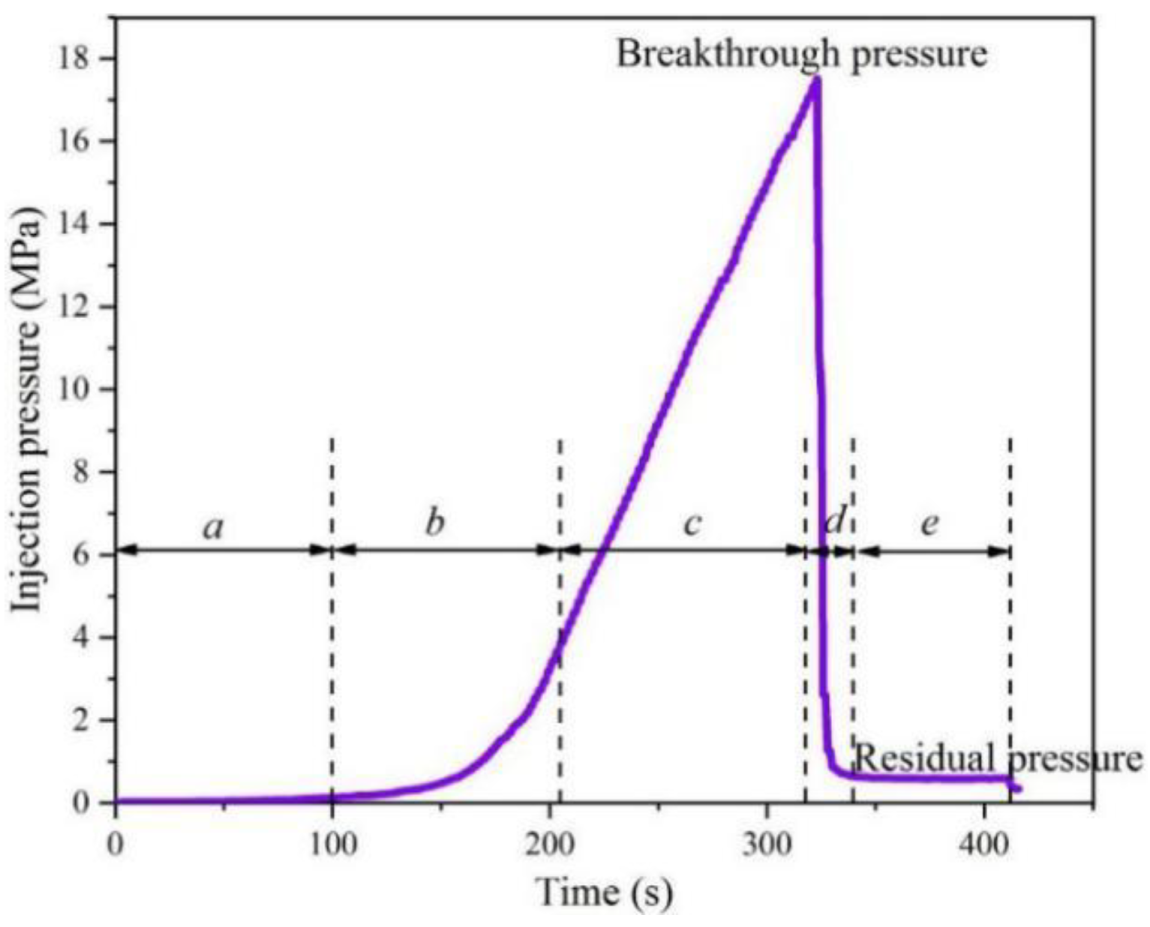
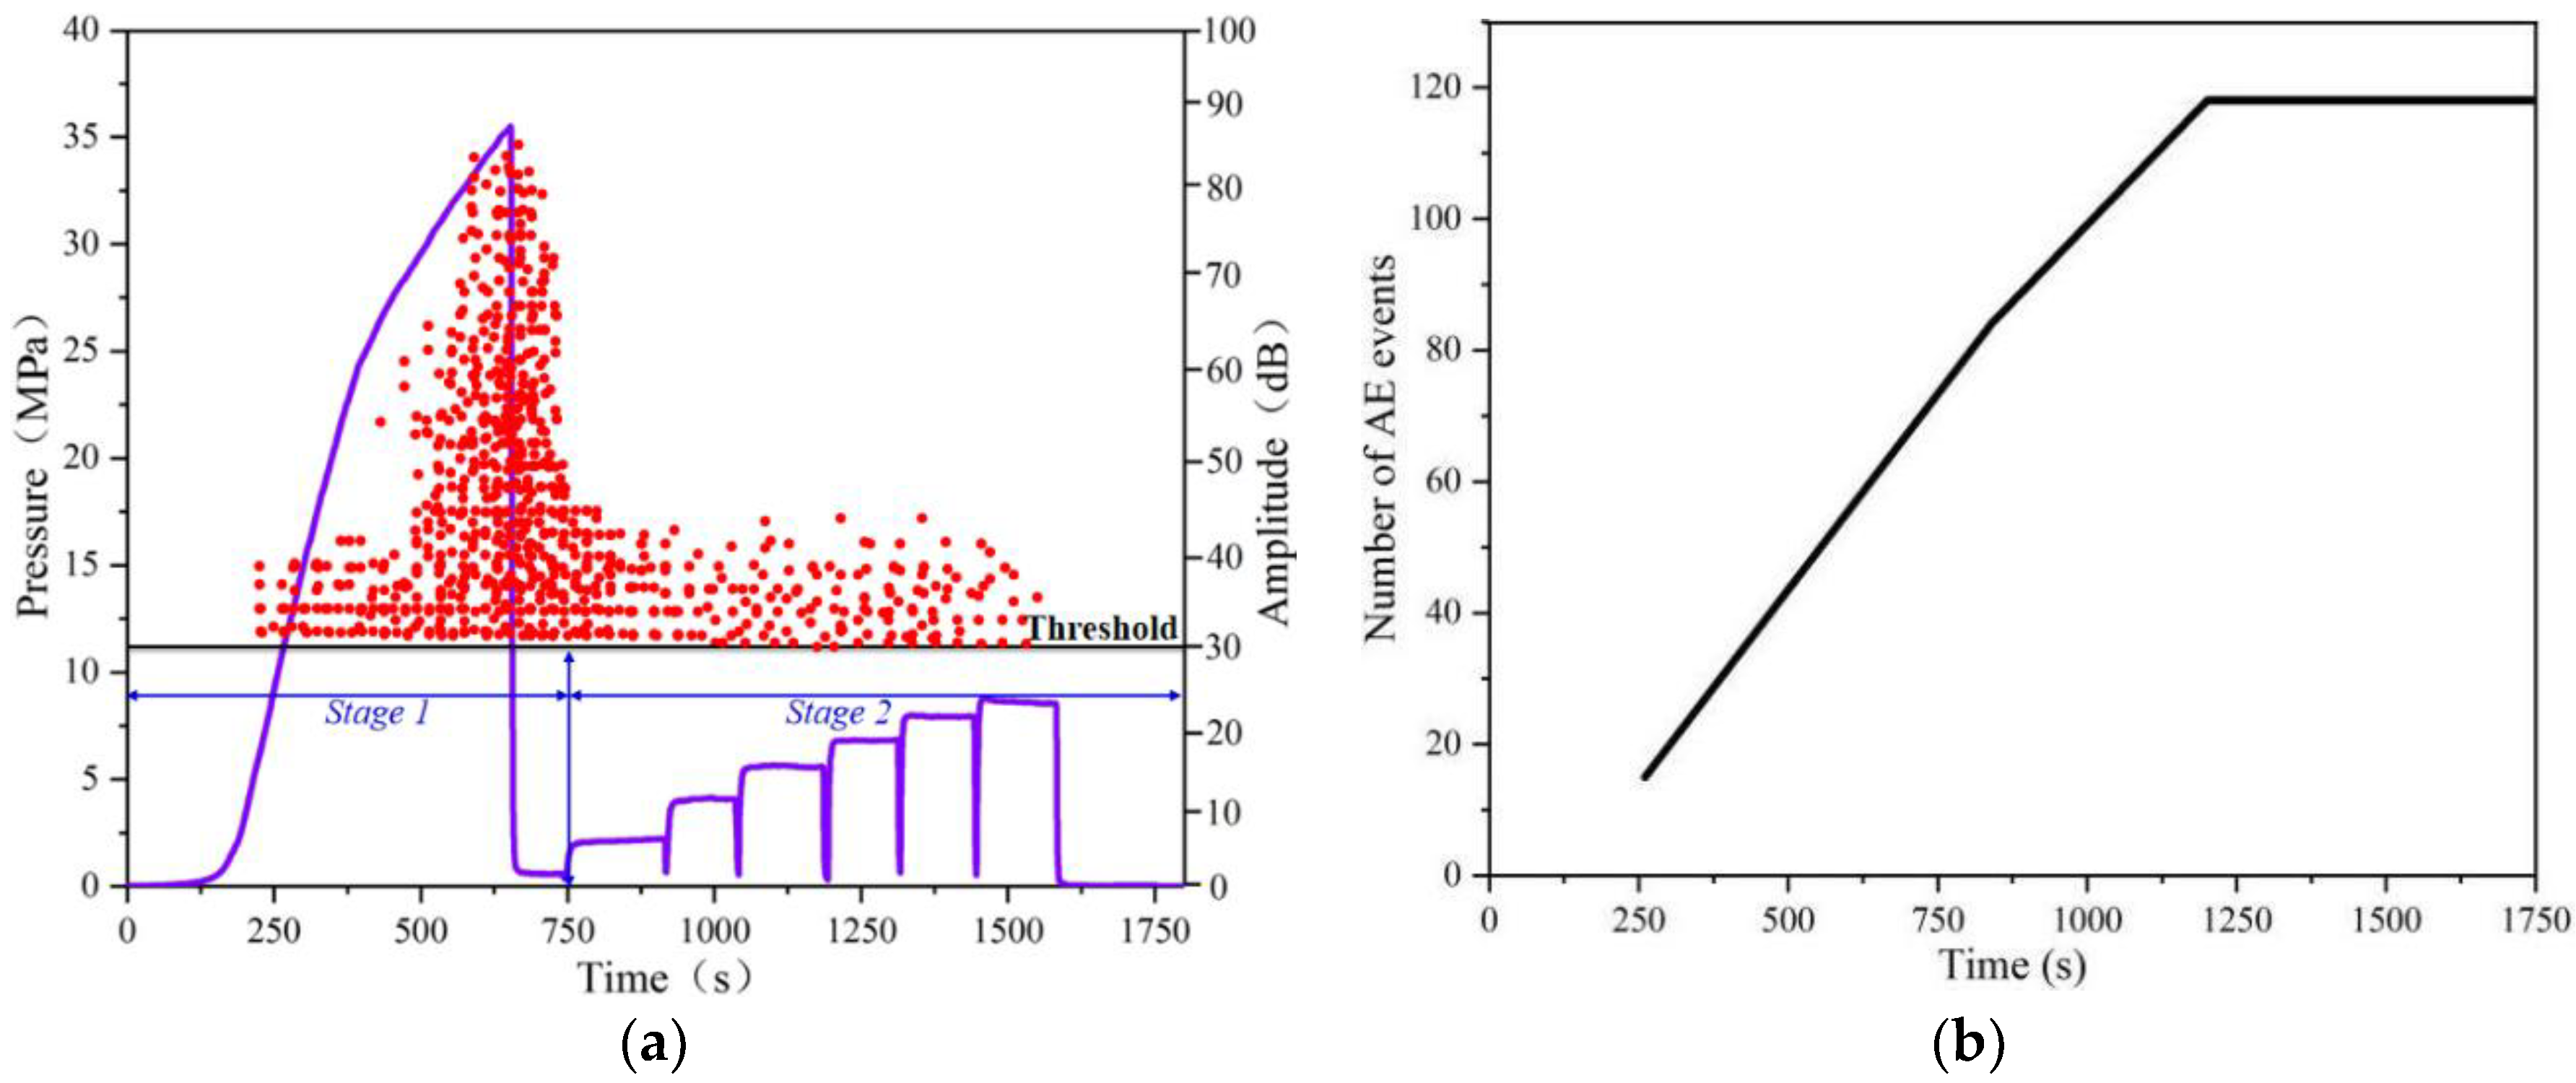
4.1. Injection Pressure Curve

All of the pressure–time curves in our fracturing test exhibited the following five distinct stages: (a) drill hole filling, (b) drill hole pressurization, (c) fracturing, (d) crack extension, and (e) post-failure, as shown in Figure 10. In stage (a) of the curve, water filled the steel pipe and hole of the specimen and the rock samples in this stage were hardly subjected to water pressure. In stage (b) of the curve, water entered the rock pores and pre-existing cracks of the specimen, which resulted in a small pressure increase. Once the accessible rock pores and microcracks were filled with water, the injection pressure increased significantly immediately. The slope of linear pressure development reflects the pressurization rate and this slope highly depends on the fluid injection rate. The accumulation of pressure causes the rock to be hydrofractured, which corresponds to the (c) stage of the curve. In this stage, the pressure of the hydraulic crack initiation must satisfy Equation (1) [32]:
P b > σ t + σ min
where Pb is the breakdown pressure of the sample, MPa; σt is the tensile strength of the rock, MPa; and σmin represents the minimum principal stress, MPa. Therefore, the rock strength and the surrounding pressure determine the breakdown pressure of the rock. High rock strength and a high confining pressure environment will result in a high breakdown pressure. In our room-temperature experiments, all rock samples were tested in a low ambient confining pressure environment; consequently, the breakdown pressure difference between the two lithologies was mainly caused by the strength difference of the rock samples.
In stage (d) of the curve, induced cracks cause a significant pressure drop as a result of the release of pressure along the induced hydraulic crack. In this process, the main crack and possibly the secondary crack are completely formed. Thereafter, the continued injection rate will result in an almost constant water pressure (post-failure stage), which is referred to as the residual pressure of the induced crack. Generally, this residual pressure is equal to the corresponding minimum confining pressure [9].

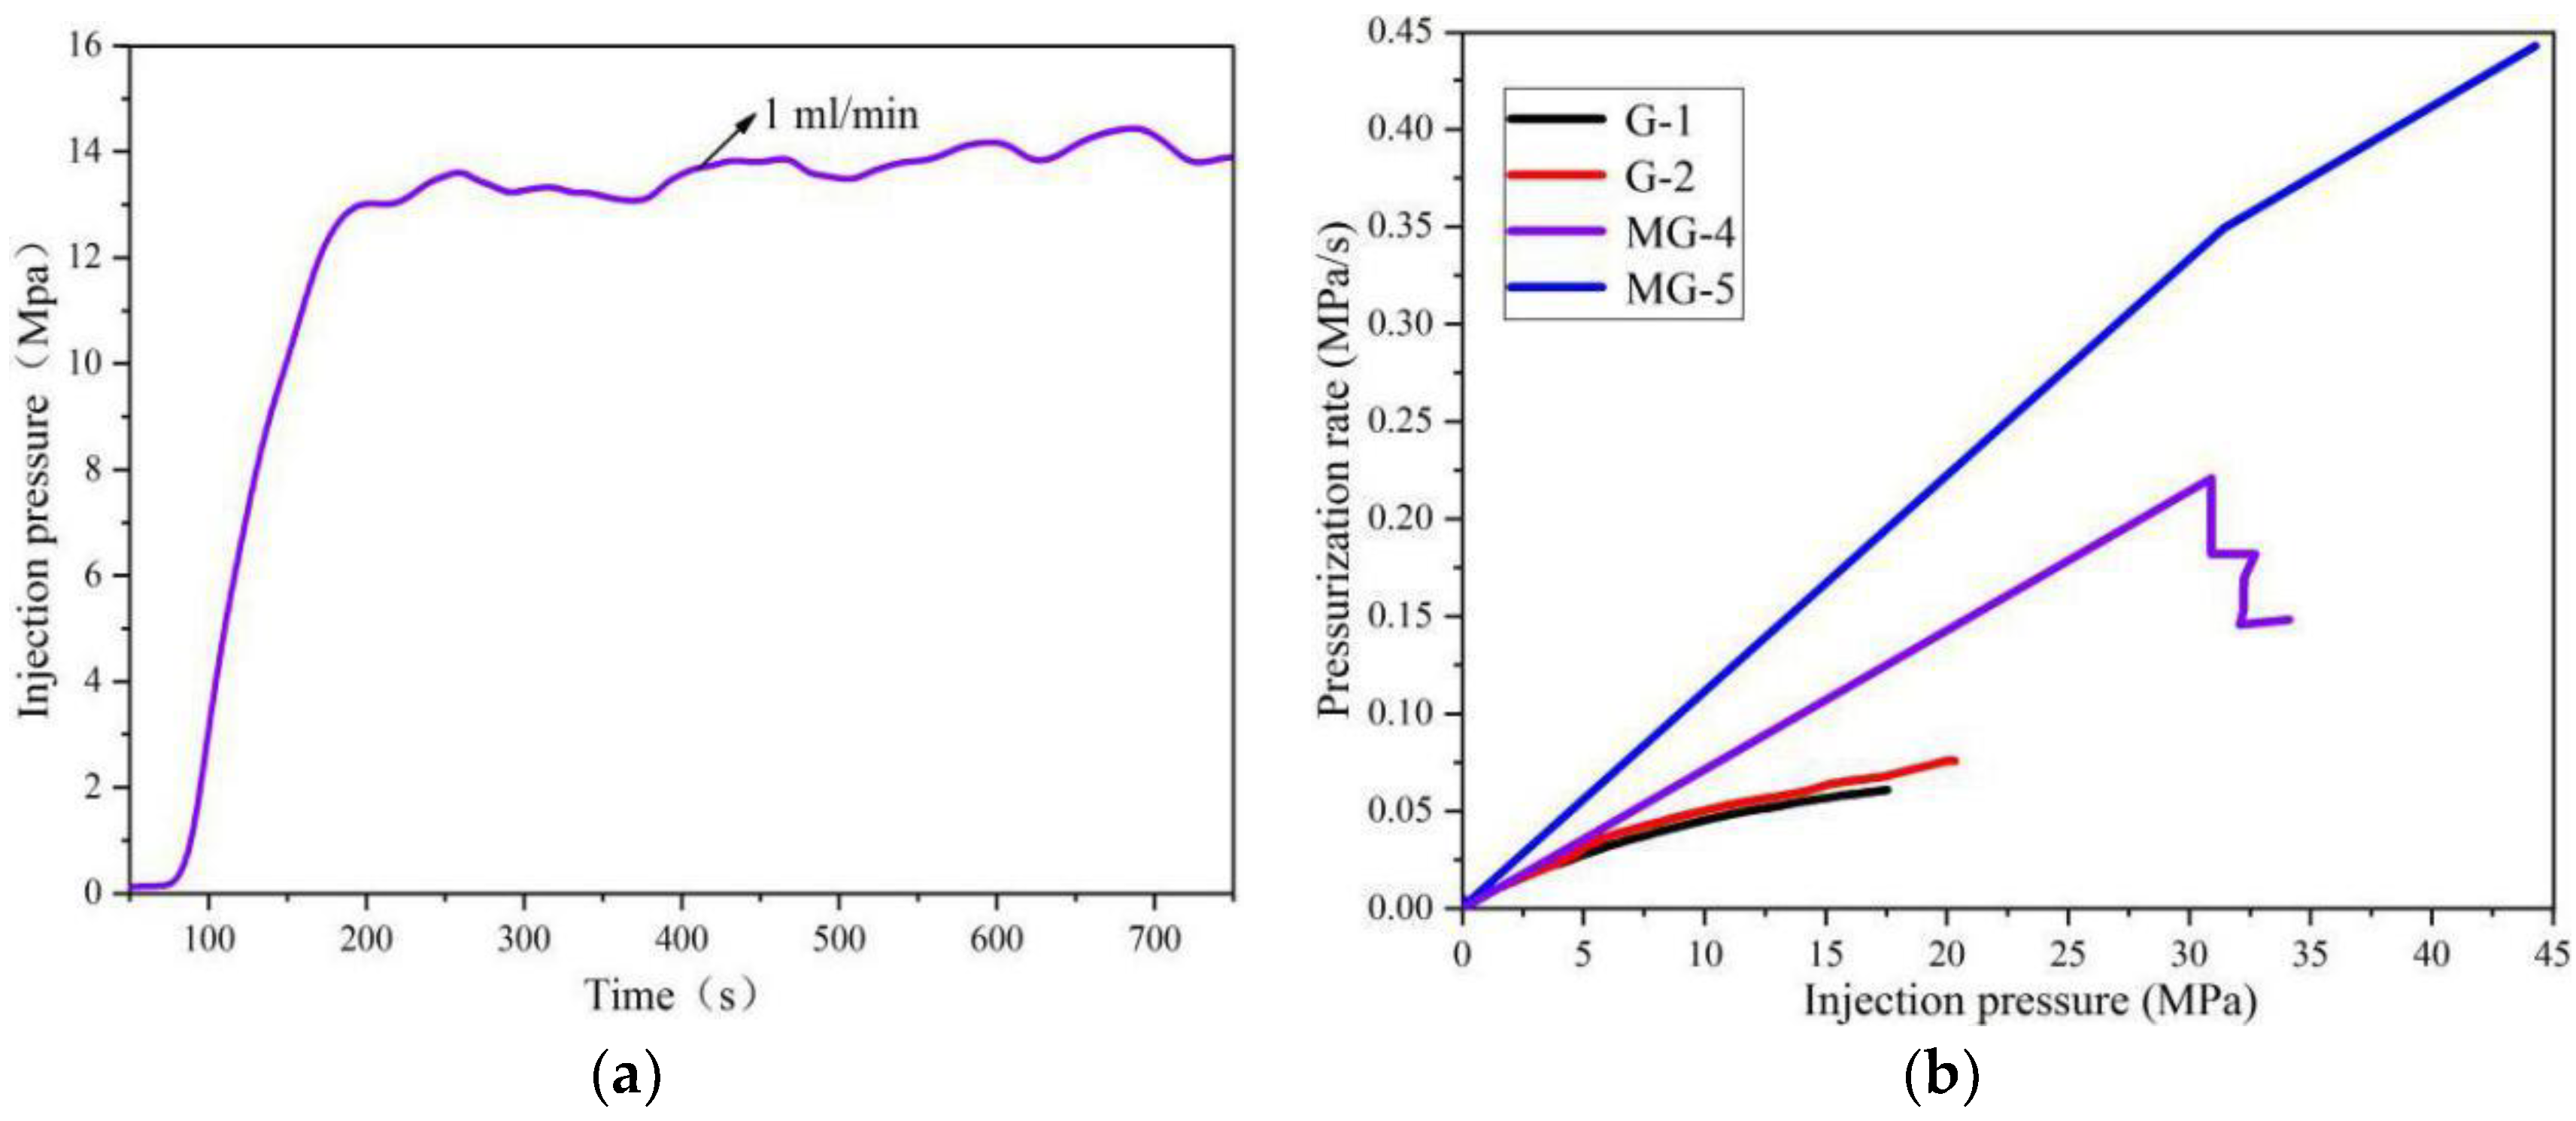
4.2. Effect of Rock Properties on Hydraulic Fracturing

The room-temperature test results showed that the breakdown pressures of the granodiorite samples were 17.8 and 20.3 MPa, respectively and the breakdown pressures of the monzonitic samples were 35.8, 43.5, 34.1, and 30.06 MPa. The breakdown pressure of the monzonitic samples was significantly higher than that of the granodiorite samples under any test conditions. This is attributed to the fact that the tensile strength of rock is usually the decisive factor in determining the hydraulic crack initiation [33] and a higher strength rock often exhibits a high hydraulic breakdown pressure. The monzogranite used in our test was a moderately strong granite type (tensile strength 16.5–19.9 MPa), whereas the granodiorite was a comparatively weak granite (tensile strength 11.5–13.9 MPa).
The influence of the hydraulic parameters on hydraulic fracturing is mainly reflected in the injection pressure. As shown in Figure 11a, when the granodiorite sample G-1 was initially tested at an injection rate of 1 mL/min, the injection pressure eventually stabilized at about 14 MPa but a typical fracture curve was never obtained. No hydraulic crack traces were observed on the surface of the specimen after it was unloaded; therefore, we loaded the sample again and tested it at a higher injection rate (5 mL/min). Sample G-2 also exhibited a similar behavior when tested at an injection rate of 1 mL/min. This may be attributed to the fact that the injection rate of 1 mL/min was lower than the fluid leak-off through the matrix. However, the monzonitic sample MG-3 was successfully hydrofractured using a 1 mL/min injection rate, indicating that the injection rate should be chosen based on the hydraulic parameters. Hofmann et al. [2] determined that the porosity had a slight effect on fracturing but the permeability had a significant influence on fracturing. High porosity and permeability can greatly dissipate the fluid pressure and thus result in fracturing failure. We refer to the minimum injection rate at which rock can be successfully hydrofractured as the injection rate threshold for the rock. Since the hydraulic parameters of the granodiorite samples (permeability 0.7 mD and porosity 4.59%) used in our experiments were significantly higher than those of the monzogranites (permeability 0.26 mD and porosity 2.49%), the injection rate threshold of the granodiorite samples was higher.
The pressurization rate is the change in the injection pressure per unit time. It is mainly affected by the injection rate and sample hydraulic parameters [20]. The drill hole pressurization and fracturing stages can be clearly identified on the injection pressure-time curve in the hydraulic fracturing tests. The tangent slope of the two-stage curve is defined as the pressurization rate. Figure 11b shows the pressurization rate versus the injection pressure for the granodiorite and monzogranite specimens at the injection rates of 5 mL/min and 10 mL/min. It is evident that the pressurization rate increased as the injection rate and the injection pressure increased with the accumulation of water in the rock. The pressurization rate of the monzogranite sample was significantly higher than that of the granodiorite under the same test conditions due to its low permeability and porosity. This means that a rock with lower permeability and smaller porosity will result in a larger pressurization rate during the fracturing process, as the fracturing fluid is less lost through the rock matrix per unit of time.

4.3. Effect of Injection Rate on Hydraulic Fracturing Behavior

Generally, the injection rate plays a critical role in distributing the fluid between the existing cracks and developing cracks. A low injection rate results in a high pressure dissipation ratio, especially for rock with high porosity and permeability. A high injection rate can activate more pre-existing microcracks in the rock mass [25,34], thus forming a complex hydraulic crack network. This can be confirmed by the number of recorded AE events. AE signals are detected by AE sensors attached to the surface of the granite specimen. When microcracks are generated in granite samples, potential strain energy is released in the form of stress waves and AE events are generated [30]. As shown in Figure 12, the number of recorded AE events increased as the injection rate increased. However, due to the low precision of the AE device, it is difficult to determine the trajectory of the hydraulic cracks in three-dimensional space.
The higher the number of AE events that are recorded during the fracturing process, the greater the damage of the rock block is. This can be confirmed by hydraulic cracks appearing on the surface of the sample. In the monzogranite samples MG-3 (1 mL/min) and MG-4 (5 mL/min), which were tested at lower injection rates, a single-wing crack was induced on only one side of the wellbore. However, the MG-5 specimen, which was tested at the injection rate of 10 mL/min, developed a double-wing crack symmetrical to the wellbore axis; this crack was similar to the hydraulic crack formed in the granodiorite samples G-1 and G-2. The MG-6 sample that was tested at a higher 25 mL/min injection rate exhibited a simple induced crack network consisting of three branch cracks on the side of the sample. As the injection rate increased, the number of recorded AE events increased significantly and the induced cracks became more complex. A complex hydraulic crack network is desirable in HDR engineering because it increases the heat transfer area of the reservoir.

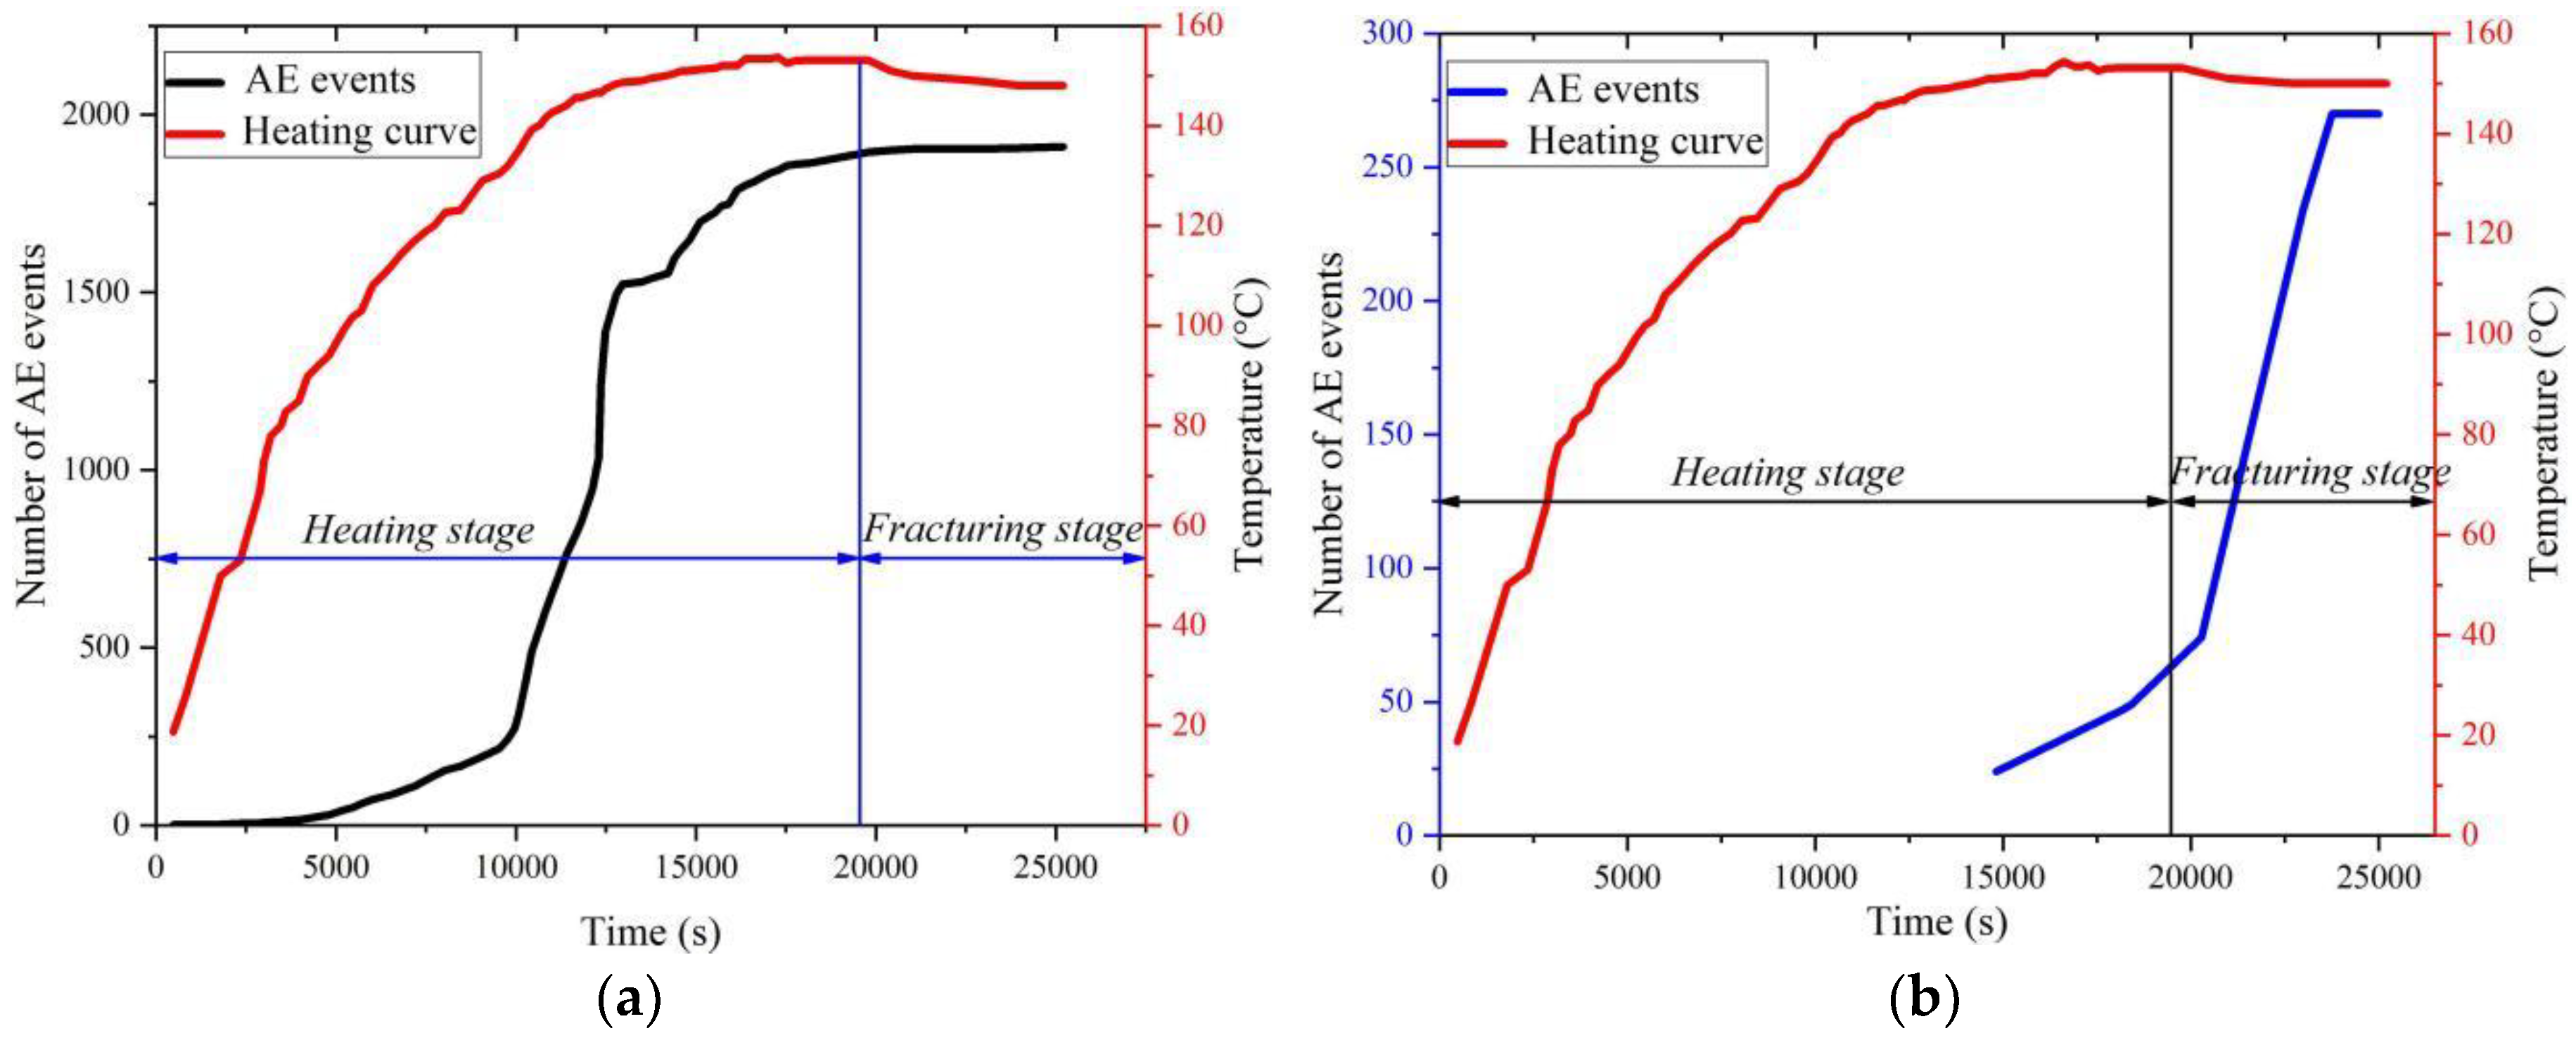
4.4. Effect of Temperature on Hydraulic Fracturing Behavior

The monzogranite samples MG-7, MG-8, and MG-9 underwent fracturing tests at a temperature of 150 °C. In contrast to the room-temperature fracturing results, the number of recorded AE events was higher, the breakdown pressure was greater, and the crack network was more complex.
Normally, the generation of microcracks occurs when the injection pressure reaches a certain value but we also recorded a large number of AE events during the heating process. This may be because the granitic mineral components with different thermo-elastic properties exhibit significant anisotropy when heated [35]. The monzogranite samples used in our high-temperature fracturing tests were complex mixtures of quartz (35%), plagioclase feldspar (30%), K-feldspar (23%), biotite (11%), and other minerals (1%). According to the experimental observations of Shao [36], an increase in the temperature induces thermal stresses on the rock matrix, resulting in the induction of thermally-induced cracks along pre-existing grain boundaries and weaker grains. The anisotropic expansion of different minerals may result in localized stress concentrations and once these stresses exceed the bond strength of different minerals or the internal strength of a particular mineral, either inter-granular or intra-granular cracks are initiated [13]. That is, the interaction of the temperature increase and the heterogeneity of the rock will exacerbate the micro-damage of the rock; thus, a large number of AE events were generated during the heating of the sample. The micro-damage likely enhanced the permeability of the sample, thereby increasing the injection rate threshold of the rock and resulting in the failed fracturing tests of the monzogranite samples MG-7 and MG-8 at 1 mL/min. The thermally-induced microcracks re-opened under the subsequent water pressure, resulting in a complex network of cracks. Additionally, the anisotropic expansion of the rock components due to heating produced dilatation of the rock block and increased the ambient confining pressure with increasing temperature (Figure 9a–c). The increase in confining pressure during high-temperature fracturing testing resulted in a higher breakdown pressure of the high-temperature samples than the room-temperature conditions.
Figure 13 shows that the number of recorded AE events of a sample increases with the increase in temperature. However, the change in the curve that records the number of AE events is relatively lagging with respect to the change in the temperature curve because the heat transfer of the rock takes a certain amount of time. As shown in Figure 13a, the first AE events at a threshold amplitude of 30 dB occurred at a temperature of 30 °C but the largest number of events were detected at temperatures of 130–148 °C. After the sample temperature stabilized at 150 °C, the number of recorded AE events no longer increased substantially. However, at a threshold amplitude of 60 dB for sample MG-8, the first detected AE events occurred at a temperature of approximately 150 °C and a large number of AE events occurred when the injection pressure was near the breakdown pressure (Figure 13b). These results suggest that more intense micro-cracking occurs primarily during the fracturing process, whereas weak micro-cracking occurs predominantly during the heating stage. The MG-9 test with a 60 dB threshold setting recorded 351 AE events, and AE events also occurred in large numbers near the breakdown pressure. This is well understood because the anisotropic expansion stress between the components caused by rock heating is weaker than the fluid pressure during fracturing.
The number of generated AE events was significantly lower during room-temperature fracturing than high-temperature fracturing. Figure 14 shows the changes in the injection pressure and the amplitude of the induced AE events during the hydraulic fracturing test of the monzogranite specimen MG-3 at an injection rate of 1 mL/min. The first AE events were recorded at an injection pressure of around 5.0 MPa but the largest number of AE events and high-amplitude AE events occurred near the breakdown pressure. This finding confirms the results of the high-temperature test of MG-8 at a higher threshold setting.

5. Discussion

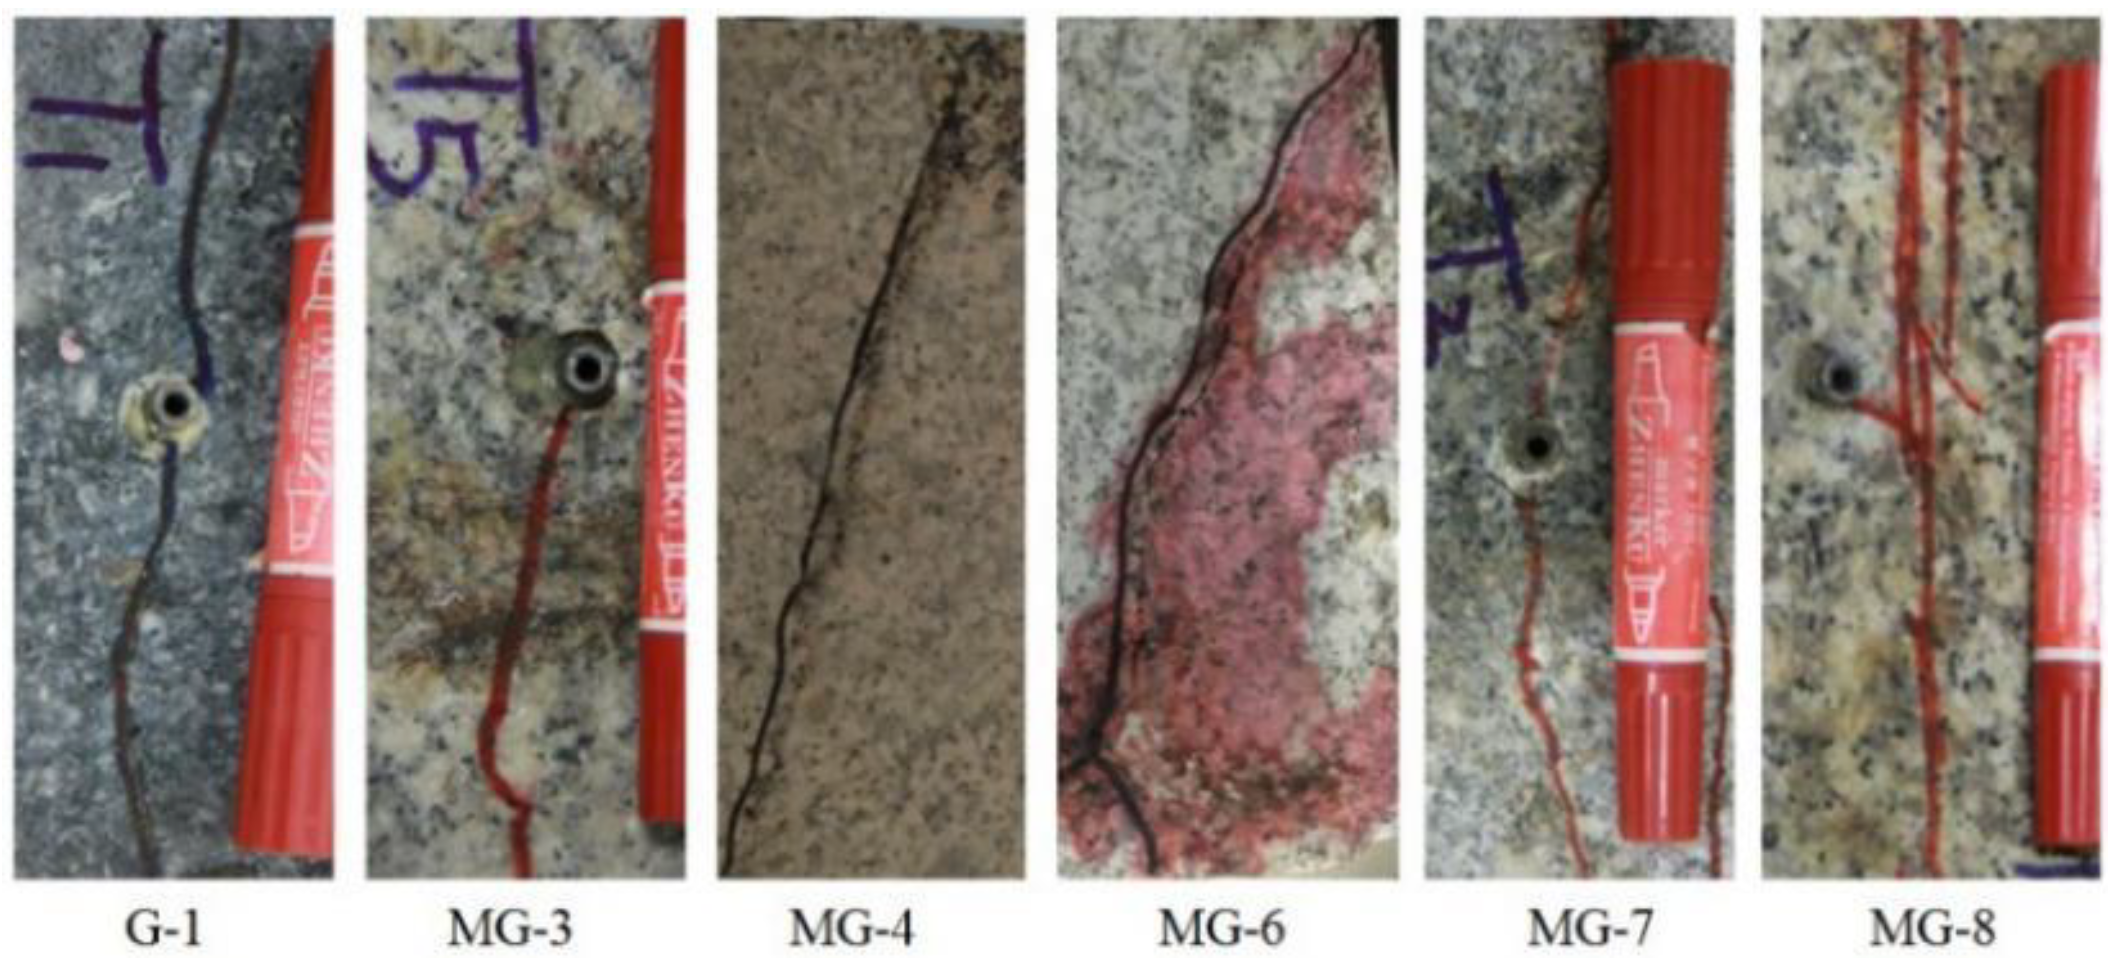
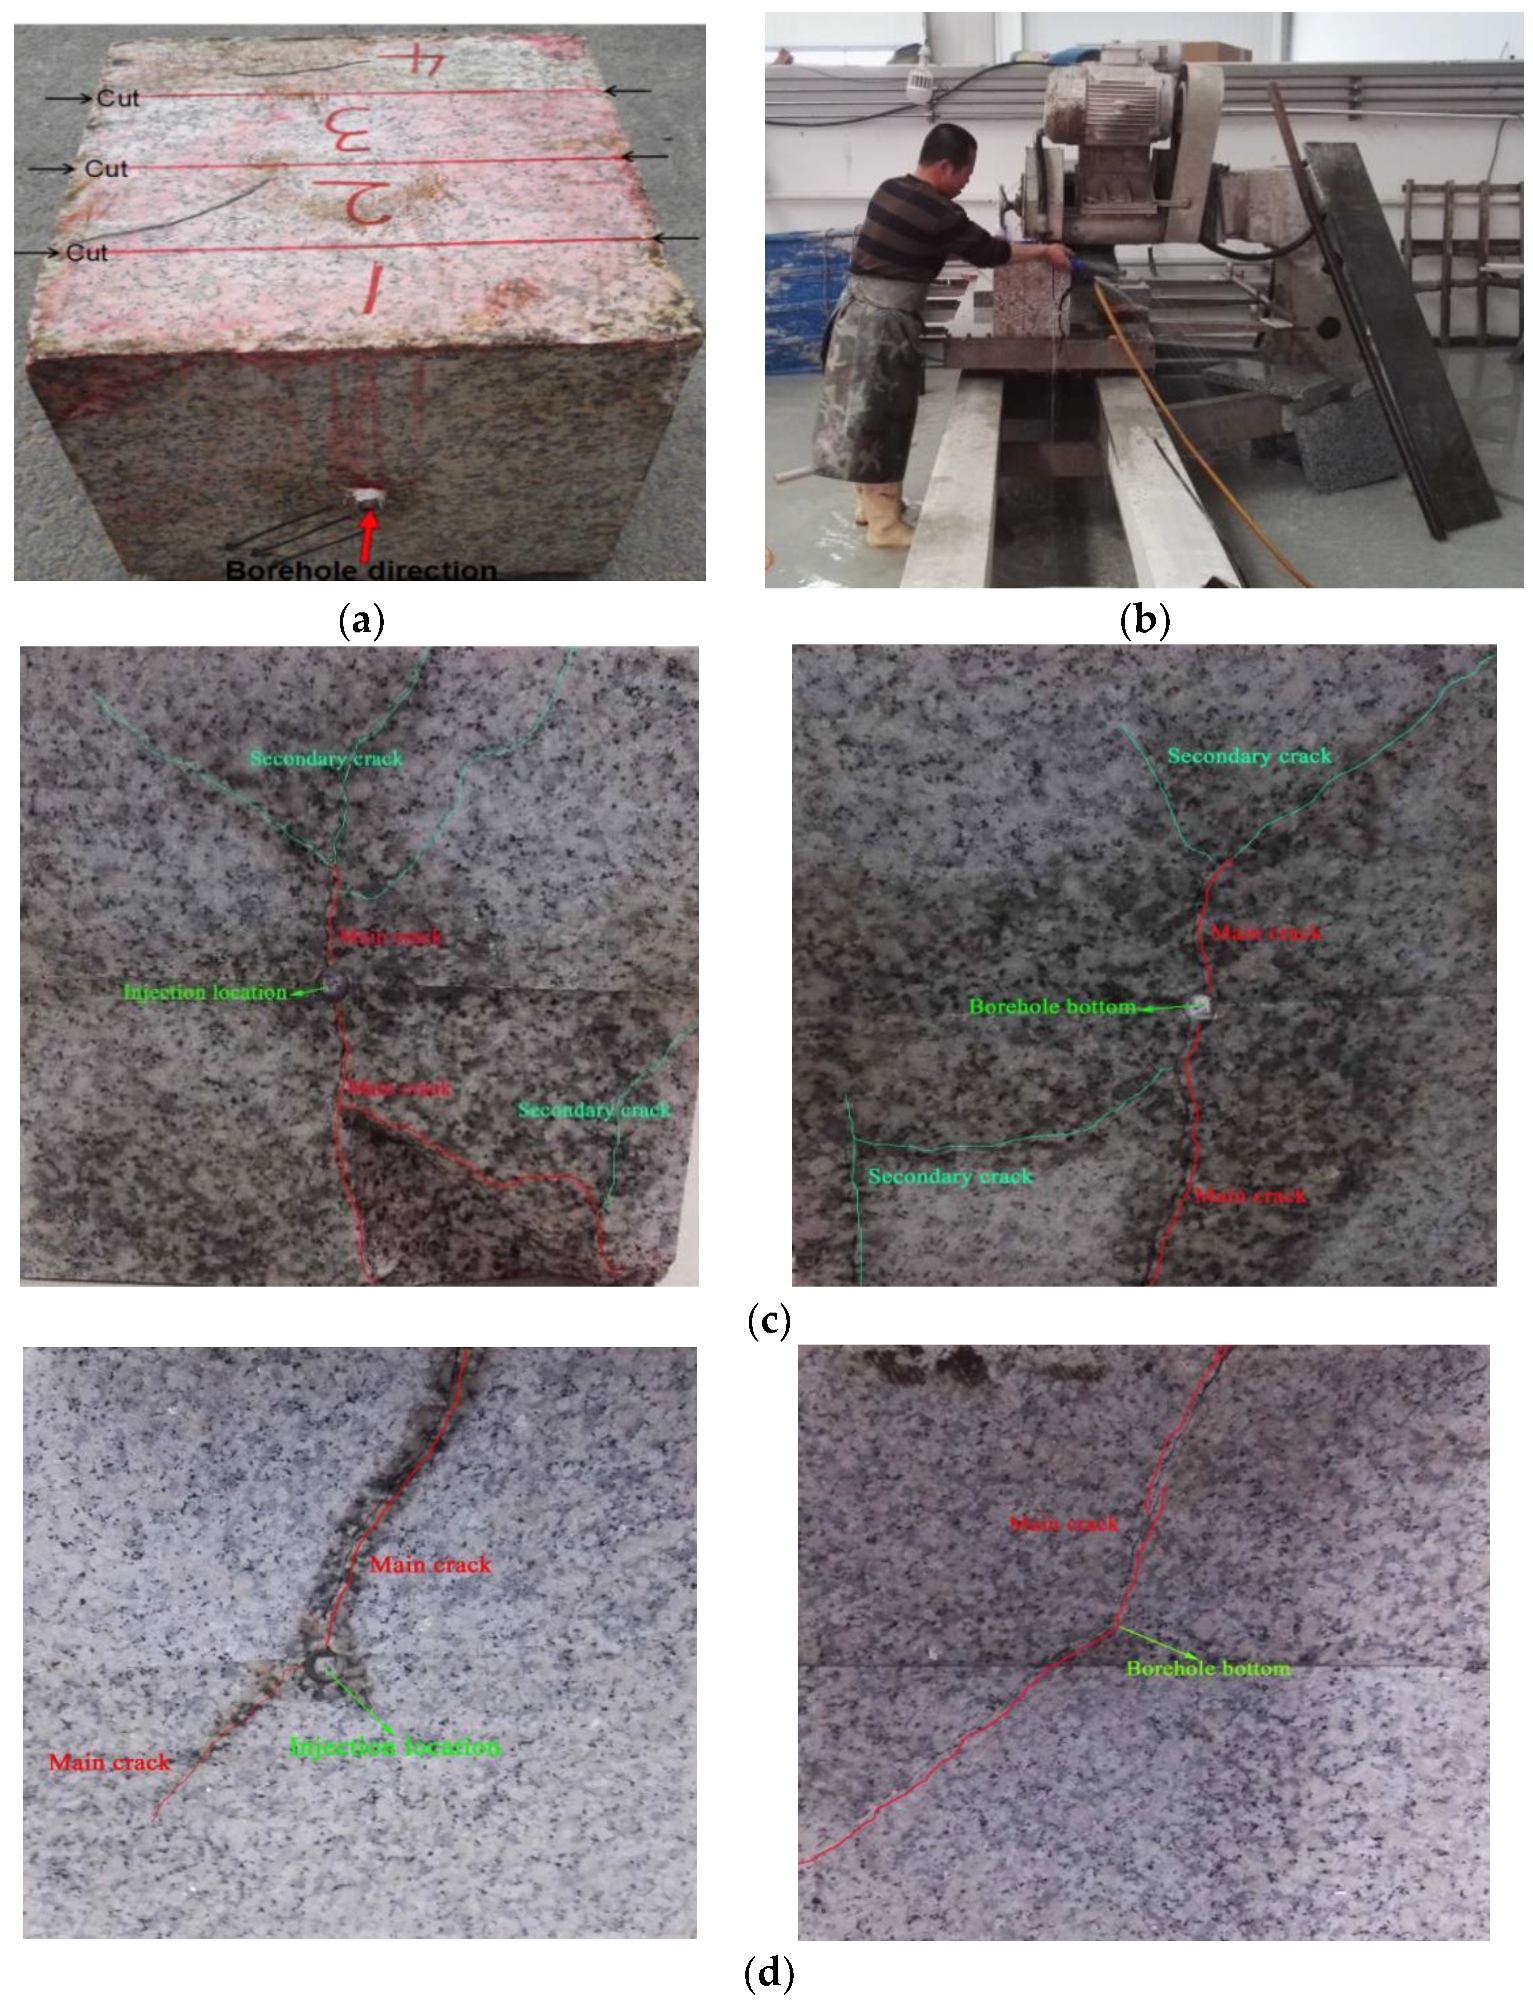
5.1. Geometric Characteristics of Hydraulic Cracks

The crack propagation path is generally determined by the interaction of the stress state, the pre-existing cracks, and the microstructural characteristics of the matrix. The induced cracks penetrated the entire sample block in all tests and the heights and lengths were similar, thus, the key difference in the geometric characteristics of the induced cracks was the crack aperture. It is evident that the crack aperture varies along the flow path, especially in the monzogranite samples (Figure 15). In contrast, the crack aperture of the granodiorite samples exhibited little change along the propagation path. This is attributed to the larger grain size distribution of the monzogranite (0.2–3.0 mm) than the granodiorite (0.2–2.0 mm). A comparison of the induced cracks in the monzogranite samples MG-3 (1 mL/min), MG-4 (5 mL/min) and MG-6 (25 mL/min) indicates that the crack aperture increases with the increase in the injection rate. The crack apertures of the samples MG-6 and MG-7, which were both tested at high temperature, were slightly larger than that of the sample MG-4 (5 mL/min). These results indicate that the high temperature and high injection rates are beneficial for water fracturing stimulation of HDR reservoirs.
The samples MG-4 and MG-6 were cut into four slices perpendicular to the drilling direction to determine the morphology of the internal hydraulic cracks (Figure 16). As shown in Figure 16c,d, the main crack was roughly deflected towards the direction of maximum horizontal stress (σH). In contrast to the sample MG-4, the propagation of multiple cracks was triggered in the sample MG-6, which confirmed the results obtained from the AE test. Due to the higher injection rate into the rock drill bore, the propagation of multiple micro-cracks was triggered. The figure shows that local damage occurred due to the propagation of secondary cracks. It is well-known that the crack aperture decreases with crack propagation due to the dissipation of injection pressure and this decrease can be clearly observed in our test results. Figure 16c,d show that the crack aperture decreases with the fluid path and even some secondary cracks terminate without propagating to the surface of the specimen. Although the crack apertures of these secondary induced cracks are relatively small compared to the main hydraulic crack, they can increase the complexity of the hydraulic crack network and thus increase the heat exchange area in the HDR reservoir.

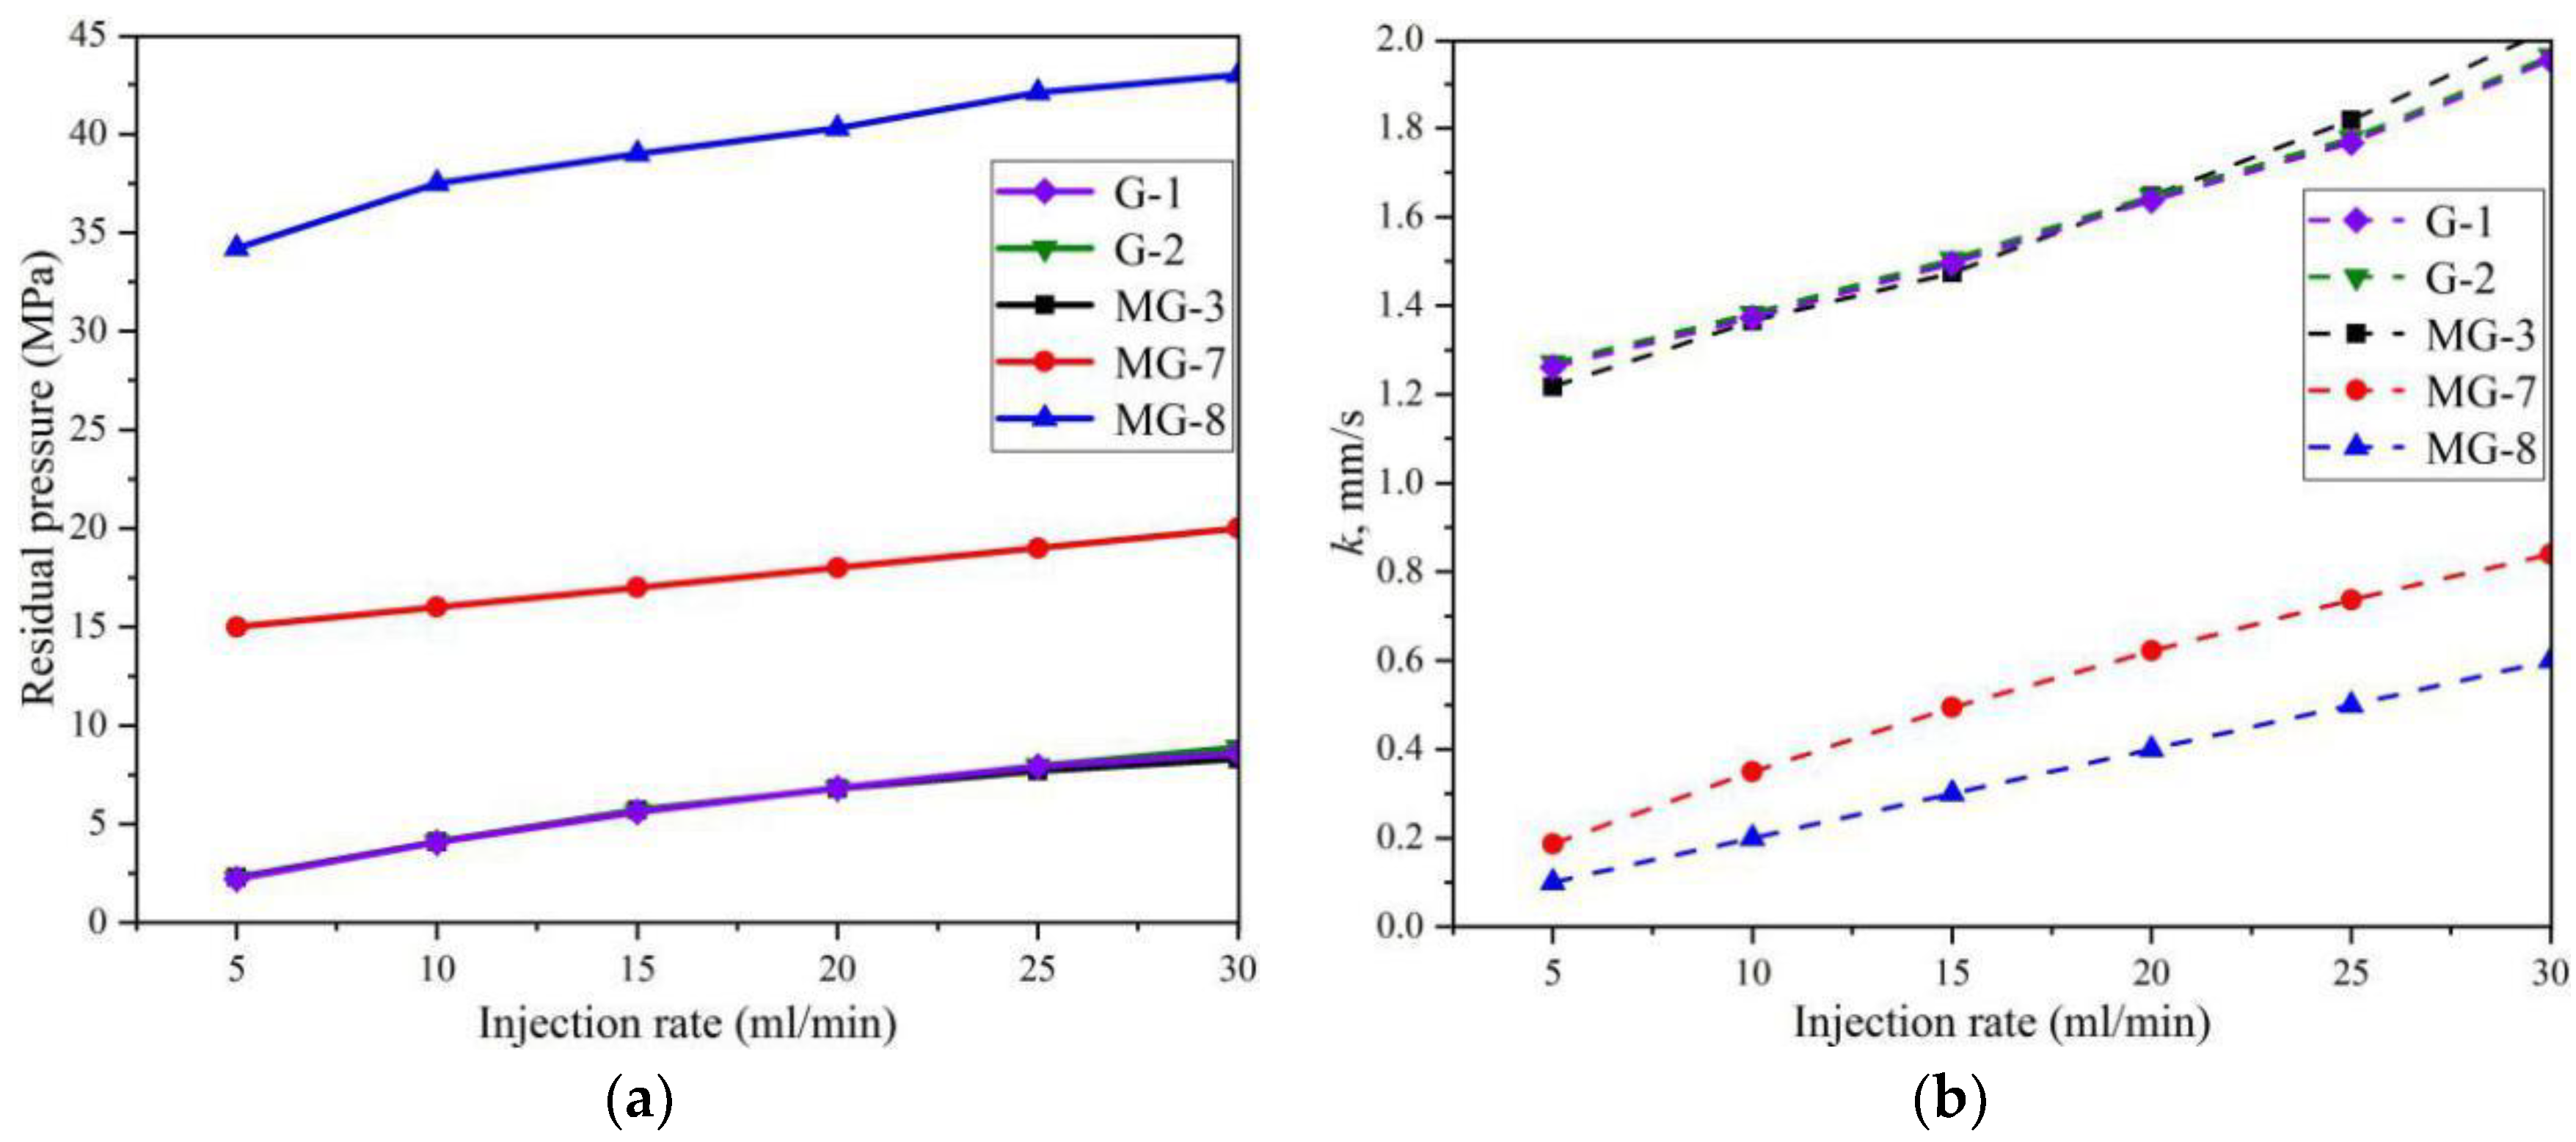
5.2. Seepage Characteristics of Hydraulic Crack

The in-situ residual pressures of the induced cracks in samples G-1, G-2, MG-3, MG-7, and MG-8 were measured at different injection rates (5, 10, 15, 20, 25, 30 mL/min), as shown in Figure 17a. We applied the next higher water injection rate whenever the pressure increase was stable. Because the fluid pressure at the exit of the induced crack is 0 MPa, the residual pressure recorded is the seepage pressure (Ps) of the hydraulic crack. The seepage pressure increased linearly with the increase in the injection rate under the same confining pressure. The hydraulic conductivity (k) of the induced crack was calculated using Equation (2) [34,37]:
k = q L γ w Δ p A
where k is the hydraulic conductivity, mm/s; q is the flow rate in the hydraulic crack, ml/min; L is the length of the sample, mm; γw is the specific gravity of water, N/m3; A is the cross-sectional area of the sample, mm2; ∆p is the fluid resistance of the crack, MPa. Since L, γw, and A are the same, the ratio of flow rate to seepage pressure reflects the change in the hydraulic conductivity of the induced crack. As shown in Figure 17b, the hydraulic conductivity (k) of the induced crack increased linearly with the increase in the injection rate. For the G-1, G-2, and MG-3 samples that were tested at room temperature, the hydraulic conductivity of the induced crack is in the range of 1.2–2.0 mm/s. For the MG-7 and MG-8 samples that were tested at 150 °C, the hydraulic conductivity of the induced crack is in the range of 0.1–0.8 mm/s. Although the hydraulic crack apertures in the granodiorite specimens G-1 and G-2 are slightly larger than those of the monzogranite specimen MG-3 in the unconfined state, their crack conductivity values were the same at a closure pressure of 4 MPa (σv/σH/σh is 6/10/4 MPa). This may be due to the very small difference in grain size distribution between the two types of granite. In addition, the crack apertures of the heated samples MG-7 and MG-8 are significantly larger than that of the room-temperature specimen MG-3 in the unconfined state but the in-situ conductivity of the crack of the former sample is significantly smaller than that of the latter because the former samples were measured at a higher closure pressure (σv/σH/σh about 12/12/12 MPa and 12/16/10 MPa, respectively). These results indicate that the hydraulic cracks induced by water fracturing in these particular granites maintained a certain fluid conductivity in a self-propping mode and the conductivity was mainly affected by the confining pressure state.

5.3. Application for Geothermal Energy Mining

Generally, the EGS system development tends to take place on naturally fractured formations with a degree of in situ pre-stimulation permeability. Because such a formation is beneficial to create a number of interconnected hydraulically-induced cracks to enhance the thermodynamic efficiency and production of the reservoir [1,38]. However, geothermal reservoirs usually develop in tight, nearly impermeable rock formations, such as Indosinian granites in this study. Our experimental results have showed that high injection rates or heating effects can lead to a relatively complex induced crack network. High injection rate can activate more pre-existing microcracks in the rock mass leading to complex hydraulically-induced crack network; while thermal cracking can further increase the number of these pre-existing microcracks, which makes it likely for an impermeable rock to create effortlessly new hydraulic cracks. However, this thermal stimulation usually has certain requirements for reservoir temperature. Grant et al. proposed that it is much more efficient when the temperature difference between the injected fluid and the reservoir is greater than 100 °C [39]. Our experiments have also confirmed that when the Indosinian granite temperature is heated to 130–148 °C, the number of thermally-induced microcracks increases dramatically. Further, the formation temperature of the Qiabuqia geothermal field reached 150 °C at a depth of 2500 m. Therefore, in the development of the Qiabuqia geothermal field, it is applicable to conduct thermal stimulation pretreatment of the reservoir before water fracturing treatment is carried out.

6. Conclusions

A series of hydraulic fracturing experiments were conducted on two Indosinian granite types collected from the Qiabuqia geothermal field. The effect of the differences in rock properties on the hydraulic fracturing behavior was investigated by comparing the fracturing test results of granodiorite and monzogranite samples. The effect of the injection rate was investigated in the range of 1 to 30 mL/min. Further, we investigated the effect of the temperature on HDR reservoir stimulation by testing the samples in a 150 °C high-temperature fracturing environment. The major conclusions are as follows:
(1)
The rock properties that had a significant impact on hydraulic fracturing included hydraulic (mainly permeability) and mechanical parameters (mainly rock strength). Due to the heterogeneity of the samples (different strength characteristics, different mineralogy, different grain size distribution, pre-existing cracks, and different permeability), the breakdown pressure, injection rate threshold, and pressurization rate were different. High-strength rock exhibits high breakdown pressures under the same fracturing test conditions. For example, in the present study, the breakdown pressure of the high-strength monzogranite (samples MG-4 and MG-5) was significantly higher than that of the low-strength granodiorite (samples G-1 and G-2) under the same fracturing test conditions. The hydraulic parameters determined the injection rate threshold and affected the pressurization rate, which in turn affected the hydraulic fracturing behavior.
(2)
The injection rate was a key factor in distributing the fluid between existing cracks and developing cracks, thereby affecting the complexity of the hydraulic crack networks. A high injection rate simultaneously caused the propagation of multiple pre-existing microcracks in the rock block and multiple hydraulic cracks were induced at the same time.
(3)
The anisotropy of the mineral components resulted in a large number of microcracks in the granite during heating, which enhanced the permeability of the rock and increased the injection rate threshold. The existence of these microcracks induced by heating led to the hydraulic crack network complexity. This suggests that it may be a viable approach to use the thermal differential effect between the fluid and rock to thermally stimulate the HDR reservoir to increase the complexity of the hydraulic crack network.
(4)
In our experimental investigation, the geometric and seepage characteristics of the hydraulic cracks were clearly affected by factors such as the rock properties, injection rate, and temperature. The crack aperture changed along the propagation path and there was greater variability in the crack aperture in the samples with larger grain size distribution. In addition, a higher injection rate and higher temperature resulted in a greater number of microcracks initiated in the rock mass, resulting in a larger crack aperture. The fluid conductivity in the induced cracks was maintained at 0.1–0.8 mm/s at a closure pressure of 12 MPa and was mainly controlled by the confining pressure state.

Author Contributions

Y.Z. and Z.H. designed the theoretical framework; Z.L. completed the writing of the manuscript; Z.L. and L.L. completed the fracturing experiments; S.Z., L.F. and G.Y. provide financial support for the project.

Funding

This research received no external funding.

Acknowledgments

This study was supported by the National Key Research and Development Program of China, Topic 3 (NO.2018YFB1501803), the National Natural Science Foundation of China (No.41772238), and the Geological survey project of China Geological Survey (NO. DD20160192), the New Energy Program of Jilin Province (NO. SXGJSF2017-5).

Conflicts of Interest

The authors declare they have no conflicts of interest in any of the work presented in this article.

References

  1. Tester, J.W.; Livesay, B.; Anderson, B.J.; Moore, M.C.; Bathchelor, A.S.; Nichols, K. The Future of Geothermal Energy: Impact of Enhanced Geothermal Systems (EGS) on the United States in the 21st Century; An assessment by an MIT-led interdisciplinary panel; MIT Press: Cambridge, MA, USA, 2006. [Google Scholar]
  2. Hofmann, H.; Babadagli, T.; Zimmermann, G. Hot water generation for oil sands processing from enhanced geothermal systems: Process simulation for different hydraulic fracturing scenarios. Appl. Energy 2014, 113, 524–547. [Google Scholar] [CrossRef]
  3. Law, R. Deep geothermal UK-United downs project, Redruth. In Proceedings of the Ground Source Live Workshop, Manchester, UK, 8 June 2011. [Google Scholar]
  4. Wyss, R.; Rybach, L. Developing deep geothermal resources in Switzerland. In Proceedings of the 2010 World Geothermal Congress, Bali, Indonesia, 25–29 April 2010. [Google Scholar]
  5. Baria, R.; Baumgärtner, J.; Gérard, A.; Jung, R.; Garnish, J. European HDR research programme at Soultz-sous-Forets (France) 1987–1996. Geothermics 1999, 28, 655–669. [Google Scholar] [CrossRef]
  6. Durham, W.B.; Bonner, B.P. Self-propping and fluid flow in slightly offset joints at high effective pressures. J. Geophys. Res. Solid Earth 1994, 99, 9391–9399. [Google Scholar] [CrossRef]
  7. Chen, Z.; Narayan, S.P.; Yang, Z.; Rahman, S.S. An experimental investigation of hydraulic behaviour of fractures and joints in granitic rock. Int. J. Rock Mech. Min. Sci. 2000, 37, 1061–1071. [Google Scholar] [CrossRef]
  8. Kamali-Asl, A.; Ehsan, G.; Nicolas, P.; Nicholas, B. Experimental study of fracture response in granite specimens subjected to hydrothermal conditions relevant for enhanced geothermal systems. Geothermics 2018, 72, 205–224. [Google Scholar] [CrossRef]
  9. Caulk, R.A.; Ghazanfari, E.; Perdrial, J.N.; Perdrial, N. Experimental investigation of fracture aperture and permeability change within Enhanced Geothermal Systems. Geothermics 2016, 62, 12–21. [Google Scholar] [CrossRef]
  10. Taherdangkoo, R.; Tatomir, A.; Anighoro, T.; Sauter, M. Modeling fate and transport of hydraulic fracturing fluid in the presence of abandoned wells. J. Contam. Hydrol. 2019, 221, 58–68. [Google Scholar] [CrossRef]
  11. Taherdangkoo, R.; Tatomir, A.; Taylor, R.; Sauter, M. Numerical investigations of upward migration of fracking fluid along a fault zone during and after stimulation. Energy Procedia 2017, 125, 126–135. [Google Scholar] [CrossRef]
  12. Zhang, Y.J.; Guo, L.L.; Li, Z.W.; Yu, Z.W.; Xu, T.F.; Lan, C.Y. Electricity generation and heating potential from enhanced geothermal system in Songliao Basin, China: Different reservoir stimulation strategies for tight rock and naturally fractured formations. Energy 2015, 93, 1860–1885. [Google Scholar] [CrossRef]
  13. Kumari, W.G.P.; Ranjith, P.G.; Perera, M.S.A.; Li, X.; Li, L.; Chen, B.; Isaka, B.A.; De Silva, V. Hydraulic fracturing under high temperature and pressure conditions with micro CT applications: Geothermal energy from hot dry rocks. Fuel 2018, 230, 138–154. [Google Scholar] [CrossRef]
  14. Zoback, M.D.; Rummel, F.; Jung, R.; Raleigh, C.B. Laboratory hydraulic fracturing experiments in intact and pre-fractured rock. Int. J. Rock Mech. Min. Sci. Geomech. Abstr. 1997, 14, 49–58. [Google Scholar] [CrossRef]
  15. Warpinski, N.; Teufel, L. Influence of geologic discontinuities on hydraulic fracture propagation (Includes associated papers 17011 and 17074). J. Pet. Technol. 1987, 39, 209–220. [Google Scholar] [CrossRef]
  16. Morgan, S.P.; Li, B.Q.; Einstein, H.H. Effect of injection rate on hydraulic fracturing of Opalinus clay shale. In Proceedings of the 51st US Rock Mechanics/Geomechanics Symposium, San Francisco, CA, USA, 25–28 June 2017; pp. 17–873. [Google Scholar]
  17. Solberg, P.; Lockner, D.; Byerlee, J.D. Hydraulic fracturing in granite under geothermal conditions. Int. J. Rock Mech. Min. Sci. Geomech. Abstr. 1980, 17, 25–33. [Google Scholar] [CrossRef]
  18. Zeng, Z.; Roegiers, J.C. Experimental observation of injection rate influence on the hydraulic fracturing behavior of a tight gas sandstone. In Proceedings of the SPE/ISRM Rock Mechanics Conference, Irving, TX, USA, 20–23 October 2002. [Google Scholar]
  19. Solberg, P.; Lockner, D.; Byerlee, J.D. Shear and tension hydraulic fractures in low permeability rocks. Pure Appl. Geophys. 1977, 115, 191–198. [Google Scholar] [CrossRef]
  20. Zhuang, L.; Kim, K.Y.; Jung, S.G.; Diaz, M.; Min, K.B. Effect of Water Infiltration, Injection Rate and Anisotropy on Hydraulic Fracturing Behavior of Granite. Rock Mech. Rock Eng. 2019, 52, 575–589. [Google Scholar] [CrossRef]
  21. Jones, C.; Keaney, G.; Meredith, P.G.; Murrell, S.A.F. Acoustic emission and fluid permeability measurements on thermally cracked rocks. Phys. Chem. Earth 1997, 22, 13–17. [Google Scholar] [CrossRef]
  22. Rutqvist, J.; Freifeld, B.; Min, K.B.; Elsworth, D.; Tsang, Y. Analysis of thermally induced changes in fractured rock permeability during 8 years of heating and cooling at the Yucca Mountain drift scale test. Int. J. Rock. Mech. Min. Sci. 2008, 45, 1373–1389. [Google Scholar] [CrossRef]
  23. Keshavarz, M.; Pellet, F.L.; Loret, B. Damage and changes in mechanical properties of a Gabbro thermally loaded up to 1000 °C. Pure Appl. Geophys. 2010, 167, 1511–1523. [Google Scholar] [CrossRef]
  24. Nasseri, M.H.B.; Schubnel, A.; Young, R.P. Coupled evolutions of fracture toughness and elastic wave velocities at high crack density in thermally treated Westerly Granite. Int. J. Rock Mech. Min. Sci. 2007, 44, 601–616. [Google Scholar] [CrossRef]
  25. Reuschlé, T.; Haore, S.G.; Darot, M. The effect of heating on the microstructural evolution of La Peyratte granite deduced from acoustic velocity measurements. Earth Planet. Sci. Lett. 2006, 243, 692–700. [Google Scholar] [CrossRef]
  26. Yavuz, H.; Demirdag, S.; Caran, S. Thermal effect on the physical properties of carbonate rocks. Int. J. Rock Mech. Min. Sci. 2010, 47, 94–103. [Google Scholar] [CrossRef]
  27. Deng, J.; Lin, C.; Yang, Q.; Liu, Y.; Tao, Z.; Duan, H. Investigation of directional hydraulic fracturing based on true tri-axial experiment and finite element modeling. Comput. Geotech. 2016, 75, 28–47. [Google Scholar] [CrossRef]
  28. Fan, T.G.; Zhang, G.Q. Laboratory investigation of hydraulic fracture networks in formations with continuous orthogonal fractures. Energy 2014, 74, 164–173. [Google Scholar] [CrossRef]
  29. Lei, Z.H.; Zhang, Y.J.; Yu, Z.W.; Hu, Z.J.; Li, L.Z.; Zhang, S.Q.; Fu, L.; Zhou, L.; Xie, Y.Y. Exploratory research into the enhanced geothermal system power generation project: The Qiabuqia geothermal field, Northwest China. Renew. Energy 2019, 139, 52–70. [Google Scholar] [CrossRef]
  30. Mao, R.B.; Feng, Z.J.; Liu, Z.H.; Zhao, Y.S. Laboratory hydraulic fracturing test on large-scale pre-cracked granite specimens. J. Nat. Gas Sci. Eng. 2017, 44, 278–286. [Google Scholar] [CrossRef]
  31. Sarmadivaleh, M.; Joodi, B.; Nabipour, A.; Rasouli, V. Steps to conducting a valid hydraulic-fracturing laboratory test. APPEA J. 2013, 53, 347–354. [Google Scholar] [CrossRef]
  32. Guo, L.L. Test and Model Research of Hydraulic Fracturing and Reservoir Damage Evolution in Enhanced Geothermal System. Ph.D. Thesis, Jilin University, Changchun, China, 2016. [Google Scholar]
  33. Meyer & Associates. Mayer Fracturing Simulators. User’s Guide Meyer Fracturing Simulators; Unicode Inc.: Mountain View, CA, USA, 2011. [Google Scholar]
  34. Al-Busaidi, A. Distinct element modeling of hydraulically fractured Lac du Bonnet granite. J. Geophys. Res. 2005, 110. [Google Scholar] [CrossRef] [Green Version]
  35. Homand-Etienne, F.; Houpert, R. Thermally induced microcracking in granites: Characterization and analysis. Int. J. Rock Mech. Min. Sci. Geomech. Abstr. 1989, 26, 125–134. [Google Scholar] [CrossRef]
  36. Shao, S. Coupled Thermo-Hydro-Mechanical (THM) Behaviour of Rock Relevant to the Geothermal Industry. Ph.D. Thesis, Monash Univerisity, Melbourne, Australia, 2015. [Google Scholar]
  37. Li, Z.W. Research on Hot Dry Rock Fracture Seepage Heat Transfer Experiment and Reservoir Modeling Evaluation. Ph.D. Thesis, Jilin University, Changchun, China, 2016. [Google Scholar]
  38. Barla, G. Comprehensive study including testing, monitoring and thermo-hydro modelling for design and implementation of a geothermal system in Torino, Italy. Geomech. Geophys. Geo-Energy Geo-Resour. 2017, 3, 175–188. [Google Scholar] [CrossRef]
  39. Grant, M.A.; Clearwater, J.; Quinao, J.; Bixley, P.F.; Le Brun, M. Thermal stimulation of geothermal wells: A review of field data. In Proceedings of the Thirty-Eight Workshop on Geothermal Reservoir Engineering, Stanford, CA, USA, 11–13 February 2013. [Google Scholar]
Figure 1. Geological setting of Qiabuqia geothermal field (Left) and the target batholith (Right).
Energies 12 02138 g001
Figure 2. View of samples; (a) Granodiorite and (b) Monzogranite.
Energies 12 02138 g002
Figure 3. Scanning electron microscopy (SEM) images of pre-existing microcracks and micropores in granite; (a) Granodiorite and (b) Monzogranite.
Energies 12 02138 g003
Figure 4. Specimen preparation; (a) drilling the hole and (b) processed samples and wellbore.
Energies 12 02138 g004
Figure 5. The P-wave velocity distributions of the (a) granodiorite and (b) monzogranite.
Energies 12 02138 g005
Figure 6. (a) Schematic of the true tri-axial fracturing system; (b) close-up view of the system and (c) sample cell and schematic diagram of the loading method.
Energies 12 02138 g006
Figure 7. Fractured granodiorite samples and pressure-time curves for different injection rates. (a) G-1 sample (5 mL/min) and (b) G-2 sample (10 mL/min).
Energies 12 02138 g007
Figure 8. Fractured monzogranite samples and pressure-time curves for different injection rates. (a) MG-3 sample (1 mL/min), (b) MG-4 sample (5 mL/min), (c) MG-5 sample (10 mL/min), and (d) MG-6 sample (25 mL/min).
Energies 12 02138 g008aEnergies 12 02138 g008b
Figure 9. Fractured monzogranite samples under high temperature of 150 °C and pressure-time curves for different injection rates. (a) MG-7 sample (5 mL/min), (b) MG-8 sample (5 mL/min), (c) MG-9 sample (25 mL/min).
Energies 12 02138 g009
Figure 10. Typical pressure-time curve of Indosinian granite in the fracturing experiments.
Energies 12 02138 g010
Figure 11. (a) Pressure-time curve of granodiorite at 1 mL/min injection rate and (b) pressurization rate dP/dt versus injection pressure at different injection rates for the granodiorite and monzogranite specimens.
Energies 12 02138 g011
Figure 12. Number of AE events at different injection rates in room-temperature fracturing tests.
Energies 12 02138 g012
Figure 13. Number of AE events over time during the heating and fracturing test of the Monzogranite specimens. (a) MG-7 sample at a threshold amplitude 30 dB and (b) MG-8 sample at a threshold amplitude of 60 dB.
Energies 12 02138 g013
Figure 14. (a) AE amplitude recorded during the room-temperature fracturing test and (b) number of AE events over time of the MG-3 sample.
Energies 12 02138 g014
Figure 15. Geometric characteristics of the cracks in the samples after fracturing.
Energies 12 02138 g015
Figure 16. (a) Schematic diagram of the cutting method; (b) cutting process of the sample after fracturing; and (c,d) crack characteristics inside the monzogranite specimens (MG-4 and MG-6) after fracturing.
Energies 12 02138 g016
Figure 17. (a) Residual pressure and (b) conductivity of the induced cracks at different injection rates.
Energies 12 02138 g017
Table 1. The parameters of the granite specimens.
ParameterGranodioriteMonzogranite
Bulk Density, ρ2623 kg/m32590 kg/m3
Porosity, ϕ4.59%2.49%
Permeability, K0.7 mD0.26 mD
Elasticity modulus, E32.6–35.6 GPa40.7–43.5 GPa
Poisson’s ratio, μ0.28–0.330.19–0.25
Uniaxial compressive strength (UCS), σc109.0 MPa131.0 MPa
Tensile strength, σb11.5–13.9 MPa16.5–19.9 MPa
Specific heat capacity, C720–750 J/(kg·K)740–800 J/(kg·K)
Thermal Conductivity, λ2.25–3.0 W/m/K2.25–3.0 W/m/K
Main mineralsPlagioclase feldspar (45%), quartz (32%), K-feldspar (10%), biotite (10%), other minerals (approximately 3%)Quartz (35%), plagioclase feldspar (30%), K-feldspar (23%), and biotite (11%), other minerals (1%)
Grain size distribution0.2–2.0 mm0.2–3.0 mm
Table 2. Granite sample hydraulic fracturing test conditions; Gr. is granodiorite and MGr. is monzogranite.
Specimen NumberConfining Pressure, σh/σH/σv, MPaInjection Rate, mL/minTemperature Setting, °CLithology
G-16/10/45Room temperature, 20 °CGr.
G-210Room temperature, 20 °CGr.
MG-31Room temperature, 20 °CMGr.
MG-45Room temperature, 20 °CMGr.
MG-510Room temperature, 20 °CMGr.
MG-625Room temperature, 20 °CMGr.
MG-76/6/65High temperature, 150 °CMGr.
MG-86/10/45High temperature, 150 °CMGr.
MG-96/10/425High temperature, 150 °CMGr.
Specimen size300 × 300 × 300 mm, cube.
Fracturing fluidDistilled water

