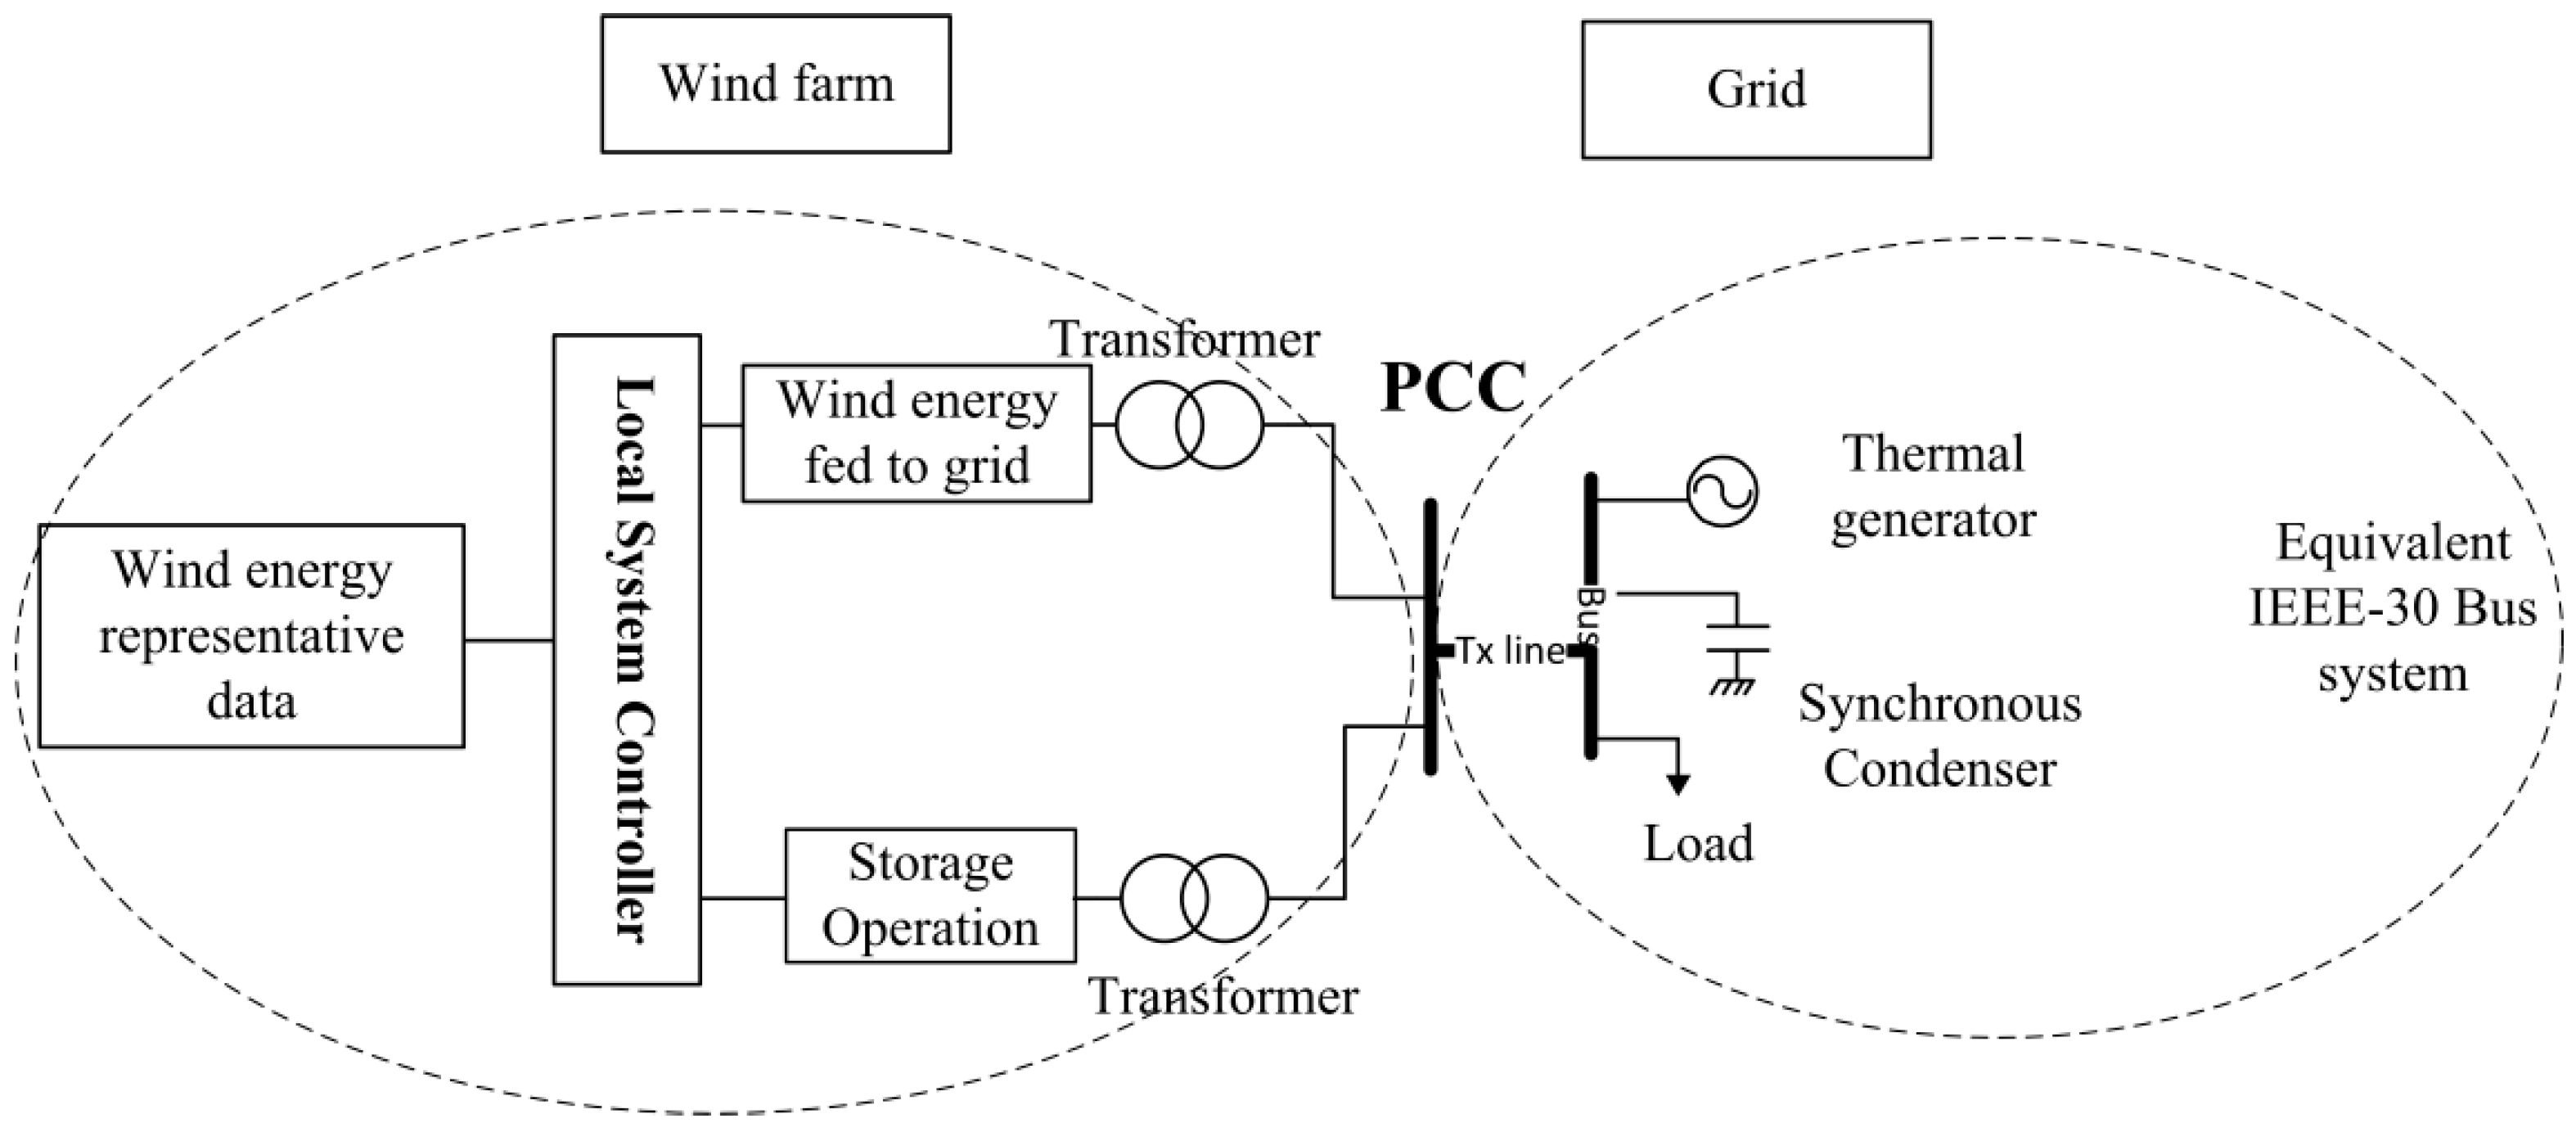
1. Introduction
Besides the cost of fuel (e.g., cost of coal and oil), the use of thermal generation is creating long lasting environmental problems from the release of many pollutant gases, such as SO
2, CO
2, and NO
x. As a result of the emission of pollutant gases and an increased demand for electrical energy, renewable energy generation is being included in the energy generation mix by many power producers all over the world. For example, countries, like China, the USA, and India, are leading renewable energy producers, integrating a huge amount of wind and solar energy sources [
1]. However, there is a clear fact that limits most power producers from the use of large amounts of these renewable energy sources. Because these renewable sources have a frequent variability and unpredictable characteristics, power producers are concerned about stability issues of the power system for an increased penetration level. In addition, the renewable energy uncertainty creates greater unpredictability and uncertainty regarding the amount of power generation from other sources to balance the load and system loss. Hence, the use of fast responding and mature storage technologies is considered a solution to these problems. Energy storage technologies (EST), depending on their response time, could be fast responding or slow responding. The high power capacity PHES and Compressed Air Energy Storage (CAES )technologies respond slowly compared to low power and fast responding battery energy storage and flywheel energy storage technologies [
2,
3,
4]. PHES is considered as the most mature energy storage technology, with their initial development in Italy and Switzerland dating back to the 1890s [
5] and the latter being adopted in other countries. Today, they account for 99% of the global large scale energy storage and 3% of global energy generation [
3]. These storage technologies are based on the use of two water reservoirs located at different heights. During the off-peak hour of the day, water is pumped (pumping mode) to the higher reservoir using the generated electricity from other sources. During the peak-hour of the day, water from the upper reservoir is used to generate electricity (generating mode) to compensate the peaking loads. Depending on the number of penstocks and the operation strategy of these two operation modes, PHES can be a single or double penstock type. In the single penstock configuration, the pumping and generating modes do not happen simultaneously while in the double penstock configuration, pumping and generating can be done simultaneously [
6]. In the single penstock configuration, a single machine is used as a pump and generator. After the generation of electricity, the water exits to the natural flow of the river/lake where the PHES is integrated with or could be limited to the artificially constructed lower reservoir without having any contact with the river or lake. Based on this, PHES are grouped as open loop and closed loop PHES [
7]. PHES are known for their high power capacity and theoretically unlimited energy capacity. Their power capacity, depending on the pressure and flow rate of the water, ranges to 3000 MW while the energy capacity is unlimited, only being limited to the reservoir size [
5,
6]. Technically, however, the PHES has a limited reservoir and hence a limited energy capacity. It has a higher cycle efficiency, ranging to 87%, a long life time of up to 60 years, and a long discharging time of 1 to 24 h [
4]. A detailed review of these storage technologies can be found in [
3,
4,
5,
6,
7,
8].
PHES had many advantages in the power system. For example, they can be used in peak shaving, valley filling, and load leveling operations. By charging at one point in time and discharging at another point in time, these ESTs are used in the time shifting of energy sources. Before their use in renewable energy integration applications, PHES technologies were integrated with fixed output nuclear power plants for peak shaving of frequently changing peak loads [
9,
10,
11]. The research in [
11] studied a techno-economic review of an existing and new pumped hydro energy storage plant. The historical developments of these storage tools showed that the world is showing interest in the use of these tools in the power system especially for renewable energy integration applications. According to the paper, countries, like Japan, the USA, Spain, and Germany, have a huge installed capacity of PHES tools. The research in [
10] described the historical development of PHES in Germany, and the challenges and the opportunities available for the new development of these storage tools. After the 1990s, the development of PHES technologies slowed down due to government policies towards their operation. The high cost of transmission charging, water pollution, and fees; effect to local ecosystem; local acceptance; and fish killing issues were also among the contributors for the decreasing trend in the use of these tools. Similar studies in the USA were conducted by [
9], stating the historical development, the grid advantages of PHES, and the status of and operation of new projects. As the world is highly interested in investing in more renewable energy sources, the development of PHES technologies has started to emerge again. However, the high cost of capital investment, operation and maintenance cost, and the cost of replacement affect the decision of power system companies to use these tools. Therefore, the optimal sizing of EST tools is considered as a power system planning process. To promote the use of ESTs, the Korean government subsidizes power producers who integrate storage to the wind farm. Similarly, the Jeju Island legislated that power producers must have ESTs installed in their wind farm with at least a 10% charging and discharging capacity relative to the wind farm name plate capacity [
12]. Even if the use of ESTs is promoted through subsidization and legislation, the economic feasibility of ESTs is a big problem for many power producers.
Storage sizing studies were conducted by many researchers both in the time and frequency domain using data ranging from days to years. The researchers in [
13,
14,
15] applied a Discrete Fourier Transform DFT based frequency analysis of the error signal to size energy storage devices. In these studies, the use of storage devices was utilized to fill the forecasting error so that power system issues arising from such errors were reduced. Such approaches cannot handle wind energy fluctuations. In such situations, conventional units must be used to balance wind energy fluctuations. This undesirable operation will increase the generation of conventional units and hence increase the cost and pollutant gas emission. Therefore, the reference signal to decide for the operation of storage units should be properly chosen. The time domain approaches, on the other hand, use specific daily data for their analysis [
16]. In the paper, the authors sized the capacity of a battery energy storage system for load leveling and voltage control operation. In other studies, the sizing of energy storage considering seasonal variation was studied through a deliberate choice of daily data for the sizing process. These approaches lack a consideration of the true nature of wind energy generation. The researchers in [
17] sized energy storage units based on their advantage of wind power firming. Here, the revenue obtained as a result of not installing additional generators, the better system voltage profile, the better grid reliability, and the emission related benefits were used for determining the size of storage tools. Chin H. Lo in [
18] modeled a battery energy storage system for utility load-leveling operations using the Kansas City Power and Light system as a model. Defining the charge and discharge point in the method was determined based on the average daily load profile as a reference. Pinson et al. in [
19] studied the dynamic sizing of energy storage for wind energy forecast uncertainty problems. They considered the effect of the wind power variation sequence in the sizing effect. Bludszuweit in [
20] used the idea of the unmet energy of the error signal to the size the storage tool. They stated that a 5% allowance of unmet energy could reduce the sizing of the energy storage within a 50% value. Brown et al. in [
21] described an optimization of pumped hydro storage for an isolated power system with renewable integration. They created representative data for historical recorded data of the system using the fuzzy clustering technique for each hour of a day. Navid in [
22] proposed a mixed integer linear programming method of sizing battery energy storage for a microgrid where one day’s data was used for the analysis. Brekken in [
23] studied optimal energy storage sizing and control for wind power applications using one day’s data of actual wind and its forecast data using a one hour-ahead persistence model. In [
24], single-level and two-level model predictive controller based hybrid energy storage systems were studied. The study concluded that while the single-level model predictive controller helps storage scheduling to follow the grid schedule, the two-level model predictive controller gives the advantage of reducing the optimization time by 60%. However, based on the data presented, we found that the size of storage used was twice the size of the wind farm. For example, the charging and discharging power for the PHES was 100 MW for the wind farm of 50 MW. The research presented in [
12] applied a Markov decision process to identify the optimal operating policy of ESTs in a hybrid system. They concluded that the sizing of ESTs is dependent not only on the amount of investment but also on the characteristics of the wind energy generation profile. In their study, the researchers assumed that the uncertain variables, such as the wind power generation and electricity price value, evolve according to discretized models. However, these assumptions could not be met as both wind energy and electricity price values are dynamic.
The use of a specific day’s daily data for the sizing and planning of an energy storage system will not give an optimal result. This is because daily wind data cannot represent the true nature of a wind energy generation profile. Therefore, storage sizing for a planning process needs to consider large recorded historical data. However, due to the many variable sizes, the direct application of one year or longer data for optimal sizing could be very difficult and will take too long even with a powerful machine. For example, the authors in [
25] used a large date analysis methodology to size an energy storage unit using a superpower computer by doing a very large number of simulation sets that increase the computation burden. Therefore, we proposed the application of a new way of characterizing wind energy generation profiles to reduce the variable size and competition time without affecting the stochastic nature of a wind energy profile. In addition, the advantages and cost effectiveness of ESTs are underestimated only because of the cost of their investment while their emission free energy generation has not been considered in many studies. That is, comparing these ESTs to the emission generating thermal units only by considering the cost of the fuel of these thermal units undersizes ESTs.
Reducing the variable size by clustering data points with similar characteristics will help reduce the competition burden. We believe that data recorded for a long time for a particular wind energy generation site could truly represent the seasonal and topographical weather related and time factors for wind energy generation characteristics. As already explained earlier, the direct use of such recorded data increases the computation time and burden. We therefore propose a variable reduction technique through the data clustering of data points with similar characteristics. The average based clustering recognizes the seasonal and day-to-day variations. On the other hand, the variation based clustering recognizes the hour-to-hour variation in a day. The combination of these two methods integrates seasonal and daily variations to wind energy generation profiles. Besides the use of clustering techniques for variable size reduction, the application of emission constrained optimization increases the combined cost of generation and the emission cost of conventional units. By doing so, the use of the conventional units is disfavored while favoring the use of storage tools.
Therefore, in this paper, one year wind energy generation data from the Northern Ireland grid [
26] was considered for the sizing of PHES for the IEEE-30 bus [
27] system with a 30% penetration level. Integral numbers of the representative data called scenarios were generated based on clustering techniques and were used in sizing the storage tool. The daily average and variation of energy generation per day were taken as characteristics in the clustering algorithm. Emission constrained optimal generation and storage sizing based on the PSO algorithm was applied. The expected value method (calculation) for a stochastic variable was used in the final storage size determination. Validation was done for the cost of generation per day for all scenarios and compared with the daily cost without storage.
The contribution of this paper includes: (1) The devising of a new methodology of reducing data and the variable size and consequently the computation time for energy storage planning and optimal sizing for renewable energy operation; and (2) indicating the favorable conditions for the use of energy storage through the use of an emission constrained optimization approach.
The remainder of this paper is organized as follows. Part two describes the mathematical modeling applied for both the storage function and system cost related functions; part three includes the stochastic modeling and the methods thereof (stochastic and k-means clustering); the simulation results and discussions are included in part four whereas the last section in part five concludes the paper.
3. Stochastic Modeling
The determination of the size of energy storage units, pertaining to the variation of renewable energy generation, is a very difficult task. On the one hand, if storage is sized for a worst case renewable energy profile, the investment cost will be higher whereas if storage is sized for a better renewable profile, the size of storage will be minimal. In this second case, the goal of limiting wind fluctuation will not be met. In a power system planning process, component sizing is a onetime planning process; hence, storage sizing is also.
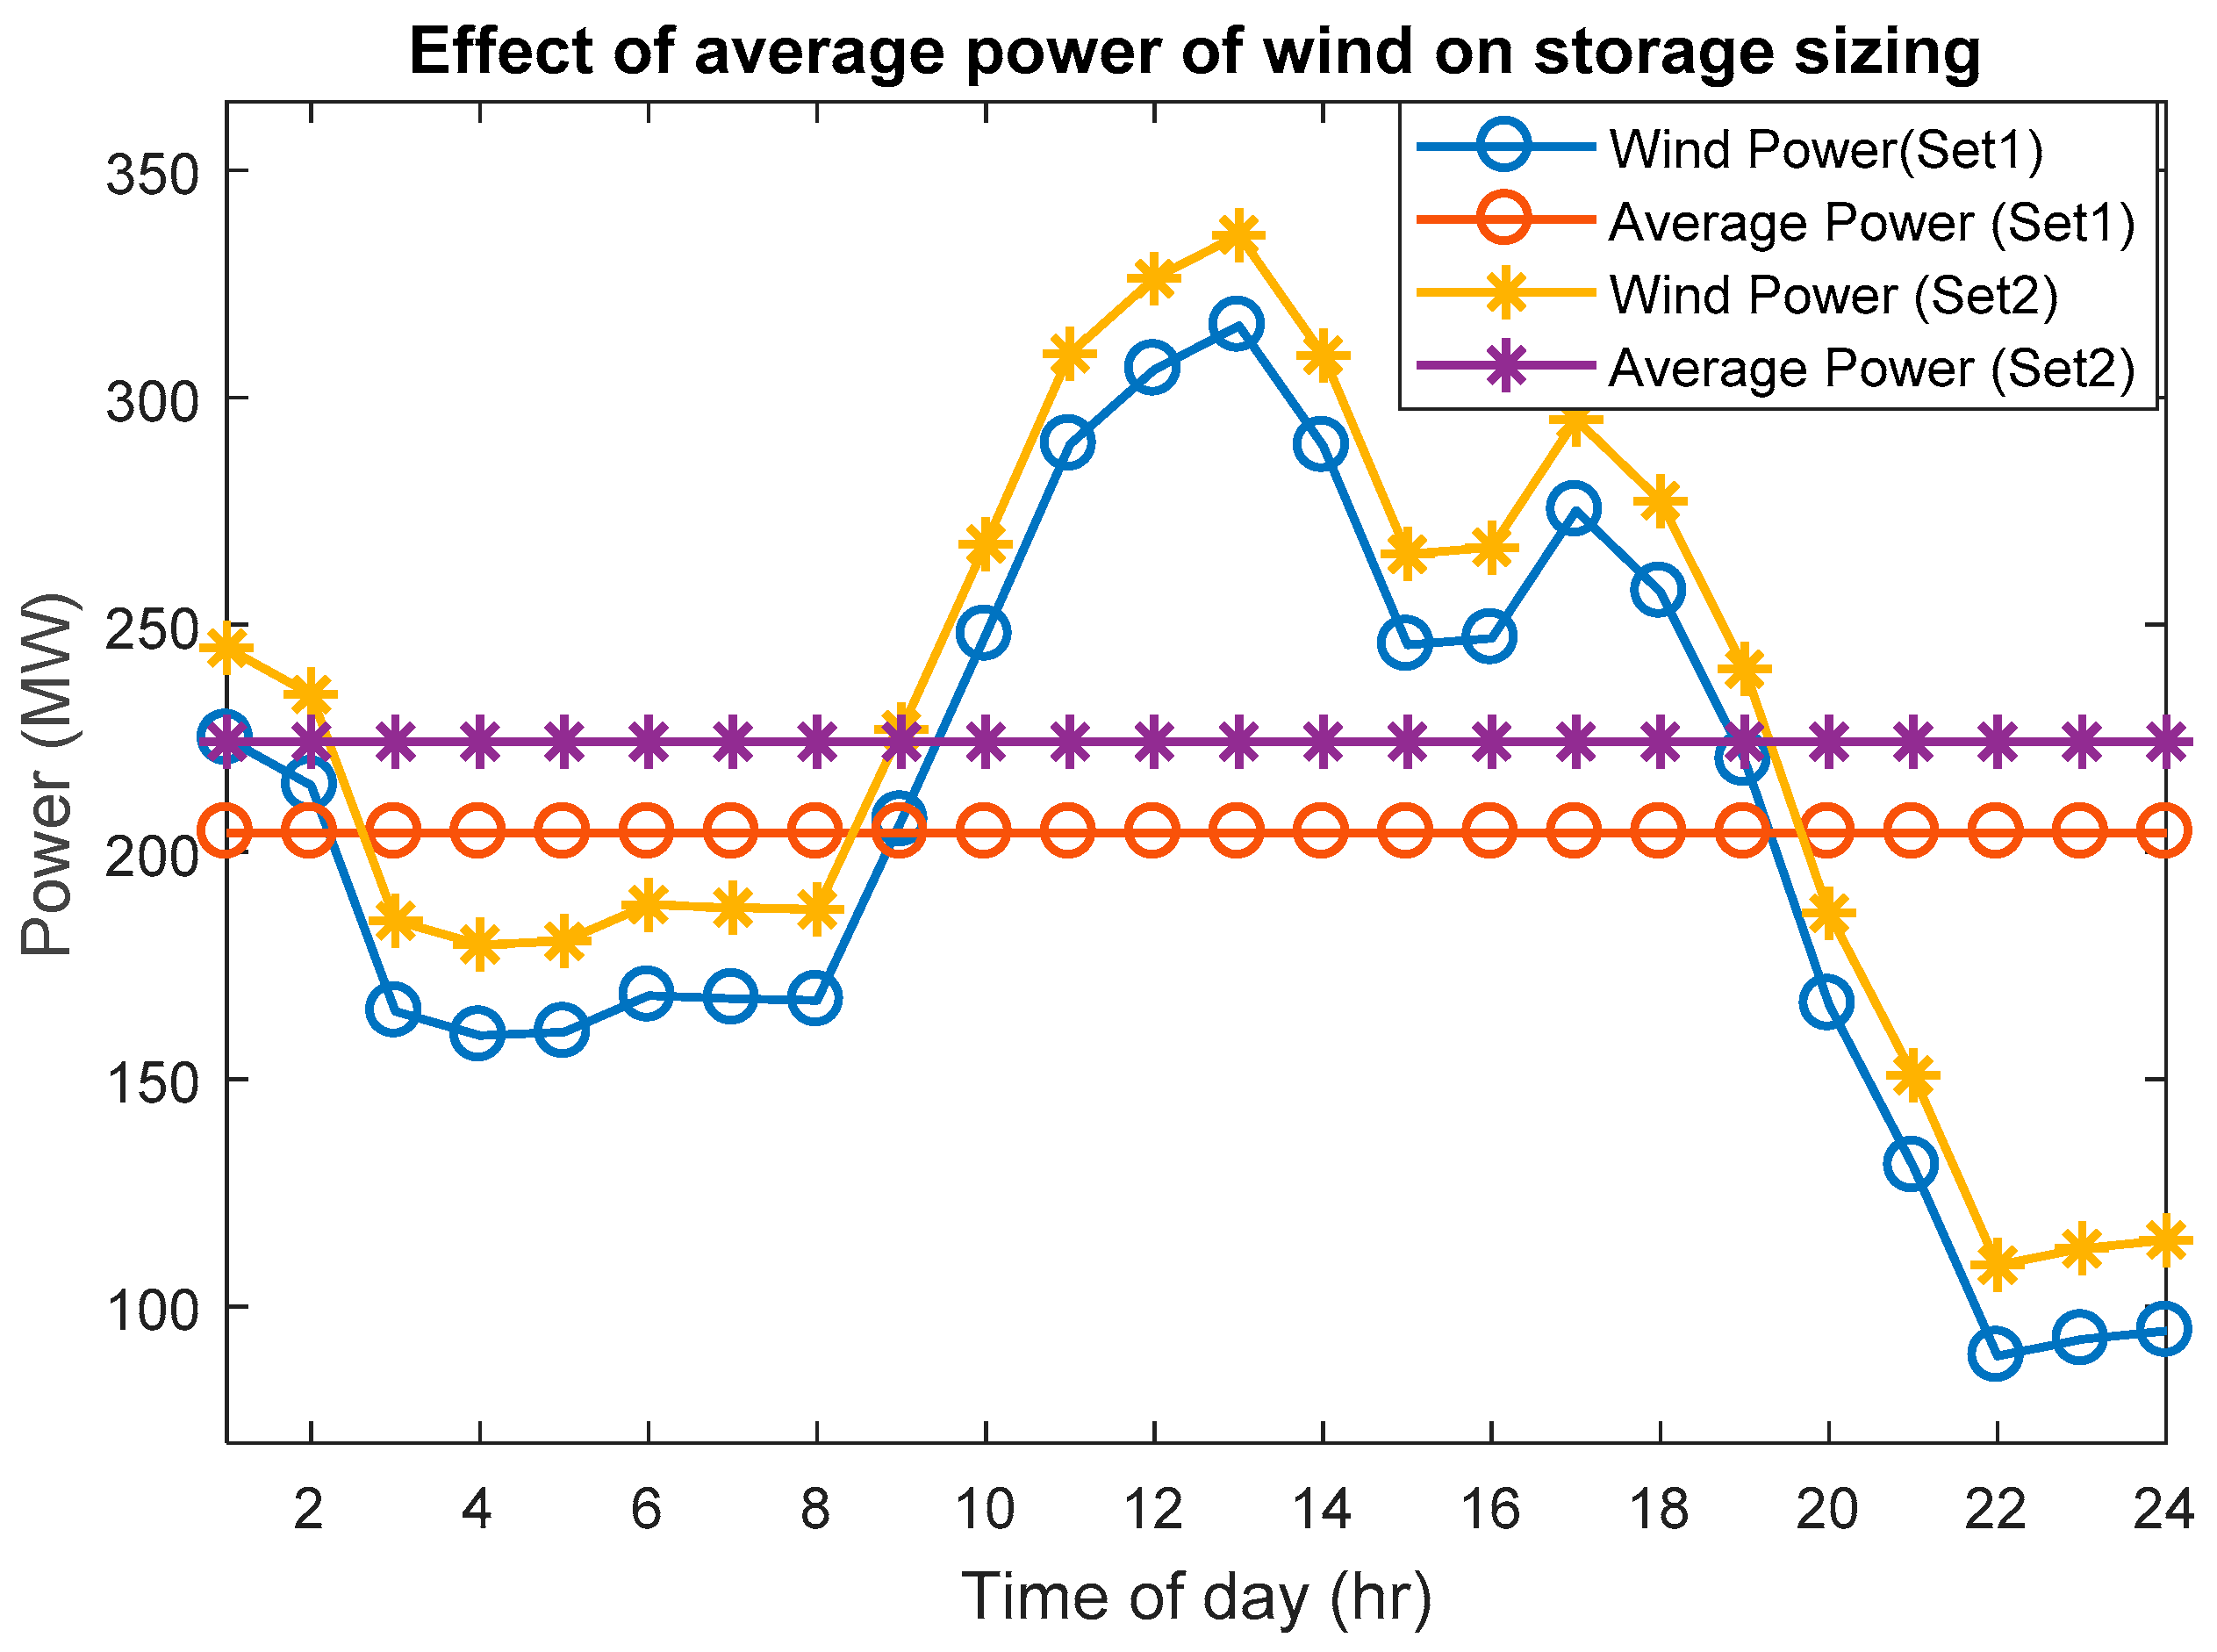
Wind energy generation for a particular site and a specific penetration level may have a very large range of generation profiles. The wind energy generation profiles can be described by the daily average value and daily variation. A wind farm with a higher daily average wind power generation and lower variation needs a smaller storage size to stabilize the fluctuation whereas a one with higher variation needs a higher storage size. The reason for this is very simple: As the cost function of thermal units is not linear, a wind farm with different average power but even similar variation will result in a different optimal generation point in the storage sizing and also the thermal units’ scheduling. To check this, the daily wind data (wind power set 1) plotted in
Figure 2 was manipulated such that the average wind data was shifted to some higher average value from the original (wind power set 2), keeping the variation the same. The proposed optimization algorithm was used to check the optimality of the storage in the two cases. The result showed that the daily total cost in the second case was lower than in the first case.
Similarly, the effect of the sequence (pattern) of wind energy variation had a significant effect in the sizing of the storage units. In some cases, wind energy variation is such that the next variation compensates the previous one so that a smaller size of storage, energy capacity, is enough whereas in other cases, the variation might be cumulative in a sequence of steps and only after a while will the variation sequence change and require larger storage sizes.
Therefore, to reduce the variable size and find representative data for the wind record, the yearlong data was clustered after being characterized according to the storage requirement. Since storage requirements are related by the average power and daily wind variation, representative wind data was generated to represent its stochastic nature by characterizing the wind data based on a separate and combined consideration of the wind power’s average and daily variation. The final optimal storage size was decided based on the expected value function using all the generated representative data.
3.1. Representative Data Generation
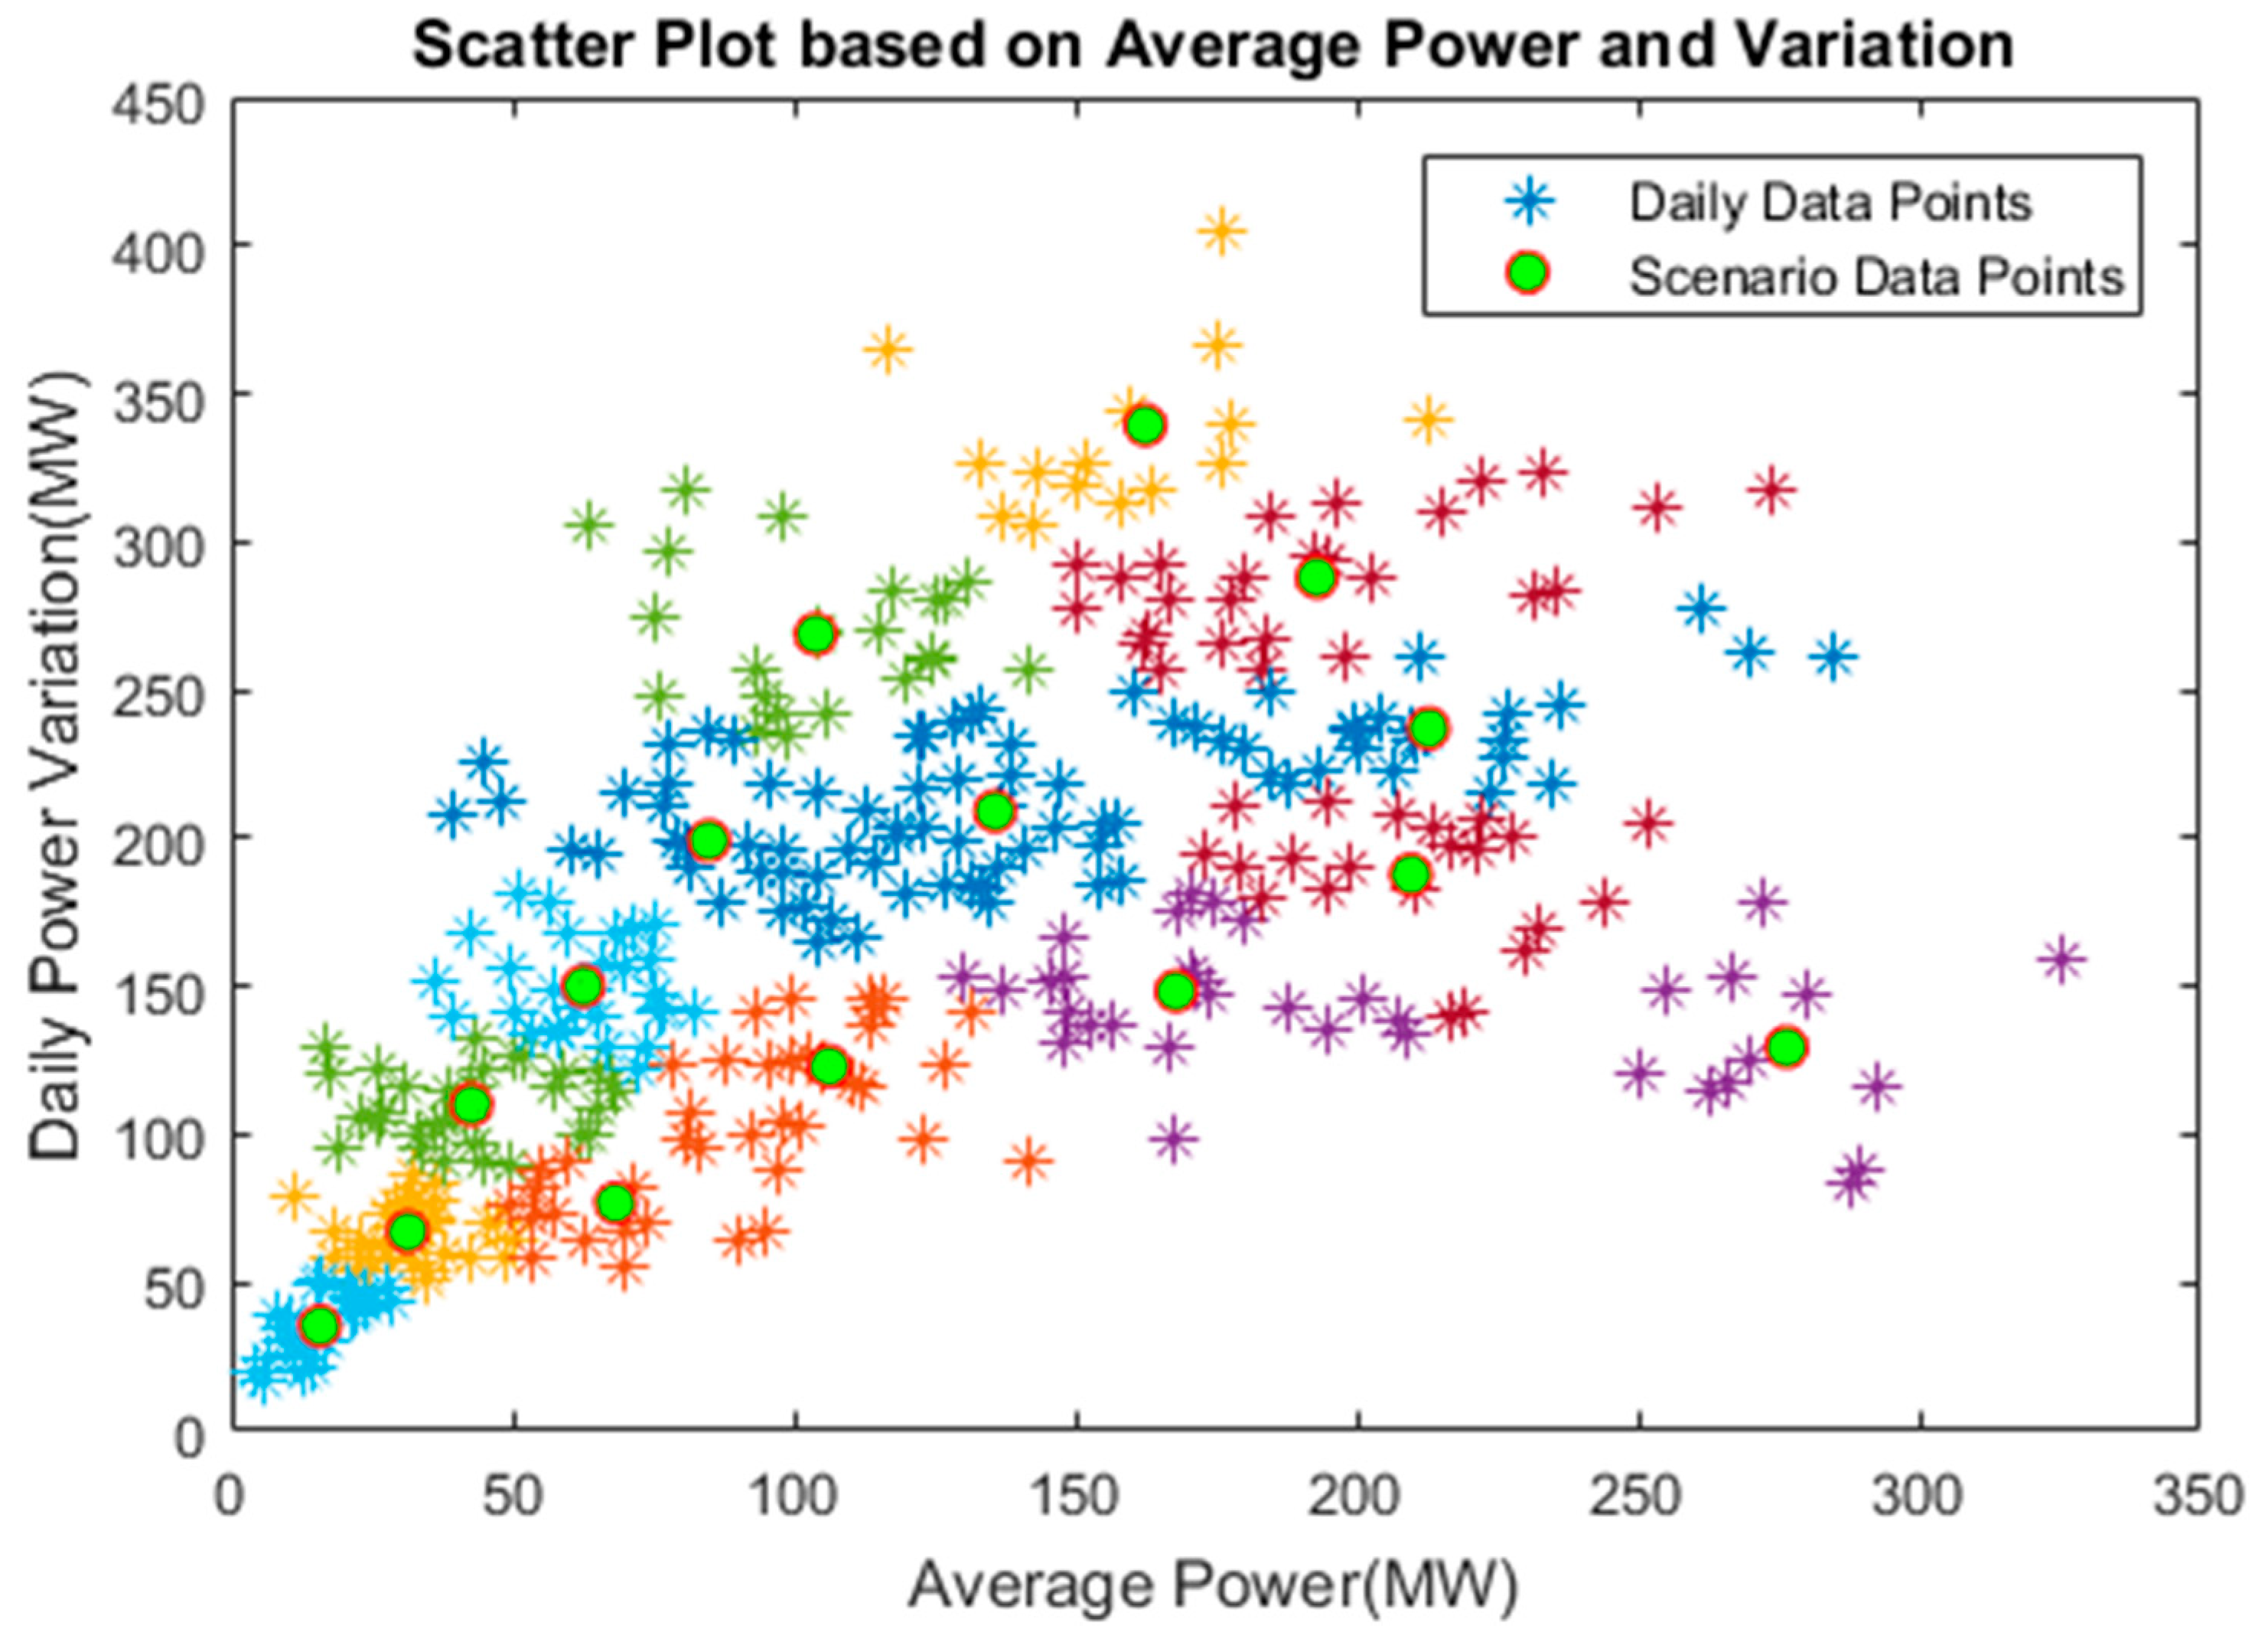
Based on the daily wind energy profile of the yearlong data, different wind energy representative data were generated by applying the k-means clustering techniques using the daily average power, power variation, and a combination of the two as a reference. The scatter plot, as depicted in
Figure 3, shows the generated centroids and the associated data points in the case study, where clustering was done based on the average and variation as criteria. As shown in the plot, the original daily wind data is represented by “*” whereas the newly generated scenarios and their corresponding centroids are represented by “O”. After the clustering and scenario generation, all data points are represented by the associated centroids. Once the centroids were determined for individual scenarios, the scenario representative data points were determined from the original dataset by using the minimum distance between data points and the centroid as a reference.
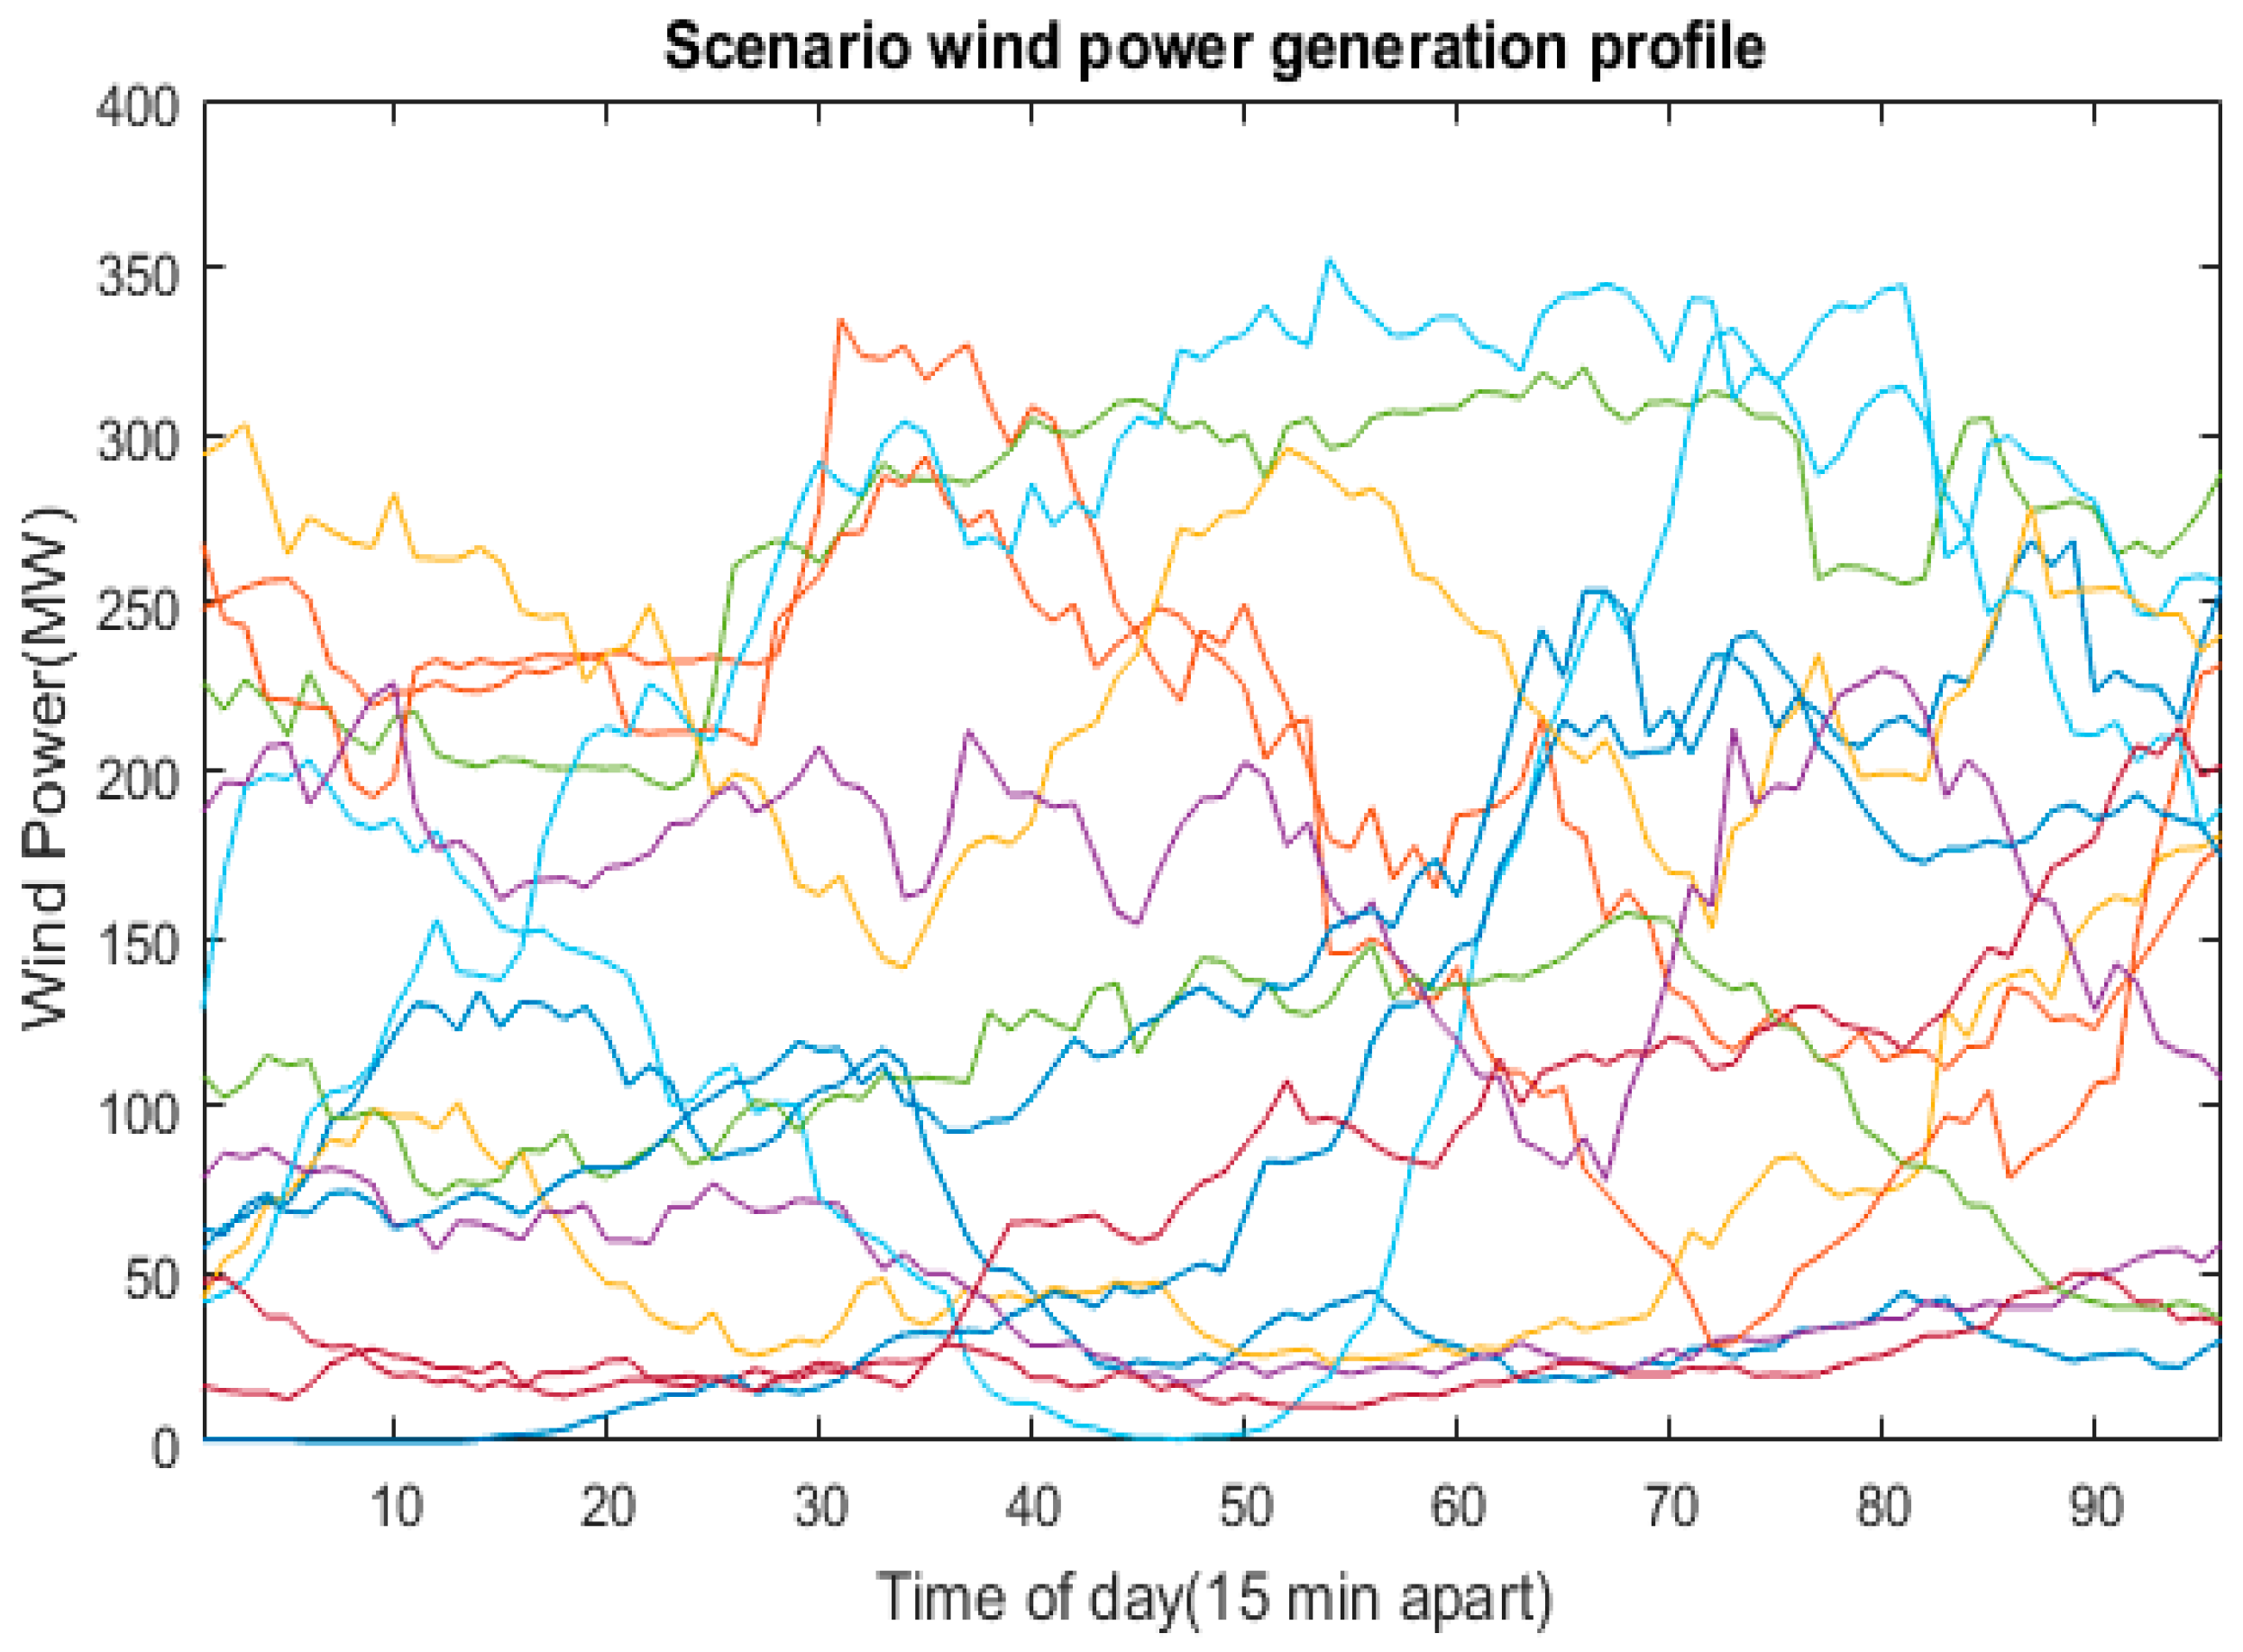
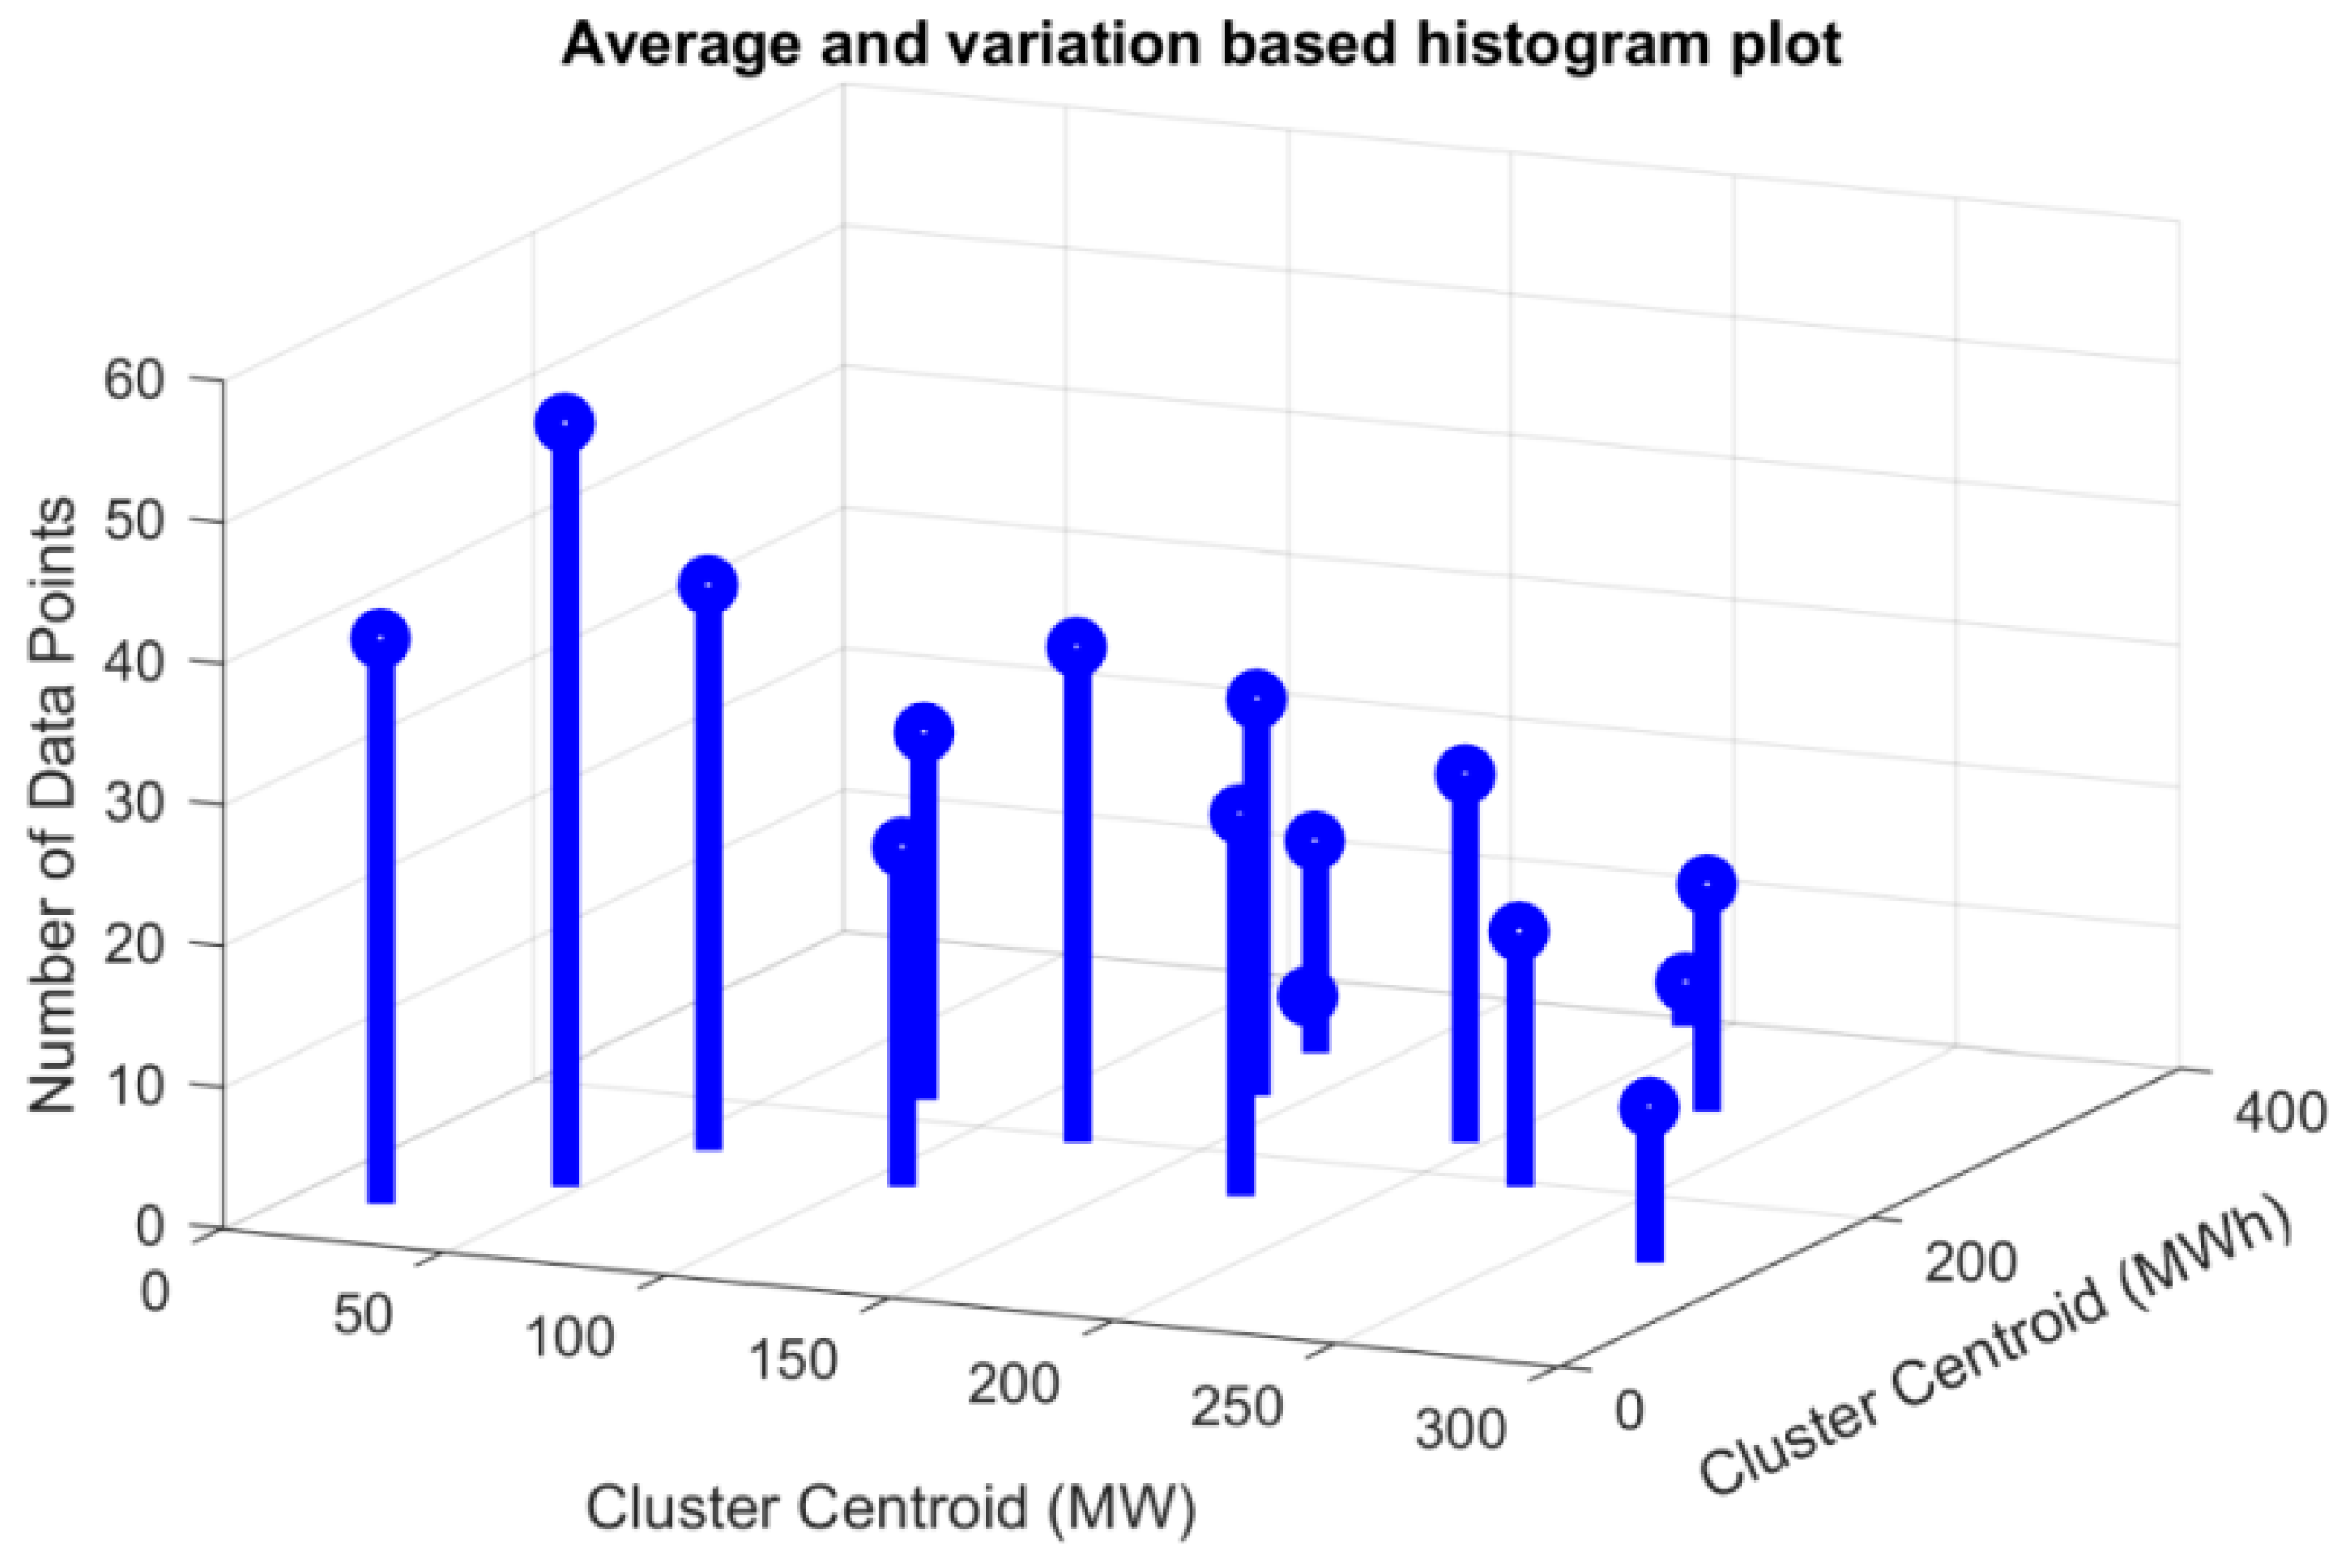
Figure 4 and
Figure 5 below show the wind energy generation profiles and the resulting histogram plot of the generated representative data points, respectively.
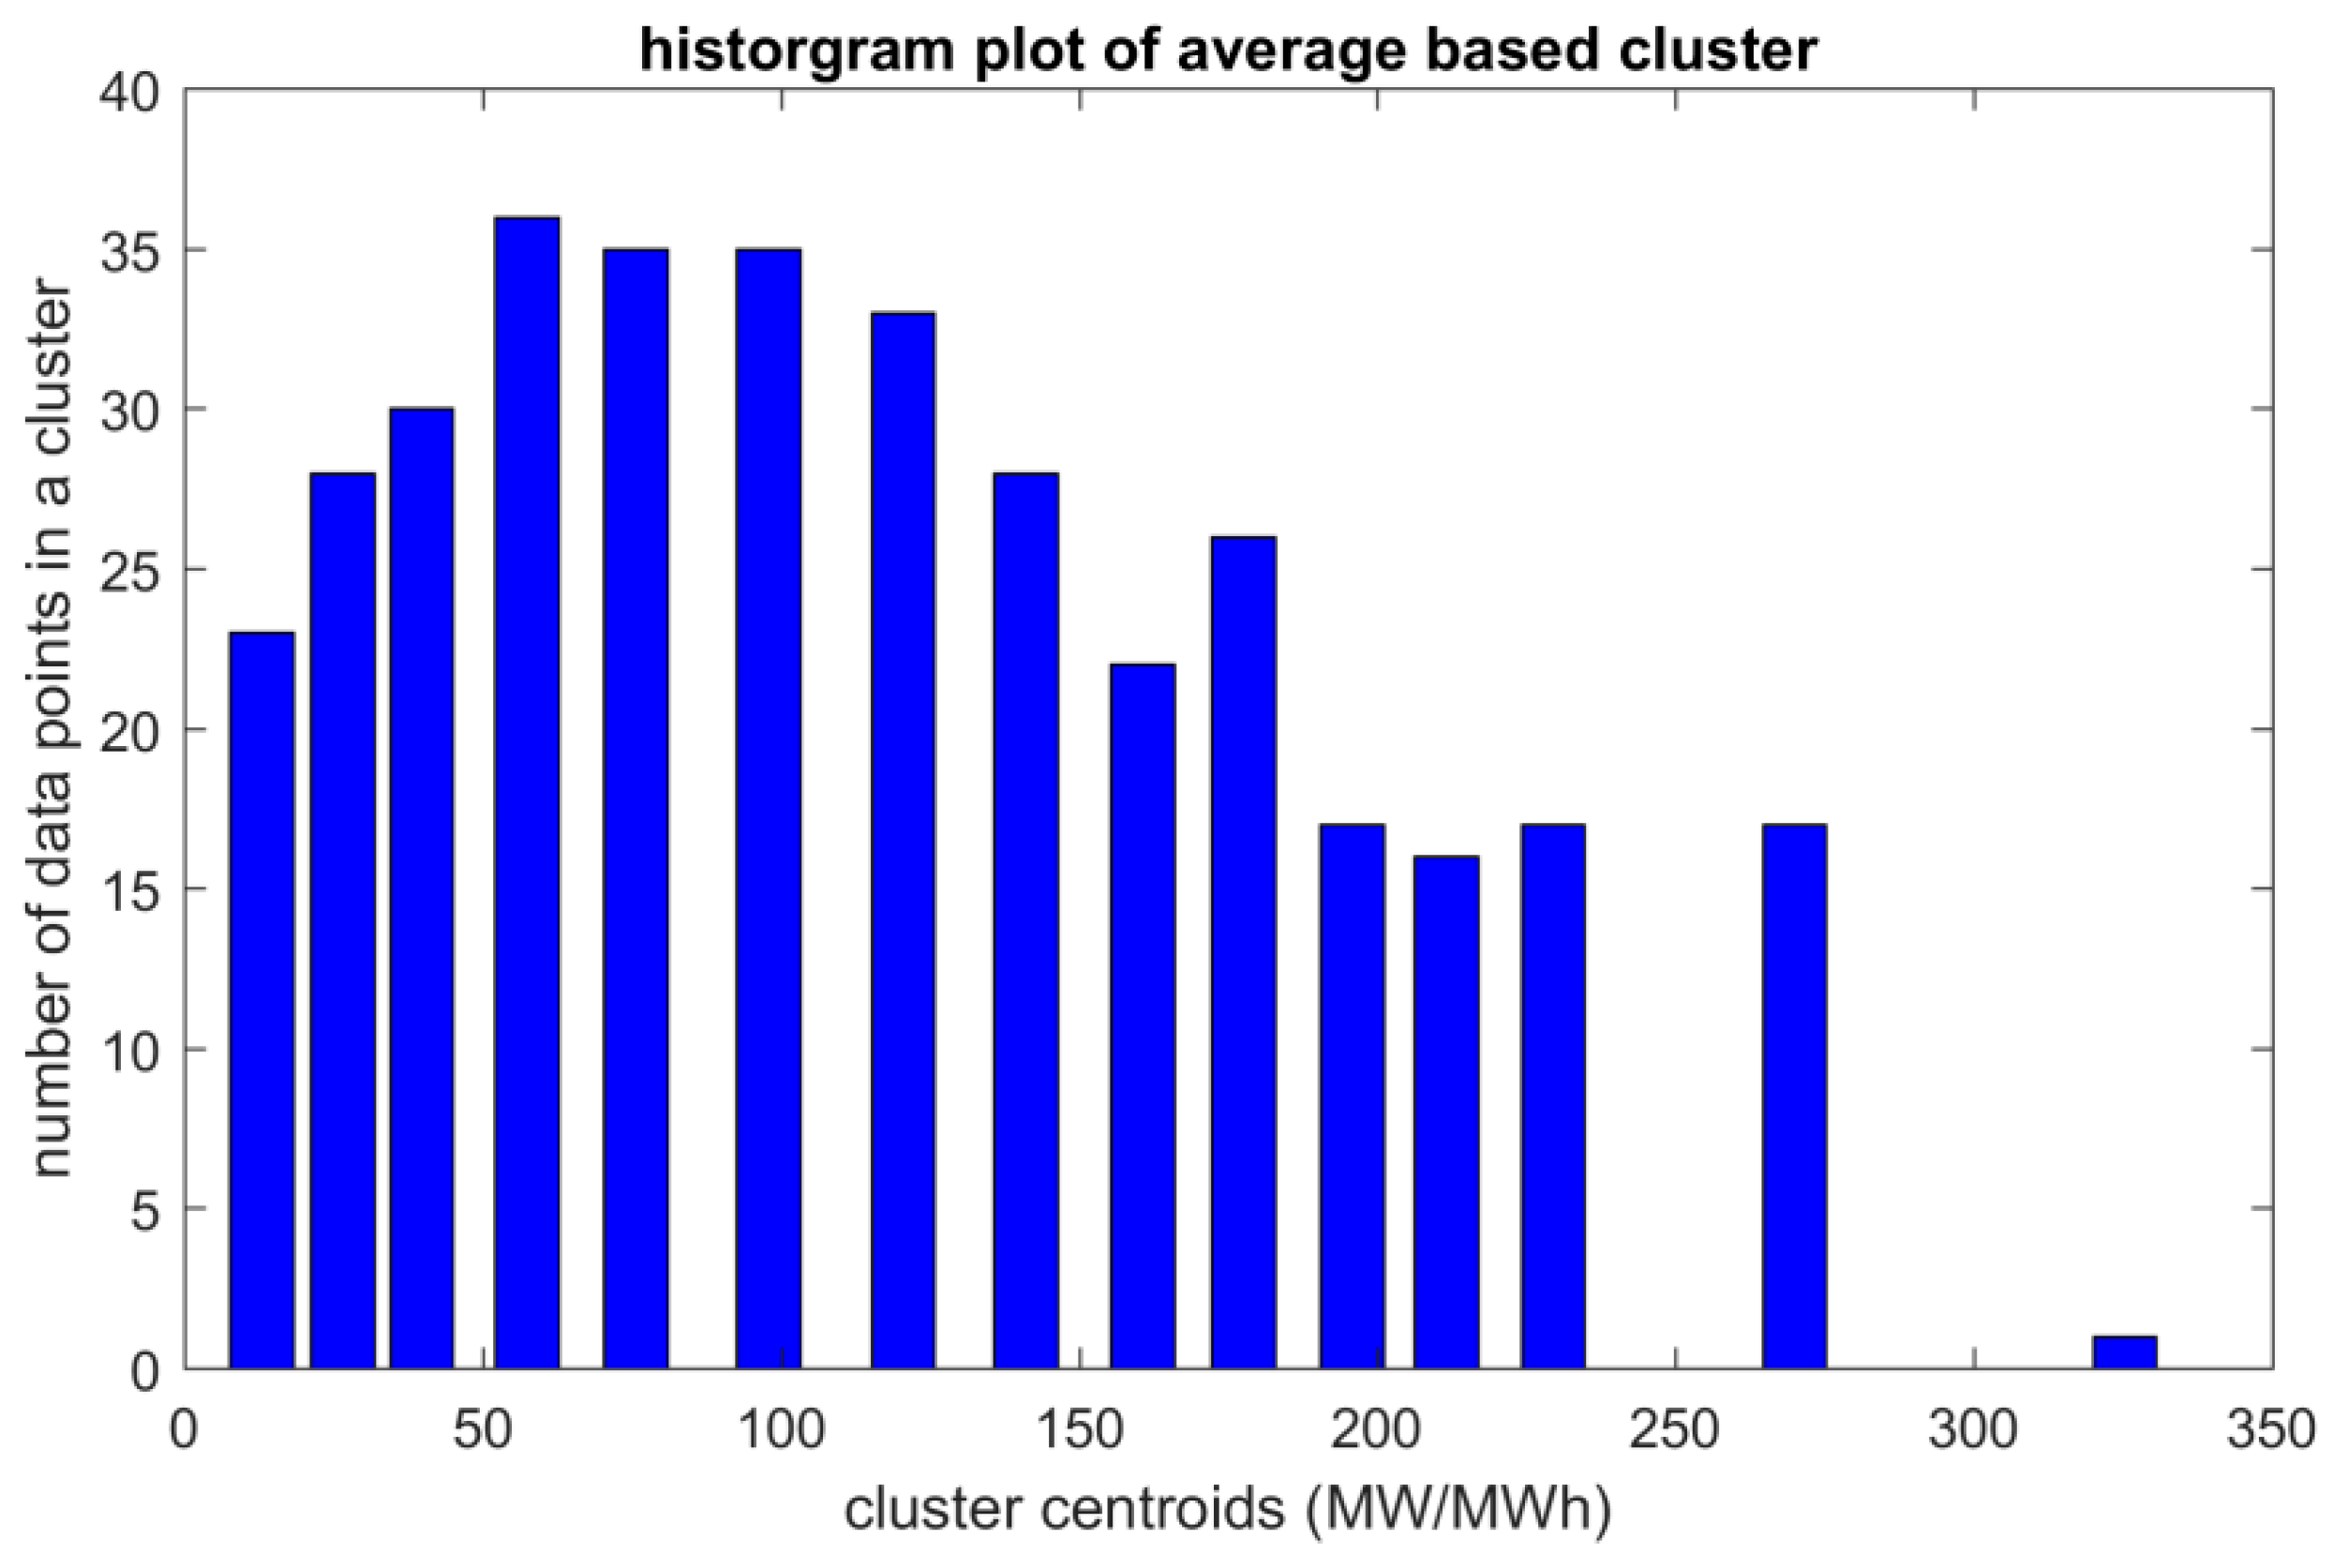
Likewise, scenarios were also generated for the other two cases, based on the daily average wind data and daily variation of the wind data. For example, the histogram plot in
Figure 6 represents the result of the clustering in the case where the daily average was used as criteria.
The final sizing of the storage follows the expected value method for random variables, as follows:
Here, the function represents summation over all the centroid points described by the variable, I; X is the random variable, x is the value of the random variable, P(X) is the probability of the random variable, and E(X) is the expected value of the random variable.
3.2. Optimization Procedure
The optimization process started by clustering the one year data based on the characteristics mentioned previously. This step resulted in the generation of representative data points called centroids. These centroids were characterized by the centroid value and daily energy generation profile. The energy storage capacity, a result of optimization for an individual centroid, was considered to work for the data points represented by the centroid. Determination of the size of the storage and the daily total cost, as defined by the objective function, was conducted using the PSO algorithm written in MATLAB R2017a.
First introduced by Kennedy and Eberhart, the PSO is one of the modern heuristic optimization algorithms used to solve nonlinear complex mathematics [
28]. It was developed through simulation of a simplified social system, such as fish schooling and bird flocking, and has been found to be robust in solving continuous nonlinear optimization problems. The PSO technique can generate high-quality solutions within a shorter calculation time and more stable convergence characteristic than other stochastic methods. PSO, as an optimization tool, provides a population-based search procedure in which individuals called particles change their positions (states) with time (iterations). In a PSO system, particles fly around in a multidimensional search space. During flight, each particle adjusts its position according to its own experience, and also based on the experience of neighboring particles, making use of the best position encountered by itself and its neighbors [
29].
Let
x denote a particle’s coordinates (position) and
v denote its corresponding flight speed (velocity) in a search space. For example, the power generation of thermal generators could be considered as a particle. Therefore, the ith particle is represented as
xi = (
xi1,
xi2, …,
xid) in the d-dimensional space. The best previous position of the
ith particle is recorded and represented as
pbest = (
pi1best,
pi2best, …,
pidbest), and
pbest for the personal best. The index of the best particle among all the particles in the group is represented by the
gbest,
gbest for the group best. The rate of the velocity for particle i is represented as
vi = (
vi1,
vi2, …,
vid). The modified velocity and position of each particle can be calculated using the current velocity and the distance from the personal best to the group best as shown in Equation (15):
Here, n is the number of particles called the population size, m is the number of members in a particle, “j” is the point of iteration, “w” is the inertia constant, c1 and c2 are the acceleration constants, vi is the velocity of particle “i” representing the speed at which the new value of a particle’s variable is updated, and xi is the current position of particle “i” representing the exact value of a particle’s variable. For example, in our case, xi could represent the thermal unit’s power generation or the power capacity of the storage unit at a particular time, n is taken as 1000, and m is (6 × 24 + 1 × 24 = 168). Additionally, 6 represents the six thermal units’ power generation, 24 for the 24 h in a day, and 1 for the storage unit power capacity.
For the first iteration, all variables hold a value generated randomly that satisfies the variables’ upper and lower limits and also other system constraints, like the ramp up and ramp down constraints of thermal units. Once all variables hold their initial values, the fitness function representing the objective function was calculated for the first time for all the population using Equation (5). To ensure the power balance problem is satisfied, the fitness function was updated by adding a very large number multiplied with the absolute value of the power balance violation. The best particle in the population, in our case the one with the minimum fitness function, was selected and was used as a reference for other particles to update their particular variable values using Equation (15). That means the other particles’ previous variable values were updated based on comparison with the corresponding variable values of the best particle. A new fitness function was calculated and a new best particle was again selected. The process continued until the result converges or the total number of iteration was tried. The results at the end of the PSO algorithm were recorded as shown in the tables in the next section.
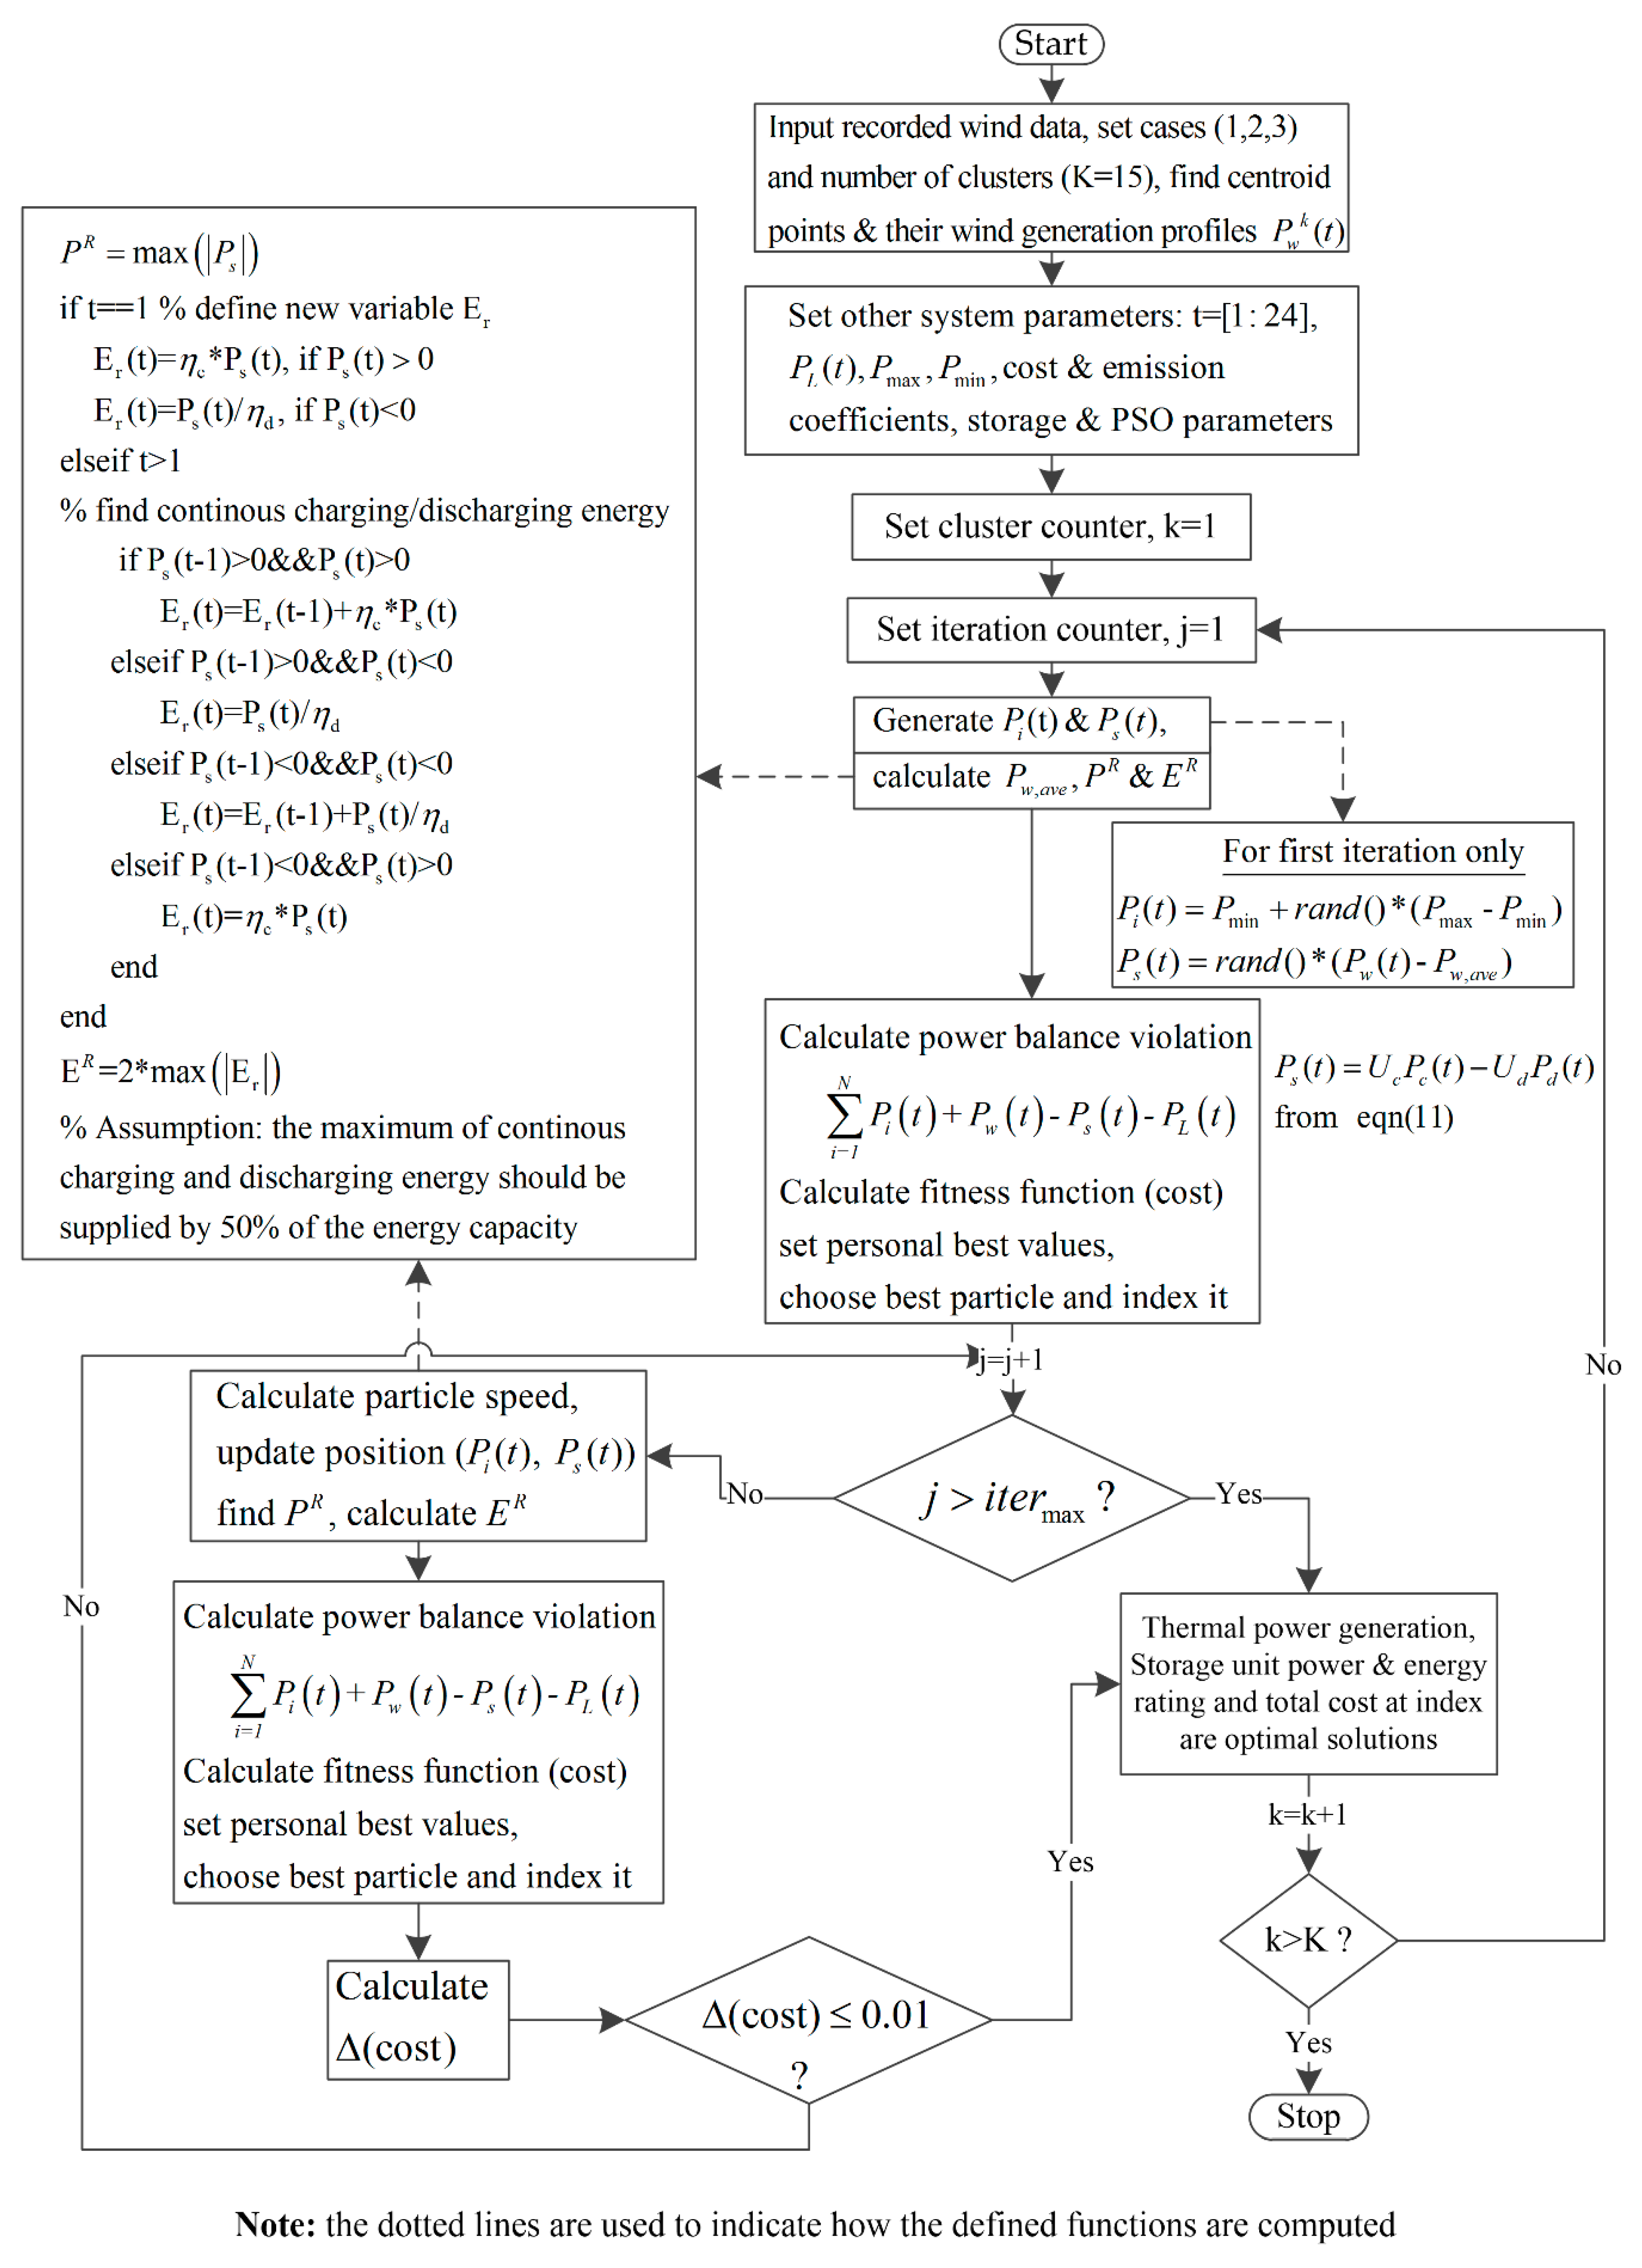
The daily average load profile of the test system and the centroid point’s wind energy generation profiles were taken as inputs together with the other defined system parameters. The hourly generation values of the thermal units, the hourly charging and discharging values, and the power and energy capacity of storage units was determined. Finally, the daily optimal cost of generation and cost of emission together with the leveled cost of storage units was determined. A flow chart showing the steps used in the proposed method and the optimization procedure is shown in
Figure 7.
4. Results and Discussion
The IEEE-30 bus system consisting of six thermal units with a daily maximum load of 1263 MW was considered. The wind power generation data is taken from the Northern Ireland grid. The data was then converted to one hour average data, from the original 15 min average data. Simulation was done for the considered power system using code written in MATLAB R2017a. Three case studies were considered for scenario generation and simulation was performed accordingly. The power system without storage was initially simulated as a reference. The daily production cost in this case was found to be
$558,025.53/day. This daily cost was used as a reference to choose the size of storage that could be used in the rest of the simulation process. The investment cost of the storage had two components, the power and energy component, both of which had a range of values. For example, the power component of the investment cost for a PHES system could range from %1000 to
$2000/kW whereas the energy component could range from
$100 to
$200/kWh [
30,
31]. In this paper, the investment cost for a PHES system was considered with these cost components taken as
$1750/kW and
$150/kWh, respectively, for power and energy. A project lifetime of 20 years and an interest rate for investment of 6% [
32] was considered. The leveled daily cost of the power and energy component was calculated accordingly. For the PSO algorithm, an acceleration factor of 2 and an inertia constant of 0.9 were used in the search process. A total of a 1000 population and 500 iterations were used. As previously described in
Section 3, three cases were considered for the clustering and optimal storage sizing.
4.1. Case One
In case one, all data points were represented by using the average power of the daily wind power generation. Each day of the year was represented by its average wind energy generation profile. The clustering, representative data generation, and the corresponding storage sizing were performed as proposed previously. Therefore, based on the proposed approach,
Table 1 shows the records undertaken for the emission constrained optimization of this case.
4.2. Case Two
In case two, individual daily data points were represented by the maximum daily variation in the wind energy generation profile. That is, the daily wind energy generation profile in reference to its average generation profile could be fluctuating in many orders. In some points in time, the generation could add up together, requiring a larger storage size whereas in other points in time, the generation at one point in time could be compensated by its previous generation requiring less storage capacity. The proposed approach for this case resulted in the 15 clusters with their power and energy ratings as given in
Table 2 below
4.3. Case Three
The third case applies the combination of the daily average and variation criteria. Each day was represented by the daily average and daily variation. The clustering, representative data generation, and calculation for the power and energy rating were manipulated as proposed and are presented as in
Table 3 below
The final result was calculated from these recorded results based on the mathematical expectation as proposed in Equation (14). Therefore, the final result of the optimal storage sizing for the first case was storage with a power rating of 110.685 MW and an energy rating of 985.5608 MWh with a total daily operating cost of $557,307.91/day. The result for the second case was storage with a power rating of 115.4002 MW and an energy rating of 1036.0679 MWh with a total daily operating cost of $554,500.116/day. Finally, the result for the third case was storage with a power rating of 138.9386 MW and an energy rating of 1163.3741 MWh with a total daily operating cost of $551,125.16/day.
Compared to the first two cases, the third case resulted in a better result with a relatively larger storage size and smaller daily cost. Therefore, the methodologies applied in the third case are considered as better options for storage sizing for wind energy applications. Compared to the no storage options, the storage options considered in case three provided the maximum daily savings and are thus considered as optimal. Comparison of the three case results showed that the clustering based on wind energy variation significantly affects the energy capacity while the power capacity is affected by the average based clustering. Comparison of the results of case 2 and case 1 and case 3 with the remaining two cases indicated these effects with case 3 resulted in a higher storage capacity with a lower total cost.
4.4. Wind Energy Fluctuation Reduction (Wind Leveling)
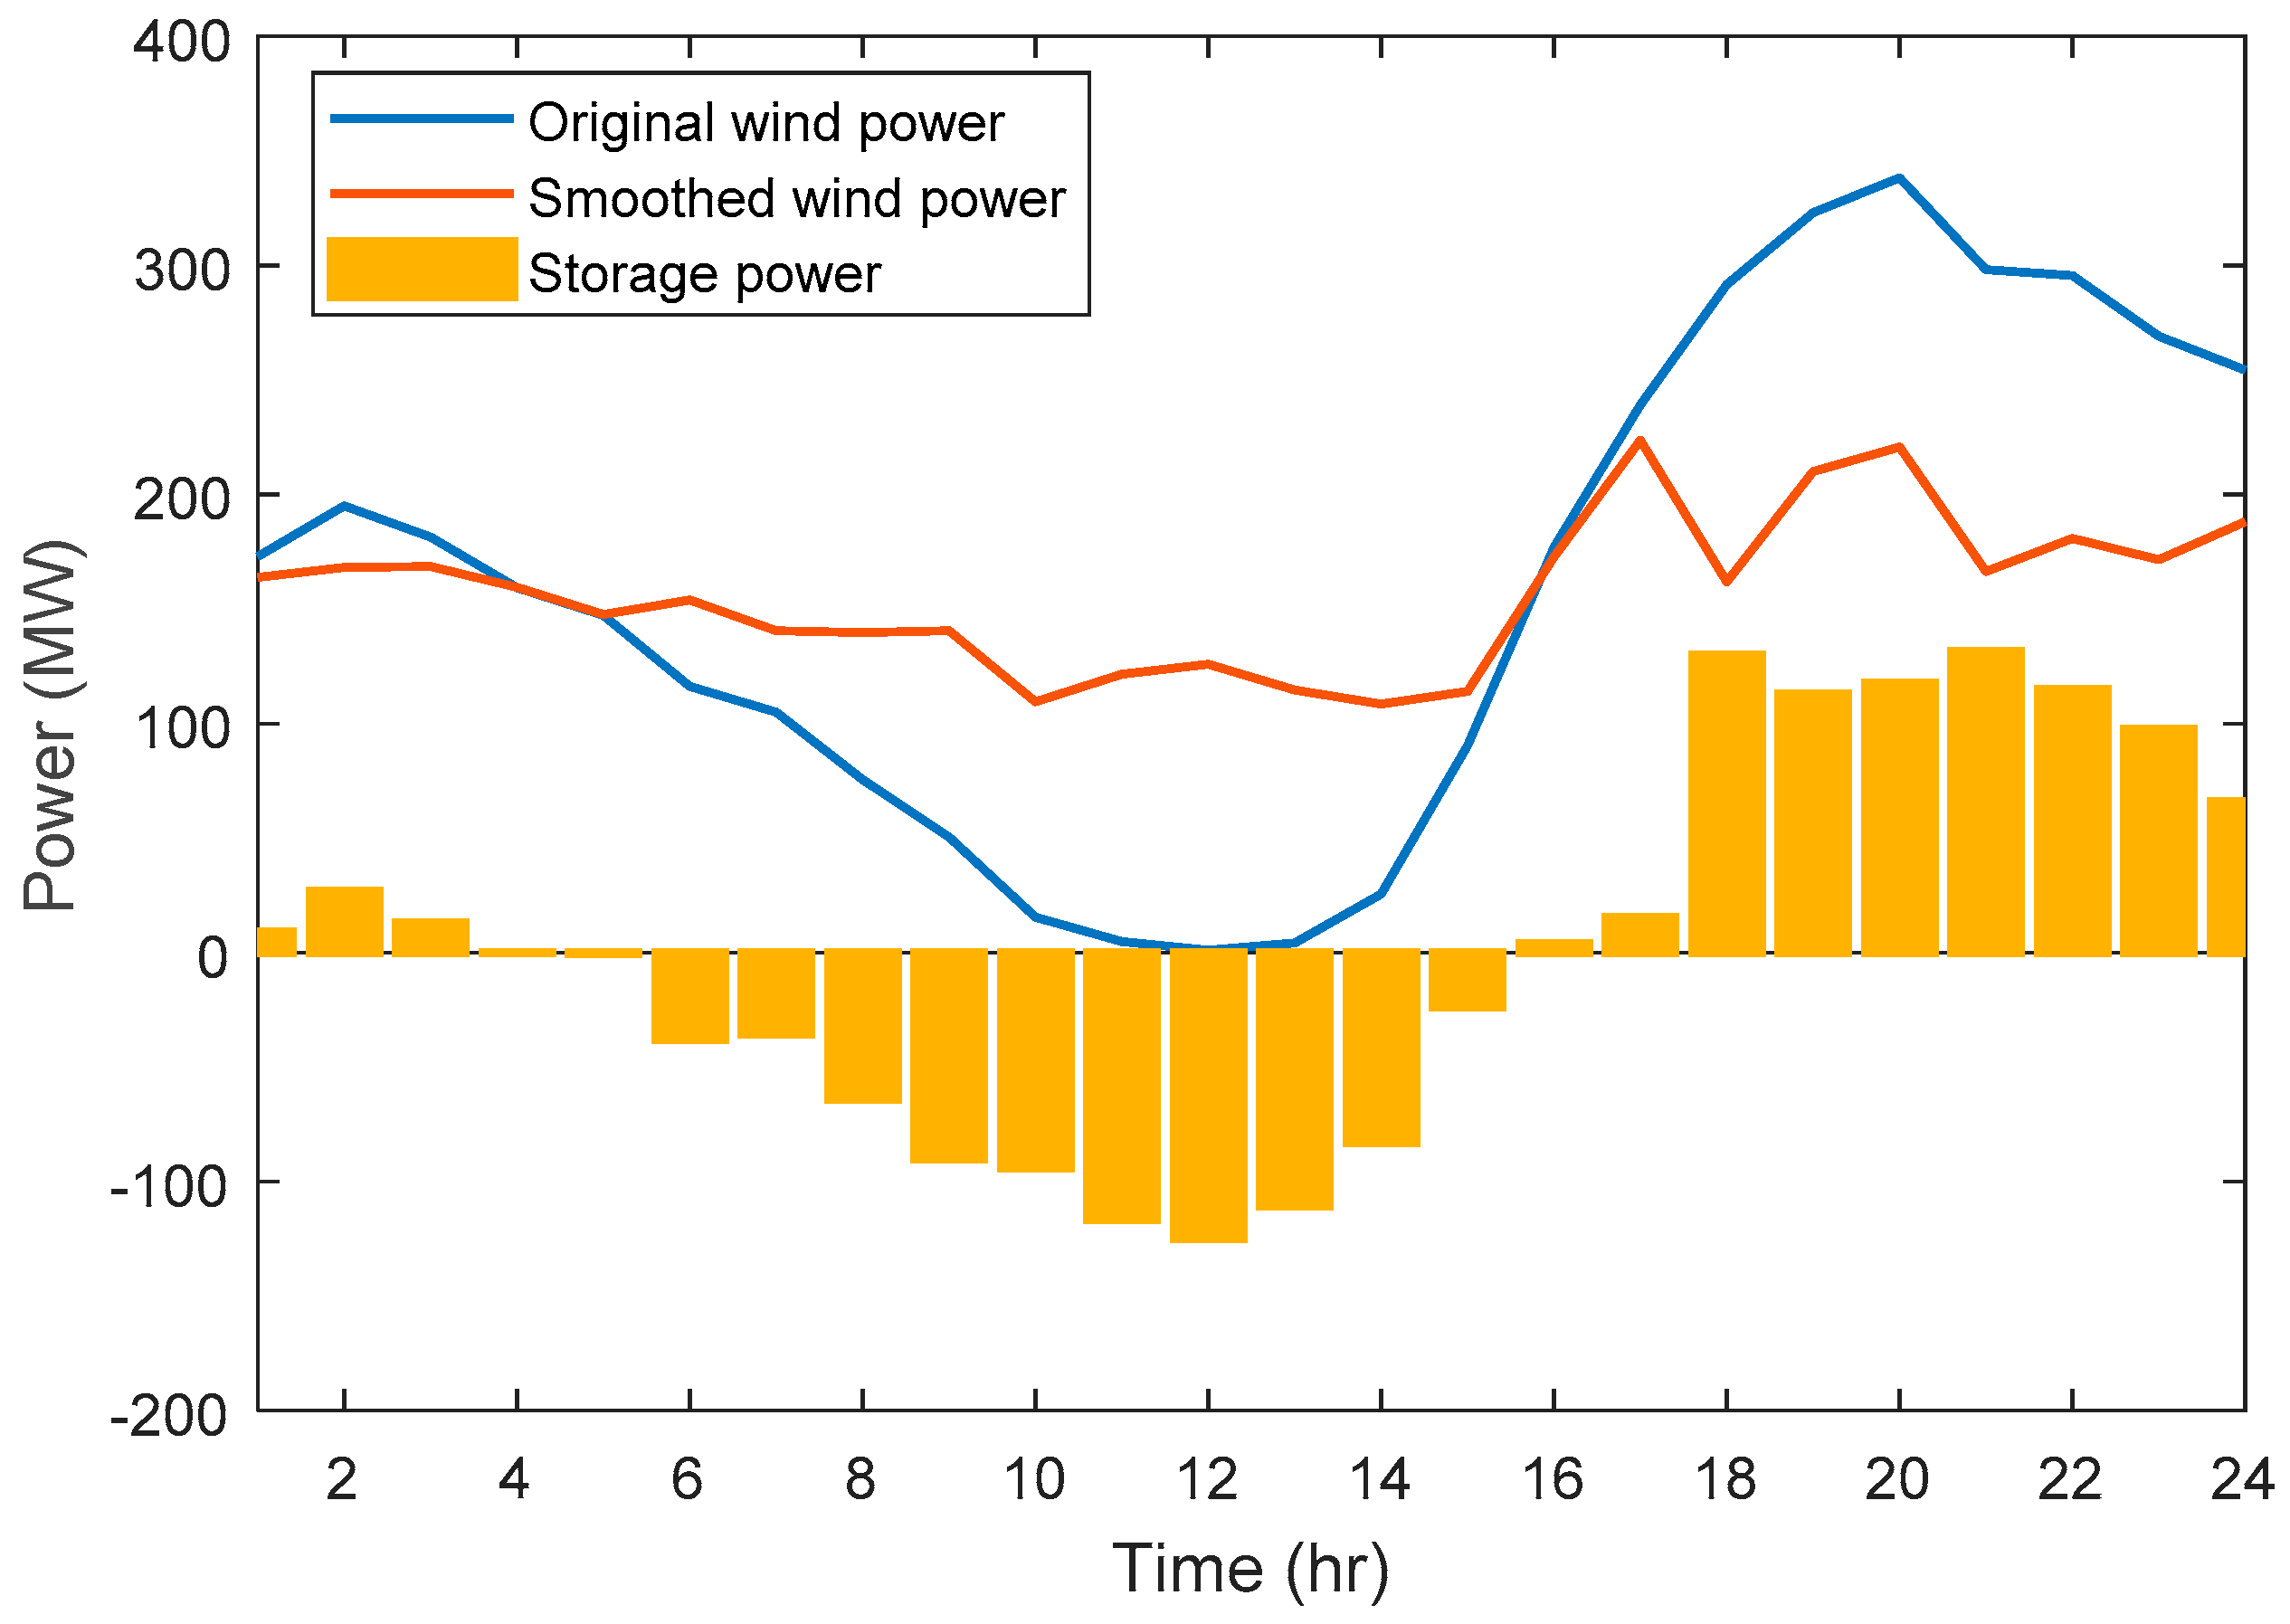
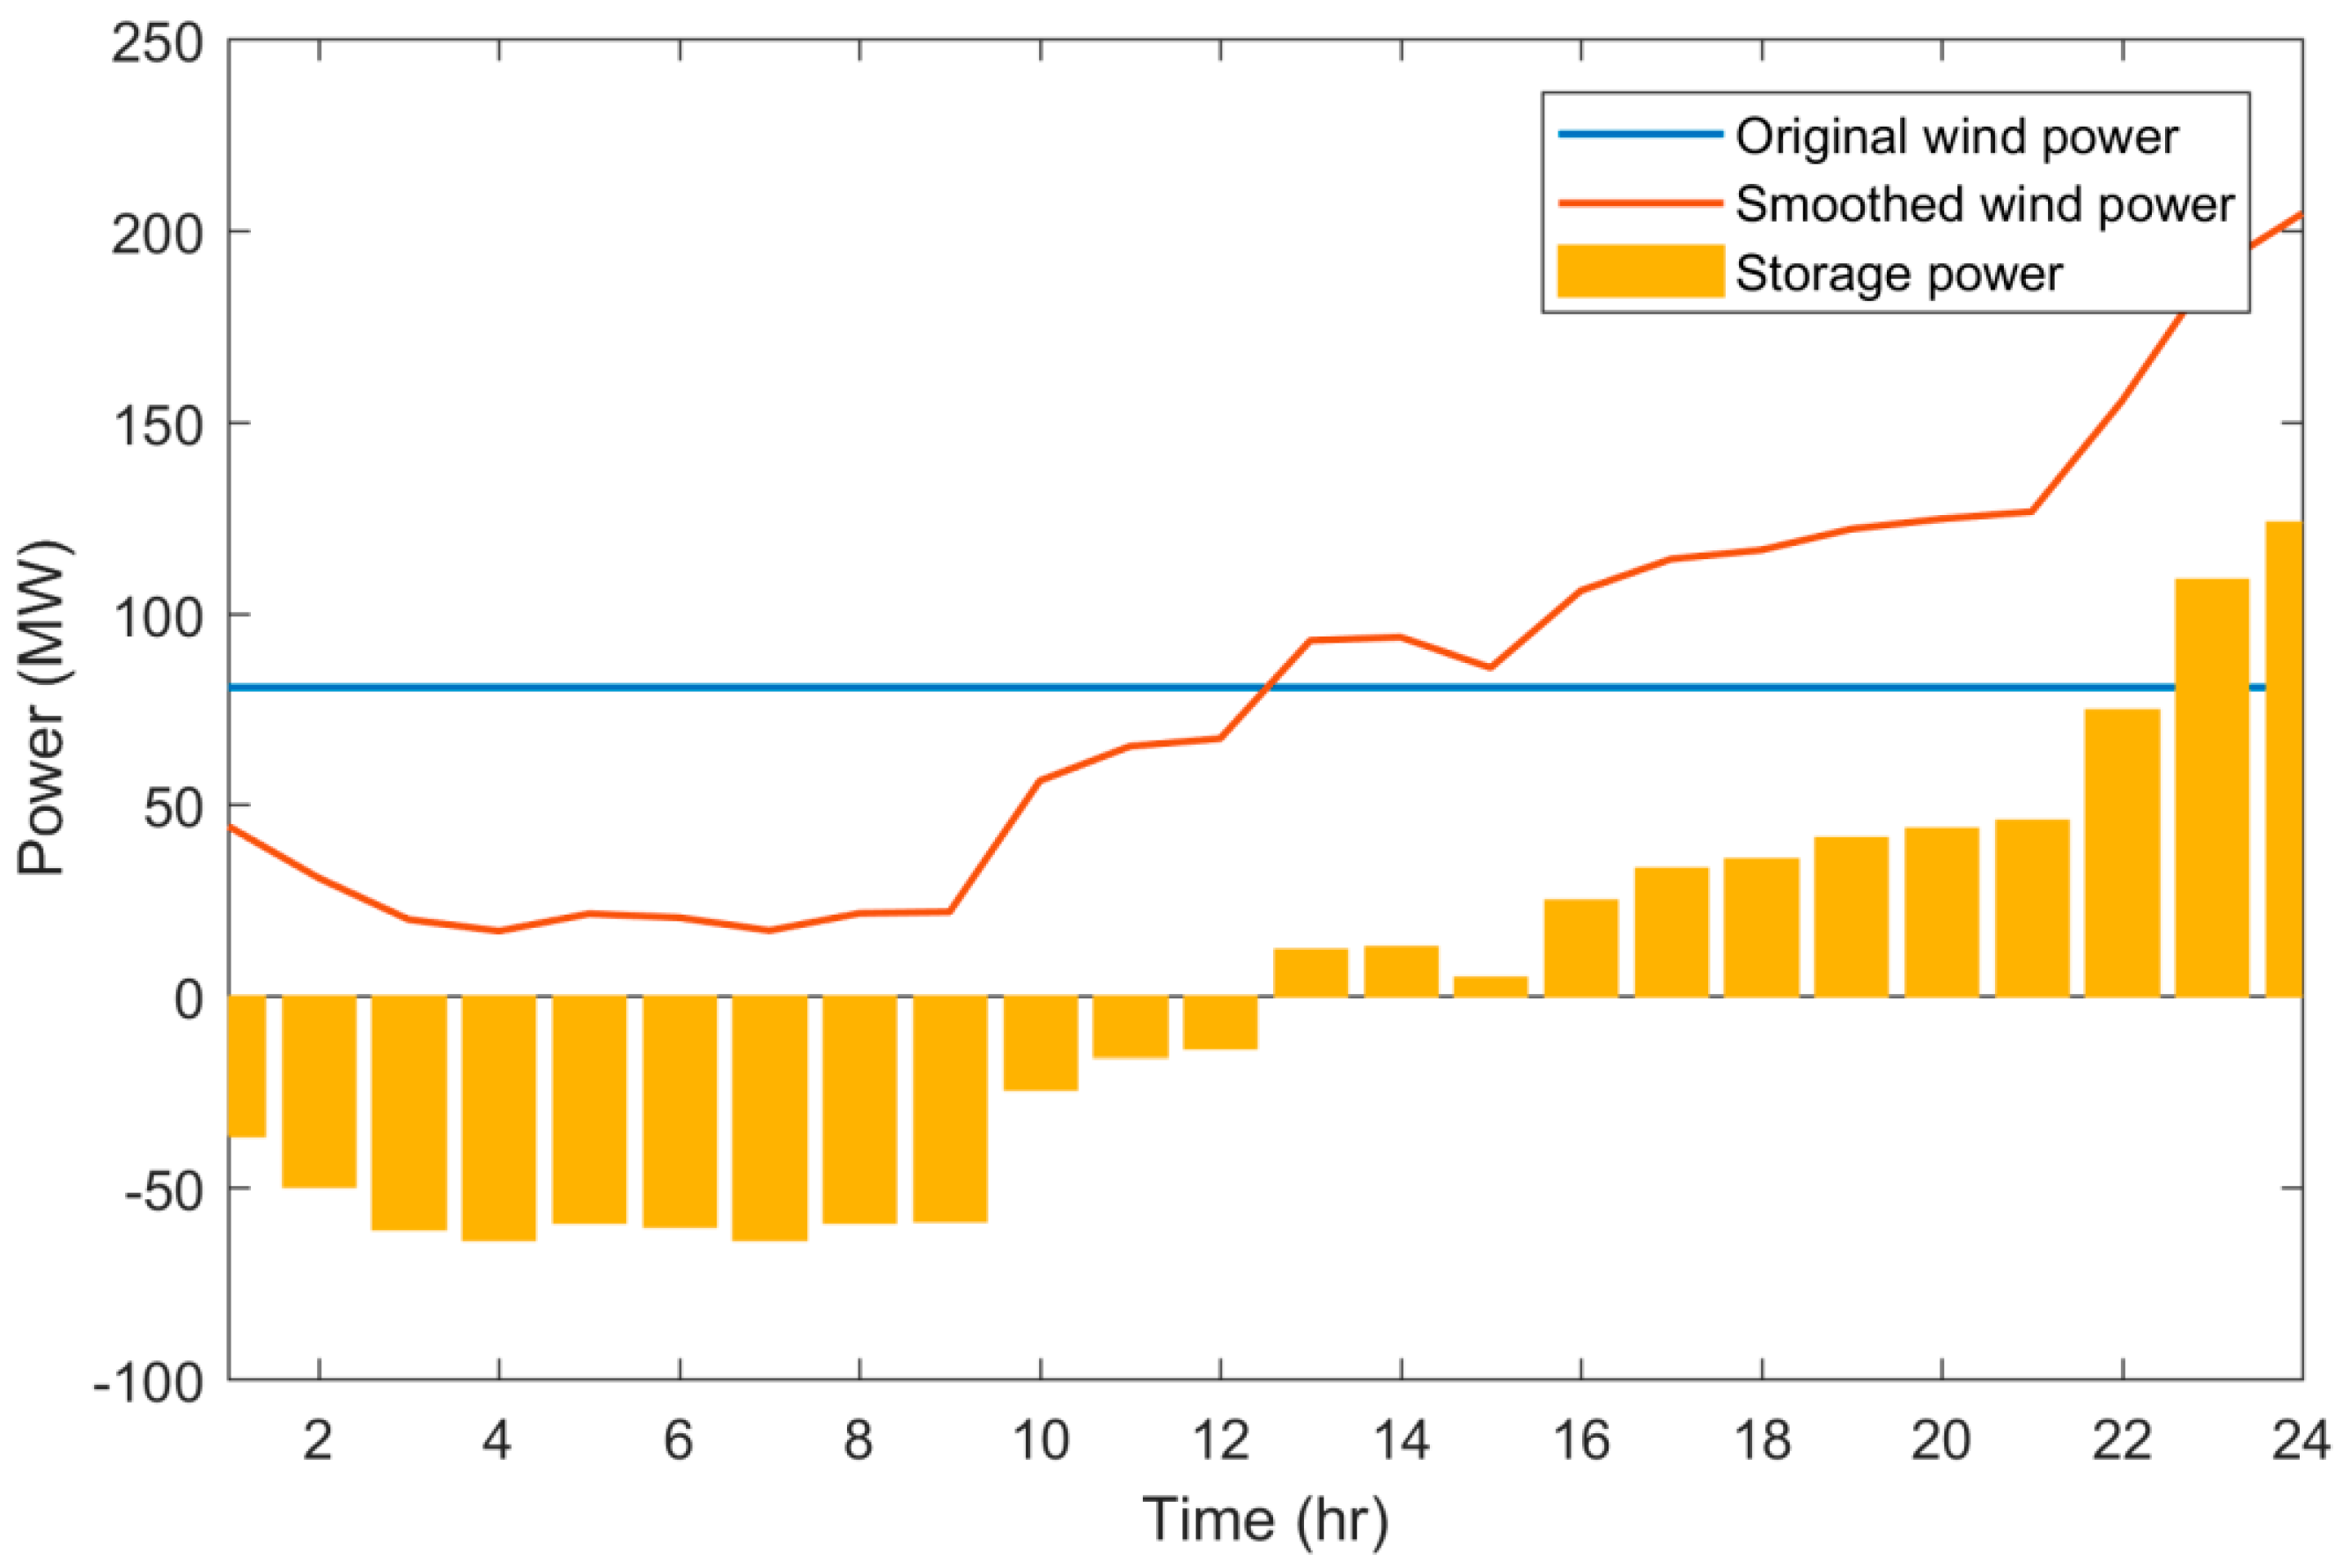
Figure 8 below shows a plot of the wind energy generation profile of cluster 10 of case 3 and the resulted smoothed the wind energy generation profile after the use of the optimal storage power and energy capacity. The storage unit charges and discharges according to the relative magnitude of the average wind and the actual wind generation profile, taking the previous state of charge and the final state of charge into account. Besides, the daily state of charge variation for the storage unit was considered to be minimal to ensure a continuously smoothed operation for the next day. For example, in the particular case, a daily state of charge difference of only 57.8659MWh, 4.974% of the rated energy capacity, was noticed. By doing so, the storage unit resulted in a better smoothed wind energy output. In
Figure 8, the bars represent the power absorbed and supplied by the storage unit. The upward bars represent the positive power for charging the PHES and the downward bars represent the negative power discharged from the PHES.
Similarly, the same approach was applied for a different cluster, cluster 2 of case 3, and the resulting smoothed wind energy generation profile after the use of the optimal storage power and energy capacity are plotted in
Figure 9 below. In this particular cluster, the power and energy requirement of the daily wind energy profile were smaller than the energy and power capacity of the storage unit. That is the reason why the storage tool completely smoothed the wind energy fluctuation to its daily average value with the initial and final state of charge of the storage unit being the same, unlike the one in
Figure 8. Therefore, the storage unit according to the daily wind energy profile smoothed the wind fluctuation based on the power and energy requirement and capacity of the storage unit.
4.5. Thermal Unit Generation and Emission Reduction
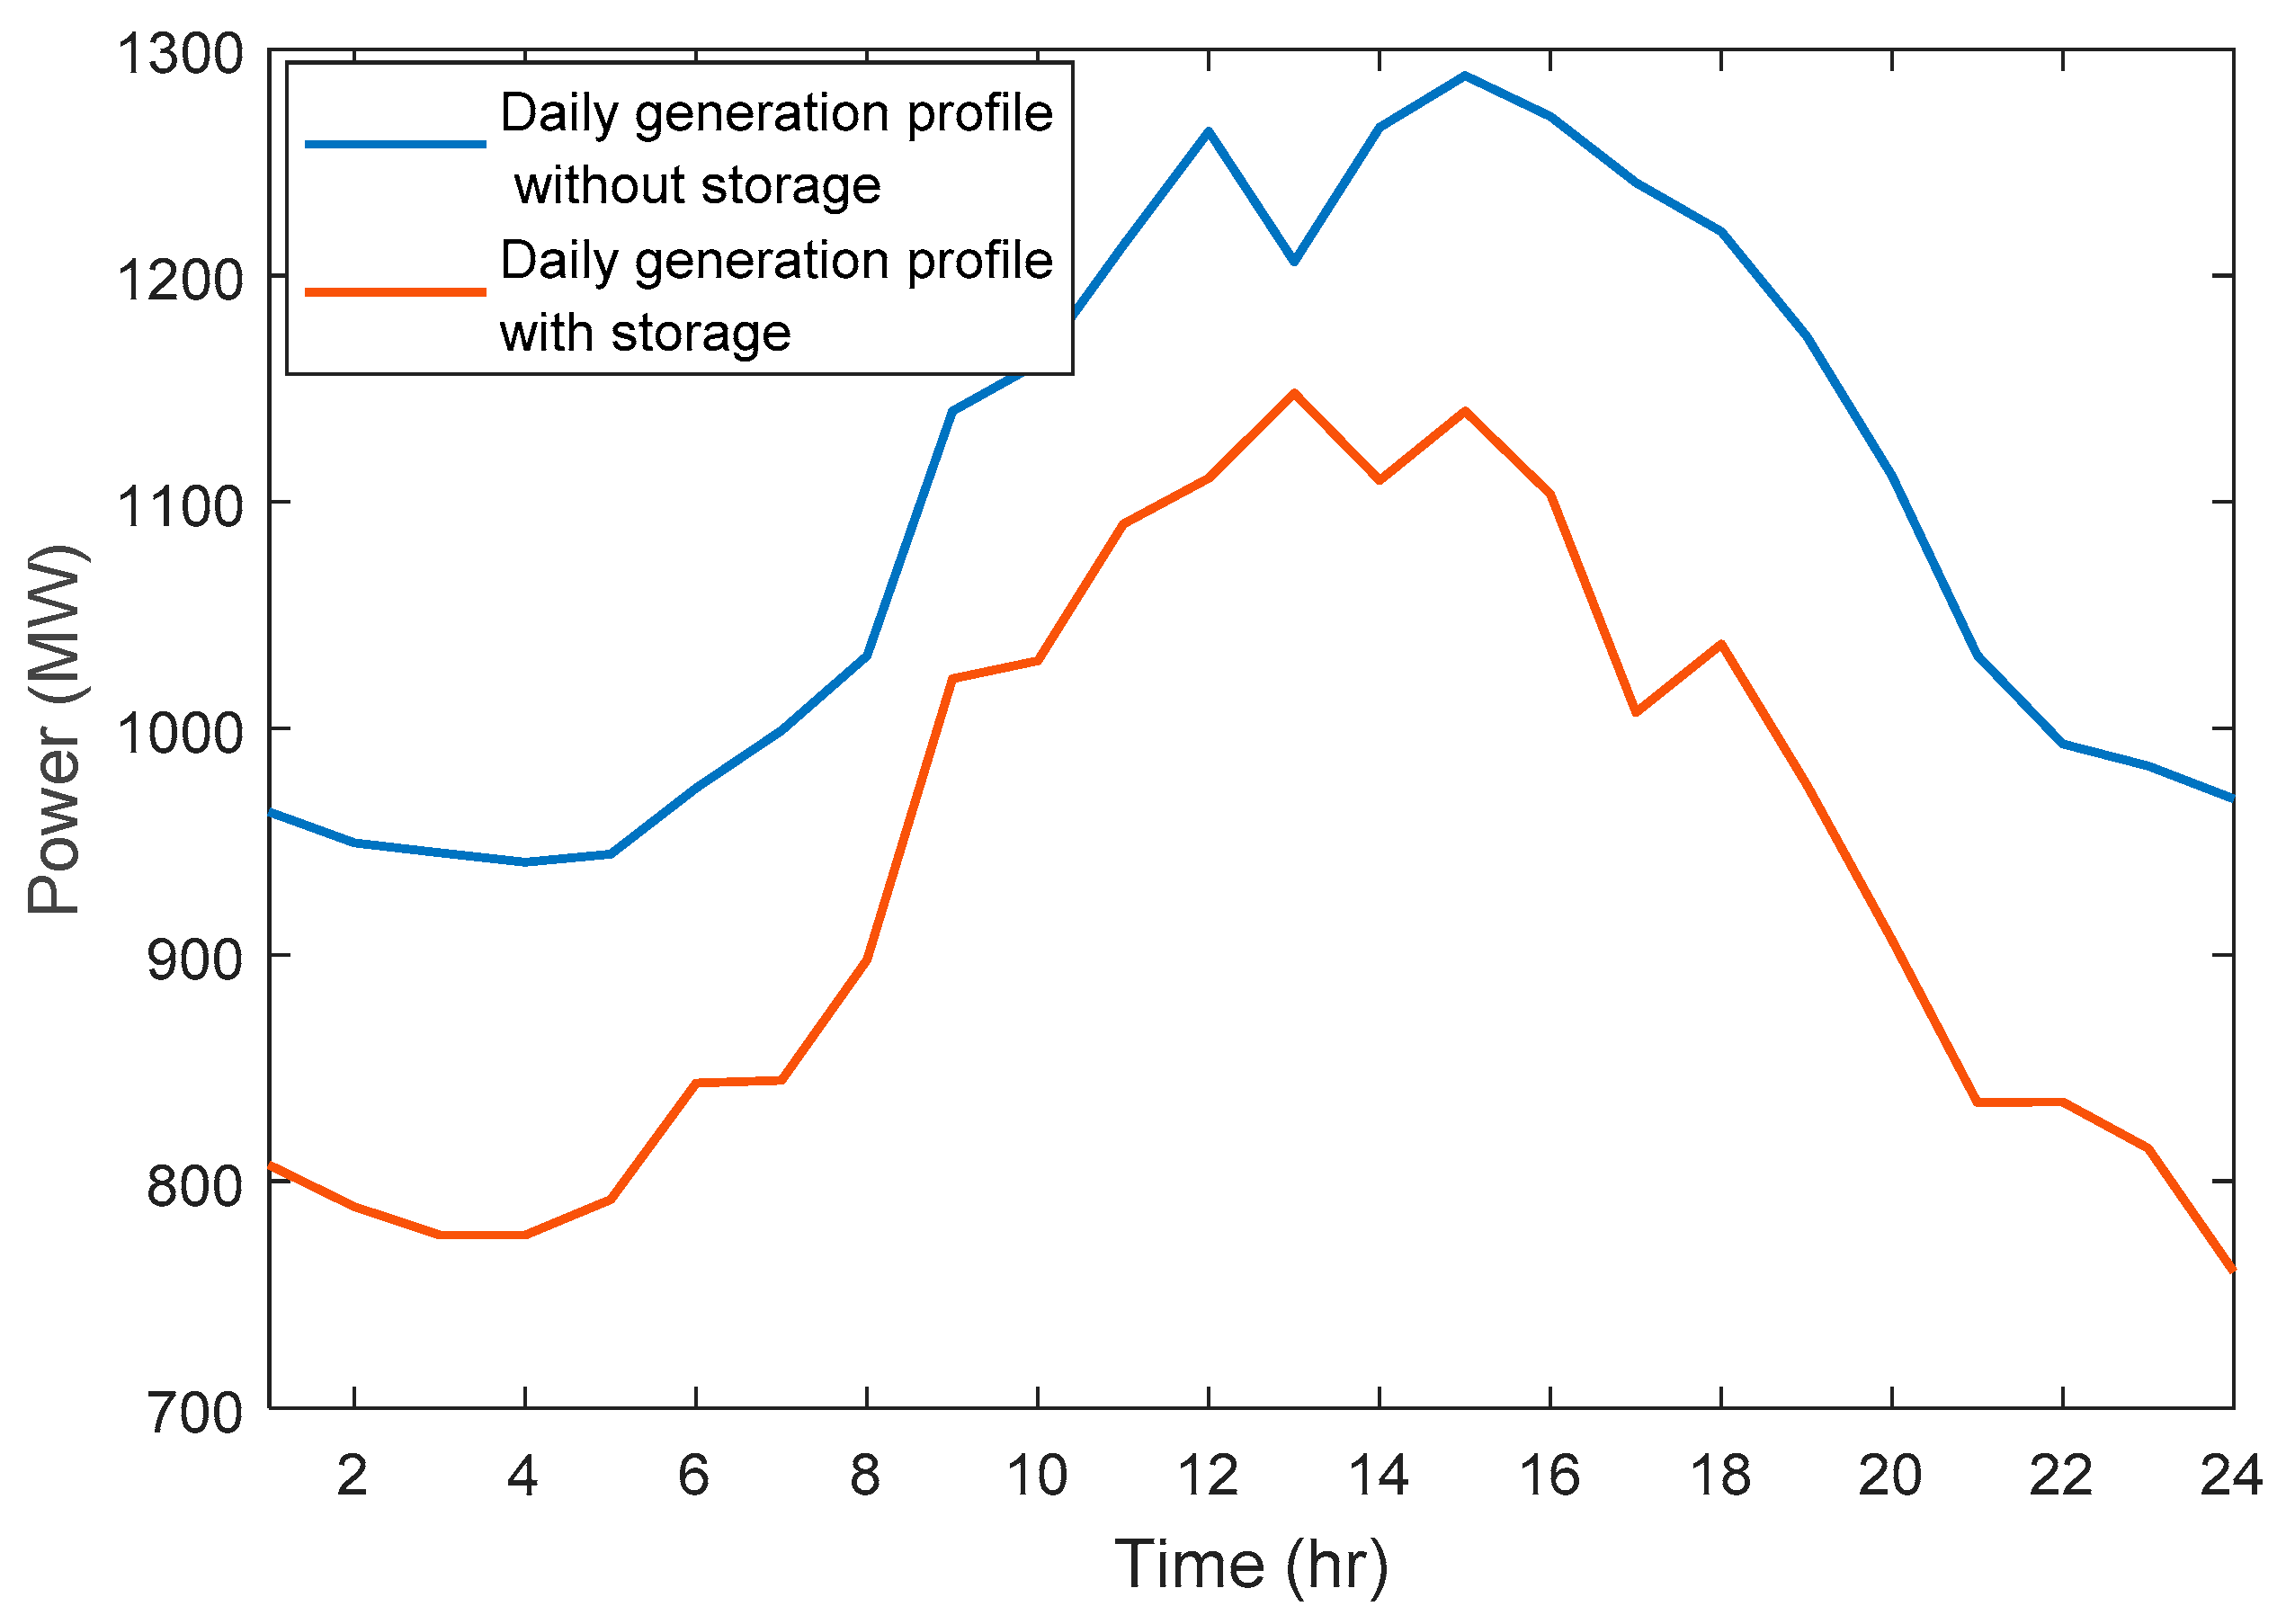
A reduction in the overall generation profile of thermal units and hence a significant reduction in the emission of pollutant gases was also noticed. For the case where only thermal units were used, the overall thermal units’ daily generation profile was higher than the daily generation profile for the case where storage units were used.
Figure 10 below shows a comparison of the two cases for the wind data of cluster 10 mentioned in
Section 4.4. Accordingly, the daily emission of pollutant gases was reduced from 11.994 metric ton per day to 9.007 metric ton per day, which indicates a significant improvement in reducing the release of these pollutant gases to the environment.
From
Figure 10, the shapes of the two plots look nearly similar. This is due to the advantage of having storage units and their appropriate smoothing capability of the daily wind energy generation profile.
5. Conclusions
In this paper, the emission constrained optimal storage sizing for the IEEE-30 bus system integrated with the 30% wind energy penetration level was studied. The separate and combined use of wind energy daily average power and daily variation based k-means clustering was used to generate wind energy scenarios.
The use of emission constrained optimal storage sizing helped increase the overall operating cost of thermal generating units. This way the relative cost of storage units was reduced and their use is favored compared to the use of thermal units without consideration of emission constraint optimization. This resulted in a larger storage sizing with less total system cost. The reduced scenarios helped reduce the competition time compared to the one if a full one year data was used. The combined characterization using the average power and daily variation resulted in a storage unit with higher power and energy capacity, relatively less system daily costs, and higher daily savings compared to the case of separate considerations.
The numerical results showed that compared to the no storage cases, the system with storage with the specified power and energy ratings had a lower total cost per day with a daily saving because of the application of storage. In the first case, the daily saving was equal to $717.62/day whereas in the second and third cases, the daily savings were $3525.41/day and $6900.37/day, respectively. The result also indicates that installing the storage units reduces the daily energy production cost and the emission of pollutant gases besides stabilizing the wind energy fluctuation.
The results from this research could be used to convince policy makers and favor the use of PHES systems. The daily savings obtained from the use of these storage technologies added to their emission reduction advantages should be considered as the reasons for the investment of these technologies.
