Article

Fundamental Investigation of the Effects of Modified Starch, Carboxymethylcellulose Sodium, and Xanthan Gum on Hydrate Formation under Different Driving Forces

1
Key Laboratory of Unconventional Oil & Gas Development (China University of Petroleum (East China)), Ministry of Education, Qingdao 266580, China
2
CNPC Engineering Technology R&D Company limited, Beijing 102206, China
3
Faculty of Engineering, China University of Geosciences, Wuhan 430074, China
*
Authors to whom correspondence should be addressed.
Energies 2019, 12(10), 2026; https://doi.org/10.3390/en12102026
Submission received: 14 April 2019 / Revised: 17 May 2019 / Accepted: 24 May 2019 / Published: 27 May 2019
(This article belongs to the Section L: Energy Sources)

Abstract

:
The development of a new drilling fluid system with hydrate inhibition is of great significance for drilling safety in gas hydrate-bearing sediments. Considering the importance of the selection of a suitable thickener for drilling fluid systems under weak and strong driving forces, the hydrate inhibition of 0.1–0.5 wt% modified starch (MS), carboxymethylcellulose sodium (CMC), and xanthan gum (XG) aqueous solutions was studied. The applicability of these three thickeners were investigated through hydrate formation experiments, mesostructure observations, water activity tests, bubble retention observations, and rheological property tests. The results show that (1) under weak driving force, 0.3 wt% or higher concentration CMC and 0.3 wt% XG can almost completely inhibit hydrate formation due to the interactions between relatively small amounts of free water and CH4 molecules. Furthermore, the hydrate inhibition of higher XG concentrations was decreased due to their strong foam stability, leading to good contact between free water and CH4 molecules. Meanwhile, the hydrate inhibition of MS was weaker when compared with that of CMC and XG at the same concentrations. (2) Under strong driving force, the existence of the three 0.1–0.5 wt% thickeners could only slow down the hydrate formation rate, and hydrate inhibition due to XG was slightly better than that of the other two. This result implies that the effects of the different mesostructures on hydrate formation were severely weakened. Finally, (3) the tackifying effect of CMC was found to be stronger than that of XG and MS, and the rheological properties of the CMC solution were shown to be relatively weak compared to those of the XG and MS solutions; the CMC solution showed a more significant increase in viscosity with decreasing temperature, which is related to the differences in the mesostructures. Therefore, when the driving force of hydrate formation is relatively low, CMC is a good choice for the drilling fluid system when there is no requirement for cooling, while XG is more applicable for a system that needs cooling. In the case of a stronger driving force, XG is the optimal choice irrespective of whether the drilling fluid system needs cooling or not.

1. Introduction

Natural gas hydrates are ice-like crystalline substances in which natural gas molecules (mainly CH4) are physically trapped inside the polyhedral cavities of water molecules [1,2,3]. They occur abundantly in both petrochemical production lines and natural environments, such as deep-sea sediments and permafrost regions where temperature and pressure conditions are favorable for hydrate stability [4,5,6,7]. Natural gas hydrate resources are estimated to contain twice the amount of carbon than that found in all known fossil fuels on the Earth [8,9], hence natural gas hydrates are an alternative energy source with immense potential [1,8,10].
As is well known, the exploration and development of natural gas hydrates cannot be performed without well drilling operations. It is crucial, for safety, to efficiently prevent and control various risks while drilling [11]. During drilling in gas hydrate-bearing sediments, hydrate phase transformations occur due to the change of temperature and pressure conditions in the well and/or around the wellbore, which results in different safety problems [12]. Shallow gas and hydrate decomposition gas permeate into drilling fluid in the well [13,14], changing the properties of the drilling fluid and forming hydrates. These hydrates can plug the well under appropriate temperature and pressure conditions, which increases safety risks [13,14]. Such risks are also encountered in conventional deep-sea oil and gas drilling [15,16]. Normally, drilling fluid is cooled and pumped into the well to inhibit and control the decomposition of hydrates in the sediment around the wellbore [17]. During the circulation of the drilling fluid in the well, the low-temperature drilling fluid undergoes heat exchange with drilling tools and sediments around the wellbore, and its changing temperature affects its rheological property [17]. Thus, hydrate drilling fluid requires both good hydrate inhibition and good rheology properties under considerable temperature variations and conditions. These two properties and the balance between them largely depend on the mesostructures of drilling fluids with thickener (an important part of the drilling fluid system) [18].
For the bulk phase and porous media systems, the difference in the behavior of hydrate formation and dissociation is caused by the difference in their heat and mass transport properties [19]. Although there have been some studies into the effect of the thickener on hydrate formation [20,21,22,23,24], the mechanisms have not been fully clarified yet, especially from the view of heat and mass transfer in the mesostructures of drilling fluids.
In this study, the effects of modified starch (MS), carboxymethylcellulose sodium (CMC), and xanthan gum (XG), three typical thickeners widely used in drilling fluids, on methane hydrate formation were investigated under weak and strong driving forces, with consideration of the varying temperature–pressure environments of drilling fluids (5.0 °C and 5.0 MPa, 5.0 °C and 12.0 MPa, respectively). A concentration range of 0.1–0.5 wt% for the thickeners was studied, and the influence mechanism was investigated based on characteristics of their mesostructures. In addition, the thickening effects and rheological properties of the aqueous solutions were comprehensively considered under temperature-varying conditions (5–20 °C). Furthermore, the applicability of each thickener in different drilling fluid systems was evaluated. The results can provide value references for the choice of thickeners for natural gas hydrate, and for conventional deep-sea oil and gas drilling fluids. Additionally, the results can guide the development of drilling fluid systems with constant rheology.

2. Experimental Methods

2.1. Materials and Instruments

The experimental materials consisted of MS and XG (produced by Zhongxuan Biomedical Co., Ltd., Zibo, China), high-viscosity CMC (obtained from Sinopharm Chemical Reagents Co., Ltd., Shanghai, China), CH4 gas (purity ≥99.9%, obtained from Wuhan Niuruide Specialty Gas Co., Ltd., Wuhan, China), and distilled water. Simulated experiments for the methane hydrate formation were conducted in an HCSHW-Ι-type multifunctional hydrate reaction simulator (see Figure 1). Samples for mesostructure observation experiments were first freeze-dried using an LGJ-10D-type freeze-drier, and then scanned using a Phenom pro-type desktop scanning electron microscope (SEM).

2.2. Experimental Methods and Processes

2.2.1. Simulated Experiment for Hydrate Formation

Typically, relatively-low-temperature drilling fluid is used for natural gas hydrate drilling [17]. However, drilling fluids exhibit a relatively high viscosity at low temperatures, which affect their rheological properties [25]. Therefore, low concentrations of thickener aqueous solutions (0.1–0.5 wt%) were selected in this study as in typical situations. Each solution was prepared by stirring the samples at a speed of 600 rev/min for 2 h.
During drilling for natural gas hydrate and conventional deep-sea oil or gas, the temperature–pressure environment of the drilling fluid varies with the circulation, thereby changing the driving force for hydrate formation in the annular space during gas invasion. The phase equilibrium conditions (5.0 °C, 4.56 MPa) of CH4 hydrates in pure water, and the temperature–pressure conditions for drilling in the marine hydrate exploration project in the South China Sea were considered [26,27,28]. According to these conditions, the effects of various types and concentrations of the thickeners on hydrate formation were investigated under two different initial experimental conditions that change the driving force of hydrate formation by increasing the pressure [29]: (a) 5.0 °C and 5.0 MPa (the corresponding undercooling of hydrate formation was ~1.3 °C) as a weak driving force; and (b) 5.0 °C and 12.0 MPa (the corresponding undercooling of hydrate formation was ~10.1 °C) as a strong driving force. To ensure experimental repeatability, each experiment was repeated thrice, and experiments were conducted as follows:
(1)
The reactor was cleaned and the air tightness checked.
(2)
Next, 250 mL of the sample was injected into the 650 mL reactor and then the reactor was continuously vacuumized for 30 min.
(3)
CH4 gas was continuously injected into the buffer tank until the pressure reached 20.0 MPa, and then the temperature control system was turned on.
(4)
When the temperature of the experimental system decreased and stabilized at 5.0 °C, the inlet of the reactor was switched on to let the CH4 gas in the buffer tank enter the reactor, which allowed the pressure to reach the designed value (5.0 MPa or 12.0 MPa).
(5)
The monitoring software was turned on to collect the temperature/pressure data in the reactor (at a collection frequency of one sample per 2 s) and the mechanical stirring apparatus was turned on with a stirring rate of 600 rev/min.

2.2.2. Mesostructure Observation Experiment

The understanding of the mesostructure characteristics of a thickener aqueous solution, helps to reveal the mechanism that influences hydrate formation [30]. Therefore, in this study, each solution was first prepared by freeze-drying, and then its mesostructure was characterized by SEM. The experimental steps were as follows:
(1)
A small amount of solution was dripped onto a new cleavage mica sheet and immerse the specimen in liquid nitrogen for 2 min.
(2)
The frozen sample was placed into a freeze-drier and lyophilized for 12 h.
(3)
The specimen was observed with SEM.

2.3. Determination of Experimental Parameters

2.3.1. Data Processing of the Simulated Experiments

The corresponding temperature and pressure versus time in the reactor were recorded during the experiment. The start and stop times for the hydrate formation as well as their corresponding values could be obtained from the temperature and pressure curves. During the evaluation of hydrate inhibition, the induction time and the amount and rate of hydrate formed were analyzed in detail [29,31]. Following this suggestion, a generalized method was employed to examine the induction time of hydrate formation [32]. As the experimental gas was high-purity CH4, consumption of the gas could be used to represent the amount of formed hydrate. The consumption amount of gas is calculated by the formula [33]:
Δn = (P1/Z1P2/Z2) · V/RT,
where Δn is the gas consumption amount in moles; R is the universal gas constant, 8.31441 J/(mol·K); T is the gas temperature in K; V is the gas volume in m3; P1 and P2 are the pressures in the reactor at the start and end times of hydrate formation, respectively, in Pa; and Z1 and Z2 are the gas compression factors under the P1 and P2 states, respectively [34,35].
The hydrate formation rate was characterized by the average consumption rate of CH4 gas during the period between the start and end of hydrate formation, which is expressed as follows:
v = Δn/(t1t2),
where v is the average gas consumption rate in mol/min; and t1 and t2 are the hydrate formation ending and induction times, respectively, in min.

2.3.2. Mesostructural Observation of Freeze-Dried Solution Samples

According to the results obtained from each hydrate formation simulated experiment, three thickeners exhibited good hydrate inhibition with a concentration of 0.3 wt% (Jiang et al. also obtained similar results [36]). Therefore, the thickener solutions with concentrations of 0.3 wt% were selected and prepared by freeze-drying. Subsequently, SEM images of the sample mesostructures were recorded at 400, 1000, 4000, and 10,000× magnifications, and the influence mechanisms of the thickeners on hydrate formation were analyzed from their mesostructures.

3. Results

3.1. Simulated Experiments

3.1.1. Initial Temperature–Pressure Conditions of Experiments at 5.0 °C and 5.0 MPa

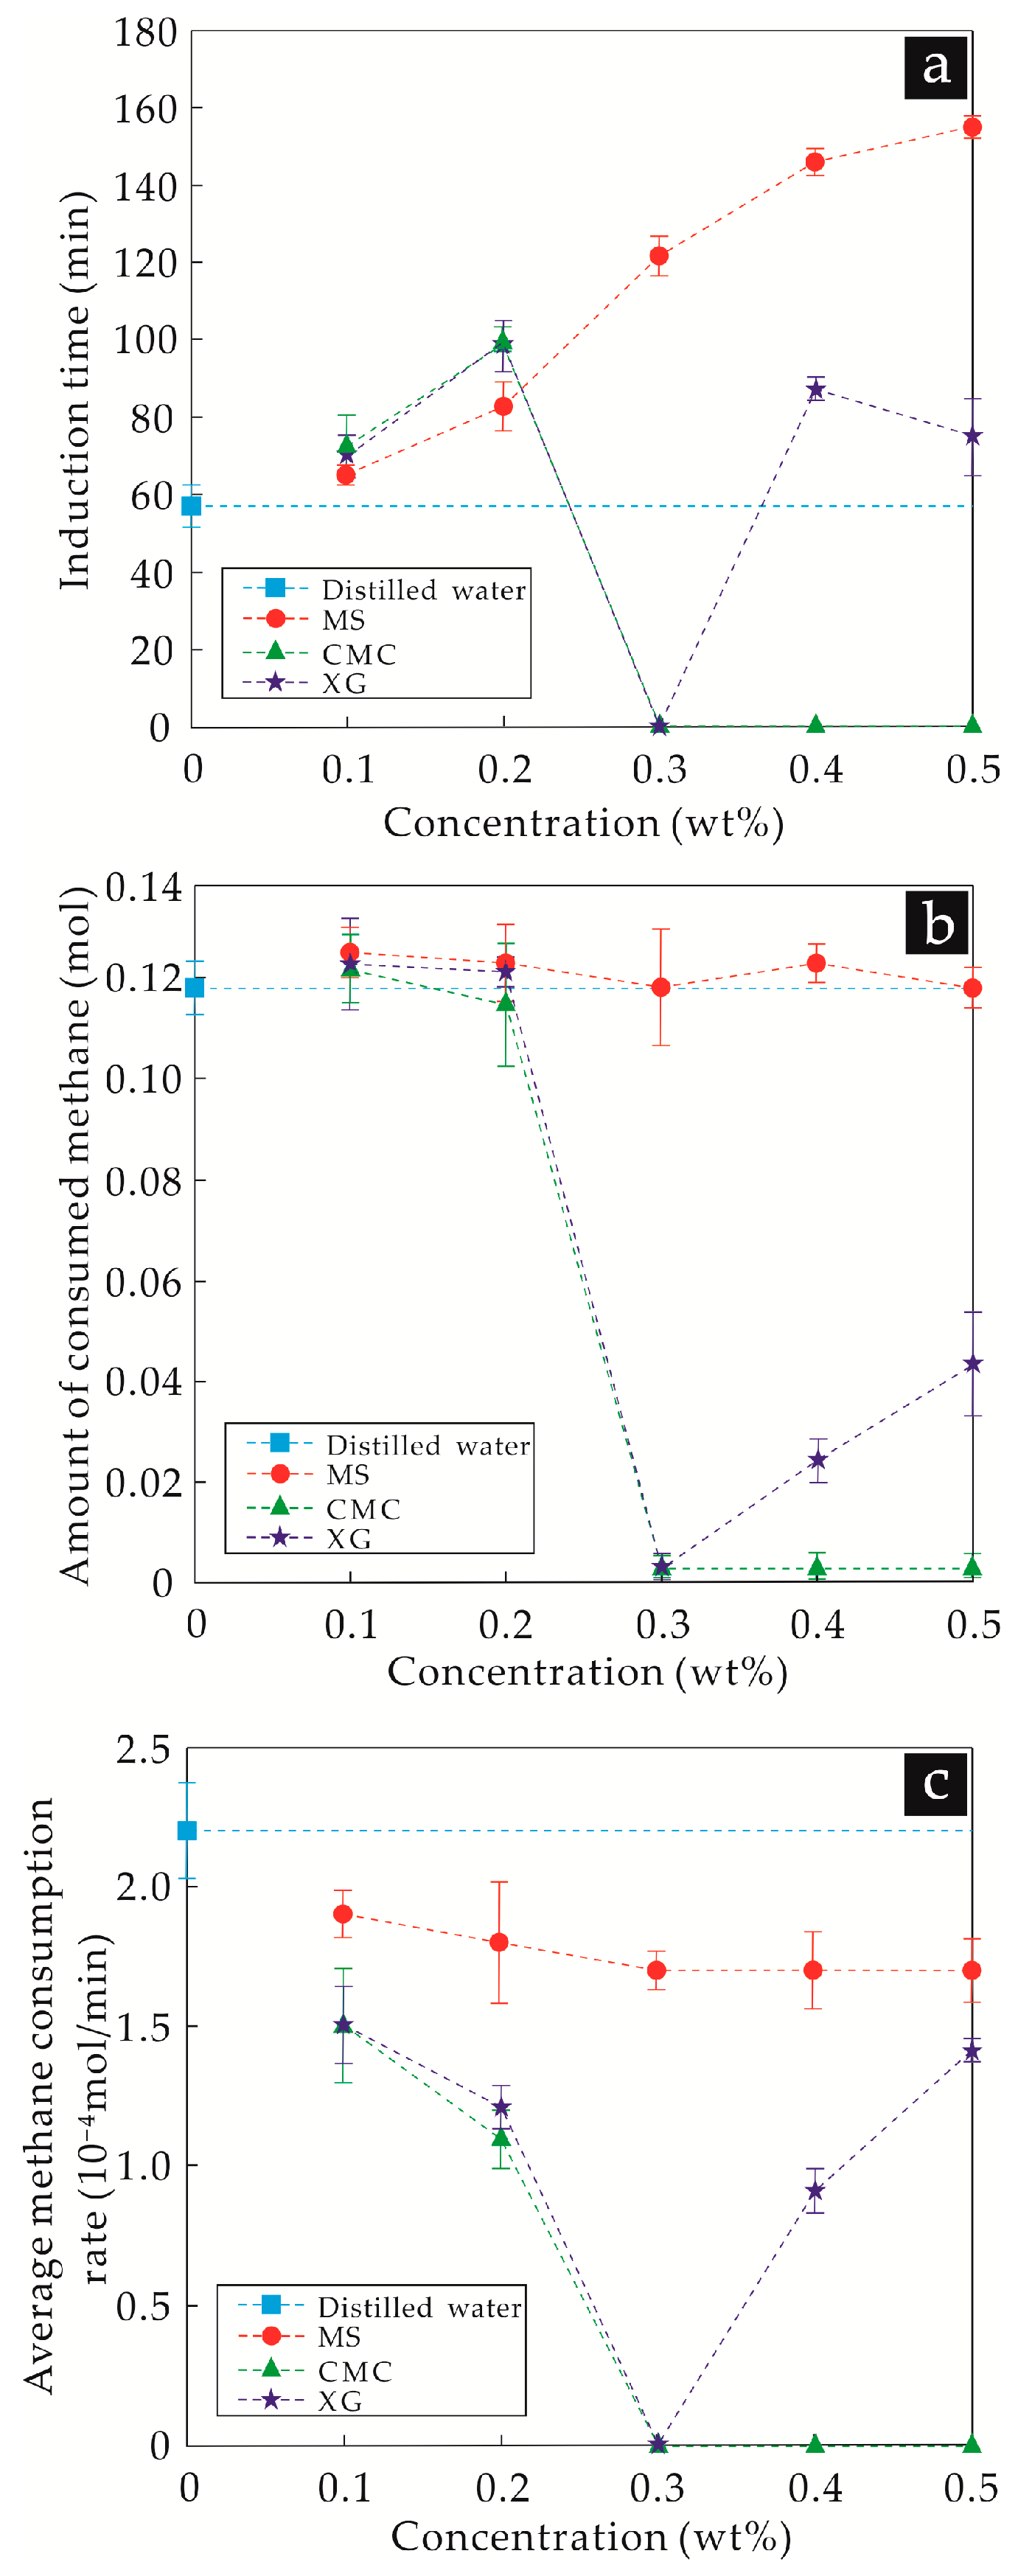
Utilizing the method described in Section 2.3.1, the induction time, amount, and rate of hydrate formation in each experiment is directly obtained or calculated (see Figure 2).
It can be seen from Figure 2 that, compared with the hydrate formation experiments in distilled water, the thickener aqueous solutions in each group exhibited different degrees of hydrate inhibition. With an increasing concentration of MS, the induction time of hydrate formation was prolonged and the formation rate of hydrates decreased gradually. However, the formation amount of hydrates remained nearly unchanged, with a value close to the same amount as that of the distilled water experiments.
For CMC solutions with concentrations of 0.1 wt% and 0.2 wt%, the induction time and formation rate were similar to those of MS, and the amount of hydrate formed was also similar to that of the distilled water experiment. For a solution with a concentration larger than 0.3 wt%, the temperature did not increase sharply and the pressure did not decrease sharply, indicating that hydrates did not form. Moreover, the CH4 gas consumption amount was only 0.003 mol during the entire experiment. Therefore, under the experimental conditions, there was almost no hydrate formation at these three concentrations of CMC aqueous solutions.
With the XG aqueous solution concentration increasing from 0.1 wt% to 0.3 wt%, the variation trends of the induction time for hydrate formation and the amount and rate of formed hydrate were similar to those of the CMC experiments. However, the induction times for hydrate formation of 0.1 wt% and 0.2 wt% XG aqueous solutions were relatively long. With concentrations increasing to 0.4 wt% and 0.5 wt%, 0.024 mol and 0.043 mol of CH4 gas were consumed, respectively.
To summarize the effects of MS, CMC, and XG, under a weak driving force for hydrate formation: although MS exhibited an inhibitory ability for hydrate formation and hydrate inhibition increased with the concentration of MS, the hydrate inhibitory ability was relatively weak. The inhibitory ability of CMC on hydrate nucleation and growth was relatively strong, and for concentrations larger than 0.3 wt%, hydrate formation was nearly completely inhibited. In addition, the hydrate inhibition of XG was also relatively strong, and the addition amount of 0.3 wt% could thoroughly inhibit hydrate formation. However, a small amount of hydrate was formed in the system with a further increase of the concentration of XG, which shows that, for XG aqueous solutions, a concentration of 0.3 wt% is the optimal addition amount for hydrate inhibition.

3.1.2. Initial Temperature–Pressure Conditions of Experiments at 5.0 °C and 12.0 MPa

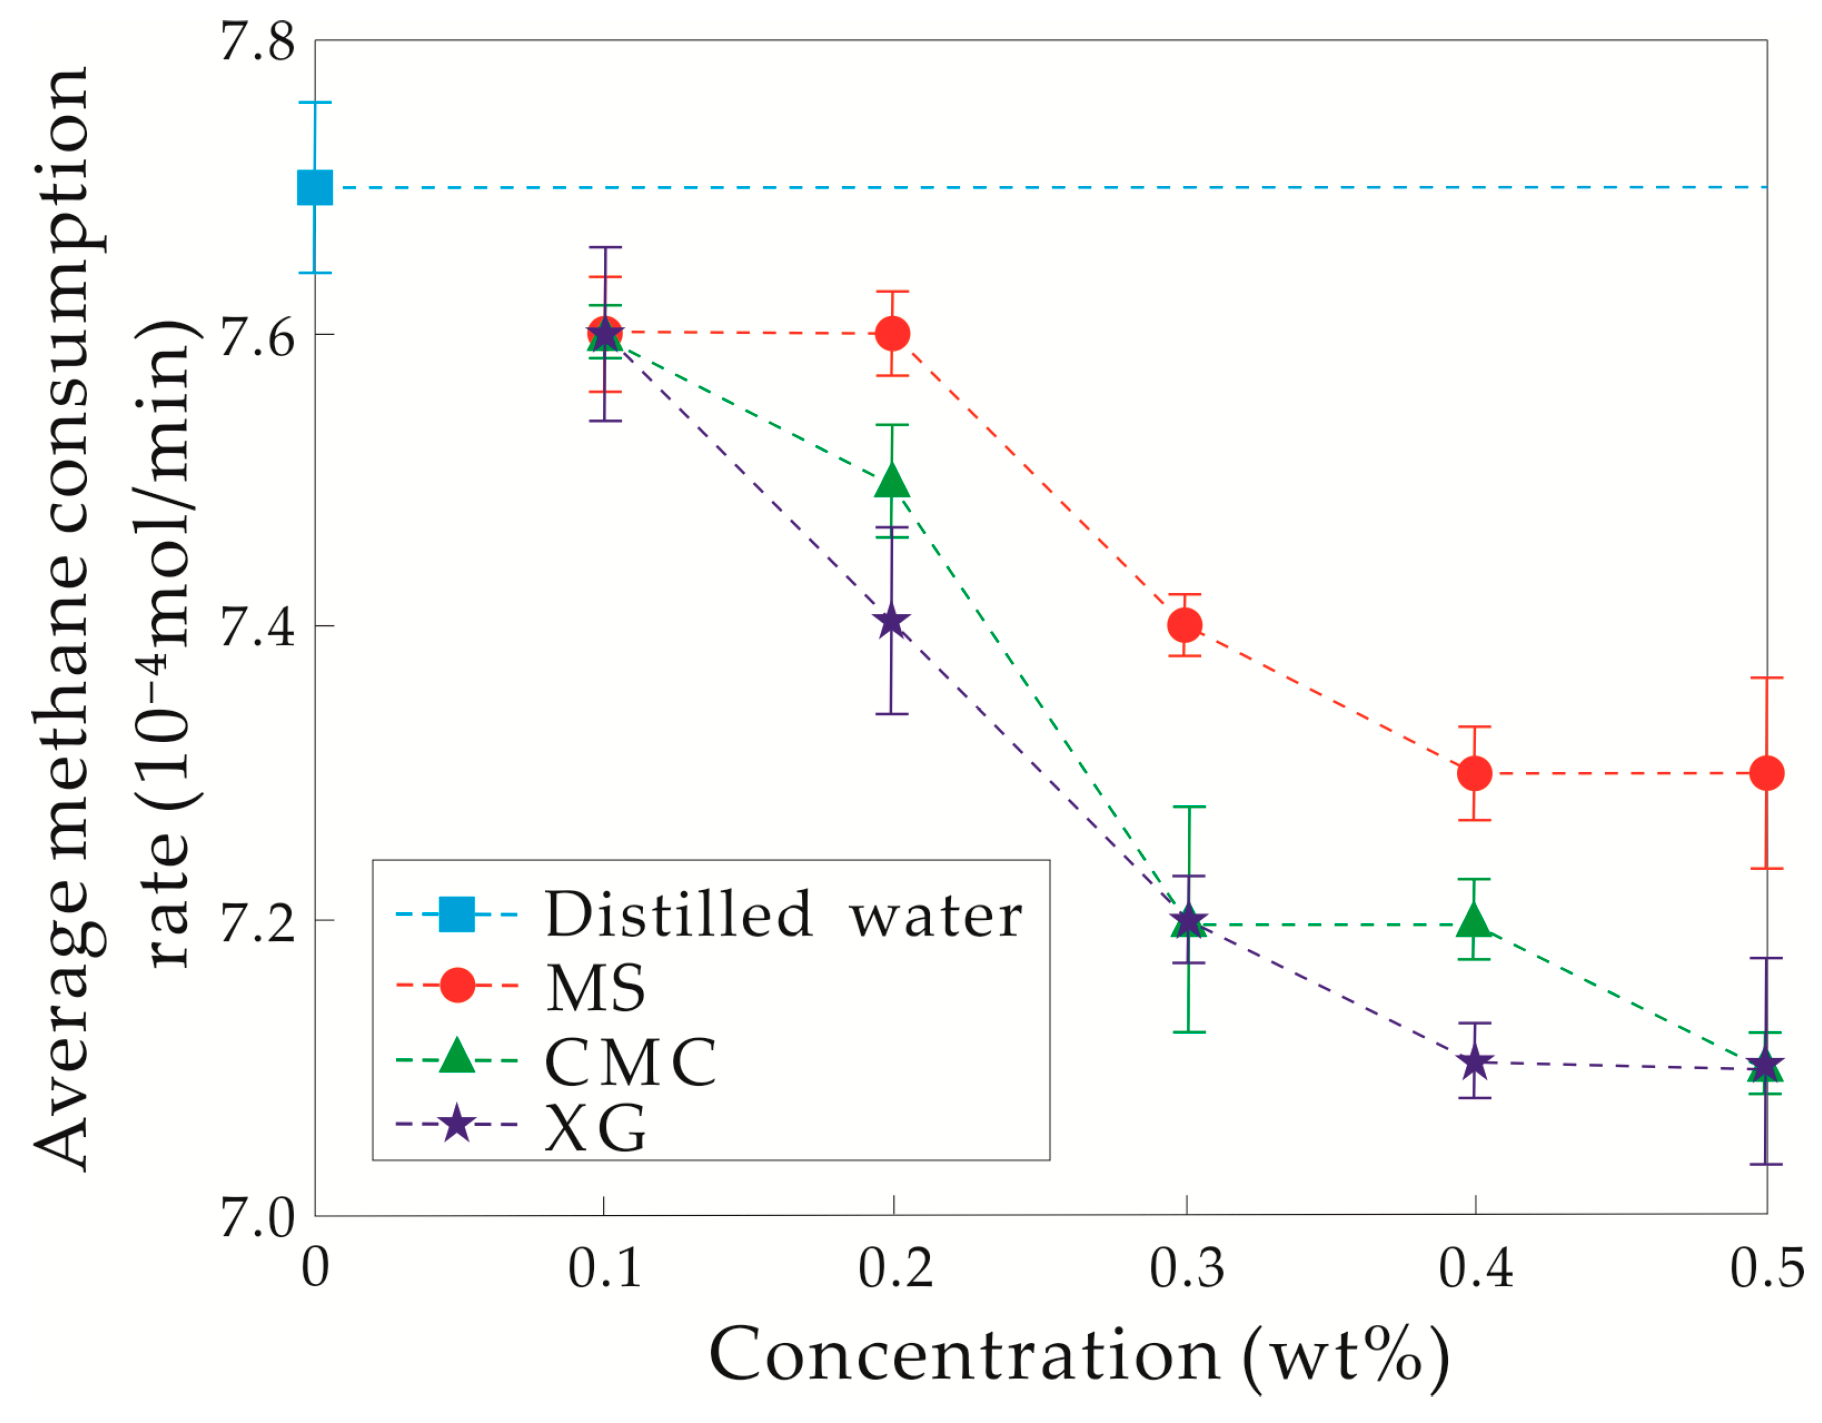
When the initial temperature and pressure conditions were set to 5.0 °C and 12.0 MPa, the pressure decreased sharply and the temperature significantly increased simultaneously during the experiments. This dependence indicates that there was an extremely short or even no induction time for hydrate formation. The amount of hydrate formed in each experiment was also the same, due to the similar initial and final pressures. However, different end times of hydrate formation among experiments were observed, leading to different hydrate formation rates (see Figure 3).
The hydrate formation rates for the three 0.1 wt% thickener aqueous solutions were slightly less than that of the distilled water experiments, indicating weak hydrate inhibitory abilities. With the concentration increasing from 0.1 to 0.2 wt%, the hydrate inhibitory ability of MS aqueous solution remained nearly unchanged. On the contrary, the rates of hydrate formation in CMC and XG aqueous solutions both decreased, showing that the hydrate inhibitory abilities of CMC and XG were enhanced, and was relatively strong in the latter. When the concentration of the three thickeners varies from 0.3 to 0.5 wt%, the hydrate formation rate decreased. For the same concentration of the three thickeners, MS exhibited the weakest hydrate inhibitory ability, and the hydrate inhibitory ability of XG was slightly stronger than that of CMC.
Under a strong driving force, although the inhibition ability of the three thickeners for hydrate formation increased with the concentration, their inhibition was still relatively weak and only decreased the hydrate formation rate to some extent. The hydrate inhibition of XG was the strongest under these experimental conditions.

3.2. Mesostructure Experiments

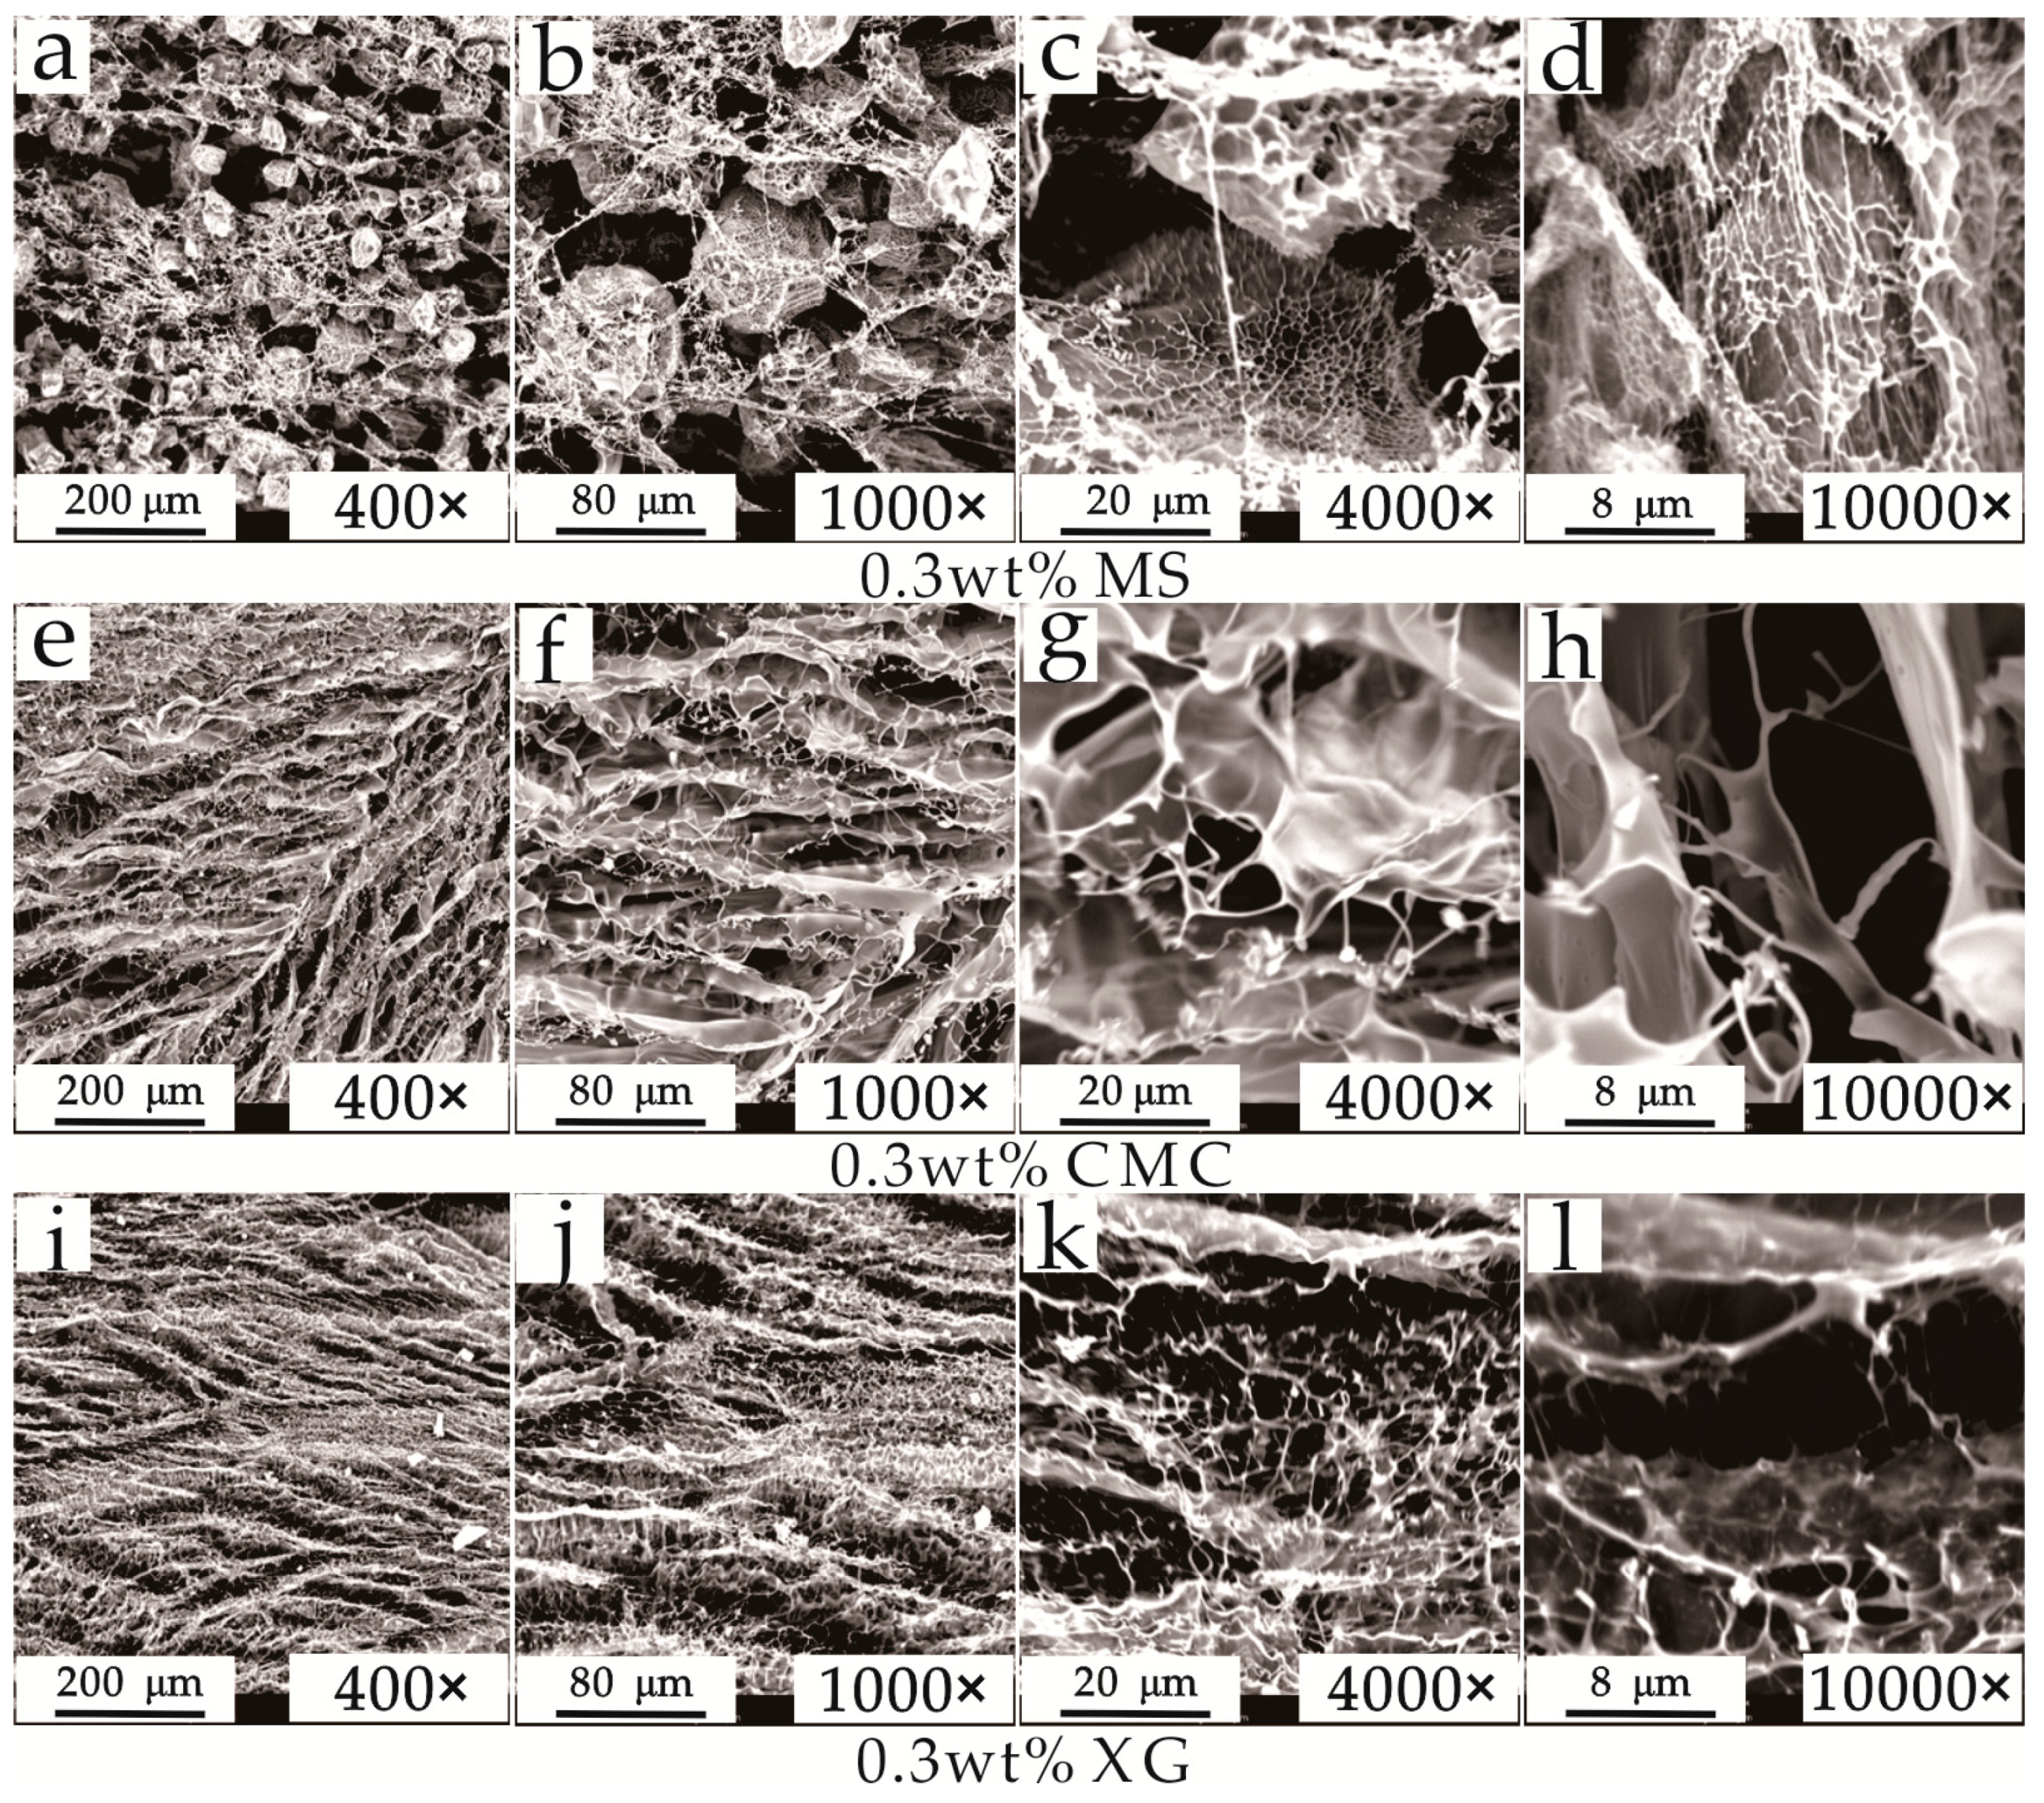
Figure 4 shows mesostructures of freeze-dried samples for different magnifications, where bright white and dark parts represent the hydrated molecule aggregates of the thickener and pore spaces, respectively. The spatial structure of MS-hydrated molecules is mainly comprised of rod-like network skeletons (diameter of 0.2–0.5 µm) with a relatively sparse distribution, and with spherical aggregates (diameter of 100–150 µm) attached to them (Figure 4a–d). A honeycomb-like interior pore space with pore diameter of 2–8 µm is observed in the spherical aggregates. Pores among network skeletons are within three different ranges of diameters of 5–25 µm, 50–80 µm, and 100–200 µm. Moreover, pores with large diameters (i.e., 50–100 µm) exhibit good connectivity.
The spatial structure of CMC-hydrated molecule aggregates is mainly comprised of uniformly-distributed smooth sheet-like skeletons (with a thickness of ~0.2 µm and a spacing of 20–80 µm), with line-like skeletons (diameter of ~0.2 µm) sparsely distributed among them (Figure 4e–h). Among the sheet-like skeletons, the pore diameter is smaller than that of MS (5–50 µm), and the shapes are more complex.
The spatial structure of XG-hydrated molecule aggregates is similar to that of CMC (Figure 4i–l). However, the sheet-like skeleton is thinner (thickness of ~0.1 µm) and the spacing interval is smaller (10–50 µm). The line-like skeletons supporting the sheet-like skeletons are thinner (diameter of ~0.1 µm) with a much denser distribution, leading to a smaller pore size in the network skeleton (diameters of 2–30 µm) and a more complex morphology.
The significant differences in the spatial mesostructures of the three different thickener solutions not only affect the spatial distribution and contents of the three different states of water (free water, weakly bound water, and strongly bound water) and the gas in the drilling fluid [37], but also affect the heat and mass transfer during hydrate formation and dissociation, which can affect the hydrate inhibition [18].

4. Discussion

4.1. Hydrate Inhibition and Inhibitory Mechanism Analysis of the Three Thickeners

The amount of CH4 gas dissolved in each solution was almost the same at the beginning of the experiment when the driving force for hydrate formation was weak. For mesostructures of MS aqueous solutions, sparsely distributed rod-like skeletons and spherical aggregates cause their hydrated molecule aggregates to have a smaller specific surface area than those of CMC and XG aqueous solutions. Due to the presence of more pores with larger diameters in MS-hydrated molecule aggregates, there was a smaller number of strongly and weakly bound water molecules adsorbed near the hydrophilic MS molecules and a relatively larger amount of free water molecules in the pore space [35]. Furthermore, the hydrophobic CH4 molecules were possibly dispersed in free water after dissolving in the solution [35], which made a larger contact area between the gas molecules and free water molecules in the pore space and thus created the hydrate form more easily. Hence, MS exhibited weaker hydrate inhibition. With an increase in the amount of MS, the porous space in the skeleton structure decreased, the specific surface area of MS hydrated molecule aggregates increased, and the number of free water molecules decreased. Most of the free water molecules possibly remained in pores with larger diameters for hydrated molecule aggregates and thus had good contact with CH4 molecules staying in the same pores. This effect only slightly enhanced the hydrate inhibition of MS.
A smaller volume of thin sheet-like and line-like hydrated molecule aggregates in CMC solutions was observed with a relatively uniform distribution, and the network skeleton exhibited a larger specific surface area with a smaller pore space and a more complex morphology. Compared with MS, a larger number of water molecules were adsorbed near hydrophilic CMC-hydrated molecules, and the number of free water molecules in the pore space was smaller, leading to stronger hydrate inhibition. With the amount of CMC increasing from 0.1–0.2 wt% to 0.3–0.5 wt%, the network skeleton of the hydrated molecules became thicker and wider, which made the surface area larger, the morphology more complex, and the pore space in the network skeleton smaller. As a result, there were almost no free water molecules remaining in the pore space, and water molecules in the solution were mostly strongly bound water. Thus, in the case of a weak driving force for hydrate formation, it was difficult or even impossible for water molecules to align and form a cage structure under hydrogen bonding [38,39]. As a result, the hydrate formation was almost completely inhibited. The mechanism of this inhibitory effect is similar to the complete inhibitory effect of kinetic inhibitors under certain conditions [40,41].
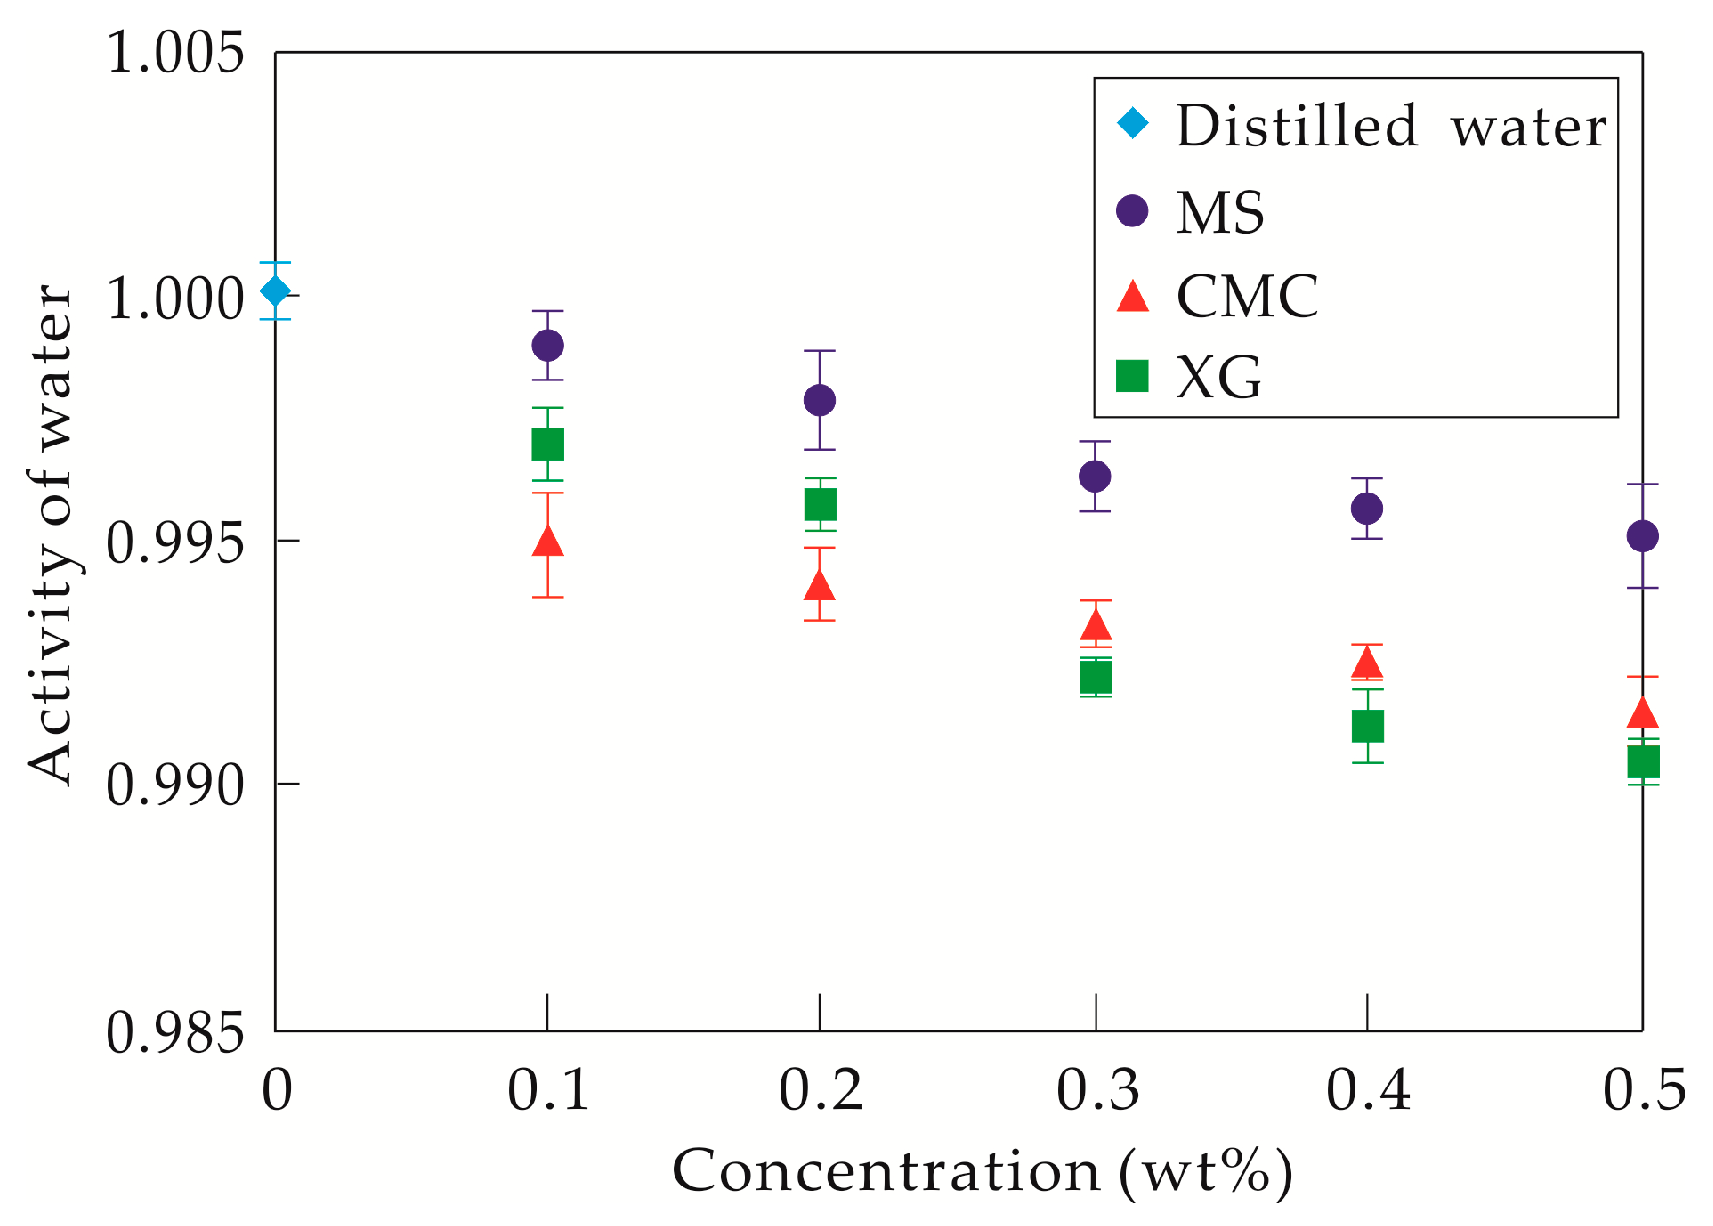
With the addition of 0.1 wt% and 0.2 wt% XG, the volumes of the sheet-like and line-like hydrated molecule aggregates were smaller, and their distribution was more uniform compared to those existing in CMC solutions at the same concentrations. The porous space in the skeleton structures is smaller with a more complex morphology. However, the hydrate inhibitory ability of XG was slightly weaker than that of CMC. According to the activity values of water in CMC and XG solutions at these two concentrations (Figure 5), although the specific surface area of the XG-hydrated molecule aggregates in the solution was larger, their abilities to bond to water molecules were weaker. This effect may cause a smaller amount of bound water molecules in the solutions. Hence, the hydrate inhibition was slightly weaker than that of CMC. With the use of 0.3 wt% XG, the skeleton structure of the hydrated molecule was denser, and the size of the porous space became smaller. Although the adsorption ability of hydrated molecules was relatively weak, water molecules in the porous space possibly exist as strongly bound water as a result of the larger specific surface area of the hydrated molecules. Thus, almost no hydrate is forms in the solution. With the concentration of XG increasing to 0.4 wt% and 0.5 wt%, the network skeleton structure becomes even denser, the porous space becomes even smaller, and water molecules in the porous space were possibly all strongly bound water. However, a small amount of hydrate formed in the solution, which may be related to the strong foam stability of XG aqueous solutions (see Figure 6).
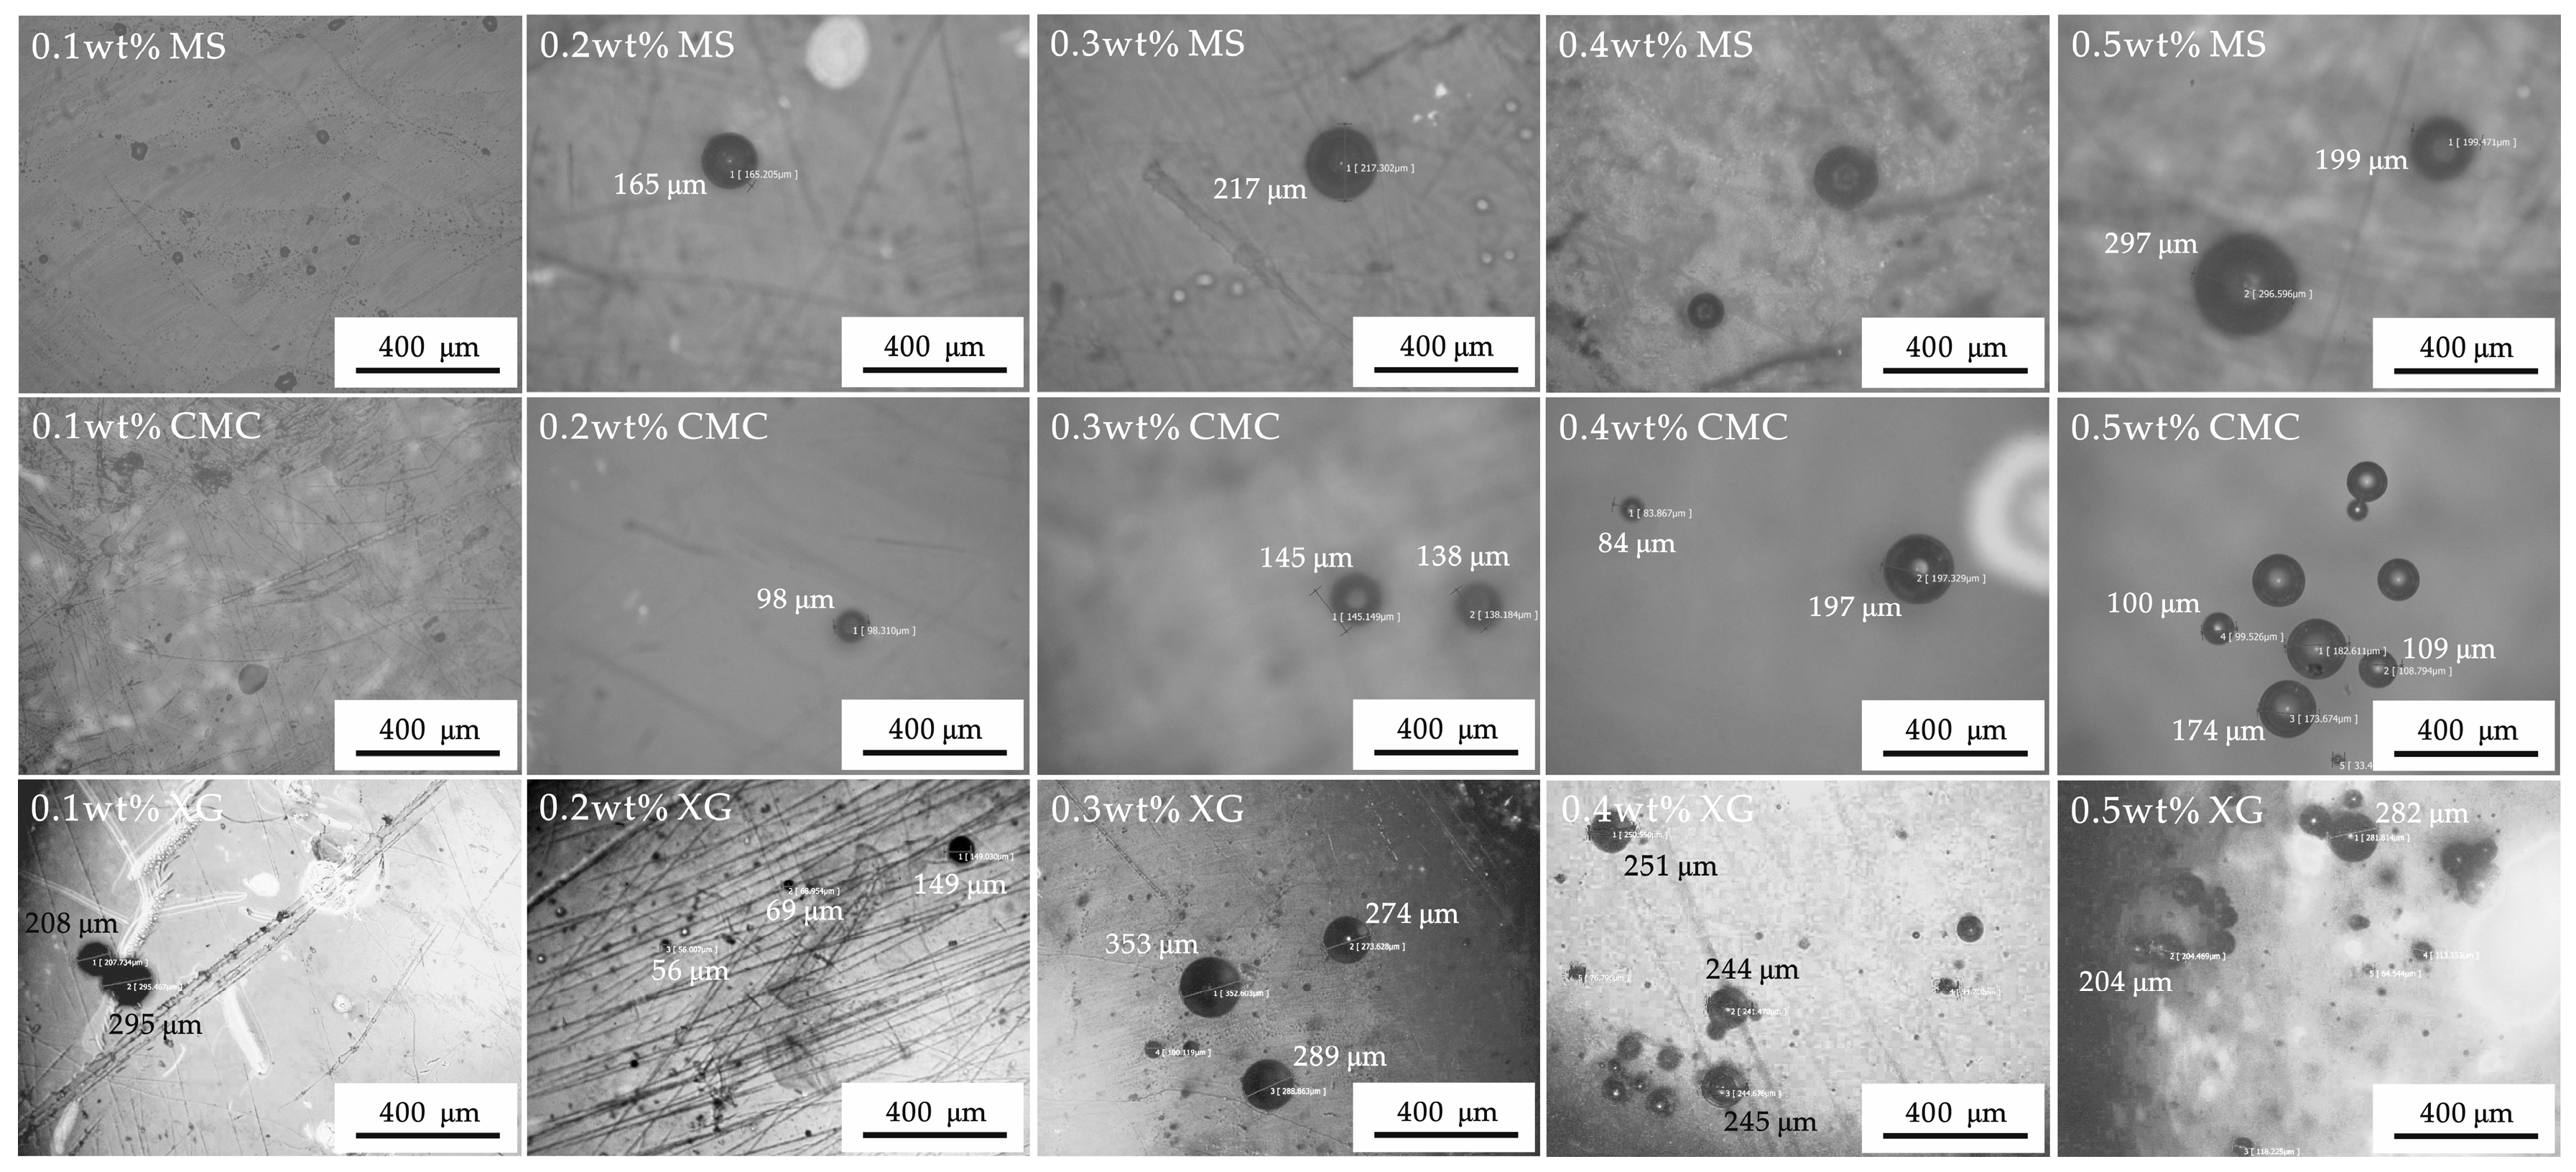
Laser scanning confocal microscopy images reveal the retention of bubbles in the solution after the thickener aqueous solution was prepared and transferred to a new cleavage mica sheet using a pipette (Figure 6). During solution transfer, the number of bubbles in each MS solution obviously decreased, and only a small number of bubbles are observed. For each CMC solution, although bubbles dissipate, the number of remaining bubbles was greater than that of the MS solution. Meanwhile, in each XG solution, only a small number of bubbles dissipated during the transfer. It seems that although MS and CMC solutions exhibit certain foamability under stirring, bubbles formed in solutions are easily broken, dissipate easily, and have difficulty existing stably because of weak foam stability. XG molecules are rod-like helical structures with a large number of rigid groups. A dense composite film is formed between the gas–liquid interface at a specific concentration. XG molecules increase the strength and thickness of the bubble wall and permit the facile formation of bubbles and their stable existence under violent kinetic conditions [42]. Therefore, with the addition of 0.4 wt% and 0.5 wt% XG in solution, a large number of stable methane bubbles are formed in the reactor under stirring. Due to a large gas–liquid contact area at the bubble wall, a small amount of hydrate is probably formed on the bubble surface as a thin film [43], which decreases the hydrate inhibition of XG at these two concentrations.

4.2. Applicability Analysis of the Three Thickeners in Different Drilling Fluid Systems

In order to avoid large hydrate dissociation in the reservoir during the drilling of hydrates, the reservoir temperature should be kept in a hydrate stability zone. Therefore, it is necessary to maintain the temperature of the drilling fluid at a relatively low value [17]. However, the temperature–pressure conditions of the low-temperature drilling fluid circulating in the wellbore keep changing. The rheological properties, especially the viscosity of the drilling fluid, varies with temperature, which further affects the ability of the drilling fluid to flow [17,25]. In order to stabilize the rheological properties of the prepared drilling fluid, more attention should be paid to the effects of thickeners on hydrate formation; the thickening effect and amplitude of the drilling fluid viscosity under various temperature conditions. Considering the temperature range involved in marine hydrate drilling (2.0 °C to room temperature), in this study, the rotational viscosity of each thickener solution, for temperatures 5.0–20.0 °C, was measured by a temperature-controlled six-speed rotation viscometer, produced by Qingdao HaiTongDa Special Purpose Instrument Co., Ltd. (Qingdao, China). The apparent and plastic viscosities of each solution were calculated by:
μa = θ600/2
μp = θ600 – θ300,
respectively, where μa is the apparent viscosity in mPa·s; μp is the plastic viscosity in mPa·s; θ600 is the dial reading of six-speed rotation viscometer at 600 rev/min; and θ300 is the dial reading of six-speed rotation viscometer at 300 rev/min. The results are shown in Table 1.
The apparent and plastic viscosities of each solution increase with the additional amounts of thickeners and decrease with the system temperature (see Table 1). This result is closely related to the skeleton structure of the thickener-hydrated molecules and molecular thermodynamic motion. The increasing concentration leads to a steadier network skeleton and a more complex morphology. Meanwhile, the pore space becomes smaller, which decreases the amount of free water. More water becomes strongly or weakly bound water, which increases the difficulty of the shear fracture of the skeleton structure. Lower temperatures weaken the thermodynamic motion of the thickener hydrated molecules and the water molecules in the pore space. Moreover, the buffering effect of water molecules on the relative motion among thickener hydrated molecules becomes weaker, resulting in a more difficult relative motion between the thickener-hydrated molecules [18]. The thickening effect of the addition decreases in order of CMC, XG, and MS, due to the different aggregation degrees of the formed network skeletons aggregated in the thickener-hydrated molecule solution. The rheological properties of MS and XG solutions, affected by different thermal stabilities of the solution, are better at low temperatures, while the rheological properties of CMC solutions are poorer [44].
According to the results obtained from the hydrate formation simulated experiments and solution viscosity tests, for low-temperature drilling fluid under variable temperature, the balance of the thickening effect and hydrate inhibition should be considered when selecting a suitable type and concentration of the drilling fluid thickener. If the temperature–pressure conditions for drilling are near the phase equilibrium condition of natural gas hydrate, the hydrate formation can be inhibited by CMC addition of 0.3 wt% or larger, and the drilling fluid viscosity is also increased. In this context, the addition amount of the hydrate inhibitor can be appropriately decreased. When the drilling temperature–pressure condition exerts a strong driving force for hydrate formation, it is better to select XG as the drilling fluid thickener, in order to reliably guarantee the inhibition of the hydrate formation in the drilling fluid system.

5. Conclusions

The experiments show that when the driving force of hydrate formation is weak, 0.1–0.5 wt% MS addition has only a small inhibition effect on hydrate formation. However, 0.1–0.5 wt% CMC addition and 0.3 wt% XG addition can completely inhibit hydrate formation. If the XG concentration is increased to 0.4 wt%–0.5 wt%, hydrate inhibition is weakened because of the strong foam stability, which leads to a good contact between free water and CH4 molecules. When the driving force for hydrate formation is relatively strong, all the three thickeners (MS, CMC, and XG) will reduce the hydrate formation rate to some degree with an increase of their addition amounts. In this case, the inhibition effect of XG is better than the other two. These results imply that the effects of the different mesostructures on hydrate formation are severely weakened under strong driving force. Moreover, for MS, CMC, and XG aqueous solutions, increasing concentration or decreasing temperature causes an increase of the apparent and plastic viscosities. In CMC solutions this effect is much larger than in the other two solutions, which is also related to the difference in their mesotructures.
In general, for a weak driving force, CMC is more applicable for use in a drilling fluid system without cooling, while XG is more suitable for a drilling fluid system that requires cooling. With a strong driving force for hydrate formation, XG was applicable to various drilling fluid systems with a hydrate inhibitory ability. An appropriate amount of addition of XG can enhance the foaming and foam stability of the drilling fluid system, which will weaken the hydrate inhibition of the system. Therefore, when selecting XG as the thickener, an appropriate amount of defoaming agent should be considered to mix in the drilling fluid. Further studies will be conducted on heat and mass transfer in the mesostructures of these thickener aqueous solutions to provide valuable references for the further development of drilling fluid systems for conventional deep-sea oil and gas and natural gas hydrate.

Author Contributions

All of the authors contributed to publishing this paper. R.W., X.X., and H.S. conceived and designed the experiments. R.W., H.S., X.S., and Z.Z. performed the experiments and wrote the paper. R.W., X.X., and L.Z. prepared the experiments and analyzed the data.

Funding

This research was funded by the Opening Fund of Key Laboratory of Unconventional Oil & Gas Development (China University of Petroleum (East China)), the Ministry of Education, the Fundamental Research Funds for the Central Universities, the China Postdoctoral Science Foundation (206402), the Research Project of CNPC Engineering Technology R & D Company limited (CPET201807), and the National Natural Science Foundation of China (51874263).

Acknowledgments

The authors would like to thank Professor Jinsheng Sun for critically reviewing the manuscript.

Conflicts of Interest

The authors declare no conflict of interest.

References

  1. Sloan, E.D. Fundamental principles and applications of natural gas hydrates. Nature 2003, 426, 353–363. [Google Scholar] [CrossRef]
  2. Walsh, M.R.; Koh, C.A.; Sloan, E.D.; Sum, A.K.; Wu, D.T. Microsecond simulations of spontaneous methane hydrate nucleation and growth. Science 2009, 326, 1095–1098. [Google Scholar] [CrossRef] [PubMed]
  3. Jacobson, L.C.; Hujo, W.; Molinero, V. Amorphous precursors in the nucleation of clathrate hydrates. J. Am. Chem. Soc. 2010, 132, 11806–11811. [Google Scholar] [CrossRef]
  4. Hammerschmidt, E.G. Formation of gas hydrates in natural gas transmission lines. Ind. Eng. Chem. 1934, 26, 851–855. [Google Scholar] [CrossRef]
  5. Makogon, Y.F. Natural gas hydrates—A promising source of energy. J. Nat. Gas Sci. Eng. 2010, 2, 49–59. [Google Scholar] [CrossRef]
  6. Kvenvolden, K.A. Gas hydrates—Geological perspective and global change. Rev. Geophys. 1993, 31, 173–187. [Google Scholar] [CrossRef]
  7. Feng, J.C.; Wang, Y.; Li, X.S. Dissociation characteristics of water-saturated methane hydrate induced by huff and puff method. Appl. Energy 2018, 211, 1171–1178. [Google Scholar] [CrossRef]
  8. Collett, T.S. Energy resource potential of natural gas hydrates. AAPG Bull. 2002, 86, 1971–1992. [Google Scholar] [Green Version]
  9. Sloan, E.D. Introductory overview: Hydrate knowledge development. Am. Mineral. 2004, 89, 1155–1161. [Google Scholar] [CrossRef]
  10. Liu, C.L.; Meng, Q.G.; He, X.L.; Li, C.F.; Ye, Y.G.; Lu, Z.Q.; Zhu, Y.H.; Li, Y.H.; Liang, J.Q. Comparison of the characteristics for natural gas hydrate recovered from marine and terrestrial areas in China. J. Geochem. Explor. 2015, 152, 67–74. [Google Scholar] [CrossRef]
  11. Mcconnell, D.R.; Zhang, Z.; Boswell, R. Review of progress in evaluating gas hydrate drilling hazards. Mar. Petrol. Geol. 2012, 34, 209–223. [Google Scholar] [CrossRef]
  12. Khabibullin, T.; Falcone, G.; Teodoriu, C. Drilling through gas-hydrate sediments, managing wellbore-stability risks. SPE Drill. Complet. 2011, 26, 287–294. [Google Scholar] [CrossRef]
  13. Ning, F.L.; Zhang, K.N.; Wu, N.Y.; Zhang, L.; Li, G.; Jiang, G.S.; Yu, Y.B.; Liu, L.; Qin, Y.H. Invasion of drilling mud into gas-hydrate-bearing sediments. Part I: Effect of drilling mud properties. Geophys. J. Int. 2013, 193, 1370–1384. [Google Scholar] [CrossRef]
  14. Ning, F.L.; Wu, N.Y.; Yu, Y.B.; Zhang, K.N.; Jiang, G.S.; Zhang, L.; Sun, J.X.; Zheng, M.M. Invasion of drilling mud into gas-hydrate-bearing sediments. Part II: Effects of geophysical properties of sediments. Geophys. J. Int. 2013, 193, 1385–1398. [Google Scholar] [CrossRef] [Green Version]
  15. Hege, E.; Majeed, Y.; Eirik, S. Hydrate control during deepwater drilling: Overview and new drilling-fluids formulations. SPE Drill. Complet. 2001, 16, 16–19. [Google Scholar]
  16. Zhang, L.; Zhang, C.; Hhuang, H.D.; Qi, D.M.; Zhang, Y.; Ren, S.R.; Wu, Z.M.; Fang, M.Z. Gas hydrate risks and prevention for deep water drilling and completion: A case study of well QDN-X in Qiongdongnan Basin, South China Sea. Petrol. Explor. Dev. 2014, 41, 755–762. [Google Scholar] [CrossRef]
  17. Jiang, G.S.; Liu, T.L.; Ning, F.L.; Tu, Y.Z.; Zhang, L.; Yu, Y.B.; Kuang, L.X. Polyethylene glycol drilling fluid for drilling in marine gas hydrates-bearing sediments: An experimental study. Energies 2011, 4, 140–150. [Google Scholar] [CrossRef]
  18. Zhang, L.; Sun, H.C.; Han, B.; Peng, L.; Ning, F.L.; Jiang, G.S.; Chehotkin, V.F. Effect of shearing actions on the rheological properties and mesostructures of CMC, PVP and CMC+PVP aqueous solutions as simple water-based drilling fluids for gas hydrate drilling. J. Unconv. Oil Gas Resour. 2016, 14, 86–98. [Google Scholar] [CrossRef]
  19. Sun, X.; Mohanty, K.K. Kinetic simulation of methane hydrate formation and dissociation in porous media. Chem. Eng. Sci. 2006, 61, 3476–3495. [Google Scholar] [CrossRef]
  20. Kotkoskie, A.U.; Al-ubaidi, B.; Wildeman, T.R.; Sloan, E.D. Inhibition of gas hydrates in water-based drilling mud. SPE Drill. Eng. 1992, 7, 130–136. [Google Scholar] [CrossRef]
  21. Sun, B.J.; Liu, X.L.; Ren, S.R. Experiment on inhibiting of drilling fluid additives for natural gas hydrate formation. J. China Univ. Pet. 2008, 32, 56–59. [Google Scholar]
  22. Fan, Z.X.; Dong, L.S.; Dong, X.J.; He, Y.H.; Wang, T.F. Effect of chemical additives used in drilling fluid on hydrate formation. J. Fuel Chem. Technol. 2010, 38, 190–194. [Google Scholar]
  23. Liu, X.L.; Li, Z.H.; Zheng, Y.; Li, R.Q. Gas hydrate inhibition of drilling fluid additives. In Proceedings of the 7th International Conference on Gas Hydrates, Edinburgh, UK, 17–21 July 2011. [Google Scholar]
  24. Ishmuratov, F.G.; Rakhimova, N.T.; Ishmiyarov, E.R.; Voloshin, A.I.; Gusakov, V.N.; Tomilov, Y.V.; Nifant’yev, N.E.; Dokichev, V.A. New “Green” polysaccharidal inhibitor of gas hydrate formation on the basis of carboxymethylcellulose sodium salt. Russ. J. Appl. Chem. 2018, 91, 653–656. [Google Scholar] [CrossRef]
  25. Hu, Y.L.; Yue, Q.S.; Liu, S.J.; Fu, Z.J.; Liang, S. Research on deepwater synthetic drilling fluid and its low temperature rheological properties. Pet. Sci. 2011, 8, 485–489. [Google Scholar] [CrossRef] [Green Version]
  26. Caenn, R.; Chikkingar, G.V. Drilling fluids: State of the art. J. Petrol. Sci. Eng. 1996, 14, 221–230. [Google Scholar] [CrossRef]
  27. Sloan, E.D.; Koh, C.A. Clathrate Hydrates of Natural Gases, 3rd ed.; CRC Press: Boca Raton, FL, USA, 2007. [Google Scholar]
  28. Li, G.; Moridis, G.J.; Zhang, K.N.; Li, X.S. The use of huff and puff method in a single horizontal well in gas production from marine gas hydrate deposits in the Shenhu Area of South China Sea. J. Petrol. Sci. Eng. 2011, 77, 49–68. [Google Scholar] [CrossRef]
  29. Wang, R.; Liu, T.L.; Ning, F.L.; Ou, W.J.; Zheng, L.; Wang, Z.; Peng, L.; Sun, J.X.; Liu, Z.C.; Li, T.S.; et al. Effect of hydrophilic silica nanoparticles on hydrate formation: Insight from the experimental study. J. Energy Chem. 2018, 30, 90–100. [Google Scholar] [CrossRef] [Green Version]
  30. Farhang, F.; Nguyen, A.V.; Sewell, K.B. Fundamental investigation of the effects of hydrophobic fumed silica on the formation of carbon dioxide gas hydrates. Energy Fuels 2014, 28, 7025–7037. [Google Scholar] [CrossRef]
  31. Skovborg, P.; Ng, H.J. Measurement of induction times for the formation of methane and ethane gas hydrates. Chem. Eng. Sci. 1993, 48, 445–453. [Google Scholar] [CrossRef]
  32. Farhang, F.; Nguyen, A.V.; Hampton, M.A. Influence of sodium halides on the kinetics of CO2 hydrate formation. Energy Fuels 2014, 28, 1220–1229. [Google Scholar] [CrossRef]
  33. Ahmed, T.H. Hydrocarbon Phase Behavior; Guif Publishing Company: Houston, TX, USA, 1989. [Google Scholar]
  34. Wang, R.; Sun, H.C.; Xu, X.G.; Zhang, J.; Wang, J.H.; Yang, Z.; Zhang, Z.L.; Lai, X.Q.; Liu, T.L.; Jiang, G.S. Study of the mechanism of hydrate formation promoted by hydrophobic nano-SiO2. Energy Sources Part A 2018, 40, 2257–2264. [Google Scholar] [CrossRef]
  35. Wang, R.; Sun, H.C.; Sun, J.S.; Qu, Y.Z.; Zhang, J.; Shi, X.M.; Zhang, L.; Guo, D.D. Effect of dissolution and dispersion conditions of VC-713 on the hydrate inhibition. J. Chem. 2019. [Google Scholar] [CrossRef]
  36. Jiang, G.S.; Ning, F.L.; Zhang, L.; Tu, Y.Z. Effect of agents on hydrate formation and low-temperature rheology of polyalcohol drilling fluid. J. Earth Sci. 2011, 22, 652–657. [Google Scholar] [CrossRef]
  37. Furushima, Y.; Ishikiriyama, K.; Ueno, Y.; Sugayab, H. Analysis of the state of water in polyvinylpyrrolidone aqueous solutions using DSC method. Thermochim. Acta 2012, 538, 43–47. [Google Scholar] [CrossRef]
  38. Bai, D.S.; Chen, G.J.; Zhang, X.R.; Sum, A.K.; Wang, W.C. How properties of solid surfaces modulate the nucleation of gas hydrate. Sci. Rep. 2015, 5, 12747. [Google Scholar] [CrossRef]
  39. Li, H.J.; Stanwix, P.; Aman, Z.; Johns, M.; May, E.; Wang, L.G. Raman spectroscopic studies of clathrate hydrate formation in the presence of hydrophobized particles. J. Phys. Chem. A 2016, 120, 417–424. [Google Scholar] [CrossRef]
  40. Lederhos, J.P.; Long, J.P.; Sum, A.; Christiansen, R.L.; Sloan, E.D. Effective kinetic inhibitors for natural gas hydrates. Chem. Eng. Sci. 1996, 51, 1221–1229. [Google Scholar] [CrossRef]
  41. Kang, S.P.; Shin, J.Y.; Lim, J.S.; Lee, S.Y. Experimental measurement of the induction time of natural gas hydrate and its prediction with polymeric kinetic inhibitor. Chem. Eng. Sci. 2014, 116, 817–823. [Google Scholar] [CrossRef]
  42. Sheng, Y.J.; Lu, S.X.; Xu, M.J.; Wu, X.J.; Li, C.H. Effect of Xanthan gum on the performance of aqueous film-forming foam. J. Disper. Sci. Technol. 2016, 37, 1664–1670. [Google Scholar] [CrossRef]
  43. Wang, R.; Ning, F.L.; Liu, T.L.; Zhang, L.; Sun, H.C.; Peng, L.; Guo, D.D.; Jiang, G.S. Dynamic simulation of hydrate formed from free methane gas in borehole. Acta Petrol. Sin. 2017, 38, 963–972. [Google Scholar]
  44. Tan, G.X.; Cui, Y.D.; Yi, G.B.; Zhou, J.H. Influence of different states of water in hydrogels on tensile properties. J. Chem. Ind. Eng. 2005, 56, 2019–2023. [Google Scholar]
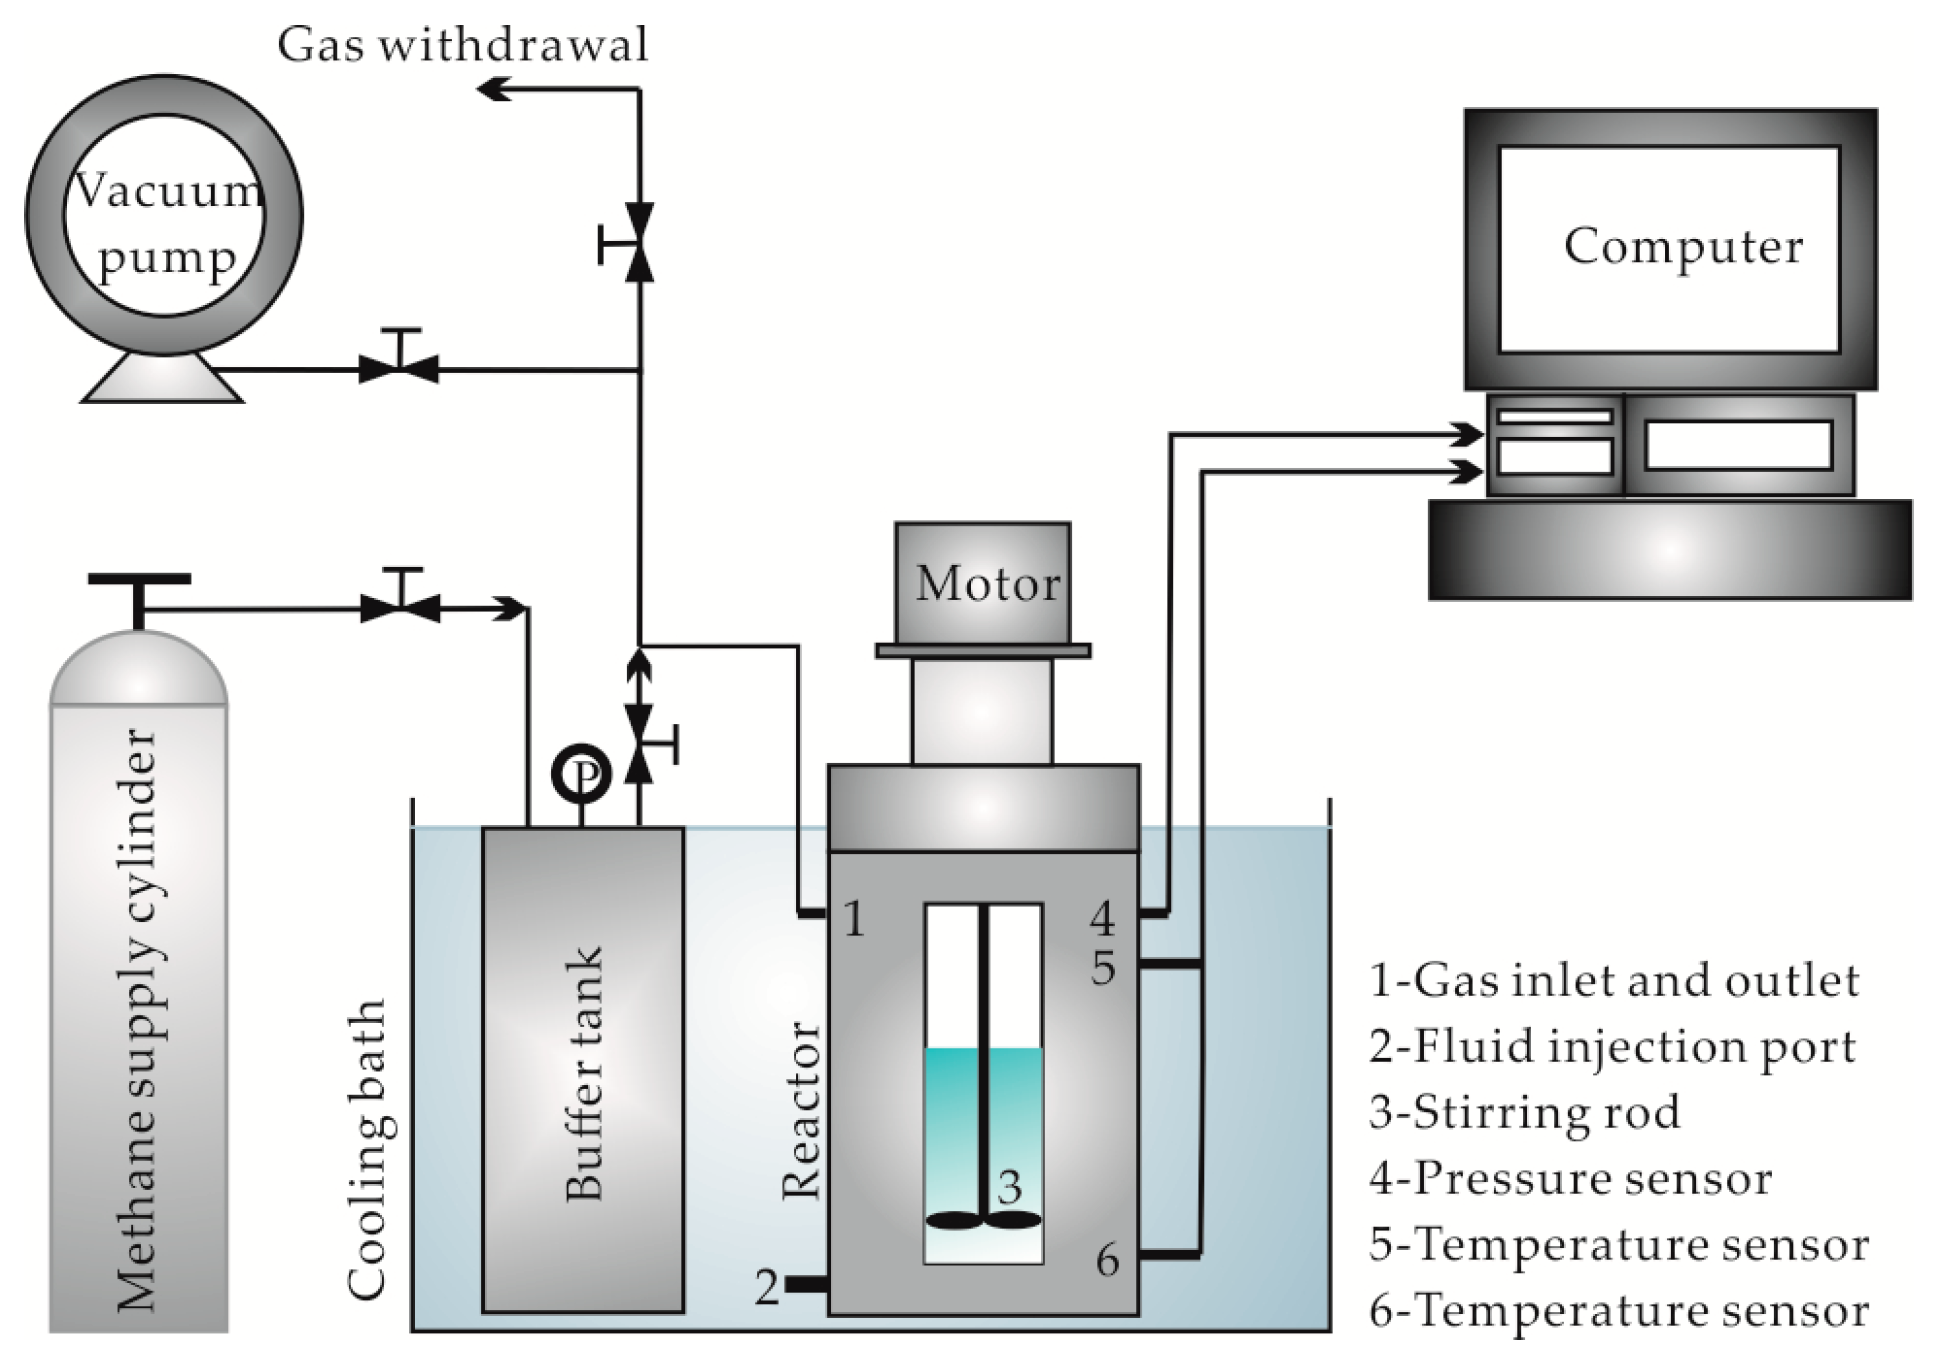
Figure 1. Schematic of the experimental setup.
Energies 12 02026 g001
Figure 2. Hydrate formation (a) induction time, (b) amount, and (c) rate as a function of the concentrations of thickeners in solution when the driving force is weak. MS: modified starch, CMC: carboxymethylcellulose sodium, XG: xanthan gum.
Energies 12 02026 g002
Figure 3. Hydrate formation rate changes with the concentrations of solution when the driving force is strong. MS: modified starch, CMC: carboxymethylcellulose sodium, XG: xanthan gum.
Energies 12 02026 g003
Figure 4. Mesostructures of 0.3 wt% (ad) modified starch (MS), (eh) carboxymethylcellulose sodium (CMC), and (il) xantham gum (XG) solutions.
Energies 12 02026 g004
Figure 5. Water activity of each solution. MS: modified starch, CMC: carboxymethylcellulose sodium, XG: xanthan gum.
Energies 12 02026 g005
Figure 6. Retention of bubbles after solution transfer in each experiment. MS: modified starch, CMC: carboxymethylcellulose sodium, XG: xanthan gum.
Energies 12 02026 g006
Table 1. Apparent and plastic viscosities of solutions under different temperatures.
Kind of ThickenerConcentration (wt%)Apparent Viscosity (mPa·s)Plastic Viscosity (mPa·s)
5 °C10 °C15 °C20 °C5 °C10 °C15 °C20 °C
MS0.12.001.751.601.501.901.801.701.60
0.22.502.252.051.952.402.302.202.10
0.32.852.502.152.052.802.602.302.20
0.43.453.052.802.453.703.203.002.60
0.54.003.503.302.954.103.803.503.10
CMC0.17.456.806.105.705.905.505.104.80
0.214.6513.5512.3511.2010.8010.209.608.60
0.319.1517.6516.2514.9513.5012.8012.1011.40
0.423.5522.0520.2518.3516.2016.0014.9013.80
0.531.8029.2527.1524.9020.9020.0018.9018.00
XG0.16.456.005.505.204.404.103.903.40
0.210.009.308.608.155.304.304.003.70
0.312.0511.3010.609.956.005.505.104.80
0.414.4013.6013.0012.157.106.405.805.40
0.516.7015.8015.0014.308.407.807.306.90
Note: MS: modified starch, CMC: carboxymethylcellulose sodium, XG: xanthan gum.