1. Introduction
This paper examines the reported emissions of sulphur hexafluoride (SF
6) from the power industry in Scotland, Wales, and England. In recent years, it had been concluded that SF
6 is an extremely potent global warming gas and can have a significant impact on global warming if released into the environment. Previously, it was determined that SF
6 has a global warming potential (GWP) of 22,800 times that of carbon dioxide (CO
2) over a 100 year period, as used in EU and UK regulations [
1,
2,
3]. However, more recent estimates put the GWP of SF
6 at 23,500 times that of CO
2 [
4]. SF
6 has an extremely long atmospheric lifetime of 3200 years [
4] during which infrared radiation is reflected back towards earth when left in the atmosphere. The use of SF
6 has been banned from applications where a suitable alternative can be provided and is classified as a regulated fluorinated greenhouse gas by both the EU and the UK [
2,
3]. SF
6 is also listed in the United Nation’s Kyoto [
5] and Paris agreements [
6] as a gas deemed to have a high global warming impact and emissions, and, therefore, should be reduced.
SF
6 exhibits extremely useful insulation characteristics that allow for its use in distribution and transmission equipment in the power network. It exhibits an insulation capability approximately three times that of air [
7] and, therefore, it allows for compact gas-insulated switchgear (GIS) and gas-insulated lines (GIL) to be adopted. These are much smaller in size than air-insulated equipment [
7]. SF
6 equipment has a high safety service record when operating under high voltage stresses compared to oil- and air-insulated equipment [
8] due to the use of leak detection equipment and its particular use at the medium voltage distribution level and above where the gas can be both indoors or outside. However, due to recent concerns over the environmental impact of SF
6, distribution and transmission network operators have implemented schemes to reduce the impact of SF
6 equipment by reducing the release of SF
6 into the environment [
9,
10,
11,
12,
13,
14]. Stringent regulations, which require the reporting of leaks whenever they occur, have also been implemented in recent years as a result of the known impact of the global warming potential of SF
6 [
2,
3,
5,
6]. Manufacturers of SF
6 equipment play a key role in improving equipment gas seals and providing gas density sensors that allow for the constant monitoring of gas equipment on the power network. In recent years, it has become apparent that a new alternative, environmentally-friendly, gas is needed to replace SF
6 entirely because of its inherent global warming potential. However, this has not been an easy task and, in the market at present, there is no alternative to SF
6 that could directly replace it while fulfilling all its dielectric and interruption properties. Mixtures of SF
6/N
2 have also been proposed for insulation purposes only, however, SF
6 is still a component meaning there is still an environmental impact and this mixture cannot carry out the high voltage interruption performance expected of pure SF
6. Therefore, a large amount of distribution and transmission equipment still exists in the network today with a constant annual leakage rate that varies depending on the age and degradation of the equipment in use. It is of timely importance that how much SF
6 is in use in the distribution and transmission networks, the amount of SF
6 that leaks each year, and the potential impact this gas can contribute to global warming both now and in the future be evaluated.
2. SF6 Emissions and Calculated Equivalent CO2 Emissions
The data used in this paper is taken directly from reported emissions from distribution and transmission network operators. SF
6 can be released into the atmosphere by accidental leakage due to faults and/or equipment degradation, which causes loss of gas from seals or sudden decompression [
15]. SF
6 leakage may also occur during normal operation due to vibrations and handling operations as equipment is decommissioned or maintenance is undertaken. The data used in this paper is often captured through SF
6 maintenance top-ups which allows the operator to determine how much gas is needed to top-up a piece of equipment to its normal operating pressure and, therefore, how much gas has been lost [
16]. Therefore, depending on the amount of maintenance required, the amount of SF
6 emissions may vary.
The equivalent CO
2 emissions in tonnes (tCO
2e) can be directly converted from the SF
6 emissions in kg by using the following equation [
3]:
This equation uses the quantity of SF
6 in kg divided by 1000 to convert this number to tonnes, multiplied by the global warming potential (GWP) of SF
6. The GWP scale factor used in this paper is 1 kg of SF
6 being equivalent to 22,800 kg of CO
2, as provided by the UK government, Department for Environment, Food and Rural Affairs (DEFRA) [
3] and the European Union [
2]. Over the reported years 2010–2014, a scale factor of 1 kg of SF
6 to 23,900 kg of CO
2 was previously used. However, this was changed in recent years to 22,800 [
1]. The most recent reports suggest this equivalent ratio could actually be 23,500 [
4]. In this paper, all data has been re-calculated for the scale factor 22,800 equivalency, even if they were originally reported using a different scale factor. Some reported emissions have discrepancies between source years. In these cases, the most up to date source has been used as some operators have re-calculated these numbers from new data. Some distribution network emissions of SF
6 were given directly as tCO
2e and have been calculated from this figure. All other equivalent CO
2 emissions in this paper have been directly calculated from SF
6 emissions (kg). The regulatory reporting year and the years shown in this paper occur between April and March of the following year rather than a complete calendar year. For example, for the year 2012–2013, the year reported is actually between April 2012 and March 2013.
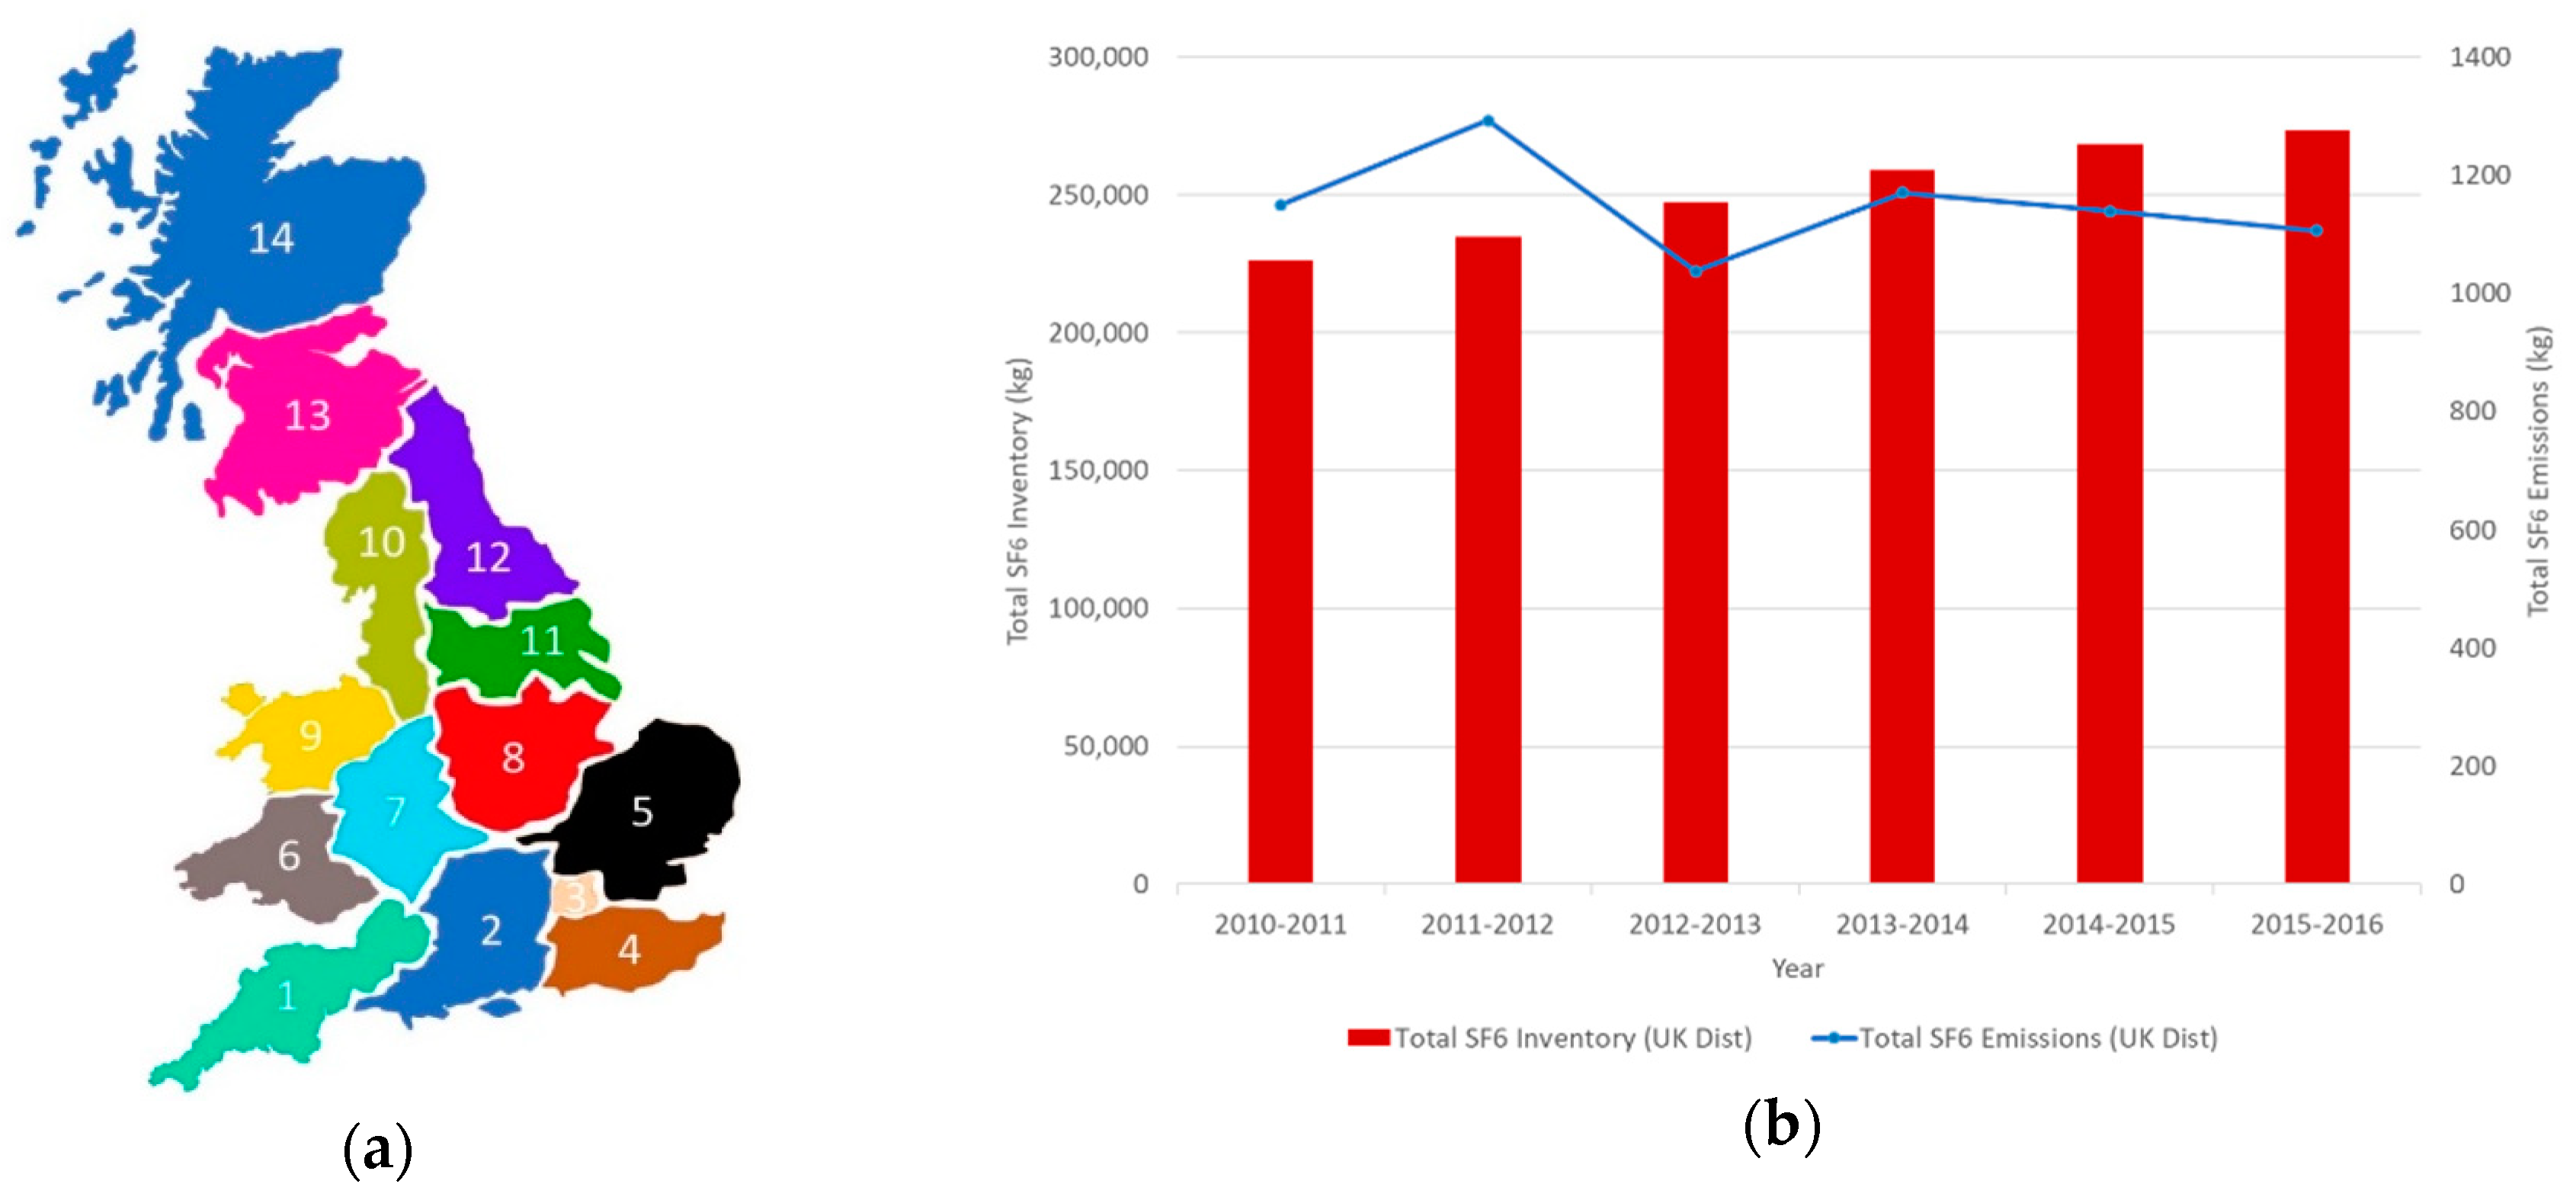
3. Reported Emissions of SF6 in Great Britain between 2010 and 2016 by Distribution Network Area
The power distribution network is divided into 14 unique areas in Scotland, England, and Wales. These areas are shown in
Figure 1a. The total amount of SF
6 reported as emissions between 2010 and 2016 are shown in
Table 1 [
15,
16,
17,
18,
19,
20,
21,
22,
23,
24,
25,
26,
27,
28,
29,
30,
31,
32,
33,
34,
35,
36,
37,
38,
39,
40,
41,
42,
43,
44,
45,
46,
47,
48]. It is important to note that emissions of SF
6 from the distribution network have fluctuated over the last six years with emissions both rising and falling over the period, as shown in
Figure 1b. For the last six years, an average SF
6 emission level of 1149 kg per year can be calculated for England, Scotland, and Wales combined.
The equivalent amount of CO
2 that would need to be released into the atmosphere to have the same global warming potential as the amount of SF
6 released is shown in
Table 2. The equivalent CO
2 emissions, shown in
Table 2, have been calculated using a scale factor of 1:22,800. The equivalent average annual CO
2 emissions that equate to 1149 kg of SF
6 is 26,197 tonnes of CO
2.
In
Table 3, the inventory of SF
6 equipment used in each distribution network area is collected and classified.
Table 3 gives an account of the scale of gas-insulated power equipment that is required to maintain a safe and reliable electricity distribution network in England, Scotland, and Wales. In the future, if an environmentally-friendly alternative insulation medium is found to replace SF
6, the gas inventory shown in
Table 3 will need to be replaced with the new alternative gas. From
Figure 1b, it can be shown that the amount of SF
6-insulated distribution equipment on the network is still increasing steadily, with an average increase of 9401 kg of SF
6 being introduced into the power distribution network every year. As the amount of SF
6 in the distribution network increases, so too does the potential environmental impact this gas could pose if released.
In
Table 4, the annual leak rate on the distribution network for each area is given. The annual leak rate is the calculated percentage of SF
6 emissions in a given area against the total inventory held in that distribution network area. These calculations shows that the actual leakage rate per year of the total inventory held is quite low, with an average annual leak rate of 0.46% of the total SF
6 inventory. This is possibly due to the work already carried out with gas handling procedures and equipment gas seals. However, modern distribution equipment installed in the network should have a leakage rate of 0.1% for a sealed pressure system [
49]. Thus, a much higher leakage rate is actually being generated either through older equipment with poor gas seals, accidental gas leaks in gas handling operations, or equipment gas containment failure. It may also be the case that some of the older SF
6 equipment in the distribution networks are of a closed pressure system type, such as those used in single-pressure circuit breakers, which have a much higher leakage threshold of between 0.5% and 1% per year [
49].
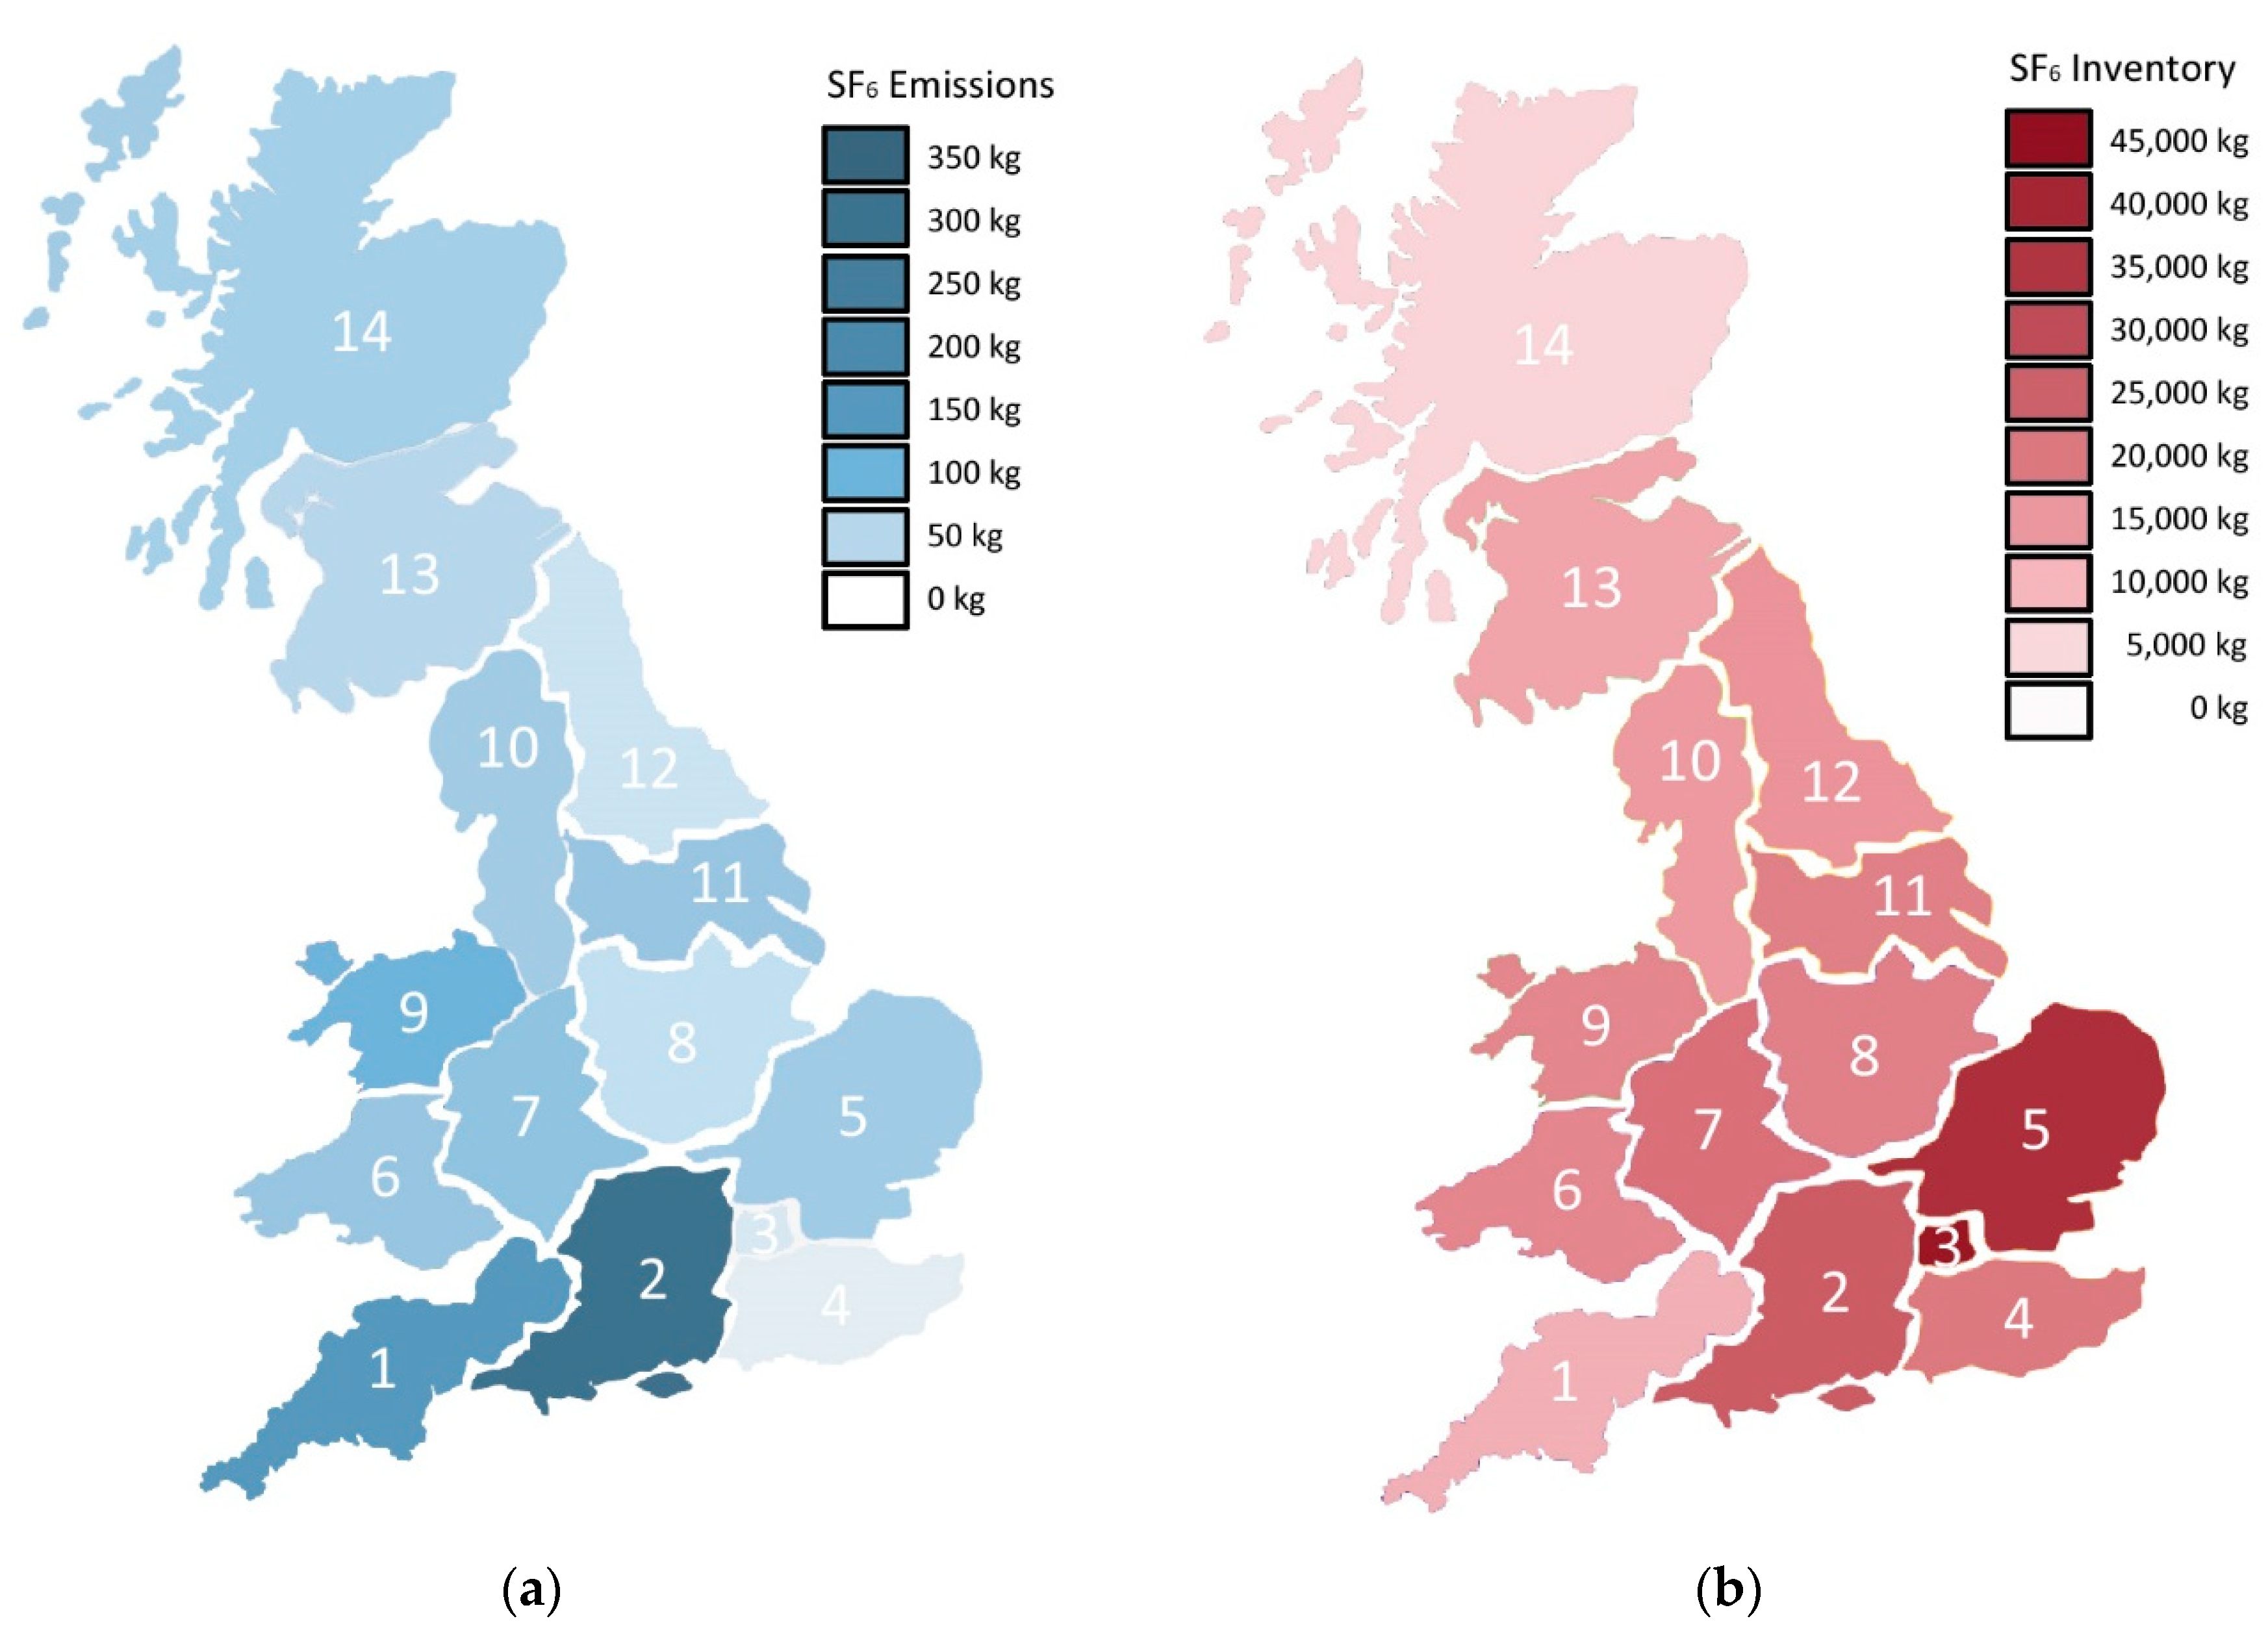
In
Table 5, the average annual SF
6 emissions have been calculated for the years 2010–2016 for all of the distribution network areas. These annual average emissions of SF
6 are shown on a map in
Figure 2a with the colour scale representing the level of SF
6 emissions. From the average emissions calculated, it can be shown that southern England and the south west of England have the largest emissions of SF
6 from the gas insulation distribution equipment installed in these areas as the electricity network in these areas is extensive.
In
Table 6, the amount of SF
6 inventory on the distribution network is shown for each distribution area for the last reported year (2015–2016). The amount of SF
6 inventory in the distribution network is also shown by location in
Figure 2b. It can be noted that the highest inventory of SF
6 equipment is in London and the lowest inventory is in North Scotland for distribution equipment. This is to be expected because SF
6 equipment is often used in dense urban areas where space availability is limited and power requirements are higher. Given that SF
6 equipment is often the most compact solution and has the smallest footprint requirement, its usage is highest in large cities, such as London. However, despite having the most SF
6 insulated distribution equipment, the average SF
6 emissions reported from the London area are small compared to other regions. It could be expected that the larger the amount of SF
6 equipment in one area, the more likely the emissions of SF
6 would be higher. However, the reported data shows that this is not always the case. For some areas, such as Southern England, the amount of SF
6 inventory is quite high and the emissions are high, but for other areas, like London, the distribution equipment SF
6 inventory is high but the emissions are low. Although it is difficult to determine trends, it is likely that either the SF
6 equipment installed in London is newer than other areas and, therefore, has improved tight gas seals or that the equipment is more likely to be indoors rather than outdoors, like some rural networks. Therefore, the equipment is much less likely to suffer degradation and accidental gas release. It may also be true that the equipment is left for longer periods of time without maintenance so no log of emissions has been taken or, perhaps, maintenance occurs more often and, therefore, accidental emissions of SF
6 are less likely.
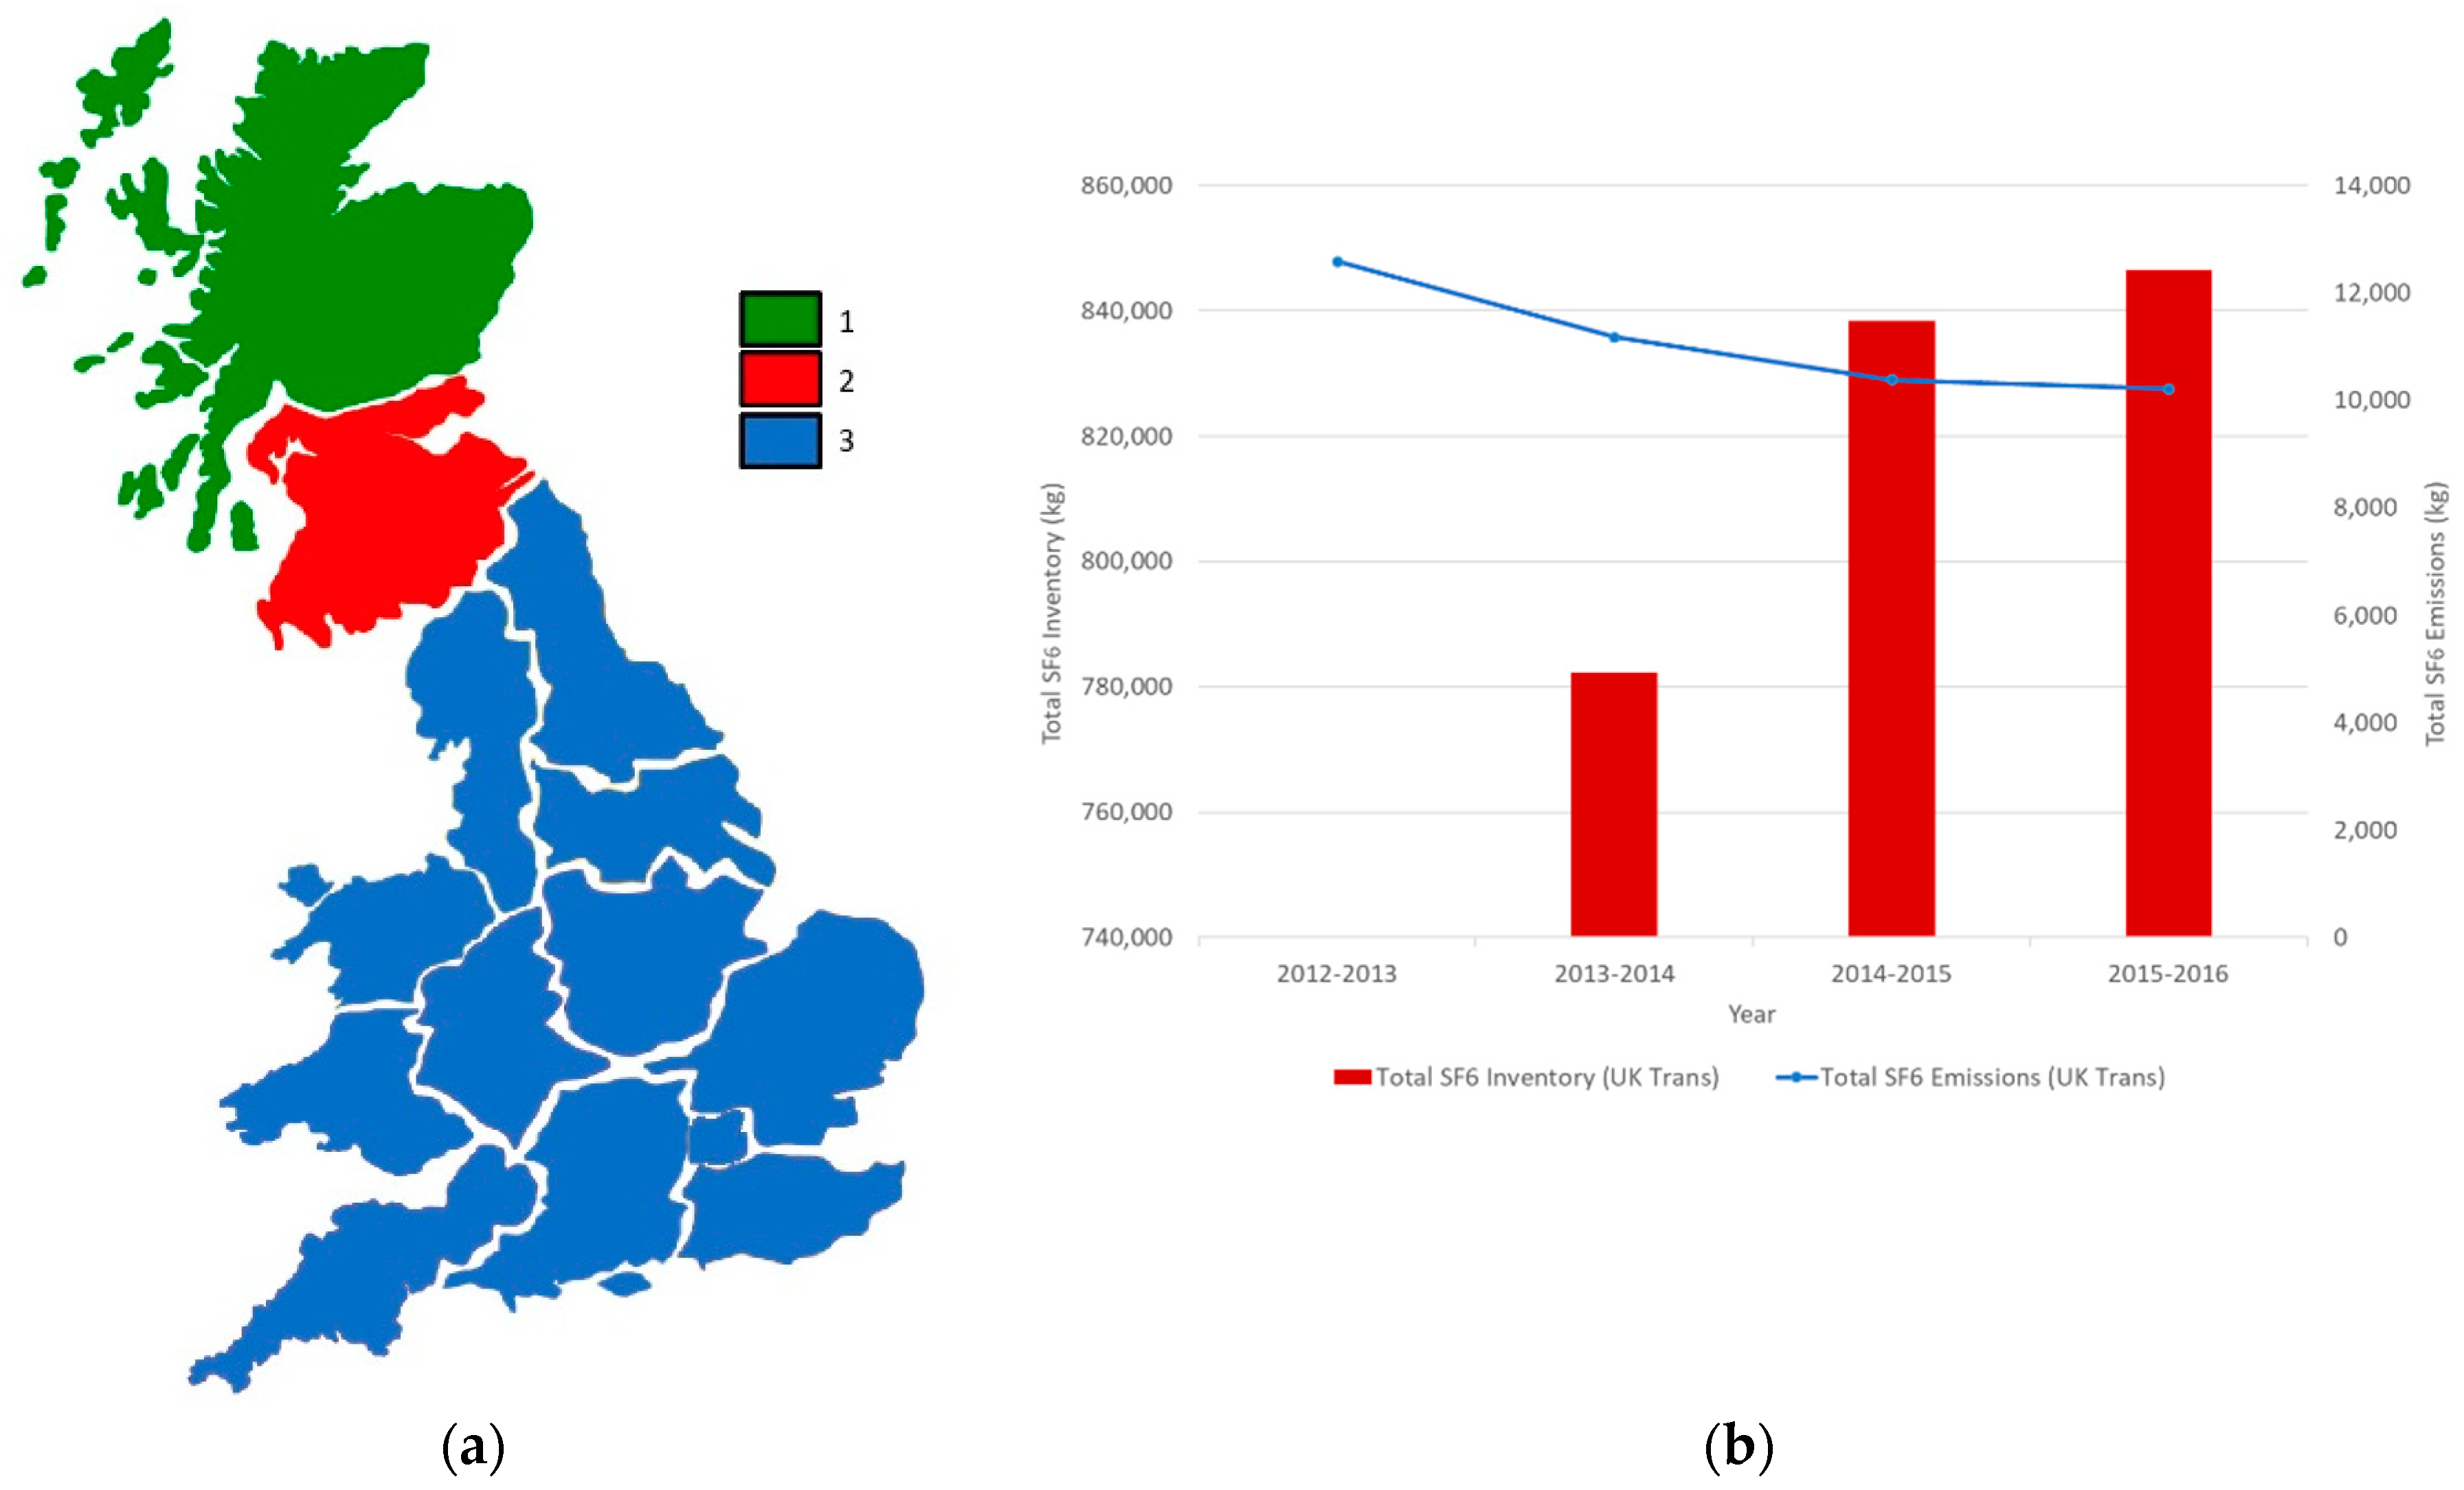
4. Reported Emissions of SF6 in Great Britain between 2010 and 2016 by Transmission Network Area
There are three transmission network operators in Scotland, England, and Wales. The network areas covered by each transmission network operator are shown in
Figure 3a.
In
Table 7, the emissions of SF
6 reported by transmission network operators are summarised for the three transmission network areas. It can be shown in
Figure 3b that, over the last four years, the total emissions of SF
6 has been slowly decreasing, which is likely to be helped by the replacement of the oldest equipment which has the worst leakage rates. New replacement equipment is likely to have improved gas seals that reduce the amount of SF
6 being released into the atmosphere and, therefore, the amount of maintenance top-ups. In some instances, transmission network operators have reported that these figures are distorted by single containment failures which have led to increased amounts of SF
6 being released into the atmosphere. One such event, which occurred in the year 2013–2014, where a rupture disc failure on a newly commissioned circuit breaker led to the release of 113 kg of SF
6 in a single event, this contributed to approximately one-third of the SF
6 released in that year in that area [
50].
In
Table 7, it can be seen that the amount of SF
6 released into the atmosphere from the transmission network in England, Scotland and Wales was 10,215 kg of SF
6 for the reported year 2015–2016. The calculated equivalent emissions of CO
2 compared to SF
6 emissions with a scale factor of 22,800 gives an equivalent 232,902 tonnes of CO
2 being released into the atmosphere, as shown in
Table 8.
The estimated inventory of SF
6 used on the transmission network for England, Scotland, and Wales is shown in
Table 9. For the year 2015–2016, the total amount of SF
6 used on the network is estimated using the previous year’s figures for map area 1, as no data was available for this year. It can be observed from
Figure 3b that the amount of SF
6 used on the transmission network has increased for the last three years. The data in
Table 9 indicates that the amount of SF
6 used on the England and Wales transmission network has increased steadily for the last five years, meaning that more equipment insulated with SF
6 must have been installed each year along with innovations in leakage mitigation.
In
Table 10, the estimated SF
6 annual leak rate of all equipment on the transmission networks in England, Scotland, and Wales is reported. The leakage rate of each area is calculated using the amount of SF
6 leaked in a particular year as a percentage of the total inventory of SF
6 used on the transmission network. It is important to note from
Table 10 that the annual average leakage rate for SF
6 equipment on the transmission network fluctuates from year to year, and this is likely to be caused by accidental leakage from single incidents or the amount of maintenance or new installations undertaken.
5. Conclusions
This paper evaluates the present inventory of SF6 that is needed to sustain the electrical distribution and transmission networks in England, Scotland, and Wales. It has also shown the present emissions of SF6 from these networks into the atmosphere, the equivalent CO2 emissions from this potent global warming gas and the leakage percentage rate at which SF6 is released from the total inventory.
This paper highlights that, over the last six years, the amount of SF6 inventory currently held by distribution network operators has increased by an average of 9401 kg per year. In the year 2015–2016, the total inventory of SF6 on the distribution network was 273,496 kg of SF6 with a leakage rate of 0.40%. This work has also shown that over the last three years, the average annual increase of SF6 used on the transmission network has increased by 32,071 kg each year. At current levels, the amount of SF6 used on the transmission network currently stands at 846,384 kg as of 2015–2016. Over the last three years, the average SF6 leak rate can be calculated as 1.29% per year.
In the year 2015–2016, the total amount of SF6 used on the electrical network is approximately 1,119,880 kg in England, Scotland and Wales. The amount of SF6 released into the atmosphere for the year 2015–2016 was approximately 11,320 kg which is the equivalent of 258,110 tonnes of CO2 being released into the environment. The environmental impact of this release of SF6 into the atmosphere from all power utilities around the world, could have serious implications for the future, considering the long atmospheric lifetime that SF6 has and its ability to contribute towards global warming if nothing is done to reduce its use. This work, therefore, highlights the need to research a new environmentally friendly alternative insulation gas to replace the highly global warming gas SF6.
At present, research is investigating the use of alternative gases such as CF
3I gas mixtures in simple geometries [
66,
67], as well as other environmentally-friendly alternatives, such as fluoronitriles, fluoroketones, and HFOs [
68], all of which have demonstrated promising results as alternatives. These gases all exhibit a lower global warming potential than SF
6, such as CF
3I, which has a GWP of less than 5 [
68,
69], compared to the most recent estimation of 23,500 for SF
6 [
4]. The environmental impact of these gases in the atmosphere is also decreased with gases, like CF
3I, exhibiting an atmospheric lifetime of less than two days [
69] compared to 3200 years for SF
6 [
1], however, there are still concerns regarding their toxicity and much research is still needed to evaluate their characteristics in full. Some of these gases are now being trialled as an alternative insulation medium in switchgear [
70,
71,
72] to replace SF
6. However, at present, the full characteristics of these new insulation gases and their practical feasibility for the long-term are still being investigated, including a 400 kV gas-insulated line (GIL) demonstrator at Cardiff University to trial new alternative environmentally-friendly gases. Industry-led projects are also readily being explored to trial alternative insulation gases to counteract this problem and demonstration sites are being setup by all distribution and transmission network operators in order to find a solution to replace SF
6. Industry-led projects are expected to produce better equipment with improved leakage mitigation to help curb the problem with all network and distribution network operators committed to reducing SF
6 losses [
10,
12,
16,
42,
45,
57,
63]. For example, a demonstration site at Sellindge substation in Kent, UK has been commissioned to install a 400 kV substation that is insulated by a new green gas for grid (g
3) as an alternative to SF
6 [
73].


