Assessment of Energetic, Economic and Environmental Performance of Ground-Coupled Heat Pumps


Abstract
1. Introduction
2. Methods
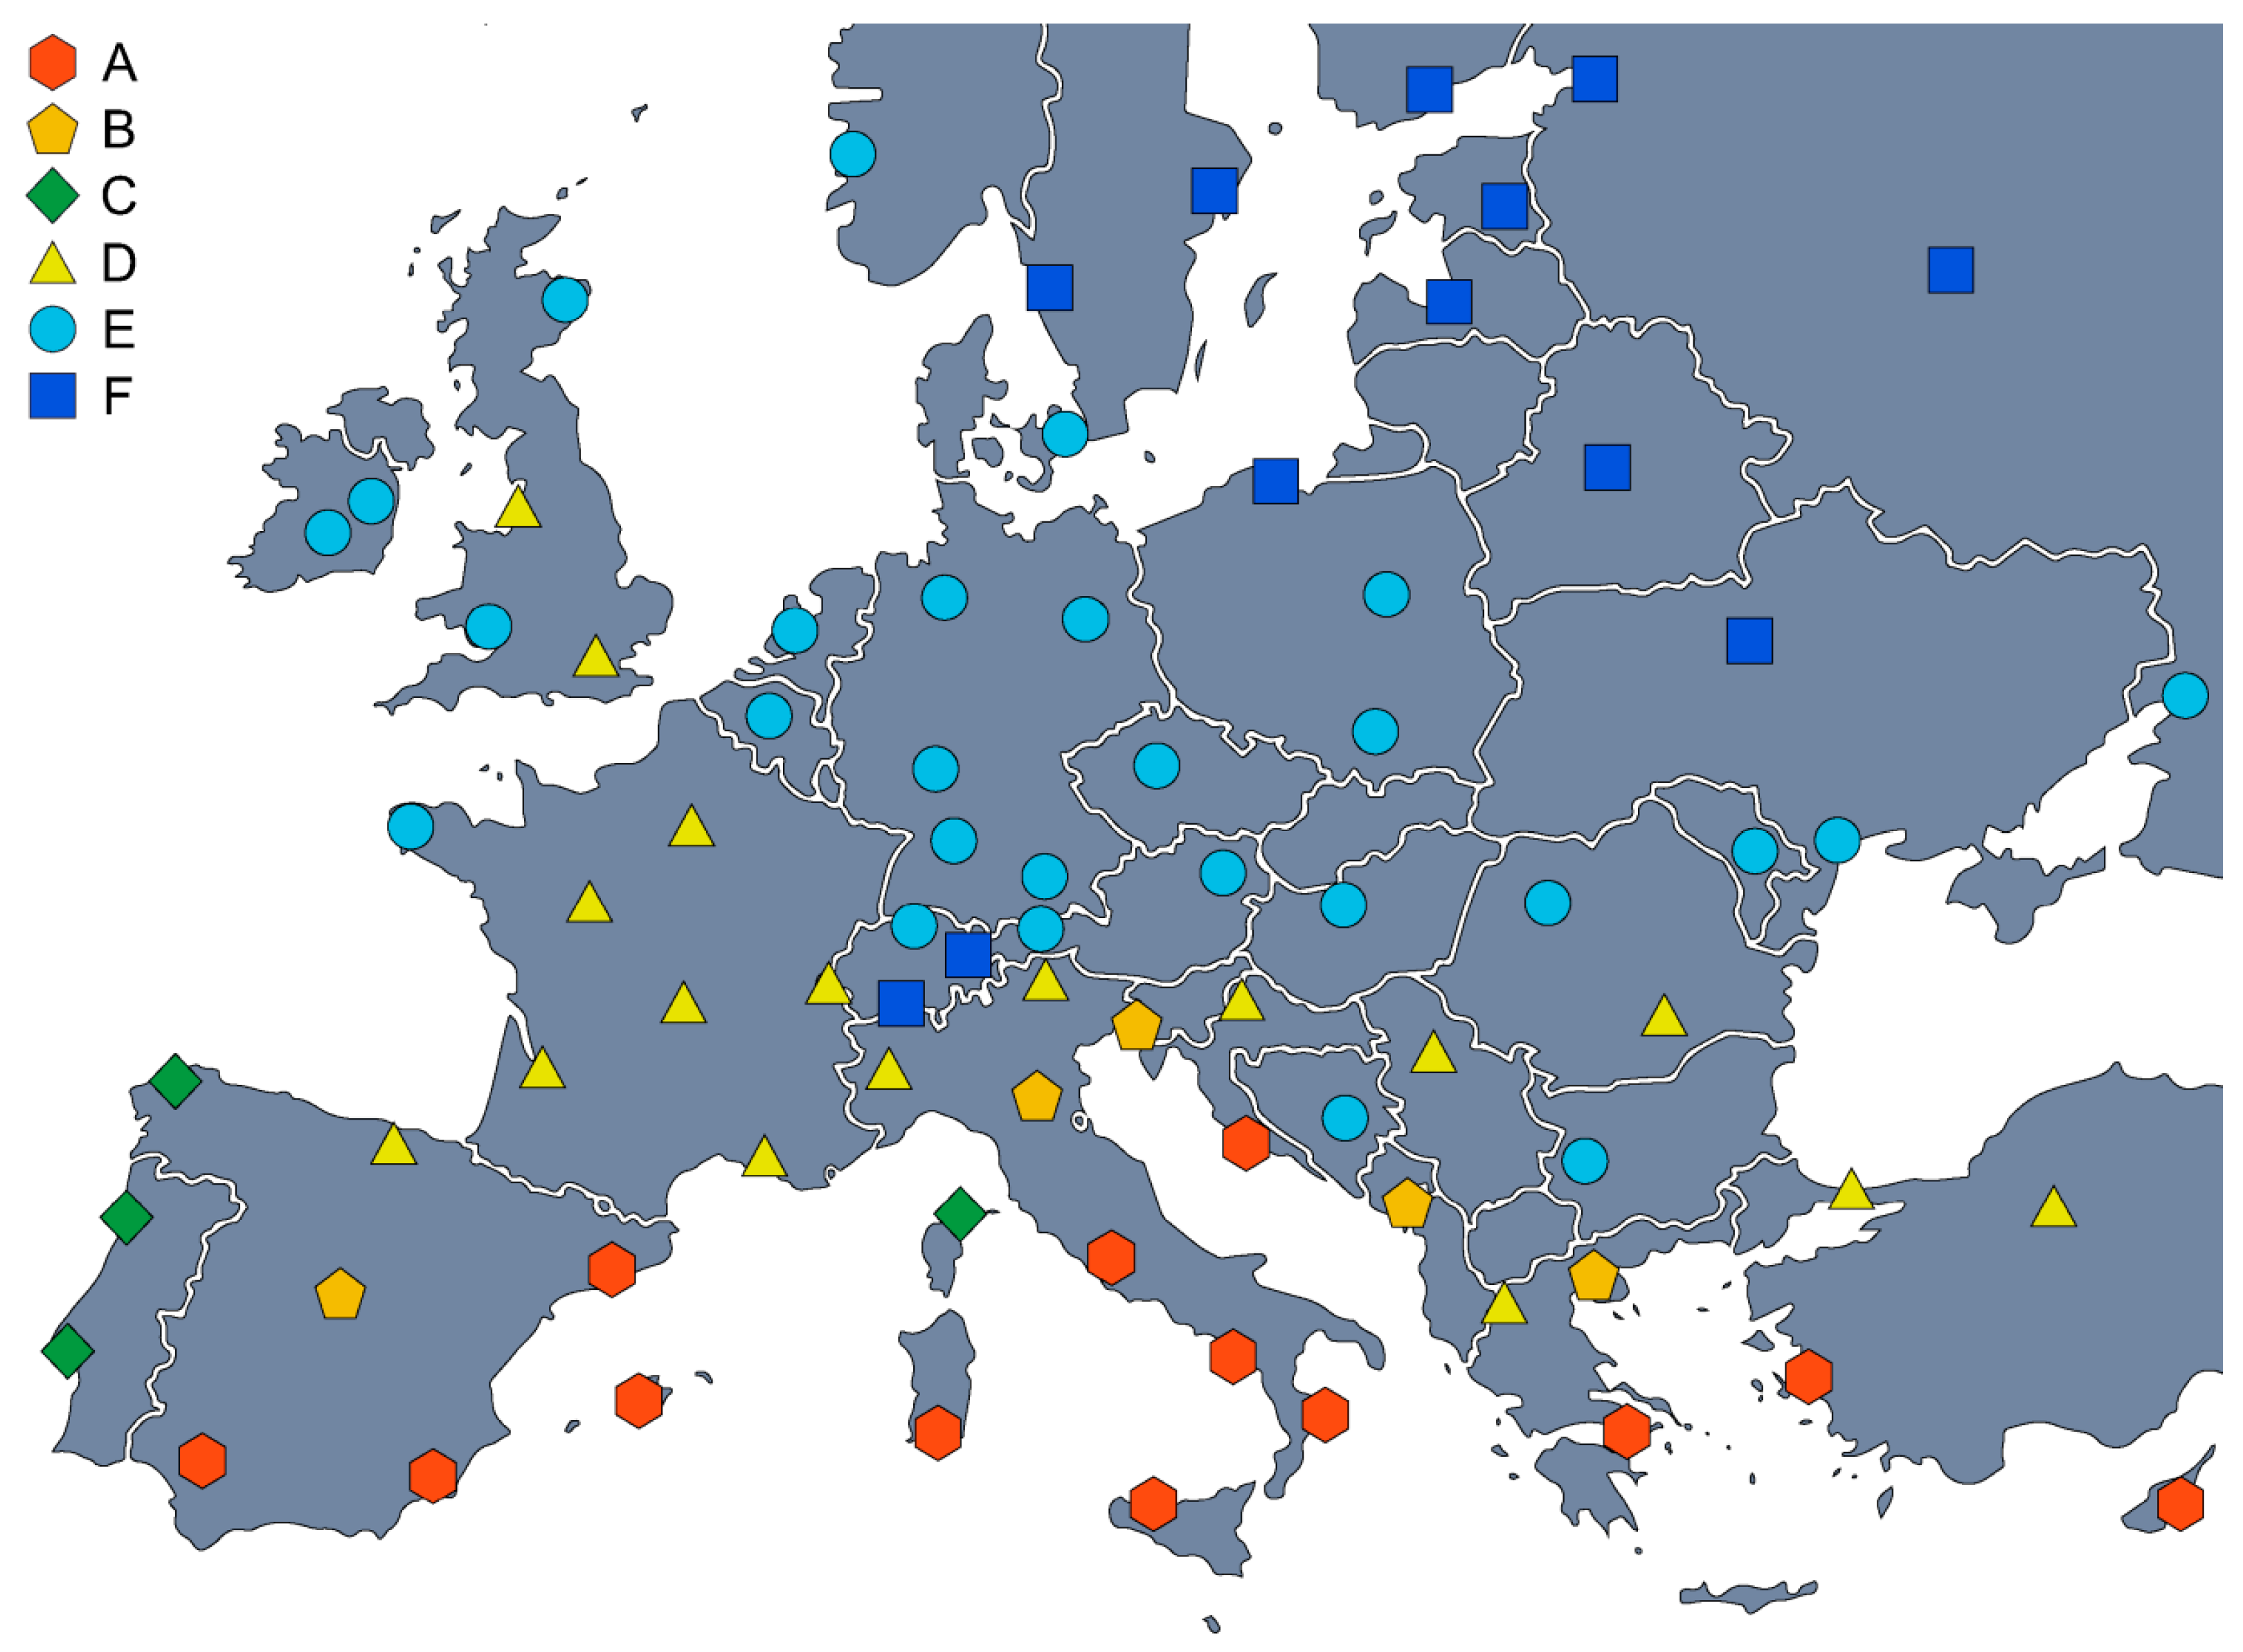
2.1. Buildings and Climatic Conditions Simulated
- -
- Three different building types, i.e., a single family detached house (House), a small two-story office building (Office) and a multi-story hotel (Hotel). Data on their size are reported in Table 1. Each building destination is characterized by a different occupancy level, air change schedule, temperature setpoint and use of the HVAC system, as described in Section 2.2.
- -
- -
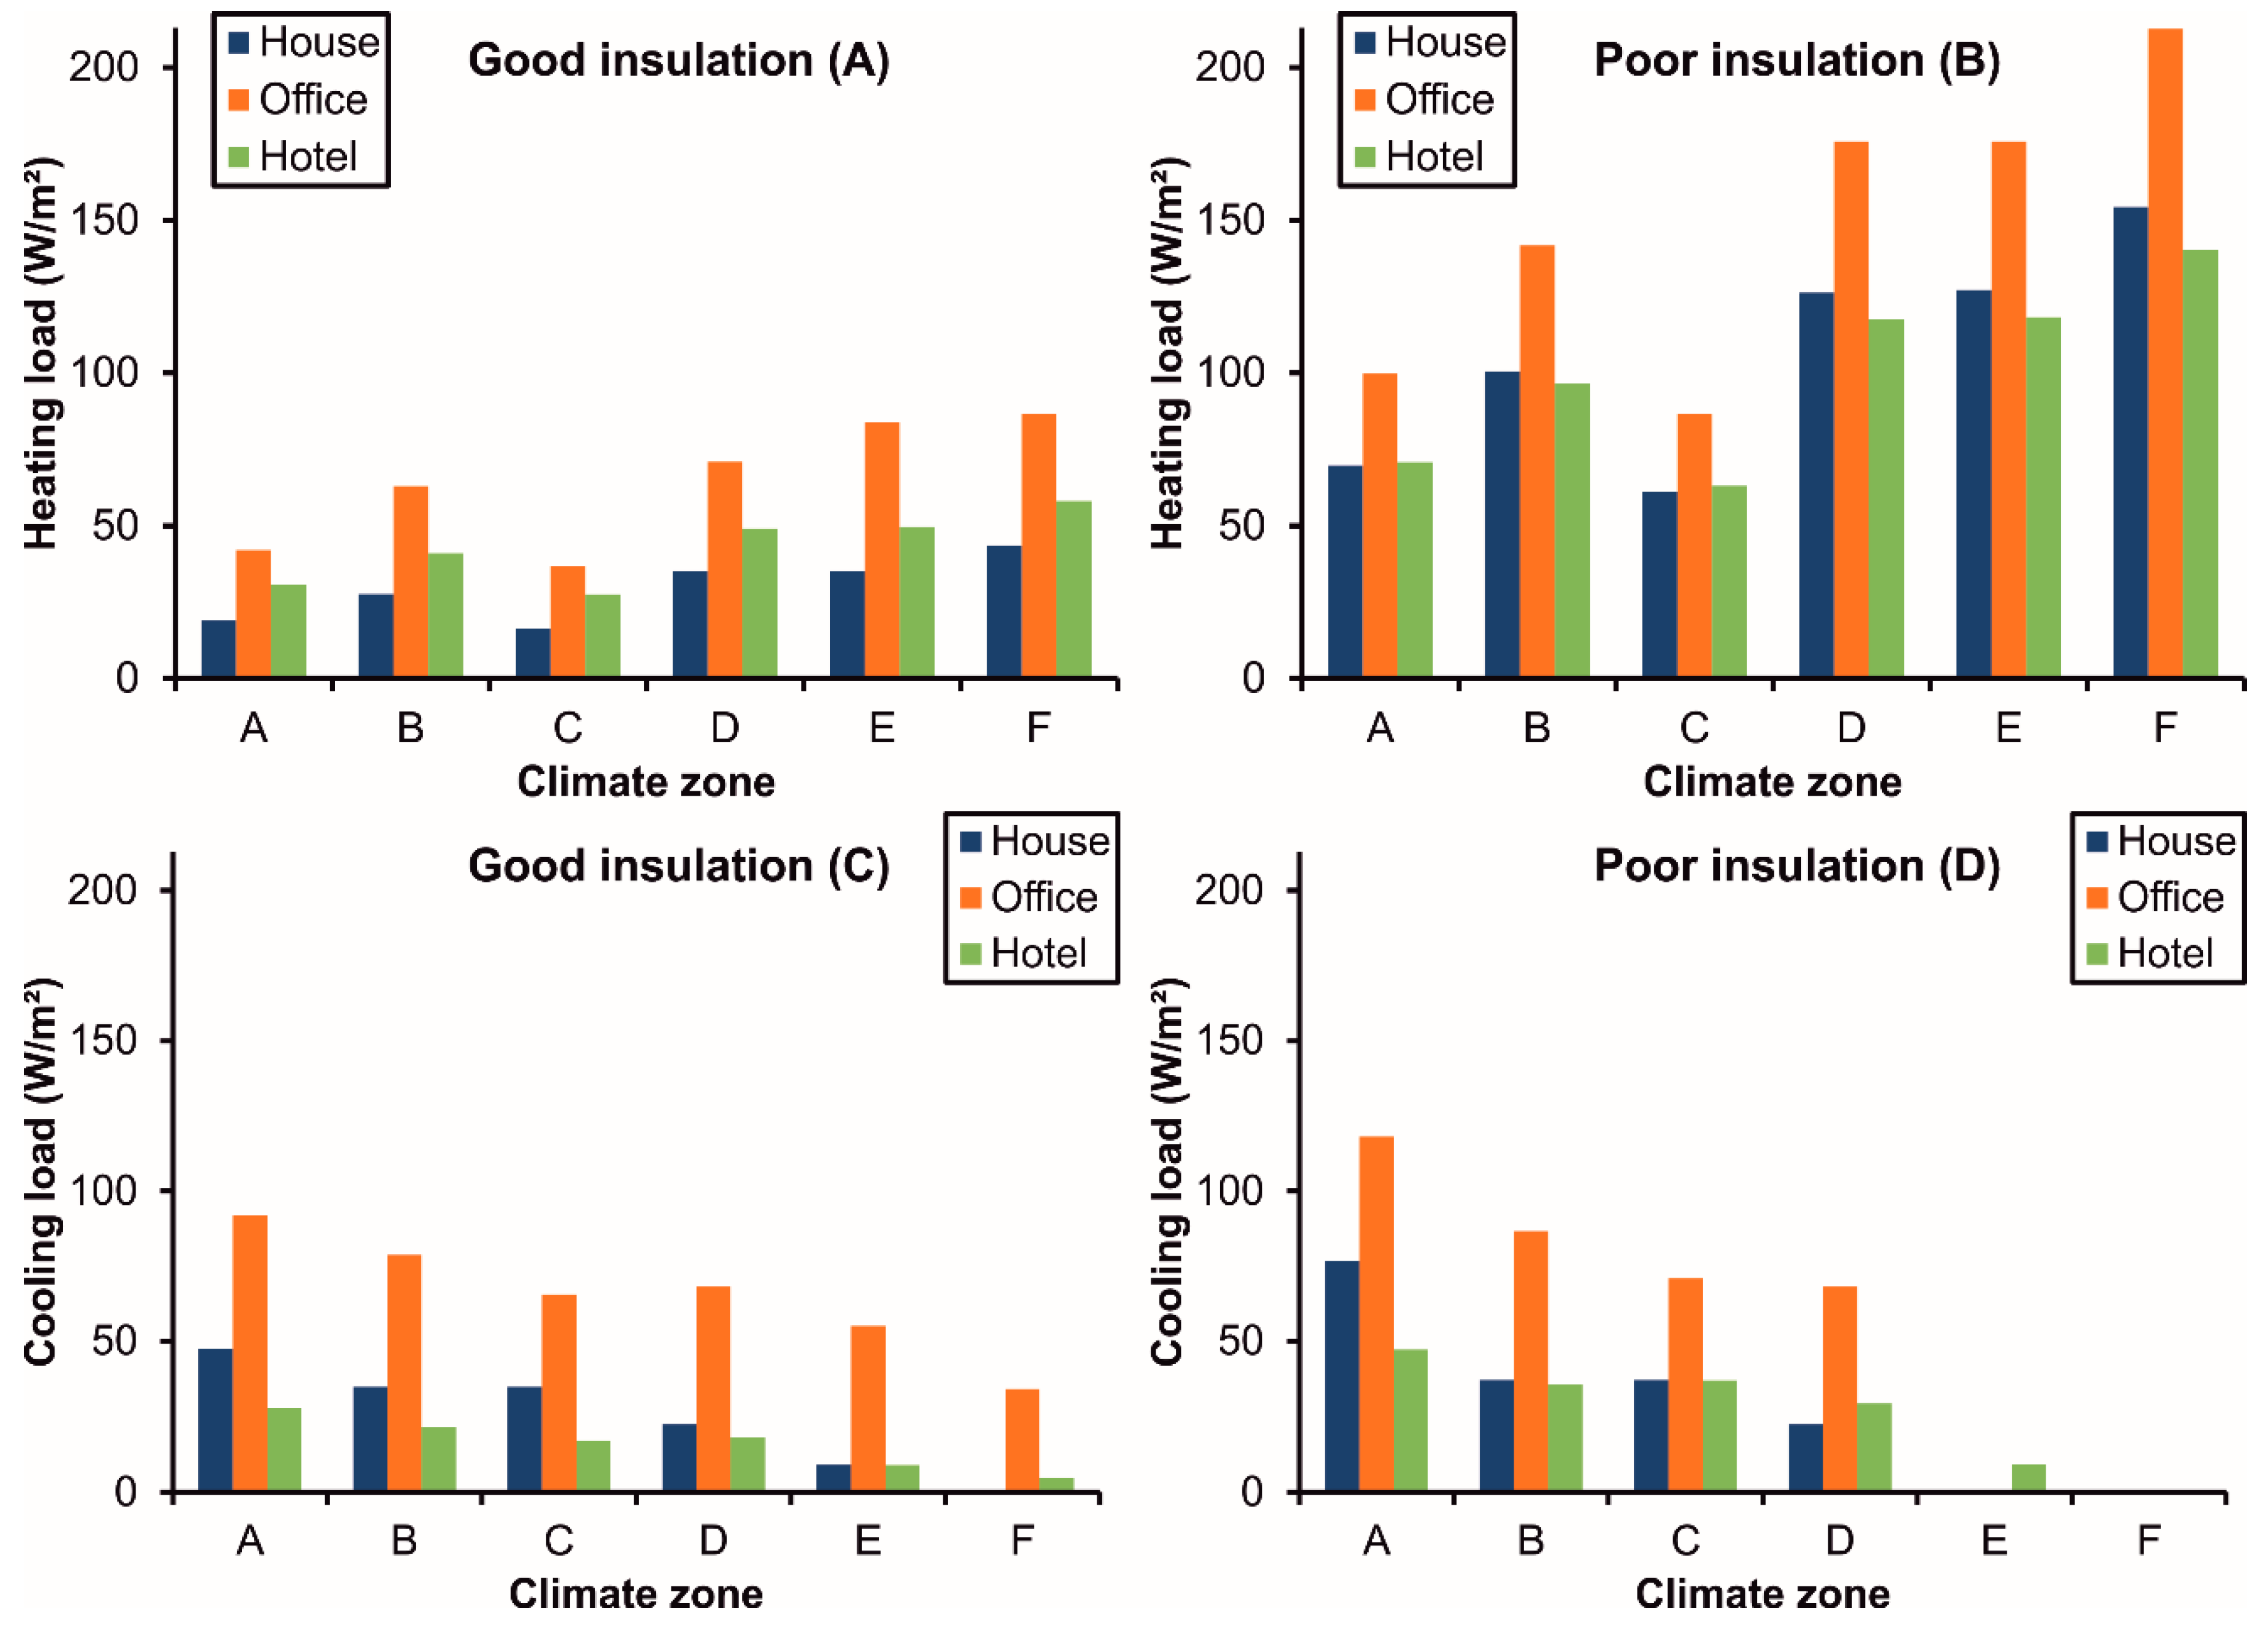
- Two thermal insulation levels: “good” insulation, in compliance with the present Italian legislation (see Ref. [34]), and “poor” insulation, representative of buildings of the 1960s using reference values from TABULA project [35]. The thermal transmittance values of building envelope are reported in Table 2 for opaque elements and in Table 3 for windows. Details on the layers constituting the opaque elements are available in the Supplementary Materials (Section 1.1, Tables S1–S8).
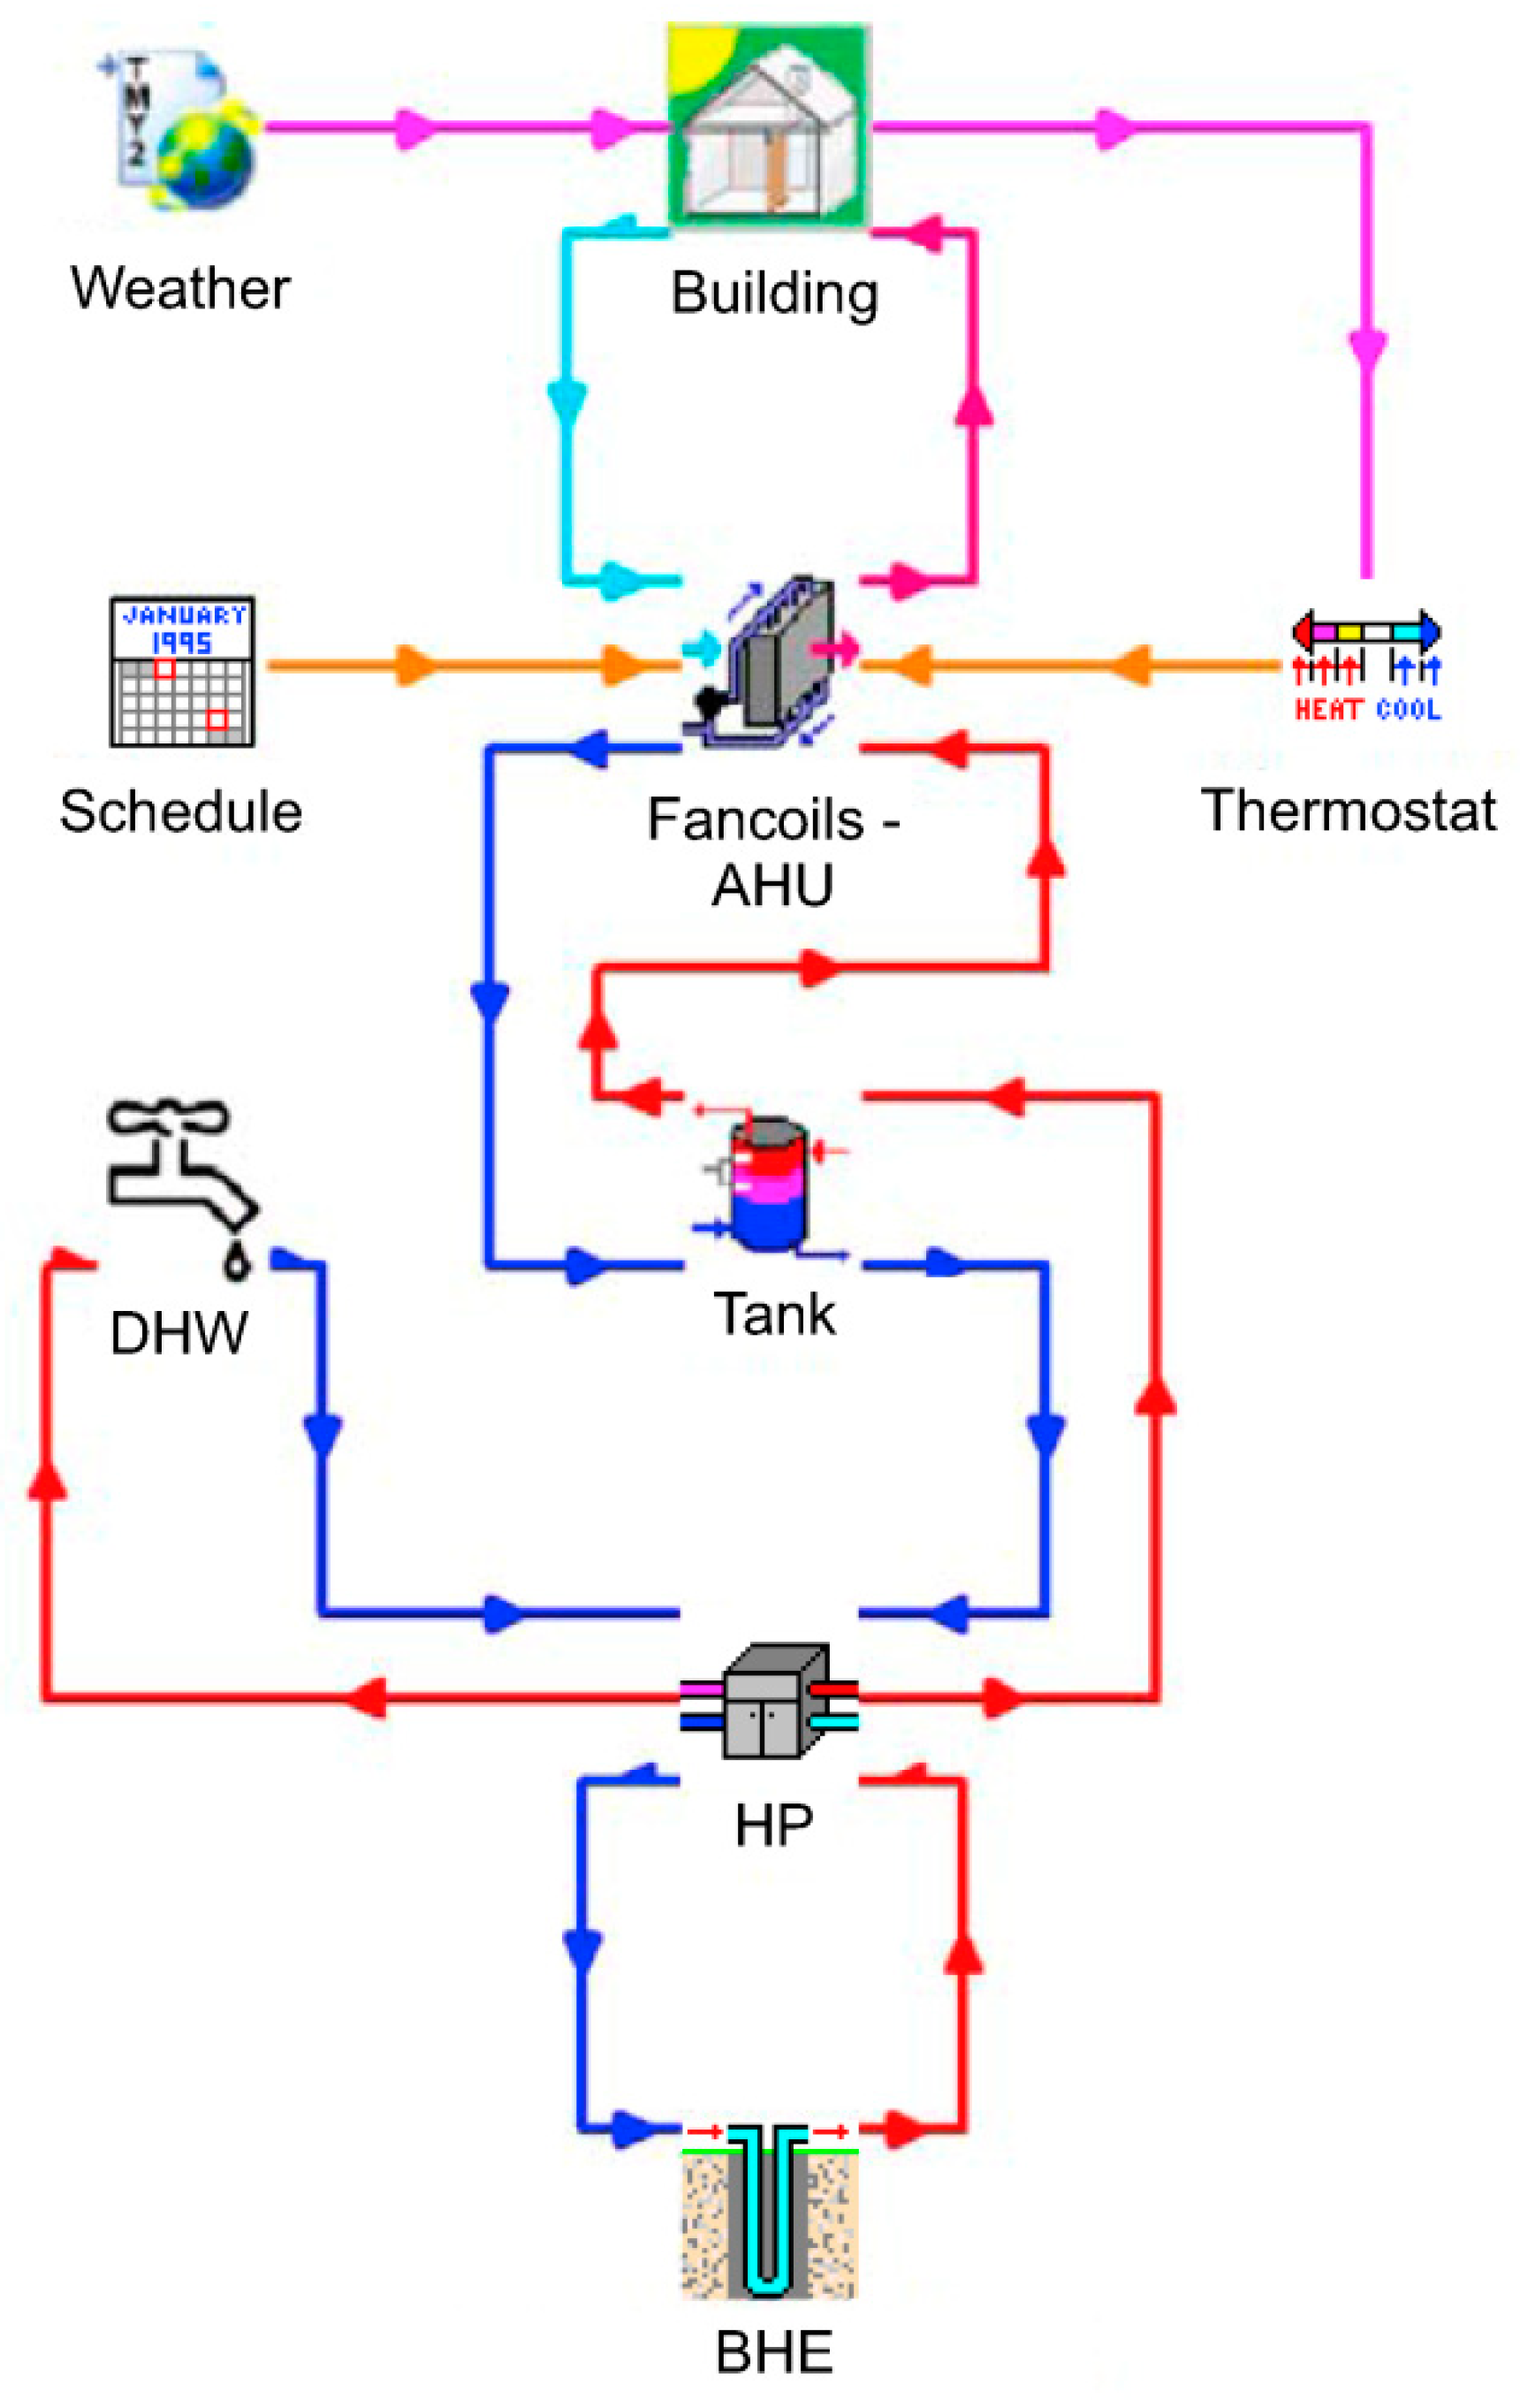
2.2. The Building-HVAC Model
2.2.1. Building
- -
- The House hosts 4 people from 4:00 p.m. to 8:00 a.m. on working days, and all day on weekends.
- -
- The Office hosts 20 people during working hours (8:00 a.m. to 4:00 p.m.).
- -
- The Hotel hosts a maximum of 28 and 112 people, respectively, during low and high season. Further details on the occupancy level of the Hotel are shown in Table S9 of the Supplementary Materials [38].
2.2.2. Thermostat and Schedules
- -
- Temperature: 20 ± 1.3 °C in winter and 26 ± 1.3 °C in summer for the House and Office buildings. The Hotel has more demanding setpoints, i.e., 22 ± 1.3 °C in summer and 25 ± 1.3 °C in winter.
- -
- Relative humidity: 50 ± 10% for all building types.
2.2.3. Distribution and Terminals
2.2.4. Buffer Tank
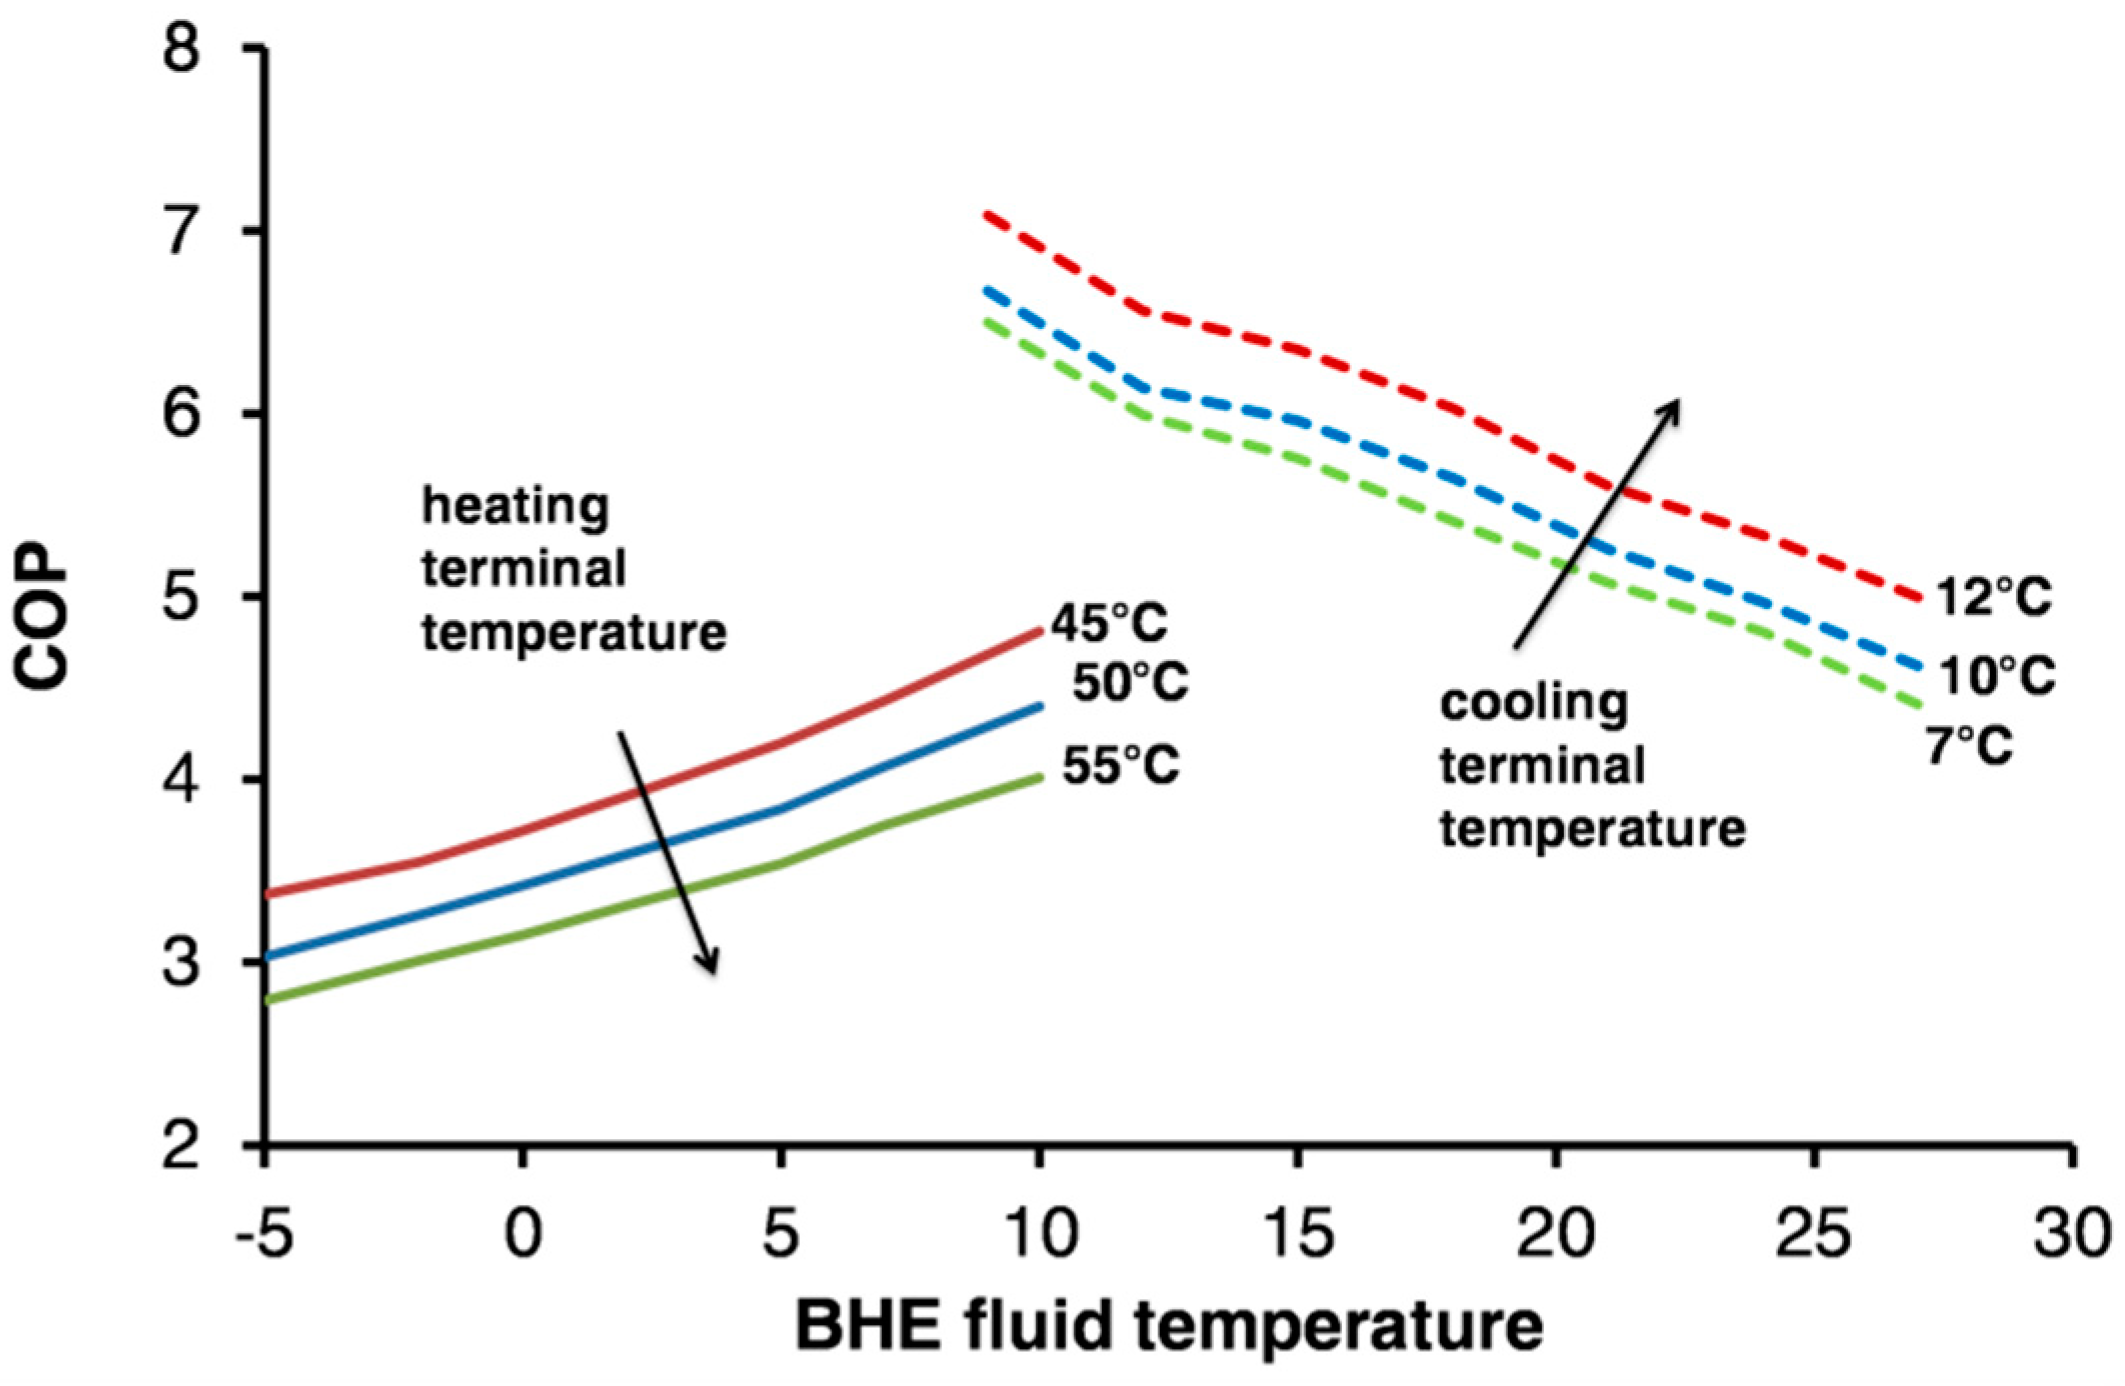
2.2.5. Heat Pump and Auxiliaries
2.2.6. Domestic Hot Water
2.2.7. Borehole Heat Exchangers
2.2.8. Backup Gas Boiler
3. Results and Discussion
3.1. Energy Consumption
3.2. Economic Performance
3.2.1. Hybrid System Results
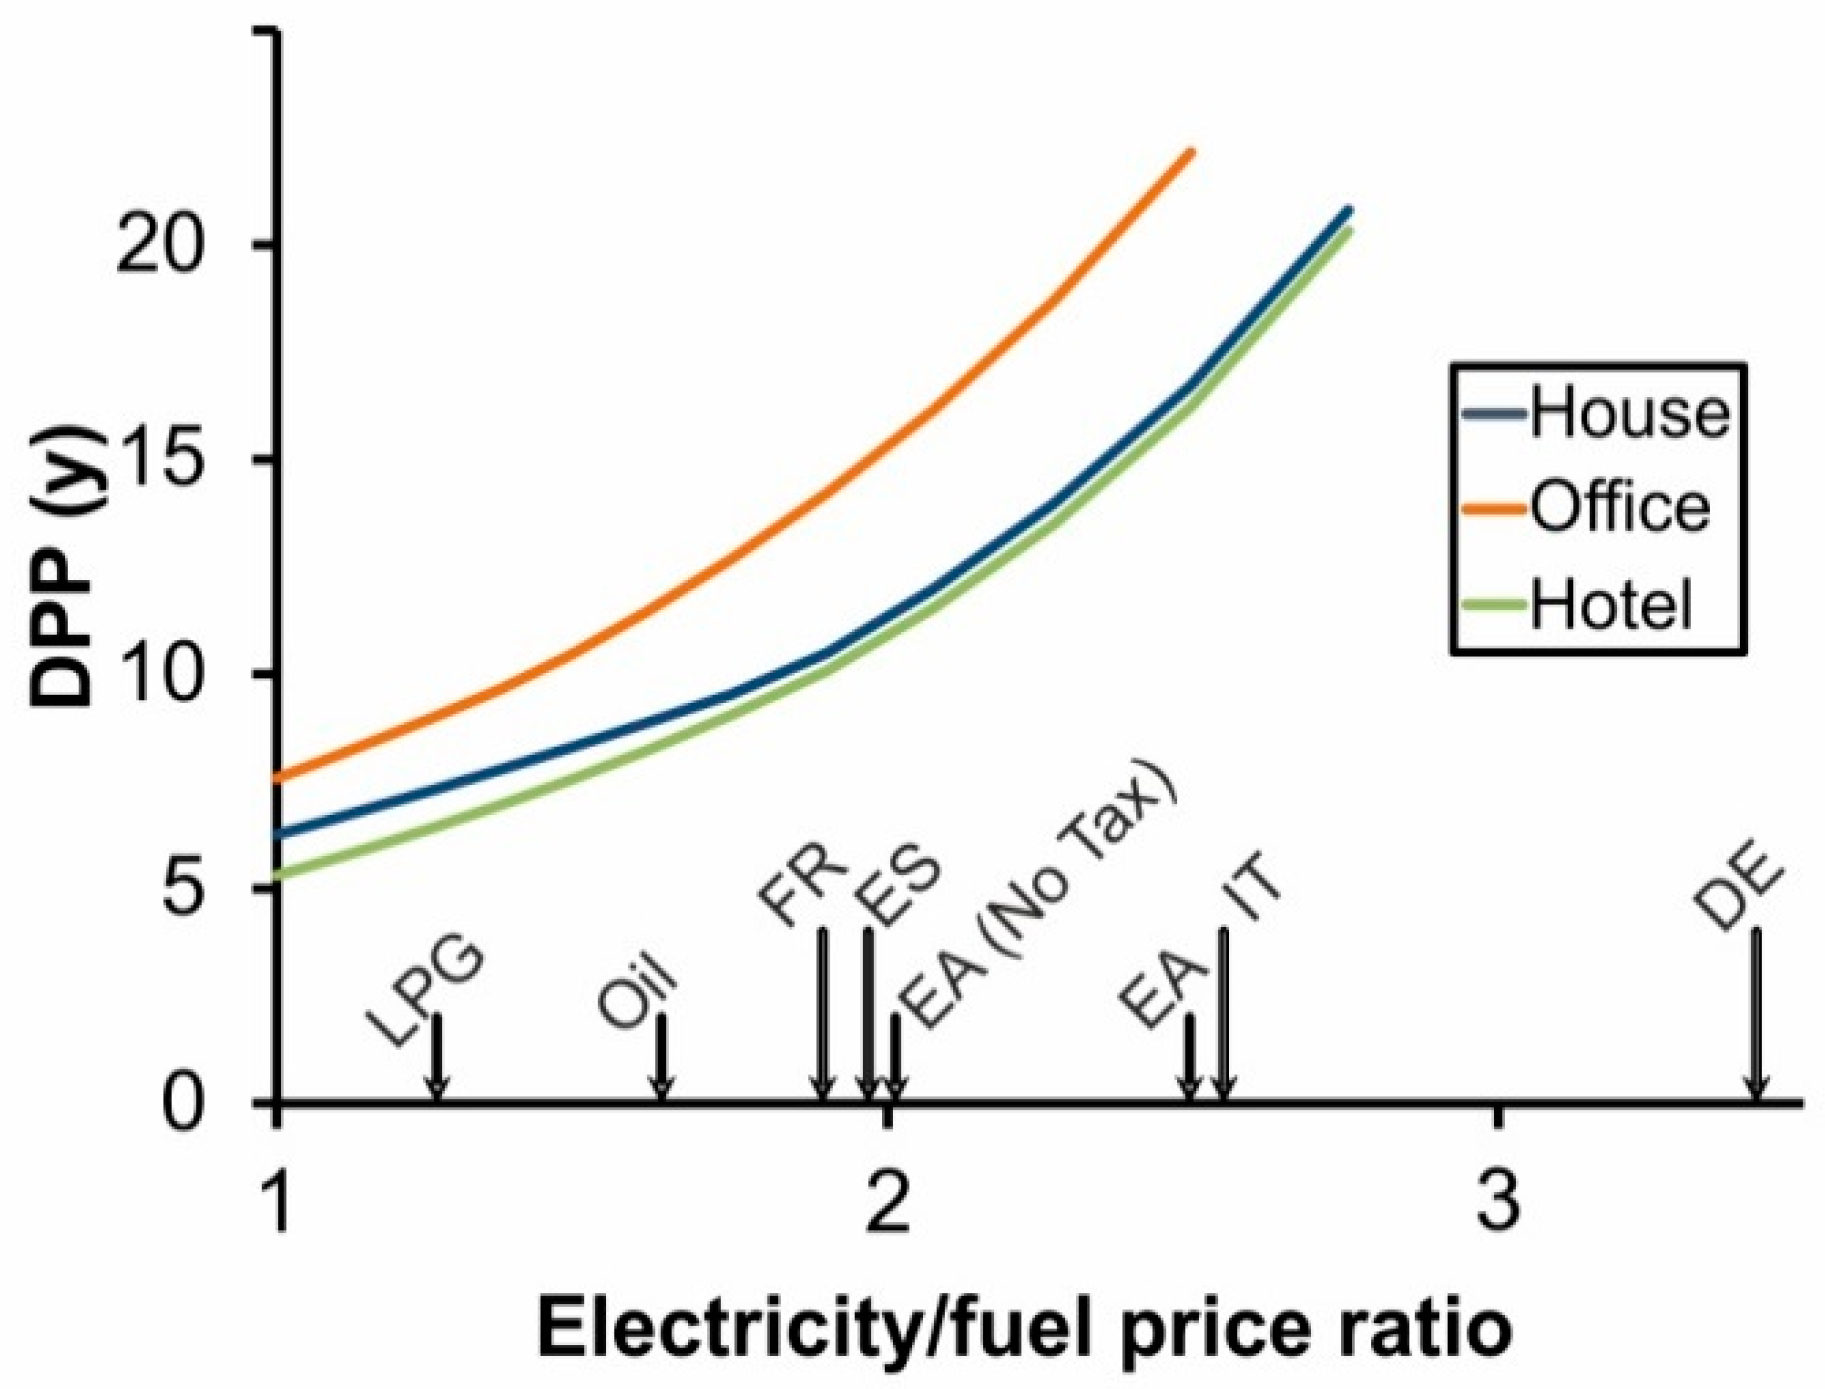
3.2.2. Electricity/Fuel Price Ratio Analysis
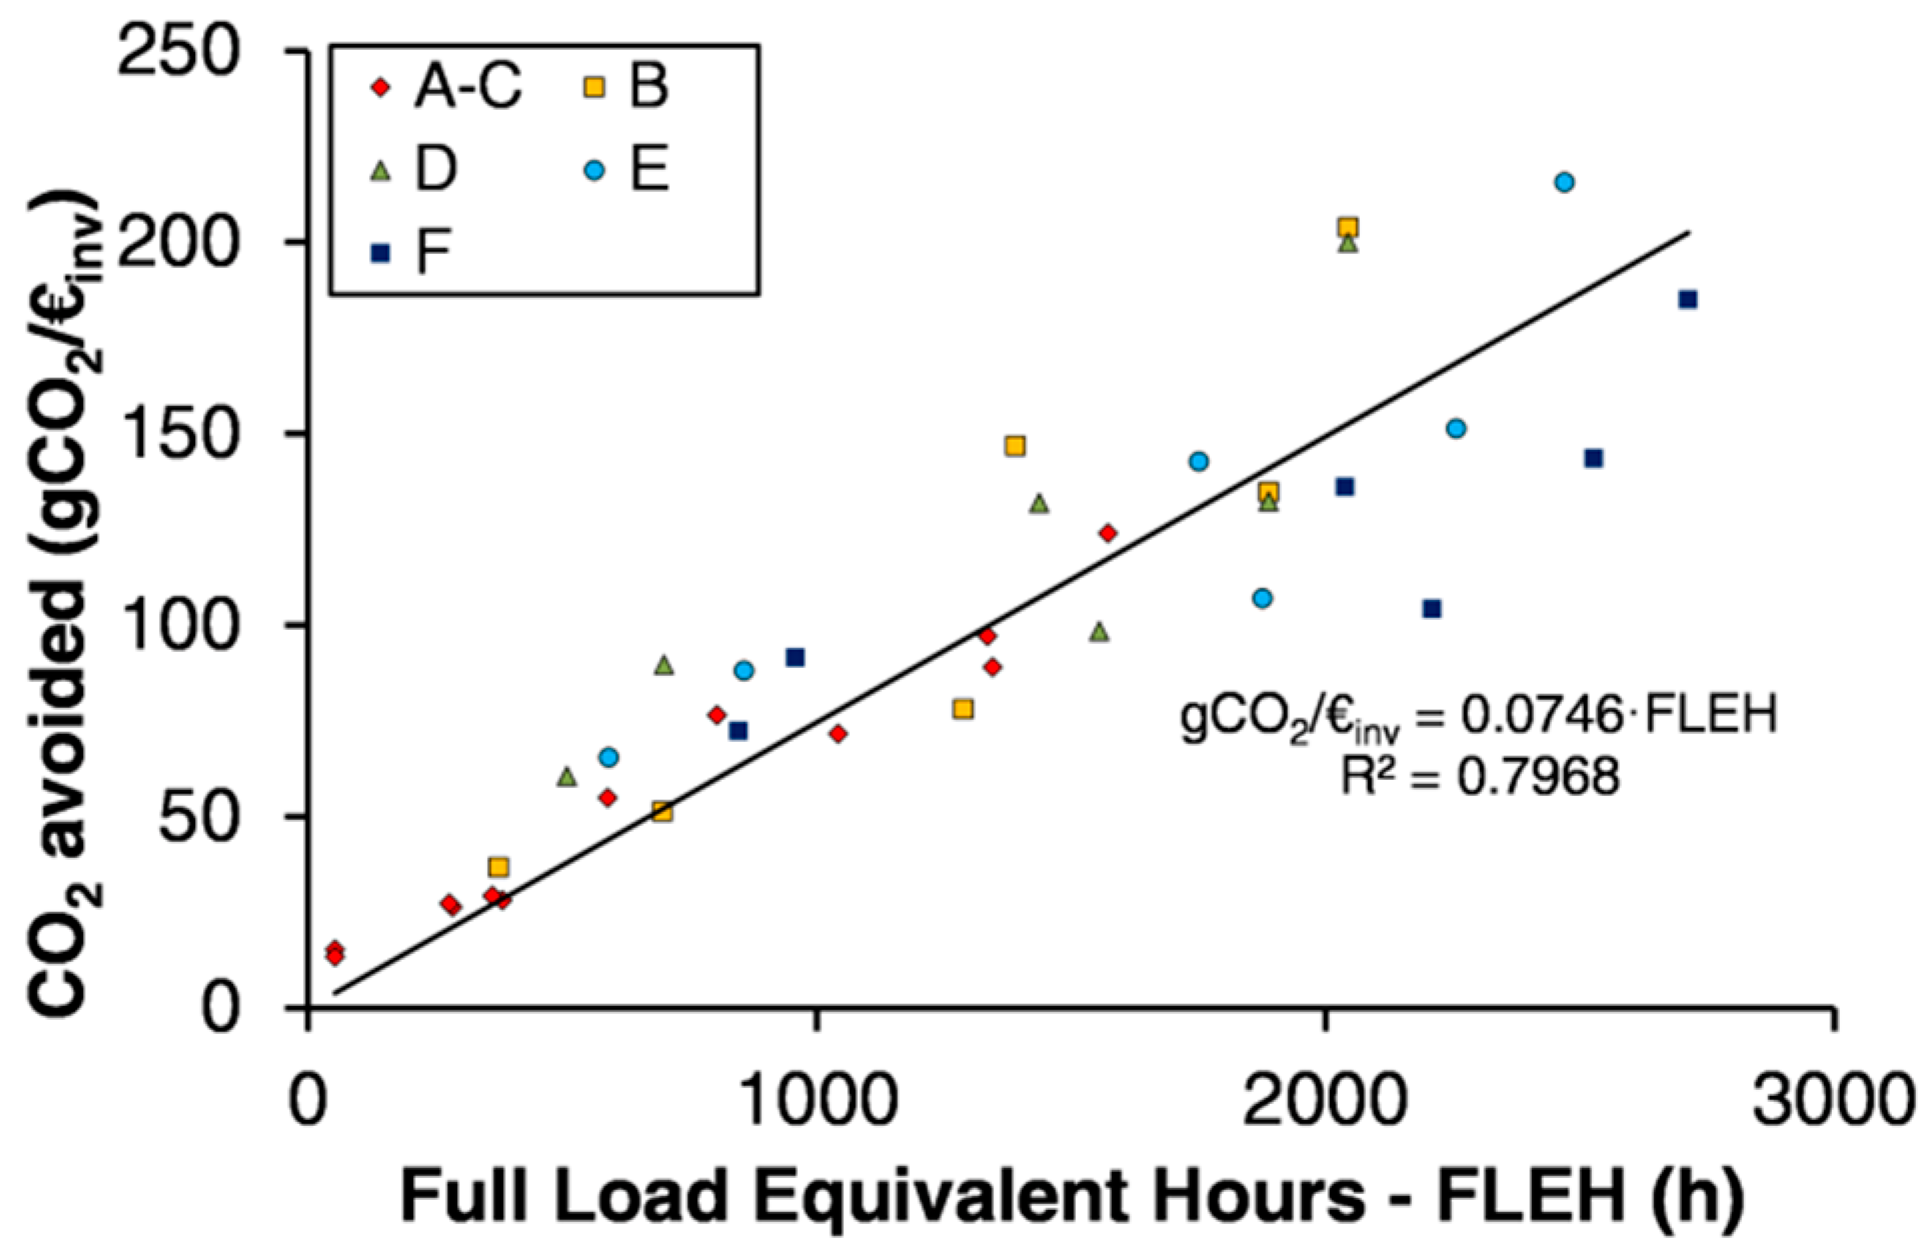
3.3. Environmental Benefits
4. Conclusions
Supplementary Materials
Author Contributions
Funding
Acknowledgments
Conflicts of Interest
References
- IEA. World Energy Investment Outlook. 2014. Available online: www.iea.org/publications/freepublications/publication/WEIO2014.pdf (accessed on 27 November 2017).
- Polesello, V.; Johnson, K. Energy-Efficient Buildings for Low-Carbon Cities; ICCG Reflection; ICCG: Venice, Italy, 2016. [Google Scholar]
- Nejat, P.; Jomehzadeh, F.; Taheri, M.M.; Gohari, M.; Majid, M.Z. A global review of energy consumption, CO2 emissions and policy in the residential sector (with an overview of the top ten CO2 emitting countries). Renew. Sustain. Energy Rev. 2015, 43, 843–862. [Google Scholar] [CrossRef]
- Bayer, P.; Saner, D.; Bolay, S.; Rybach, L.; Blum, P. Greenhouse gas emission savings of ground source heat pump systems in europe: A review. Renew. Sustain. Energy Rev. 2012, 16, 1256–1267. [Google Scholar] [CrossRef]
- Heinonen, J.; Laine, J.; Pluuman, K.; Säynäjoki, E.-S.; Soukka, R.; Junnila, S. Planning for a low carbon future? Comparing heat pumps and cogeneration as the energy system options for a new residential area. Energies 2015, 8, 9137–9154. [Google Scholar] [CrossRef]
- Lund, J.W. Direct utilization of geothermal energy. Energies 2010, 3, 1443–1471. [Google Scholar] [CrossRef]
- Casasso, A.; Pestotnik, S.; Rajver, D.; Jež, J.; Prestor, J.; Sethi, R. Assessment and mapping of the closed-loop shallow geothermal potential in Cerkno (Slovenia). Energy Procedia 2017, 125, 335–344. [Google Scholar] [CrossRef]
- Casasso, A.; Sethi, R. Assessment and mapping of the shallow geothermal potential in the province of Cuneo (Piedmont, NW Italy). Renew. Energy 2017, 102, 306–315. [Google Scholar] [CrossRef]
- Yang, H.; Cui, P.; Fang, Z. Vertical-borehole ground-coupled heat pumps: A review of models and systems. Appl. Energy 2010, 87, 16–27. [Google Scholar] [CrossRef]
- Klein, S.A.; Beckman, W.A.; Mitchell, J.W.; Duffie, J.A.; Duffie, N.A.; Freeman, T.L.; Mitchell, J.C.; Braun, J.E.; Evans, B.L.; Kummer, J.P. Trnsys 16—User Manual; Solar Energy Laboratory, University of Wisconsin: Madison, WI, USA, 2004. [Google Scholar]
- Klein, S.A.; Beckman, W.A.; Mitchell, J.W.; Duffie, J.A.; Duffie, N.A.; Freeman, T.L.; Mitchell, J.C.; Braun, J.E.; Evans, B.L.; Kummer, J.P.; et al. Trnsys 16—Volume 3 Standard Component Library Overview; Solar Energy Laboratory, University of Wisconsin: Madison, WI, USA, 2005; p. 92. [Google Scholar]
- Zogou, O.; Stamatelos, A. Optimization of thermal performance of a building with ground source heat pump system. Energy Convers. Manag. 2007, 48, 2853–2863. [Google Scholar] [CrossRef]
- Fabrizio, E.; Ferrara, M.; Urone, G.; Corgnati, S.P.; Pronsati, S.; Filippi, M. Performance assessment of solar assisted ground source heat pump in a mountain site. Energy Procedia 2015, 78, 2286–2291. [Google Scholar] [CrossRef]
- Franco, A.; Fantozzi, F. Experimental analysis of a self consumption strategy for residential building: The integration of PV system and geothermal heat pump. Renew. Energy 2016, 86, 1075–1085. [Google Scholar] [CrossRef]
- Tagliabue, L.C.; Maistrello, M.; Del Pero, C. Solar heating and air-conditioning by gshp coupled to PV system for a cost effective high energy performance building. Energy Procedia 2012, 30, 683–692. [Google Scholar] [CrossRef]
- Thygesen, R.; Karlsson, B. An analysis on how proposed requirements for near zero energy buildings manages pv electricity in combination with two different types of heat pumps and its policy implications—A swedish example. Energy Policy 2017, 101, 10–19. [Google Scholar] [CrossRef]
- Ruiz-Calvo, F.; Montagud, C.; Cazorla-Marín, A.; Corberán, J.M. Development and experimental validation of a TRNSYS dynamic tool for design and energy optimization of ground source heat pump systems. Energies 2017, 10, 1510. [Google Scholar] [CrossRef]
- De Rosa, M.; Ruiz-Calvo, F.; Corberán, J.M.; Montagud, C.; Tagliafico, L.A. A novel trnsys type for short-term borehole heat exchanger simulation: B2G model. Energy Convers. Manag. 2015, 100, 347–357. [Google Scholar] [CrossRef]
- Ruiz-Calvo, F.; De Rosa, M.; Monzó, P.; Montagud, C.; Corberán, J.M. Coupling short-term (B2G model) and long-term (g-function) models for ground source heat exchanger simulation in trnsys. Application in a real installation. Appl. Therm. Eng. 2016, 102, 720–732. [Google Scholar] [CrossRef]
- Emmi, G.; Zarrella, A.; De Carli, M.; Galgaro, A. An analysis of solar assisted ground source heat pumps in cold climates. Energy Convers. Manag. 2015, 106, 660–675. [Google Scholar] [CrossRef]
- Montagud, C.; Corberán, J.M.; Ruiz-Calvo, F. Experimental and modeling analysis of a ground source heat pump system. Appl. Energy 2013, 109, 328–336. [Google Scholar] [CrossRef]
- Han, C.; Yu, X. Performance of a residential ground source heat pump system in sedimentary rock formation. Appl. Energy 2016, 164, 89–98. [Google Scholar] [CrossRef]
- Safa, A.A.; Fung, A.S.; Kumar, R. Heating and cooling performance characterisation of ground source heat pump system by testing and TRNSYS simulation. Renew. Energy 2015, 83, 565–575. [Google Scholar] [CrossRef]
- Zhao, Z.; Shen, R.; Feng, W.; Zhang, Y.; Zhang, Y. Soil thermal balance analysis for a ground source heat pump system in a hot-summer and cold-winter region. Energies 2018, 11, 1206. [Google Scholar] [CrossRef]
- Jung, Y.-J.; Kim, H.-J.; Choi, B.-E.; Jo, J.-H.; Cho, Y.-H. A study on the efficiency improvement of multi-geothermal heat pump systems in Korea using coefficient of performance. Energies 2016, 9, 356. [Google Scholar] [CrossRef]
- Lu, Q.; Narsilio, G.A.; Aditya, G.R.; Johnston, I.W. Economic analysis of vertical ground source heat pump systems in melbourne. Energy 2017, 125, 107–117. [Google Scholar] [CrossRef]
- Morrone, B.; Coppola, G.; Raucci, V. Energy and economic savings using geothermal heat pumps in different climates. Energy Convers. Manag. 2014, 88, 189–198. [Google Scholar] [CrossRef]
- Chang, Y.; Gu, Y.; Zhang, L.; Wu, C.; Liang, L. Energy and environmental implications of using geothermal heat pumps in buildings: An example from North China. J. Clean. Prod. 2017, 167, 484–492. [Google Scholar] [CrossRef]
- Ciulla, G.; Lo Brano, V.; D’Amico, A. Modelling relationship among energy demand, climate and office building features: A cluster analysis at european level. Appl. Energy 2016, 183, 1021–1034. [Google Scholar] [CrossRef]
- Junghans, L. Evaluation of the economic and environmental feasibility of heat pump systems in residential buildings, with varying qualities of the building envelope. Renew. Energy 2015, 76, 699–705. [Google Scholar] [CrossRef]
- Alavy, M.; Nguyen, H.V.; Leong, W.H.; Dworkin, S.B. A methodology and computerized approach for optimizing hybrid ground source heat pump system design. Renew. Energy 2013, 57, 404–412. [Google Scholar] [CrossRef]
- Nguyen, H.V.; Law, Y.L.E.; Alavy, M.; Walsh, P.R.; Leong, W.H.; Dworkin, S.B. An analysis of the factors affecting hybrid ground-source heat pump installation potential in North America. Appl. Energy 2014, 125, 28–38. [Google Scholar] [CrossRef]
- Tsikaloudaki, K.; Laskos, K.; Bikas, D. On the Establishment of Climatic Zones in Europe with Regard to the Energy Performance of Buildings. Energies 2011, 5, 32–44. [Google Scholar] [CrossRef]
- Italian Ministry of Economic Development. Supplemento Ordinario n.39 alla Gazzetta Ufficiale—Serie Generale—n.162; Repubblica Italiana: Rome, Italy, 2015; pp. 1–41.
- Ballarini, I.; Corgnati, S.P.; Corrado, V. Use of reference buildings to assess the energy saving potentials of the residential building stock: The experience of TABULA project. Energy Policy 2014, 68, 273–284. [Google Scholar] [CrossRef]
- Meteonorm. Meteonorm—Irradiation Data for Every Place on Earth. Available online: www.meteonorm.com/ (accessed on 31 January 2018).
- Klein, S.A.; Beckman, W.A.; Mitchell, J.W.; Duffie, J.A.; Duffie, N.A.; Freeman, T.L.; Mitchell, J.C.; Braun, J.E.; Evans, B.L.; Kummer, J.P.; et al. Trnsys 16—Volume 6 Multizone Building Modeling with Type 56 and Trnbuild; Solar Energy Laboratory, University of Wisconsin: Madison, WI, USA, 2004; p. 199. [Google Scholar]
- Aprile, M. Caratterizzazione Energetica del Settore Alberghiero in Italia (Energy Characterisation of the Hotel Sector in Italy). Available online: progettoegadi.enea.it/it/RSE162.pdf (accessed on 3 May 2017).
- Klein, S.A.; Beckman, W.A.; Mitchell, J.W.; Duffie, J.A.; Duffie, N.A.; Freeman, T.L.; Mitchell, J.C.; Braun, J.E.; Evans, B.L.; Kummer, J.P.; et al. Trnsys 16—Volume 5 Mathematical Reference; Solar Energy Laboratory, University of Wisconsin: Madison, WI, USA, 2006; p. 434. [Google Scholar]
- TESS (Thermal Energy System Specialists). Tess Library Documentation; TESS: Madison, WI, USA, 2004. [Google Scholar]
- UNI/TS. Uni ts 11300-1: Prestazioni Energetiche Degli Edifici, Parte 1. Available online: http://www.dabove.com/index.php?page=la-norma-uni-ts-11300-1 (accessed on 14 June 2018).
- Rabl, A.; Norford, L. Peak load reduction by preconditioning buildings at night. Int. J. Energy Res. 1991, 15, 781–798. [Google Scholar] [CrossRef]
- Dimplex. Manuale di Progettazione. Riscaldare e Raffreddare con Pompe di Calore (Design Manual. Heating and Cooling with Heat Pumps). Available online: goo.gl/LehE2v (accessed on 27 April 2017).
- Ochsner, K. Geothermal Heat Pumps: A Guide for Planning and Installing; Routledge: London, UK, 2012. [Google Scholar]
- ASHRAE. Handbook-Fundamentals; ASHRAE: Atlanta, GA, USA, 2013. [Google Scholar]
- UNI/TS. Uni ts 11300-2: Prestazioni Energetiche Degli Edifici, Parte 2. Available online: http://www.dabove.com/index.php?page=la-norma-uni-ts-11300-2 (accessed on 14 June 2018).
- Jordan, U.; Vajen, K. Realistic Domestic Hot-Water Profiles in Different Time Scales. Available online: goo.gl/7Nkzzq (accessed on 6 May 2017).
- Hellström, G. Duct Ground Heat Storage Model, Manual for Computer Code; Department of Mathematical Physics, University of Lund: Lund, Sweden, 1989. [Google Scholar]
- Philippe, M.; Michel Bernier, P.; Marchio, D. Sizing calculation spreadsheet: Vertical geothermal borefields. Ashrae J. 2010, 52, 20. [Google Scholar]
- Kavanaugh, S.P.; Rafferty, K. Ground-Source Heat Pumps: Design of Geothermal Systems for Commercial and Institutional Buildings; ASHRAE: Atlanta, GA, USA, 1997. [Google Scholar]
- Belussi, L.; Danza, L. Method for the prediction of malfunctions of buildings through real energy consumption analysis: Holistic and multidisciplinary approach of energy signature. Energy Build. 2012, 55, 715–720. [Google Scholar] [CrossRef]
- Ni, L.; Song, W.; Zeng, F.; Yao, Y. Energy Saving and Economic Analyses of Design Heating Load Ratio of Ground Source Heat Pump with Gas Boiler as Auxiliary Heat Source. In Proceedings of the IEEE 2011 International Conference on Electric Technology and Civil Engineering (ICETCE), Jiujiang, China, 22–24 April 2011; pp. 1197–1200. [Google Scholar]
- Bierman, H., Jr.; Smidt, S. The Capital Budgeting Decision: Economic Analysis of Investment Projects; Routledge: London, UK, 2012. [Google Scholar]
- EIA. Updated Buildings Sector Appliance and Equipment Costs and Efficiencies. Available online: www.eia.gov/analysis/studies/buildings/equipcosts/pdf/full.pdf (accessed on 28 June 2017).
- IEA. Renewables for Heating and Cooling. Available online: www.iea.org/publications/freepublications/publication/Renewable_Heating_Cooling_Final_WEB.pdf (accessed on 27 June 2017).
- European Central Bank. Harmonised Long-Term Interest Rates. Available online: www.ecb.europa.eu/stats/shared/download/stats/download/irs/irs/irs.pdf (accessed on 17 July 2017).
- Ochsner. Price List 2012. Available online: wagnersolar.hu/dokumentumok/OCHSNER_Arlista2012-2.pdf (accessed on 27 April 2017).
- Vaillant. Listino Prezzi Settembre 2016 (Price List September 2016). Available online: goo.gl/eYAcFC (accessed on 30 June 2017).
- Viessmann. Price List. Available online: www.viessmann.de (accessed on 30 June 2017).
- Bosch. Listino Prezzi 2016 (Price List 2016). Available online: www.junkers.it/privati/documentazione/cataloghi_e_listini/cataloghi_e_listini (accessed on 30 June 2017).
- Hoval Hoval website. Available online: www.hoval.it/ (accessed on 27 April 2017).
- BRGM. Qualiforage. Engagement of Borehole Heat Exchanger Drilling Enterprises. Available online: infoterre.brgm.fr/rapports/RP-63015-FR.pdf (accessed on 2 July 2017).
- Agenzia Delle Entrate. Guida Agevolazioni Risparmio Energetico 2017 (Guide to Incentives for Energy Saving). Available online: goo.gl/boZuRg (accessed on 5 July 2017).
- European Commission. Vat Rates Applied in the Member States of the European Union. Situation at 1st January 2018. Available online: https://ec.europa.eu/taxation_customs/sites/taxation/files/resources/documents/taxation/vat/how_vat_works/rates/vat_rates_en.pdf (accessed on 8 July 2018).
- Eurostat. Eurostat Website. Available online: ec.europa.eu/eurostat (accessed on 8 July 2017).
- European Commission. Consumer Prices of Petroleum Products. Available online: ec.europa.eu/energy/en/data-analysis/weekly-oil-bulletin (accessed on 18 October 2017).
- Winkler, J.; Booten, C.; Christensen, D.; Tomerlin, J. Laboratory Performance Testing of Residential Window Air Conditioners. Available online: goo.gl/L6ykA8 (accessed on 3 August 2017).
- Buckley, C.; Pasquali, R.; Lee, M.; Dooley, J.; Williams, T. Ground Source Heat and Shallow Geothermal Energy Homeowner Manual. Available online: goo.gl/7L1tcE (accessed on 6 September 2017).
- Newnan, D.G.; Eschenbach, T.; Lavelle, J.P. Engineering Economic Analysis; Oxford University Press: Oxford, UK, 2004; Volume 2. [Google Scholar]
- Chinese, D.; Nardin, G.; Saro, O. Multi-criteria analysis for the selection of space heating systems in an industrial building. Energy 2011, 36, 556–565. [Google Scholar] [CrossRef]
- IEA. Monthly Oil Price Statistics. Available online: www.iea.org/statistics/monthlystatistics/monthlyoilprices/ (accessed on 18 October 2017).
- ISPRA. Fattori di Emissione Atmosferica di CO2 e Altri Gas a Effetto Serra nel Settore Elettrico (CO2 Emission Factors of the Electric Sector). Available online: www.isprambiente.gov.it/files2017/pubblicazioni/rapporto/R_257_17.pdf (accessed on 19 November 2017).
- Koffi, B.; Cerutti, A.; Duerr, M.; Iancu, A.; Kona, A.; Janssens-Maenhout, G. Com Default Emission Factors for the Member States of the European Union. Available online: data.europa.eu/89h/jrc-com-ef-comw-ef-2017 (accessed on 13 July 2018).
- ARPA Lombardia; Regione Lombardia; Regione Piemonte; Regione Emilia Romagna; Regione Veneto; Giulia, R.F.-V.; Regione Puglia; Provincia di Trento; Provincia di Bolzano. Inemar—Inventario Emssioni Aria (Inventory of Emissions of Air Pollutants). Available online: http://www.inemar.eu/ (accessed on 10 December 2017).
- INNOVHUB. Comparative Study on the Emissions of Gas, LPG, Oil and Pellet Boilers. Available online: goo.gl/GmhhKn (accessed on 15 December 2017).
- Shen, G.; Tao, S.; Wei, S.; Zhang, Y.; Wang, R.; Wang, B.; Li, W.; Shen, H.; Huang, Y.; Chen, Y.; et al. Reductions in emissions of carbonaceous particulate matter and polycyclic aromatic hydrocarbons from combustion of biomass pellets in comparison with raw fuel burning. Environ. Sci. Technol. 2012, 46, 6409–6416. [Google Scholar] [CrossRef] [PubMed]
- Ozgen, S.; Caserini, S.; Galante, S.; Giugliano, M.; Angelino, E.; Marongiu, A.; Hugony, F.; Migliavacca, G.; Morreale, C. Emission factors from small scale appliances burning wood and pellets. Atmos. Environ. 2014, 94, 144–153. [Google Scholar] [CrossRef]
- Sarigiannis, D.A.; Karakitsios, S.P.; Kermenidou, M.V. Health impact and monetary cost of exposure to particulate matter emitted from biomass burning in large cities. Sci. Total Environ. 2015, 524–525, 319–330. [Google Scholar] [CrossRef] [PubMed]
- Pietrogrande, M.C.; Bacco, D.; Ferrari, S.; Kaipainen, J.; Ricciardelli, I.; Riekkola, M.L.; Trentini, A.; Visentin, M. Characterization of atmospheric aerosols in the po valley during the supersito campaigns—Part 3: Contribution of wood combustion to wintertime atmospheric aerosols in Emilia Romagna region (Northern Italy). Atmos. Environ. 2015, 122, 291–305. [Google Scholar] [CrossRef]
- McKechnie, J.; Colombo, S.; Chen, J.; Mabee, W.; MacLean, H.L. Forest bioenergy or forest carbon? Assessing trade-offs in greenhouse gas mitigation with wood-based fuels. Environ. Sci. Technol. 2010, 45, 789–795. [Google Scholar] [CrossRef] [PubMed]
- Ter-Mikaelian, M.T.; Colombo, S.J.; Chen, J. The burning question: Does forest bioenergy reduce carbon emissions? A review of common misconceptions about forest carbon accounting. J. For. 2015, 113, 57–68. [Google Scholar] [CrossRef]
- Fraunhofer Institute. Ermittlung Vermiedener Umweltschäden—Hintergrundpapier zur Methodik—Im: “Rahmen des Projekts Wirkungen des Ausbaus Erneuerbarer Energien” (Determination of Avoided Environmental Damage—Background Paper on Methodology. In Impact of the Expansion of Renewable Energies; Fraunhofer Institute: Munich, Germany, 2012; Available online: publica.fraunhofer.de/eprints/urn_nbn_de_0011-n-2363162.pdf (accessed on 5 January 2018).


| Building | Floor Area (m2) | External Surface (m2) | Gross Volume (m3) | S/V Ratio (m−1) |
|---|---|---|---|---|
| House | 221 | 556 | 855 | 0.65 |
| Office | 381 | 953 | 1832 | 0.52 |
| Hotel | 2840 | 4374 | 15,620 | 0.28 |
| Element | U-Value (W/(m2 K)) “Good Insulation” | U-Value (W/(m2 K)) “Poor Insulation” |
|---|---|---|
| External wall | 0.28 | 1.60 |
| Under-roof slab | 0.51 | 1.76 |
| Roof | 0.24 | 2.38 |
| Floor | 0.15 | 0.75 |
| Property | Good Insulation | Poor Insulation |
|---|---|---|
| Window type | Double 4/15/4 | Single 4 |
| U-value (W/m2 K) | 1.430 | 5.680 |
| g-value | 0.605 | 0.855 |
| Transmittance | 0.521 | 0.830 |
| Reflectance | 0.355 | 0.075 |
| Climate Zone | HDD Criterion | CDD Criterion | City | Average Annual Temperature | HDD | CDD |
|---|---|---|---|---|---|---|
| A | <1500 | ≥500 | Seville, Spain | 18.18 °C | 920 | 986 |
| B | 1500–3000 | ≥500 | Bologna, Italy | 13.98 °C | 2115 | 649 |
| C | <1500 | <500 | Lisbon, Portugal | 16.81 °C | 914 | 480 |
| D | 1500–3000 | <500 | Belgrade, Serbia | 11.26 °C | 2743 | 239 |
| E | 3000–3750 | <500 | Berlin, Germany | 9.42 °C | 3172 | 41 |
| F | ≥3750 | <500 | Stockholm, Sweden | 5.31 °C | 4632 | 0 |
| Mode | Building | Monday | WD | WE |
|---|---|---|---|---|
| Heating | House | 6:00–8:00 a.m. and 4:00–10:00 p.m. | 6:00 –8:00 a.m. and 4:00–10:00 p.m. | 8:00 a.m.–10:00 p.m. |
| Office | 4:00 a.m.–6:00 p.m. | 6:00 a.m.–6:00 p.m. | Always off | |
| Hotel | Always on | Always on | Always on | |
| Cooling | House | 4:00–10:00 p.m. | 4:00–10:00 p.m. | 8:00 a.m.–10:00 p.m. |
| Office | 7:00 a.m.–6:00 p.m. | 8:00 a.m.–6:00 p.m. | Always off | |
| Hotel | Always on | Always on | Always on |
| Installation Type | Climate Zone | Subsidies | No Subsidies | ||||
|---|---|---|---|---|---|---|---|
| House | Office | Hotel | House | Office | Hotel | ||
| New installation | A | ! | - | ! | - | - | - |
| B | + | ! | ! | - | - | - | |
| C | ! | - | - | - | - | - | |
| D | + | ↑ | ↑ | - | - | - | |
| E | + | ↑ | ↑ | - | - | - | |
| F | + | ↑ | ↑ | - | - | - | |
| Substitution | A | ! | ! | + | - | - | - |
| B | + | + | + | ! | ! | + | |
| C | + | ! | + | - | - | ! | |
| D | + | + | + | - | - | + | |
| E | + | + | + | ! | - | + | |
| F | + | + | + | - | - | + | |
| Building | House | Office | Hotel |
|---|---|---|---|
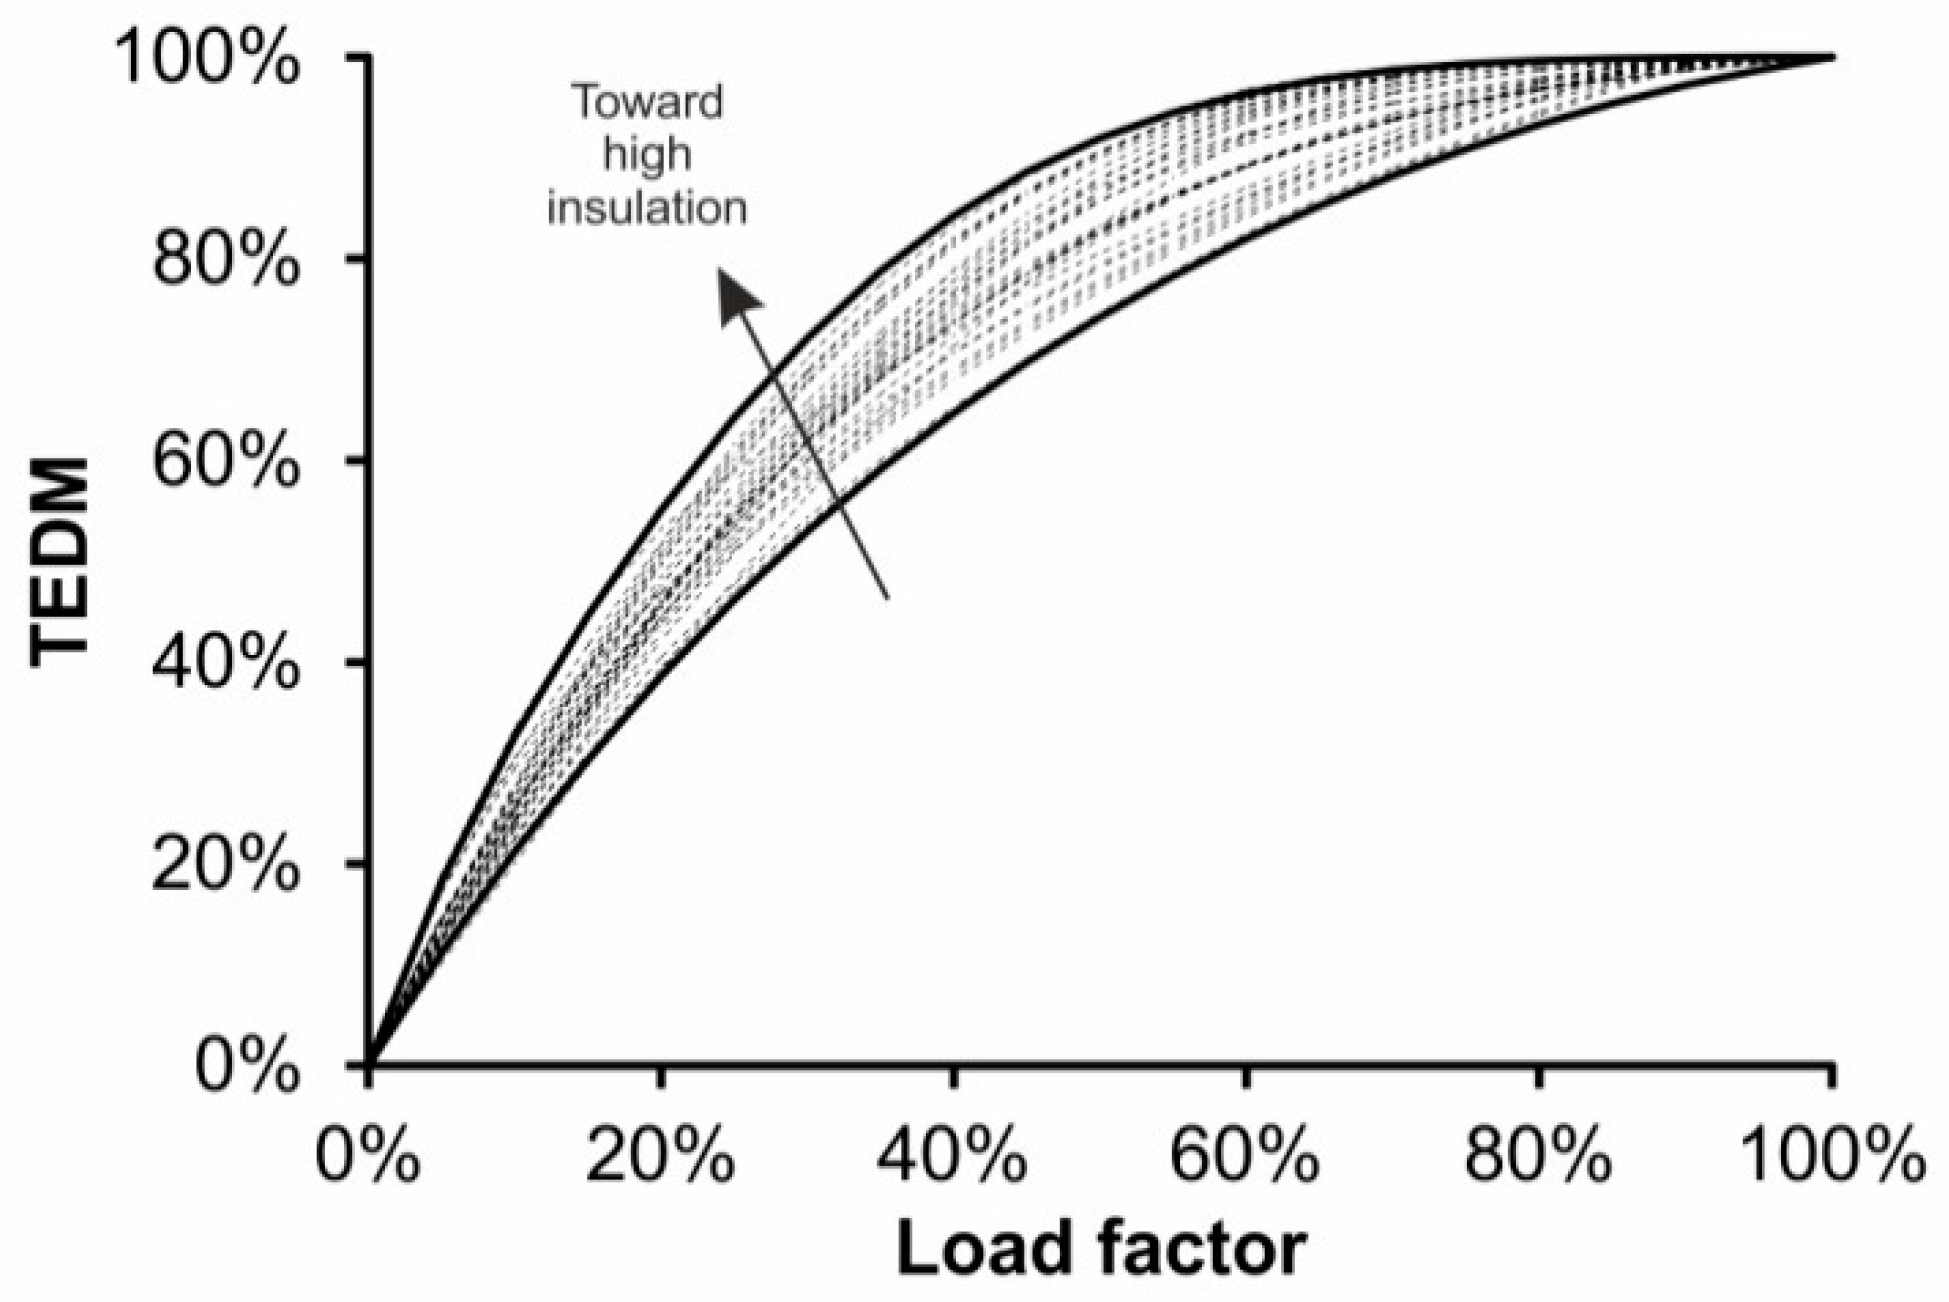
| 90% estimated TEDM | 87% | 97% | 98% |
| 70% estimated TEDM | 68% | 88% | 91% |
| Present EA | EA (No Taxes) | Oil (IT) | LPG (IT) | IT | DE | ES | FR |
|---|---|---|---|---|---|---|---|
| 2.53 | 2.04 | 1.64 | 1.27 | 2.59 | 3.48 | 1.99 | 1.91 |
© 2018 by the authors. Licensee MDPI, Basel, Switzerland. This article is an open access article distributed under the terms and conditions of the Creative Commons Attribution (CC BY) license (http://creativecommons.org/licenses/by/4.0/).
Share and Cite
Rivoire, M.; Casasso, A.; Piga, B.; Sethi, R. Assessment of Energetic, Economic and Environmental Performance of Ground-Coupled Heat Pumps. Energies 2018, 11, 1941. https://doi.org/10.3390/en11081941
Rivoire M, Casasso A, Piga B, Sethi R. Assessment of Energetic, Economic and Environmental Performance of Ground-Coupled Heat Pumps. Energies. 2018; 11(8):1941. https://doi.org/10.3390/en11081941
Chicago/Turabian StyleRivoire, Matteo, Alessandro Casasso, Bruno Piga, and Rajandrea Sethi. 2018. "Assessment of Energetic, Economic and Environmental Performance of Ground-Coupled Heat Pumps" Energies 11, no. 8: 1941. https://doi.org/10.3390/en11081941
APA StyleRivoire, M., Casasso, A., Piga, B., & Sethi, R. (2018). Assessment of Energetic, Economic and Environmental Performance of Ground-Coupled Heat Pumps. Energies, 11(8), 1941. https://doi.org/10.3390/en11081941