Three-Dimensional Numerical Investigation of Coupled Flow-Stress-Damage Failure Process in Heterogeneous Poroelastic Rocks

 ,
, 
Abstract
1. Introduction
2. Theoretical Model
2.1. Mechanical Equilibrium Equation
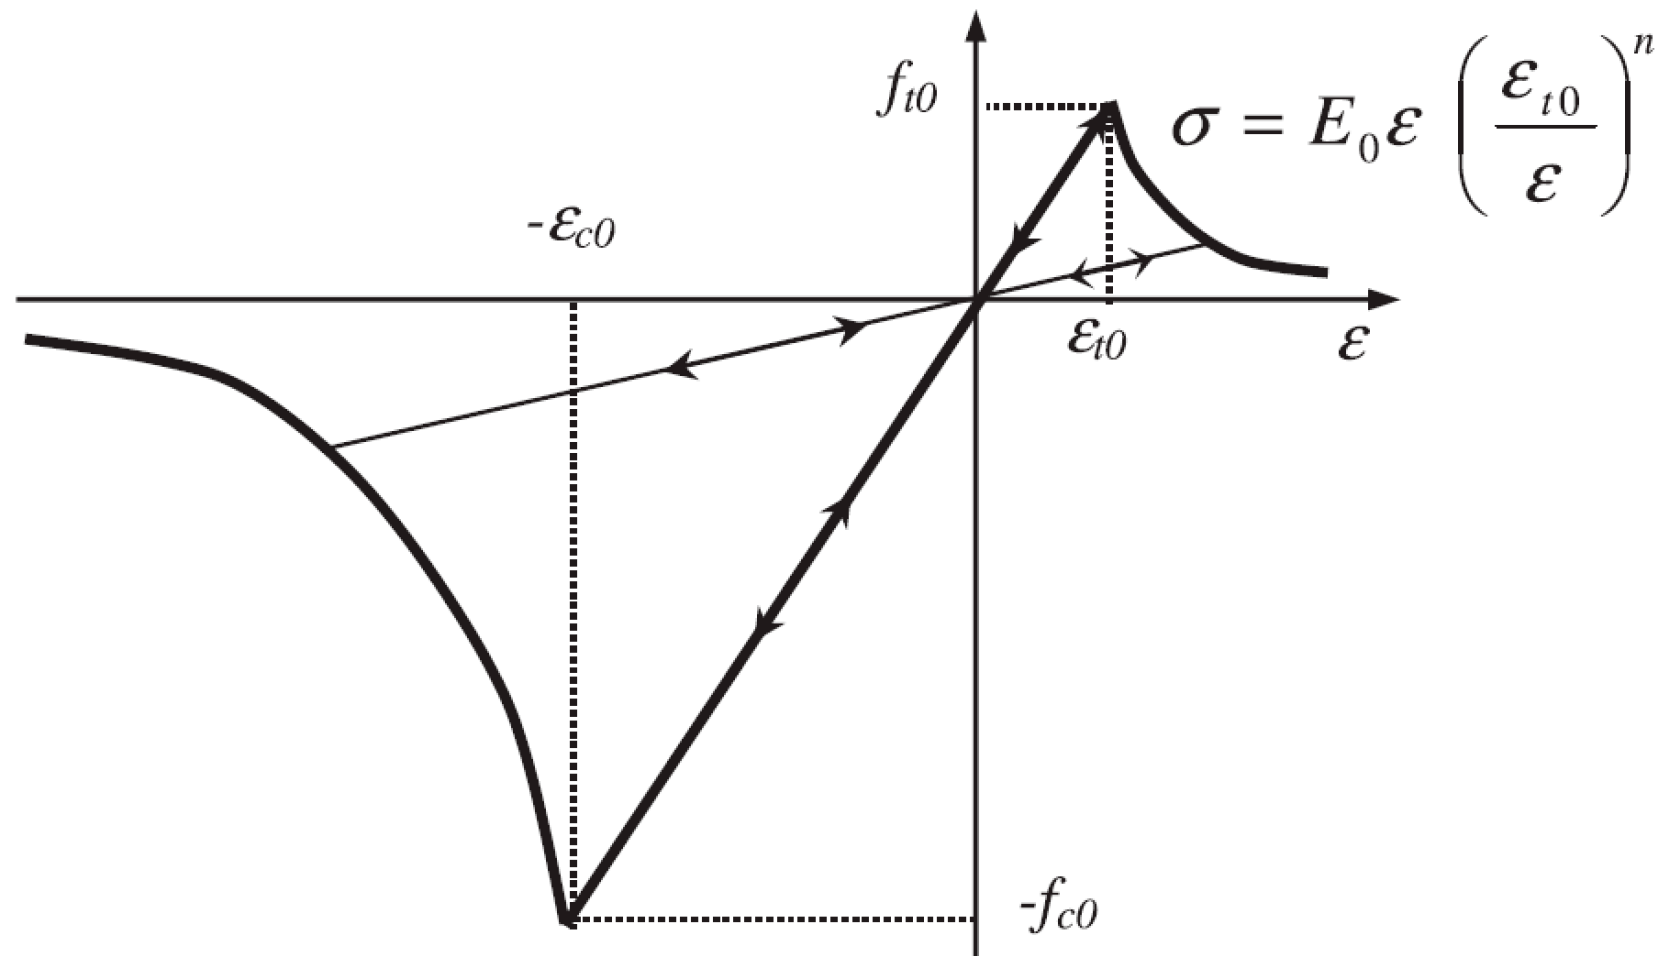
2.2. Failure Criterion and Damage Evolution Equation
2.3. Flow Equation
3. Experimental Testing
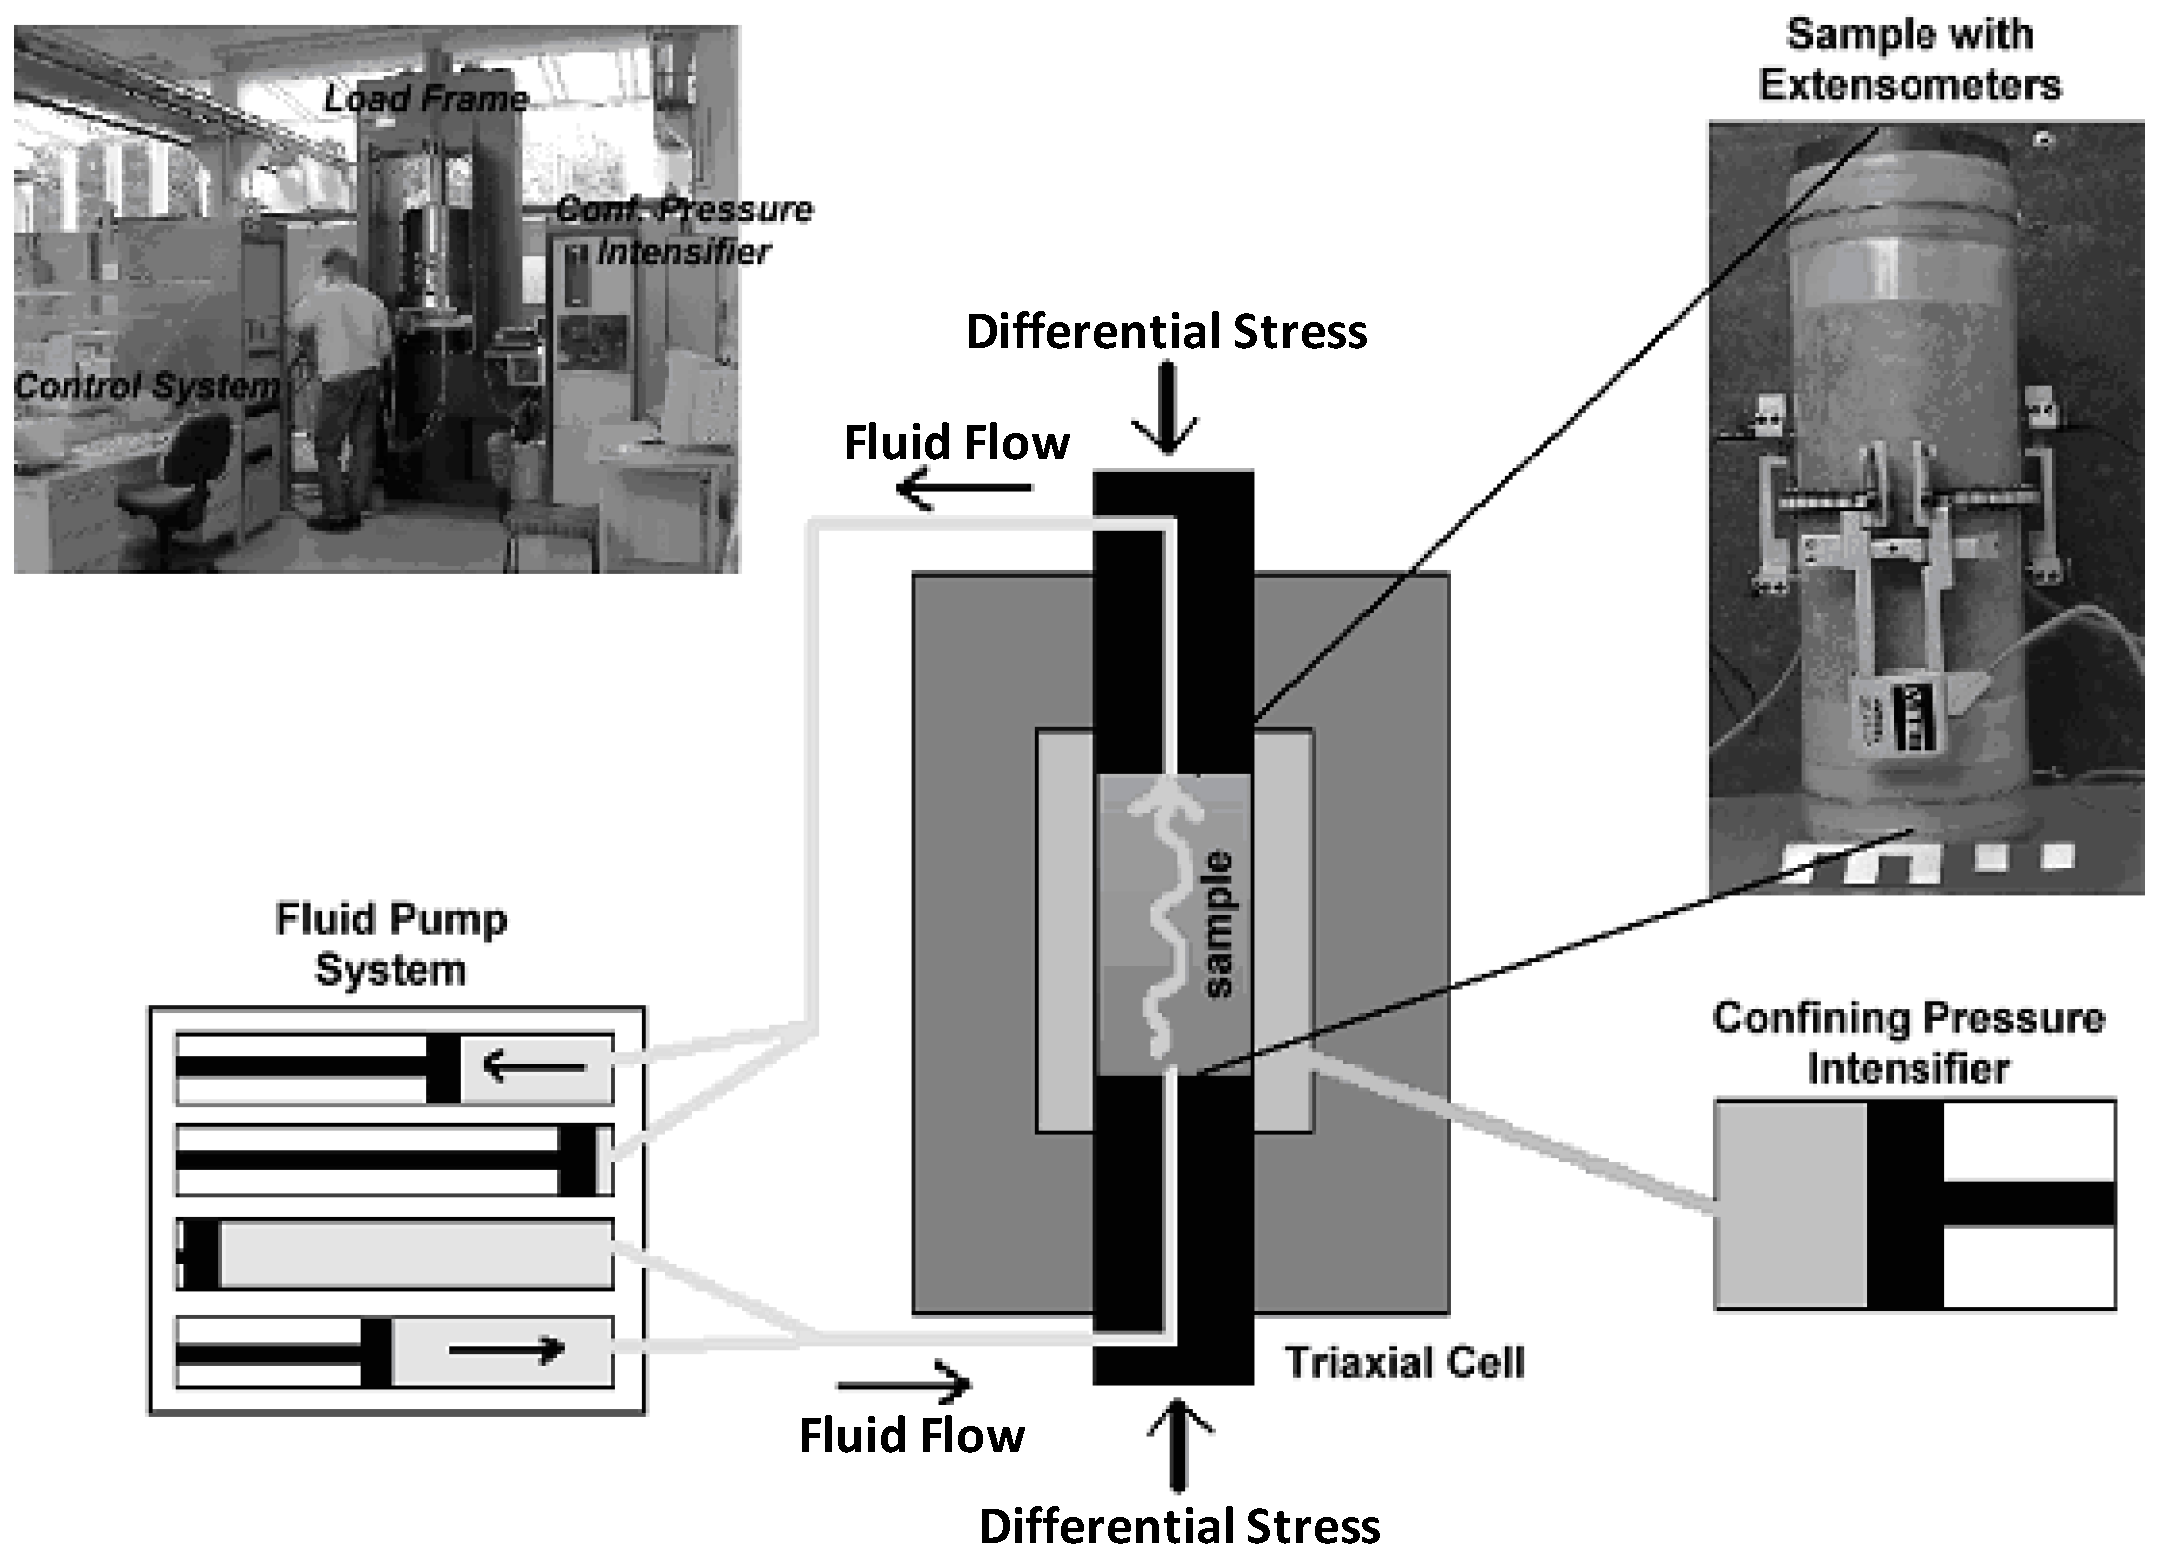
3.1. Rock Specimens and Testing Procedure
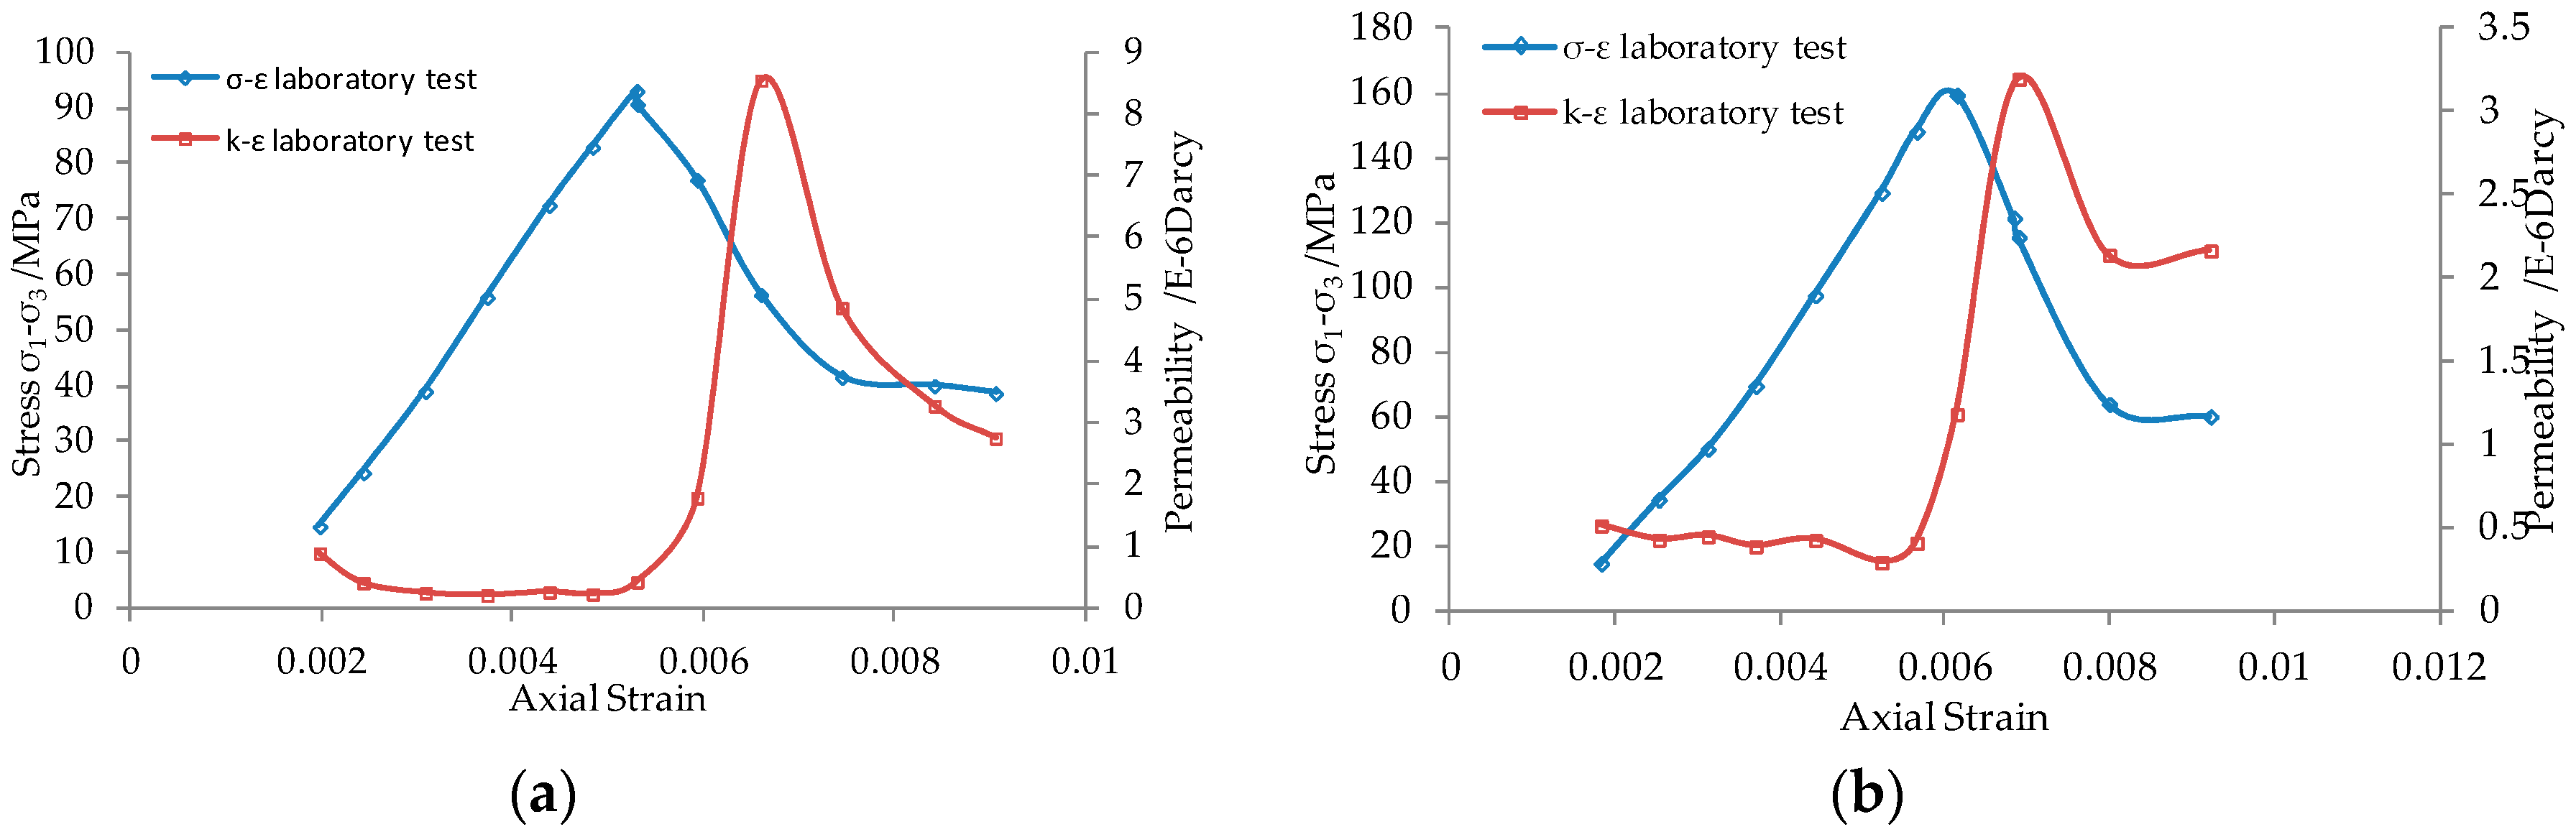
3.2. Test Results
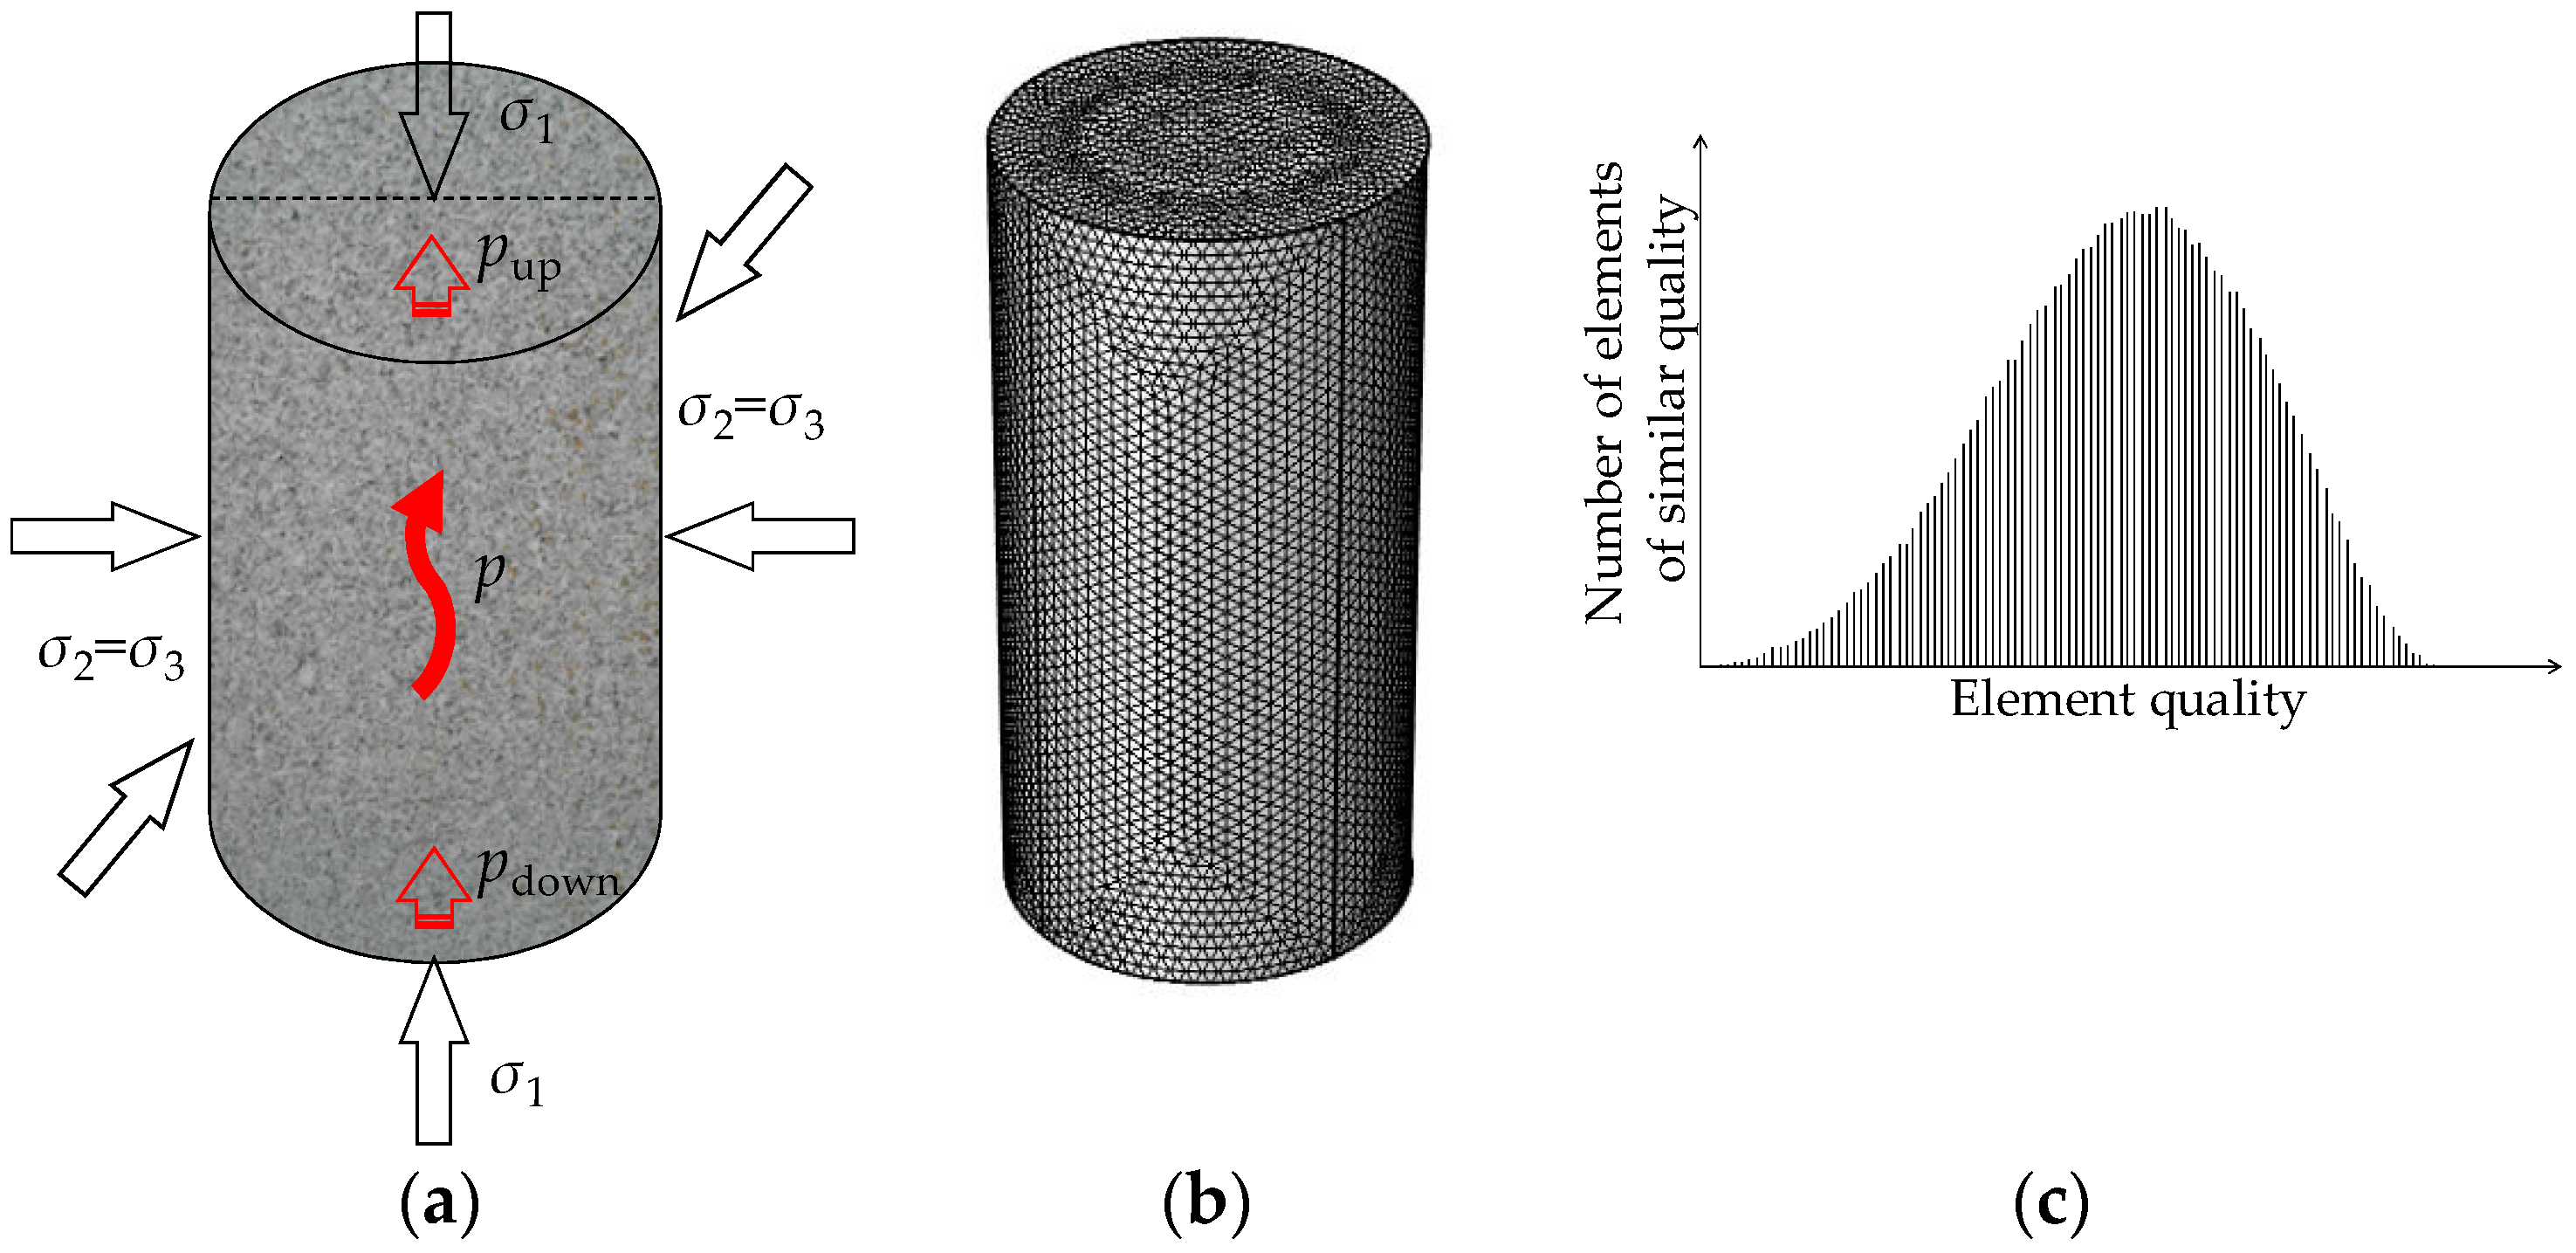
4. Numerical Simulation
5. Results and Discussions
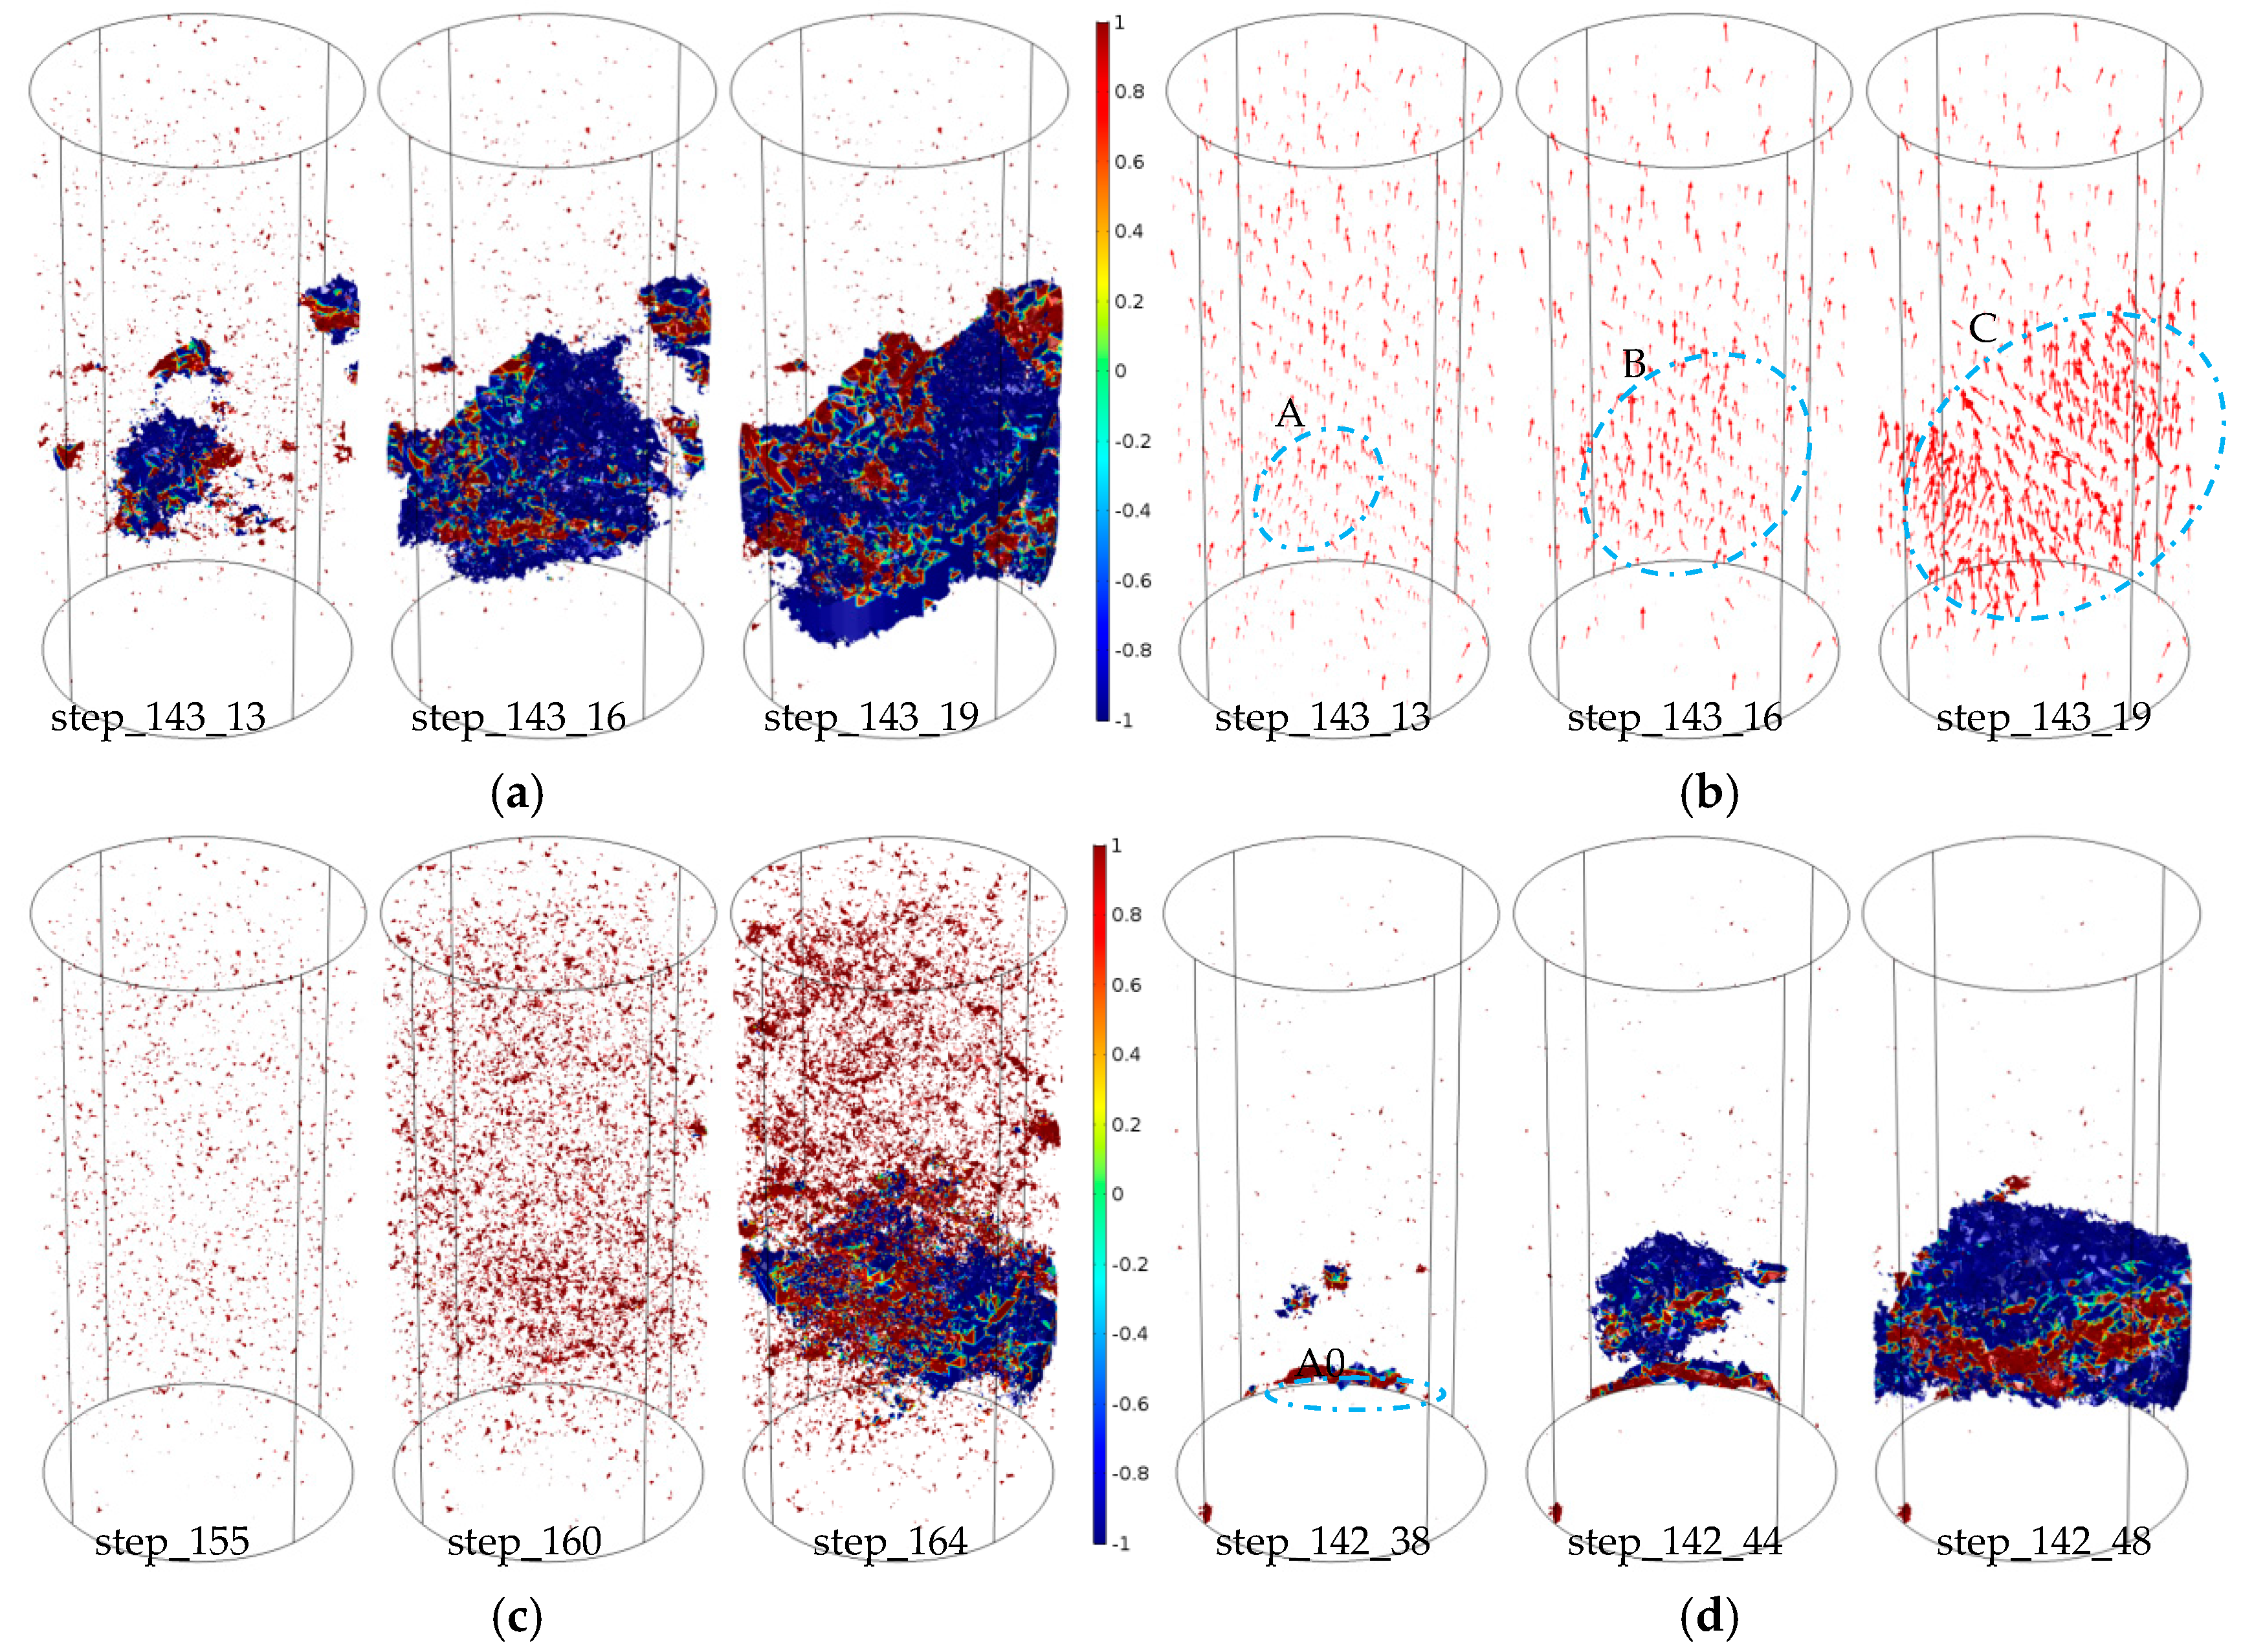
5.1. Failure Pattern and Permeability Evolution in Heterogeneous Degrees
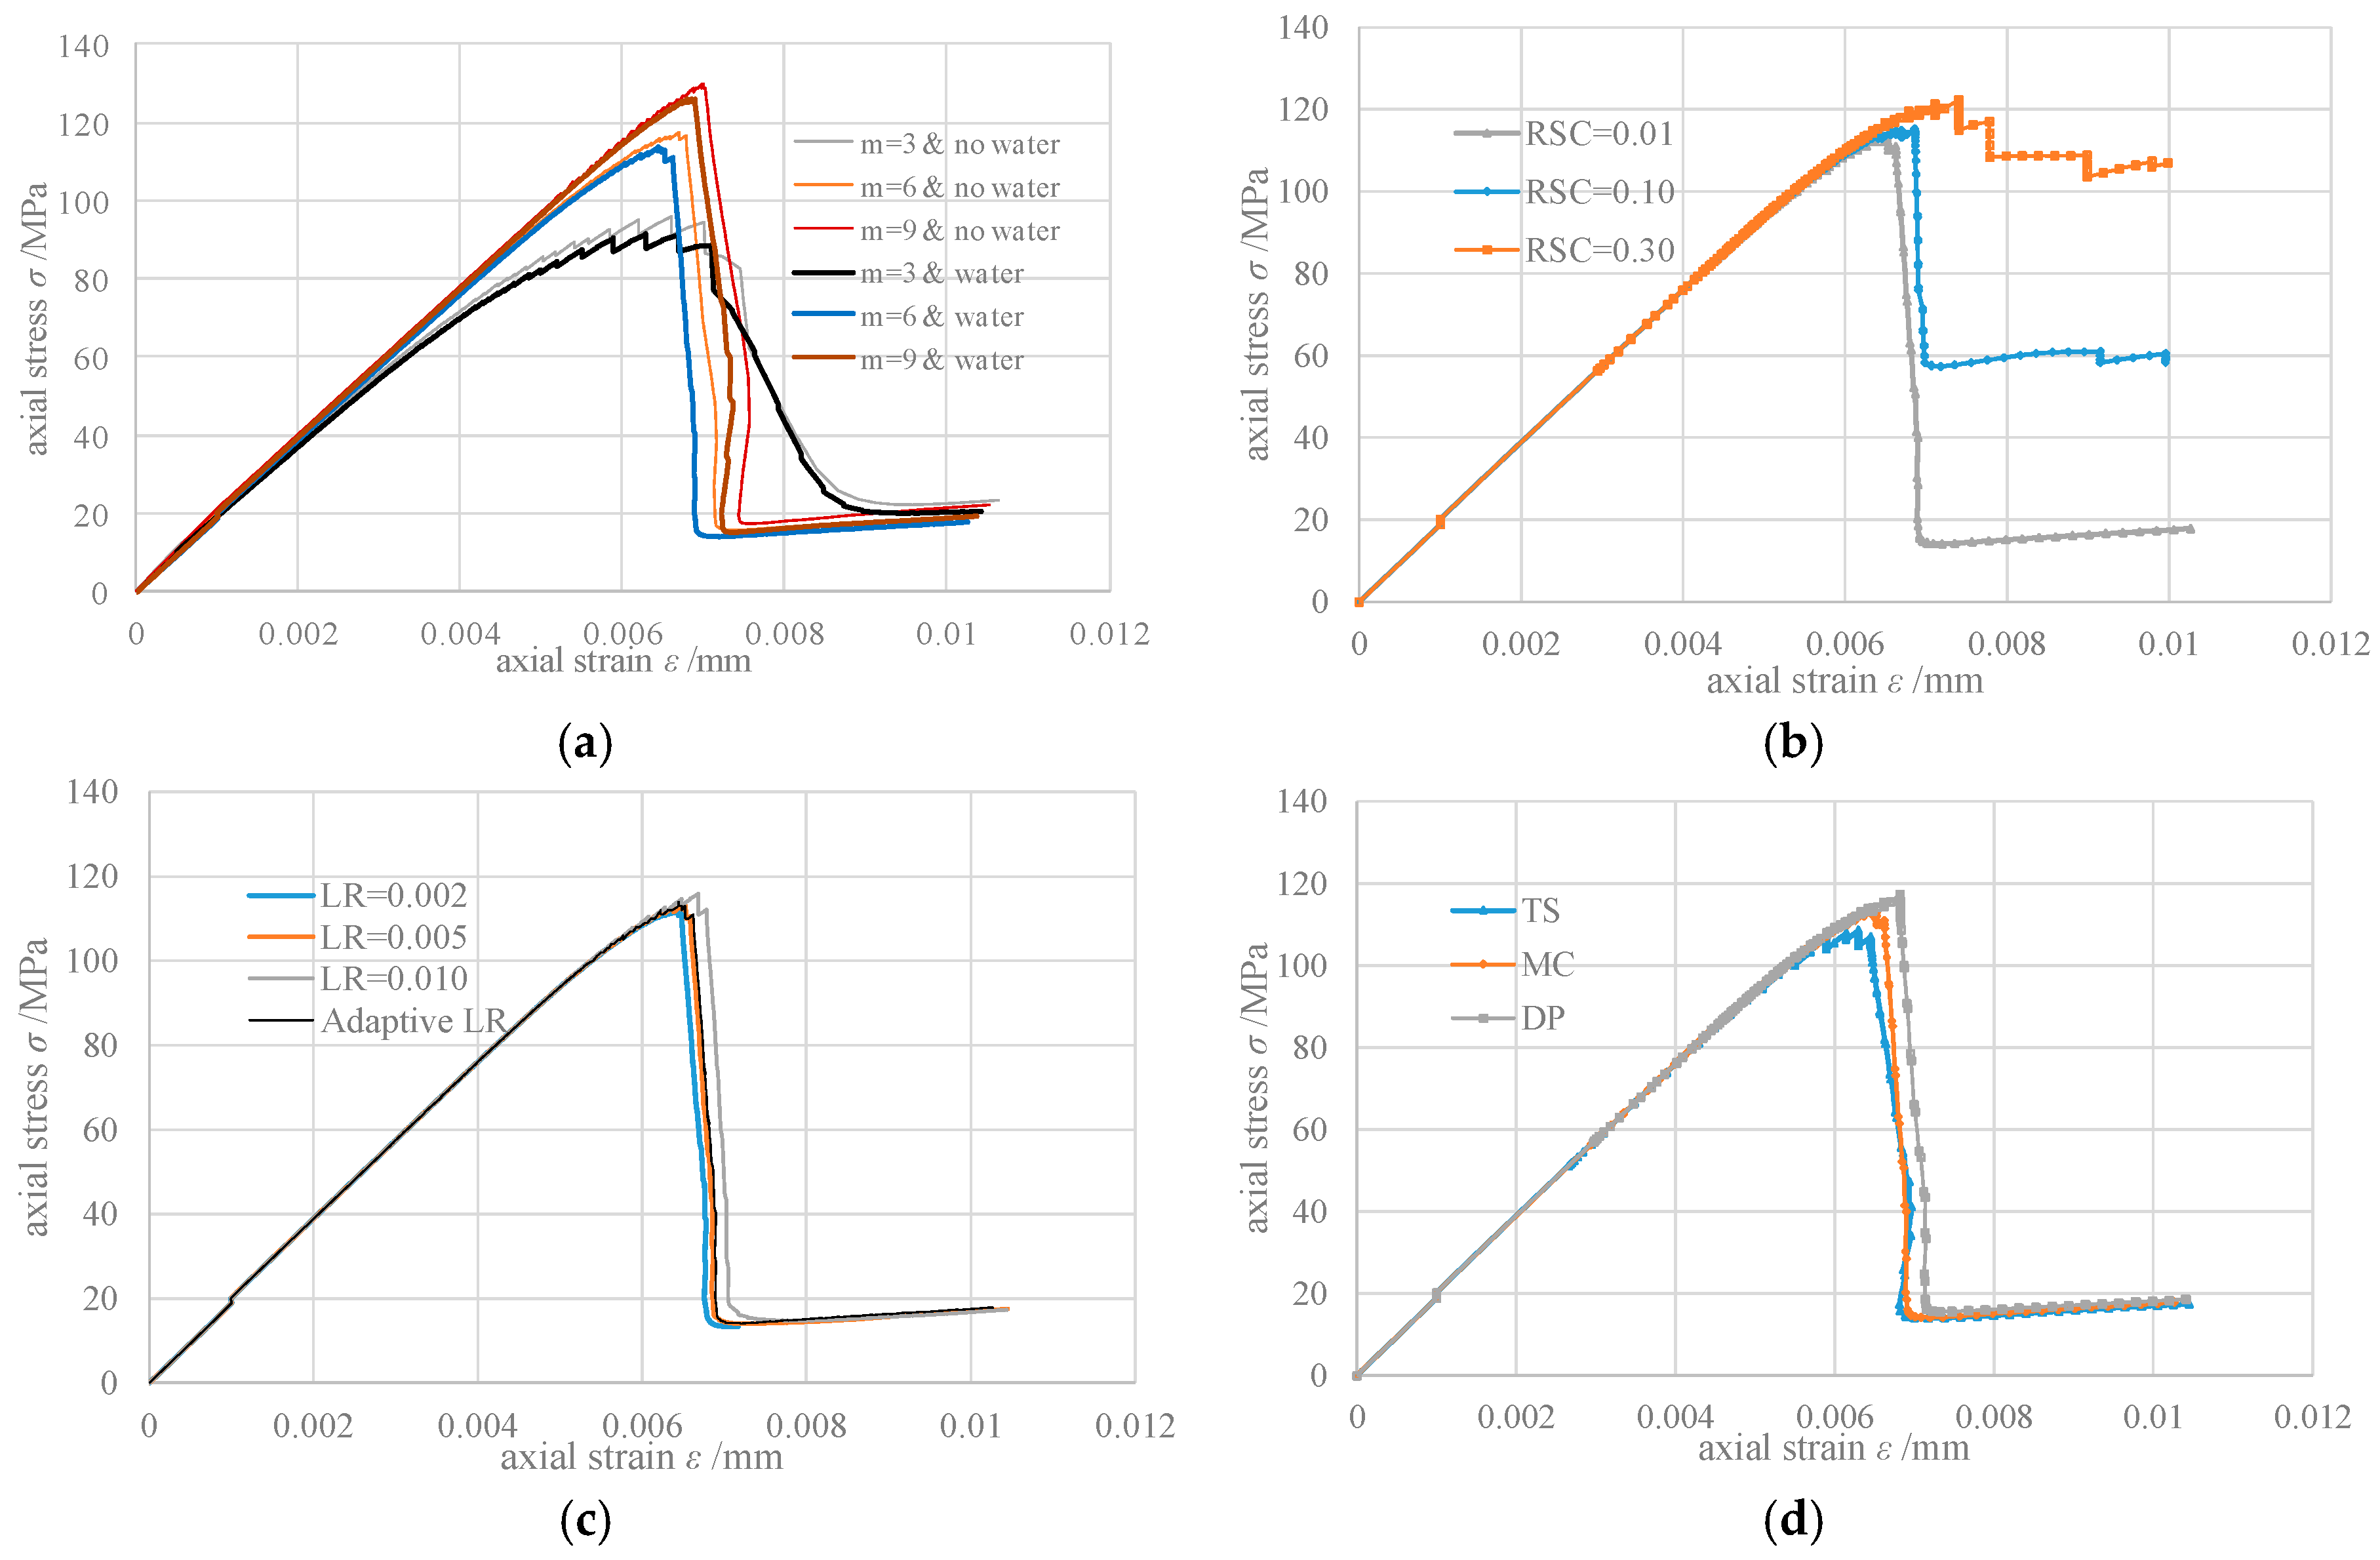
5.2. Effect of Different Parameters and Strength Criteria
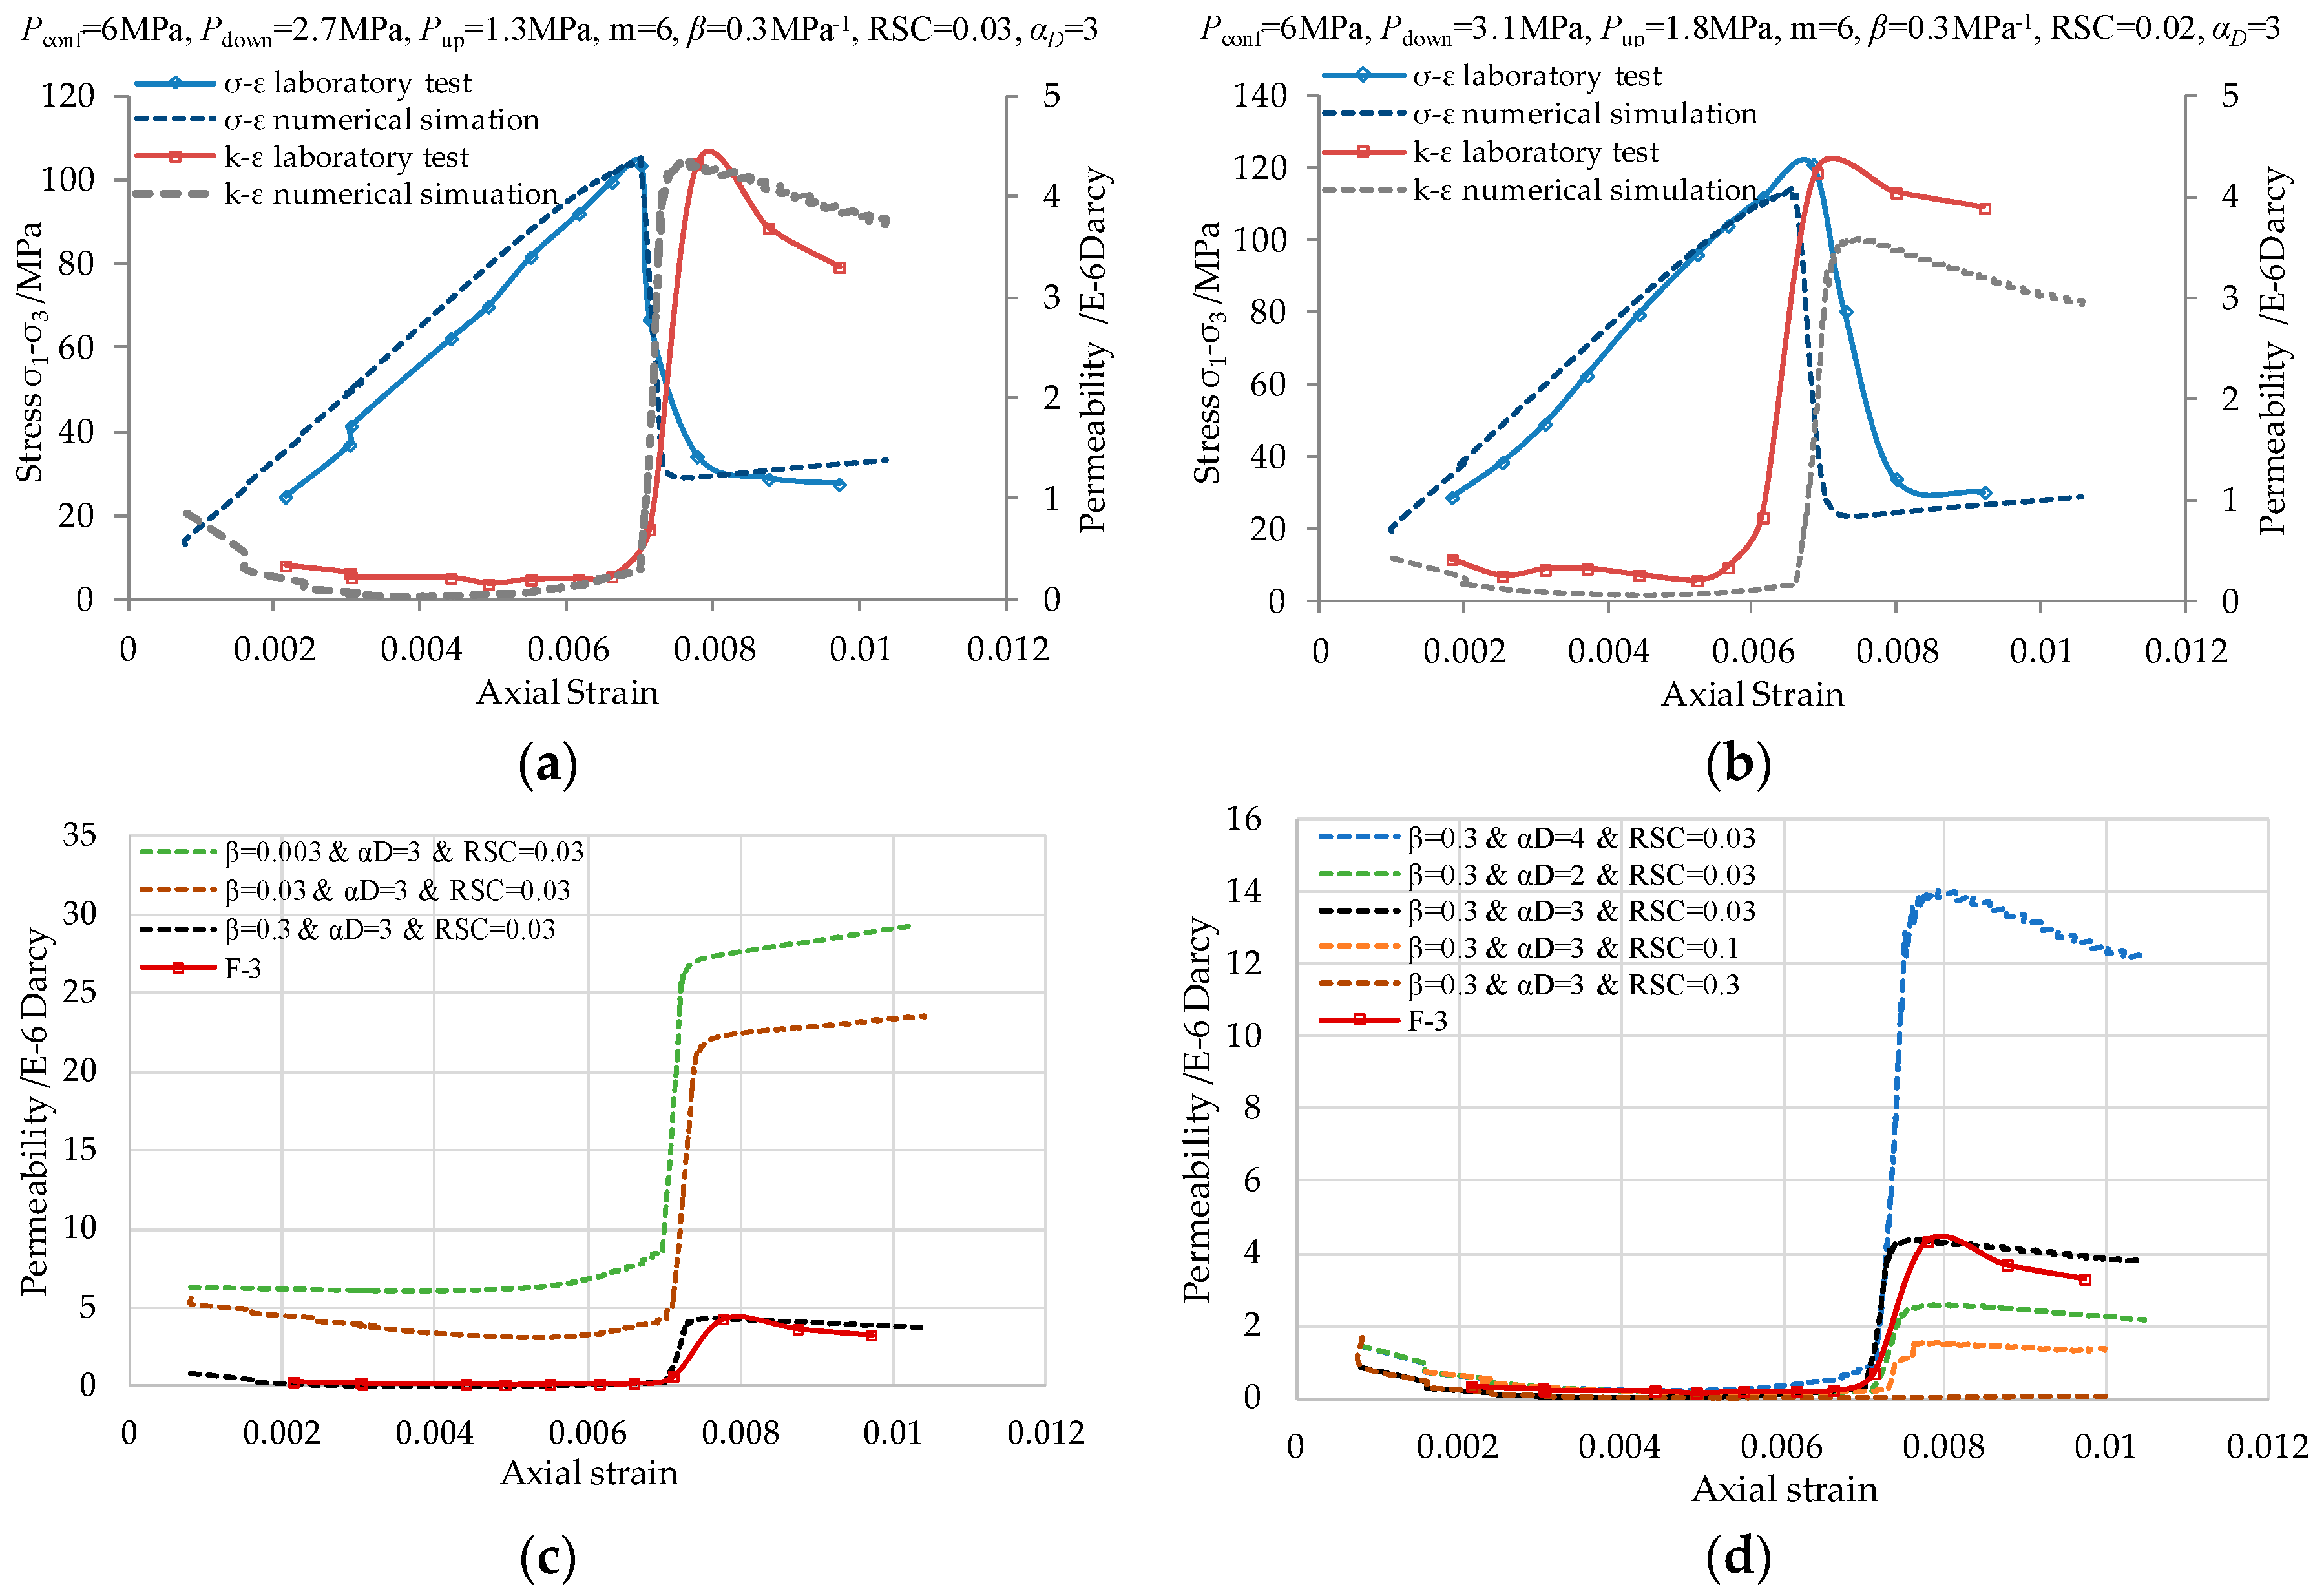
5.3. Relation of Permeability-Strain under Different Combined Variables
6. Conclusions
Author Contributions
Funding
Conflicts of Interest
References
- Li, L.C.; Tang, C.A.; Li, G.; Wang, S.Y.; Liang, Z.Z.; Zhang, Y.B. Numerical simulation of 3D hydraulic fracturing based on an improved flow-stress-damage model and a parallel fem technique. Rock Mech. Rock Eng. 2012, 45, 801–818. [Google Scholar] [CrossRef]
- Liang, Z.Z.; Xing, H.; Wang, S.Y.; Williams, D.J.; Tang, C.A. A three-dimensional numerical investigation of the fracture of rock specimens containing a pre-existing surface flaw. Comput. Geotech. 2012, 45, 19–33. [Google Scholar] [CrossRef]
- Gu, R.; Ozbay, U. Numerical investigation of unstable rock failure in underground mining condition. Comput. Geotech. 2015, 63, 171–182. [Google Scholar] [CrossRef]
- Li, L.C.; Tang, C.A.; Tham, L.G.; Yang, T.H.; Wang, S.H. Simulation of multiple hydraulic fracturing in non-uniform pore pressure field. Adv. Mater. Res. 2005, 9, 163–172. [Google Scholar] [CrossRef]
- Tang, C.A.; Tham, L.G.; Lee, P.K.K.; Yang, T.H.; Li, L.C. Coupled analysis of flow, stress and damage (FSD) in rock failure. Int. J. Rock Mech. Min. Sci. 2002, 39, 477–489. [Google Scholar] [CrossRef]
- Zhu, W.C.; Wei, C.H.; Li, S.; Wei, J.; Zhang, M.S. Numerical modeling on destress blasting in coal seam for enhancing gas drainage. Int. J. Rock Mech. Min. Sci. 2013, 59, 179–190. [Google Scholar] [CrossRef]
- Rutqvist, J.; Stephansson, O. The role of hydromechanical coupling in fractured rock engineering. Hydrogeol. J. 2003, 11, 7–40. [Google Scholar] [CrossRef]
- Li, S.; Li, Y.; Li, Y.; Wu, Z.; Zhou, G. Permeability-strain equations corresponding to the complete stress-strain path of yinzhuang sandstone. Int. J. Rock Mech. Min. Sci. Geomech. Abstr. 1994, 31, 383–391. [Google Scholar]
- Min, K.B.; Rutqvist, J.; Tsang, C.F.; Jing, L. Stress-dependent permeability of fractured rock masses: A numerical study. Int. J. Rock Mech. Min. Sci. 2004, 41, 1191–1210. [Google Scholar] [CrossRef]
- Liu, H.H.; Wei, M.Y.; Rutqvist, J. Normal-stress dependence of fracture hydraulic properties including two-phase flow properties. Hydrogeol. J. 2013, 21, 371–382. [Google Scholar] [CrossRef]
- Liu, L.Q.; Liu, P.X.; Wong, H.C.; Ma, S.P.; Guo, Y.S. Experimental investigation of three-dimensional propagation process from surface fault. Sci. China Ser. D Earth Sci. 2008, 51, 1426–1435. [Google Scholar] [CrossRef]
- Nasseri, M.H.B.; Goodfellow, S.D.; Lombos, L.; Young, R.P. 3-D transport and acoustic properties of fontainebleau sandstone during true-triaxial deformation experiments. Int. J. Rock Mech. Min. Sci. 2014, 69, 1–18. [Google Scholar] [CrossRef]
- Chen, C.S.; Pan, E.; Amadei, B. Fracture mechanics analysis of cracked discs of anisotropic rock using the boundary element method. Int. J. Rock Mech. Min. Sci. 1998, 35, 195–218. [Google Scholar] [CrossRef]
- Pan, P.Z.; Feng, X.T.; Hudson, J.A. Study of failure and scale effects in rocks under uniaxial compression using 3D cellular automata. Int. J. Rock Mech. Min. Sci. 2009, 46, 674–685. [Google Scholar] [CrossRef]
- Pogacnik, J.; Elsworth, D.; O’Sullivan, M.; O’Sullivan, J. A damage mechanics approach to the simulation of hydraulic fracturing/shearing around a geothermal injection well. Comput. Geotech. 2016, 71, 338–351. [Google Scholar] [CrossRef]
- Rozycki, P.; Moës, N.; Bechet, E.; Dubois, C. X-fem explicit dynamics for constant strain elements to alleviate mesh constraints on internal or external boundaries. Comput. Methods Appl. Mech. Eng. 2008, 197, 349–363. [Google Scholar] [CrossRef]
- Stead, D.; Eberhardt, E.; Coggan, J.S. Developments in the characterization of complex rock slope deformation and failure using numerical modelling techniques. Eng. Geol. 2006, 83, 217–235. [Google Scholar] [CrossRef]
- Yang, T.; Liu, H.Y.; Tang, C.A.; Yang, T.; Liu, H.Y.; Tang, C.A. Scale effect in macroscopic permeability of jointed rock mass using a coupled stress-damage-flow method. Eng. Geol. 2017, 228, 121–136. [Google Scholar] [CrossRef]
- Colombo, D.; Massin, P. Fast and robust level set update for 3D non-planar x-fem crack propagation modelling. Comput. Methods Appl. Mech. Eng. 2011, 200, 2160–2180. [Google Scholar] [CrossRef]
- Scholtès, L.; Donzé, F.V. Modelling progressive failure in fractured rock masses using a 3D discrete element method. Int. J. Rock Mech. Min. Sci. 2012, 52, 18–30. [Google Scholar] [CrossRef]
- Shi, G.H. Discontinuous deformation analysis: A new numerical model for the statics and dynamics of deformable block structures. Eng. Comput. 1992, 9, 157–168. [Google Scholar] [CrossRef]
- Cleary, P.W.; Sawley, M.L. Dem modelling of industrial granular flows: 3D case studies and the effect of particle shape on hopper discharge. Appl. Math. Model. 2002, 26, 89–111. [Google Scholar] [CrossRef]
- Park, J.W.; Song, J.J. Numerical simulation of a direct shear test on a rock joint using a bonded-particle model. Int. J. Rock Mech. Min. Sci. 2009, 46, 1315–1328. [Google Scholar] [CrossRef]
- Rui, Z.; Guo, T.; Feng, Q.; Qu, Z.; Qi, N.; Gong, F. Influence of gravel on the propagation pattern of hydraulic fracture in the glutenite reservoir. J. Pet. Sci. Eng. 2018, 165, 627–639. [Google Scholar] [CrossRef]
- Li, G.; Tang, C.A.; Li, L.C. Three-dimensional micro flow-stress-damage (FSD) model and application in hydraulic fracturing in brittle and heterogeneous rocks. Key Eng. Mater. 2010, 452–453, 581–584. [Google Scholar] [CrossRef]
- Wang, Y.; Li, X.; Hu, R.; Ma, C.; Zhao, Z.; Zhang, B. Numerical evaluation and optimization of multiple hydraulically fractured parameters using a flow-stress-damage coupled approach. Energies 2016, 9, 325. [Google Scholar] [CrossRef]
- Wang, L.; Liu, J.F.; Pei, J.L.; Xu, H.N.; Bian, Y. Mechanical and permeability characteristics of rock under hydro-mechanical coupling conditions. Environ. Earth Sci. 2015, 73, 5987–5996. [Google Scholar] [CrossRef]
- Sheng, J.; Xu, X.; Zhan, M.; He, S.; Su, B.; Liu, J. Permeability changes in a rock fracture during coupled fluid flow and chemical dissolution processes. In Advances in Water Resources & Hydraulic Engineering; Springer: Berlin, Germany, 2009; pp. 257–262. [Google Scholar]
- Weng, X.W.; Kresse, O.; Cohen, C.E.; Wu, R.T.; Gu, H.R. Modeling of hydraulic-fracture-network propagation in a naturally fractured formation. SPE Prod. Oper. 2011, 26, 368–380. [Google Scholar]
- Yang, T.; Jia, P.; Shi, W.; Wang, P.; Liu, H.; Yu, Q. Seepage-stress coupled analysis on anisotropic characteristics of the fractured rock mass around roadway. Tunn. Undergr. Space Technol. 2014, 43, 11–19. [Google Scholar] [CrossRef]
- Yew, C.H.; Weng, X.W. Mechanics of Hydraulic Fracturing; Gulf Professional Publishing: Houston, TX, USA, 2014. [Google Scholar]
- McClure, M.; Babazadeh, M.; Shiozawa, S.; Huang, J. Fully Coupled Hydromechanical Simulation of Hydraulic Fracturing in Three-Dimensional Discrete Fracture Networks; Society of Petroleum Engineers: The Woodlands, TX, USA, 2015. [Google Scholar]
- Noorishad, J.; Ayatollahi, M.; Witherspoon, P. In A finite-element method for coupled stress and fluid flow analysis in fractured rock masses. Int. J. Rock Mech. Min. Sci. Geomech. Abstr. 1982, 19, 185–193. [Google Scholar] [CrossRef]
- Mualem, Y. A new model for predicting the hydraulic conductivity of unsaturated porous media. Water Resour. Res. 1976, 12, 513–522. [Google Scholar] [CrossRef]
- Li, Y.; Chen, Y.F.; Zhou, C.B. Hydraulic properties of partially saturated rock fractures subjected to mechanical loading. Eng. Geol. 2014, 179, 24–31. [Google Scholar] [CrossRef]
- Cui, L.Z.; Abousleiman, Y. Time-dependent poromechanical responses of saturated cylinders. J. Eng. Mech. 2001, 127, 391–398. [Google Scholar] [CrossRef]
- Cryer, C.W. A comparison of the three-dimensional consolidation theories of biot and terzaghi. Q. J. Mech. Appl. Math. 1963, 16, 401–412. [Google Scholar] [CrossRef]
- Mandel, J. Consolidation des sols (étude mathématique). Geotechnique 1953, 3, 287–299. [Google Scholar] [CrossRef]
- Jaeger, J.C.; Cook, N.G.; Zimmerman, R.W. Fundamentals of Rock Mechanics; Blackwell Publishing: Singapore, 2007. [Google Scholar]
- Biot, M.A. General theory of three-dimensional consolidation. J. Appl. Phys. 1941, 12, 155–164. [Google Scholar] [CrossRef]
- Schulze, O.; Popp, T.; Kern, H. Development of damage and permeability in deforming rock salt. Eng. Geol. 2001, 61, 163–180. [Google Scholar] [CrossRef]
- Tang, C.A. Numerical simulation of progressive rock failure and associated seismicity. Int. J. Rock Mech. Min. Sci. 1997, 34, 249–261. [Google Scholar] [CrossRef]
- Zhu, W.C.; Tang, C.A. Micromechanical model for simulating the fracture process of rock. Rock Mech. Rock Eng. 2004, 37, 25–56. [Google Scholar] [CrossRef]
- Handin, J.; Heard, H.C.; Magouirk, J.N. Effects of the intermediate principal stress on the failure of limestone, dolomite, and glass at different temperatures and strain rates. J. Geophys. Res. 1967, 72, 611–640. [Google Scholar] [CrossRef]
- Mogi, K. Effect of the intermediate principal stress on rock failure. J. Geophys. Res. 1967, 72, 5117–5131. [Google Scholar] [CrossRef]
- Yu, M.H. Unified Strength Theory and Its Applications; Springer Science & Business Media: Berlin, Germany, 2011. [Google Scholar]
- Yu, M.H.; Zan, Y.W.; Zhao, J.; Yoshimine, M. A unified strength criterion for rock material. Int. J. Rock Mech. Min. Sci. 2002, 39, 975–989. [Google Scholar] [CrossRef]
- Detournay, E.; Cheng, A.H.D. Fundamentals of Poroelasticity. Chapter 5 in Comprehensive Rock Engineering: Principles, Practice and Projects, II. Available online: http://www.olemiss.edu/projects/sciencenet/poronet/fundporo.pdf (accessed on 31 May 2018).
- Li, L.C.; Yang, T.H.; Liang, Z.Z.; Zhu, W.C.; Tang, C.A. Numerical investigation of groundwater outbursts near faults in underground coal mines. Int. J. Coal Geol. 2011, 85, 276–288. [Google Scholar]
- Yang, T.H.; Xu, T.; Liu, H.Y.; Tang, C.A.; Shi, B.M.; Yu, Q.X. Stress–damage–flow coupling model and its application to pressure relief coal bed methane in deep coal seam. Int. J. Coal Geol. 2011, 86, 357–366. [Google Scholar] [CrossRef]
- Louis, C. Rock Hydraulics; Springer: Vienna, Austria, 1972; pp. 77–82. [Google Scholar]
- Chilingar, G.V. Relationship between porosity, permeability, and grain-size distribution of sands and sandstones. Dev. Sedimentol. 1964, 1, 71–75. [Google Scholar]
- Cui, X.J.; Bustin, R.M. Volumetric strain associated with methane desorption and its impact on coalbed gas production from deep coal seams. AAPG Bull. 2005, 89, 1181–1202. [Google Scholar] [CrossRef]
- Harpalani, S.; Schraufnagel, A. Measurement of parameters impacting methane recovery from coal seams. Int. J. Min. Geol. Eng. 1990, 8, 369–384. [Google Scholar] [CrossRef]
- Liu, J.S.; Chen, Z.W.; Elsworth, D.; Qu, H.Y.; Chen, D. Interactions of multiple processes during cbm extraction: A critical review. Int. J. Coal Geol. 2011, 87, 175–189. [Google Scholar] [CrossRef]
- Shi, J.Q.; Durucan, S. Drawdown induced changes in permeability of coalbeds: A new interpretation of the reservoir response to primary recovery. Transp. Porous Media 2004, 56, 1–16. [Google Scholar] [CrossRef]
- Wei, C.H.; Zhu, W.C.; Yu, Q.L.; Xu, T.; Jeon, S. Numerical simulation of excavation damaged zone under coupled thermal–mechanical conditions with varying mechanical parameters. Int. J. Rock Mech. Min. Sci. 2015, 75, 169–181. [Google Scholar] [CrossRef]
- Barber, B. The effect of weathering on pore geometry and compressive strength of selected rock types from turkey. Eng. Geol. 2004, 75, 215–227. [Google Scholar]
- Griffiths, L.; Heap, M.J.; Xu, T.; Chen, C.; Baud, P. The influence of pore geometry and orientation on the strength and stiffness of porous rock. J. Struct. Geol. 2017, 96, 149–160. [Google Scholar] [CrossRef]
- Sabatakakis, N.; Koukis, G.; Tsiambaos, G.; Papanakli, S. Index properties and strength variation controlled by microstructure for sedimentary rocks. Eng. Geol. 2008, 97, 80–90. [Google Scholar] [CrossRef]
- Comsol, A. Comsol Multiphysics (Version 5.3a) User Guide and Reference Guide. Available online: https://www.comsol.com/forum/thread/161042/comsol-5-3_-matlab-livelink-user-s-guide (accessed on 30 May 2018).
- Liang, Z.Z.; Tang, C.A.; Li, H.X.; Xu, T.; Zhang, Y.B. Numerical simulation of 3-D failure process in heterogeneous rocks. Int. J. Rock Mech. Min. Sci. 2004, 41, 323–328. [Google Scholar] [CrossRef]


| Lithology | Number | Confining Pressure/MPa | Inlet Water Pressure/MPa | Differential Pressure/MPa | Peak Stress/MPa | Peak Strain/ × 10−3 | Permeability/ × 10−6 Darcy |
|---|---|---|---|---|---|---|---|
| Sandstone | F-1 | 6.0 | 1.8 | 0.5 | 97.58 | 5.602 | 0.2169–0.3387 |
| F-2 | 6.0 | 2.3 | 1.0 | 93.09 | 5.297 | 0.2093–8.5461 | |
| F-3 | 6.0 | 2.7 | 1.4 | 101.64 | 7.004 | 0.1499–4.3382 | |
| F-4 | 6.0 | 3.1 | 1.8 | 121.38 | 6.84 | 0.2018–4.2451 | |
| E-1 | 6.0 | 2.8 | 1.5 | 139.75 | 5.84 | 0.9075–7.8942 | |
| E-2 | 8.0 | 2.8 | 1.5 | 151.05 | 6.01 | 0.0406–3.5561 | |
| E-3 | 10.0 | 2.8 | 1.5 | 159.42 | 5.29 | 0.0514–3.1963 |
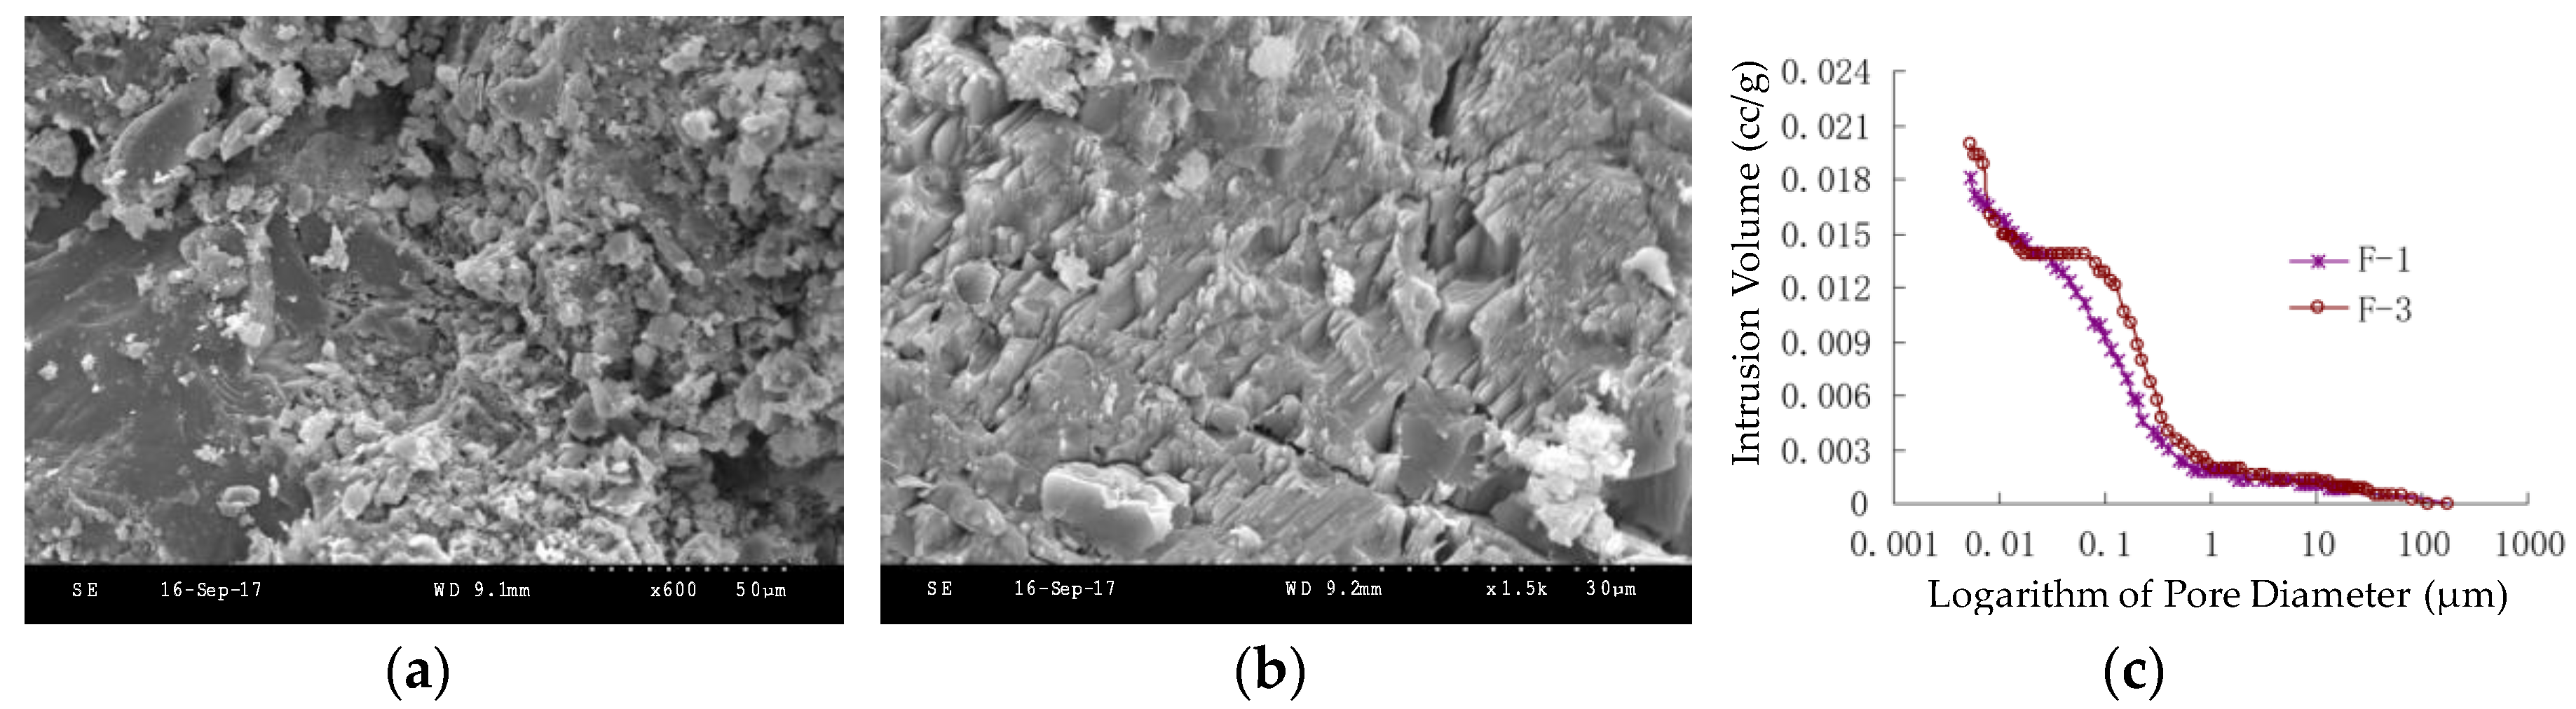
| Number | Sample Weight (g) | Intrusion Volume (cc/g) | Volume Percentage of Different Pore Diameters (%) | Porosity (%) | |||
|---|---|---|---|---|---|---|---|
| 0–1 | 1–10 | 10–100 | 100–1000 | ||||
| (µm) | (µm) | (µm) | (µm) | ||||
| F-1 | 3.6715 | 0.0181 | 90.06 | 3.87 | 3.87 | 2.21 | 4.59 |
| F-3 | 3.8185 | 0.0200 | 87.00 | 6.00 | 6.00 | 1.00 | 5.05 |
| Parameters | Symbol | Value |
|---|---|---|
| Homogeneity index | m | 6 |
| Elasticity modulus | E | 20 GPa |
| Poisson’s ratio | ν | 0.18 |
| Compressive strength | σc | 170 MPa |
| Tensile strength | σt | 17 MPa |
| Frictional angle | φ | 30° |
| Initial permeability | k0 | 2 × 10⁻⁶ Darcy |
© 2018 by the authors. Licensee MDPI, Basel, Switzerland. This article is an open access article distributed under the terms and conditions of the Creative Commons Attribution (CC BY) license (http://creativecommons.org/licenses/by/4.0/).
Share and Cite
Chen, S.; Wei, C.; Yang, T.; Zhu, W.; Liu, H.; Ranjith, P.G. Three-Dimensional Numerical Investigation of Coupled Flow-Stress-Damage Failure Process in Heterogeneous Poroelastic Rocks. Energies 2018, 11, 1923. https://doi.org/10.3390/en11081923
Chen S, Wei C, Yang T, Zhu W, Liu H, Ranjith PG. Three-Dimensional Numerical Investigation of Coupled Flow-Stress-Damage Failure Process in Heterogeneous Poroelastic Rocks. Energies. 2018; 11(8):1923. https://doi.org/10.3390/en11081923
Chicago/Turabian StyleChen, Shikuo, Chenhui Wei, Tianhong Yang, Wancheng Zhu, Honglei Liu, and Pathegama Gamage Ranjith. 2018. "Three-Dimensional Numerical Investigation of Coupled Flow-Stress-Damage Failure Process in Heterogeneous Poroelastic Rocks" Energies 11, no. 8: 1923. https://doi.org/10.3390/en11081923
APA StyleChen, S., Wei, C., Yang, T., Zhu, W., Liu, H., & Ranjith, P. G. (2018). Three-Dimensional Numerical Investigation of Coupled Flow-Stress-Damage Failure Process in Heterogeneous Poroelastic Rocks. Energies, 11(8), 1923. https://doi.org/10.3390/en11081923