Article

Effect of Blade Pitch Angle on the Aerodynamic Characteristics of a Straight-bladed Vertical Axis Wind Turbine Based on Experiments and Simulations

1
College of Mechanical Engineering, Inner Mongolia University of Technology, Hohhot 010051, China
2
Graduate School of Bioresources, Mie University, 1577 Kurimamachiya-cho, Tsu, Mie 514-8507, Japan
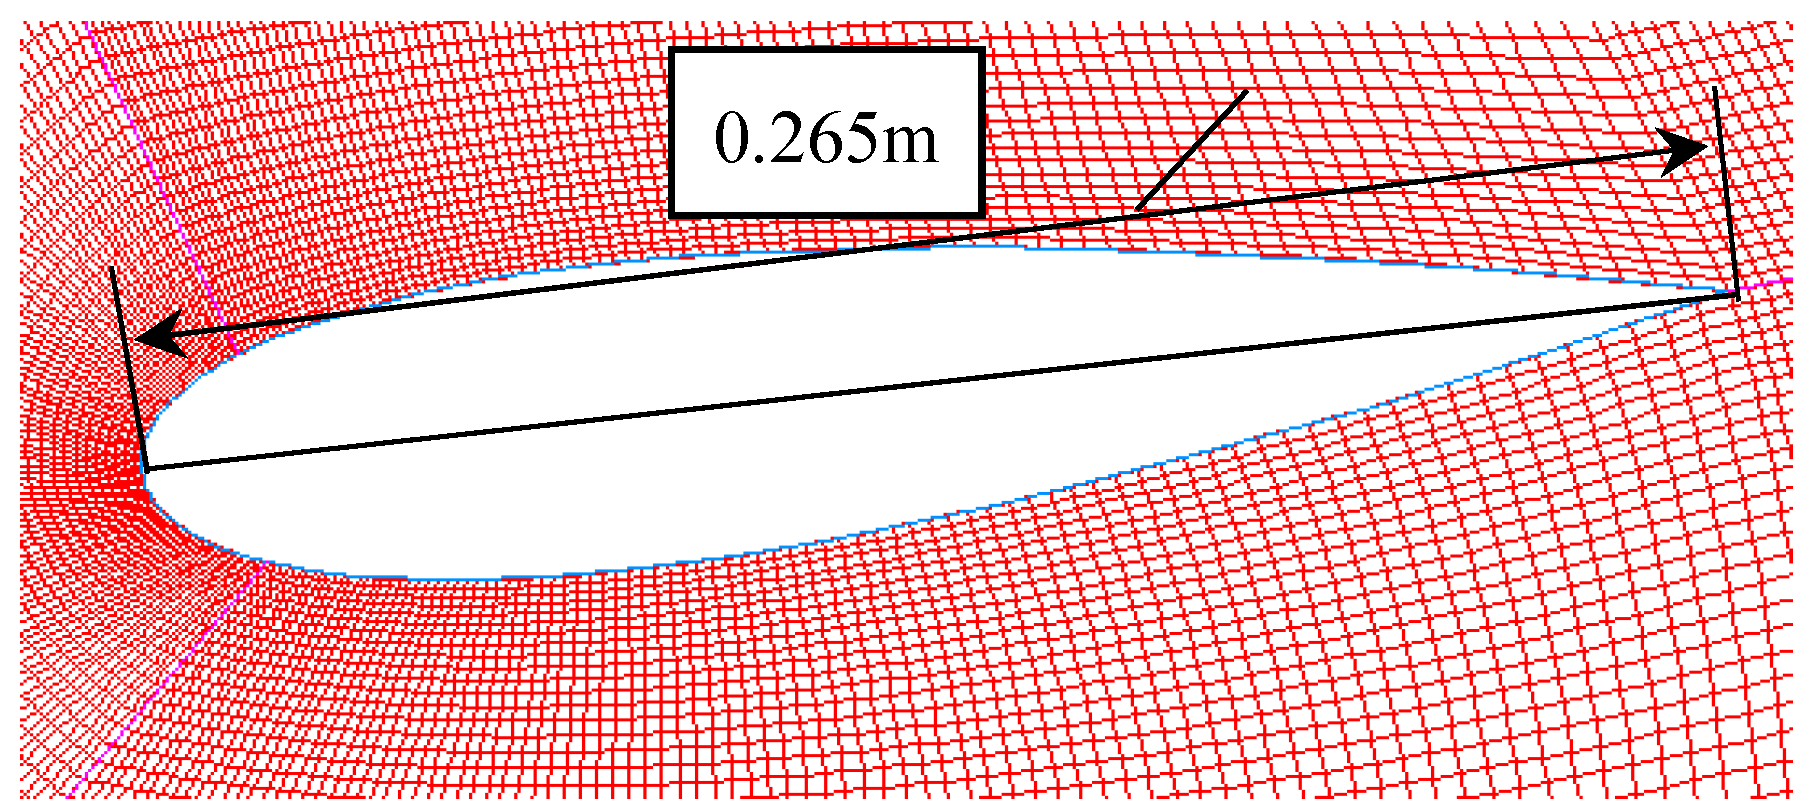
3
School of Electrical Engineering, University of Jinan, Jinan 250022, China
4
CAS Laboratory of Wind Energy Utilization, Institute of Engineering Thermophysics, Chinese Academy of Sciences, Beijing 100190, China
5
Division of Mechanical Engineering, Mie University, 1577 Kurimamachiya-cho, Tsu, Mie 514-8507, Japan
*
Author to whom correspondence should be addressed.
Energies 2018, 11(6), 1514; https://doi.org/10.3390/en11061514
Submission received: 22 April 2018 / Revised: 23 May 2018 / Accepted: 30 May 2018 / Published: 11 June 2018

Abstract

:
The blade pitch angle has a significant influence on the aerodynamic characteristics of horizontal axis wind turbines. However, few research results have revealed its impact on the straight-bladed vertical axis wind turbine (Sb-VAWT). In this paper, wind tunnel experiments and CFD simulations were performed at the Sb-VAWT to investigate the effect of different blade pitch angles on the pressure distribution on the blade surface, the torque coefficient, and the power coefficient. In this study, the airfoil type was NACA0021 with two blades. The Sb-VAWT had a rotor radius of 1.0 m with a spanwise length of 1.2 m. The simulations were based on the k-ω Shear Stress Transport (SST) turbulence model and the wind tunnel experiments were carried out using a high-speed multiport pressure device. As a result, it was found that the maximum pressure difference on the blade surface was obtained at the blade pitch angle of β = 6° in the upstream region. However, the maximum pressure coefficient was shown at the blade pitch angle of β = 8° in the downstream region. The torque coefficient acting on a single blade reached its maximum value at the blade pitch angle of β = 6°. As the tip speed ratio increased, the power coefficient became higher and reached the optimum level. Subsequently, further increase of the tip speed ratio only led to a quick reversion of the power coefficient. In addition, the results from CFD simulations had also a good agreement with the results from the wind tunnel experiments. As a result, the blade pitch angle did not have a significant influence on the aerodynamic characteristics of the Sb-VAWT.

1. Introduction

Wind power technology, which utilizes the renewable clean energy, has been regarded as an important way to alleviate the energy crisis and environmental pollution [1,2,3,4,5]. After hundreds of years, as shown in Figure 1, there are presently two main types of wind turbines: horizontal axis wind turbines (HAWTs) and vertical axis wind turbine (VAWTs) [6,7]. Currently, the large-type HAWT is very popular, but it is mainly installed in mountains, grasslands and oceans, where the infrastructure costs are very high. Moreover, there is an inevitable transmission loss of power because the wind turbines are far away from the power demand centers [8,9,10]. Straight-bladed vertical axis wind turbines (Sb-VAWTs) have been favored by global researchers due to their low production cost and insensitivity to high turbulence intensity in cities [11,12,13].
For HAWT, the International Electrotechnical Commission (IEC) has developed a set of uniform design standards [14]. However, the research progress on VAWTs is relatively slow compared with HAWTs. Up to now, uniform worldwide design standard has not been established. For the Sb-VAWT, the blade pitch angle is one of the basic parameters [15]. It is also a factor with a direct impact on the flow field around the blade, which then affects the pressure distribution on the blade surface, which may lead to a change in the lift-to-drag ratio of the blade and power coefficient of the wind turbine [16].
In the study of Sb-VAWT standardization, researchers have achieved remarkable results. In 2013 Conaill et al. characterized the relationship between the Sb-VAWT design parameters and the best performance based on the averaged moment values [17]. It was found that the lift-to-drag ratio had an effect on the rotating rotor speed of the Sb-VAWT and the peak value of the power output coefficient. As the rotating rotor speed of the Sb-VAWT gets faster, the lift-to-drag ratio increased. Maeda et al. [18] in 2013 studied the effect of the rotor angular frequency of the Sb-VAWT on the pressure distribution acting on the blade surface by using a high-speed multiport pressure device and a torque meter. This experiment revealed that the tip speed ratio increased with the increase of the pressure difference on the blade surface. Based on this experiment, Li et al. [19] in 2015 further investigated the influence of the number of blades on the aerodynamic characteristics of the Sb-VAWT via a torque meter. The results of this experiment showed that the peak value of the power coefficient of the Sb-VAWT decreased with the increase of the number of blades. Sun et al. [20] in 2016 and Battisti et al. [21] in 2016 also obtained a similar conclusion by conducting wind tunnel experiments and CFD simulations. Abu-El-Yazied et al. [22] performed in 2015 CFD simulations to verify the conclusions, and analyzed the influence of various lengths of blade chords on the power coefficient of the SB-VAWT. They found that the power coefficient decreased with the increase of the chord length.
In order to analyze the effect of blade solidity on the power coefficient of the Sb-VAWT, Roh and Kang et al. [23] in 2013 investigated the aerodynamic characteristics of the NACA0015 airfoil at the Reynolds number of Re = 3.6 × 10⁵ in reference to the multiple streamtube model. When the blade solidities were 0.251, 0.333, 0.417, and 0.500, the maximum values of the power coefficient of the wind turbine were around 0.48, 0.47, 0.40, and 0.27, respectively. Li et al. also verified this conclusion via wind tunnel experiments [24] and the panel method [25], from which the maximum value of power coefficient decreased with the increase of the blade solidity.
Islam et al. [26] in 2007 evaluated the effects of the NACA0012, NACA0022, NACA5522 and LS0421 airfoils on the power coefficient of the Sb-VAWT via CFD simulations. The results showed that the power coefficient of the high-thickness NACA00XX was higher than that of the low-thickness NACA00XX, and the total output power of the symmetrical airfoil was higher than that of the asymmetric airfoil. Danao et al. [27] in 2012, concluded that the NACA0012 was the optimal airfoil of the Sb-VAWT [27]. Iida et al. [28] in 2003, Claessens et al. [29] in 2006, and Armstrong et al. [30] in 2011 used wind tunnel experiments and CFD simulations to analyze the influence of the Reynolds number on the energy conversion of the Sb-VAWT. Their studies found that with the increase of Reynolds number, the wind energy utilization of the Sb-VAWT increased and the optimal tip speed ratio decreased.
In summary, the current research on design parameters such as rotor diameter, airfoil, the number of blade, blade solidity, etc. has achieved significant results. However, studies on the blade pitch angle of the Sb-VAWT by using CFD simulations and wind tunnel experiments are few. Therefore, the objectives of this research are to clarify the influence of the blade pitch angle on the aerodynamic characteristics of the Sb-VAWT and look for the optimal blade pitch angle by using CFD simulations and wind tunnel experiments. In order to investigate in detail the aerodynamic characteristics of the Sb-VAWT at different blade pitch angles, pressure distribution on blade surface, torque coefficient, and power coefficient will be analyzed.
The outline of the following work is shown as follows: Firstly, the pressure distributions at the blade pitch angles of β = 4°, 6°, and 8° are compared and analyzed in order to investigate the effect of blade pitch angle on aerodynamic characteristics of the Sb-VAWT. Secondly, the torque coefficients acting on the single blade are discussed at the blade pitch angles of β = 4°, 6°, and 8°. Besides, the torque coefficients acting on the single blade calculated by CFD simulations are compared with high-speed multiport pressure device at the blade pitch angle of β = 6°. Finally, the optimal blade pitch angle is studied from the aspect of the power coefficient of wind turbine. The power coefficients of wind turbine are compared with torque meter in wind tunnel experiments and CFD simulations, respectively.

2. Theories and Methods

2.1. Theories

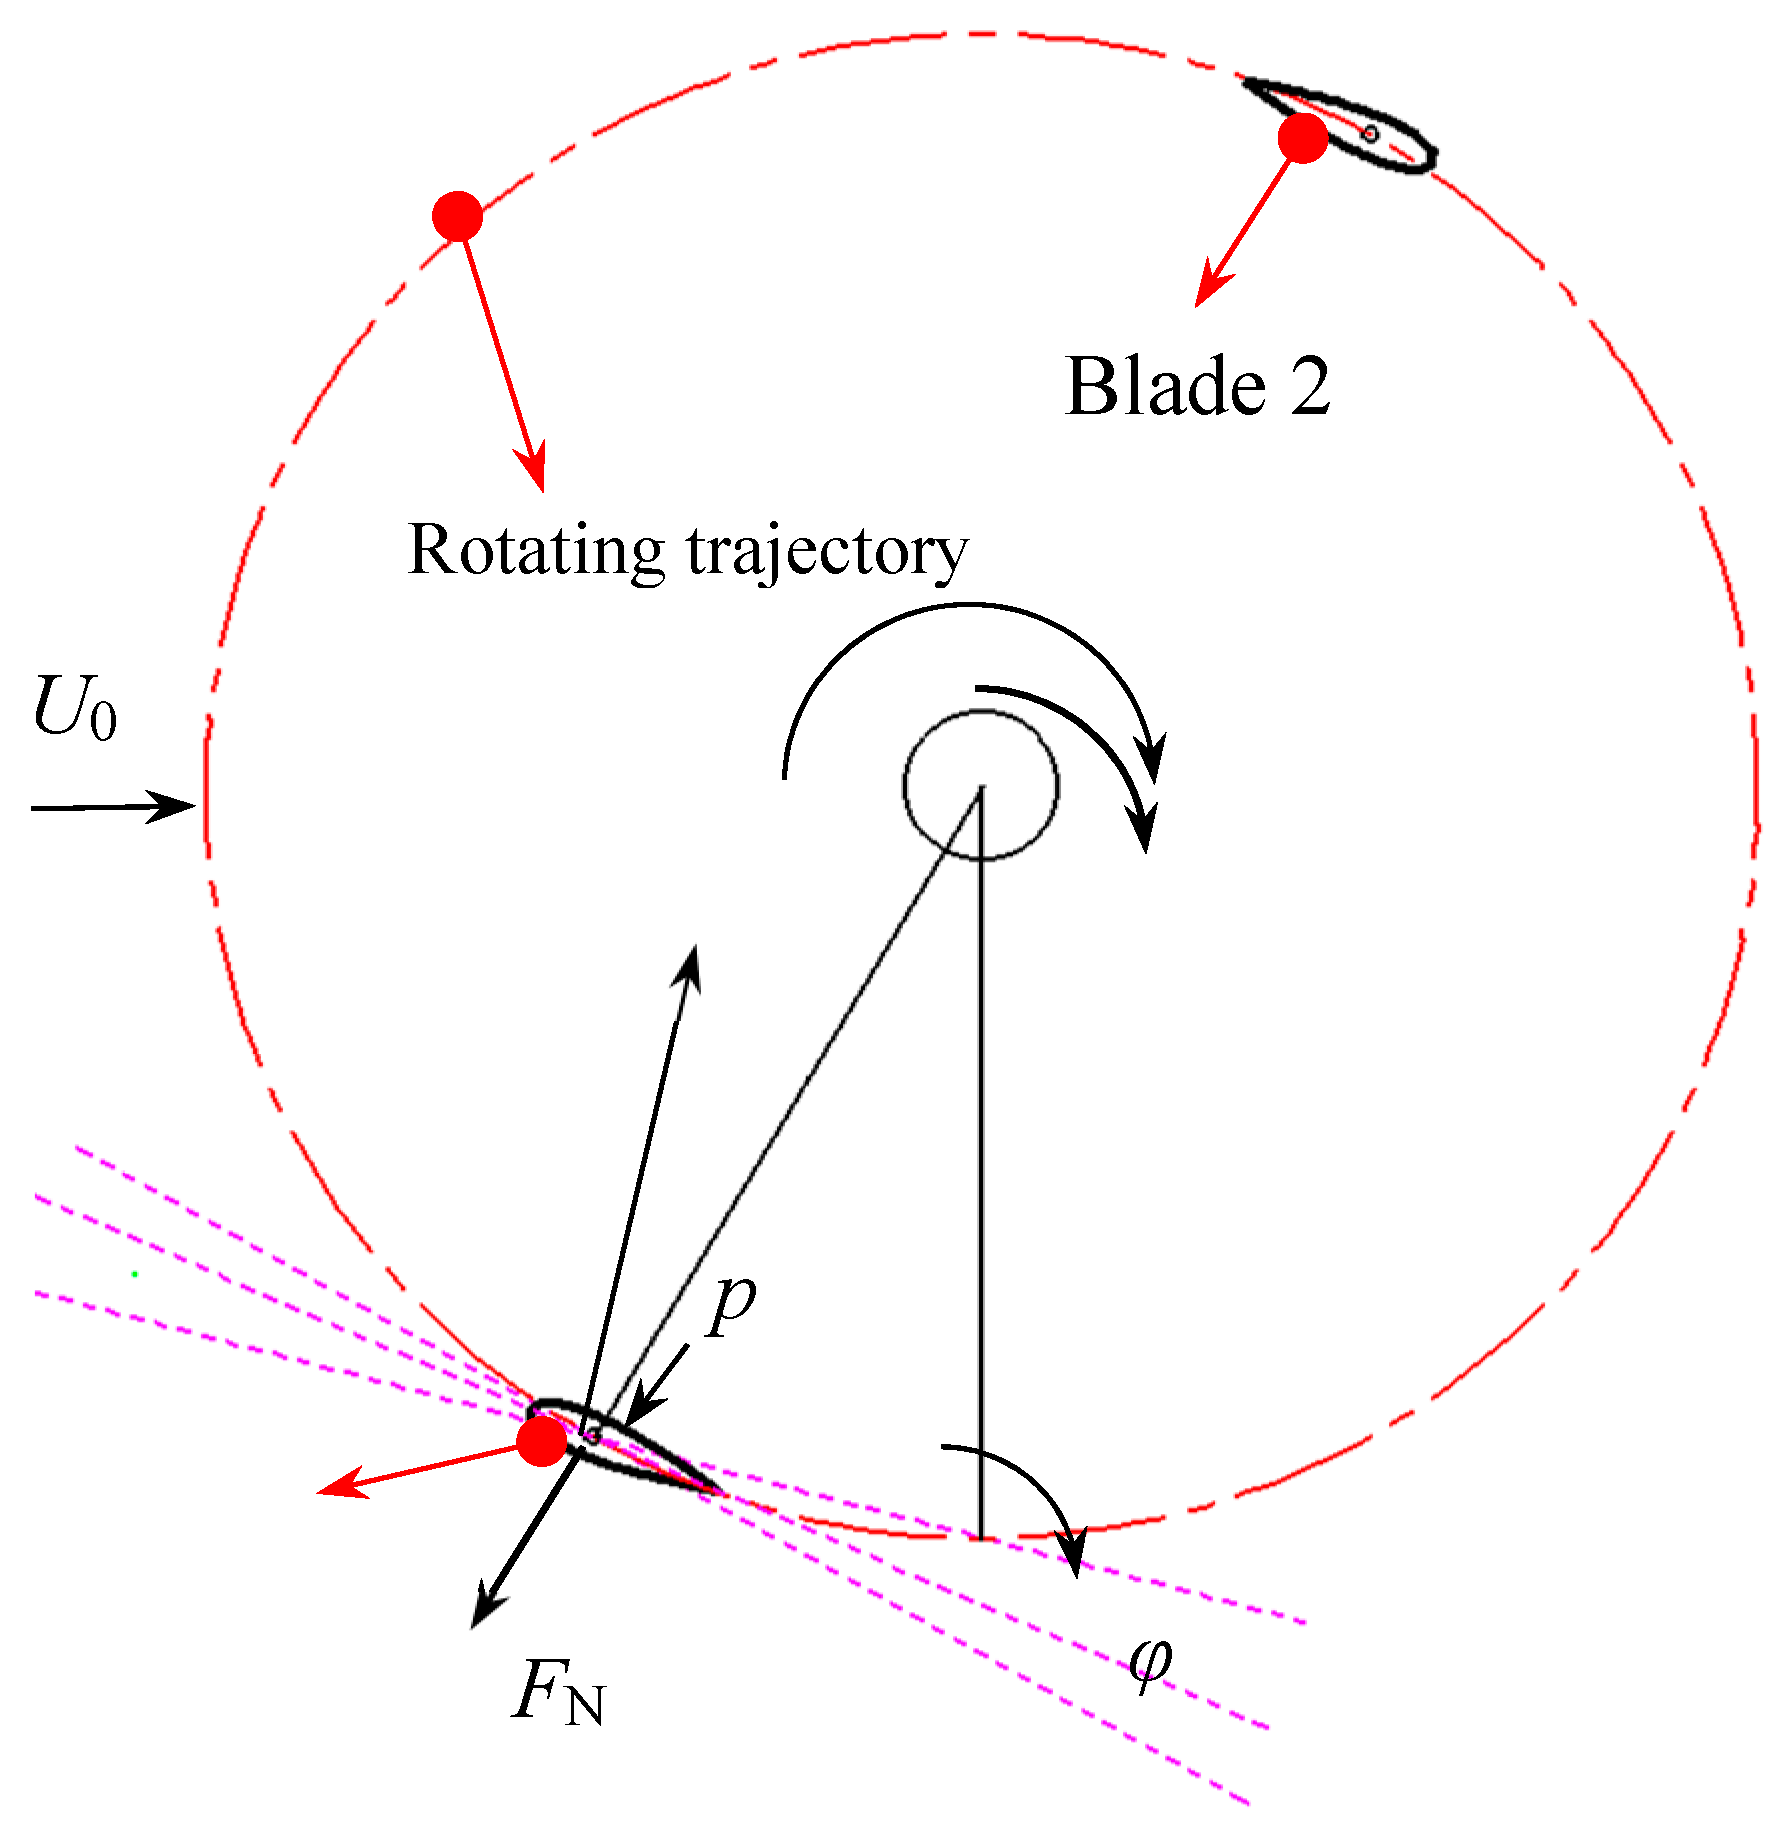
In order to study the effect of the blade pitch angle of the Sb-VAWT on the power coefficient, the mathematical model of aerodynamics should be analyzed. As shown in Figure 2, the dotted circle is the rotating shaft of the rotor and θ is the azimuth angle. The direction of the mainstream wind velocity U0 flows from left to right and the rotating direction of the rotor is clockwise viewed from topside of wind turbine. V and W are the tangential velocity of the blade and the resultant flow velocity to blade, respectively. The resultant flow velocity to blade W is expressed with the tangential velocity V and the mainstream wind velocity U0 as:
W = U 0 + V
The blade angle of attack α is the angle between the resultant flow velocity to blade and the blade chord. The blade pitch angle β is the angle between the tangential velocity V of the blade and the blade chord. φ is the angle between the resultant flow velocity to blade W and the tangential velocity V, which can be expressed as:
φ = α + β
P is the pressure acting on the blade surface and it is perpendicular to the blade surface. The pressure coefficient acting on the blade surface Cp is expressed as:
C p = P 0.5 ρ U 0 2
where, ρ represents the air density. Tangential force can be obtained from the following expression:
F T = F l sin φ F d cos φ
where, Fl is the lifting force of the blade and its direction is perpendicular to the blade chord. Fd is the drag force of the blade and its direction is parallel to the blade chord.
The torque of the single blade Q is generated by the tangential force of the blade. Therefore, Q can be expressed with the tangential force FT as:
Q = R 2 π 0 2 π F T ( θ ) d θ
Hence, the torque coefficient CQ is defined as:
C Q = N Q 0.5 ρ A U 0 2 R 0 = N Q 0.5 ρ D H U 0 2 R 0
where, N and R0 represent the number of blades and the rotor radius. D and H represent the rotor diameter and the Spanwise length, respectively. According to the rotor torque, the power coefficient CPower can be determined by the following equation:
C P o w e r = N Q ω 0.5 ρ D H U 0 3
where, ω is the angular frequency of the rotor.

2.2. Methods

In this paper, the influence of the blade pitch angle on the aerodynamic characteristics of the Sb-VAWT is investigated by using CFD simulations. The aerodynamic characteristics of the Sb-VAWT include the pressure distribution, the torque coefficient and the power coefficient. The CFD simulations are performed in the three-dimensional numerical model; it adopts sliding mesh technology, k-ω Shear Stress Transport (SST) turbulence model and the SAMPLE iterative algorithm for numerical calculation. The sliding mesh technique is commonly used in CFD simulations for simulating the aerodynamic characteristics of the Sb-VAWT. According to reference [31], the CFD simulations of the Sb-VAWT can obtain a high computational accuracy under the constant speed of the rotor. As can be seen from reference [32], the k-ω SST turbulence model combines the advantages of the standard k-ω and the standard k-ε turbulence models, and it includes the modified turbulent viscosity formula, which takes into account the effect of turbulence shear stress, being able to more accurately simulate the size of the separation point and separation zone caused by the negative pressure gradient. It also has the advantages of adaptive filtering for the boundary layer and less sensitivity to the quality of the mesh.
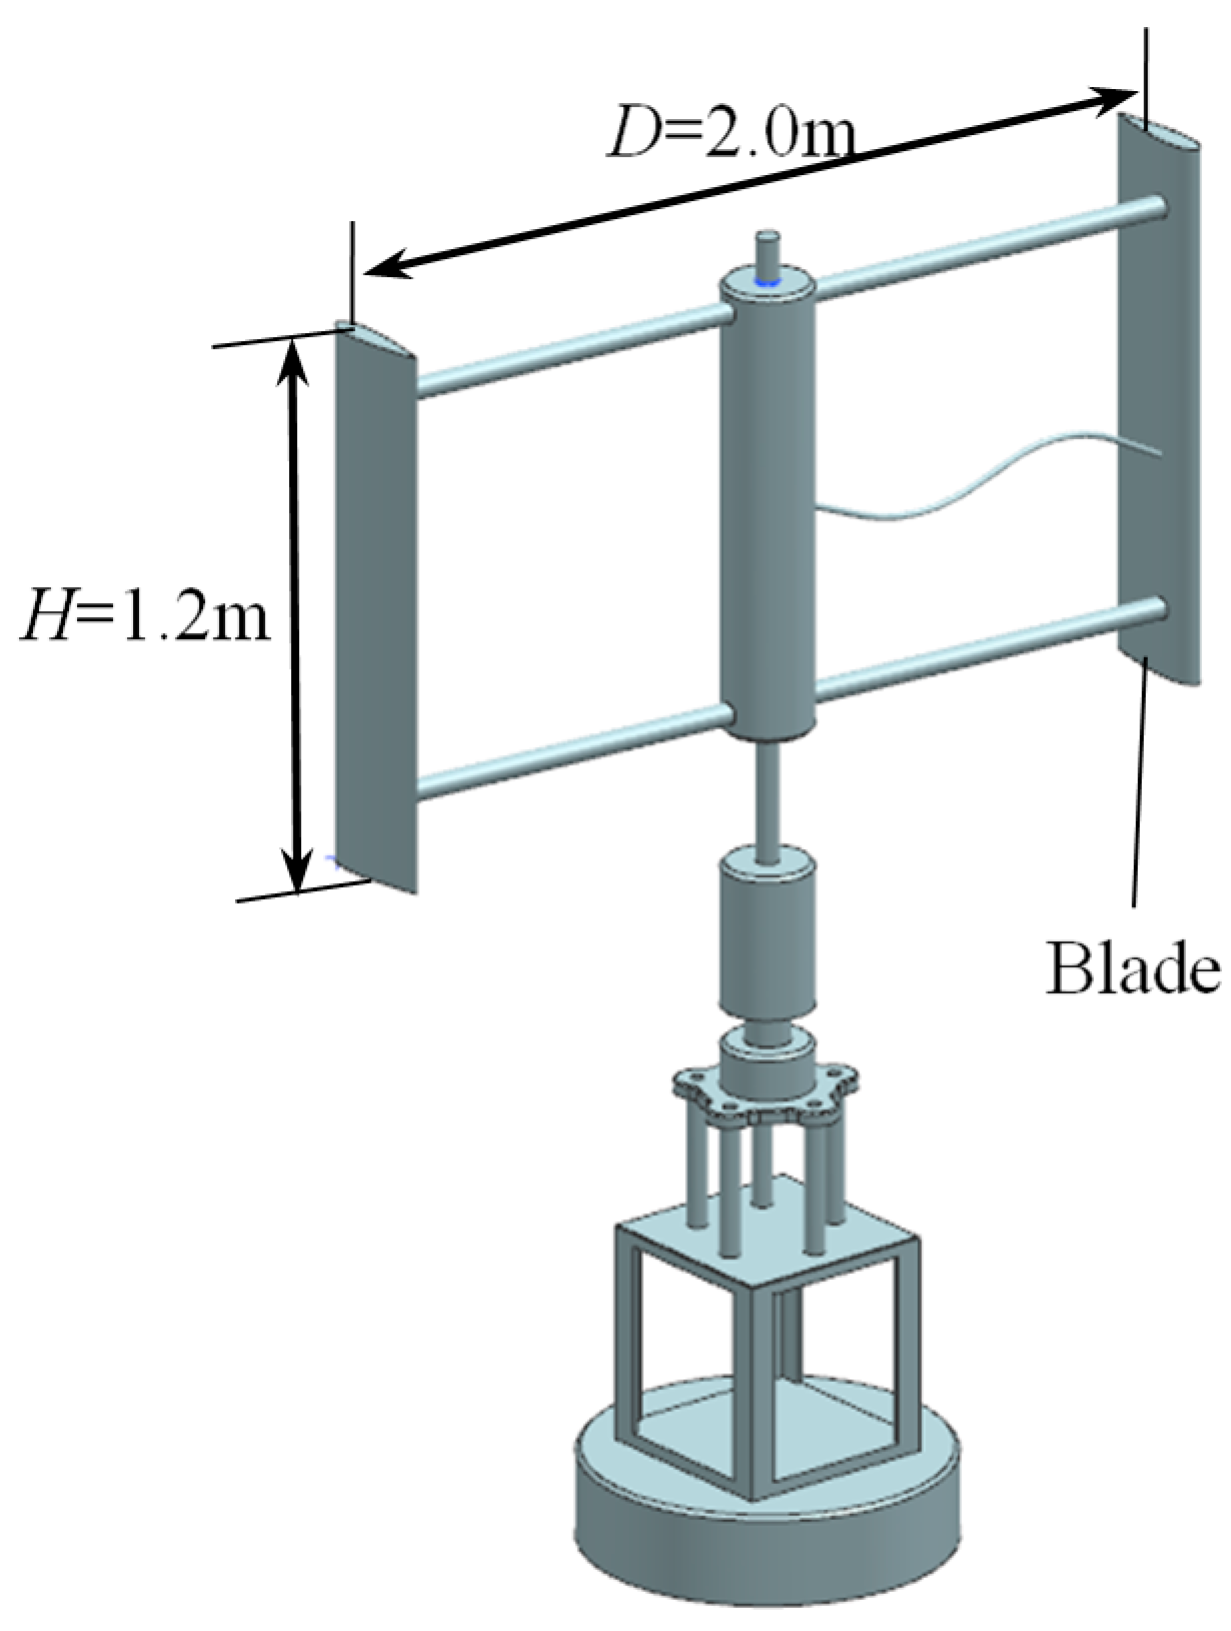
As shown in Figure 3, the model of the wind turbine is double-blade Sb-VAWT. The rotor diameter is D = 2.0 m with the spanwise length of H = 1.2 m. The airfoil is the standard NACA0021 with the blade chord length of c = 0.265 m.
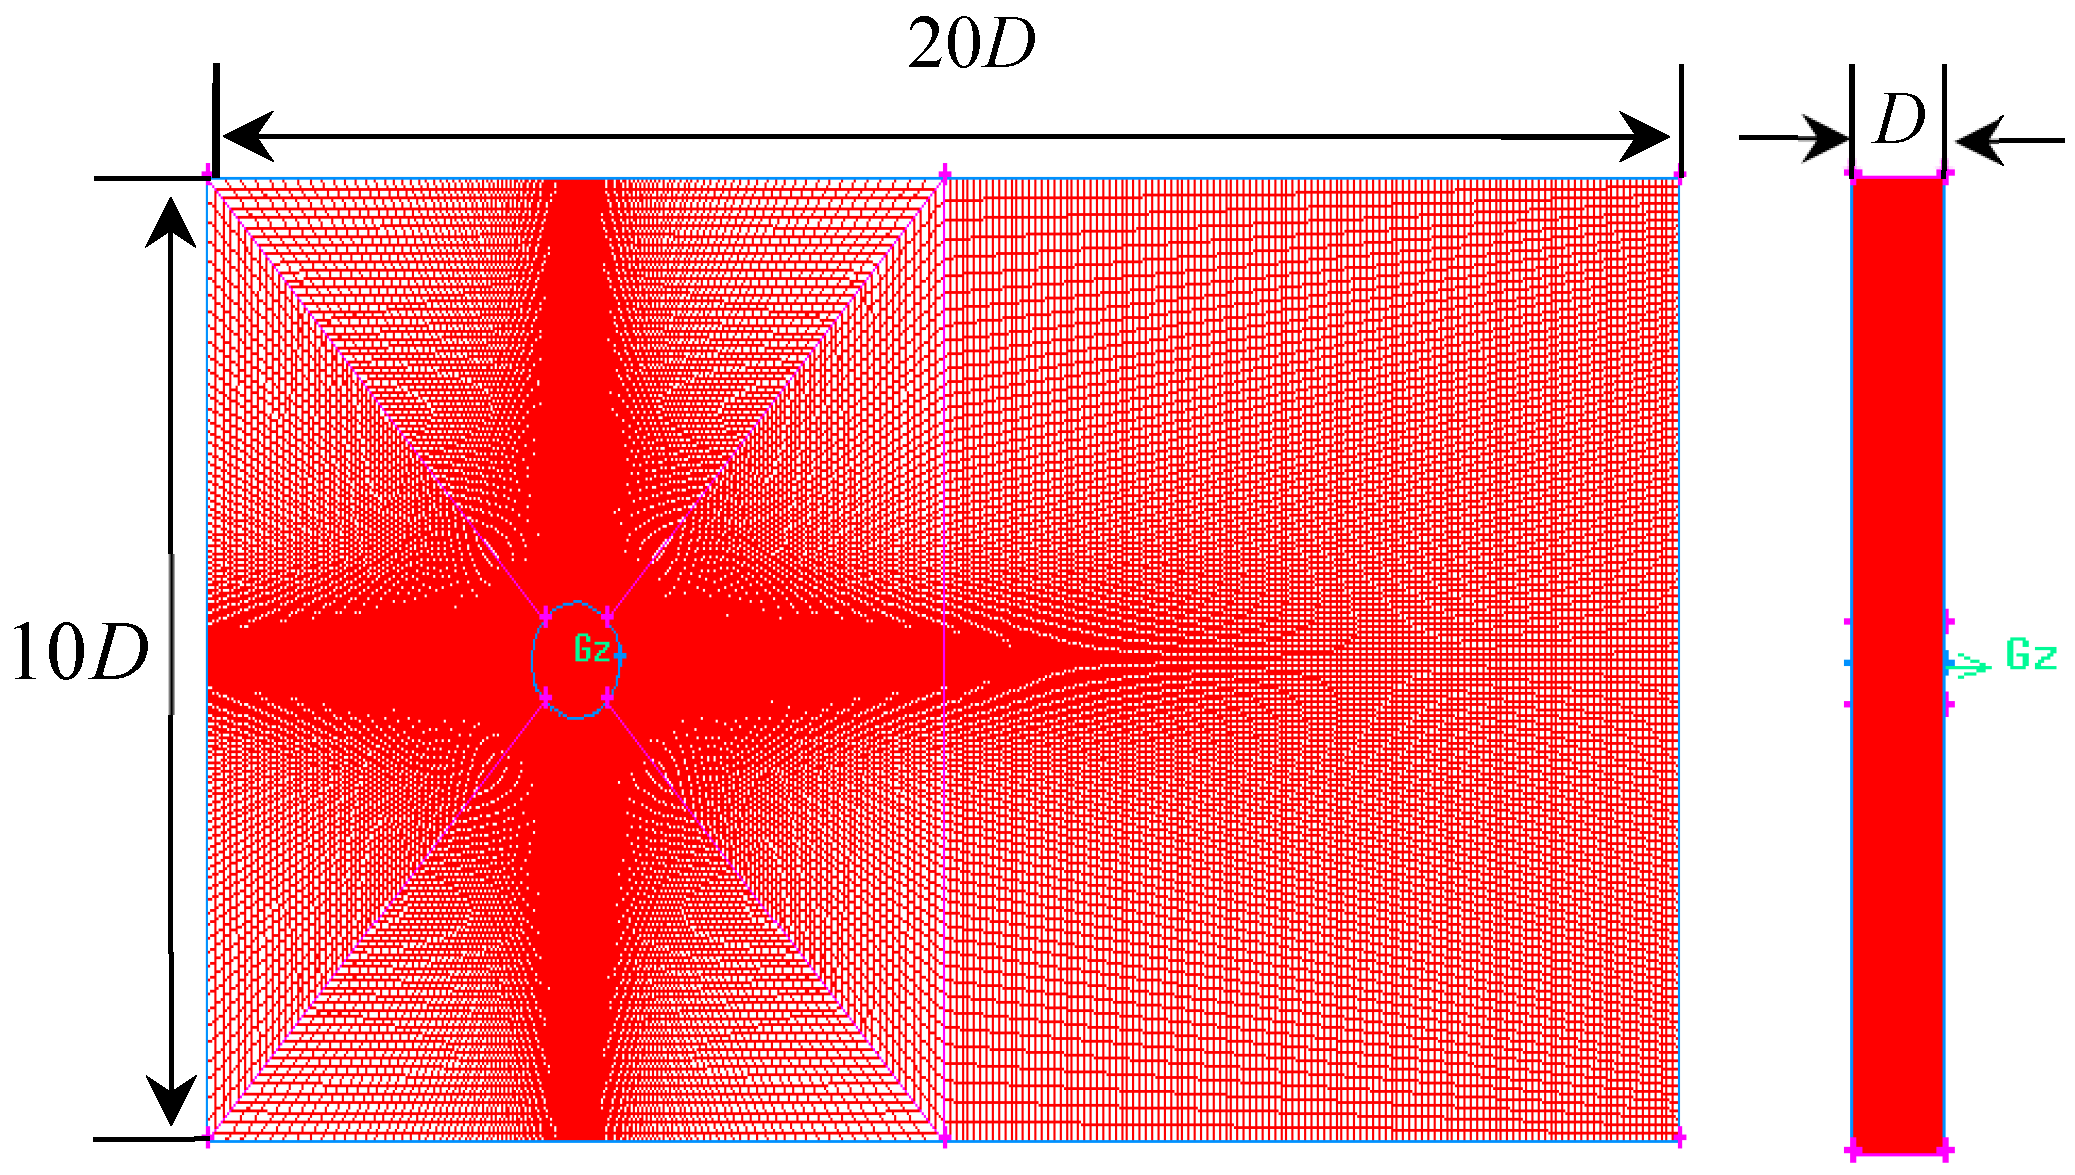
Due to the effect of the tip vortex on the pressure distribution on the blade surface in the spanwise direction [33], the CFD simulations used the three-dimensional numerical model to increase the accuracy of the calculation, as shown in Figure 4. The length, width and height of the three-dimensional numerical model are L0 = 20.0D, W0 = 10.0D and H0 = 1.0D, respectively. The rotor center of the Sb-VAWT is located 5D away from the inlet surface. It is located at the center position of the three-dimensional numerical model in width and height. Since the CFD simulations are based on the sliding mesh technique, the computational domain is divided into a stationary domain and a rotating domain.
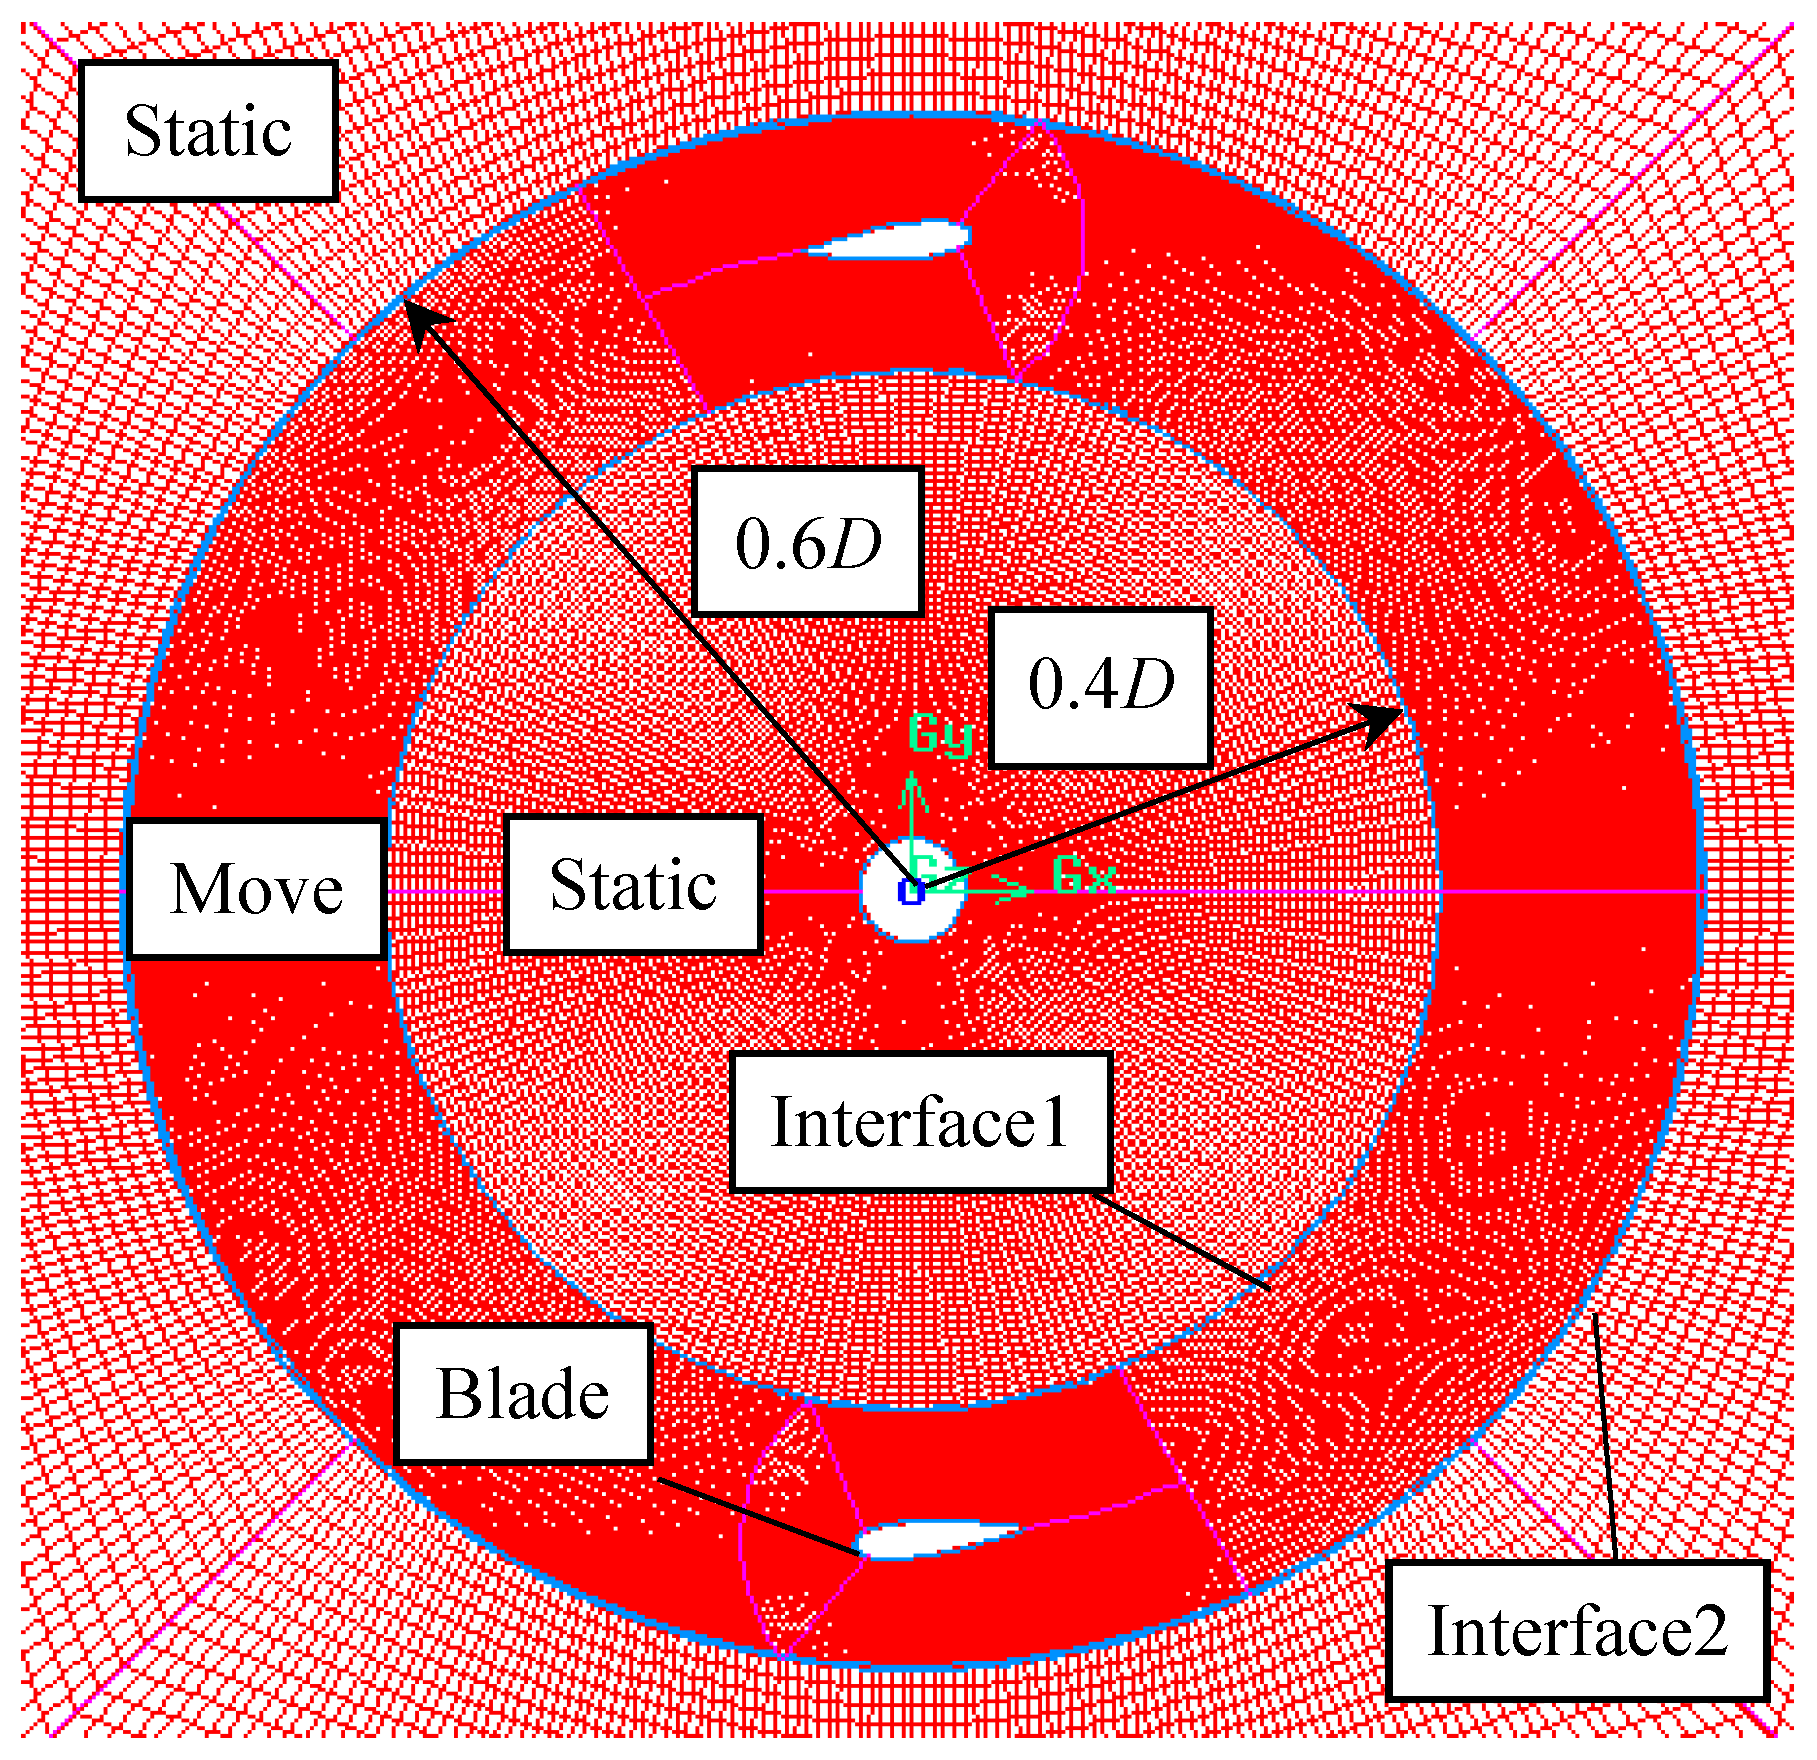
The mesh of the stationary domain and the rotating domain for the CFD simulations are constructed using the topological meshing technique. As shown in Figure 5, the outer radius of the rotating domain is 0.6D and the inner radius is 0.4D. The interfaces between the inner and outer walls are Interface1 and Interface2, respectively. To obtain a higher calculation precision, the mesh of the rotating domain is encrypted. The mesh near the blades was given further encryption, which is depicted in Figure 6.
From Table 1, the boundary condition of the inlet of numerical domain adopts the VELOCITY-INLET and the mainstream wind velocity is defined as 8.0 m/s. The boundary condition of the outlet of numerical domain employs the PRESSURE-OUTLET and the pressure value is 0 Pa. Other walls are set as non-sliding boundary condition as a default setting.
Since the flow field of the Sb-VAWT has a Reynolds number that is greater than the critical Reynolds number, the turbulence model is used. The number of time steps of the CFD simulations is set as 540. According to Formula (6) and the angular velocity of the blade, the time step t can be expressed as:
t = π 90 ω
In the wind tunnel experiments, the center surface (z = 0) along the blade span direction was considered to measure the pressure distribution by using the multiport pressure device during the one-cycle rotation of the rotor. The torque coefficient and power coefficient acting on the single blade are calculated by integrating the pressure distribution on the blade surface. The torque of the Sb-VAWT was measured by a torque meter, and then the utilization rate of wind energy (power coefficient) was investigated. The effect of the blade pitch angle on the aerodynamic characteristics of the Sb-VAWT could be verified scientifically via CFD simulations and wind tunnel experiments.
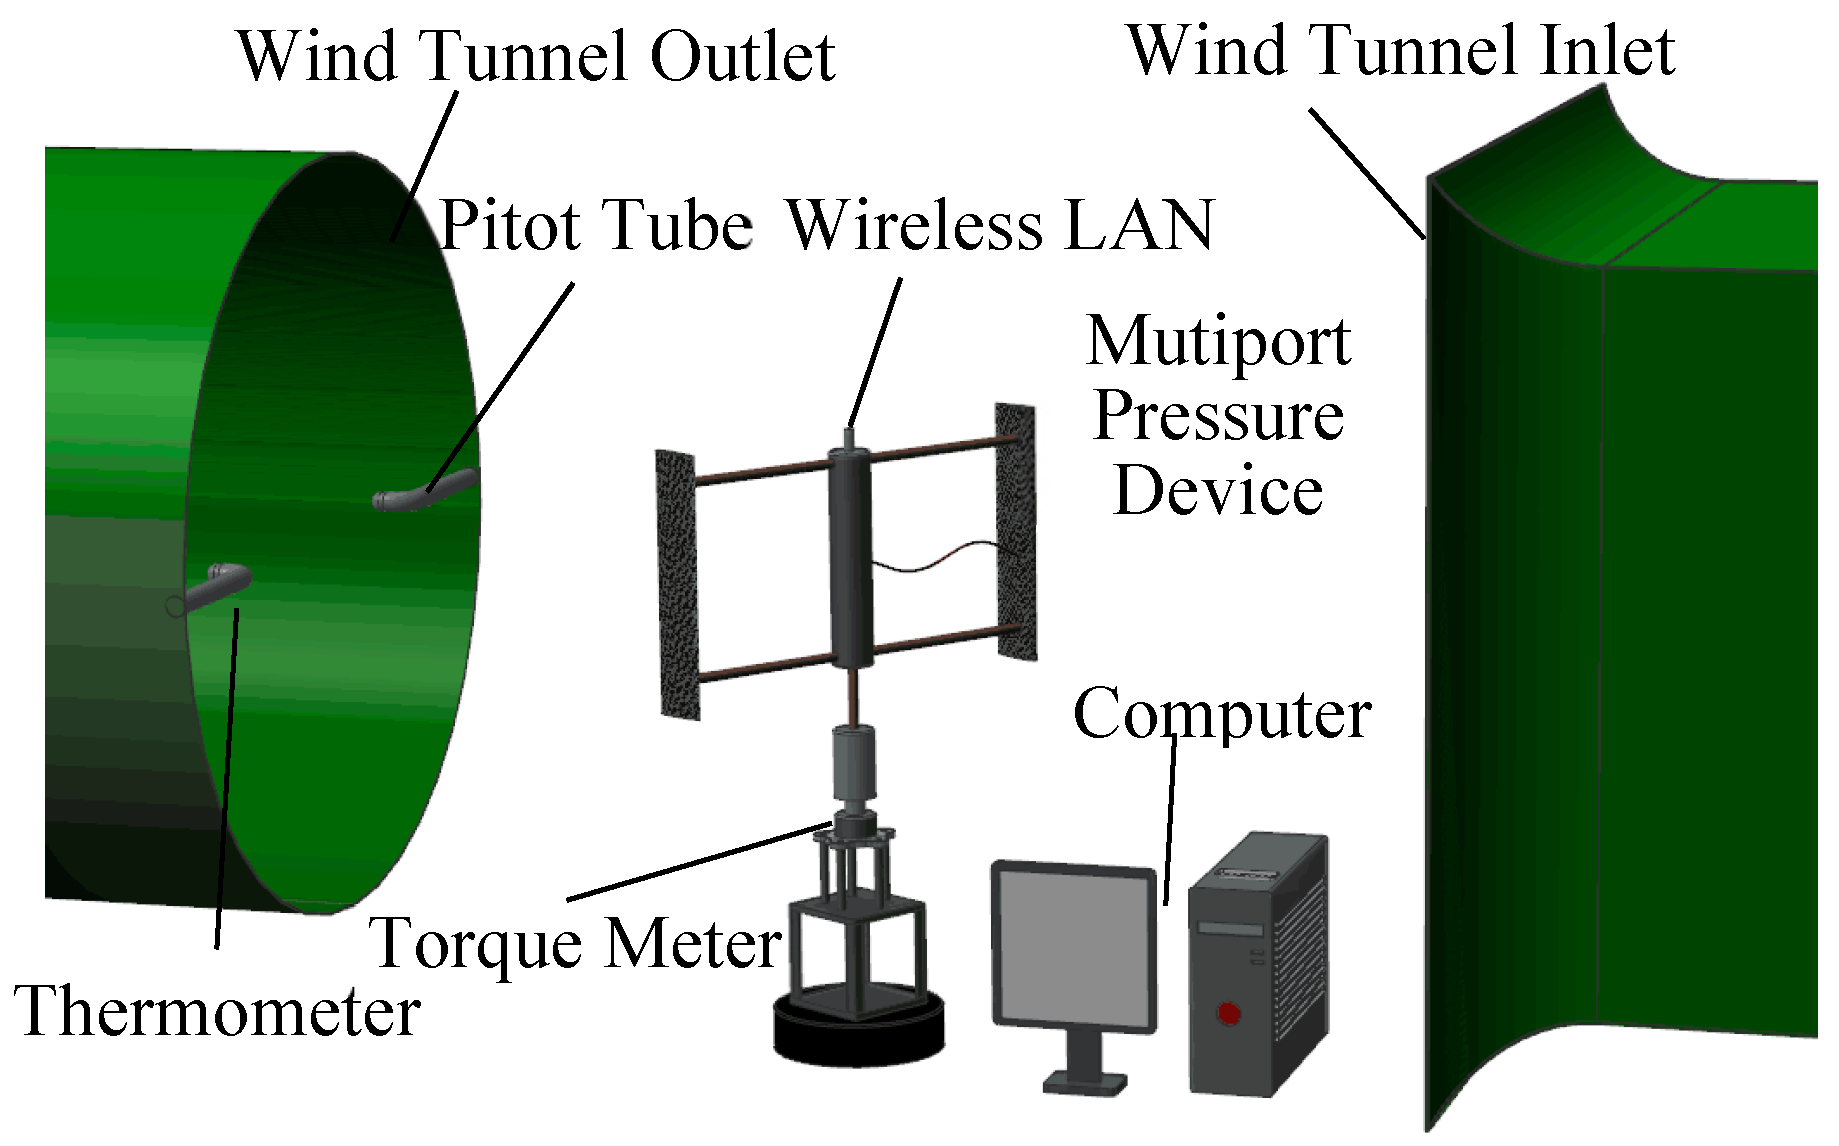
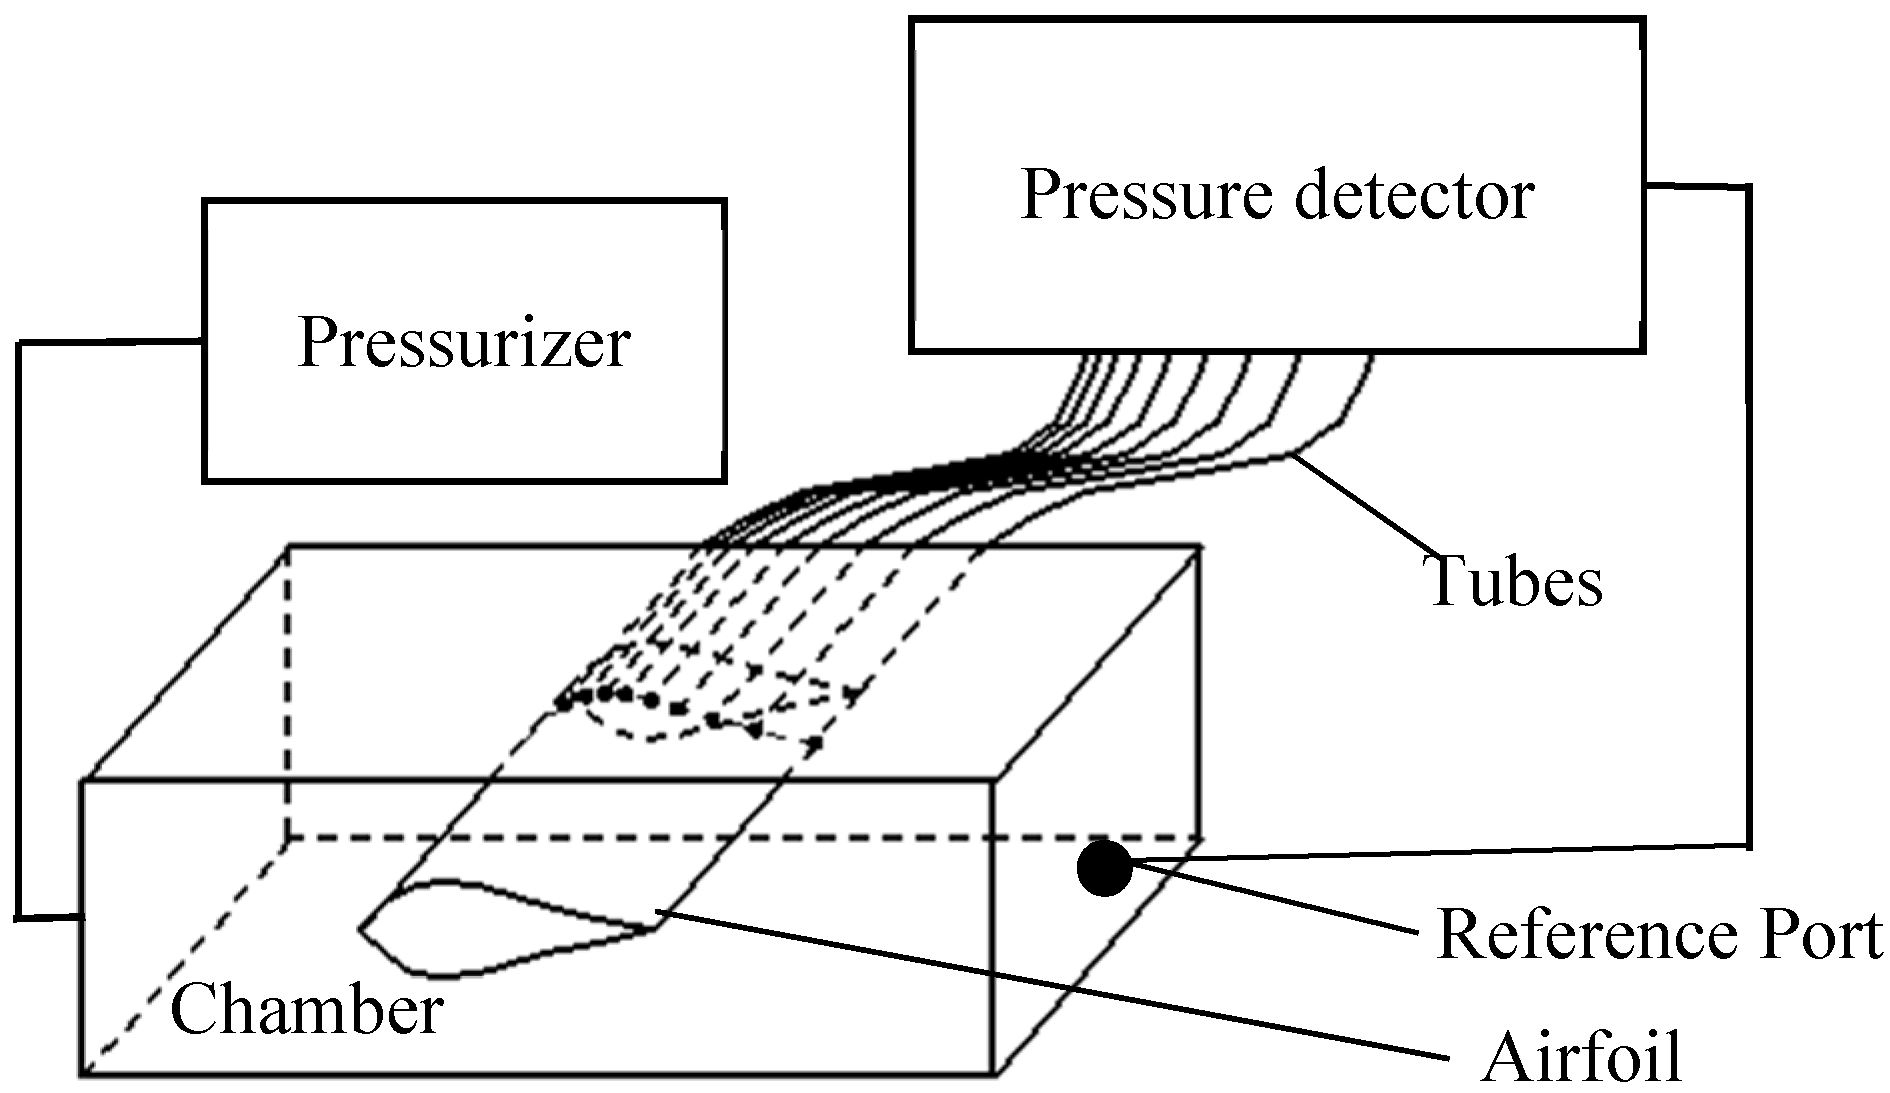
Figure 7 shows the schematic diagram of the Sb-VAWT in wind tunnel experiments. The experiments were carried out in an open test section of circular type wind tunnel with an outlet diameter of 3.0 m and the maximum wind velocity was 40.0 m/s. The torque meter of TS-2700 was chosen to measure the torque coefficients of the rotor. The mainstream wind velocity was 8.0 m/s and the blade pitch angles were set at β = 4°, 6° and 8°, respectively. The size ratio between the actual wind turbine and the model of the wind turbine in CFD simulations was 1:1. Figure 8 illustrates the correction system for the high-speed multiport pressure device. More detailed experimental parameters have been introduced in the previous studies of Li et al. [10,19,24,34,35].
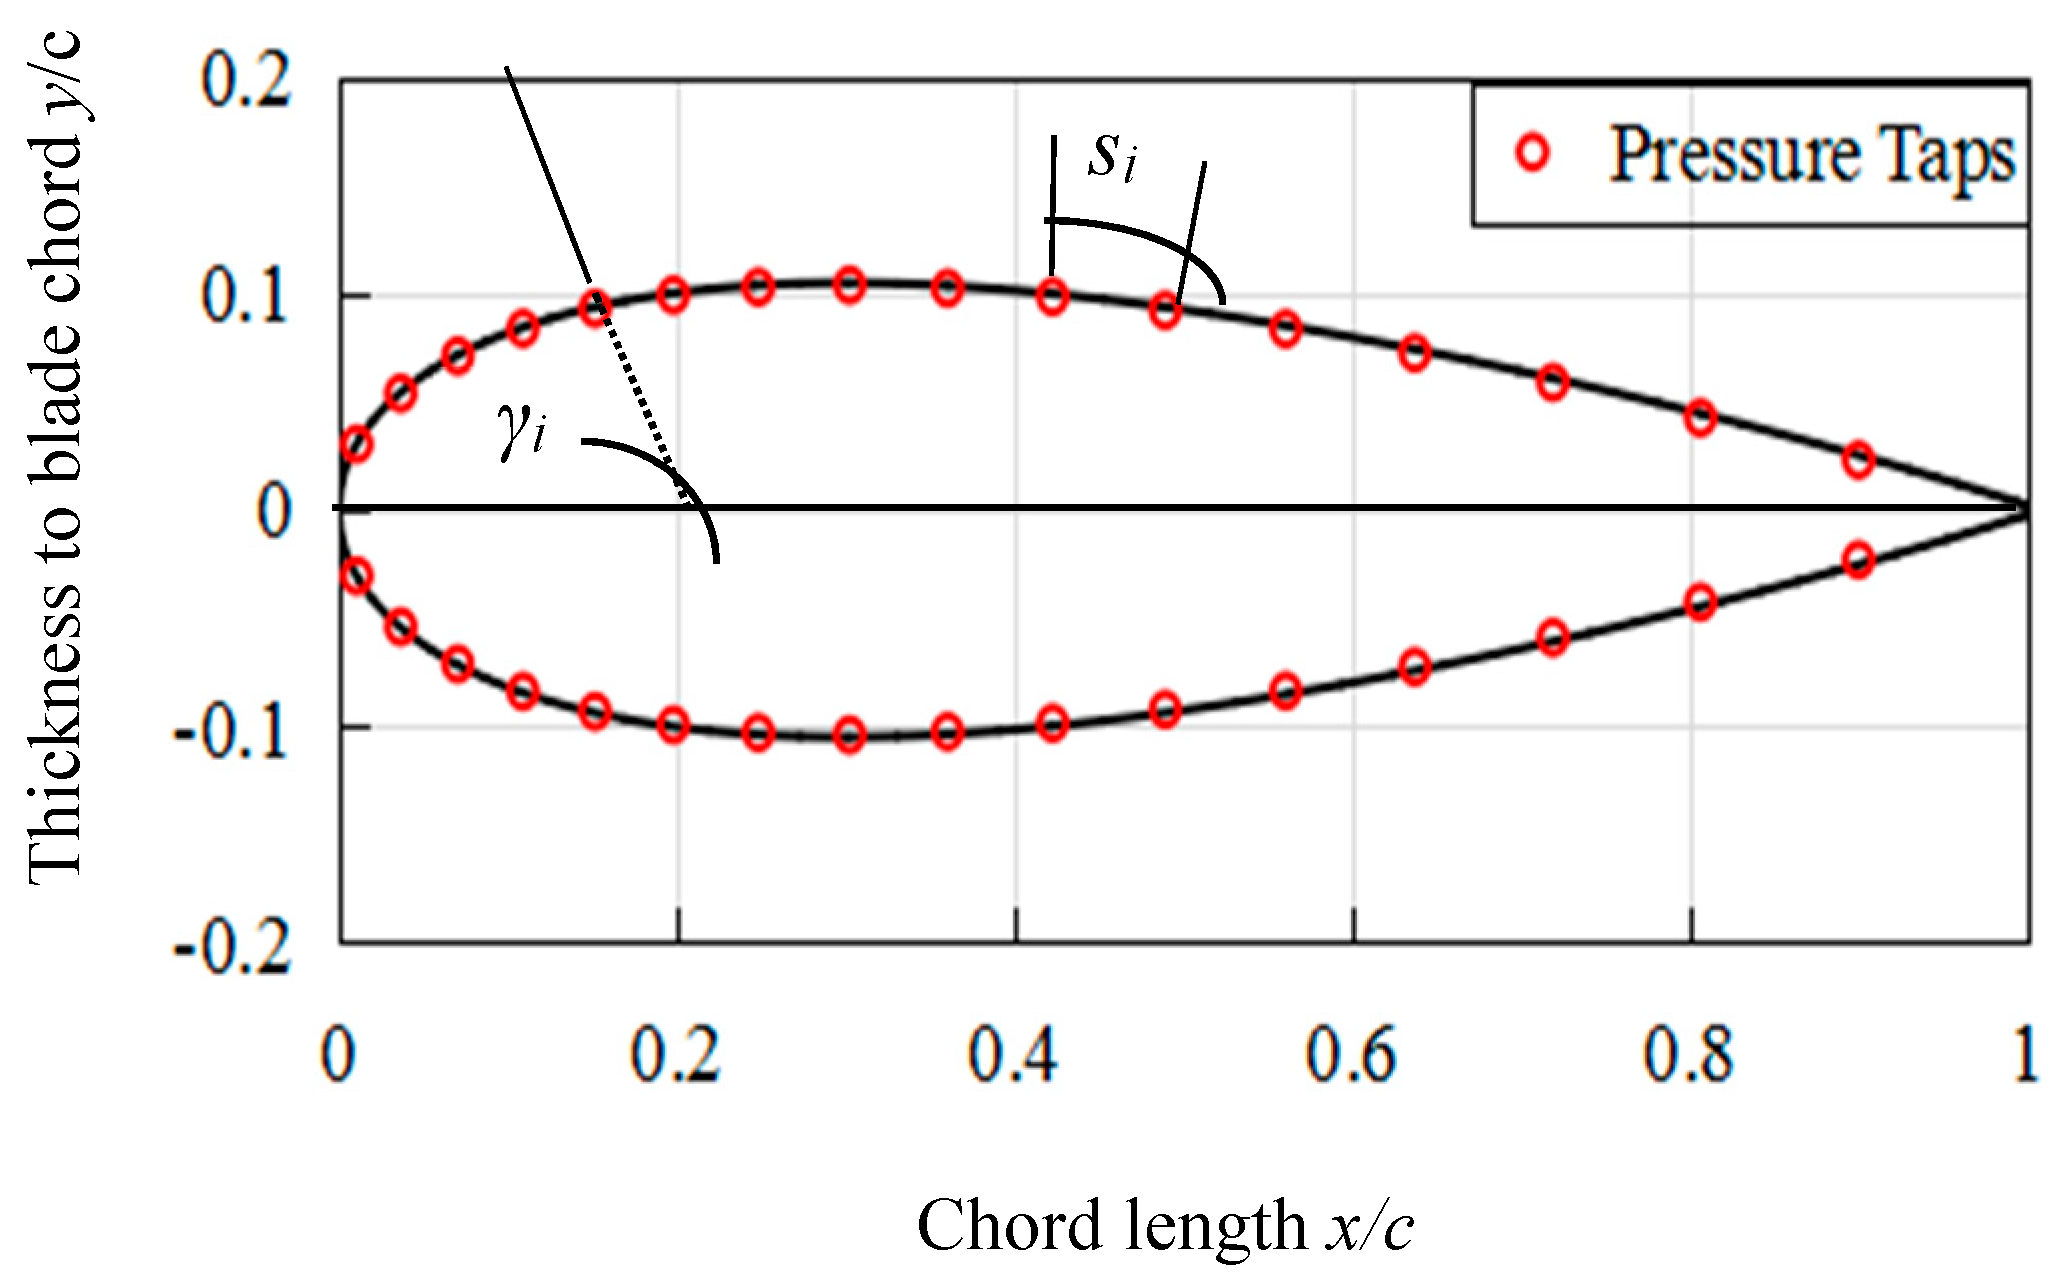
Figure 9 represents the distribution of pressure taps on the blade surface. As shown in this figure, the circle represents the pressure taps on the blade surface. The pressure taps at the leading edge of the blade were arranged with high density. The reason is that the pressure gradient of the leading edge of the blade was greater than that of the trailing edge of the blade. The distance between the pressure taps is si and the measured pressure value of each tap is Pi. The value of the static pressure point is P0. At each pressure tap, the angle between the direction of the pressure value and the blade chord is γi. The tangential force and the normal force for the blade are FT and FN, respectively. According to the pressure of each tap, FT and FN can be expressed as:
F T = ( p i p 0 ) s i sin γ i
F N = ( p i p 0 ) s i cos γ i
According to Equation (9), the tangential force FT can be calculated. And then, the torque of the single blade can be calculated from Equation (4). Furthermore, the power coefficient of the rotor can be obtained.

3. Results

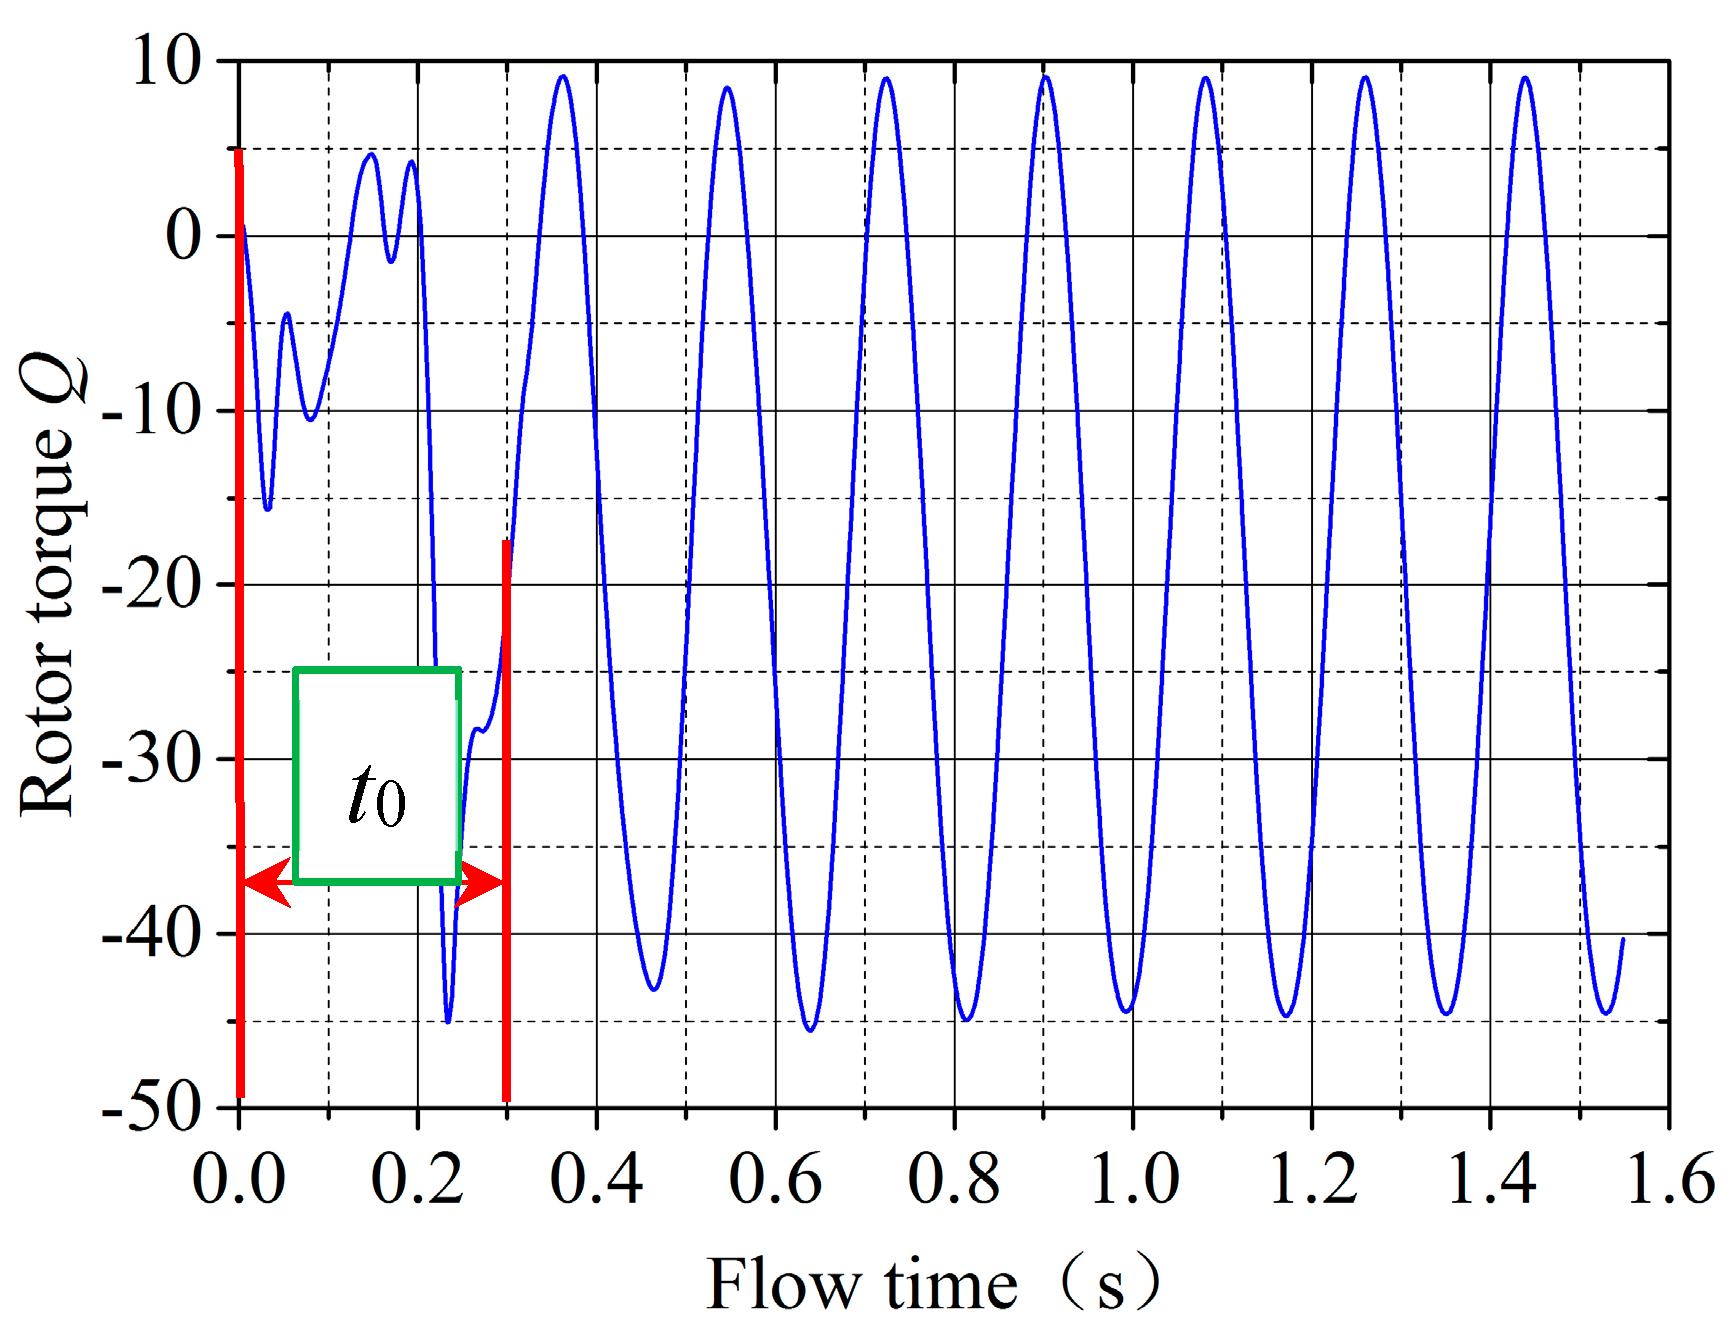
Figure 10 shows the result of monitor of the CFD simulation at the blade pitch angle of β = 6°. The monitored data is the torque of the rotor. The horizontal axis and vertical axis represent the flow time and the rotor torque, respectively. When the time is 0 < t0 < 0.3, the curve fluctuates irregularly. This phenomenon shows the computation of the CFD simulation is not convergent. When the flow time is t > 0.3, the computation of the CFD simulation is convergent. When the time is t > 0.8, the curve fluctuation becomes stabilized.
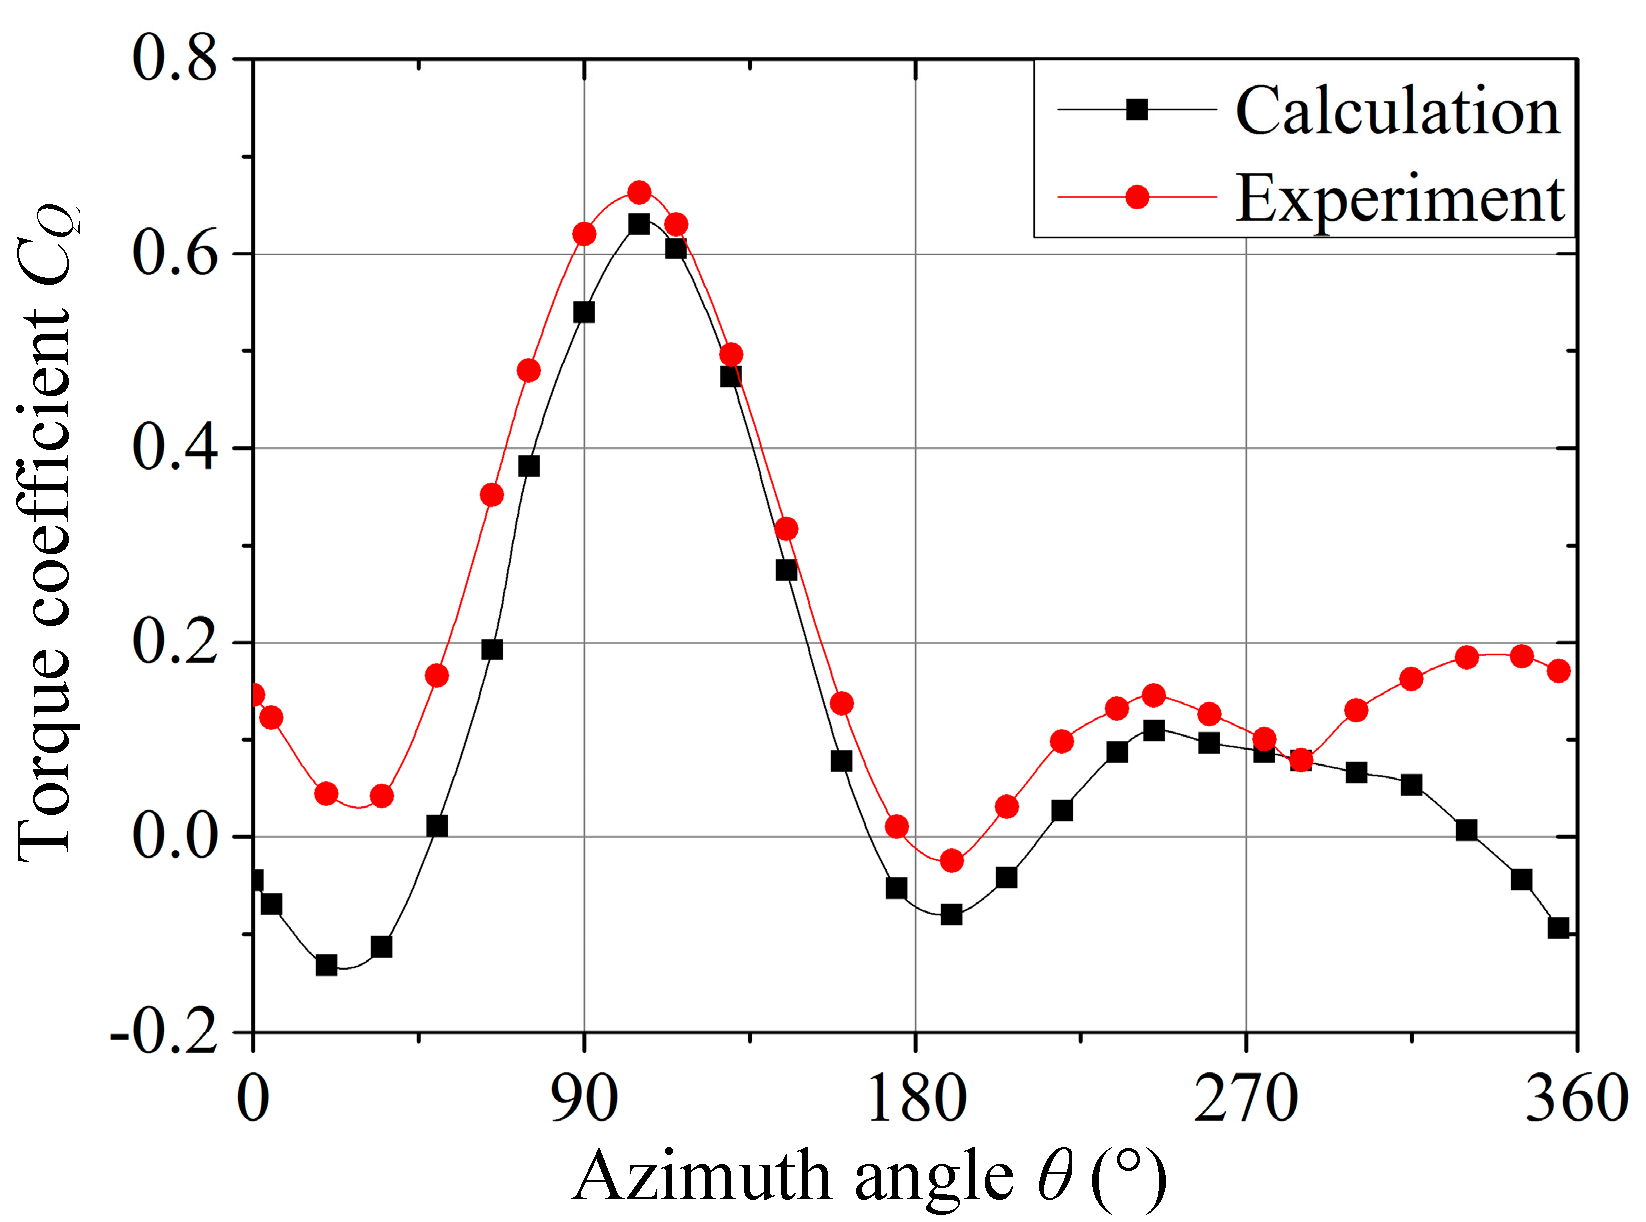
As shown in Figure 11, the torque coefficients acting on the single blade computed by CFD simulations are compared with those measured by high-speed multiport pressure device in wind tunnel experiments. As shown in the figure, the fluctuation of torque coefficient acting on the single blade computed by CFD simulations is in a good agreement with the curve of the experimental measurements when the azimuth angles are 60 ° < θ < 300 ° . However, the curve measured by experiment measurements is slightly smaller than that calculated by the CFD simulation at the azimuth angles of 0 ° < θ < 60 ° and 300 ° < θ < 360 ° . The reason for this phenomenon is that the rotation direction of the rotor is clockwise, which results in the tip vortex generated by the blade in the upstream region and has an important effect on the aerodynamic characteristics of the blade at the azimuth angles of 0 ° < θ < 60 ° and 300 ° < θ < 360 ° . Nevertheless, the two curves still have a good agreement. This is similar to the observation by Yang et al. [36].

4. Discussion

4.1. Pressure Distribution on Single Blade Surface

This section discusses the effect of the blade pitch angle on the pressure distribution on the single blade surface at the azimuth angles of 0° ≤ θ ≤ 360°. The results are obtained by CFD simulations at the blade pitch angles of β = 4°, 6°, and 8°. In this study, the interval of 0° ≤ θ < 180° is defined as the upstream region and the interval of 180° ≤ θ < 360° is defined as the downstream region.
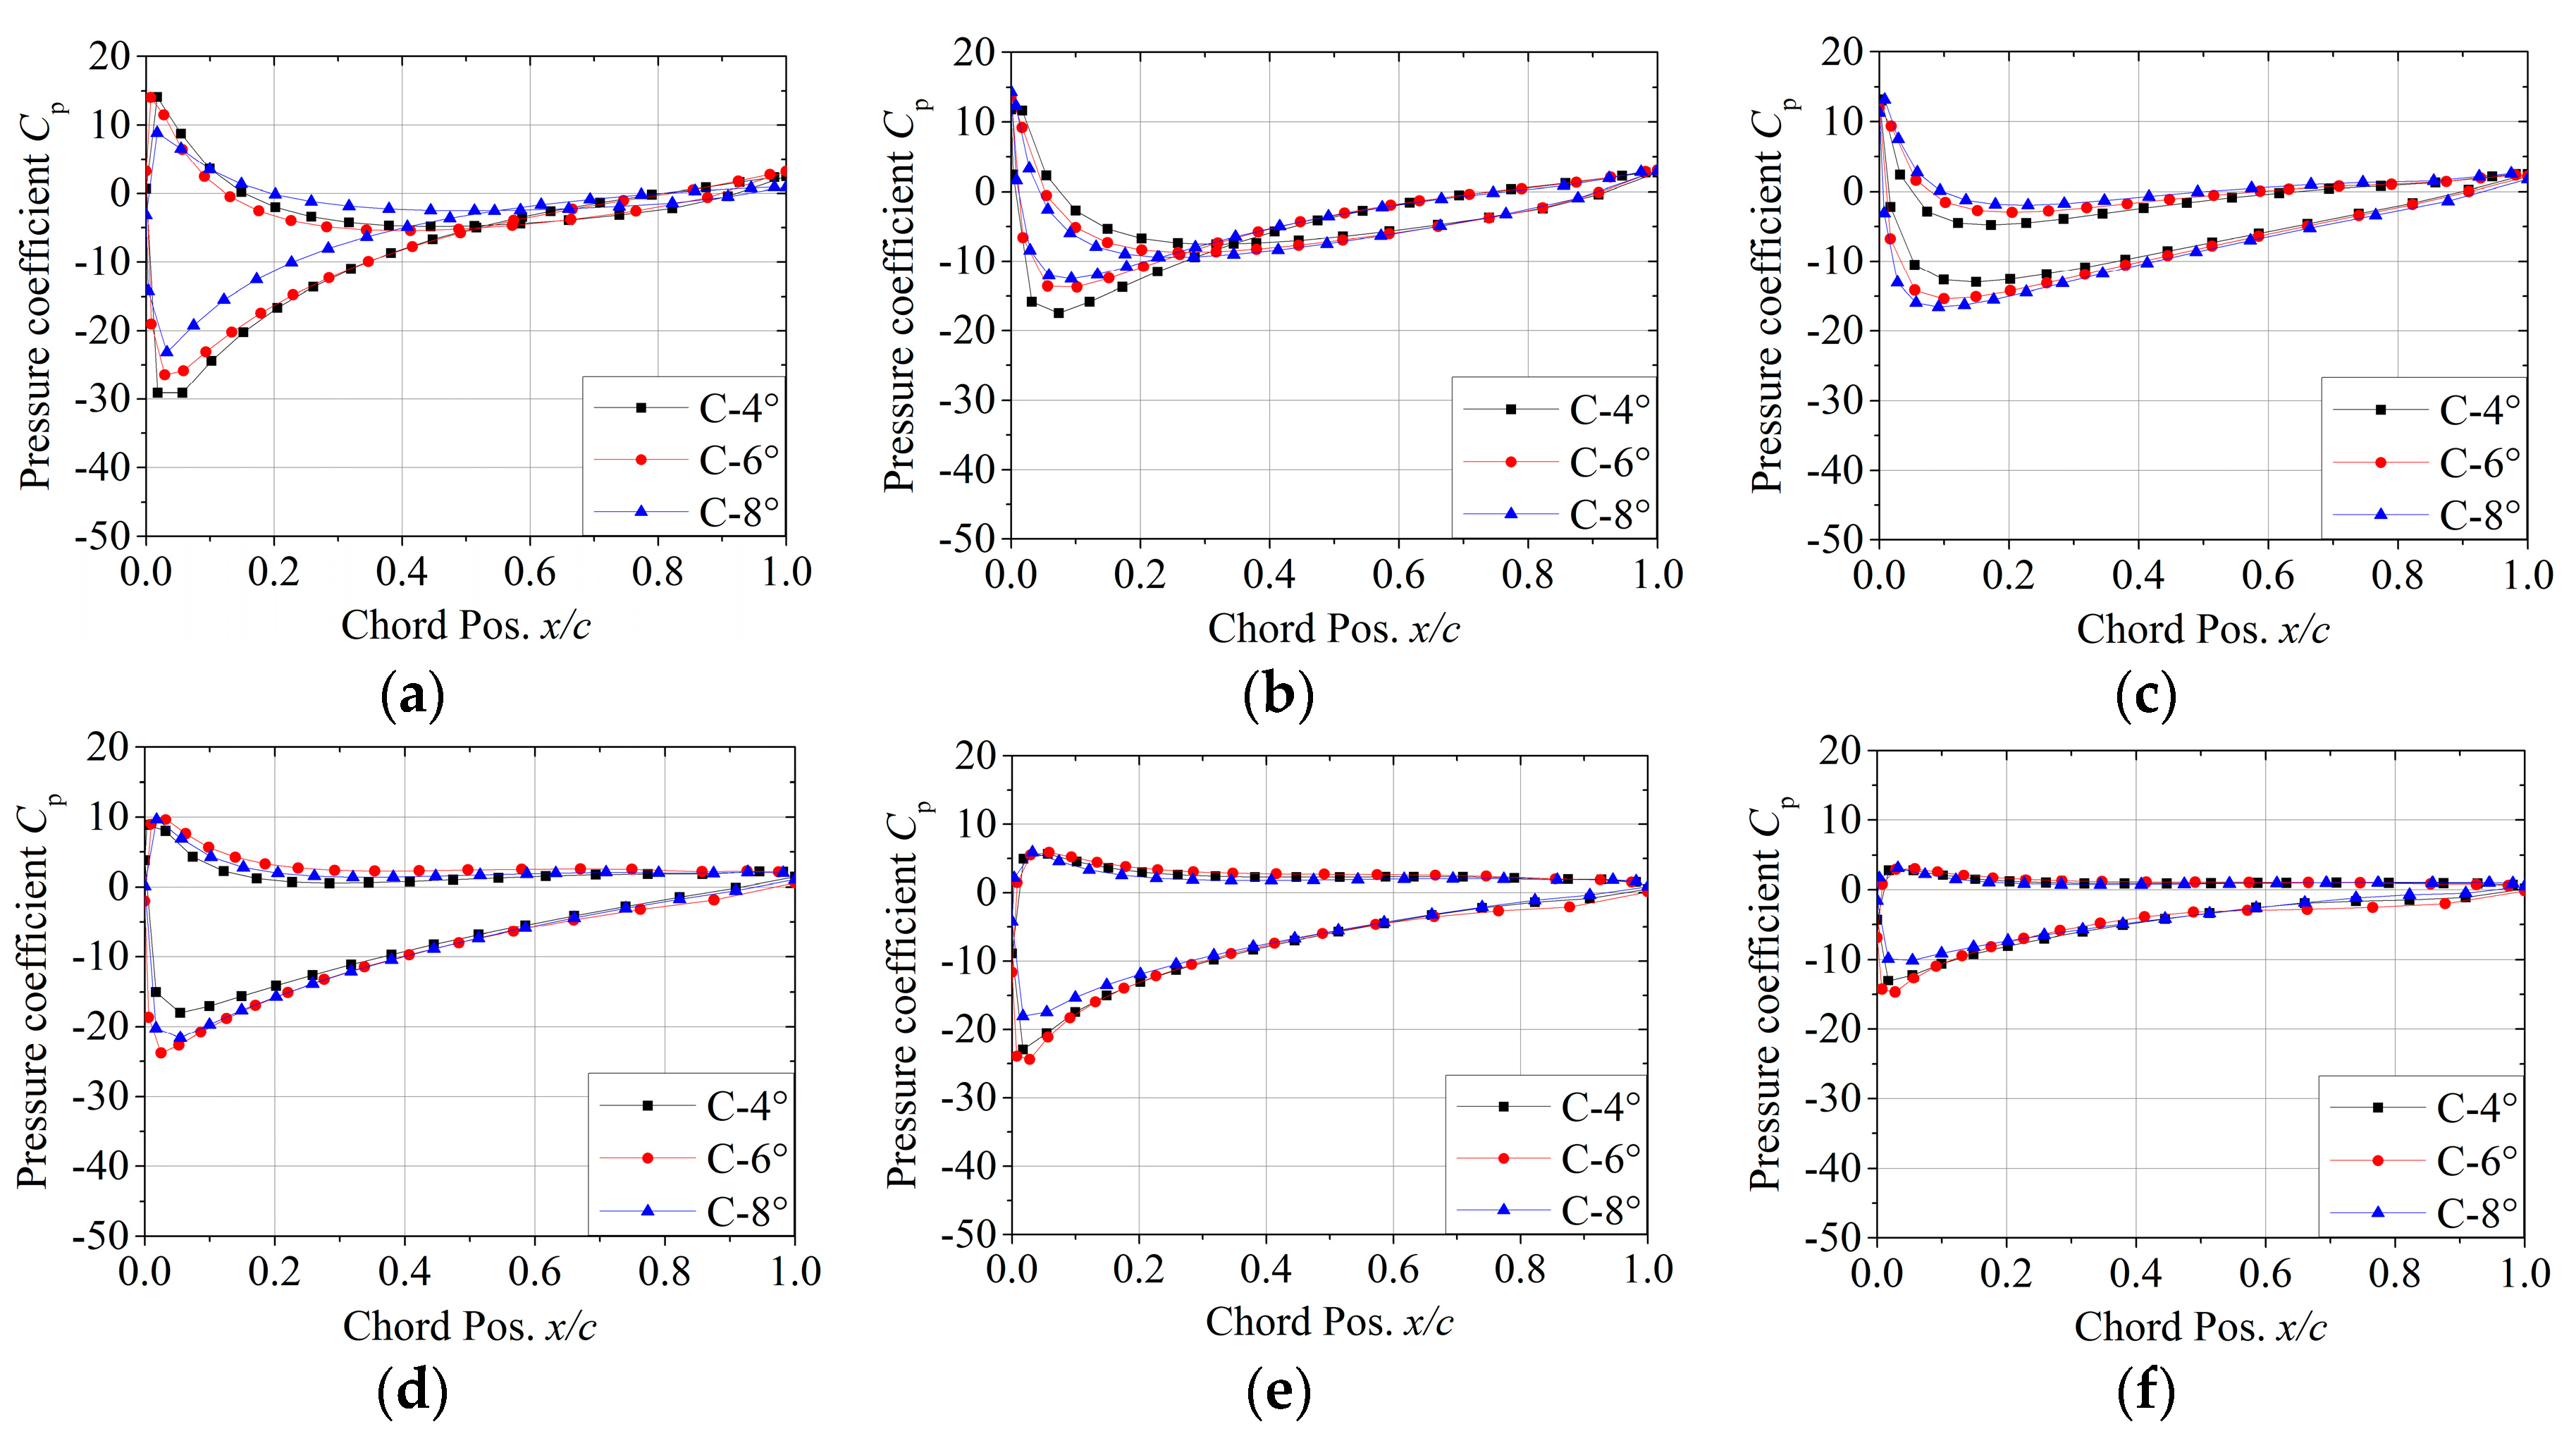
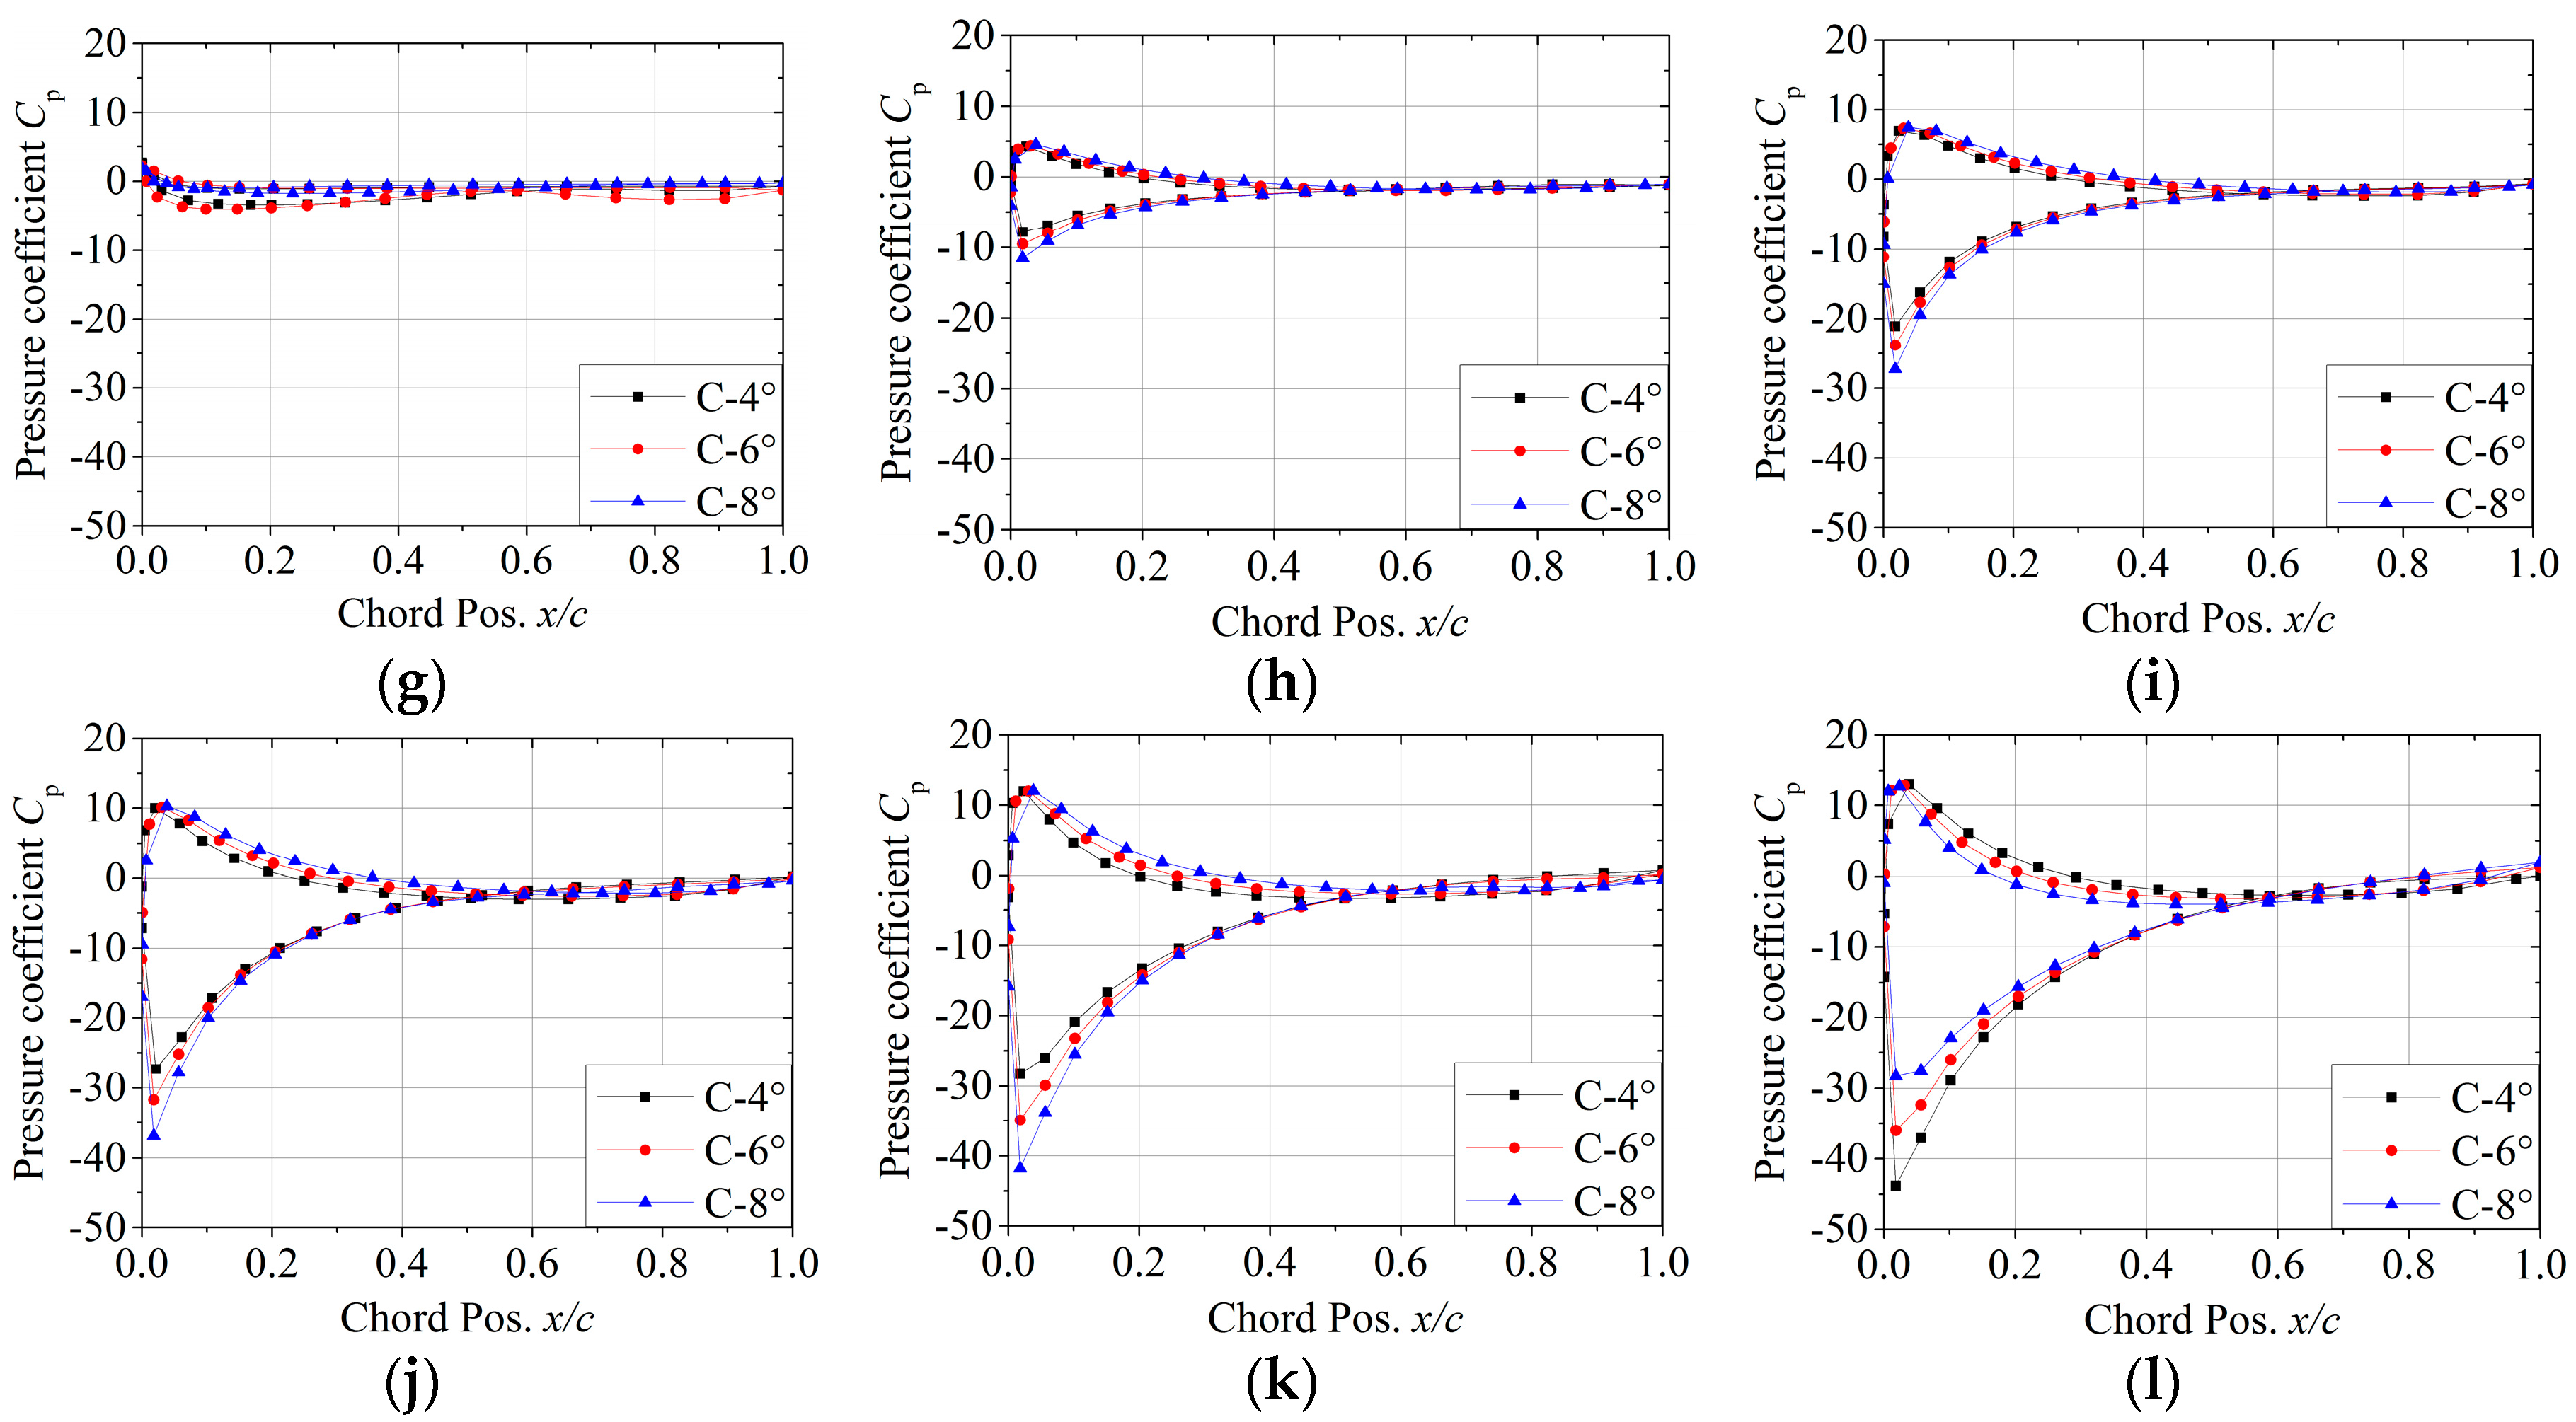
Figure 12 illustrates the fluctuations of pressure distribution at different blade pitch angles from the CFD simulations. From this figure, it is seen that the maximum value of pressure difference on the blade surface is reached at the azimuth angle of θ = 90°. Thus, it can be inferred that the maximum aerodynamic characteristics of the blade should be generated in the upstream region. The minimum value of the pressure difference on the blade surface appears at the azimuth angle of θ = 180°. Similar results were also mentioned by Li et al. [24] in 2016. The main reason is that the direction of the tangential velocity V of the blade is the same as that of the mainstream wind velocity U0, which results in the resultant flow velocity to blade W reaching the minimum value.
Compared with the azimuth angle of θ = 90°, the pressure difference on the blade surface is smaller at the azimuth angle of θ = 270°, which is mainly affected by the angle of attack and the loss of wind energy in the downstream region. The pressure difference on the blade surface at the azimuth angle of θ = 0° is greater than at the azimuth angle of θ = 180°. The reason is that the direction of tangential velocity V of the blade is opposite to that of the mainstream wind velocity when the azimuth angle is θ = 0°, which results in the resultant flow velocity to blade at the azimuth angle of θ = 0° being greater than that at the azimuth angle of θ = 180°. This result also has a good agreement with the studies of Li et al. [33]. As can be seen from Figure 12, the maximum value of the pressure difference on the blade surface appears near the leading edge of the blade and the pressure difference near the trailing edge on the blade surface is closed to zero. Therefore, it can be concluded that the power coefficient of the Sb-VAWT is mainly dependent on the leading edge of the blade.
As shown in Table 2, the pressure differences on the blade surface for different blade pitch angles of β = 4°, 6°, and 8° are compared at the azimuth angles of 0° ≤ θ ≤ 360°. When the azimuth angles are θ = 0°, 30° and 330°, the pressure differences on the blade surface at the blade pitch angle of β = 4° are larger than those at the blade pitch angles of β = 6° and 8°. When the azimuth angles are θ = 90°, 120°, 150° and 180°, the pressure differences on the blade surface at the blade pitch angle of β = 6° are larger than those at the blade pitch angles of β = 4° and 8°. Among the blade pitch angles of β = 4°, 6°, and 8°, the pressure differences on the blade surface at the blade pitch angles of β = 8° are maximum when the azimuth angles are θ = 60°, 210°, 240°, 270° and 300°, respectively. Therefore, in the upstream region, the maximum pressure difference on the blade surface is mainly obtained at the blade pitch angle of β = 6°, and in the downstream region, the pressure difference on the blade surface is mainly obtained at the blade pitch angle of β = 8°. According to reference [24], the power coefficient of the Sb-VAWT is mainly obtained in the upstream region. To sum up, the analysis on the pressure distribution on the blade surface shows that the optimal blade pitch angle is β = 6° for the Sb-VAWT when the number of blade is two.

4.2. Torque Coefficient for Single Blade

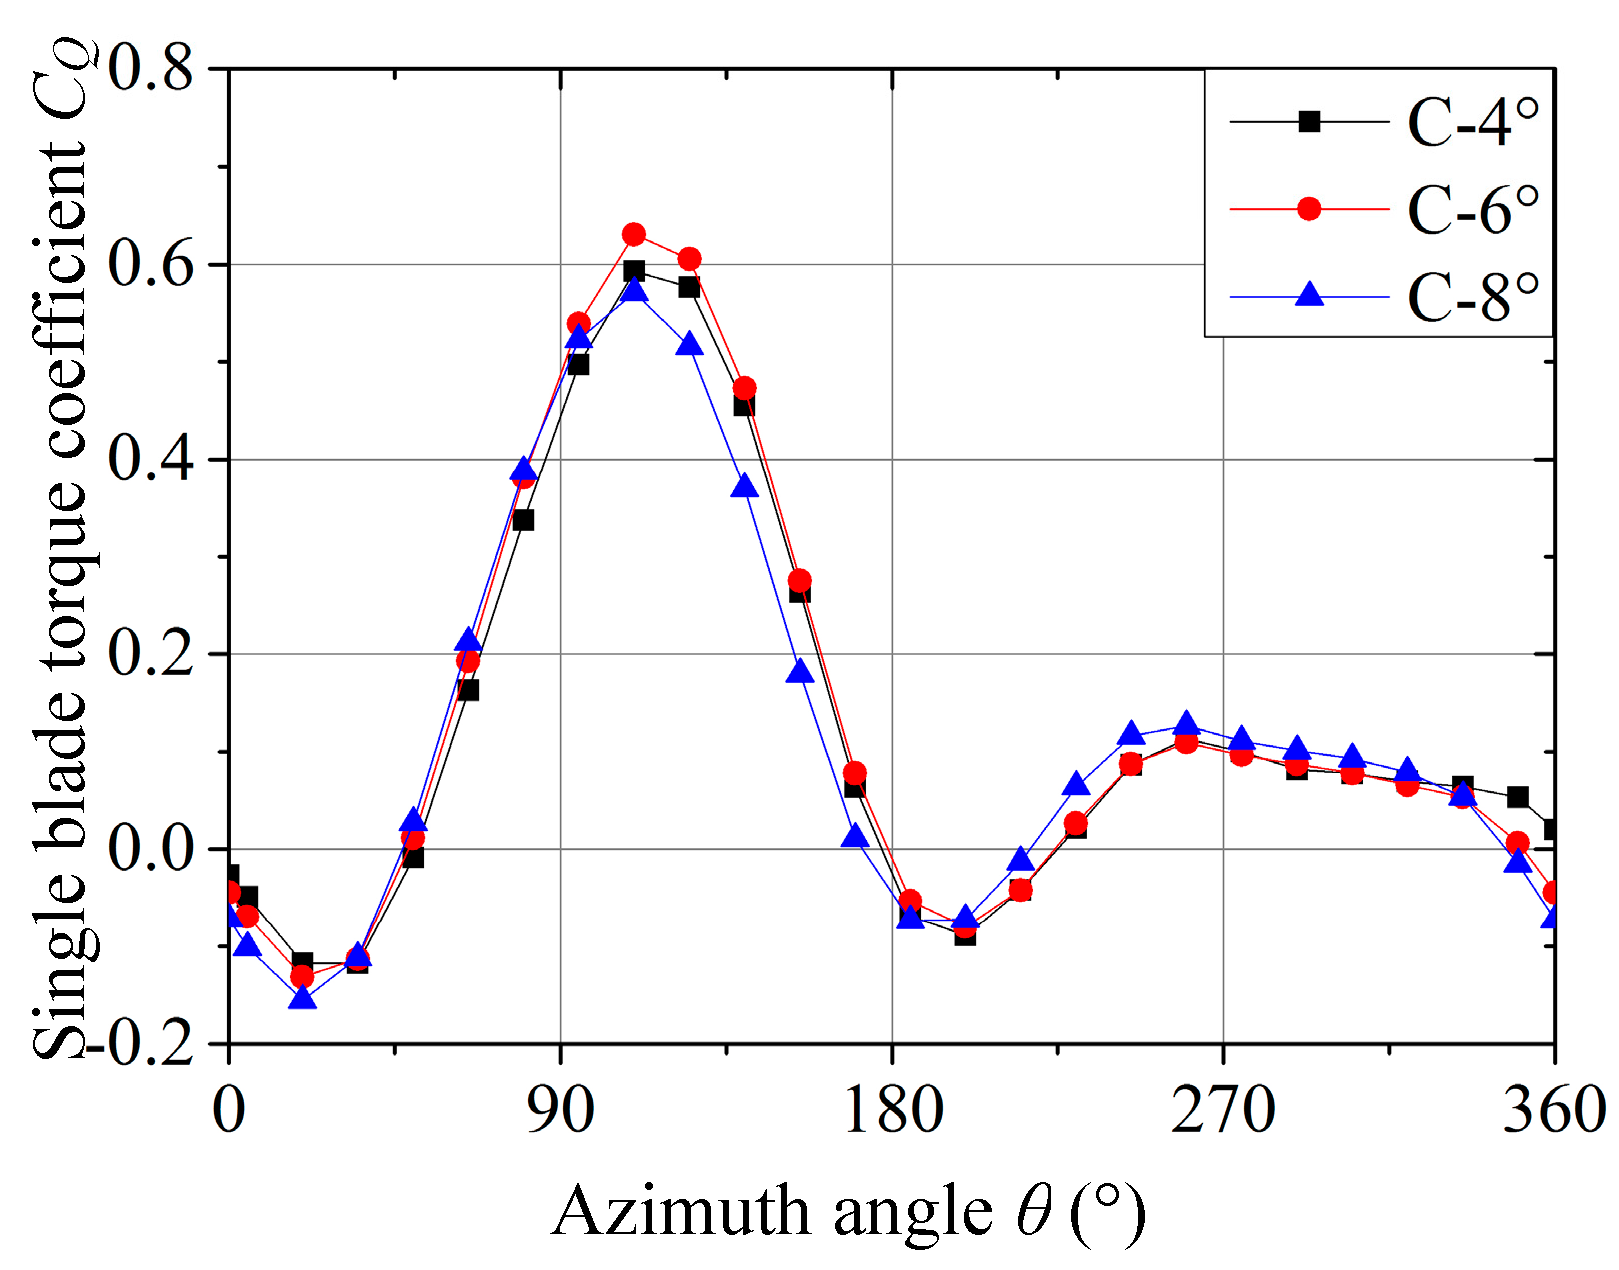
In this section, CFD simulations are used to analyze the torque coefficients acting on the single blade when the blade pitch angles are β = 4°, 6°, and 8°, respectively. Then, the torque coefficients obtained by the CFD simulations and the wind tunnel experiments are compared at the blade pitch angle of β = 6°. The torque coefficients acting on the single blade are calculated by Equation (5). The tangential force FT in Equation (5) is obtained by the pressure value acting on the blade surface. As shown in Figure 13, the three curves have a little difference in the upstream region, while the difference in the downstream region is even fewer. When the azimuth angles are around θ = 30° and 180°, the curves present two wave troughs and the values of which are both negative. When the azimuth angle is around θ = 100°, the torque coefficient acting on the single blade achieves the maximum value at the blade pitch angle of β = 6° and the minimum value at the blade pitch angle of β = 8°. When the azimuth angle is around θ = 260°, the blade has the maximum torque coefficient at the blade pitch angle of β = 8° and the minimum torque coefficient at the blade pitch angle of β = 6°, which are consistent with the results of the pressure distribution on the blade surface. The torque coefficients acting on the single blade at the blade pitch angles of β = 4°, 6°, and 8° reach the maximum values at the upstream region of around θ = 100° and reach the minimum values in the downstream region of around θ = 200°.

4.3. Power Coefficient for the Wind Turbine

Sb-VAWT is an energy conversion device, for which the power coefficient is the core of all design parameters. This section discusses the influence of the blade pitch angle on the power coefficient based on the torque meter measurements and the CFD simulations. In this paper, because both wind tunnel experiments and CFD simulations only involve the energy conversion of the rotor, the power coefficient is estimated purely on the basis of aerodynamics. However, since the power coefficients measured by the torque meter in wind tunnel experiments do not exclude energy loss resulting from the mechanical structure, the results are smaller than those calculated by CFD simulations. The power coefficients obtained by CFD simulations are calculated by Equation (7), in which the torque is obtained from the previous Section 4.2.
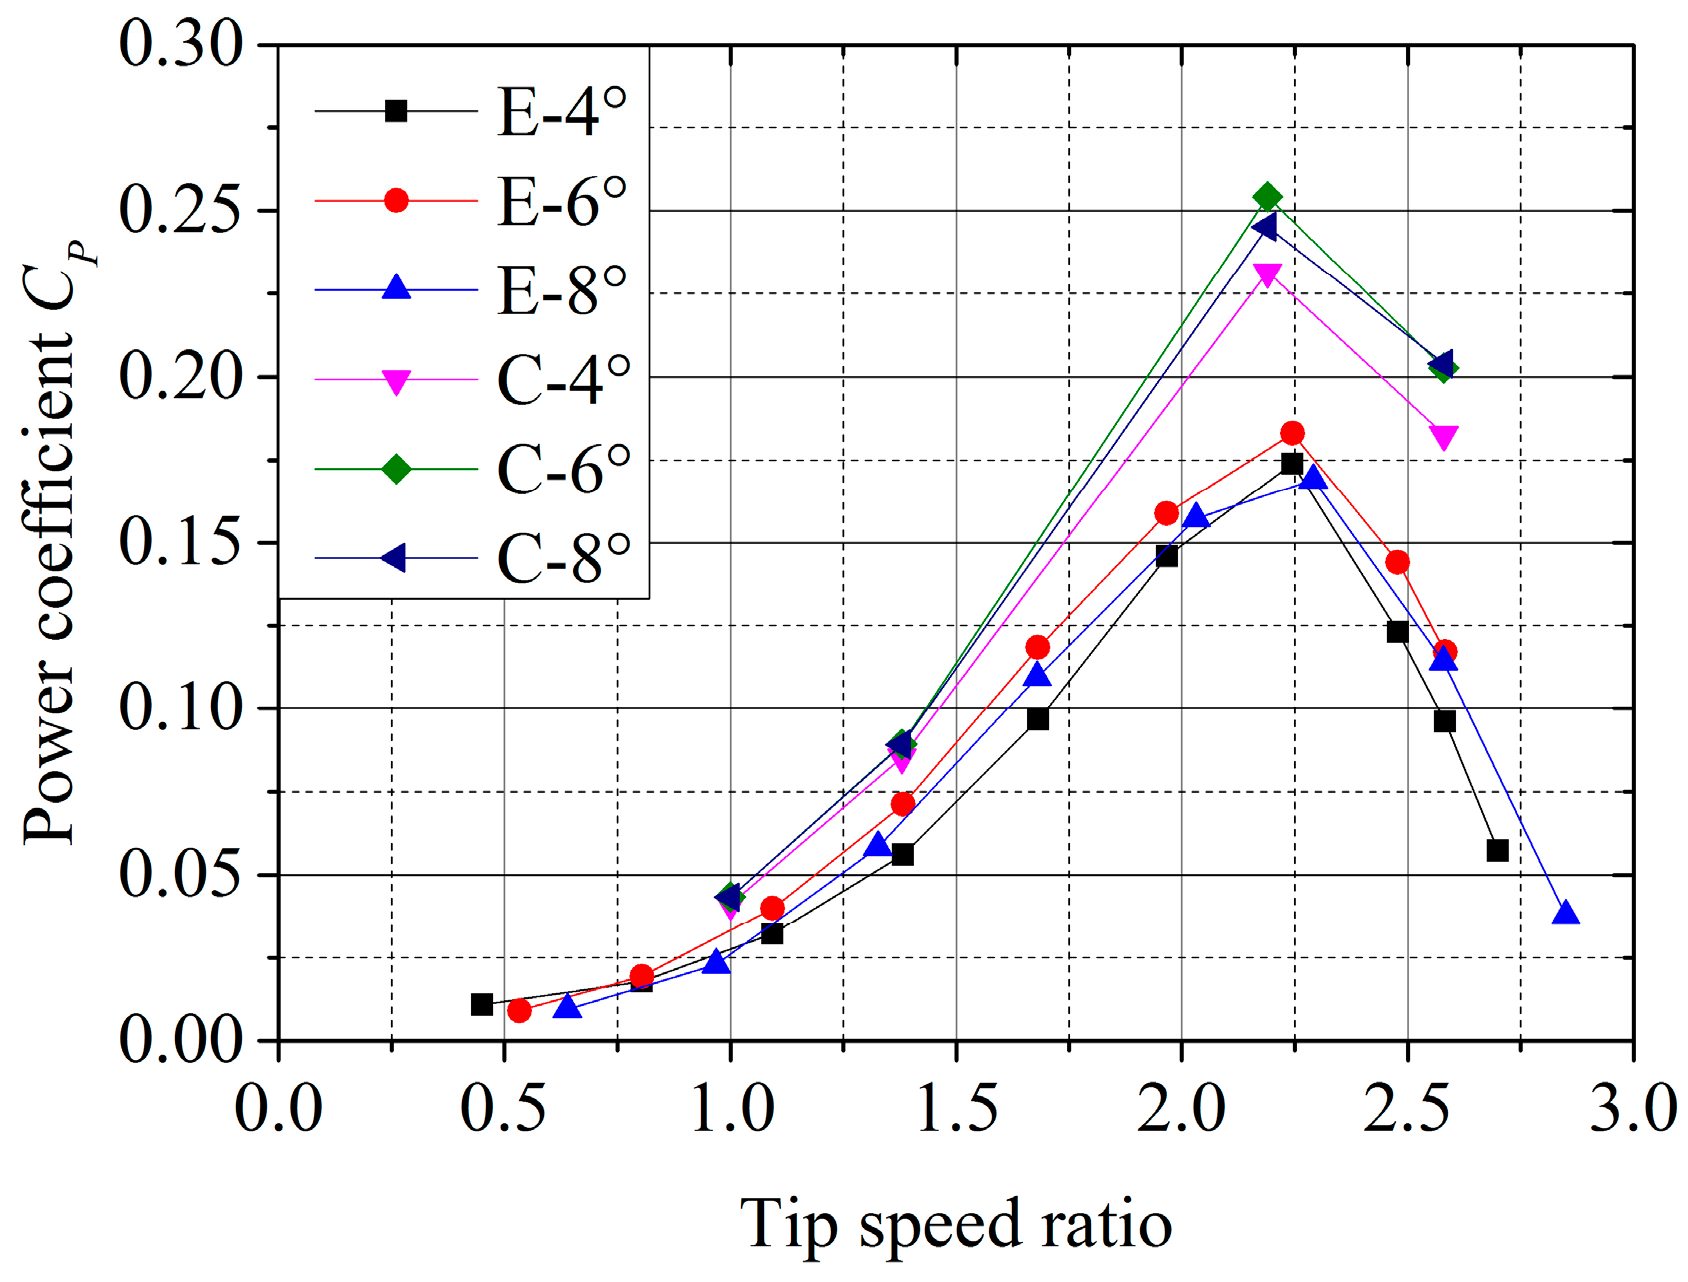
As shown in Figure 14, the power coefficients calculated by CFD simulations can agree well with those measured by the wind tunnel experiments at low tip speed ratio (λ < 1.50), whereas the power coefficients calculated by CFD simulations are significantly different from those measured by the experimental data at high tip speed ratio. The reason is that the model of the CFD simulation ignores the support of the blade and the difference increases with the increase of the tip speed ratio. The power coefficient increases with the increase of tip speed ratio. When tip speed ratio reaches λ = 2.19, the power coefficient reaches the maximum value. With the tip speed ratio continuing to increase, the power coefficient decreases rapidly. This result also has a good agreement with the studies of Lei et al. [37] and Li et al. [38] in 2016. This indicates that when the blade pitch angles are β = 4°, 6° and 8°, the optimal tip speed ratio is 2.19. When the tip speed ratio is 1.38, the power coefficient has the highest value at the pitch angle of β = 4°. Meanwhile, the maximum power coefficient is obtained at the pitch angle of β = 6° when the tip speed ratios are 2.19 and 2.58. In summary, the power coefficient can get an optimal value at the pitch angle of β = 6° in the both CFD simulations and the wind tunnel experiments. Therefore, the optimal blade pitch angle is β = 6° for the Sb-VAWT when the number of blade is two.

5. Conclusions

In this study, the effect of blade pitch angle on the aerodynamic characteristics of the Sb-VAWT was investigated via wind tunnel experiments and CFD simulations, and then the optimal blade pitch angle was identified. The conclusions can be summarized as follows:
(1)
Blade pitch angle effect on pressure distribution acting on single blade surface. When the azimuth angle is in the upstream region, the pressure difference acting on the blade surface reaches maximum at the blade pitch angle of β = 6°. When the azimuth angle is in the downstream region, the pressure difference acting on the blade surface reaches maximum at the blade pitch angle of β = 8°.
(2)
Blade pitch angle effect on torque coefficient acting on single blade. When the azimuth angle is around θ = 100°, the torque coefficient acting on single blade reaches maximum at the pitch angle of β = 6°. When the azimuth angle is around θ = 260°, the maximum torque coefficient is obtained at the blade pitch angle of β = 8°.
(3)
Blade pitch angle effect on power coefficient. At the optimal tip speed ratio of λ = 2.19, the power coefficient is the largest when the blade pitch angle is β = 6°. Compared to HAWT, the blade pitch angle has no significant effect on the power coefficient.

Author Contributions

Y.Y. and Y.Z. conducted the data collection and contributed to the analysis of the results and the writing the manuscript; Q.S. revised the manuscript; Z.G. and Q.L. contributed analysis tools and technical guidance.

Acknowledgments

The authors are grateful for the financial support by the National Natural Science Foundation of China (No. 51765050) and Key Research Project of Shandong Province of China under Grant (No. 2017GGX40124). We are also very grateful to your journal for providing the platform to share scientific research.

Conflicts of Interest

The authors declare no conflict of interest.

Nomenclature

cBlade chord (m)
CQTorque coefficient
CpPressure coefficient
CPowerPower coefficient
DRotor diameter (m)
FdDrag force (N)
FlLife force (N)
FNNormal force (N)
FTTangential force (N)
HSpanwise length (m)
H0Numerical region height (m)
L0Numerical region length (m)
R0Rotor radius (m)
ReReynolds number
U0Mainstream wind velocity (m/s)
WResultant flow velocity to blade (m/s)
W0Numerical region width (m)
aAngle of attack (°)
βBlade pitch angle (°)
θAzimuth angle (°)
λTip speed ratio
ρAir density (kg/m3)
ωAngular frequency (rad/s)

References

  1. CUI Minxuan. China Energy Development Report; Social Science Literature Publishing House: Beijing, China, 2010; pp. 152–170. [Google Scholar]
  2. Global Wind Report 2016. Available online: http://gwec.net/publications/global-wind-report-2/global-wind-report-2016 (accessed on 8 June 2018).
  3. Yu, W.; Zhang, M.M.; Xu, J.Z. Effect of smart rotor control using a deformable trailing edge flap on load reduction under normal and extreme turbulence. Energies 2012, 5, 3608–3626. [Google Scholar] [CrossRef]
  4. Siddiqui, M.S.; Durrani, N.; Akhtar, I. Quantification of the effects of geometric approximations on the performance of a vertical axis wind turbine. Renew. Energy 2015, 74, 661–670. [Google Scholar] [CrossRef]
  5. Dabiri, J.O. Potential order-of-magnitude enhancement of wind farm power density via counter-rotating vertical-axis wind turbine arrays. J. Renew. Sustain. Energy 2011, 3, 043104. [Google Scholar] [CrossRef] [Green Version]
  6. Galinos, C.; Larsen, T.J.; Madsen, H.A.; Paulsen, U.S. Vertical Axis Wind Turbine Design Load Cases Investigation and Comparison with Horizontal Axis Wind Turbine. Energy Procedia 2016, 94, 319–328. [Google Scholar] [CrossRef]
  7. Li, Q.; Maeda, T.; Kamada, Y.; Hiromori, Y. Investigation of wake characteristic of a 30 KW rated power Horizontal Axis Wind Turbine with wake model and field measurement. Appl. Energy 2018, in press. [Google Scholar] [CrossRef]
  8. Beri, H.; Yao, Y. Numerical Simulation of Unsteady Flow to Show Self-starting of Vertical Axis Wind Turbine Using Fluent. J. Appl. Sci. 2011, 11, 962–970. [Google Scholar] [CrossRef]
  9. Ismail, M.F.; Vijayaraghavan, K. The effects of aerofoil profile modification on a vertical axis wind turbine performance. Energy 2015, 80, 20–31. [Google Scholar] [CrossRef]
  10. Li, Q.; Maeda, T.; Kamada, Y.; Murata, J.; Furukawa, K.; Yamamoto, M. Measurement of the Flow Field around Straight-bladed Vertical Axis Wind Turbine. J. Wind Eng. Ind. Aerodyn. 2016, 151, 70–78. [Google Scholar] [CrossRef]
  11. Castelli, M.R.; Betta, S.D.; Benini, E. Effect of blade number on a straight-bladed vertical-axis darrieus wind turbine. World Acad. Sci. Eng. Technol. 2012, 61, 69–75. [Google Scholar]
  12. Wekesa, D.W.; Wang, C.; Wei, Y.; Kamau, J.N.; Danao, L.A.M. A numerical analysis of unsteady inflow wind for site specific vertical axis wind turbine: A case study for Marsabit and Garissa in Kenya. Renew. Energy 2015, 76, 648–661. [Google Scholar] [CrossRef]
  13. Lee, Y.T.; Lim, H.C. Numerical study of the aerodynamic performance of a 500W Darrieus-type vertical-axis wind turbine. Renew. Energy 2015, 83, 407–415. [Google Scholar] [CrossRef]
  14. International Electrotechnical Commission (IEC). 61400-12-1: Wind Turbines—Part 12-1: Power Performance Measurements of Electricity Producing Wind Turbines; IEC: Geneva, Switzerland, 2005. [Google Scholar]
  15. Zhining, H.E.; Liu, Z.; Zhang, Z. Status Quo and Development of Vertical-axis Wind Turbine. Mech. Eng. 2014, 88, 857–878. [Google Scholar]
  16. Chen, C.C.; Kuo, C.H. Effects of pitch angle and blade camber on flow characteristics and performance of small-size Darrieus VAWT. J. Vis. 2013, 16, 65–74. [Google Scholar] [CrossRef]
  17. Soraghan, C.; Leithead, W.; Jamieson, P. Influence of lift to drag ratio on optimal aerodynamic performance of straight blade vertical axis wind turbines. In Proceedings of the European Wind Energy Association Annual Conference, Vienna, Austria, 4–7 February 2013. [Google Scholar]
  18. Maeda, T.; Kamada, Y.; Murata, J.; Li, Q.A.; Kawabata, T.; Kogaki, T. Measurements of flow field and pressure distribution of straight-bladed vertical axis wind turbine. In Proceedings of the European Wind Energy Association Conference and Exhibition 2013, Vienna, Austria, 4–6 February 2013. [Google Scholar]
  19. Li, Q.; Maeda, T.; Kamada, Y.; Murata, J.; Furukawa, K.; Yamamoto, M. Effect of number of blades on aerodynamic forces on a straight-bladed Vertical Axis Wind Turbine. Energy 2015, 90, 784–795. [Google Scholar] [CrossRef]
  20. Sun, X.; Chen, Y.; Cao, Y.; Wu, G.; Zheng, Z.; Huang, D. Research on the aerodynamic characteristics of a lift drag hybrid vertical axis wind turbine. Adv. Mech. Eng. 2016, 8, 1–11. [Google Scholar] [CrossRef]
  21. Battisti, L.; Brighenti, A.; Benini, E.; Castelli, M.R. Analysis of Different Blade Architectures on small VAWT Performance. J. Phys. 2016, 753, 062009. [Google Scholar] [CrossRef] [Green Version]
  22. Abu-El-Yazied, T.G.; Ali, A.M.; Al-Ajmi, M.S.; Hassan, I.M. Effect of number of blades and blade chord length on the performance of Darrieus wind turbine. Am. J. Mech. Eng. Autom. 2015, 2, 16–25. [Google Scholar]
  23. Roh, S.C.; Kang, S.H. Effects of a blade profile, the Reynolds number, and the solidity on the performance of a straight bladed vertical axis wind turbine. J. Mech. Sci. Technol. 2013, 27, 3299–3307. [Google Scholar] [CrossRef]
  24. Li, Q.; Maeda, T.; Kamada, Y.; Murata, J.; Furukawa, K.; Yamamoto, M. Effect of Solidity on Aerodynamic Forces around Straight-Bladed Vertical Axis Wind Turbine by Wind Tunnel Experiments (Depending on Number of Blades). Renew. Energy 2016, 96, 928–939. [Google Scholar] [CrossRef]
  25. Li, Q.; Maeda, T.; Kamada, Y.; Shimizu, K.; Ogasawara, T.; Nakai, A.; Kasuya, T. Effect of rotor aspect ratio and solidity on a straight-bladed vertical axis wind turbine in three-dimensional analysis by the panel method. Energy 2017, 121, 1–9. [Google Scholar] [CrossRef]
  26. Islam, M.; Ting, D.S.K.; Fartaj, A. Desirable airfoil features for smaller-capacity straight-bladed VAWT. Wind Eng. 2007, 31, 165–196. [Google Scholar] [CrossRef]
  27. Danao, L.A.; Qin, N.; Howell, R. A numerical study of blade thickness and camber effects on vertical axis wind turbines. Proc. Inst. Mech. Eng. Part A J. Power Energy 2012, 226, 867–881. [Google Scholar] [CrossRef]
  28. Iida, A.; Mizuno, A.; Kamemoto, K. Prediction of Aerodynamic Noise Radiated from a Vertical-Axis Wind Turbine. In Proceedings of the ASME/JSME 2003 4th Joint Fluids Summer Engineering Conference, Honolulu, HI, USA, 6–10 July 2013; American Society of Mechanical Engineers: New York, NY, USA, 2003; pp. 63–69. [Google Scholar]
  29. Claessens, M.C. The Design and Testing of Airfoils for Application in Small Vertical Axis Wind Turbines. Master’s Thesis, Massachusetts Institute of Technology, Cambridge, MA, USA, 2006; pp. 1–113. [Google Scholar]
  30. Armstrong, S.; Tullis, S. Power performance of canted blades for a vertical axis wind turbine. J. Renew. Sustain. Energy 2011, 3, 13–106. [Google Scholar] [CrossRef]
  31. Zheng, Y. Analysis of Aerodynamic Performance of the Small H-Type Vertical Axis Wind Turbine. Master’s Thesis, Southwest Jiaotong University, Chengdu, China, 2008; pp. 35–37. [Google Scholar]
  32. Jin, X. Study on Aerodynamic Performance of Vertical Wind Turbine with Straight Blade. J. Xi’an Univ. Technol. 2010, 3, 18–19. [Google Scholar]
  33. Li, Q.; Maeda, T.; Kamada, Y.; Murata, J.; Kawabata, T.; Shimizu, K.; Ogasawara, T.; Nakai, A.; Kasuya, T. Wind tunnel and numerical study of a straight-bladed vertical axis wind turbine in three-dimensional analysis (Part I: For predicting aerodynamic loads and performance). Energy 2016, 106, 443–452. [Google Scholar] [CrossRef]
  34. Li, Q.; Maeda, T.; Kamada, Y.; Hiromori, Y.; Nakai, A.; Kasuya, T. Study on stall behavior of a straight-bladed vertical axis wind turbine with numerical and experimental investigations. J. Wind Eng. Ind. Aerodyn. 2017, 164, 1–12. [Google Scholar] [CrossRef]
  35. Li, Q.; Kamada, Y.; Maeda, T.; Murata, J.; Iida, K.; Okumura, Y. Fundamental study on aerodynamic force of floating offshore wind turbine with cyclic pitch mechanism. Energy 2016, 99, 20–31. [Google Scholar] [CrossRef]
  36. Yang, Y.; Guo, Z.; Zhang, Y.; Jinyama, H.; Li, Q. Numerical Investigation of the Tip Vortex of a Straight-Bladed Vertical Axis Wind Turbine with Double-Blades. Energies 2017, 10, 1721. [Google Scholar] [CrossRef]
  37. Lei, H.; Zhou, D.; Lu, J.; Chen, C.; Han, Z.; Bao, Y. The impact of pitch motion of a platform on the aerodynamic performance of a floating vertical axis wind turbine. Energy 2017, 119, 369–383. [Google Scholar] [CrossRef]
  38. Li, Q.; Maeda, T.; Kamada, Y.; Murata, J.; Kawabata, T.; Shimizu, K.; Ogasawara, T.; Nakai, A.; Kasuya, T. Wind tunnel and numerical study of a straight-bladed Vertical Axis Wind Turbine in three-dimensional analysis (Part II: For predicting flow field and performance). Energy 2016, 104, 295–307. [Google Scholar] [CrossRef]
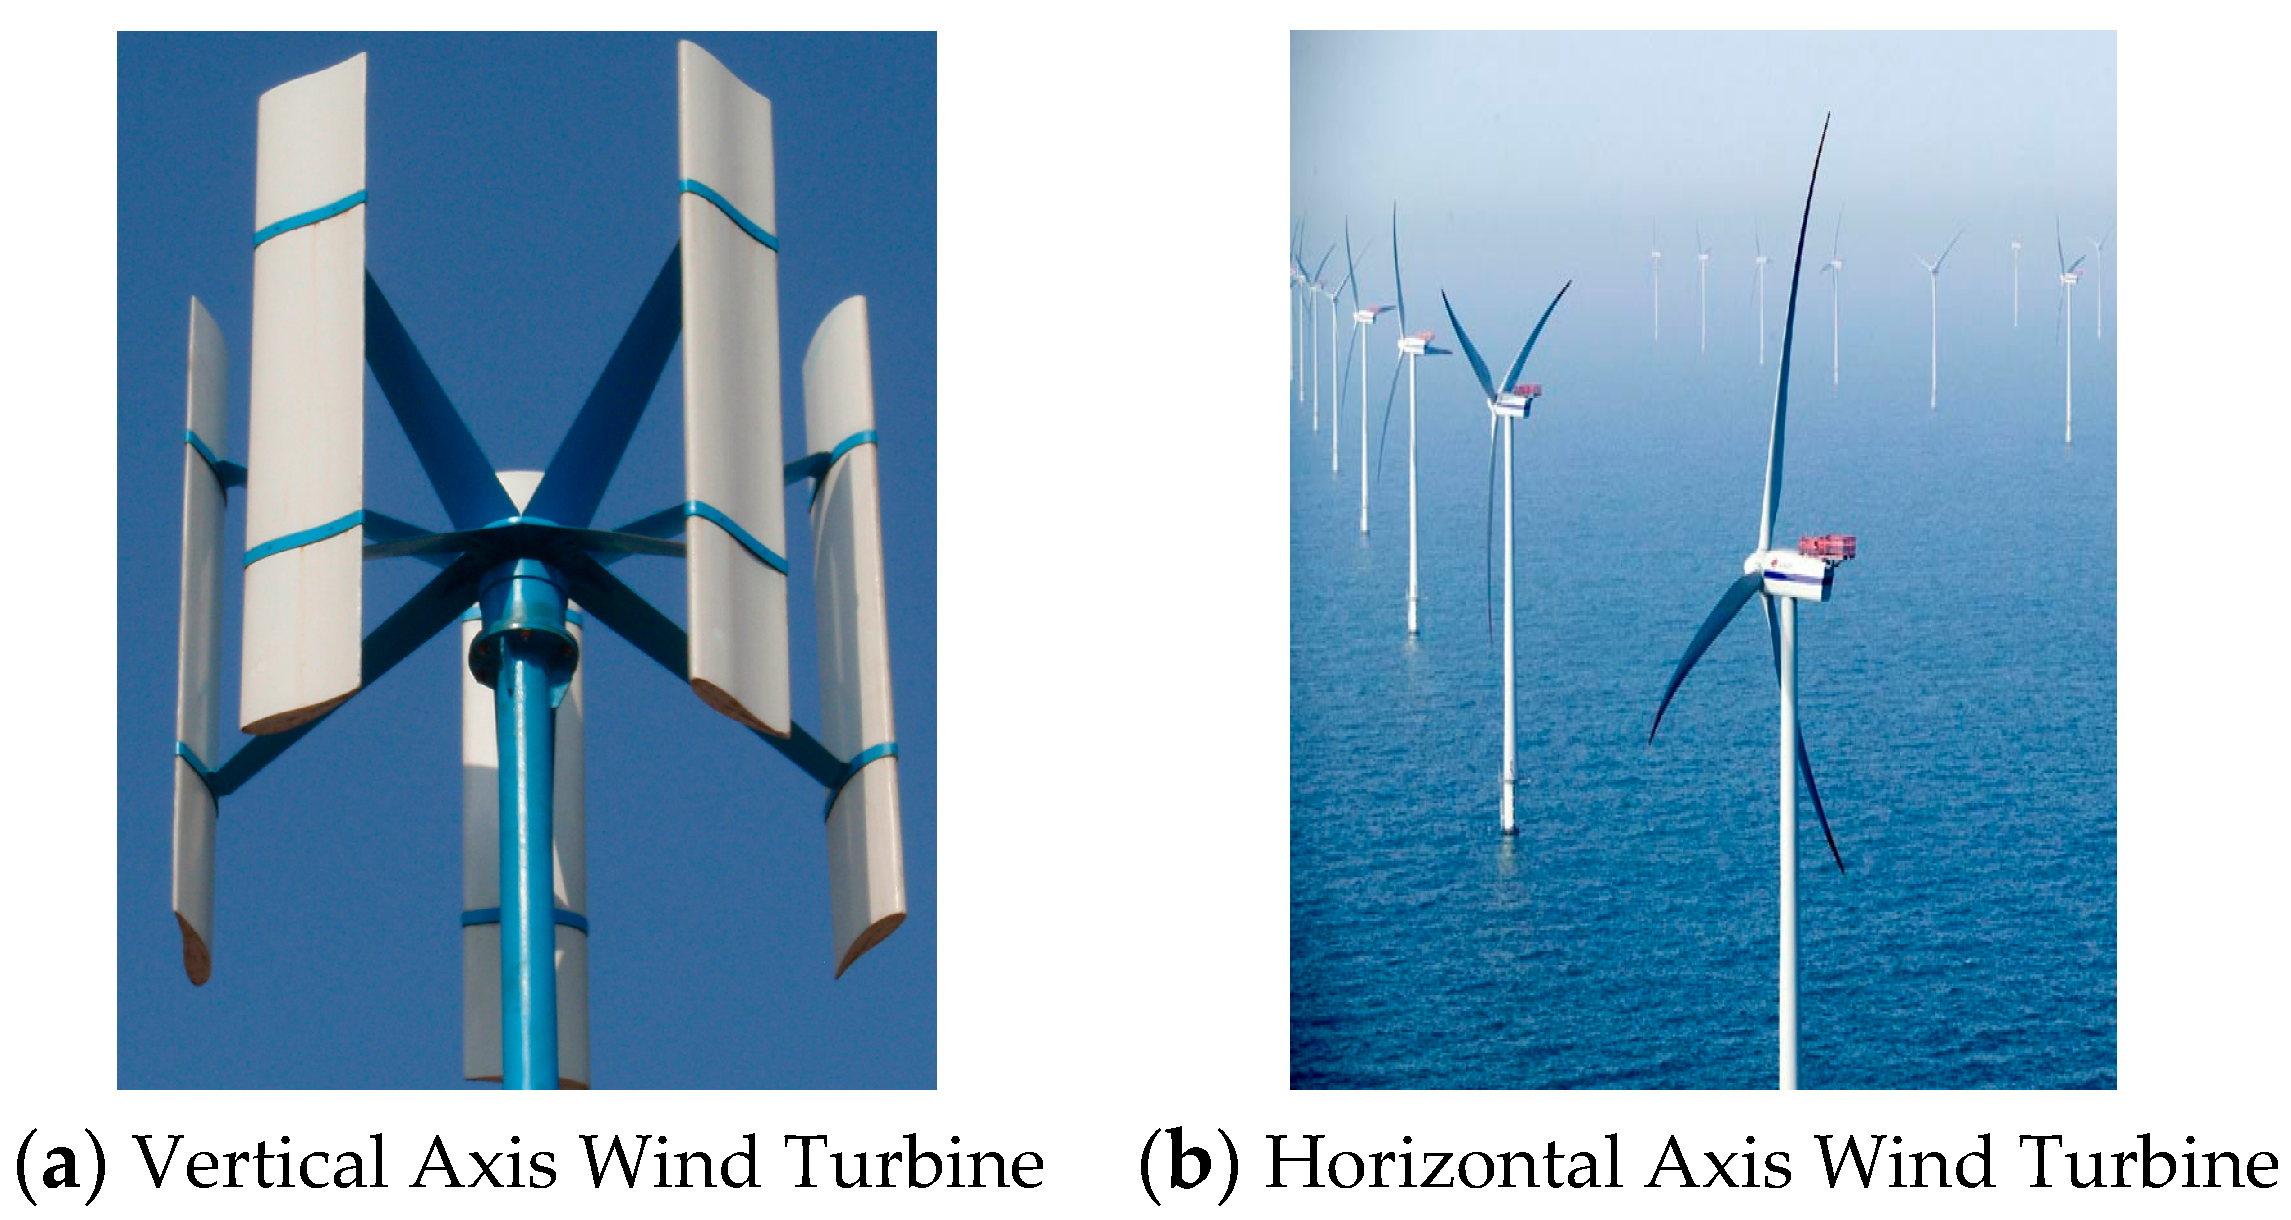
Figure 1. Types of wind turbine.
Energies 11 01514 g001
Figure 2. Definitions of velocity and force.
Energies 11 01514 g002
Figure 3. A Three-dimensional model of Sb-VAWT.
Energies 11 01514 g003
Figure 4. Computation of the domain meshes.
Energies 11 01514 g004
Figure 5. Rotating region mesh.
Energies 11 01514 g005
Figure 6. Mesh near blade.
Energies 11 01514 g006
Figure 7. A schematic diagram of Sb-VAWT in the wind tunnel measurement.
Energies 11 01514 g007
Figure 8. Calibration of dynamic response in air of tubing.
Energies 11 01514 g008
Figure 9. Distribution of pressure taps on blade surface.
Energies 11 01514 g009
Figure 10. Monitor of torque of rotor for CFD simulations.
Energies 11 01514 g010
Figure 11. Torque coefficients acting on the single blade obtained from CFD simulations and wind tunnel experiments at pitch angle of β = 6°.
Energies 11 01514 g011
Figure 12. Pressure distribution acting on blade surface at different azimuth angles of 0° ≤ θ ≤ 360° and at different blade pitch angles of β = 4°, 6°and 8°, respectively. (a) Azimuth angle θ = 0°; (b) Azimuth angle θ = 30°; (c) Azimuth angle θ = 60°; (d) Azimuth angle θ = 90°; (e) Azimuth angle θ = 120°; (f) Azimuth angle θ = 150°; (g) Azimuth angle θ = 180°; (h) Azimuth angle θ = 210°; (i) Azimuth angle θ = 240°; (j) Azimuth angle θ = 270°; (k) Azimuth angle θ = 300°; (l) Azimuth angle θ = 330°.
Energies 11 01514 g012aEnergies 11 01514 g012b
Figure 13. Torque coefficients acting on the single blade obtained from CFD simulations at different pitch angles of β = 4°, 6°and 8°, respectively.
Energies 11 01514 g013
Figure 14. Power coefficients of rotor obtained from CFD simulations and wind tunnel experiments at the different pitch angles of β = 4°, 6° and 8°, respectively.
Energies 11 01514 g014
Table 1. Boundary conditions.
TypeBoundary Conditions
Boundary of inlet surfaceVelocity-inlet
Boundary of outlet surfacePressure-outlet
Boundaries of other outside surfacesSymmetry
Boundaries of junction surfaceInterface
Boundaries of blade surfacesWall
Boundaries of other defaultsWall
Table 2. Comparison of pressure difference on the blade surface at different blade pitch angles of β = 4°, 6°, and 8°.
RegionsAzimuth AngleComparison of Pressure Difference on the Blade Surface
Upstream region4° > 6° > 8°
30°4° > 6° > 8°
60°8° > 6° > 4°
90°6° > 8° > 4°
120°6° > 4° > 8°
150°6° > 4° > 8°
Lower region180°6° > 4° > 8°
210°8° > 6° > 4°
240°8° > 6° > 4°
270°8° > 6° > 4°
300°8° > 6° > 4°
330°4° > 6° > 8°