Power Generation Expansion Optimization Model Considering Multi-Scenario Electricity Demand Constraints: A Case Study of Zhejiang Province, China


Abstract
1. Introduction
2. Methodology and Data
2.1. PGE-Zhejiang Model
2.1.1. Objective Function
- (1)
- Total investment cost. To take into account the continuous innovation of power generation technology, a parameter α is introduced in Equation (2), that is, the rate of change in investment costs [14].
- (2)
- Total operation and maintenance cost. To take into account the complexity and diversity of components in O&M costs, a parameter β is introduced in Equation (3), that is, the rate of change in O&M costs [14].
- (3)
- Total fuel cost. To take into account the finiteness of resources, a parameter γ is also introduced in Equation (4), that is, the rate of change in fuel costs.
- (4)
- Total environment cost. The total environment cost includes two components, the former part is the environmental costs for conventional plants (coal-fired plants and natural gas plants) and biomass power plants, and the latter part is the environmental costs for nuclear plants [10].
- (5)
- Total external electricity procurement cost.
2.1.2. Physical Constraints
- (1)
- Demand and supply balance of electricity and power. In this paper, the unit for electricity is TW-h, and GW for power. Given that the electricity supply planning scheme has to meet the province’s increasing electricity demand, this study presents four specific sub-constraints, as shown in Equations (7)–(10). The parameter η in Equation (9) is the proportional coefficient of purchased electricity and total electricity demand, which is estimated from the electricity data in [15]. The parameter ψ in Equation (10) is the proportional coefficient of purchased power and total peak load demand, also estimated from the power data in [15].
- (2)
- Power system security operation. Taking into account the intermittent nature of renewable energy power generation technology, the parameter ω, represents the safe operation coefficient of the power system, which is used in Equation (11) [4]. The parameter ρ in Equation (12) is the load margin coefficient, which is used to meet the peak load demand.
- (3)
- Installed capacity within the planning horizon. The cumulative installed capacity in 2020 should be lower than the capacity in the planning document [15].
- (4)
- Non-negative decision variables.
2.1.3. Data Sources
2.2. LEAP-Zhejiang-Electricity Model
2.2.1. Model Description
2.2.2. Data Sources
3. Results and Discussion
3.1. Results Analysis of Power Generation Expansion during the Planning Horizon
3.2. Cost-Benefit Analysis of PGE-Zhejiang Model during the Planning Horizon
3.3. Results Analysis of LEAP-Zhejiang-Electricity Model
3.4. Results Analysis of Power Generation Expansion under Multi-Scenario Electricity Demand Constraints
3.4.1. Results Analysis of Parameters Optimization
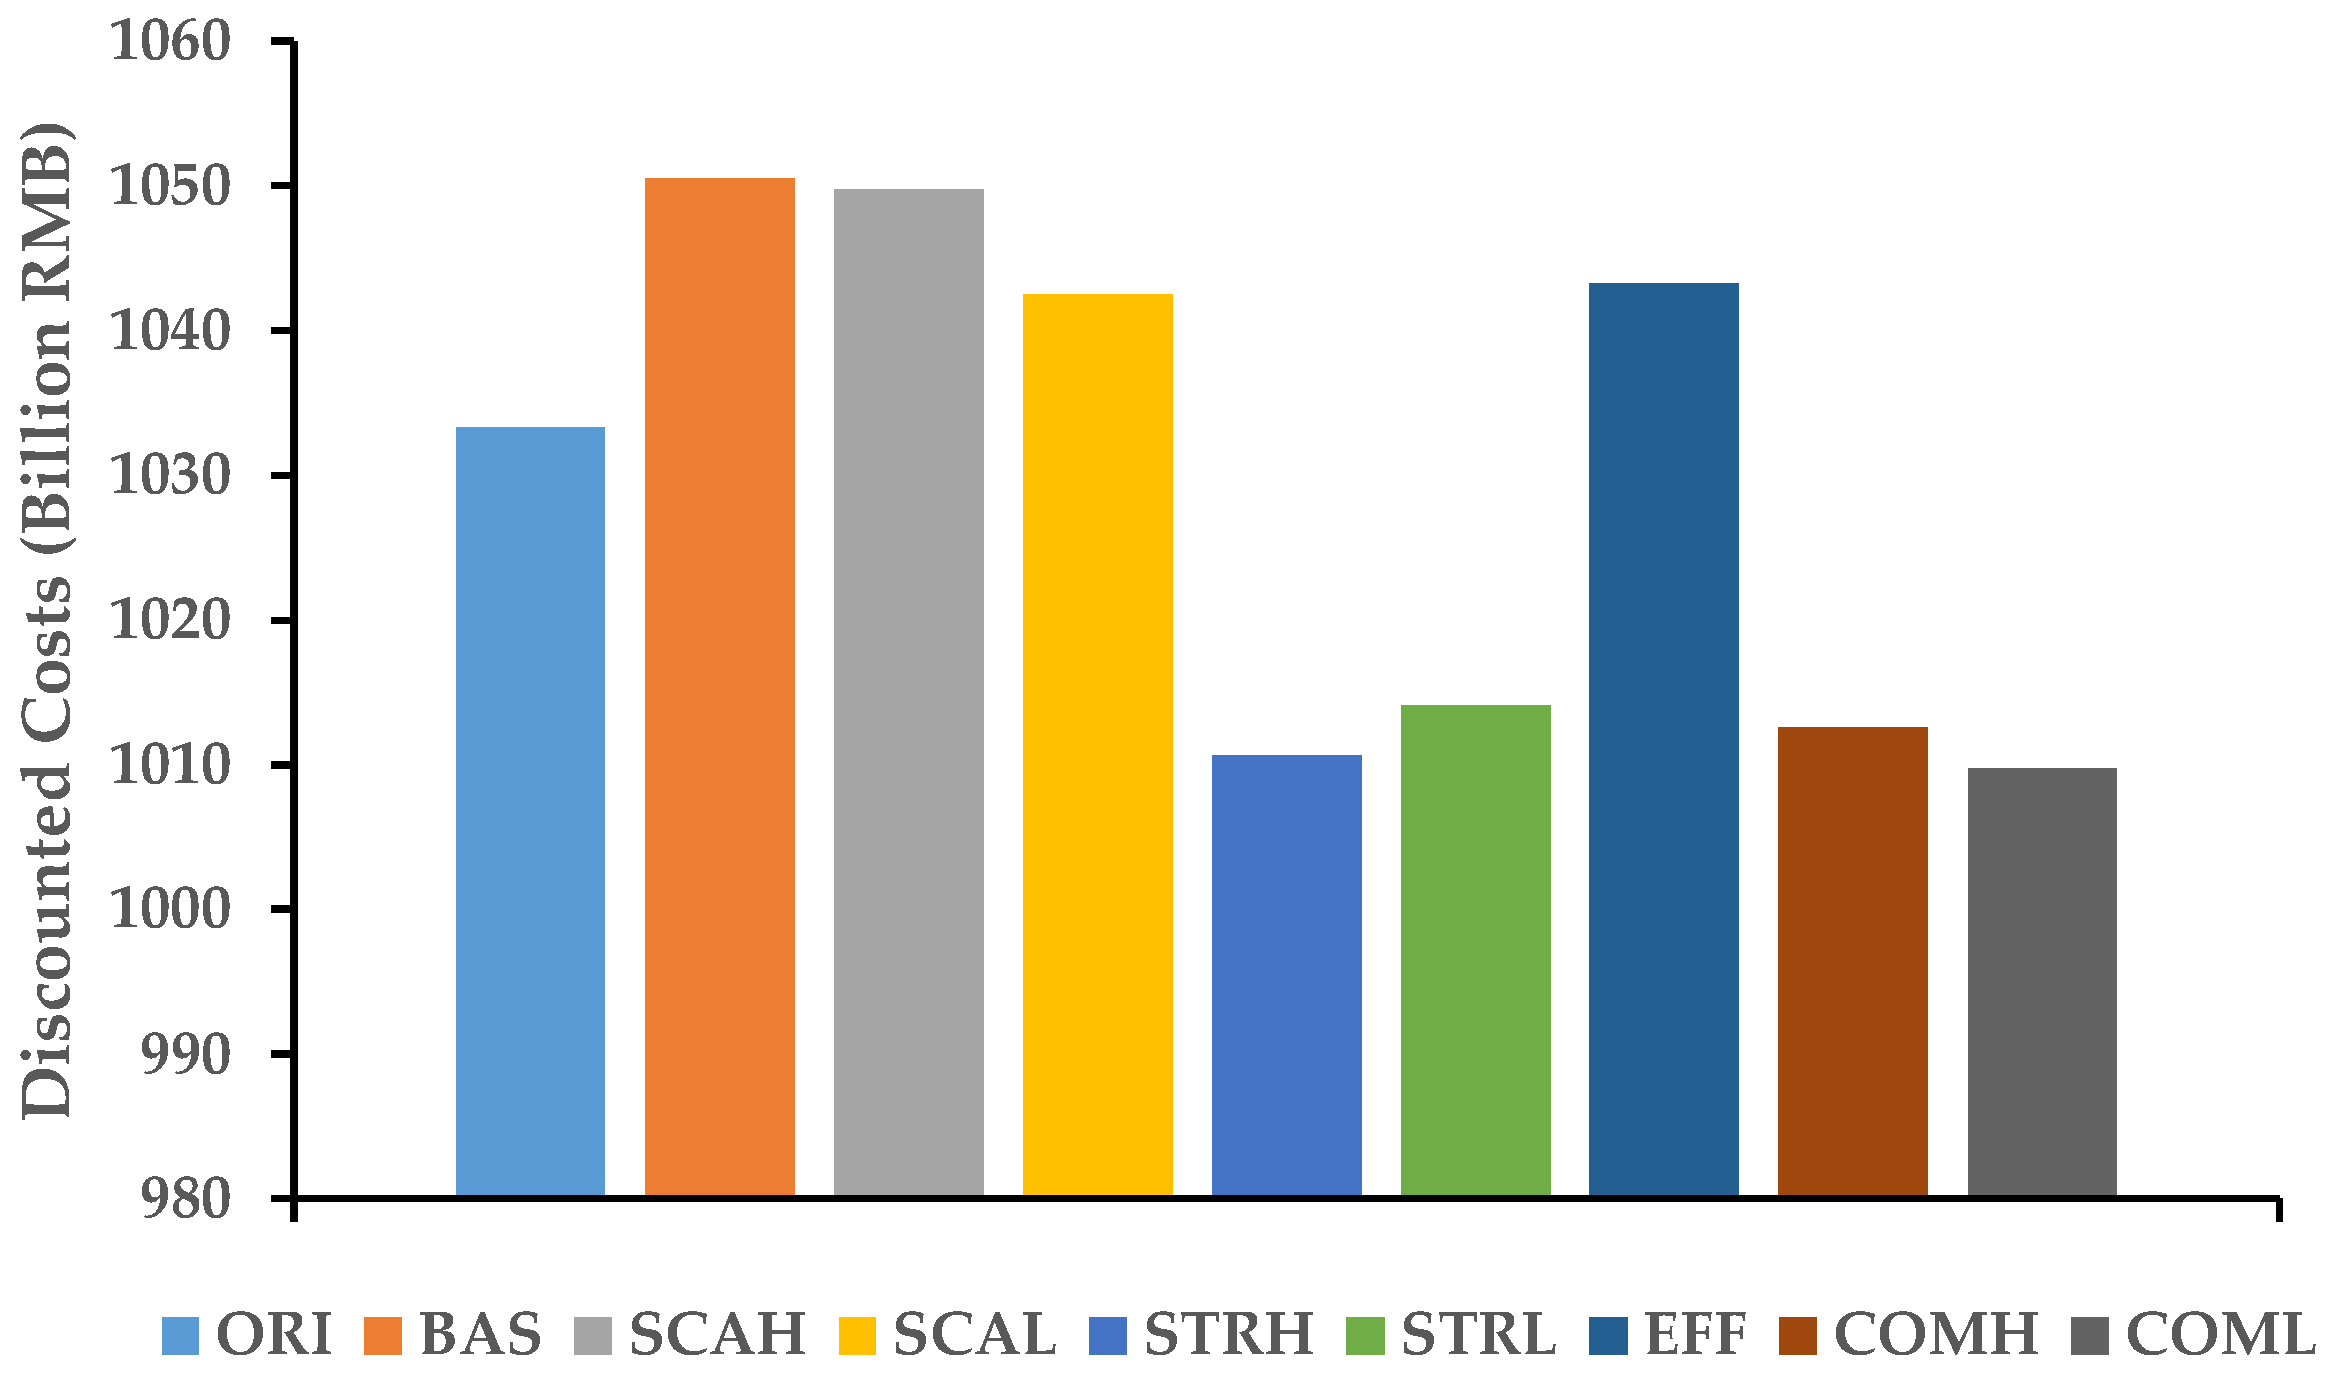
3.4.2. Analysis of Total Discounted Costs under Different Electricity Demand Scenarios
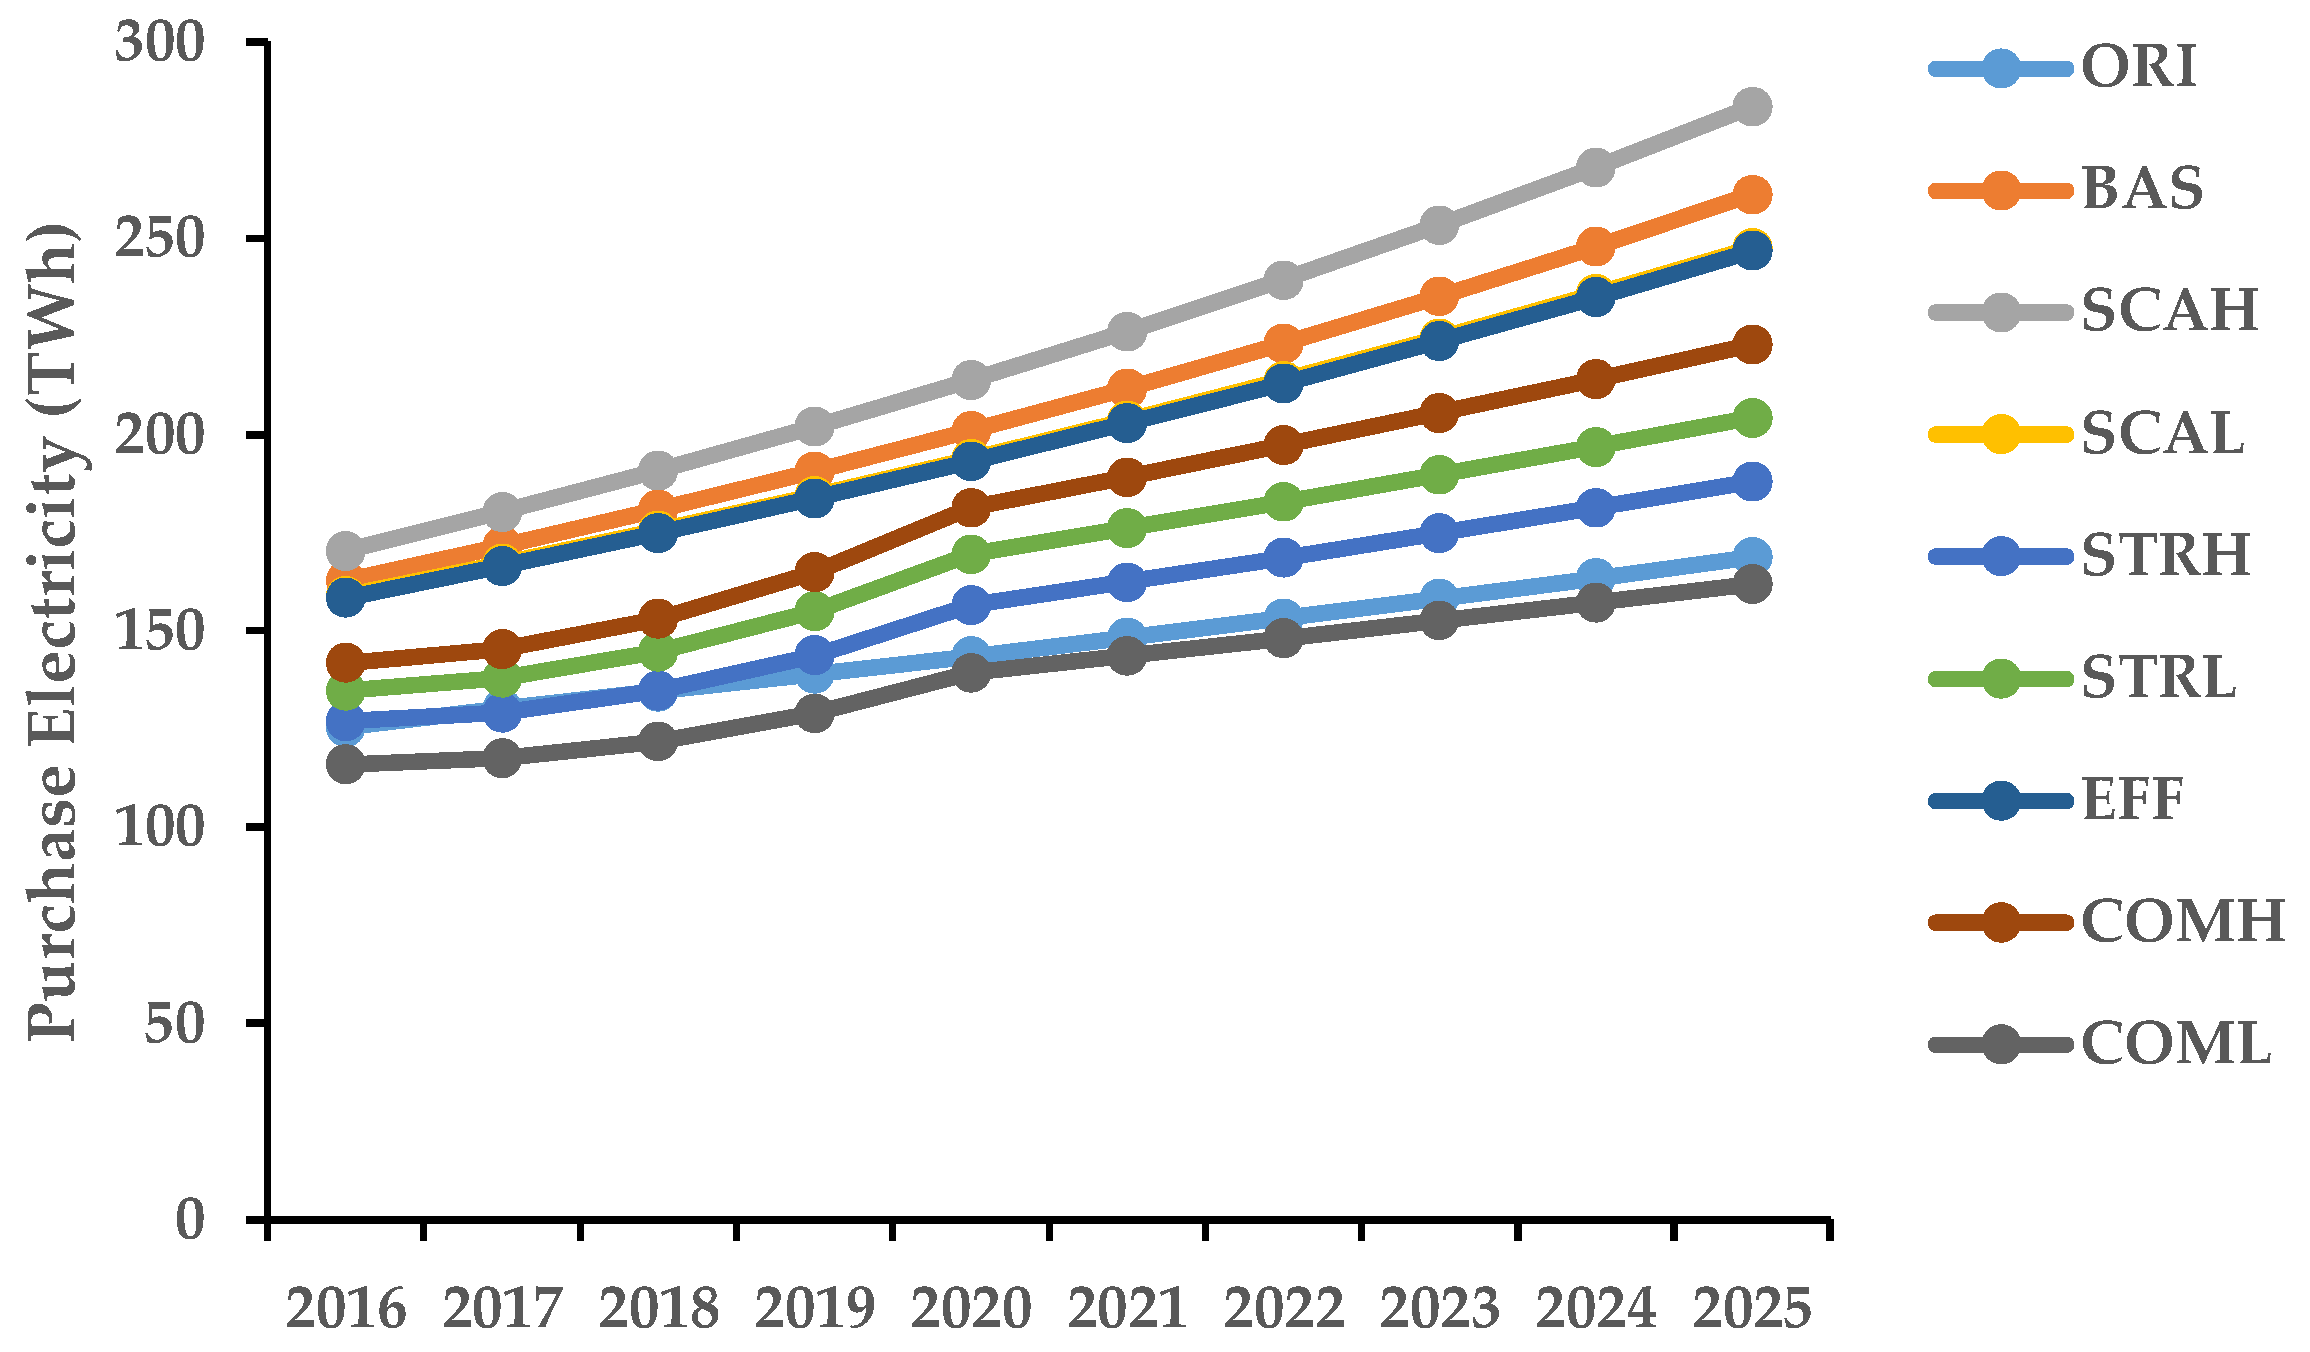
3.4.3. Comparisons of External Purchased Electricity under Different Scenarios
4. Conclusions
- (1)
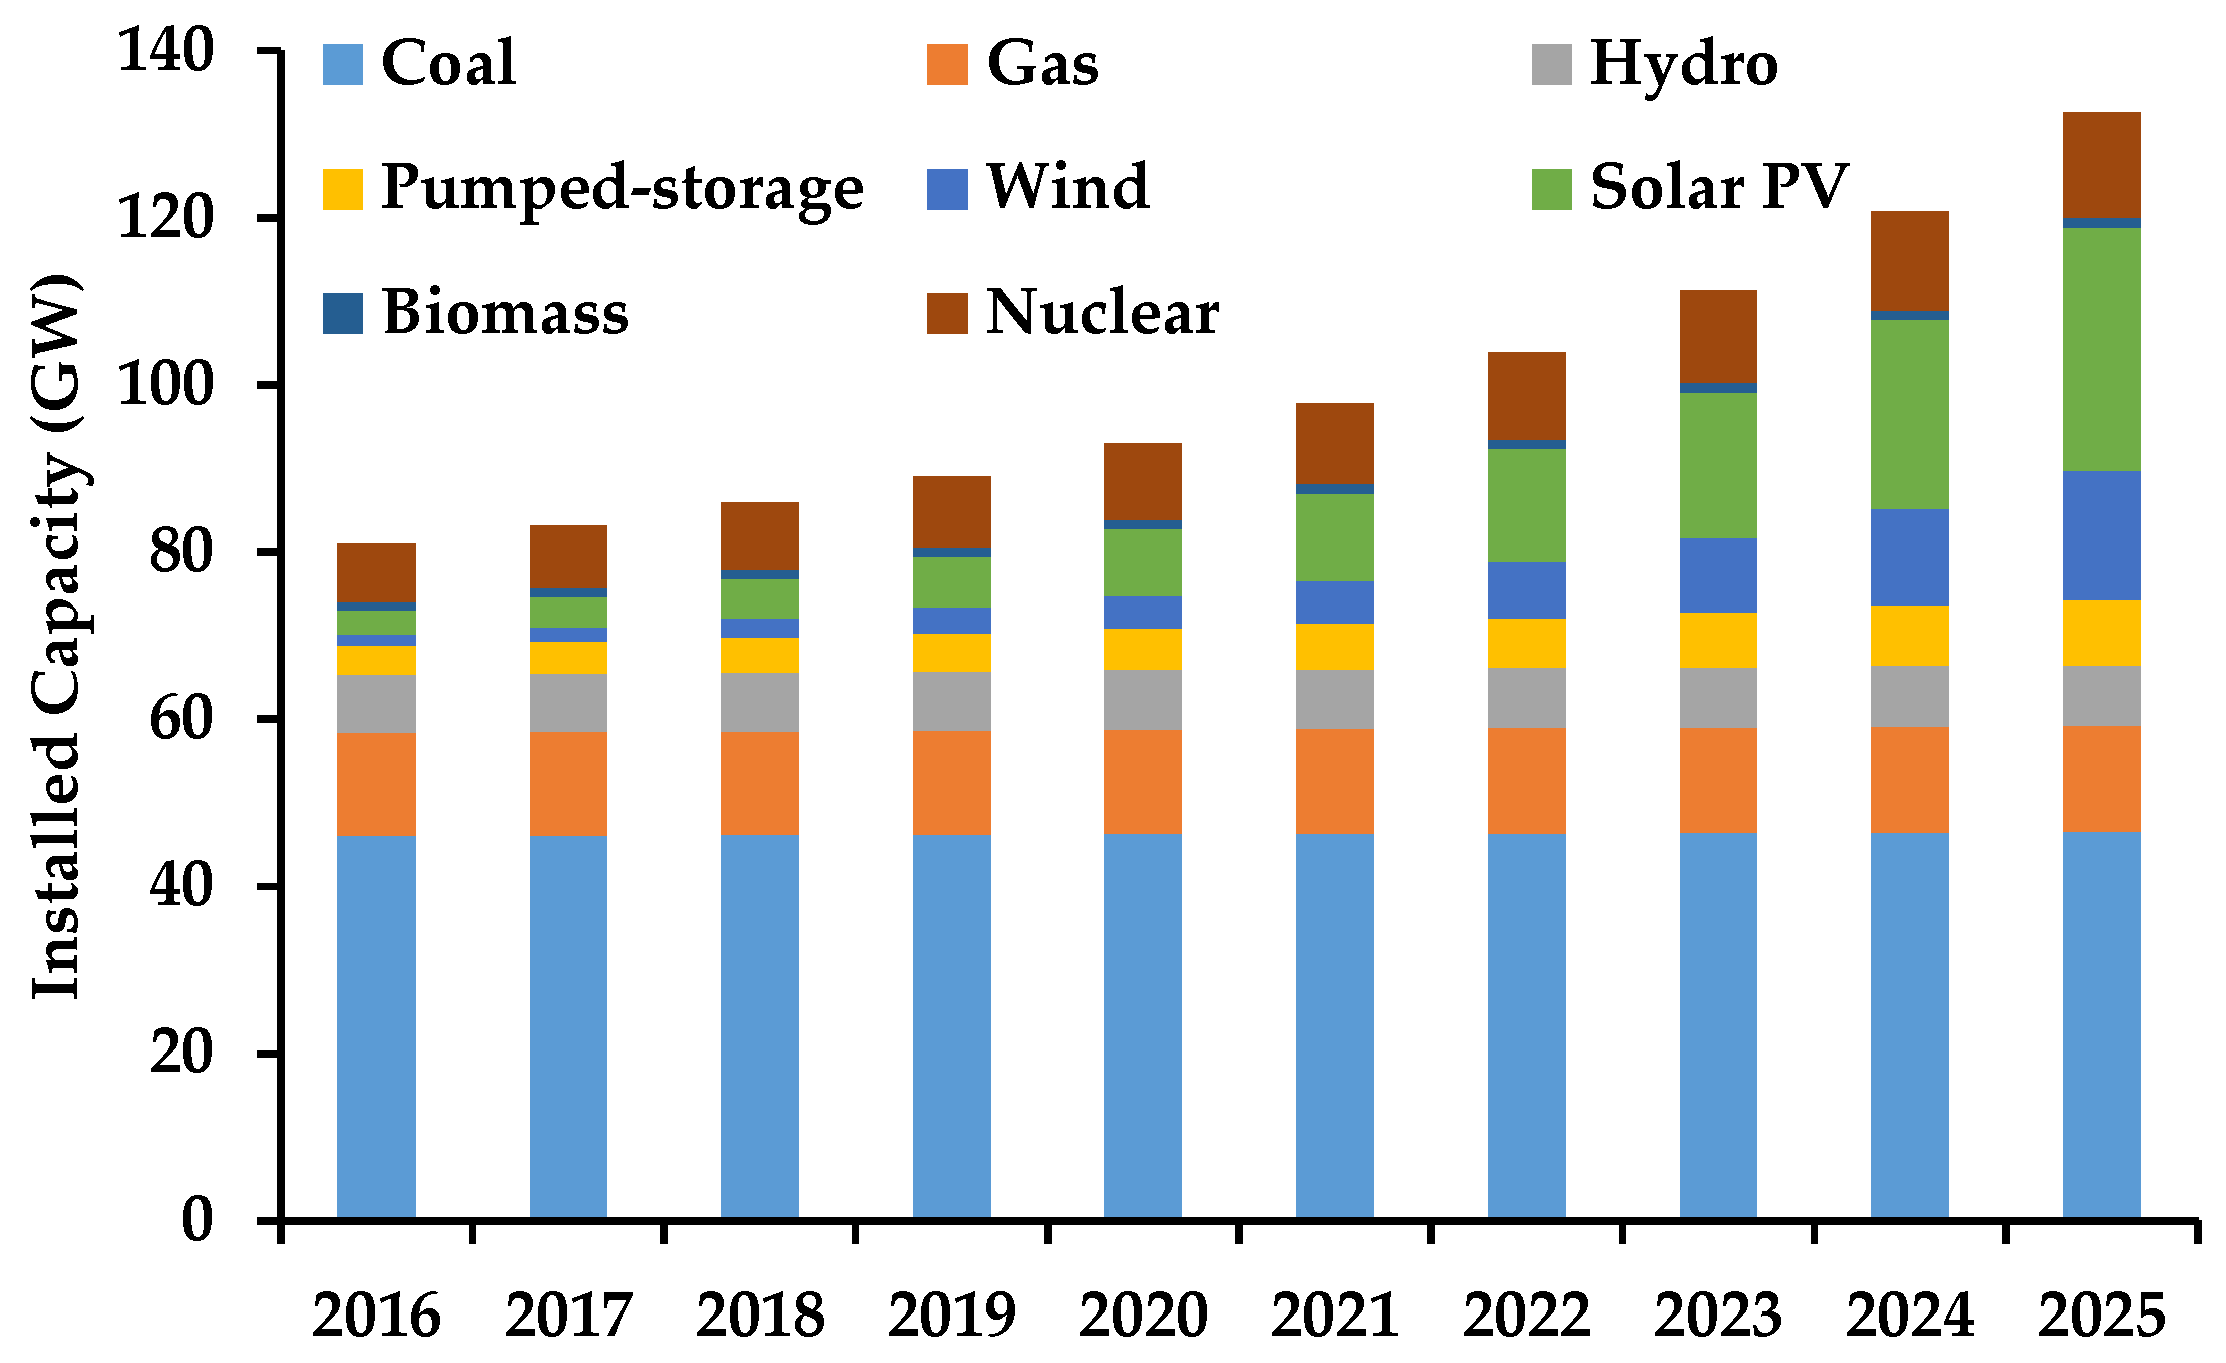
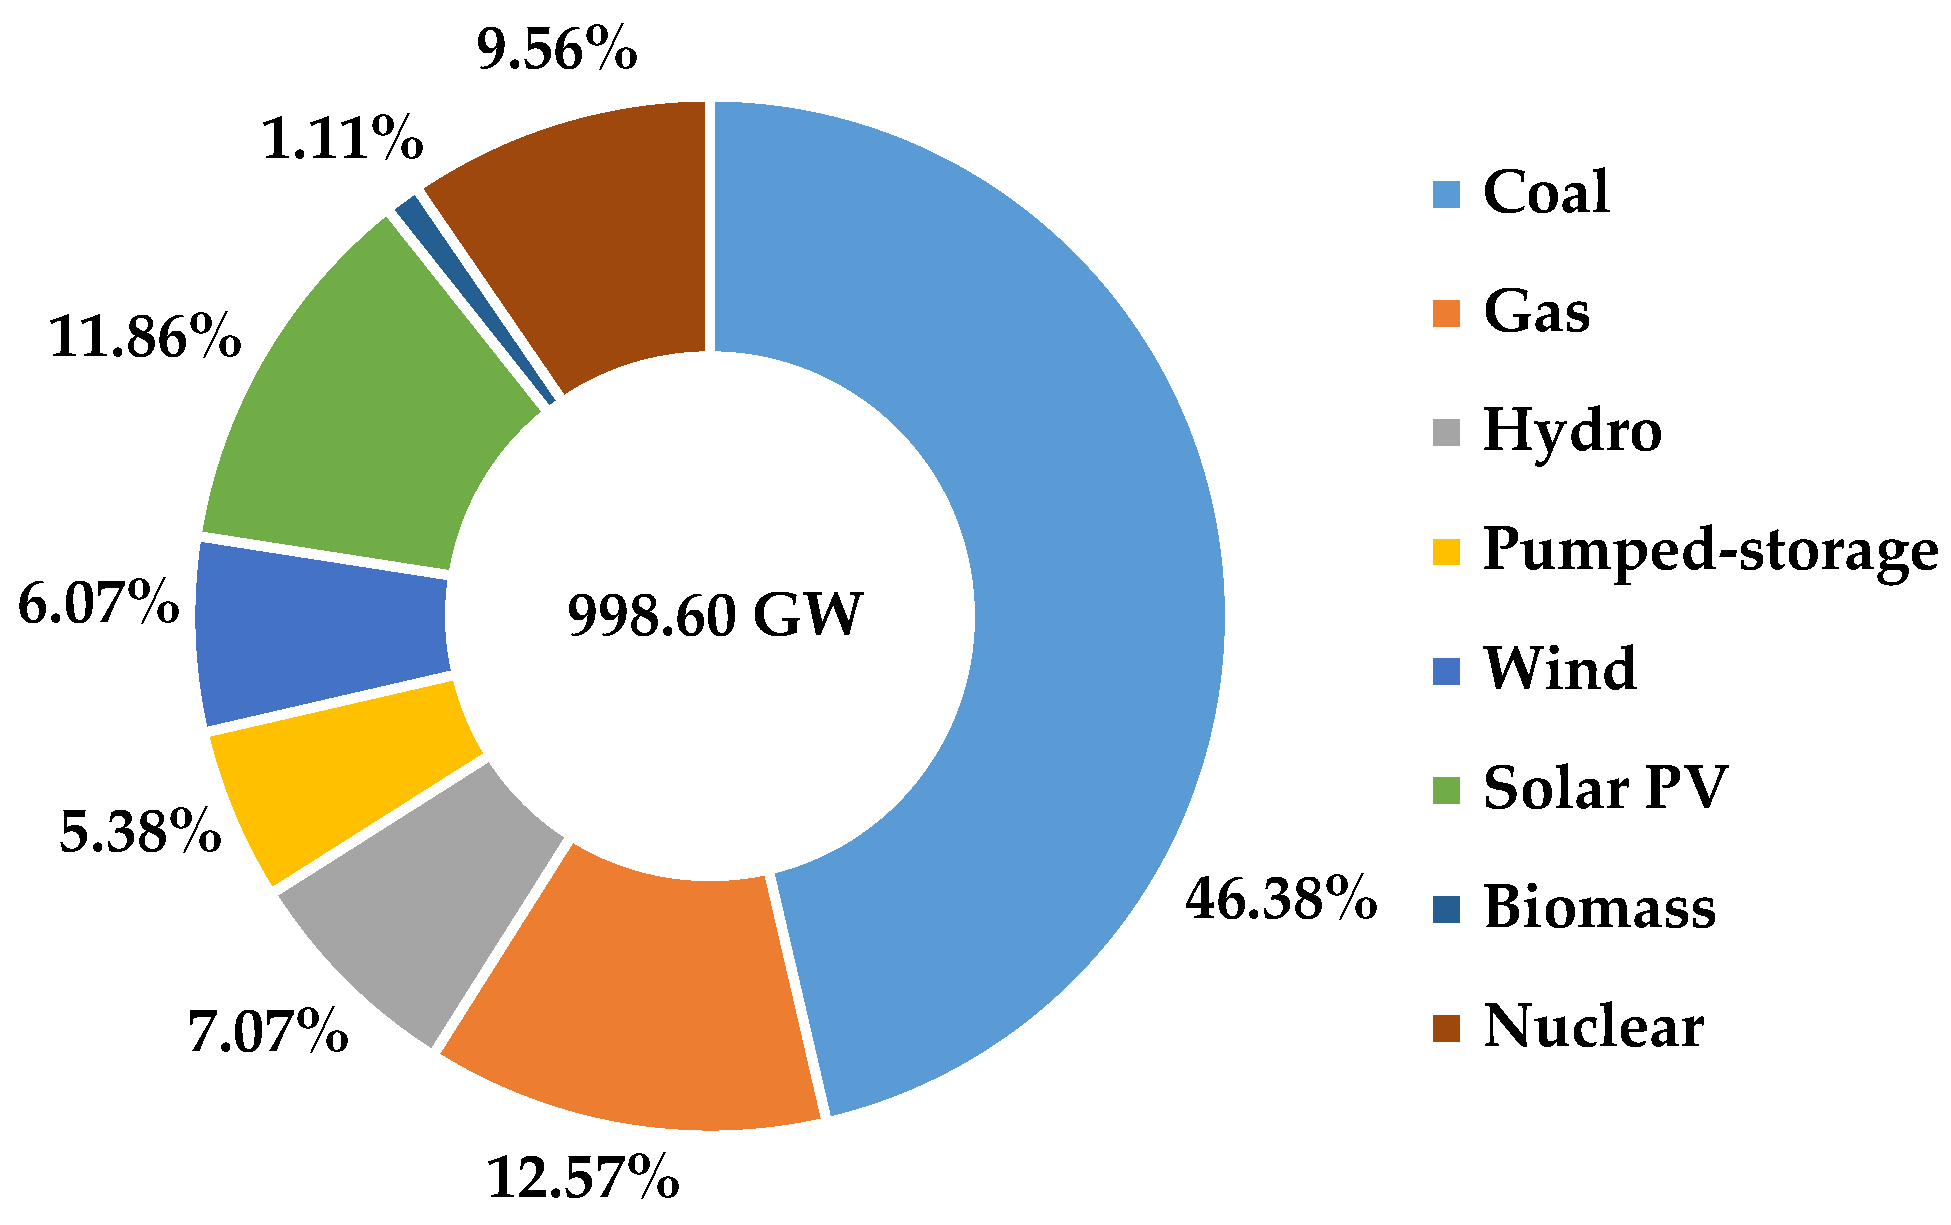
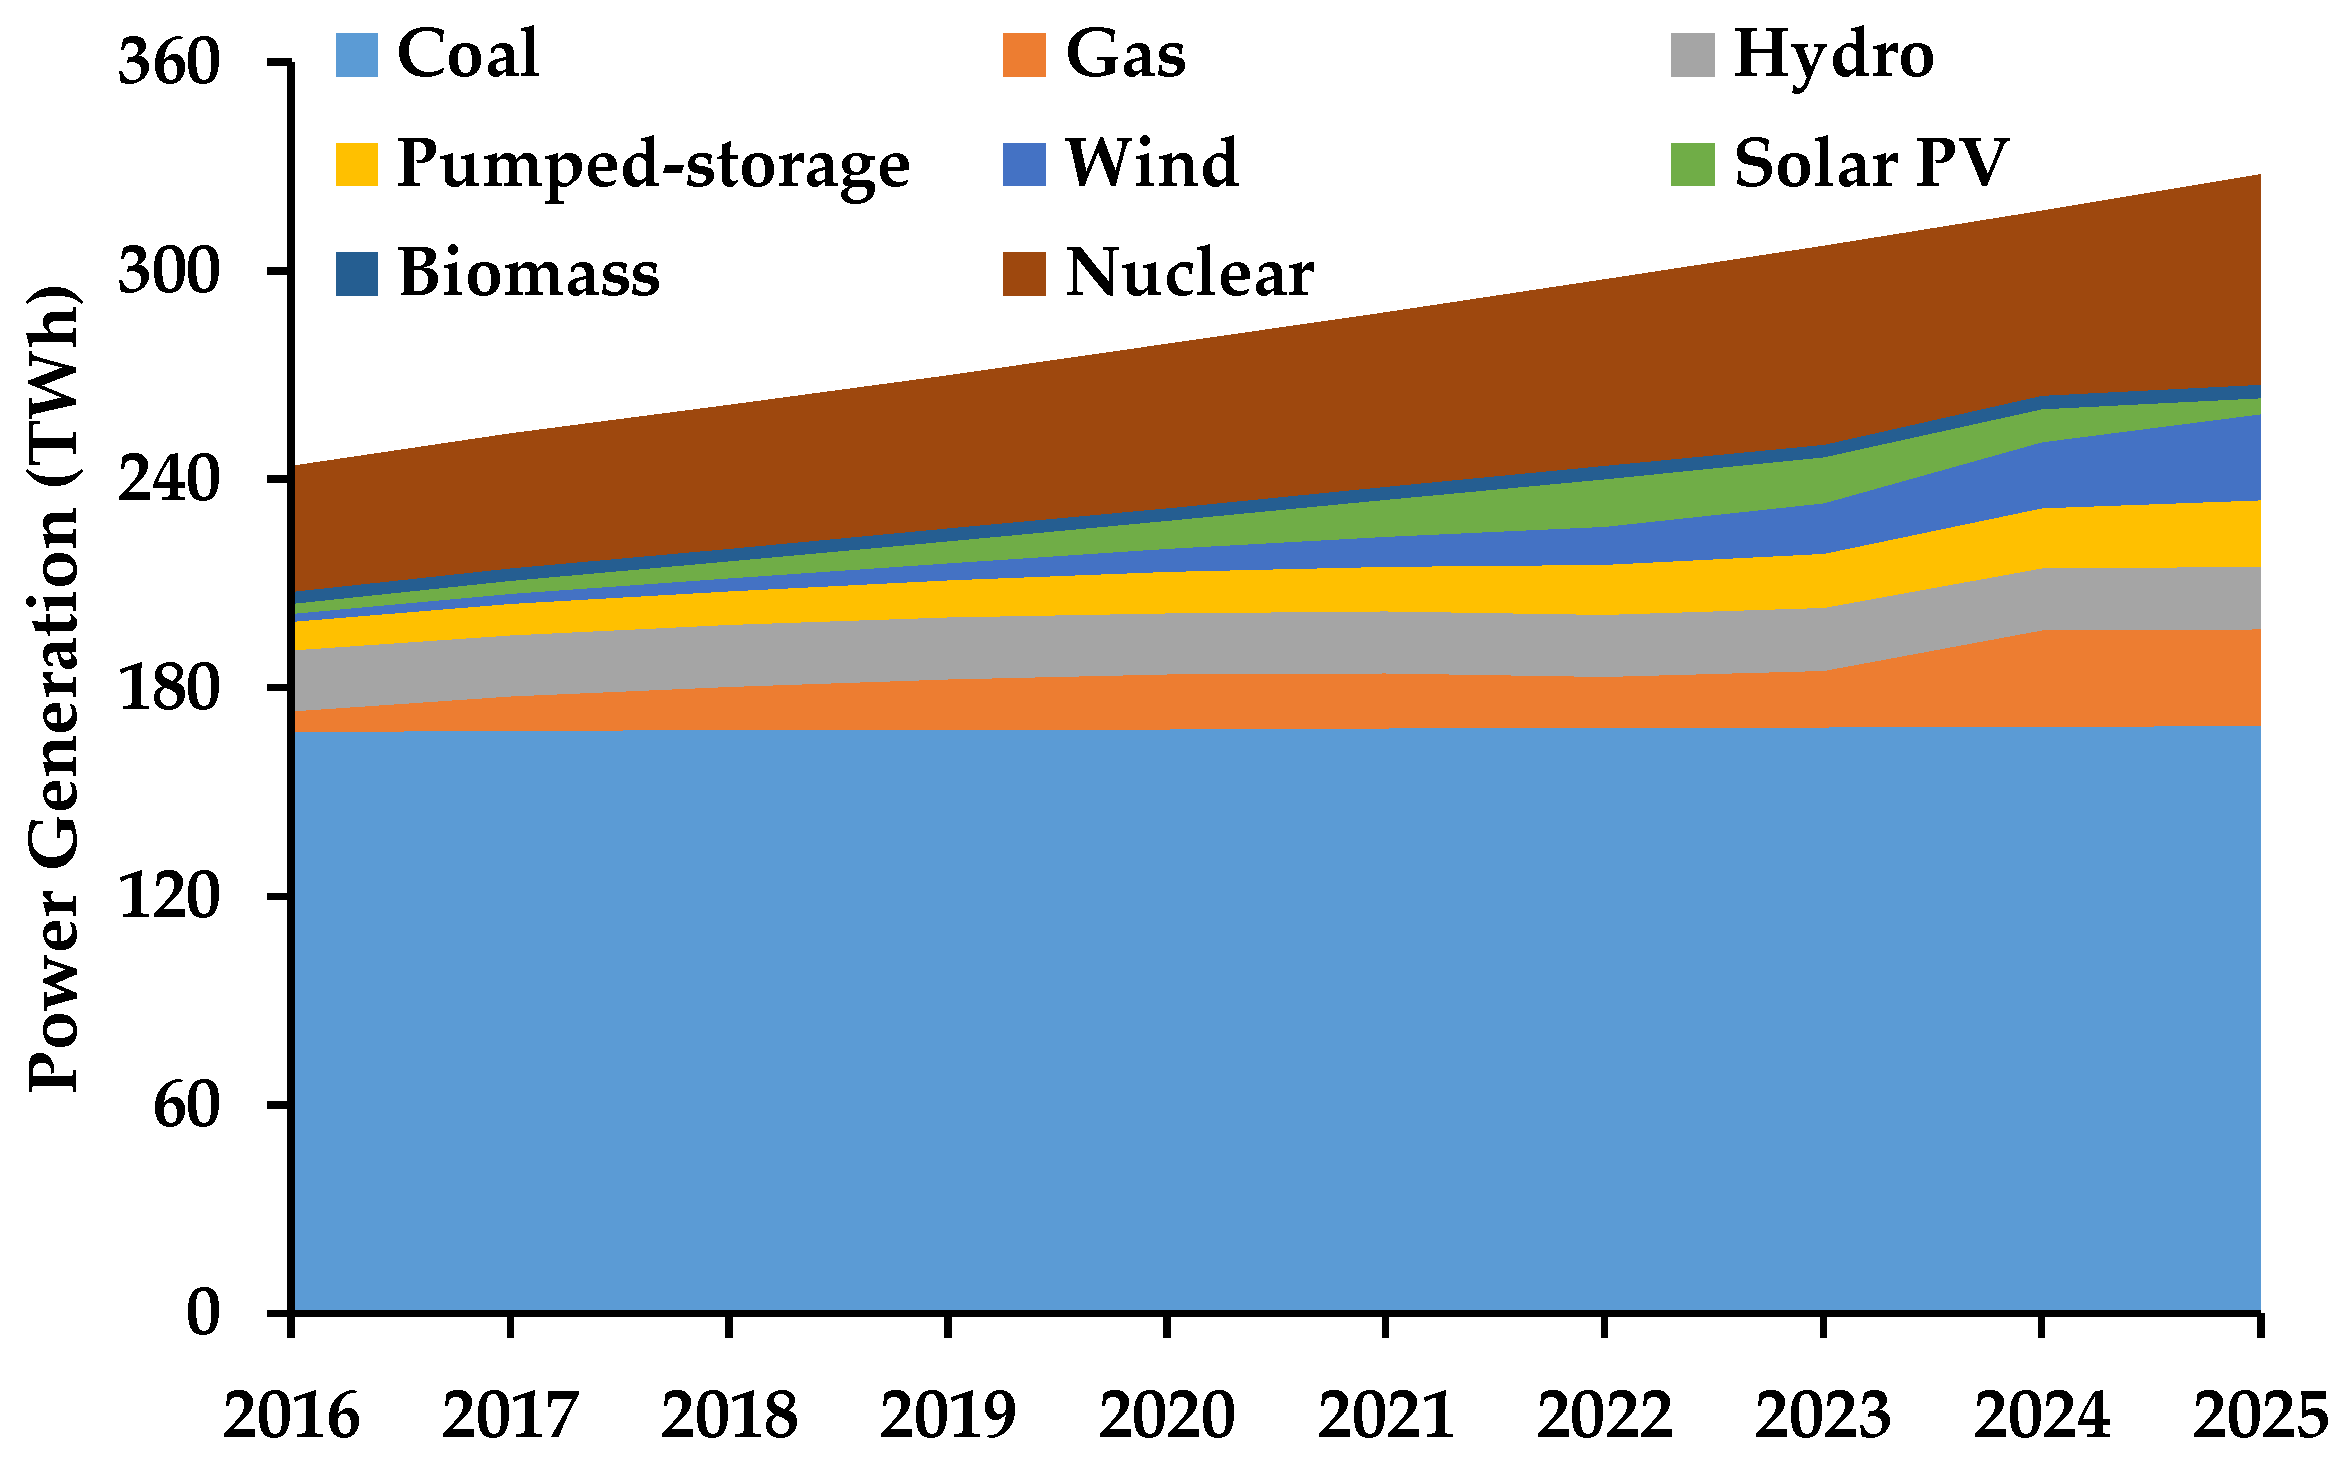
- Although the total installed capacity of nuclear power plants accounts for only 9.56% of the total installed capacity during the planning horizon, their power generation capacity is ranked after the coal-fired plants, owing to the high capacity factor, and has become another major source of maintaining the balance of supply and demand in Zhejiang’s power system. When compared with other power generation technologies, the installed capacity proportion of biomass power plants is not large and it provides only 37.18 TW-h (1.31% of the total power generation) during the planning horizon. However, their role in reducing environmental pollution is indispensable. In spite of the fastest growth rate of installed capacity for renewable energy technologies (wind and solar PV plants), coal-fired plants and natural gas plants still dominate in total installed capacities.
- (2)
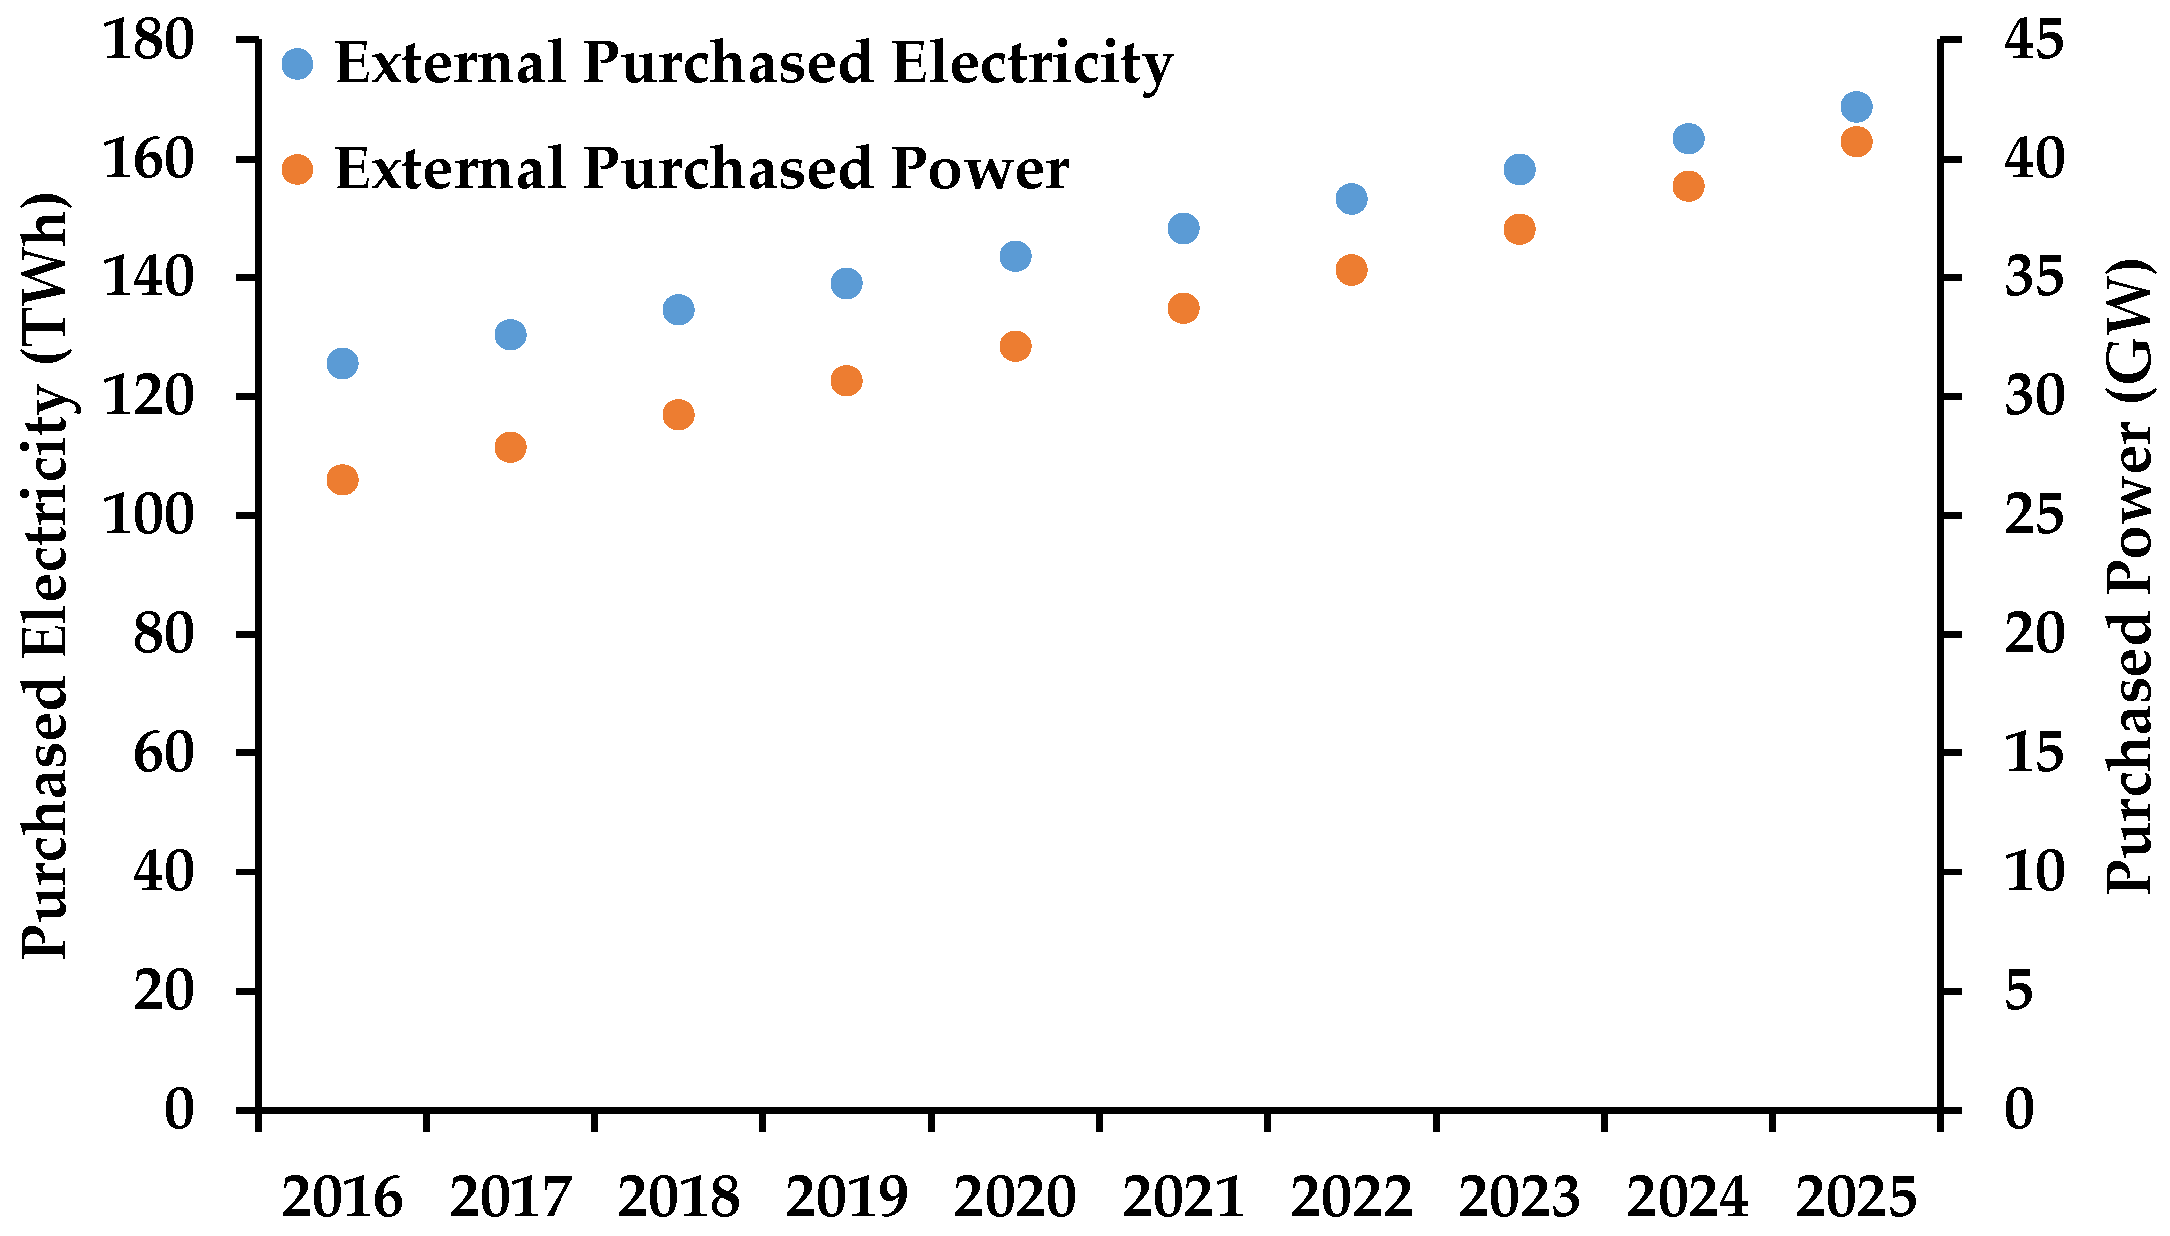
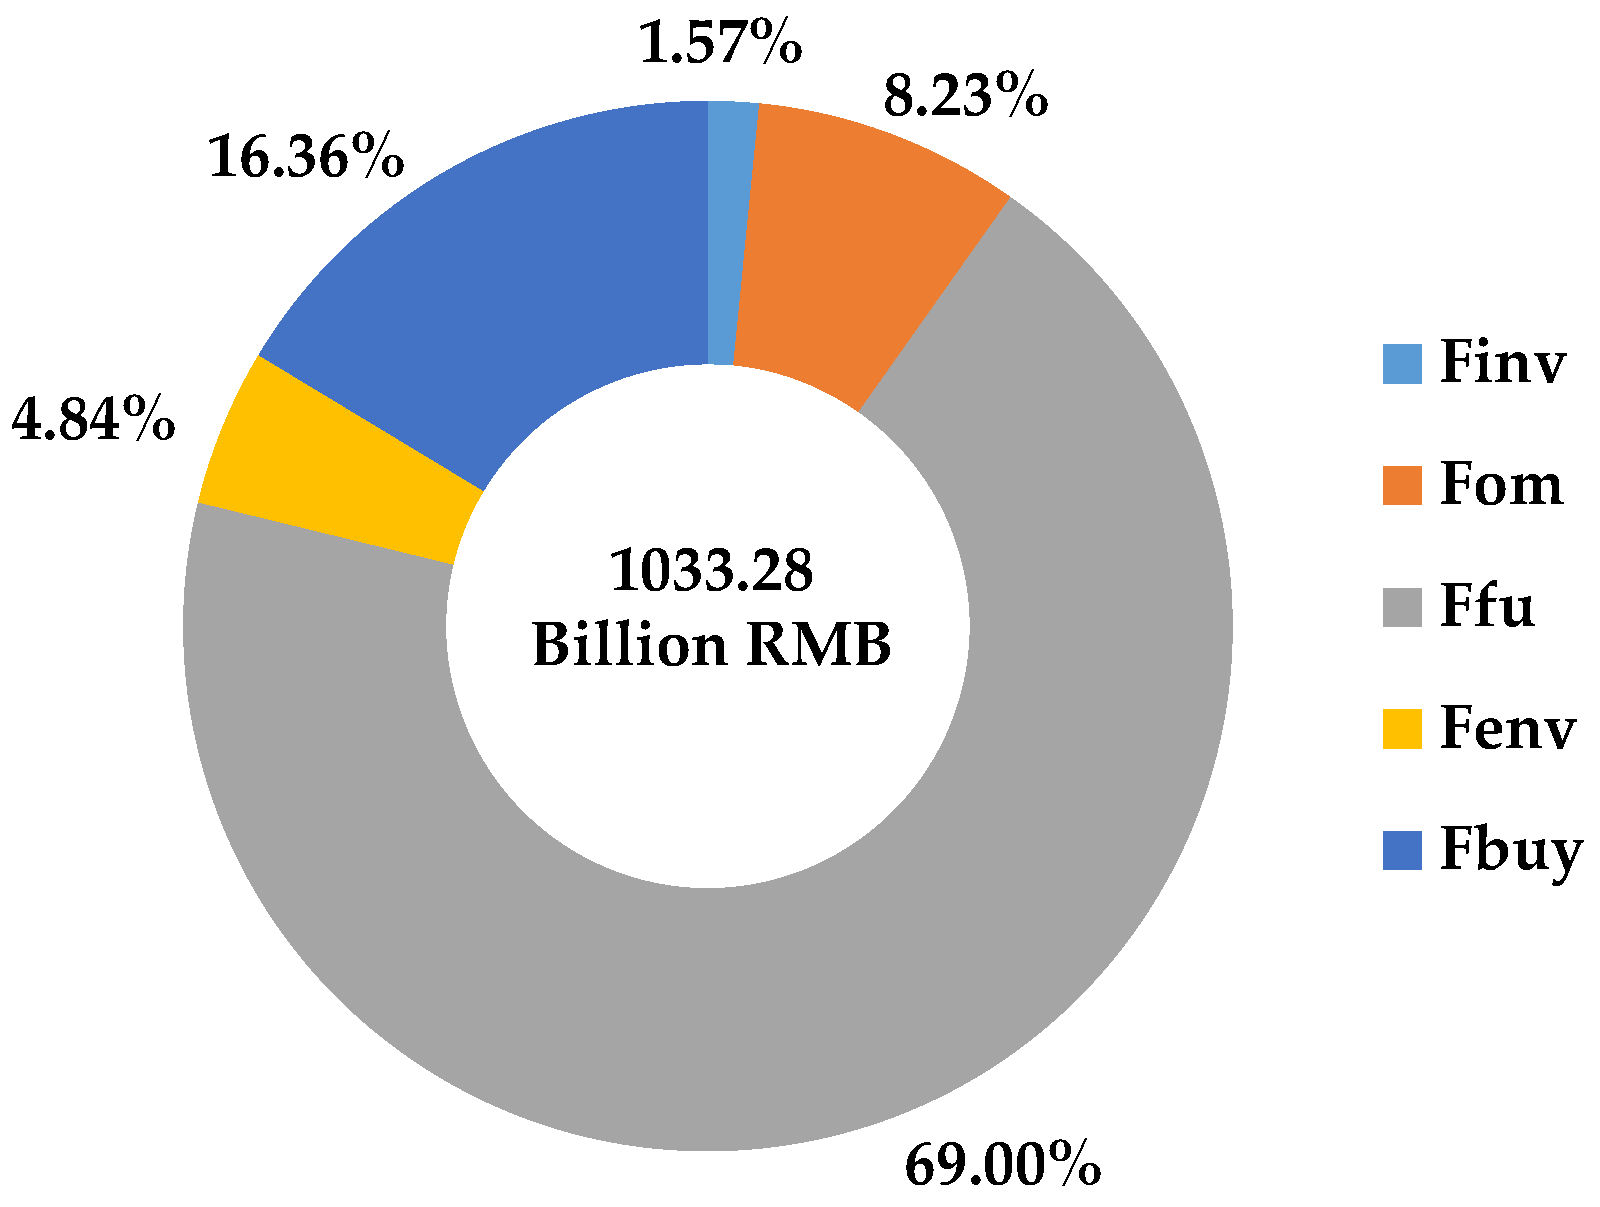
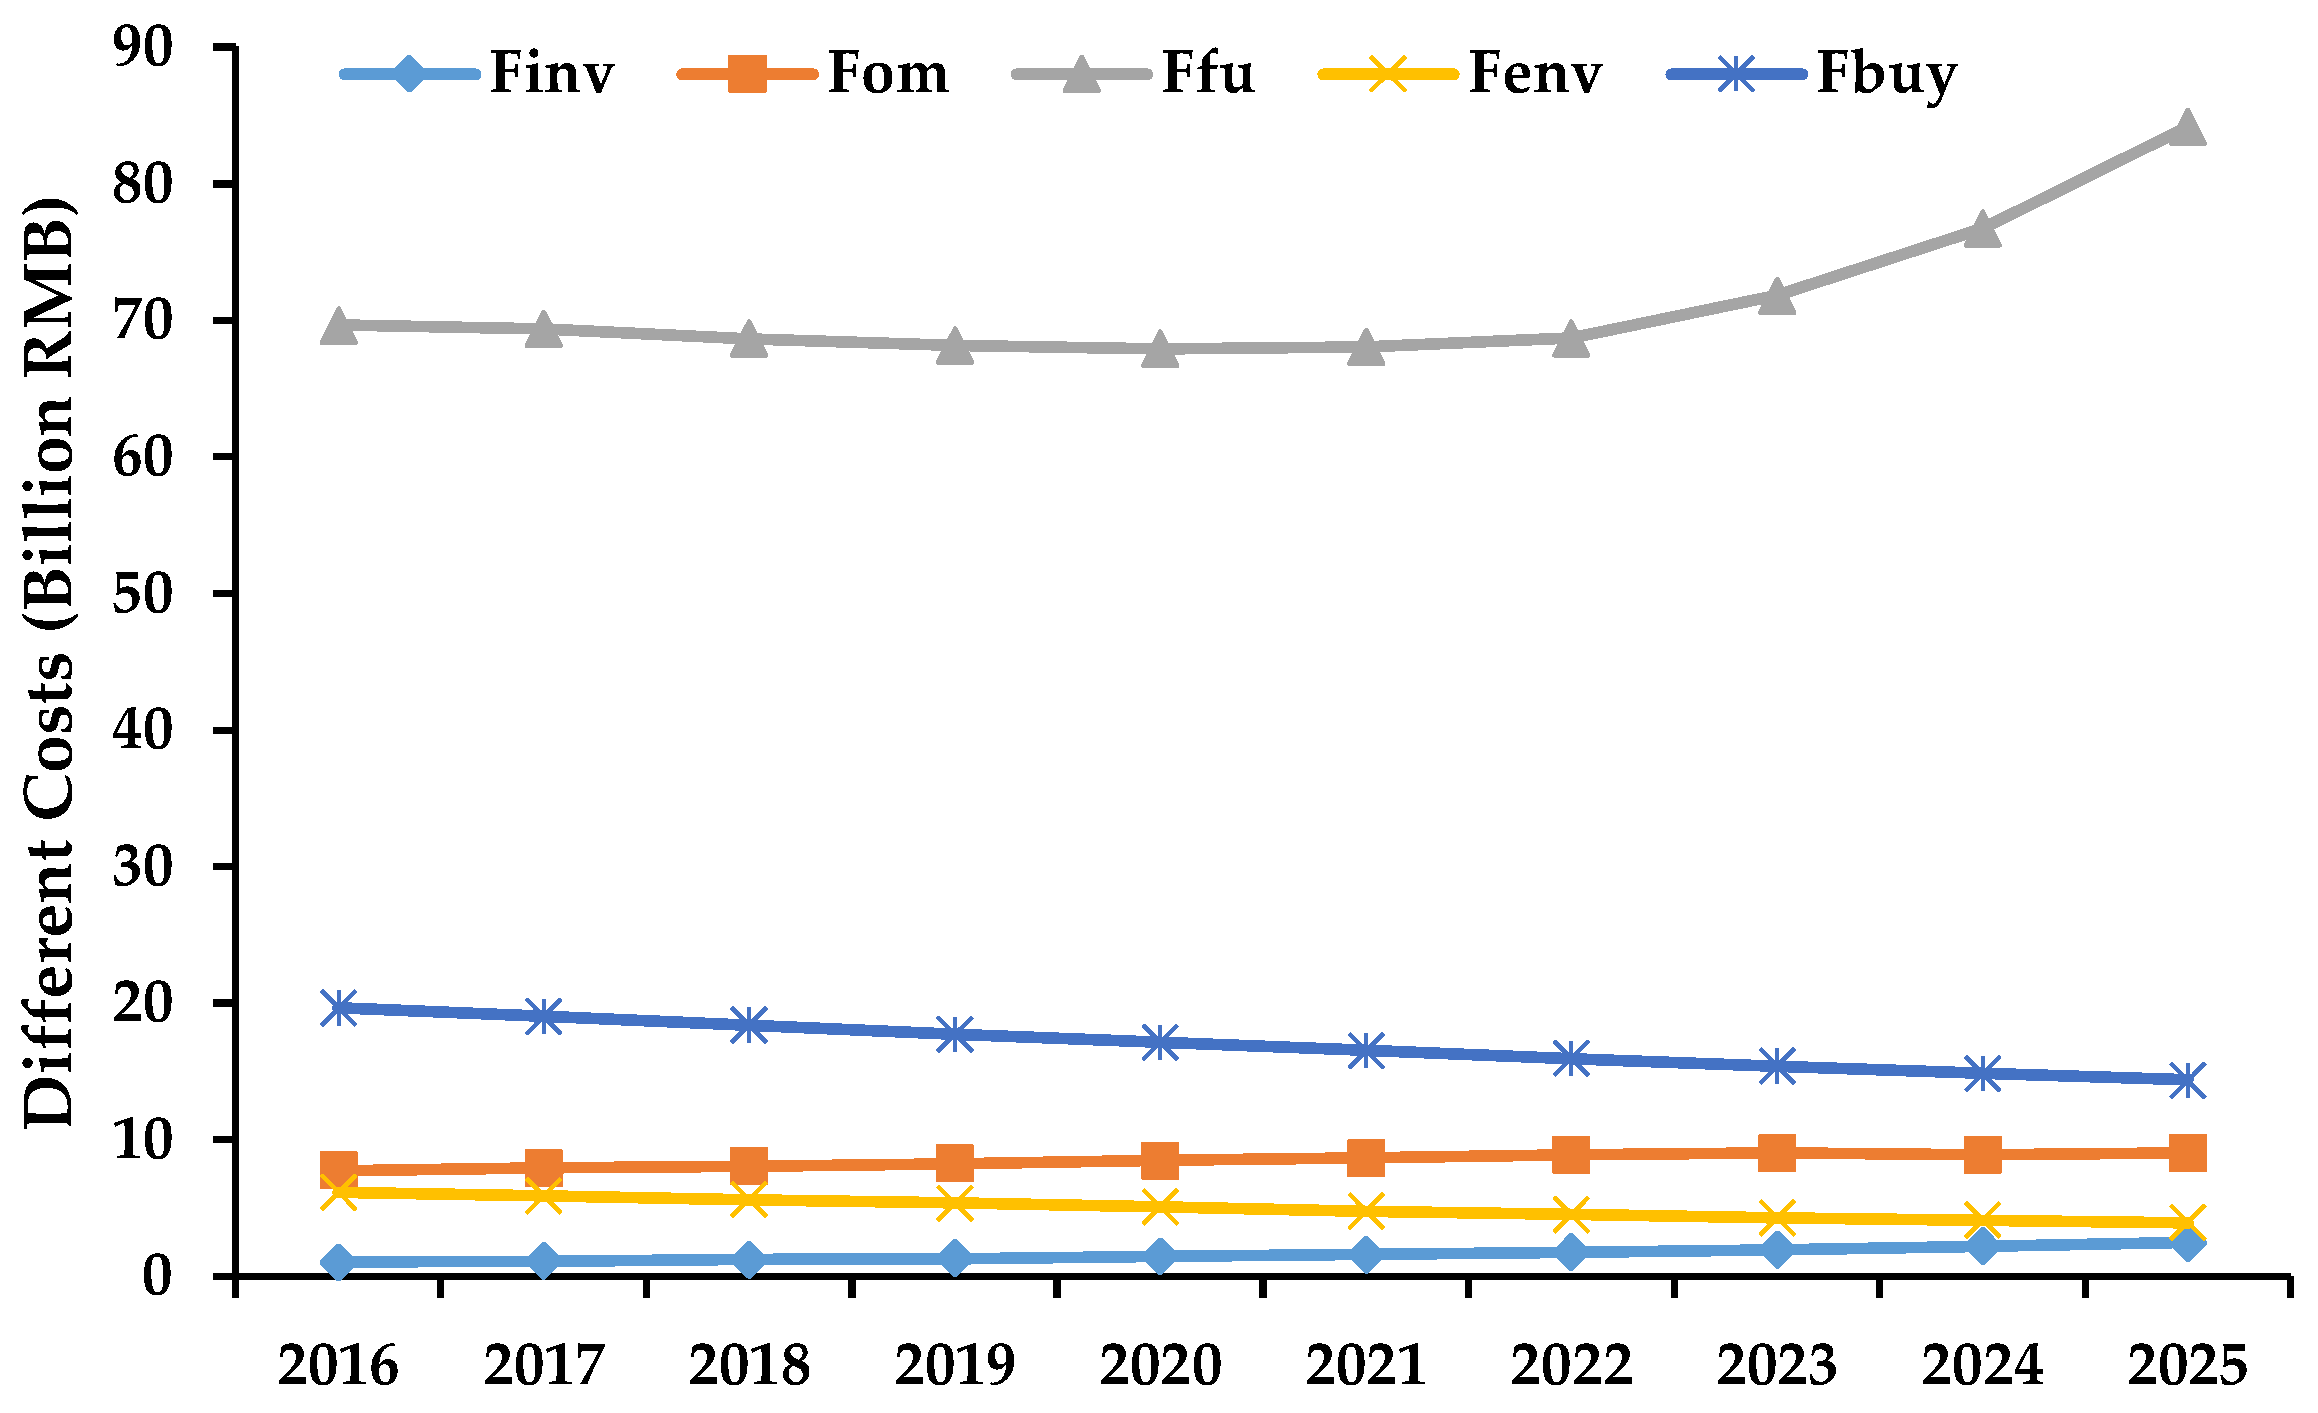
- The lowest total discounted cost is 1033.28 billion RMB during the planning horizon. However, given the fact that the power generation structure of Zhejiang Province is dominated by fossil fuel power plants, the fuel cost accounts for a large part of the total cost (about 69%). In the near future, the investment proportions of renewable energy power plants and nuclear power plants should be increased from the perspective of economic costs and environmental protection, since they can become a good substitute for fossil fuel power plants and reduce fuel cost to some extent. Besides, the external electricity procurement cost also accounts for a large part (about 16.36%). Moreover, the environmental cost for the system can be largely reduced by taking effective measures into account, including improving the proportion of renewable energy power plants.
- (3)
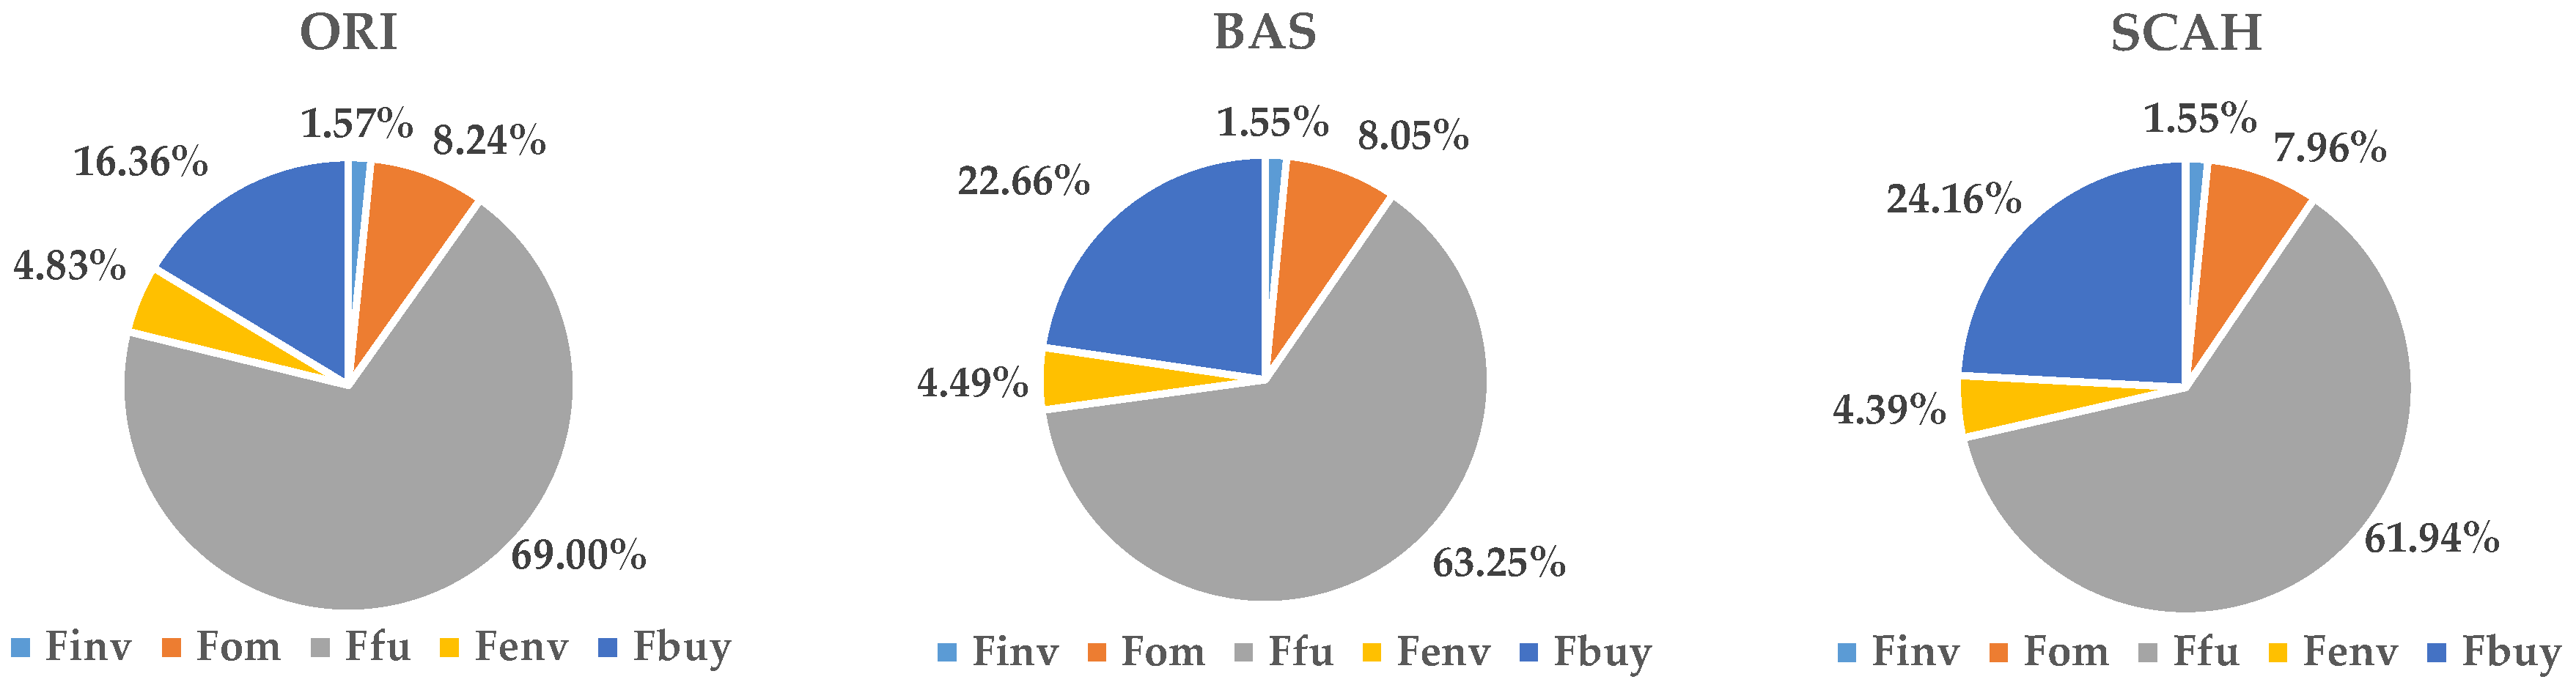
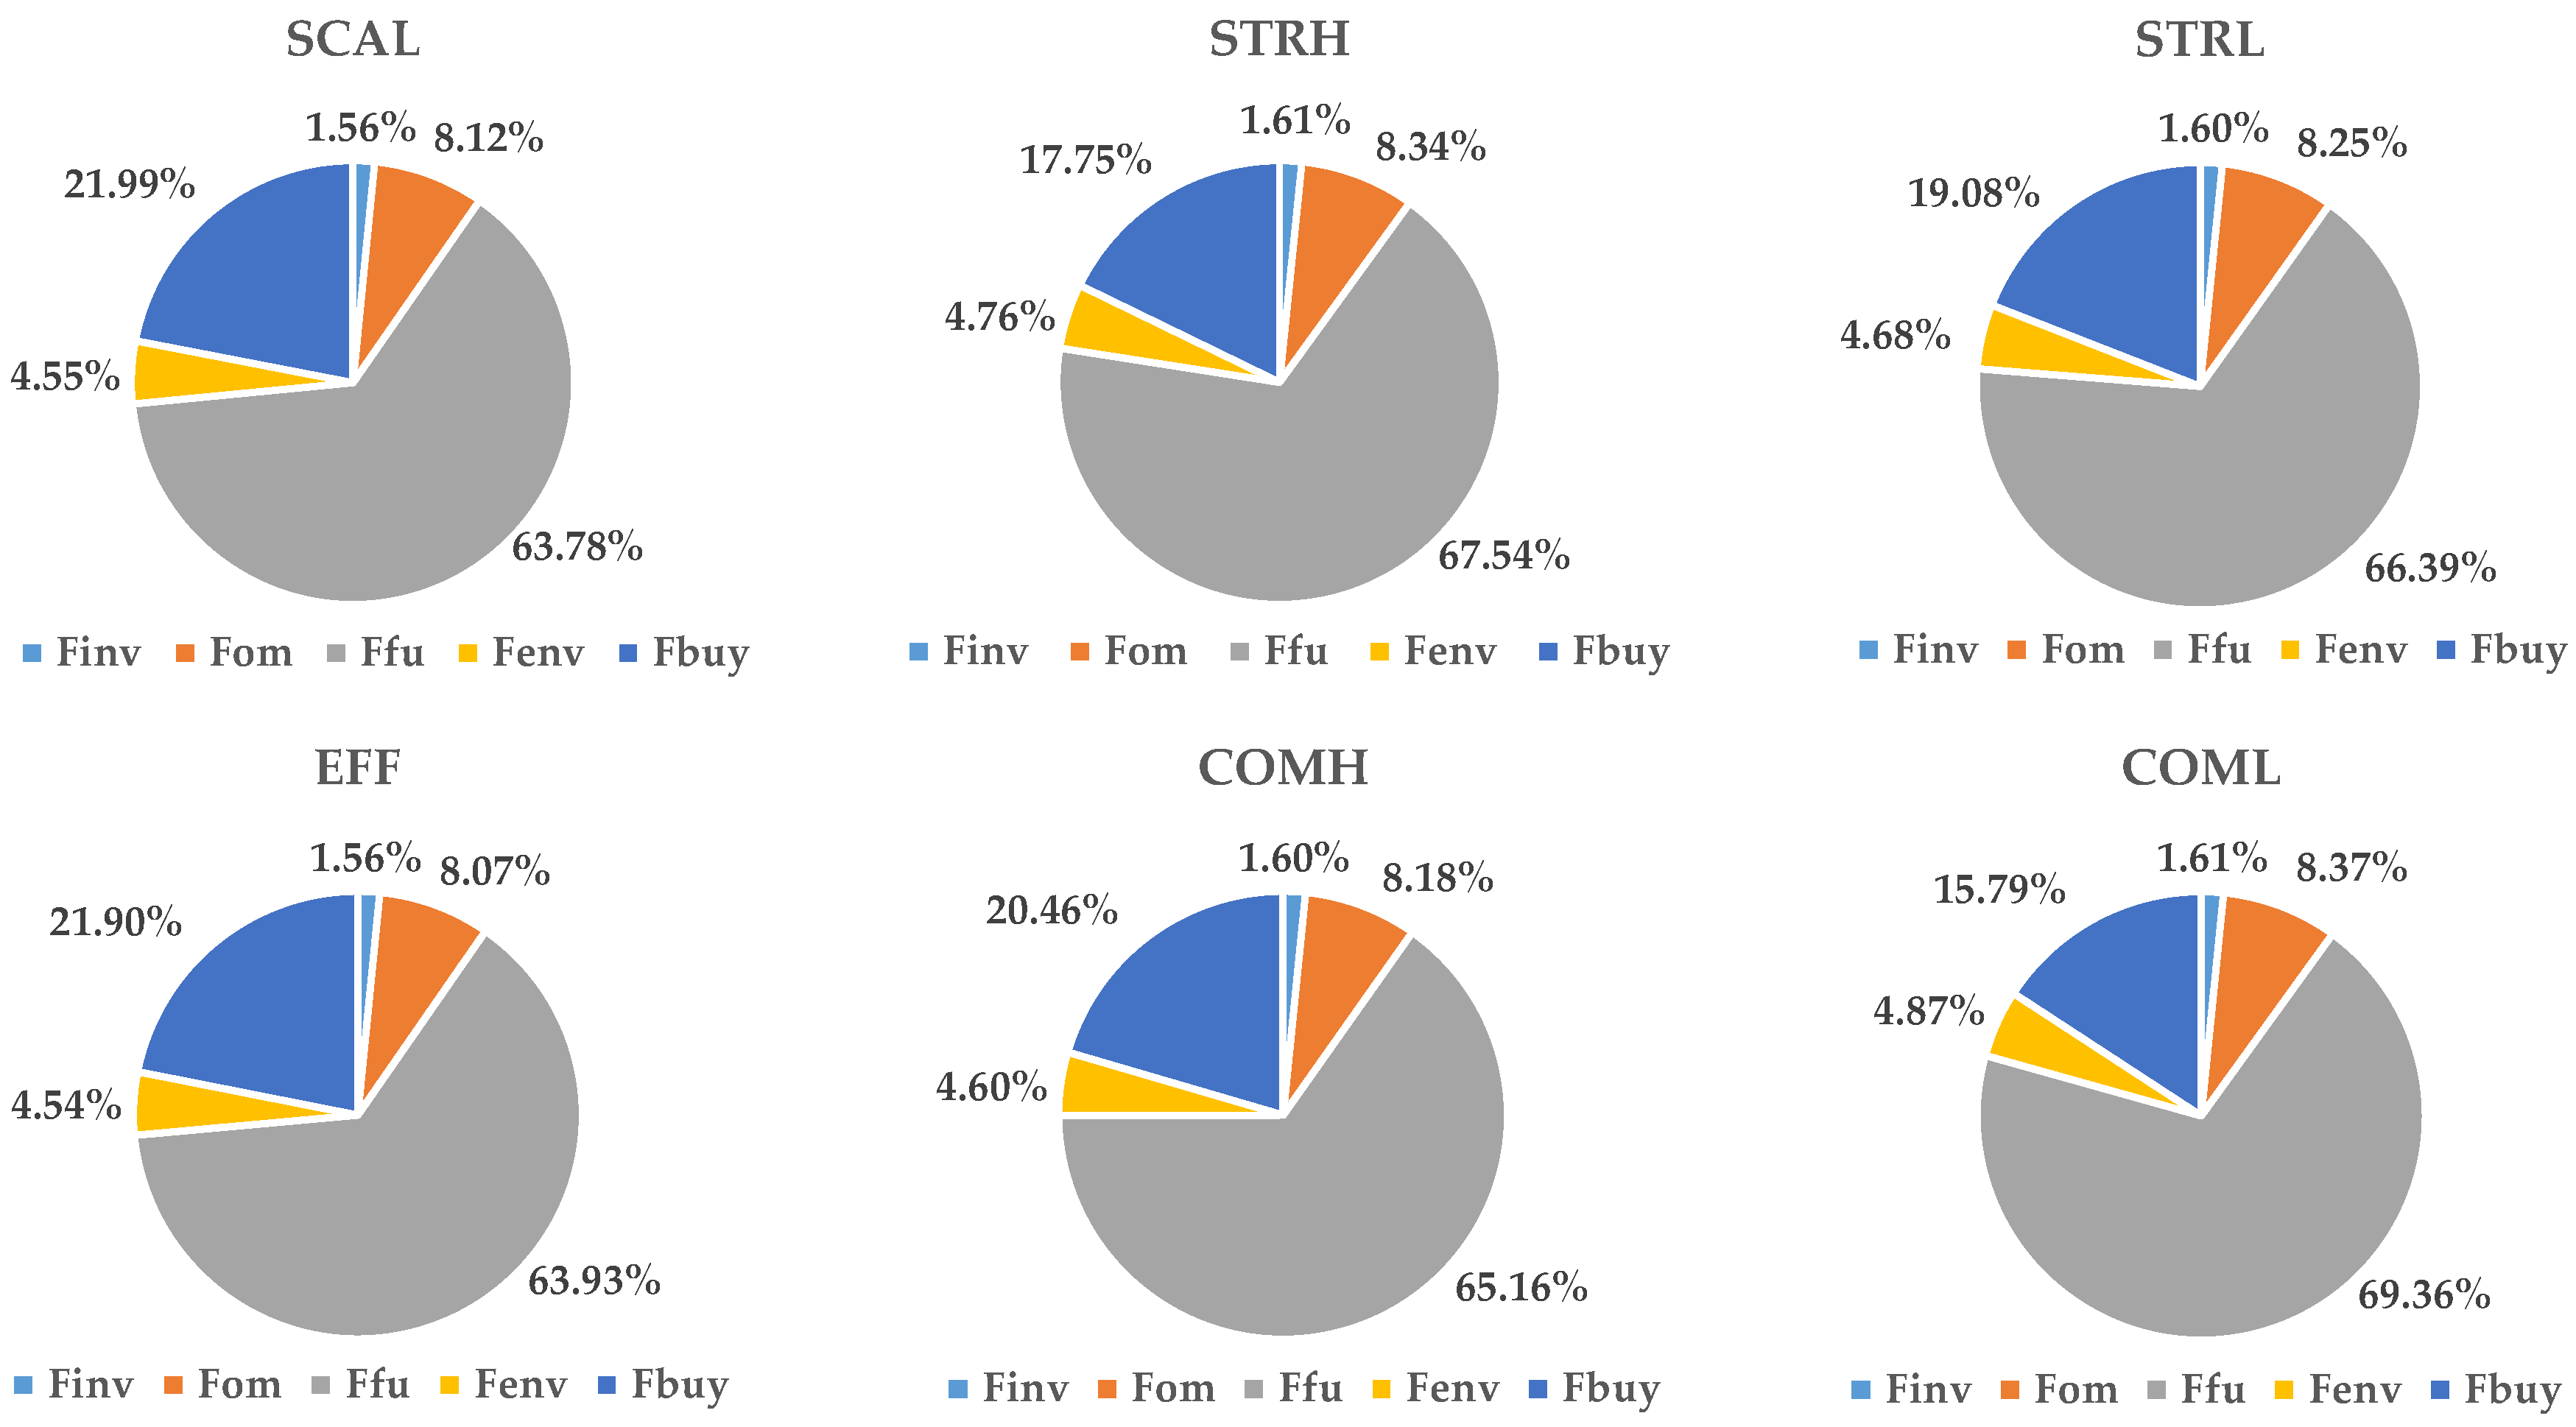
- Electricity demand is closely related to many factors, and electricity demand values under various scenarios are different since they have different key performance indicators. The SCAH scenario always has the highest electricity demand values during the planning horizon, which indicates that the GDP growth rate will become the primary KPI affecting the electricity demand. However, other factors cannot be overlooked. In the process of power planning, only the comprehensive consideration of various factors will enable policy-makers to obtain the most reliable results.
- (4)
- The optimization results of the ORI and COML scenarios are very similar, whether it is the electricity demand, the proportion of external purchased electricity, the proportions of various costs, or the values of some key techno-economic data, which verifies that the results derived from ORI scenario are true and authentic. Nevertheless, in view of the total discounted cost, the ORI scenario is not as superior as COML scenario, and the development mode of COML scenario should be adopted by policy-makers to obtain the optimal future power development path.
Author Contributions
Acknowledgments
Conflicts of Interest
References
- Zeng, L.; Zhao, L.; Wang, Q.; Wang, B.; Xie, Y.; Ma, Y.; Cui, W. Modeling interprovincial cooperative energy saving in China: An electricity utilization perspective. Energies 2018, 11, 241. [Google Scholar] [CrossRef]
- Wang, B. Energy Poverty in China: A Dynamic Analysis Based on a Hybrid Panel Data Decision Model. Energies 2017, 10, 1942. [Google Scholar] [CrossRef]
- Zhang, J.; Hu, Z.; Zheng, Y.; Zhou, Y.; Wan, Z. Sectoral Electricity Consumption and Economic Growth: The Time Difference Case of China, 2006–2015. Energies 2017, 10, 249. [Google Scholar] [CrossRef]
- Chen, H.; Tang, B.J.; Liao, H.; Wei, Y.M. A multi-period power generation planning model incorporating the non-carbon external costs: A case study of China. Appl. Energy 2016, 183, 1333–1345. [Google Scholar] [CrossRef]
- Luz, T.; Moura, P.; de Almeida, A. Multi-objective power generation expansion planning with high penetration of renewables. Renew. Sustain. Energy Rev. 2018, 81, 2637–2643. [Google Scholar] [CrossRef]
- Chen, Q.; Kang, C.; Xia, Q.; Zhong, J. Power generation expansion planning model towards low-carbon economy and its application in China. Power Syst. IEEE Trans. 2010, 25, 1117–1125. [Google Scholar] [CrossRef]
- Jin, S.W.; Li, Y.P.; Huang, G.H.; Zhang, K. Inexact mixed-integer programming with interval-valued membership function for sustainable power-generation capacity planning. J. Clean. Prod. 2016, 122, 52–66. [Google Scholar] [CrossRef]
- Cheng, R.; Xu, Z.; Liu, P.; Wang, Z.; Li, Z.; Jones, I. A multi-region optimization planning model for China’s power sector. Appl. Energy 2015, 137, 413–426. [Google Scholar] [CrossRef]
- Rentizelas, A.; Georgakellos, D. Incorporating life cycle external cost in optimization of the electricity generation mix. Energy Policy 2014, 65, 134–149. [Google Scholar] [CrossRef]
- Zhang, X.; Yan, P.; Zhong, J.; Guo, X.; Tian, C. Generation expansion planning model incorporating environment cost and demand side management programs. Dianwang Jishu/Power Syst. Technol. 2015, 39, 2809–2814. [Google Scholar] [CrossRef]
- Feng, Y.; Ryan, S.M. Scenario construction and reduction applied to stochastic power generation expansion planning. Comput. Oper. Res. 2013, 40, 9–23. [Google Scholar] [CrossRef]
- Perwez, U.; Sohail, A.; Hassan, S.F.; Zia, U. The long-term forecast of Pakistan’s electricity supply and demand: An application of long range energy alternatives planning. Energy 2015, 93, 2423–2435. [Google Scholar] [CrossRef]
- McPherson, M.; Karney, B. Long-term scenario alternatives and their implications: LEAP model application of Panama’s electricity sector. Energy Policy 2014, 68, 146–157. [Google Scholar] [CrossRef]
- Tang, B.J.; Li, R.; Li, X.Y.; Chen, H. An optimal production planning model of coal-fired power industry in China: Considering the process of closing down inefficient plants and developing CCS technologies. Appl. Energy 2017, 206, 519–530. [Google Scholar] [CrossRef]
- The Electric Power Development Planning of Zhejiang Province “in 13th Five-Year” (2016–2020). Available online: http://www.chinasmartgrid.com.cn/news/20160923/619192.shtml (accessed on 23 September 2016).
- Projected Costs of Generating Electricity of 2015 Edition from International Energy Agency. Available online: http://www.iea.org/publications/freepublications/publication/ElecCost2015.pdf (accessed on 30 September 2015).
- Zhang, M.; Zhou, D.; Ding, H.; Jin, J. Biomass Power Generation Investment in China: A Real Options Evaluation. Sustainability 2016, 8, 563. [Google Scholar] [CrossRef]
- Model for Comparing and Projecting the Levelised Cost of Electricity Generated by New Gas, Coal, Nuclear Power Stations and Wind Energy (On- and Offshore). Available online: http://proceedings.ewea.org/annual2013/allfiles2/1366_EWEA2013presentation.pdf (accessed on 20 November 2013).
- Wang, P.; Wang, C.; Hu, Y.; Liu, Z. Analysis of energy consumption in Hunan Province (China) using a LMDI method based LEAP model. Energy Procedia 2017, 142, 3160–3169. [Google Scholar] [CrossRef]
- Notice on the Related Items of Electricity Price Adjustment from Price Bureau of Zhejiang Province. Available online: http://jf.zjpi.gov.cn/Index/JFFileData (accessed on 8 January 2016).
- The Cost of External Electricity Purchase Is Greatly Reduced. Available online: http://www.sohu.com/a/166147667_771462 (accessed on 21 August 2017).
- Energy Conservation and Environmental Protection Situation of Power Generation Enterprises of Zhejiang Province in 2016. Available online: http://www.cpnn.com.cn/jnhb/hyzx/201712/t20171215_1040152.html (accessed on 15 December 2016).
- Heaps, C.G. Long-Range Energy Alternatives Planning (LEAP) System; Stockholm Environment Institute: Somerville, MA, USA, 2016; Software version: 2018.1.4; Available online: https://www.energycommunity.org (accessed on 4 January 2018).
- Social Development Planning of Zhejiang Province “in 13th Five-Year” (2016–2020). Available online: http://www.zjdpc.gov.cn/art/2016/11/21/art_8_1718219.html (accessed on 21 November 2016).
- National Economic and Social Development of Zhejiang Province “in 13th Five-Year” (2016–2020). Available online: http://zj.people.com.cn/n2/2016/0201/c186806-27665929.html (accessed on 1 February 2016).


| Indices | Description | Specifications |
|---|---|---|
| t | Power planning horizon | 2016–2025 |
| i | Types of power generation plants, i = 1, 2, …, 8 | Coal, gas, hydro, pumped-storage, wind, solar PV, biomass and nuclear |
| j | Types of pollutant emission, j = 1, 2, 3, 4 | NOx, CO2, CO, SO2 |
| Parameters | Description | Unit |
|---|---|---|
| TCi,2015 | The initial installed capacity of power plants i in year 2015 | MW |
| ICi,2015 | Investment cost of power plants i in year 2015 | RMB/kW |
| OMi,2015 | O&M cost of power plants i in year 2015 | RMB/kWh |
| FCi,2015 | Fuel cost of power plants i in year 2015 | RMB/kWh |
| Govi,2020 | Planned installation capacity in year 2020 | MW |
| PDt | Electricity demand in year t | 108 kWh |
| PLt | Peak load demand in year t | 104 MW |
| ECt | External purchased electricity price in year t | RMB/kWh |
| Leni | Life cycle of power plants i | year |
| r | Discount rate | % |
| αi | Change rate of investment cost of power plants i | % |
| βi | Change rate of O&M cost of power plants i | % |
| γi | Change rate of fuel cost of power plants i | % |
| qi | Annual growth rate of installed capacity of power plants i | % |
| λi | Environmental cost coefficient of nuclear plants | - |
| Load margin coefficient | - | |
| η | The proportional coefficient of purchased electricity and total electricity demand | - |
| ψ | The proportional coefficient of purchased power and total peak load demand | - |
| ω | Safety operation coefficient of power system | - |
| cfi | Capacity factor of power plants i | - |
| efj,t | Pollutant emission coefficient of type j for power plants i | g/kWh |
| evj | Environmental value of pollutant emission type j | RMB/Kg |
| penj | Penalty of pollutant emission type j | RMB/Kg |
| Variables | Description | Unit |
|---|---|---|
| PGi,t | Annual electricity generated from plants i in year t | MWh |
| BEt | The amount of electricity purchased in year t | MWh |
| BPt | The amount of power purchased in year t | MW |
| Parameter | Unit | Coal | Gas | Hydro | Pumped-Storage | Wind | Solar | Biomass | Nuclear |
|---|---|---|---|---|---|---|---|---|---|
| TCi,2015 | MW | 46,060 | 12,280 | 6940 | 3080 | 1040 | 2200 | 1030 | 6570 |
| ICi,2015 | RMB/kW | 5737.95 | 4126.65 | 3677.70 | 3677.70 | 7632.15 | 4637.10 | 5256.22 | 1,4206.50 |
| OMi,2015 | RMB/kWh | 0.0250 | 0.0200 | 0.0650 | 0.0650 | 0.0600 | 0.1000 | 0.0185 | 0.0400 |
| FCi,2015 | RMB/kWh | 0.3969 | 0.5073 | 0.0000 | 0.0000 | 0.0000 | 0.0000 | 0.2500 | 0.0574 |
| Govi,2020 | MW | 4,6350 | 1,2530 | 7050 | 4940 | 4000 | 8020 | 1100 | 9100 |
| Leni | year | 40 | 30 | 80 | 80 | 25 | 25 | 40 | 60 |
| cfi | - | 0.6056 | 0.3637 | 0.4188 | 0.4000 | 0.2700 | 0.1700 | 0.5600 | 0.8600 |
| αi | % | −1.50 | −1.00 | 1.50 | 1.50 | −4.00 | −5.00 | −2.00 | 0.00 |
| βi | % | 7.27 | 3.22 | 0.76 | 0.76 | 0.45 | −3.31 | −0.27 | 5.02 |
| γi | % | 1.90 | 2.90 | 0.00 | 0.00 | 0.00 | 0.00 | 1.70 | 3.40 |
| qi | % | 0.10 | 0.40 | 0.30 | 9.90 | 30.90 | 29.50 | 1.30 | 6.70 |
| Years | Total Effect | Scale Effect | Structure Effect | Efficiency Effect |
|---|---|---|---|---|
| 2011 | 26.23 | 40.36 | −1.33 | −12.80 |
| 2012 | 5.44 | 19.56 | −5.15 | −8.97 |
| 2013 | 19.44 | 24.90 | −9.35 | 3.89 |
| 2014 | 7.22 | 18.91 | −0.24 | −11.45 |
| 2015 | 2.48 | 20.24 | −8.39 | −9.37 |
| 2011–2015 | 34.57 | 82.94 | −22.96 | −25.41 |
| Years | 2016 | 2020 | 2025 |
|---|---|---|---|
| STRL | 4.16:44.86:50.99 | 3.65:41.56:54.79 | 3.15:36.48:60.37 |
| STRH | 4.16:44.86:50.99 | 3.65:39.78:56.57 | 3.15:34.68:62.17 |
| Primary Industry | Industry | Construction | Tertiary Industry | Urban Residents | Rural Residents |
|---|---|---|---|---|---|
| 1.04% | −1.80% | −2.40% | −1.60% | 3.3% | 6.5% |
| Scenario | 2016 | 2017 | 2018 | 2019 | 2020 | 2021 | 2022 | 2023 | 2024 | 2025 |
|---|---|---|---|---|---|---|---|---|---|---|
| ORI | 369.40 | 383.35 | 395.93 | 408.93 | 422.35 | 436.21 | 450.52 | 465.31 | 480.58 | 496.35 |
| BAS | 378.53 | 399.06 | 420.68 | 443.45 | 467.44 | 492.63 | 519.15 | 547.06 | 576.43 | 607.35 |
| SCAH | 378.53 | 400.69 | 424.13 | 448.93 | 475.16 | 502.83 | 532.09 | 563.02 | 595.71 | 630.27 |
| SCAL | 378.53 | 397.75 | 417.93 | 439.11 | 461.34 | 484.61 | 509.01 | 534.61 | 561.46 | 589.62 |
| STRH | 352.88 | 359.12 | 374.48 | 399.52 | 434.82 | 451.35 | 468.38 | 485.91 | 503.93 | 522.44 |
| STRL | 354.75 | 363.05 | 380.70 | 408.24 | 446.31 | 463.49 | 481.19 | 499.43 | 518.20 | 537.51 |
| EFF | 377.28 | 396.43 | 416.53 | 437.64 | 459.79 | 482.98 | 507.31 | 532.83 | 559.60 | 587.68 |
| COMH | 354.75 | 363.67 | 382.66 | 412.40 | 453.63 | 473.00 | 493.06 | 513.81 | 535.26 | 557.44 |
| COML | 351.71 | 356.26 | 369.25 | 391.07 | 422.12 | 435.30 | 448.77 | 462.51 | 476.52 | 490.79 |
| Scenario | Average Working Hours of Power Plants | η |
|---|---|---|
| ORI | 6000 | 0.34 |
| BAS | 6300 | 0.43 |
| SCAH | 6300 | 0.45 |
| SCAL | 6300 | 0.42 |
| STRH | 6100 | 0.36 |
| STRL | 6100 | 0.38 |
| EFF | 6200 | 0.42 |
| COMH | 6100 | 0.40 |
| COML | 6000 | 0.33 |
© 2018 by the authors. Licensee MDPI, Basel, Switzerland. This article is an open access article distributed under the terms and conditions of the Creative Commons Attribution (CC BY) license (http://creativecommons.org/licenses/by/4.0/).
Share and Cite
Wang, P.; Wang, C.; Hu, Y.; Varga, L.; Wang, W. Power Generation Expansion Optimization Model Considering Multi-Scenario Electricity Demand Constraints: A Case Study of Zhejiang Province, China. Energies 2018, 11, 1498. https://doi.org/10.3390/en11061498
Wang P, Wang C, Hu Y, Varga L, Wang W. Power Generation Expansion Optimization Model Considering Multi-Scenario Electricity Demand Constraints: A Case Study of Zhejiang Province, China. Energies. 2018; 11(6):1498. https://doi.org/10.3390/en11061498
Chicago/Turabian StyleWang, Peng, Chunsheng Wang, Yukun Hu, Liz Varga, and Wei Wang. 2018. "Power Generation Expansion Optimization Model Considering Multi-Scenario Electricity Demand Constraints: A Case Study of Zhejiang Province, China" Energies 11, no. 6: 1498. https://doi.org/10.3390/en11061498
APA StyleWang, P., Wang, C., Hu, Y., Varga, L., & Wang, W. (2018). Power Generation Expansion Optimization Model Considering Multi-Scenario Electricity Demand Constraints: A Case Study of Zhejiang Province, China. Energies, 11(6), 1498. https://doi.org/10.3390/en11061498