Numerical Investigation of Small-Scale Adsorption Cooling System Performance Employing Activated Carbon-Ethanol Pair

 ,
,  and
and 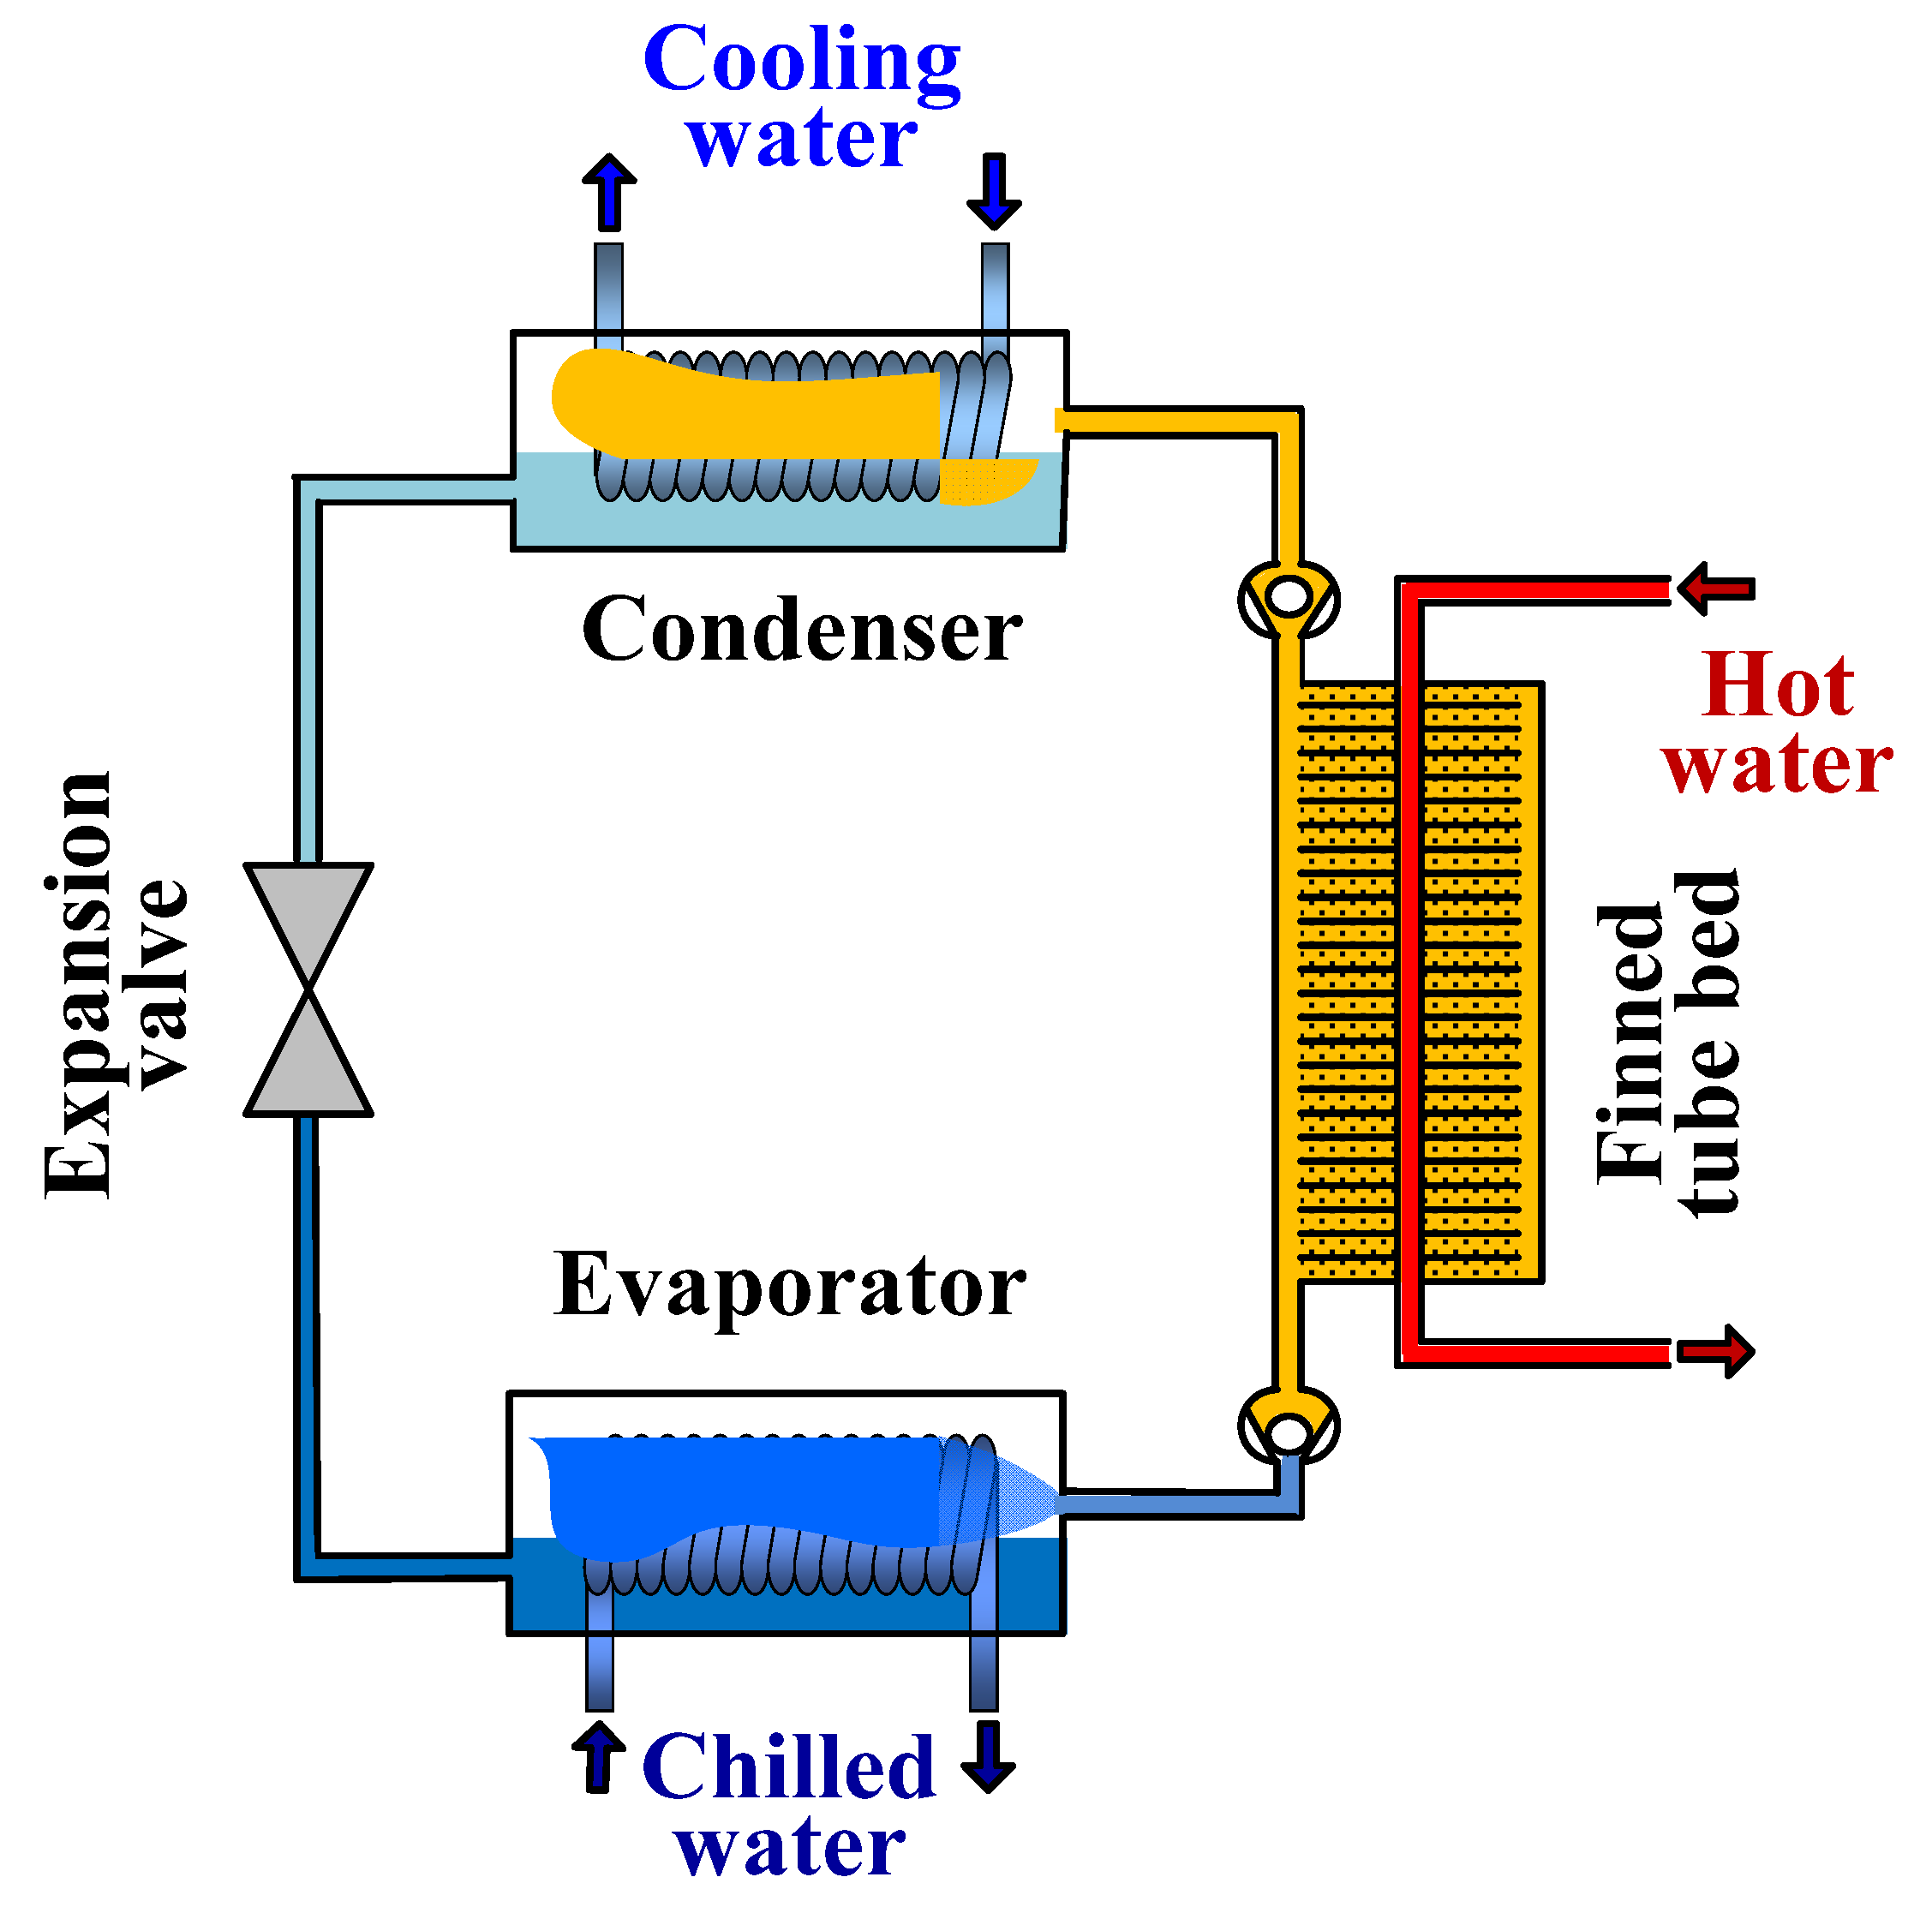
Abstract
1. Introduction
2. Working Principle of Adsorption Cooling System
3. CFD Modeling
3.1. Assumptions
- The adsorbent layer height is equal to the height of the fins.
- The porous media is considered as homogenous.
- Darcy model is adopted for flow through porous media.
- A thermal equilibrium model is assimilated for porous media i.e., the adsorbent and ethanol vapor are at same temperature.
- The variation of the heat of adsorption with the ethanol uptake is not considered, therefore, the average value of the heat of adsorption is used.
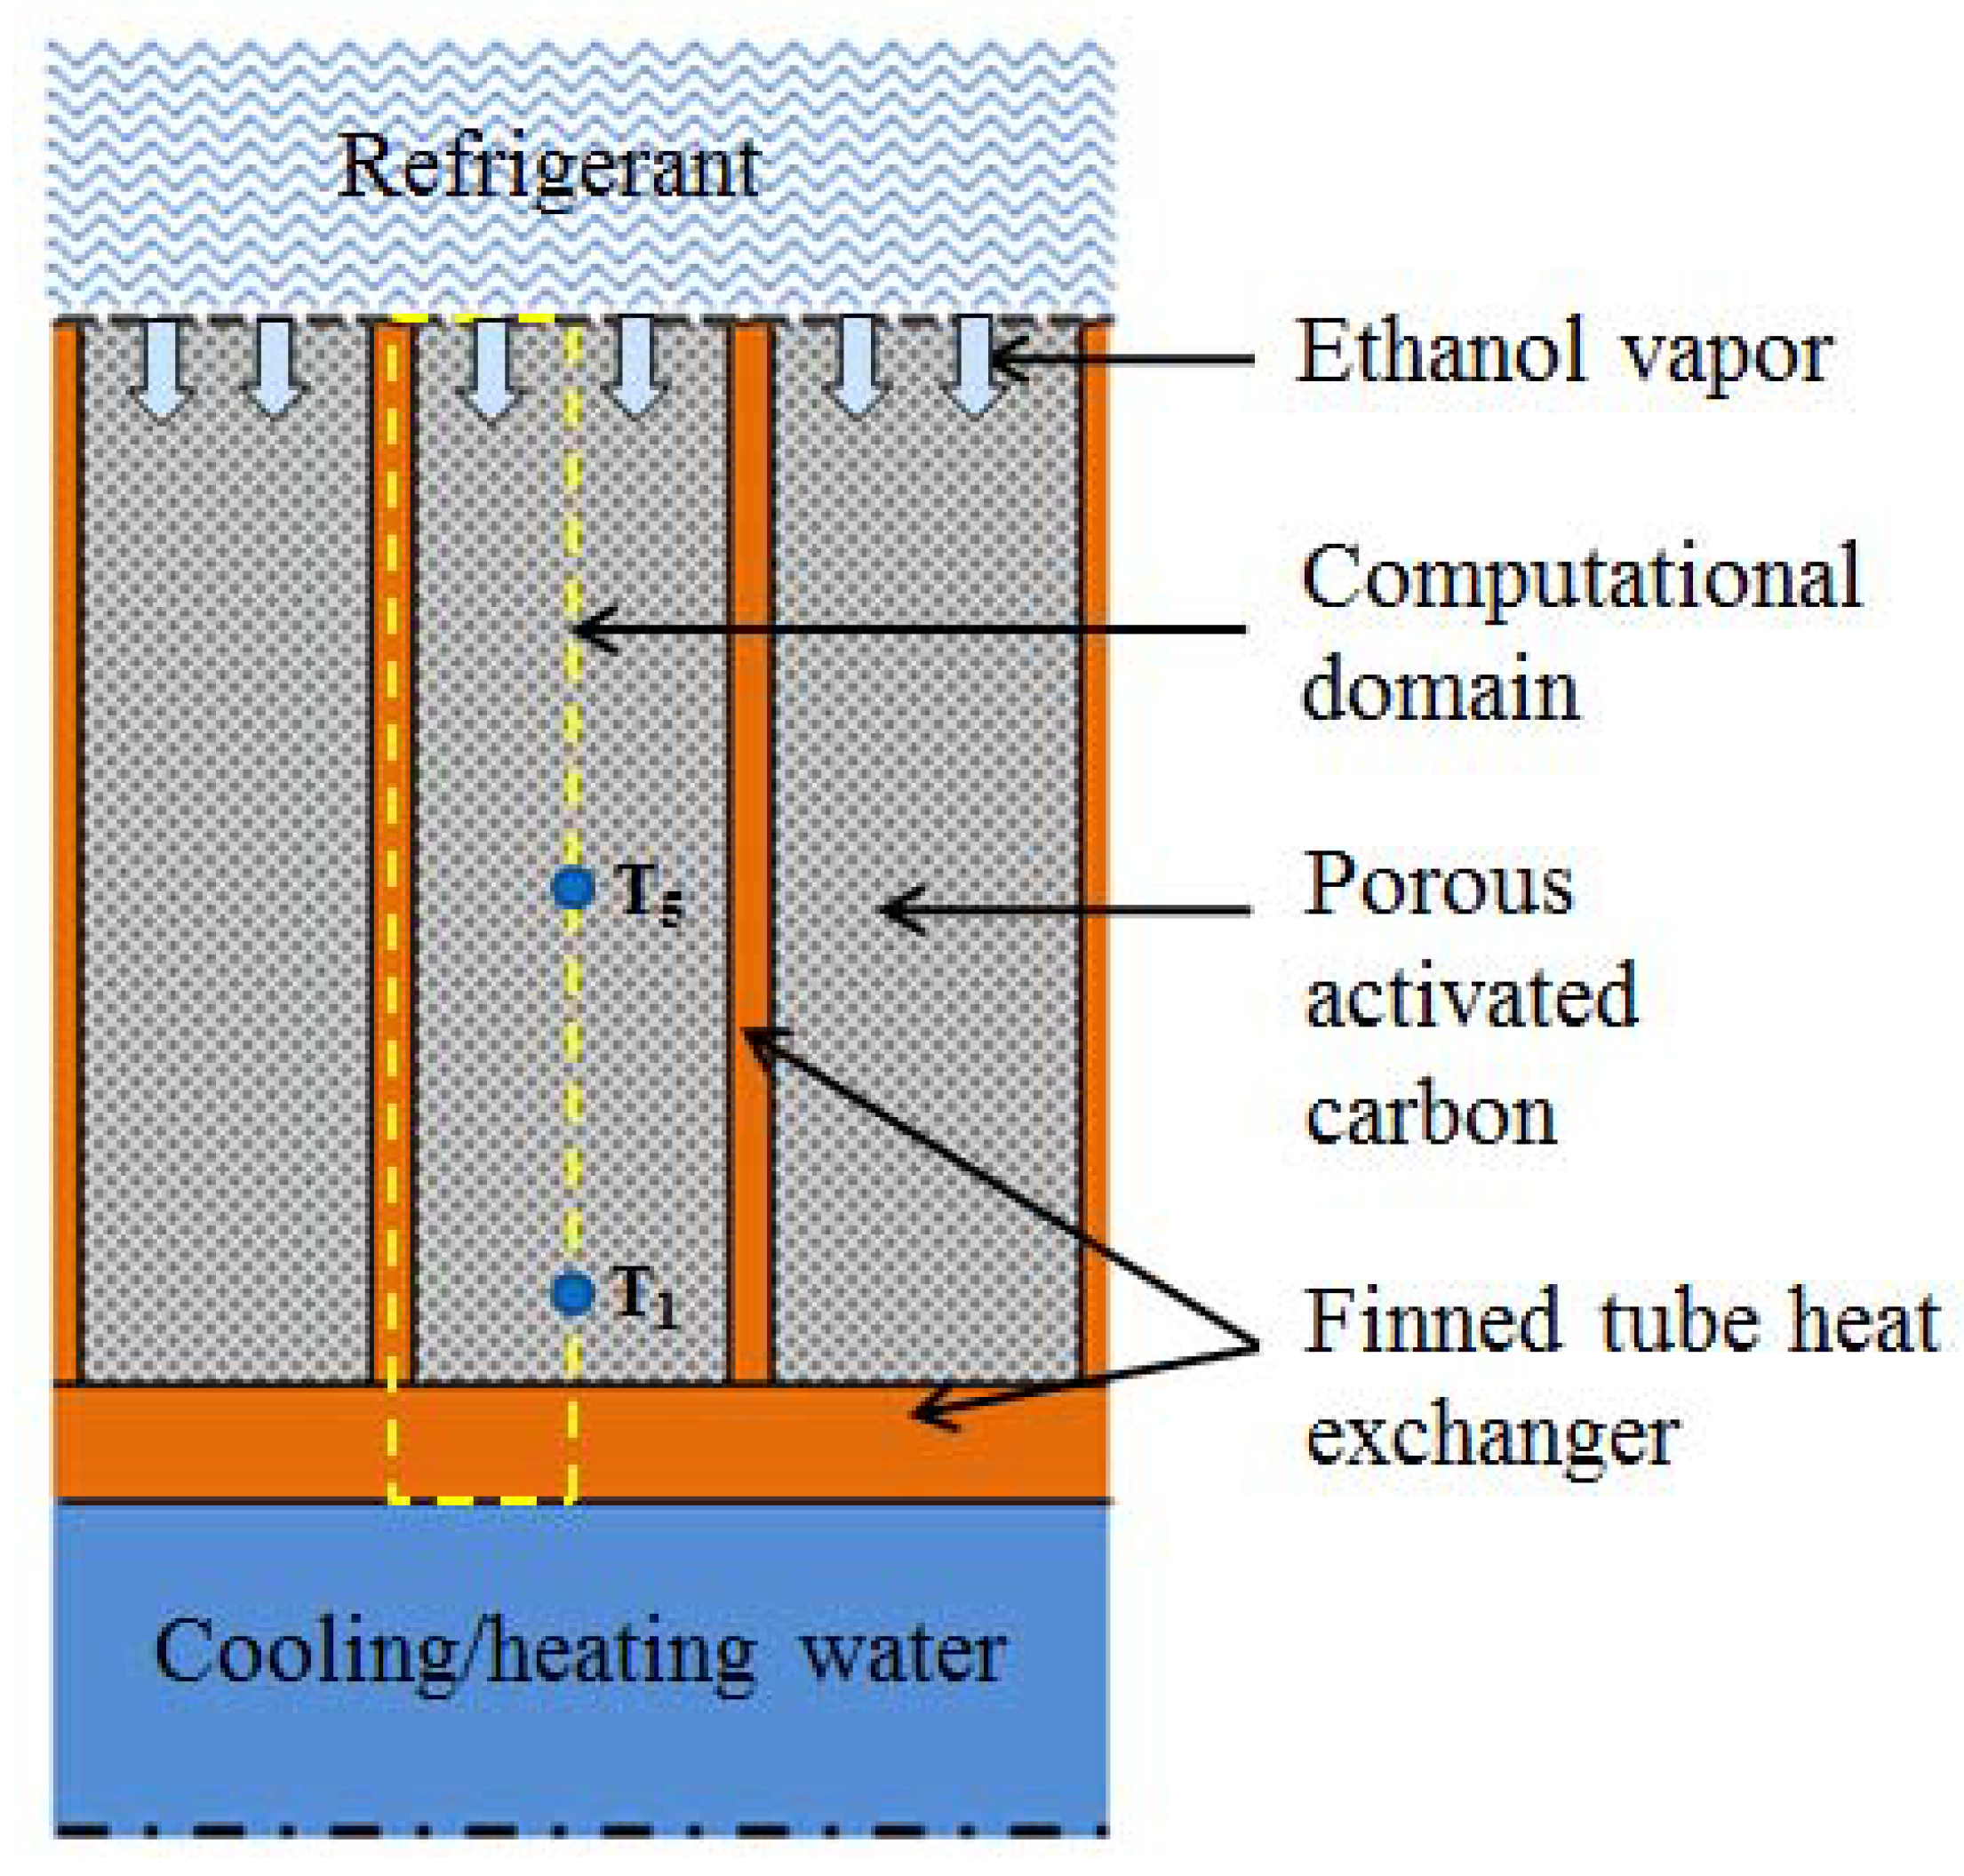
3.2. Geometry and Meshing
- -
- Minimum orthogonal quality = 0.9721 where orthogonal quality ranges from 0 to 1 and values close to 0 represents low quality.
- -
- Maximum ortho skew = 0.0279 where ortho skew ranges from 0 to 1 and values close to 1 correspond to low quality.
3.3. Materials and Porous Zone Properties
3.3.1. Materials
3.3.2. Porous Zone Properties
3.4. Boundary Conditions
3.4.1. Pressure Inlet/Wall/Pressure Outlet Conditions
3.4.2. Convection Boundary Conditions
3.5. Governing Equations
3.5.1. Mass Conservation Equation in Porous Media
3.5.2. Momentum Conservation Equation
3.5.3. Energy Conservation Equation
3.5.4. Adsorption Characteristics
3.5.5. Performance Investigation
3.5.6. Mass and Energy Balance Equation
4. Results and Discussion
4.1. Pressure Profile
4.2. Temperature Profiles
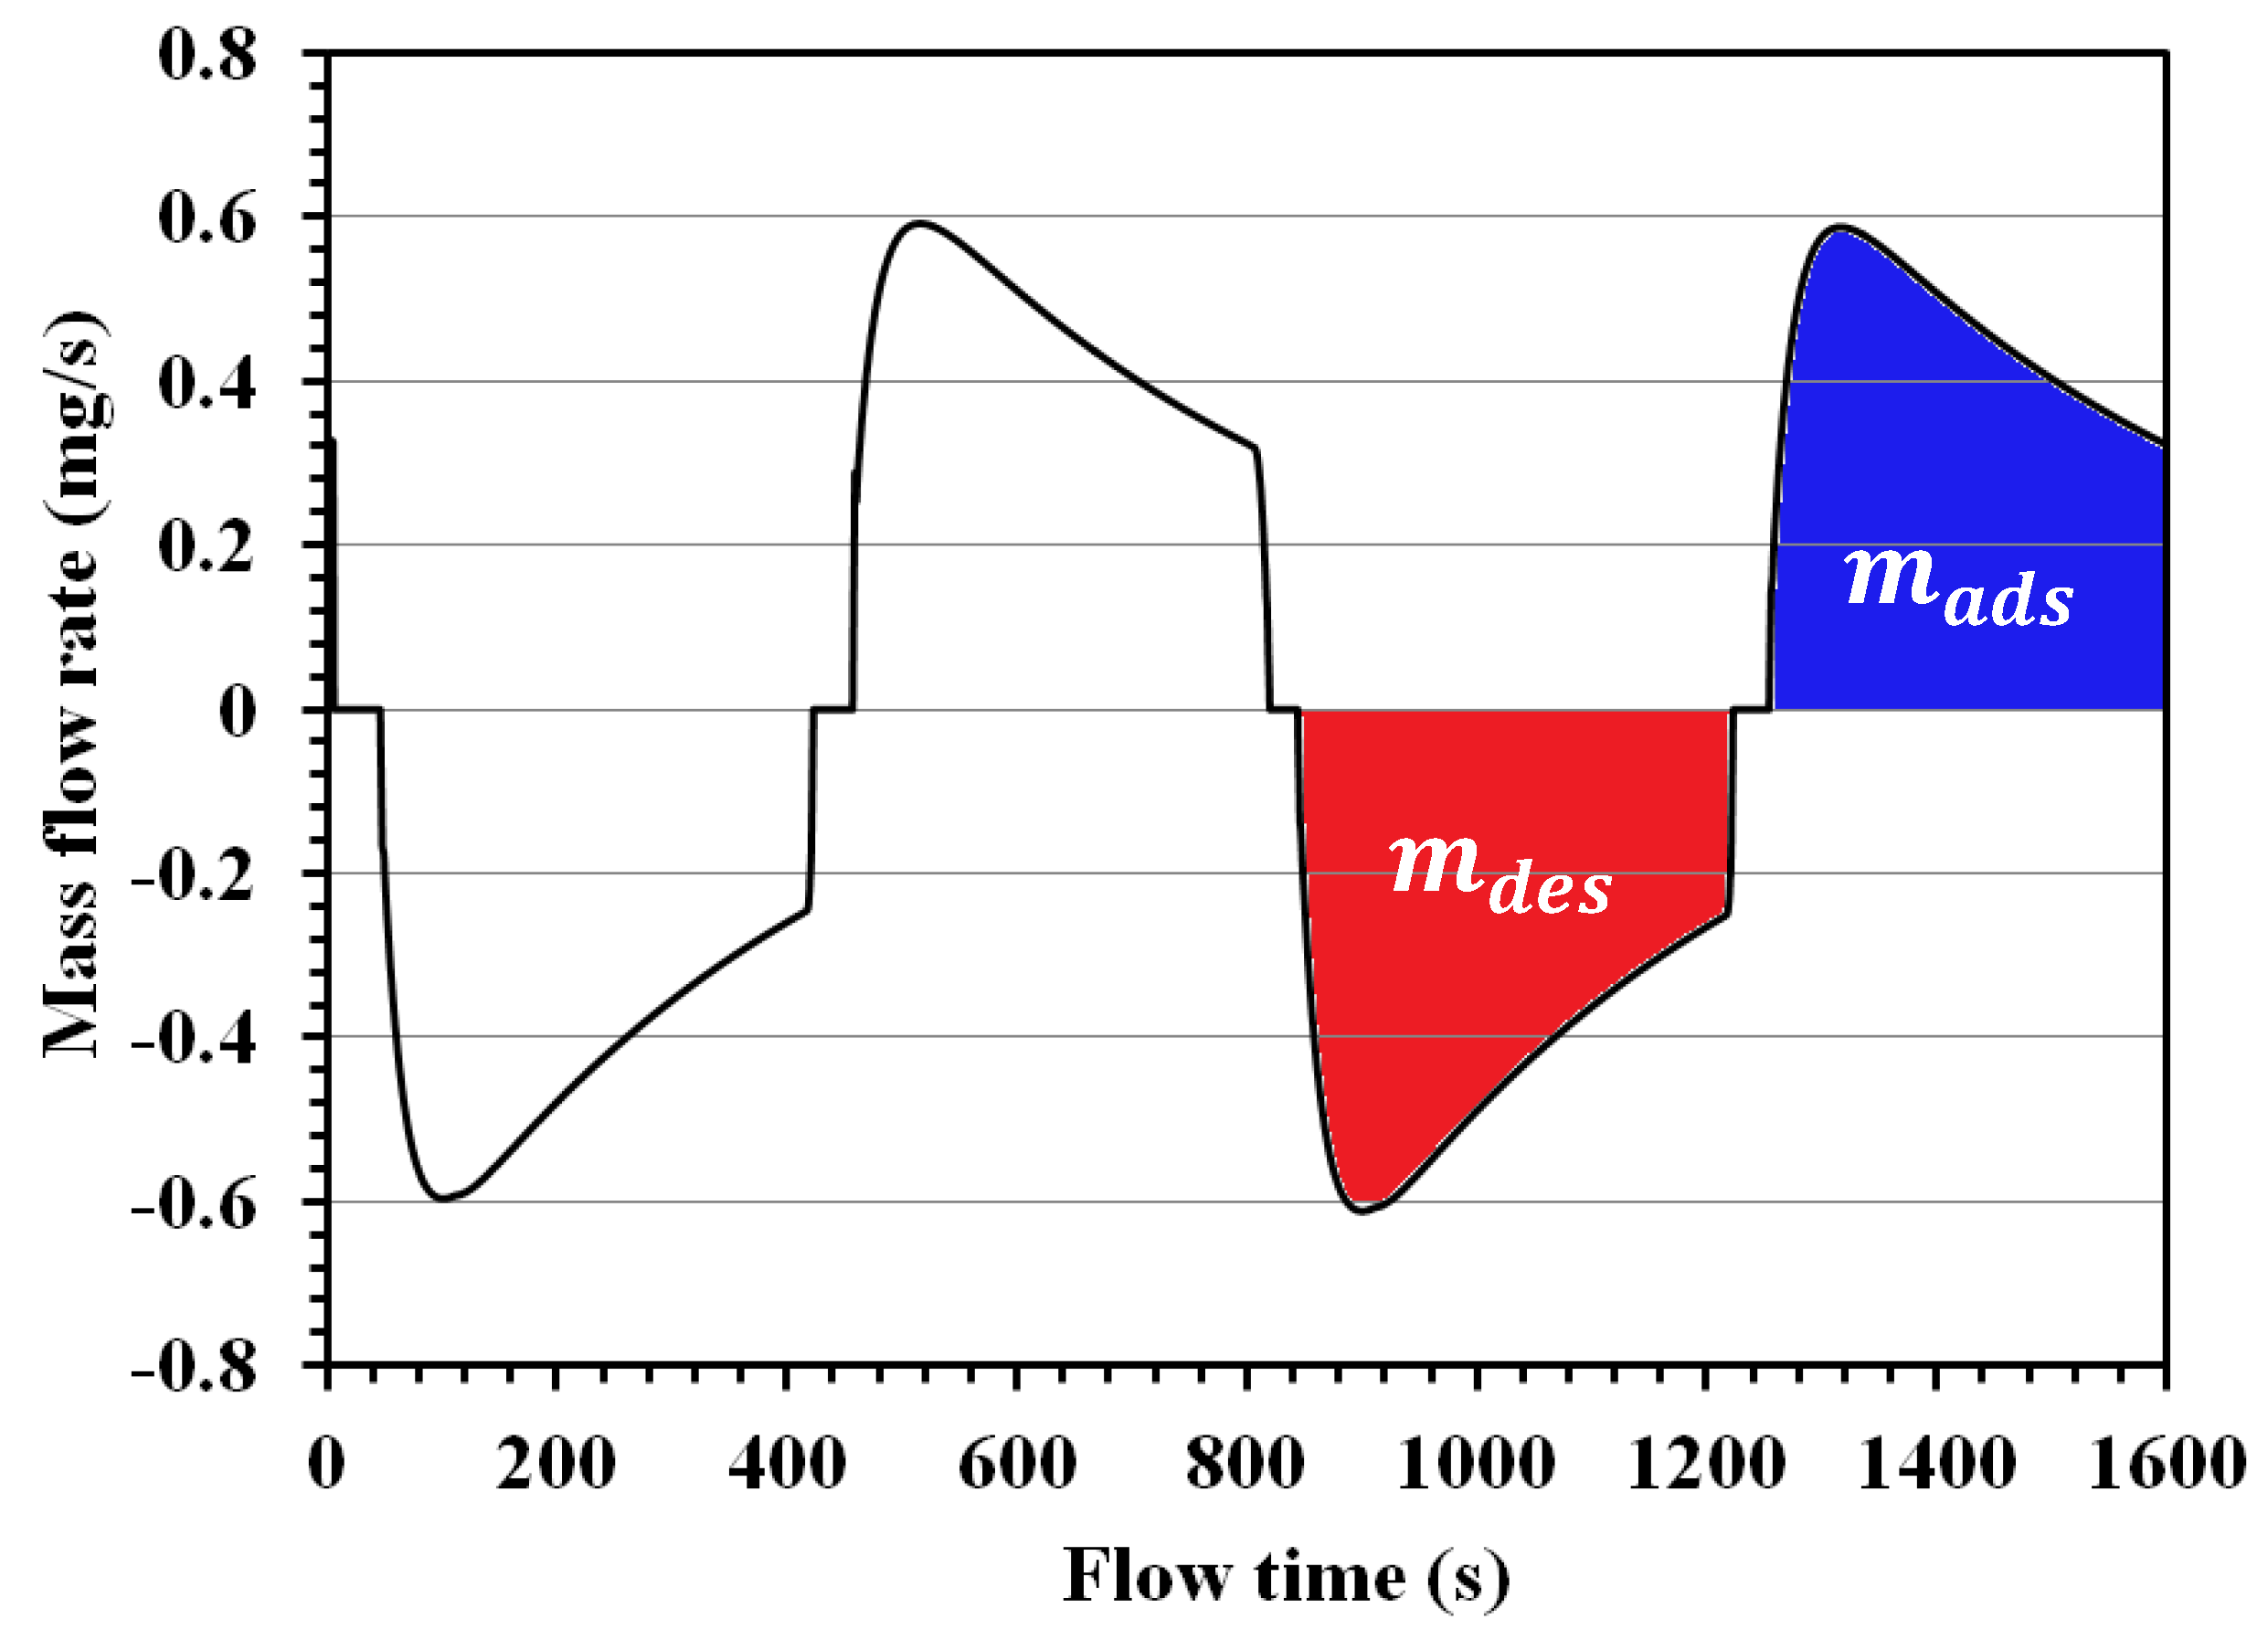
4.3. Adsorption Characteristics
4.4. Energy and Mass Balance
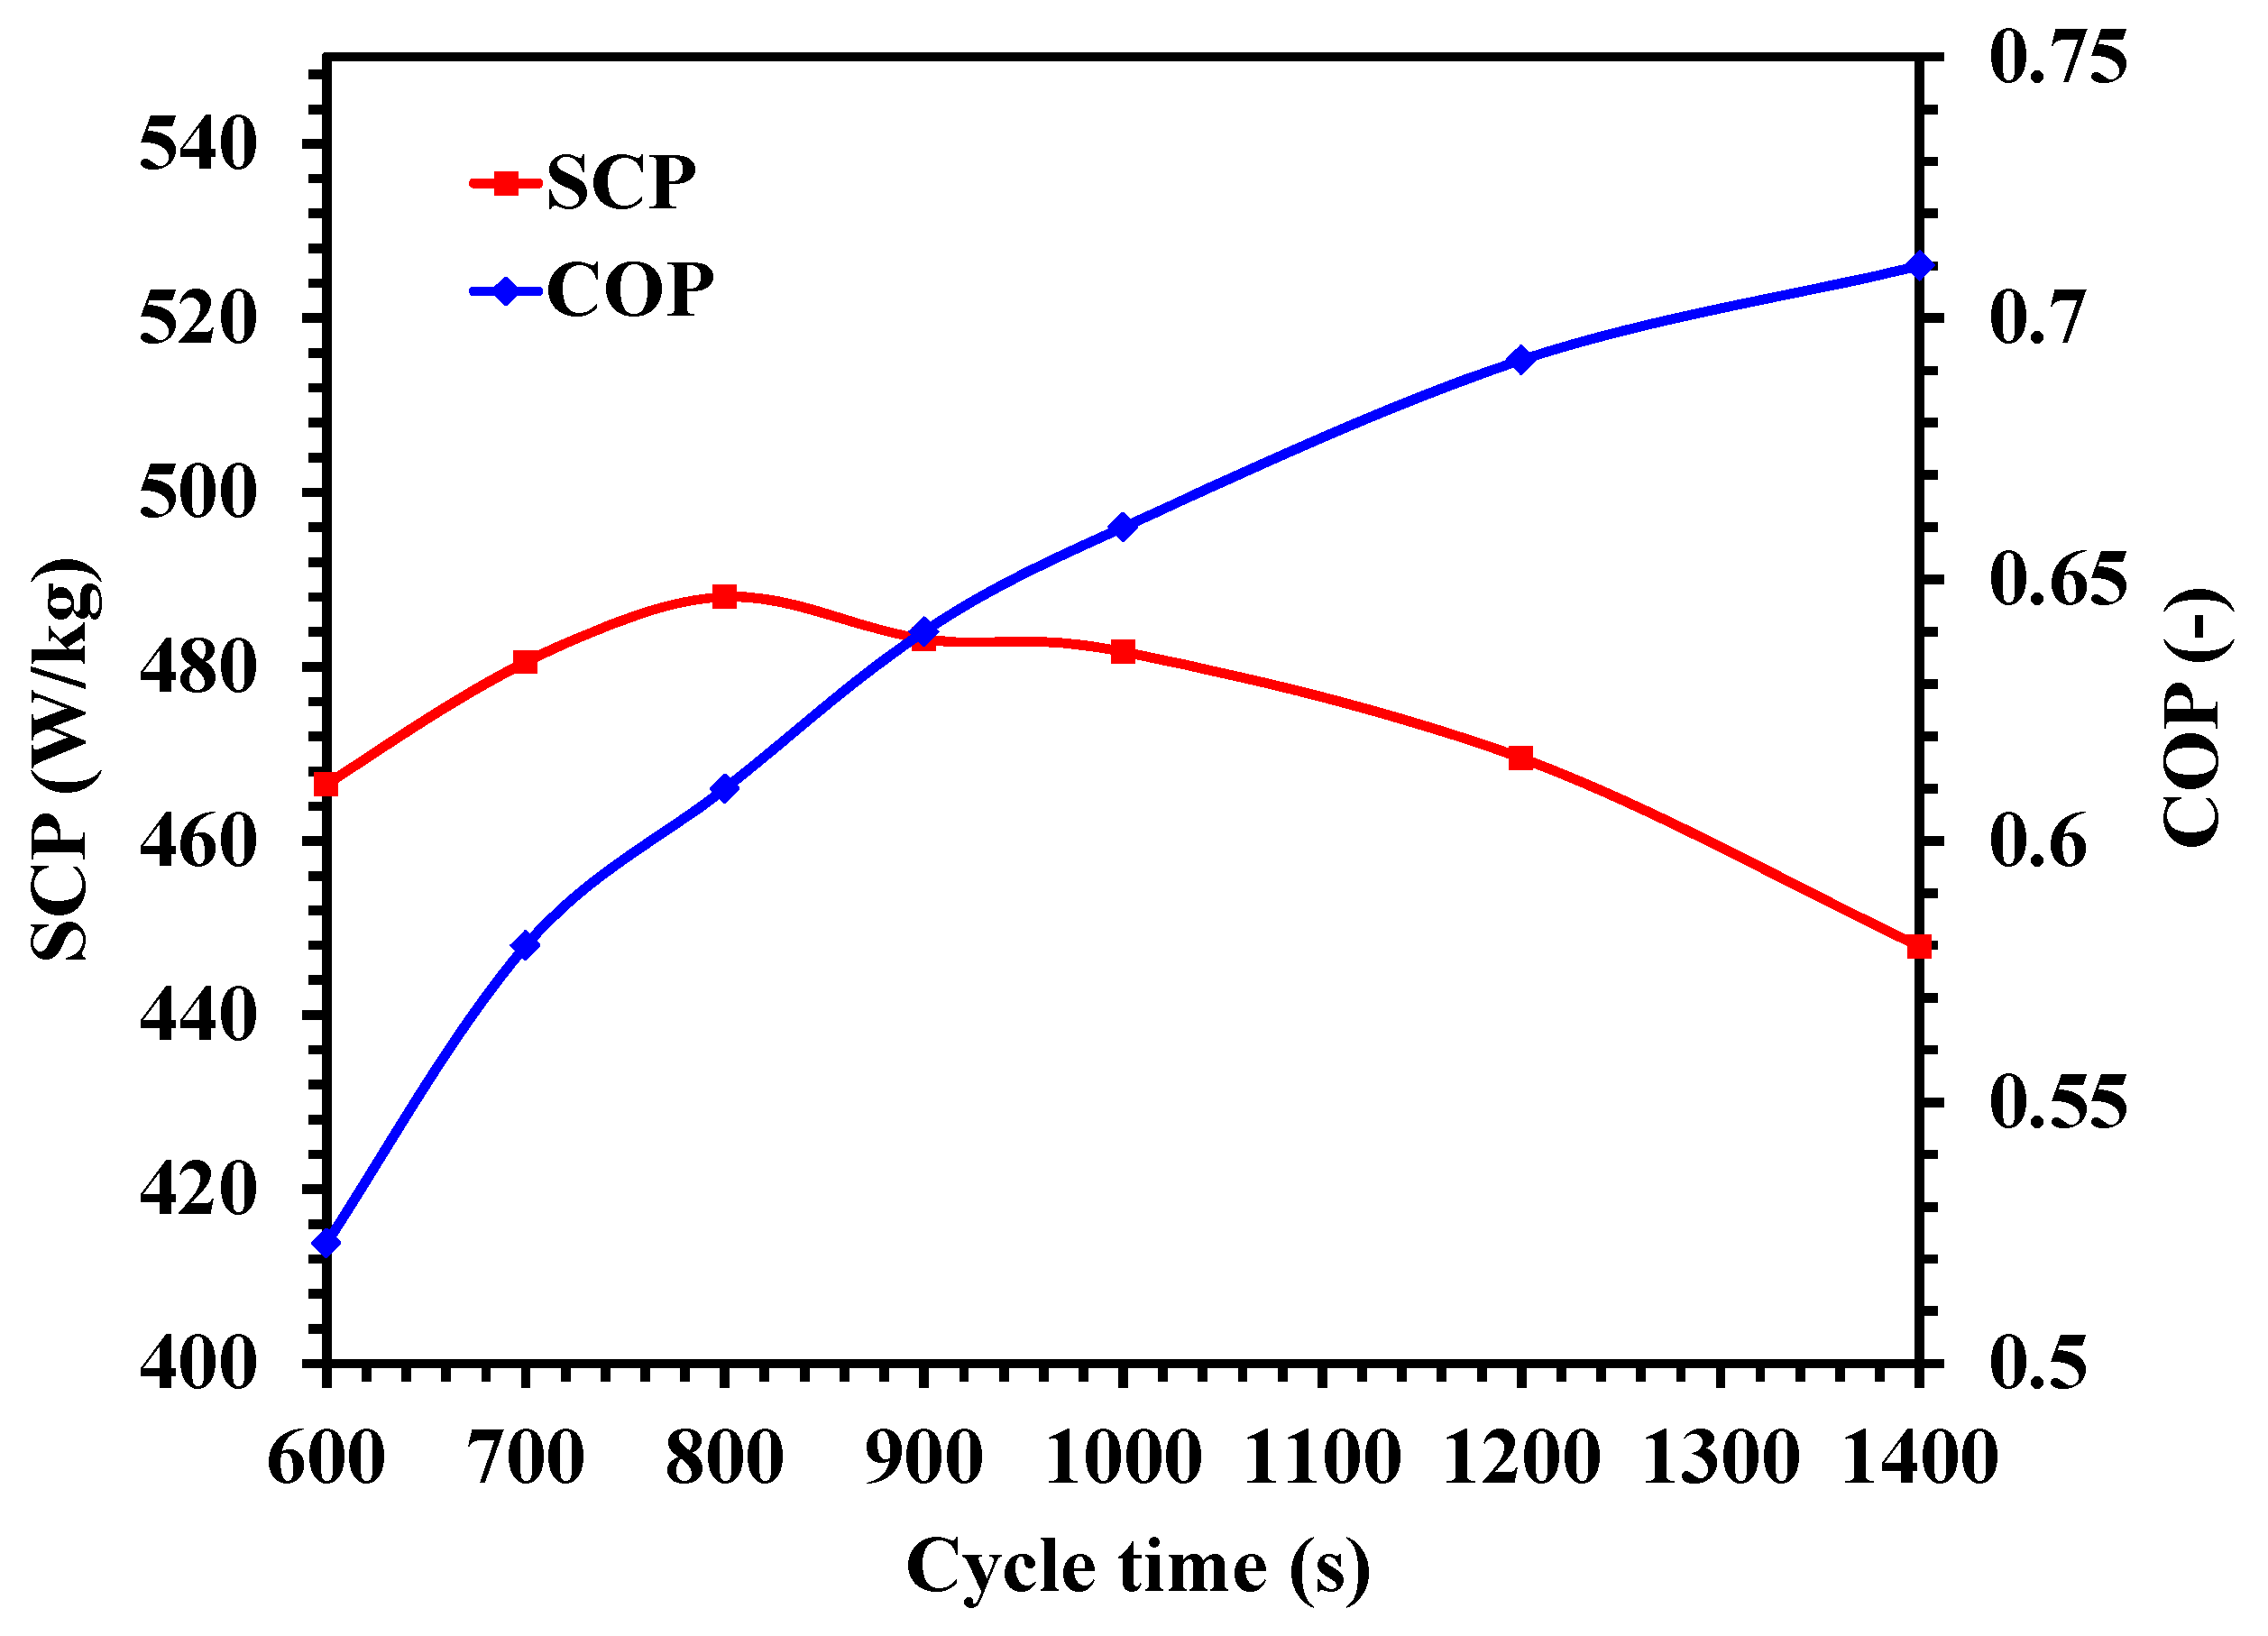
4.5. Performance Investigation
5. Conclusions
Author Contributions
Acknowledgments
Conflicts of Interest
Nomenclature
| pre-exponential factor (s−1) | |
| inertial loss coefficient (m−1) | |
| diameter (m) | |
| energy (kJ) | |
| force vector (N) | |
| gravitational acceleration (m·s−2) | |
| heat of evaporation (J·kg−1) | |
| diffusion time constant (s−1) | |
| heterogeneity parameter (-) | |
| mass flow rate (kg·s−1) | |
| m | mass (kg) |
| pressure (Pa) | |
| gas constant (kJ·kmol−1·K−1) | |
| mass source term (kg·m-3·s−1) | |
| uptake (kg·kg−1) | |
| thermal energy (J) | |
| heat of adsorption (kJ·kg−1) | |
| time (s) | |
| temperature (K) | |
| velocity magnitude (m·s−1) | |
| overall velocity vector (m·s−2) | |
| Greek | |
| permeability (m2) | |
| porosity (-) | |
| adsorbent’ micropore volume (cm3·g−1) | |
| density (kg·m−3) | |
| dynamic viscosity (Pa·s) | |
| gradient | |
| stress tensor | |
| Superscripts | |
| equilibrium | |
| Subscripts | |
| apparent, activation | |
| ac | activated carbon |
| adsorption | |
| chill | |
| condenser | |
| desorption | |
| effective | |
| g | gas phase |
| p | particle |
| solid, saturated | |
| Acronyms | |
| ACS | adsorption cooling system |
| CFD | computational fluid dynamics |
| NIST | National Institute of Standards and Technology |
| SCP | specific cooling power |
| COP | coefficient of performance |
References
- International Institute of Refrigeration. 35th Informatory Note on Refrigeration Technologies 'The Impact of the Refrigeration Sector on Climate Change’; International Institute of Refrigeration: Paris, France, 2017. [Google Scholar]
- Umair, M.; Akisawa, A.; Ueda, Y. Performance evaluation of a solar adsorption refrigeration system with a wing type compound parabolic concentrator. Energies 2014, 7, 1448–1466. [Google Scholar] [CrossRef]
- Hassan, H.Z. Performance evaluation of a continuous operation adsorption chiller powered by solar energy using silica gel and water as the working pair. Energies 2014, 7, 6382–6400. [Google Scholar] [CrossRef]
- Pan, Q.W.; Wang, R.Z.; Wang, L.W.; Liu, D. Design and experimental study of a silica gel-water adsorption chiller with modular adsorbers. Int. J. Refrig. 2016, 67, 336–344. [Google Scholar] [CrossRef]
- Uyun, A.S.; Miyazaki, T.; Ueda, Y.; Akisawa, A. Performance analysis of a double-effect adsorption refrigeration cycle with a silica gel/water working pair. Energies 2010, 3, 1704–1720. [Google Scholar]
- Brancato, V.; Frazzica, A.; Sapienza, A.; Gordeeva, L.; Freni, A. Ethanol adsorption onto carbonaceous and composite adsorbents for adsorptive cooling system. Energy 2015, 84, 177–185. [Google Scholar] [CrossRef]
- El-Sharkawy, I.I.; Hassan, M.; Saha, B.B.; Koyama, S.; Nasr, M.M. Study on adsorption of methanol onto carbon based adsorbents. Int. J. Refrig. 2009, 32, 1579–1586. [Google Scholar] [CrossRef]
- Gong, L.X.; Wang, R.Z.; Xia, Z.Z.; Lu, Z.S. Experimental study on an adsorption chiller employing lithium chloride in silica gel and methanol. Int. J. Refrig. 2012, 35, 1950–1957. [Google Scholar] [CrossRef]
- Li, S.L.; Xia, Z.Z.; Wu, J.Y.; Li, J.; Wang, R.Z.; Wang, L.W. Experimental study of a novel CaCl2/expanded graphite-NH3 adsorption refrigerator. Int. J. Refrig. 2010, 33, 61–69. [Google Scholar] [CrossRef]
- Jribi, S.; Saha, B.B.; Koyama, S.; Bentaher, H. Modeling and simulation of an activated carbon-CO2 four bed based adsorption cooling system. Energy Convers. Manag. 2014, 78, 985–991. [Google Scholar] [CrossRef]
- Papakokkinos, G.; Bartrons, E.; Farnos, J.; Castro, J.; Oliva, A. A computational model based on parallelizable unstructured meshes for the simulation of the conjugate phenomena in the adsorption reactor. In Proceedings of the International Sorption Heat Pump Conference, Tokyo, Japan, 7–10 August 2017. [Google Scholar]
- Demir, H.; Mobedi, M.; Ülkü, S. A review on adsorption heat pump: Problems and solutions. Renew. Sustain. Energy Rev. 2008, 12, 2381–2403. [Google Scholar] [CrossRef]
- Wang, K.; Vineyard, E. Adsorption Refrigeration. ASHRAE J. 2011, 53, 14–24. [Google Scholar]
- Wang, D.C.; Li, Y.H.; Li, D.; Xia, Y.Z.; Zhang, J.P. A review on adsorption refrigeration technology and adsorption deterioration in physical adsorption systems. Renew. Sustain. Energy Rev. 2010, 14, 344–353. [Google Scholar] [CrossRef]
- Critoph, R.E. Forced convection adsorption cycles. Appl. Therm. Eng. 1998, 18, 799–807. [Google Scholar] [CrossRef]
- Wang, D.C.; Xia, Z.Z.; Wu, J.Y. Design and performance prediction of a novel zeolite-water adsorption air conditioner. Energy Convers. Manag. 2006, 47, 590–610. [Google Scholar] [CrossRef]
- Saha, B.B.; Chakraborty, A.; Koyama, S. Study on an activated carbon fiber e ethanol adsorption chiller: Part II e performance evaluation. Int. J. Refrig. 2007, 30, 96–102. [Google Scholar] [CrossRef]
- Ali, S.M.; Chakraborty, A. Thermodynamic modelling and performance study of an engine waste heat driven adsorption cooling for automotive air-conditioning. Appl. Therm. Eng. 2015, 90, 54–63. [Google Scholar] [CrossRef]
- Niazmand, H.; Dabzadeh, I. Numerical simulation of heat and mass transfer in adsorbent beds with annular fins. Int. J. Refrig. 2012, 35, 581–593. [Google Scholar] [CrossRef]
- Mahdavikhah, M.; Niazmand, H. Effects of plate finned heat exchanger parameters on the adsorption chiller performance. Appl. Therm. Eng. 2013, 50, 939–949. [Google Scholar] [CrossRef]
- Ramji, H.R.; Leo, S.L.; Abdullah, M.O. Parametric study and simulation of a heat-driven adsorber for air conditioning system employing activated carbon-methanol working pair. Appl. Energy 2014, 113, 324–333. [Google Scholar] [CrossRef]
- Çaǧlar, A. The effect of fin design parameters on the heat transfer enhancement in the adsorbent bed of a thermal wave cycle. Appl. Therm. Eng. 2016, 104, 386–393. [Google Scholar] [CrossRef]
- Jribi, S.; Miyazaki, T.; Saha, B.B.; Koyama, S.; Maeda, S.; Maruyama, T. CFD simulation and experimental validation of ethanol adsorption onto activated carbon packed heat exchanger. Int. J. Refrig. 2017, 74, 343–351. [Google Scholar] [CrossRef]
- Mitra, S.; Muttakin, M.; Thu, K.; Saha, B.B. Study on the influence of adsorbent particle size and heat exchanger aspect ratio on dynamic adsorption characteristics. Appl. Therm. Eng. 2018, 133, 764–773. [Google Scholar] [CrossRef]
- Makimoto, N.; Kariya, K.; Koyama, S. Numerical analysis on adsorption characteristics of activated carbon/ethanol pair in finned tube type adsorber. Trans. JSRAE 2010, 27, 383–392. [Google Scholar]
- Makimoto, N.; Hu, B.; Koyama, S. A study on thermophysical characteristices of activated carbon powder/ethanol pair in adsorber. In Proceedings of the International Sorption Heat Pump Conference, Padua, Italy, 6–8 April 2011; pp. 433–442. [Google Scholar]
- Uddin, K.; Islam, M.A.; Mitra, S.; Lee, J.B.; Thu, K.; Saha, B.B.; Koyama, S. Specific heat capacities of carbon-based adsorbents for adsorption heat pump application. Appl. Therm. Eng. 2018, 129, 117–126. [Google Scholar] [CrossRef]
- Chakraborty, A.; Saha, B.B.; Koyama, S.; Ng, K.C. Specific heat capacity of a single component adsorbent-adsorbate system. Appl. Phys. Lett. 2007, 90, 171902. [Google Scholar] [CrossRef]
- ANSYS. Ansys Fluent User’s Guide; ANSYS: Canonsburg, PA, USA, 2015. [Google Scholar]
- Holaman, J.P. Heat Transfer, 10th ed.; McGraw-Hill: New York, NY, USA, 2010. [Google Scholar]
- Uddin, K.; El-Sharkawy, I.I.; Miyazaki, T.; Saha, B.B.; Koyama, S.; Kil, H.S.; Miyawaki, J.; Yoon, S.-H. Adsorption characteristics of ethanol onto functional activated carbons with controlled oxygen content. Appl. Therm. Eng. 2014, 72, 211–218. [Google Scholar] [CrossRef]
- Jribi, S.; Miyazaki, T.; Saha, B.B.; Koyama, S.; Maeda, S.; Maruyama, T. Corrected adsorption rate model of activated carbon–ethanol pair by means of CFD simulation. Int. J. Refrig. 2016, 71, 60–68. [Google Scholar] [CrossRef]
- El-Sharkawy, I.I.; Uddin, K.; Miyazaki, T.; Saha, B.B.; Koyama, S.; Miyawaki, J.; Yoon, S.H. Adsorption of ethanol onto parent and surface treated activated carbon powders. Int. J. Heat Mass Transf. 2014, 73, 445–455. [Google Scholar] [CrossRef]
- Ambrose, D.; Sprake, C.H.S. Thermodynamic properties of organic oxygen compounds XXV. Vapour pressures and normal boiling temperatures of aliphatic alcohols. J. Chem. Thermodyn. 1970, 2, 631–645. [Google Scholar] [CrossRef]


© 2018 by the authors. Licensee MDPI, Basel, Switzerland. This article is an open access article distributed under the terms and conditions of the Creative Commons Attribution (CC BY) license (http://creativecommons.org/licenses/by/4.0/).
Share and Cite
Khanam, M.; Jribi, S.; Miyazaki, T.; Saha, B.B.; Koyama, S. Numerical Investigation of Small-Scale Adsorption Cooling System Performance Employing Activated Carbon-Ethanol Pair. Energies 2018, 11, 1499. https://doi.org/10.3390/en11061499
Khanam M, Jribi S, Miyazaki T, Saha BB, Koyama S. Numerical Investigation of Small-Scale Adsorption Cooling System Performance Employing Activated Carbon-Ethanol Pair. Energies. 2018; 11(6):1499. https://doi.org/10.3390/en11061499
Chicago/Turabian StyleKhanam, Marzia, Skander Jribi, Takahiko Miyazaki, Bidyut Baran Saha, and Shigeru Koyama. 2018. "Numerical Investigation of Small-Scale Adsorption Cooling System Performance Employing Activated Carbon-Ethanol Pair" Energies 11, no. 6: 1499. https://doi.org/10.3390/en11061499
APA StyleKhanam, M., Jribi, S., Miyazaki, T., Saha, B. B., & Koyama, S. (2018). Numerical Investigation of Small-Scale Adsorption Cooling System Performance Employing Activated Carbon-Ethanol Pair. Energies, 11(6), 1499. https://doi.org/10.3390/en11061499