The Effect of Oil Properties on the Supercritical CO2 Diffusion Coefficient under Tight Reservoir Conditions


Abstract
:1. Introduction
2. Experimental Section
2.1. Materials
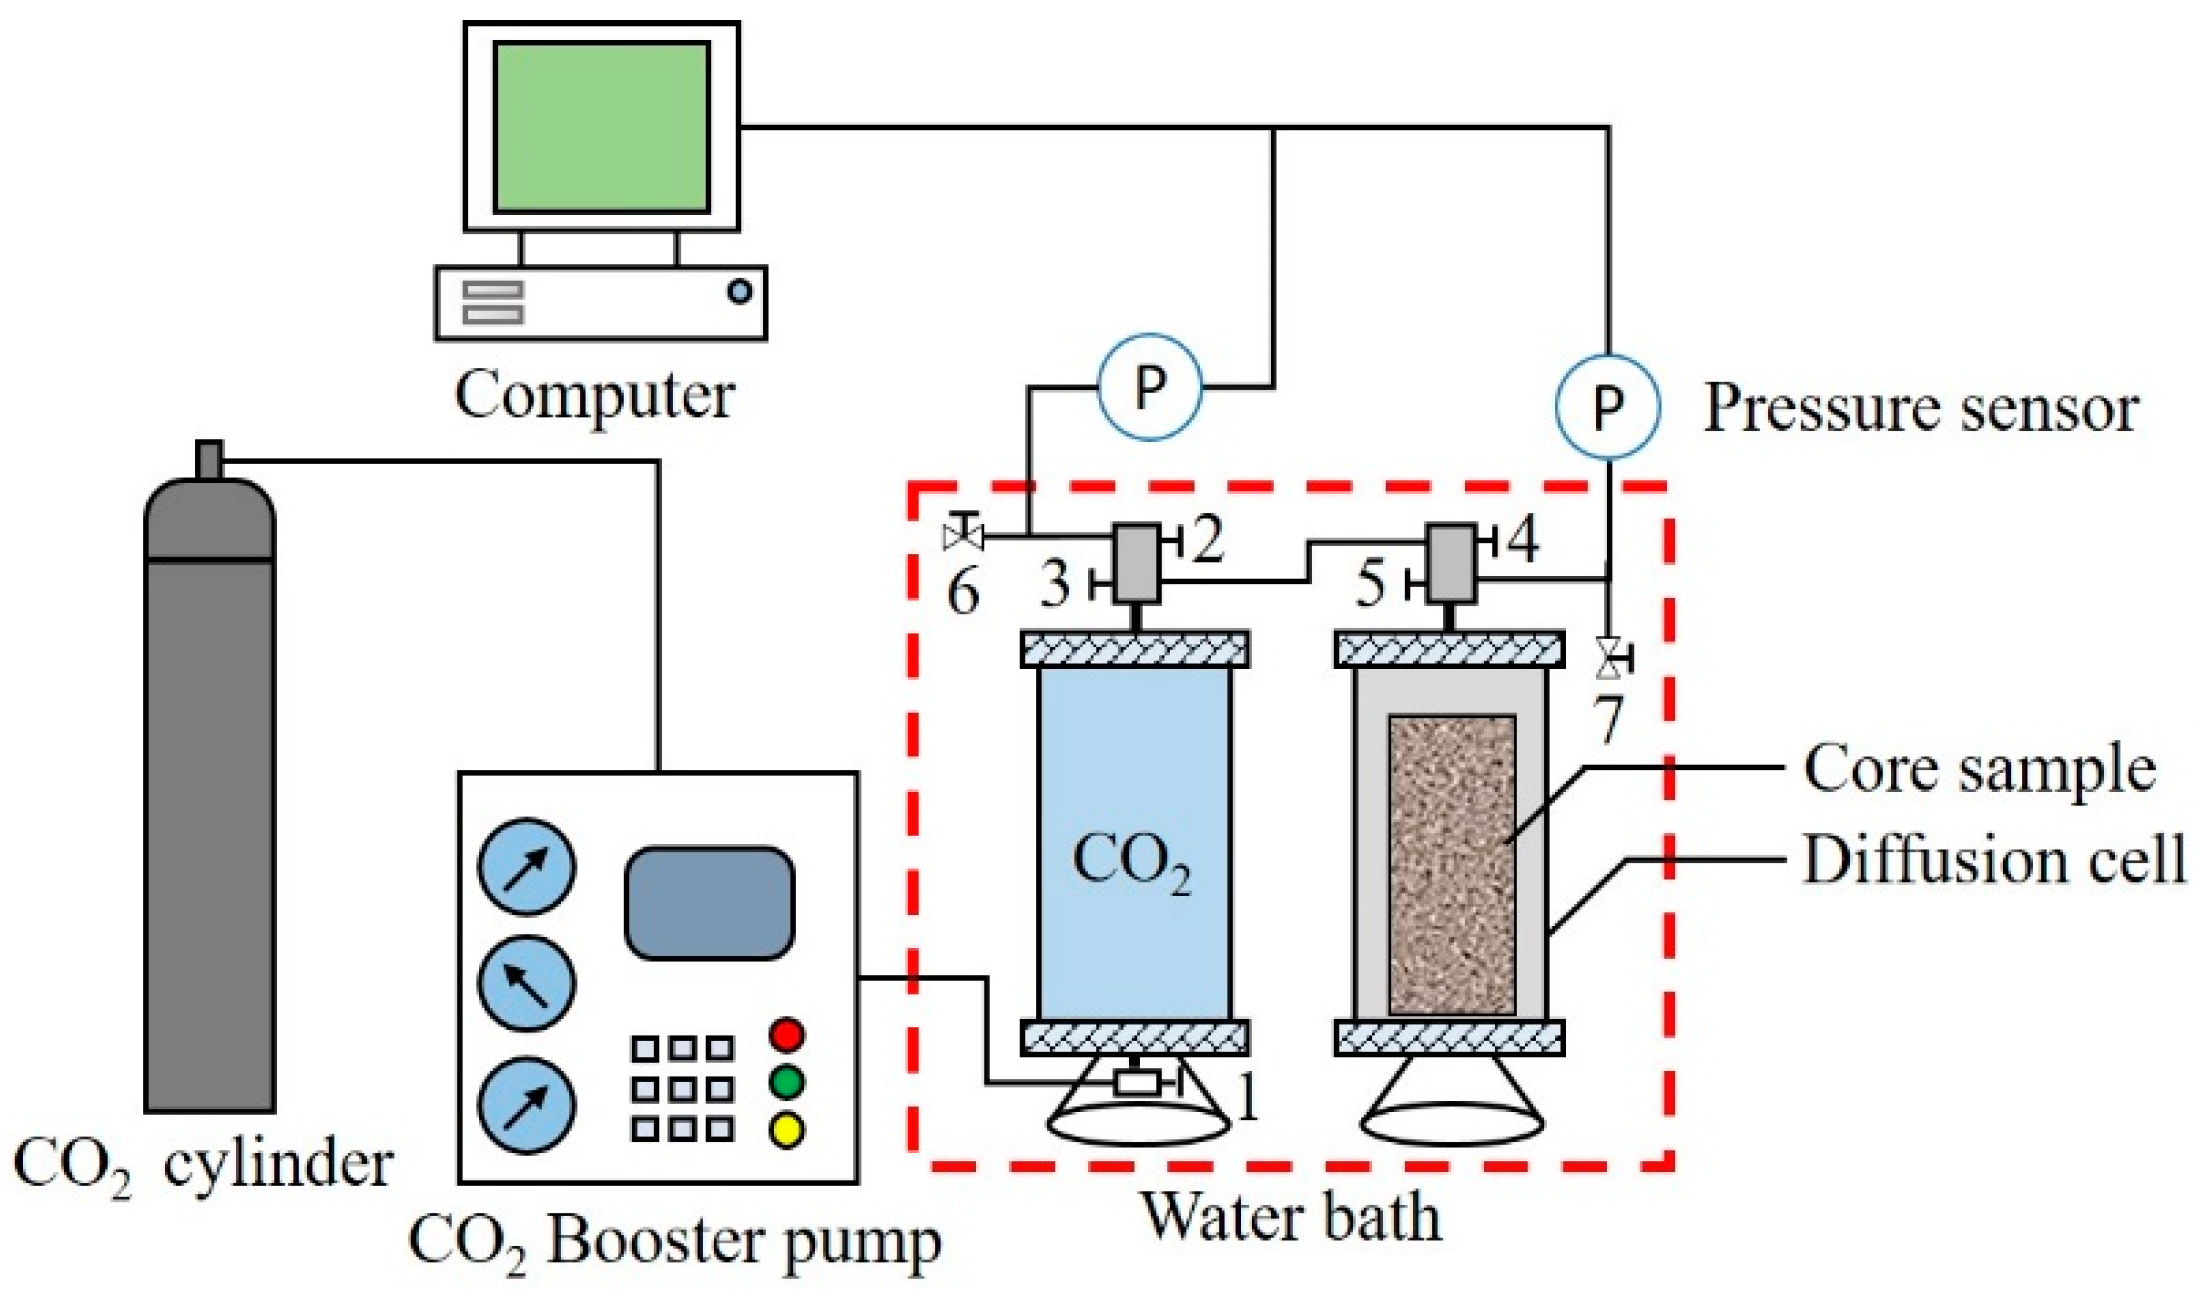
2.2. Apparatus
2.3. Experimental Procedures
- (a)
- Clean and dry the core for the experiment, put it into an intermediate container and vacuum for 10.0 h. Then, the oil sample is injected into the intermediate container at room temperature until the pressure of the oil sample reaches 15.0 MPa; maintain this pressure for 48.0 h to ensure that the core pores are completely saturated with crude oil.
- (b)
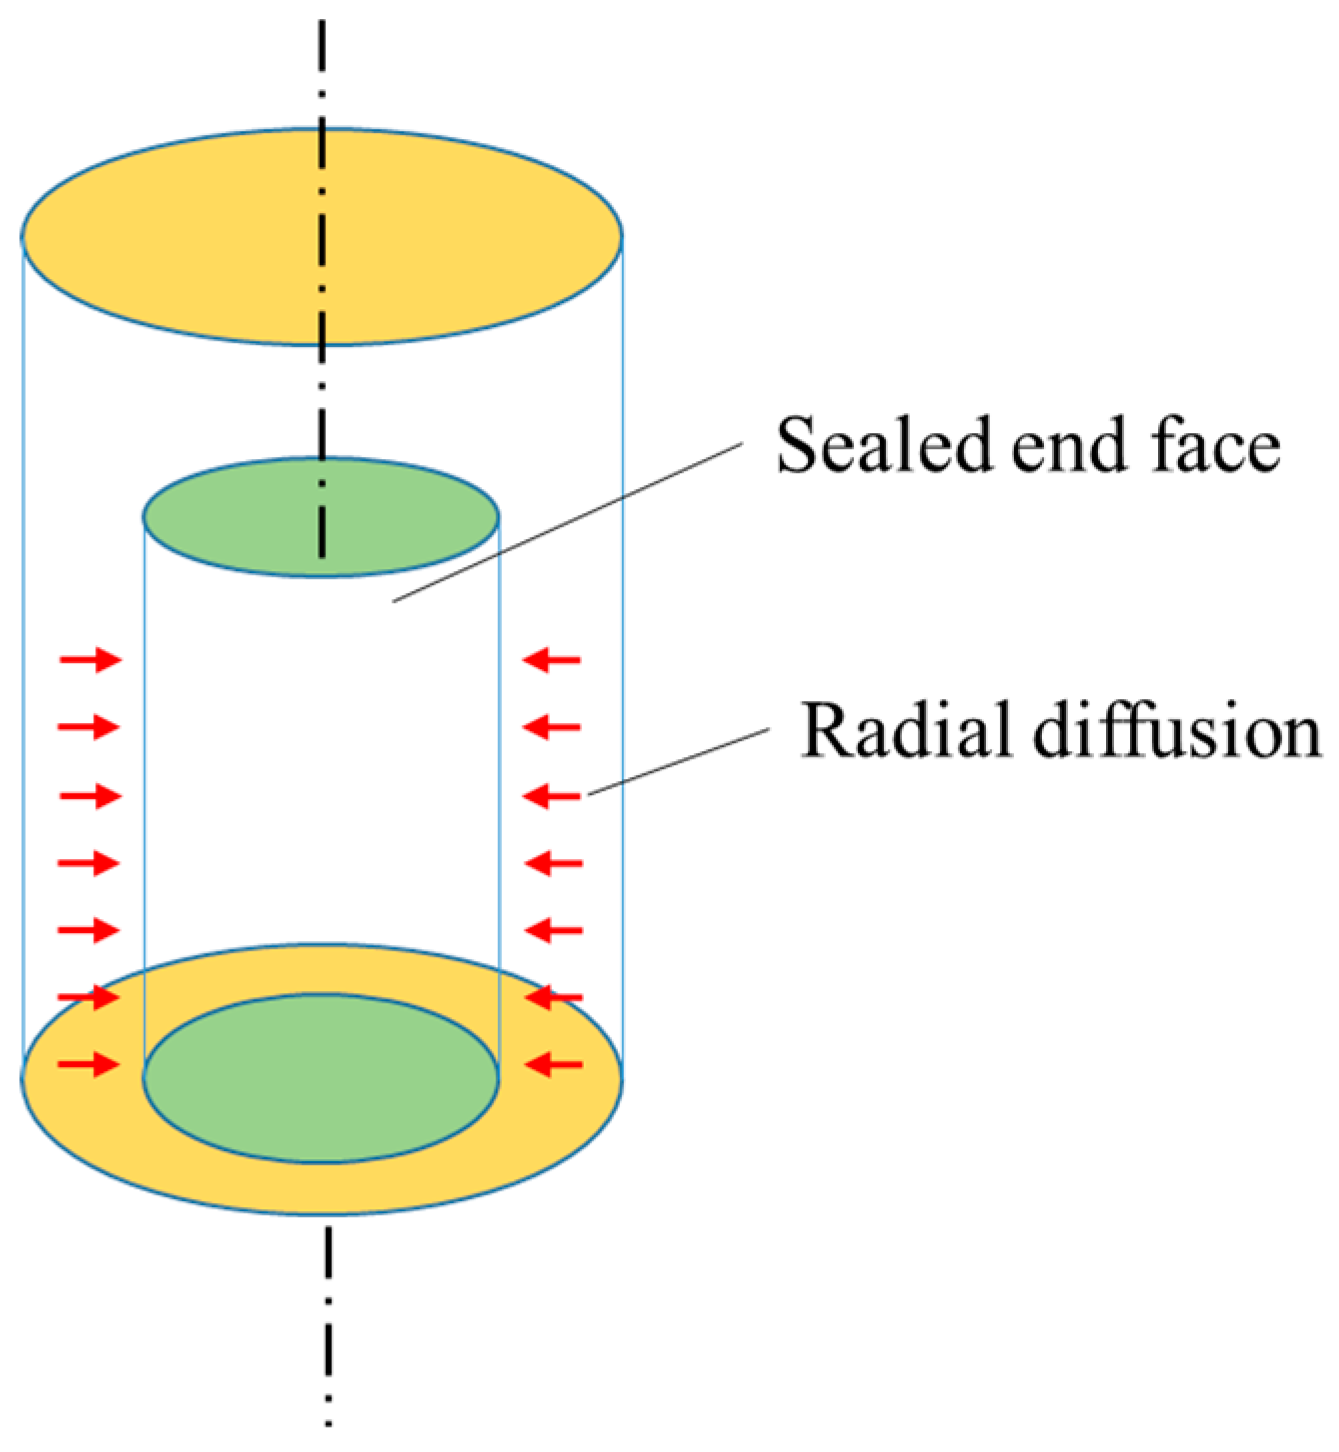
- Seal the two ends of the oil-saturated core with epoxy resin and aluminum foil to ensure that CO2 can diffuse only through the side surface of the core.
- (c)
- Connect the apparatus that is required for the diffusion experiment according to Figure 2. After testing the air tightness of the diffusion cell, place the core in it. Replace the air in the diffusion cell with low pressure CO2.
- (d)
- Put the diffusion cell and CO2 container into the water bath at the required temperature for 4.0 h, and open valve 5 to monitor the pressure in the CO2 container.
- (e)
- When the pressure inside the CO2 container is stable, open valves 2, 3 and 4 to inject CO2 into the diffusion cell. Close valves 3 and 4 quickly after the pressure in the diffusion cell and CO2 container reach a balance, and record the pressure decay in the diffusion cell.
- (f)
- When the pressure in the diffusion cell does not change, finish the diffusion experiment. Slowly open all valves, release the fluid in the diffusion cell, and clean the equipment for the next set of experiments.
3. Mathematical Model
3.1. Diffusion Model in Porous Media
- (1)
- Cores are homogenous and isotropic, i.e., the influences of different cores are ignored.
- (2)
- Oil saturates all pores in the cores, i.e., oil saturation is 100%.
- (3)
- CO2 concentration at the side surface of the core is constant during the diffusion process.
- (4)
- (5)
- The convection flow caused by the density difference is ignored.
- (6)
- The CO2 transfer process occurs only in the radial direction.
- (7)
- There is no heat exchange during the diffusion process.
3.2. Peng-Robinson Equation of State (PR EOS)
3.3. Determination of the Diffusion Coefficients
- (1)
- Determine CO2 concentration distribution in the core.
- (2)
- Calculate the mole composition in the annular space of the diffusion cell according to the amount of swelled oil and dissolved CO2.
- (3)
- Determine the pressure value by solving PR EOS with data that are obtained in step 2.
4. Results and Discussion
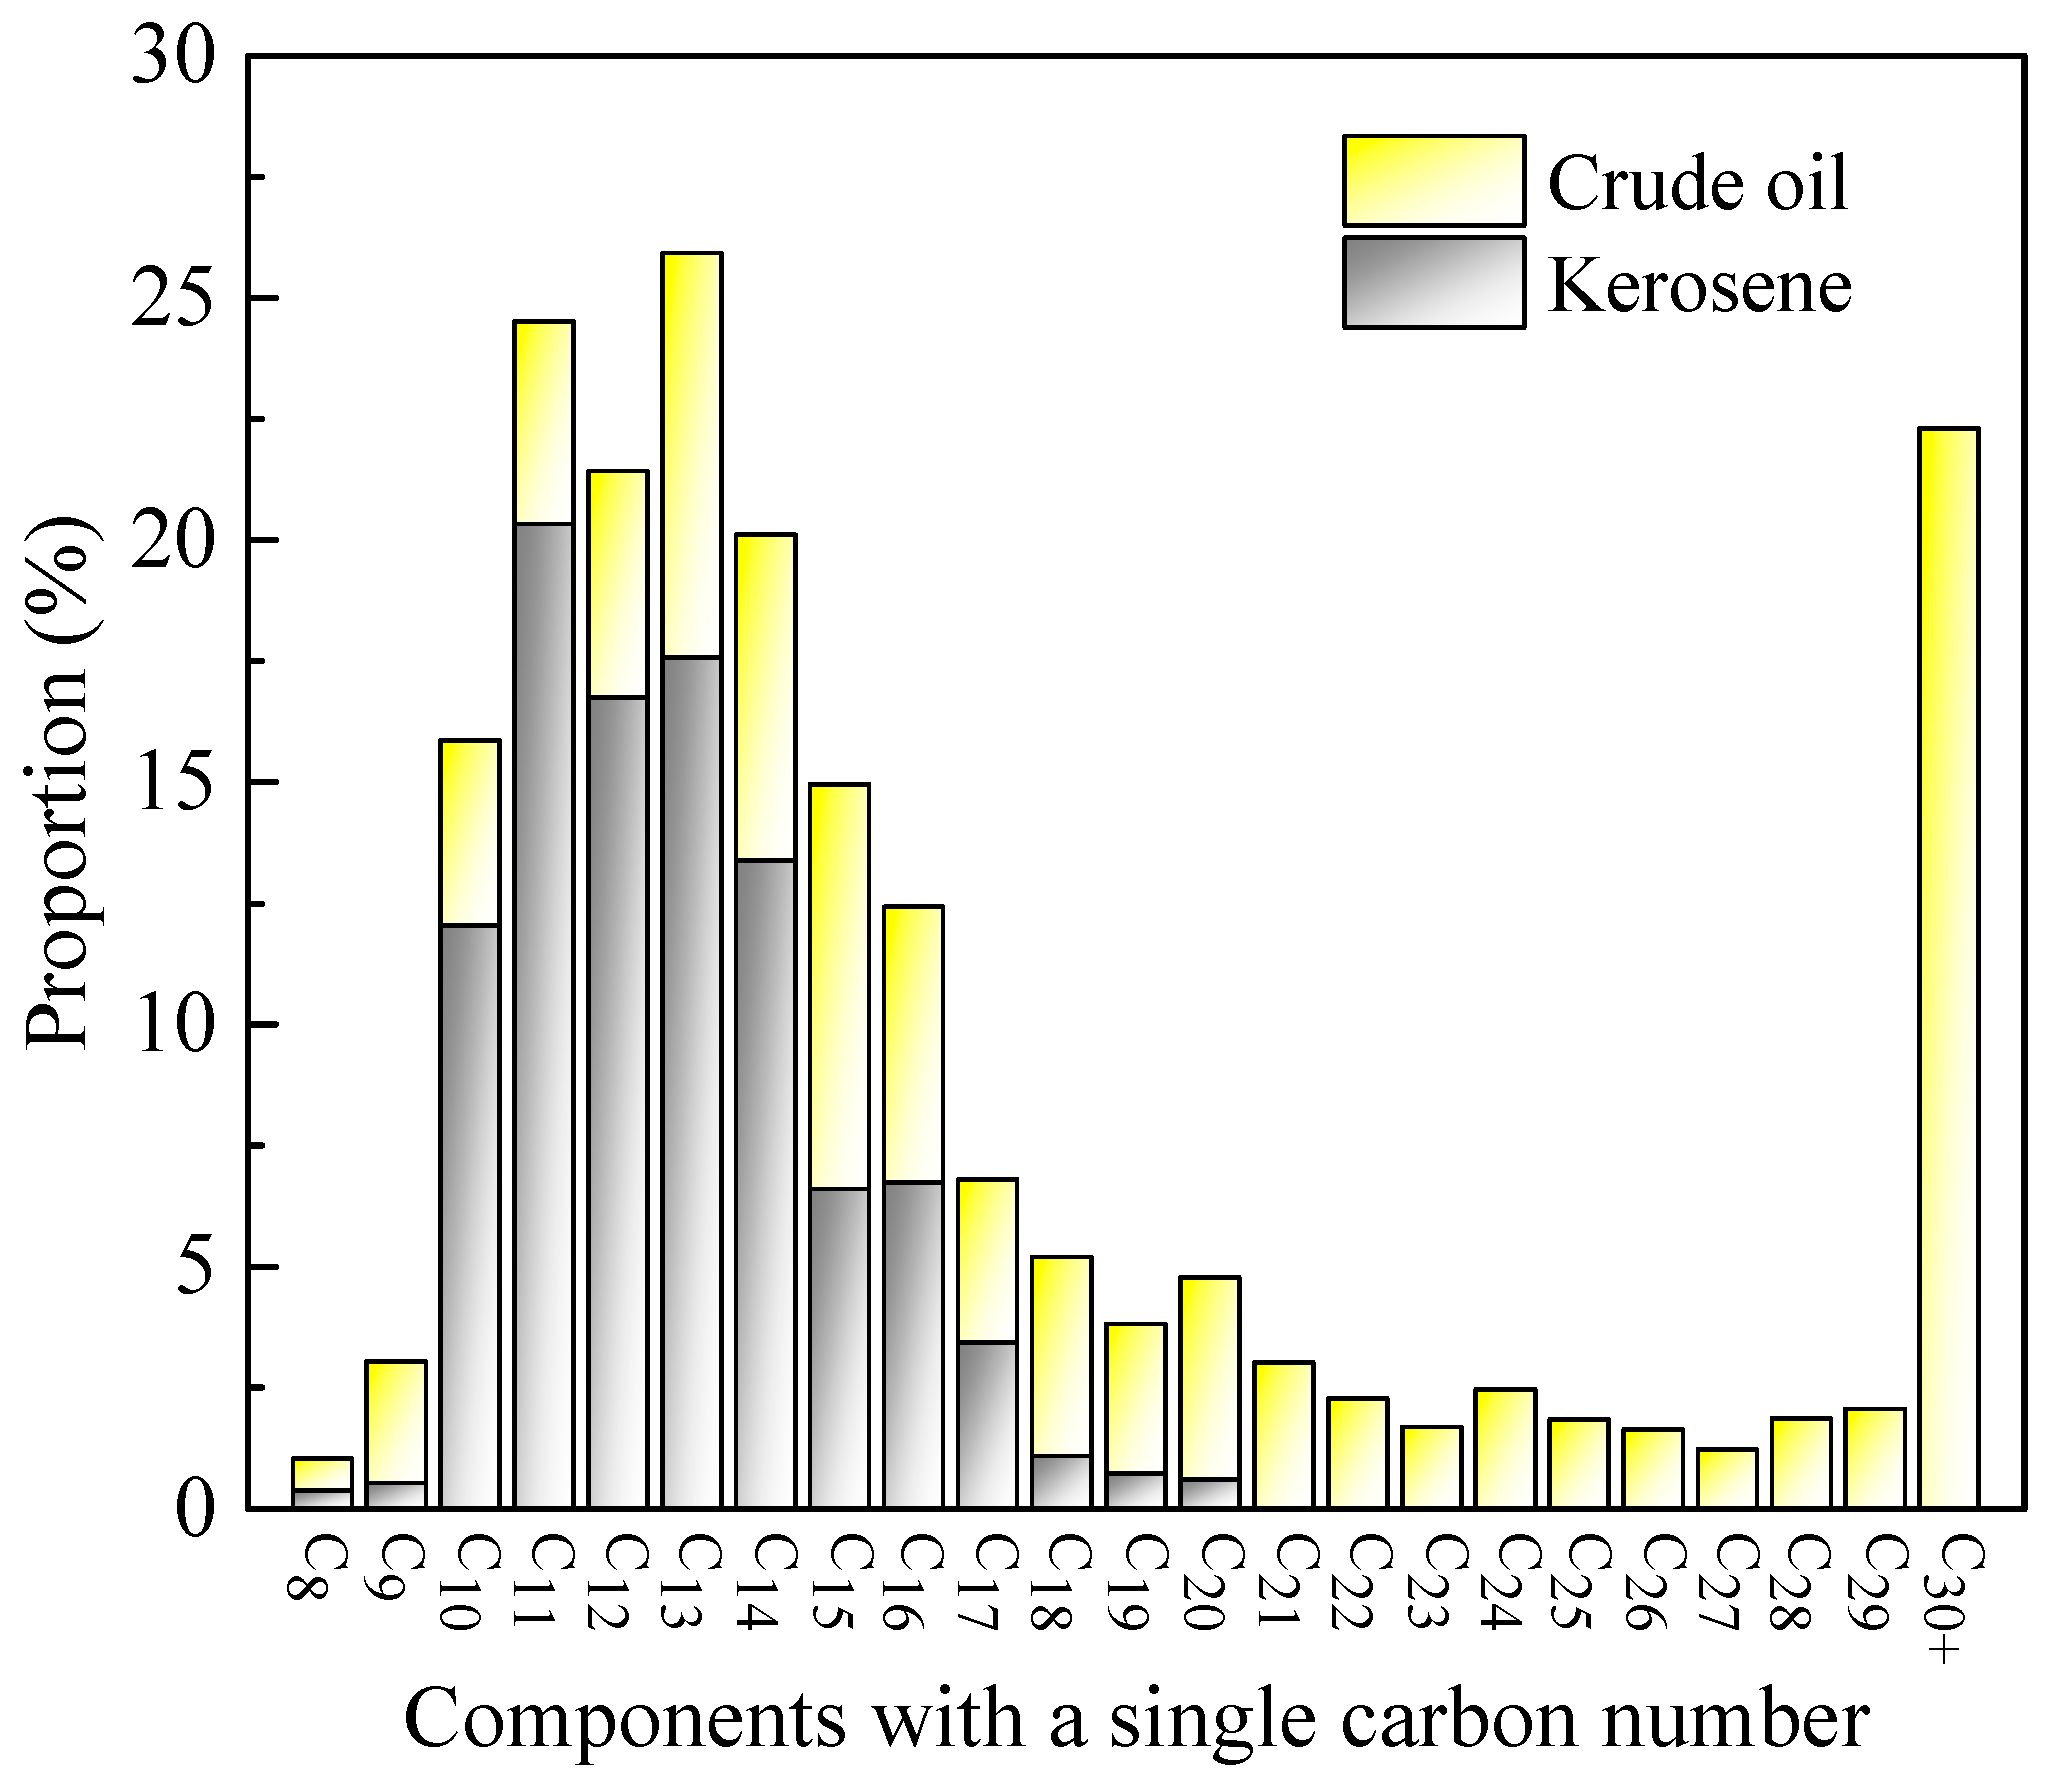
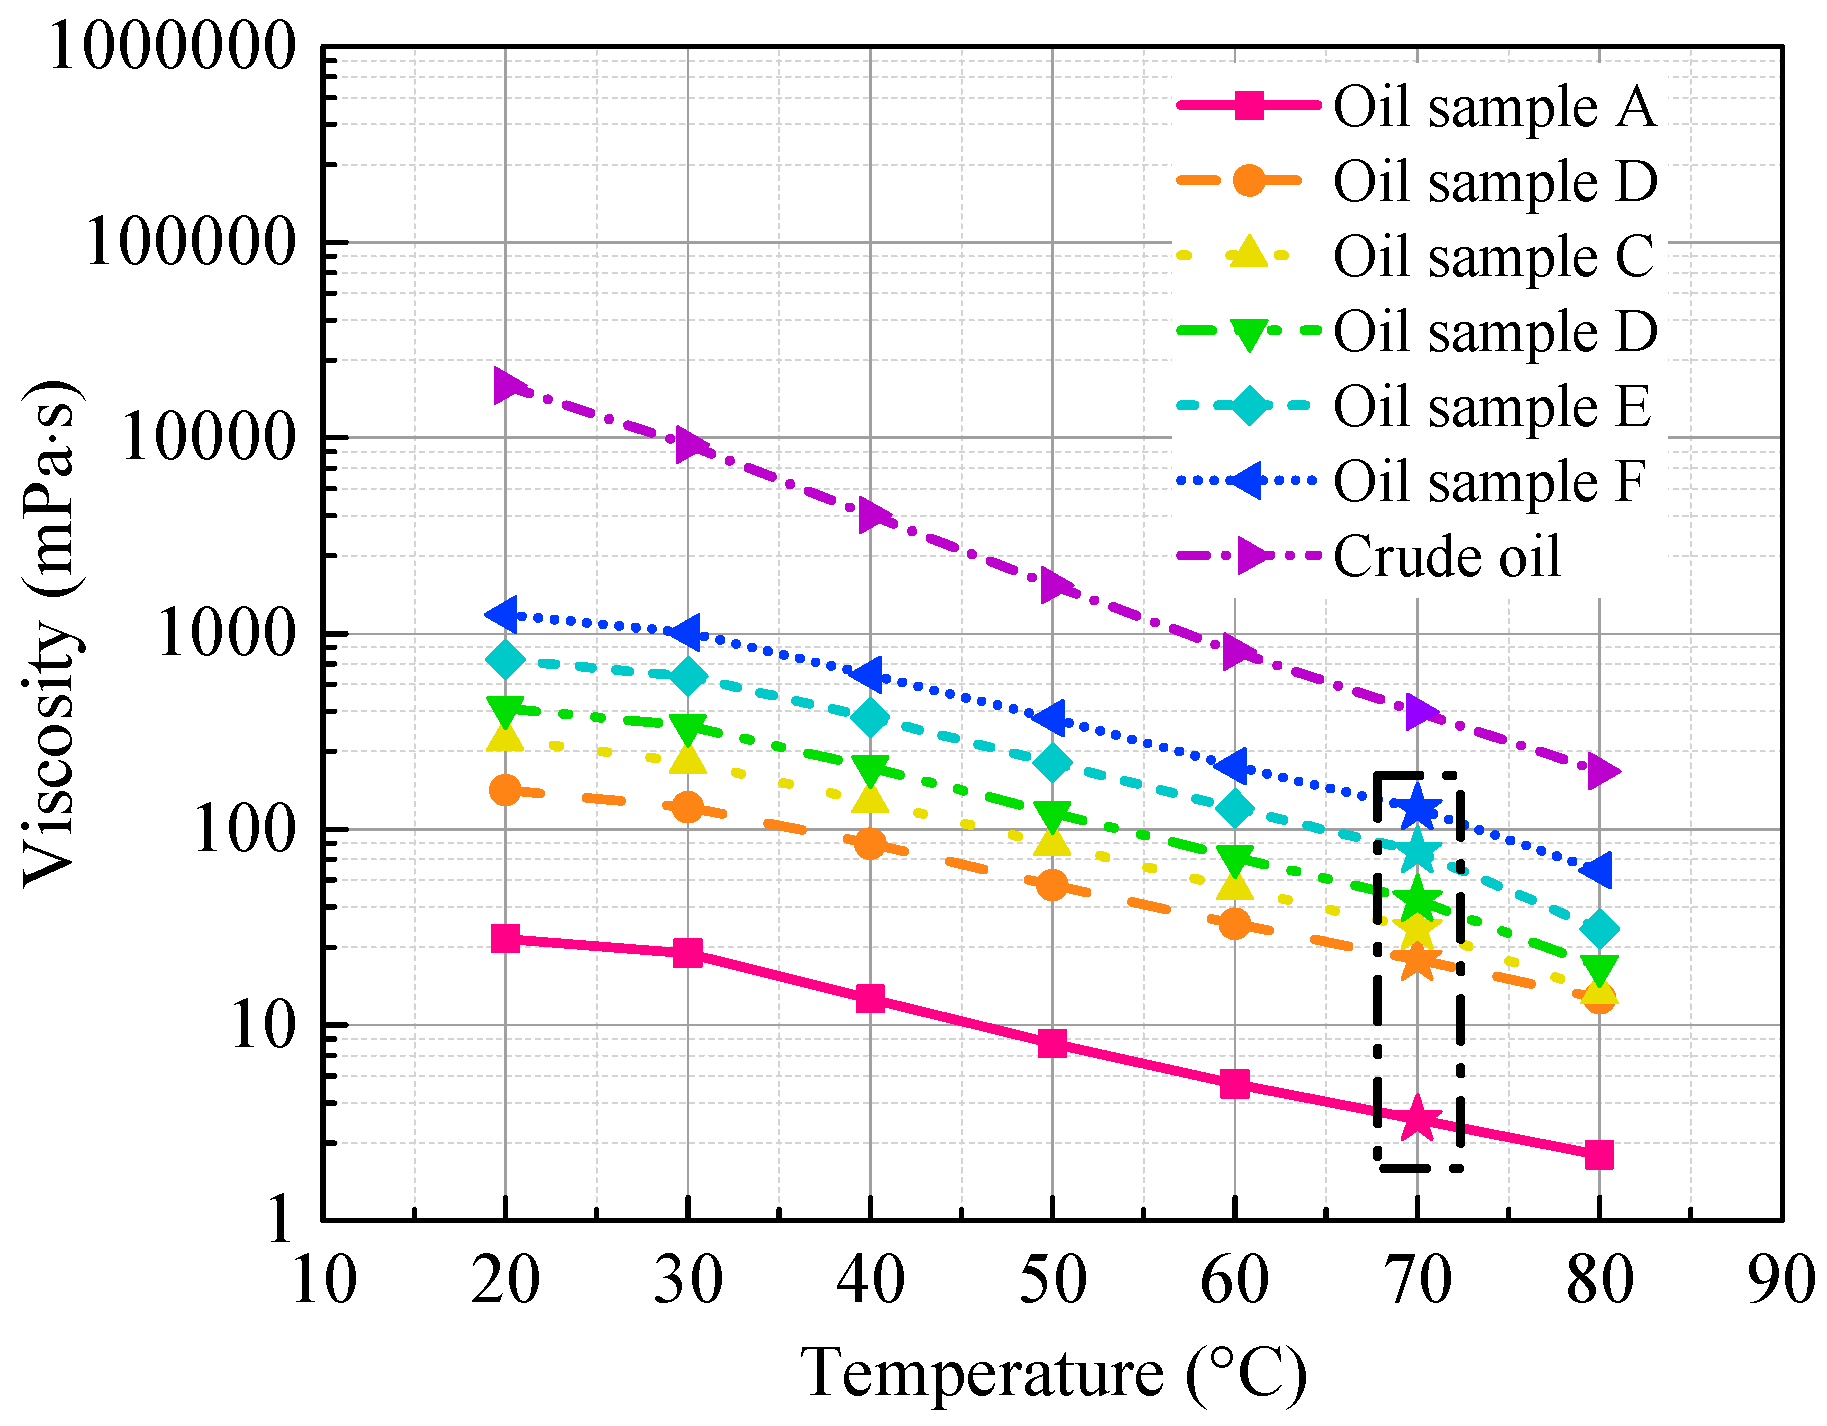
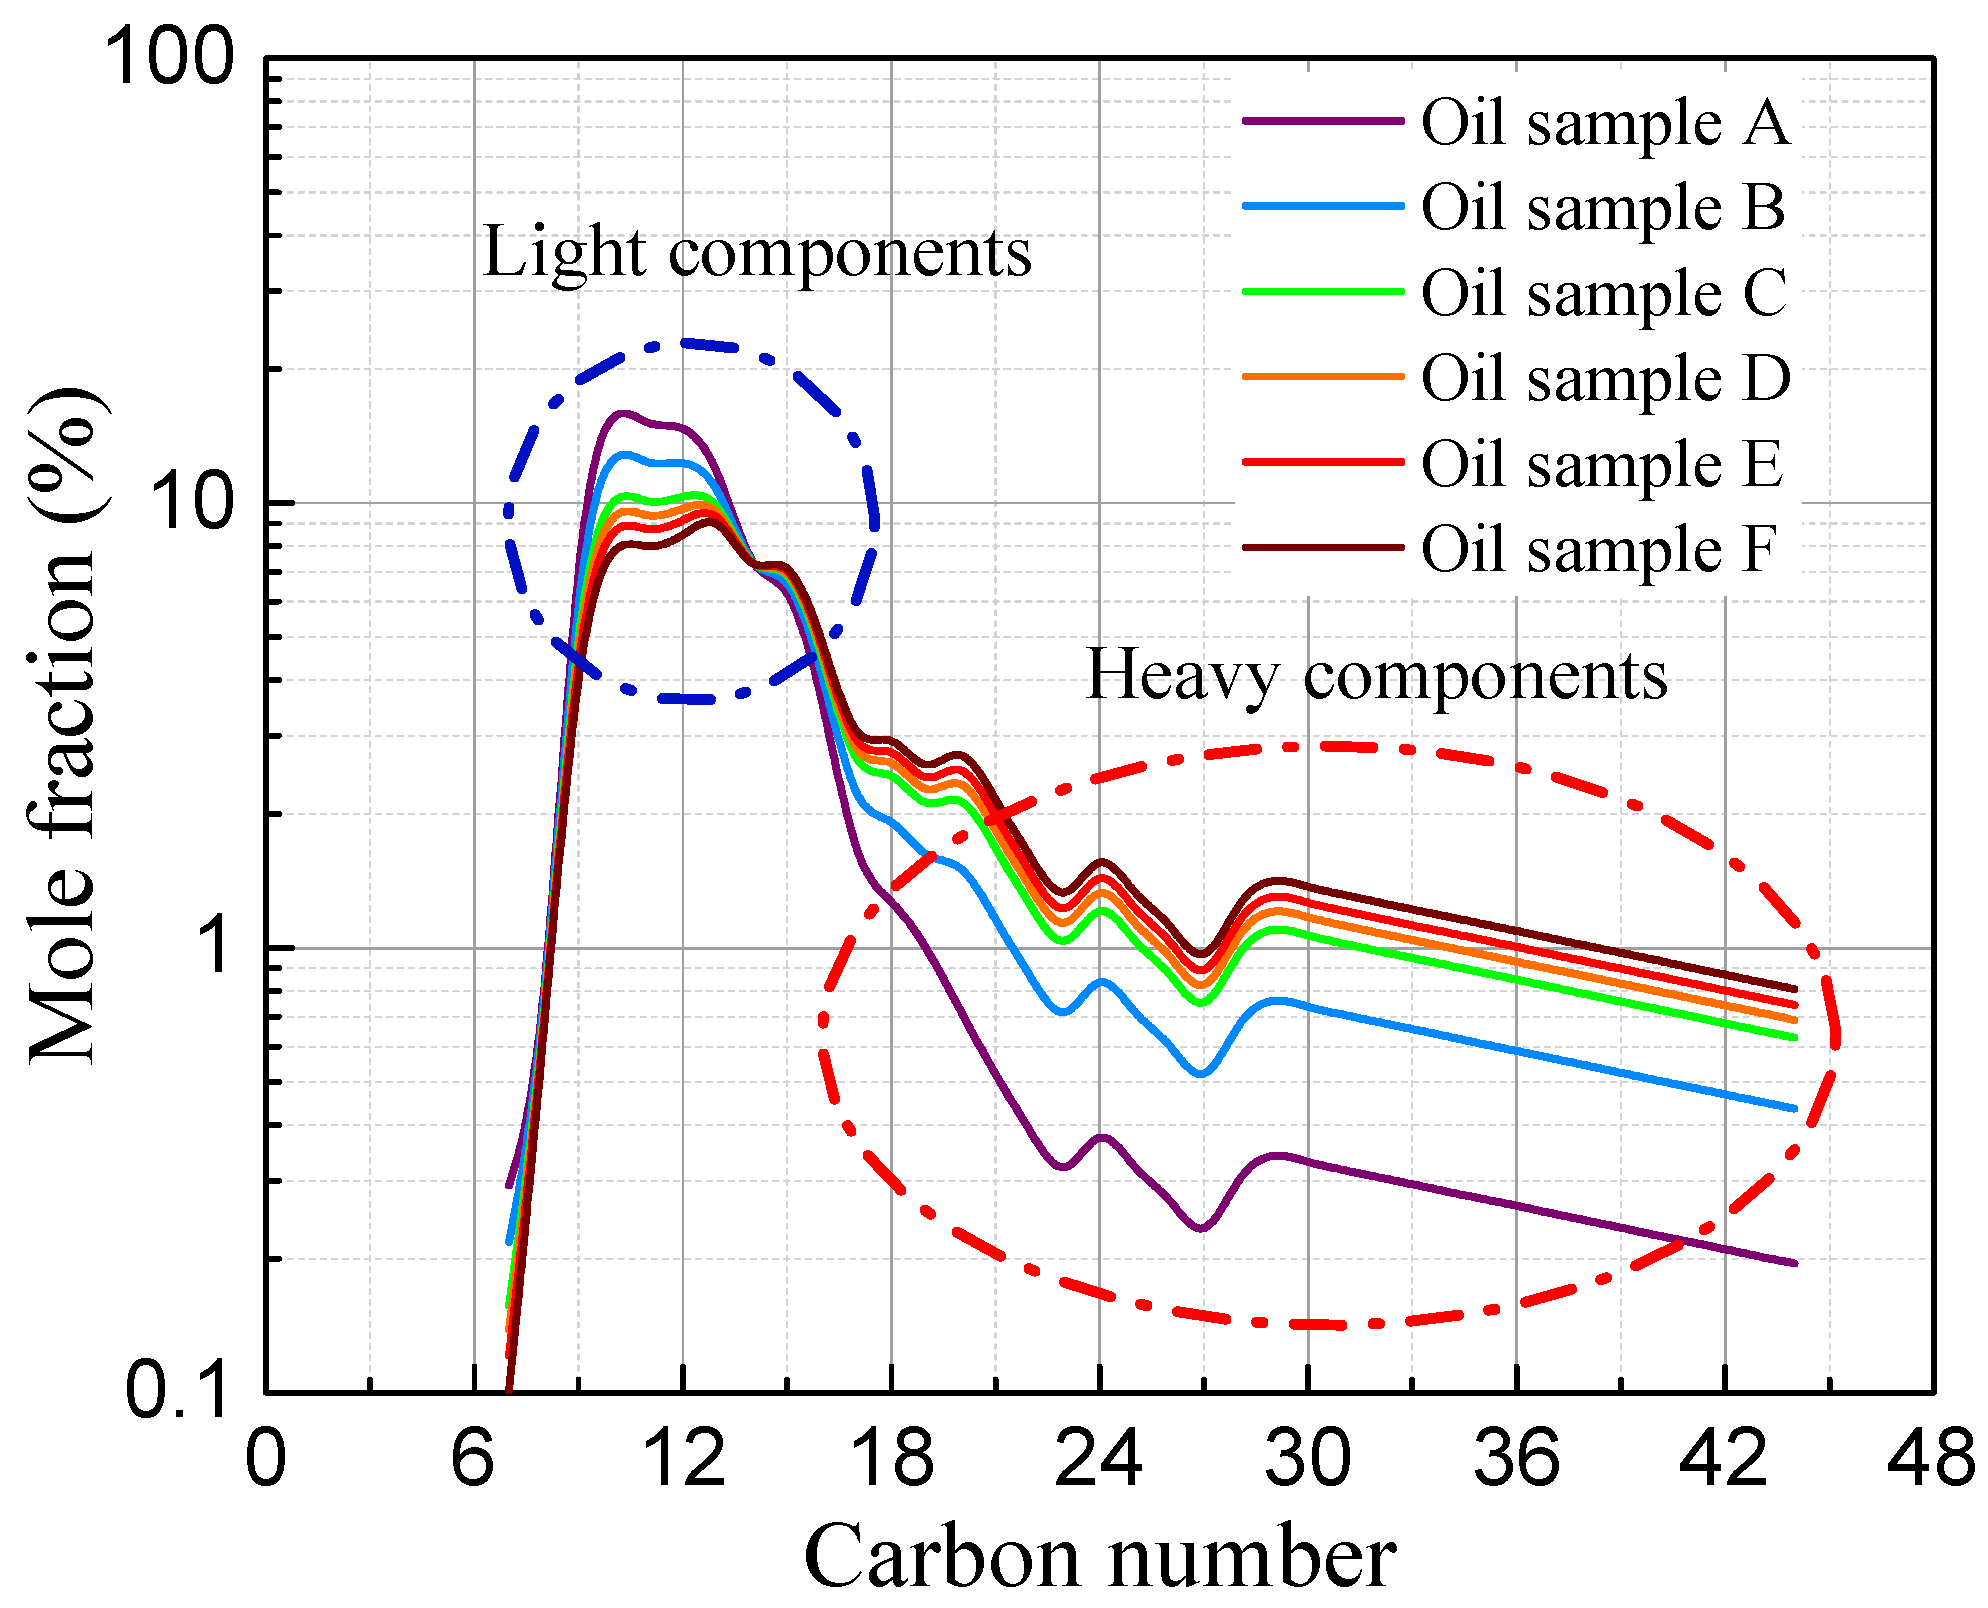
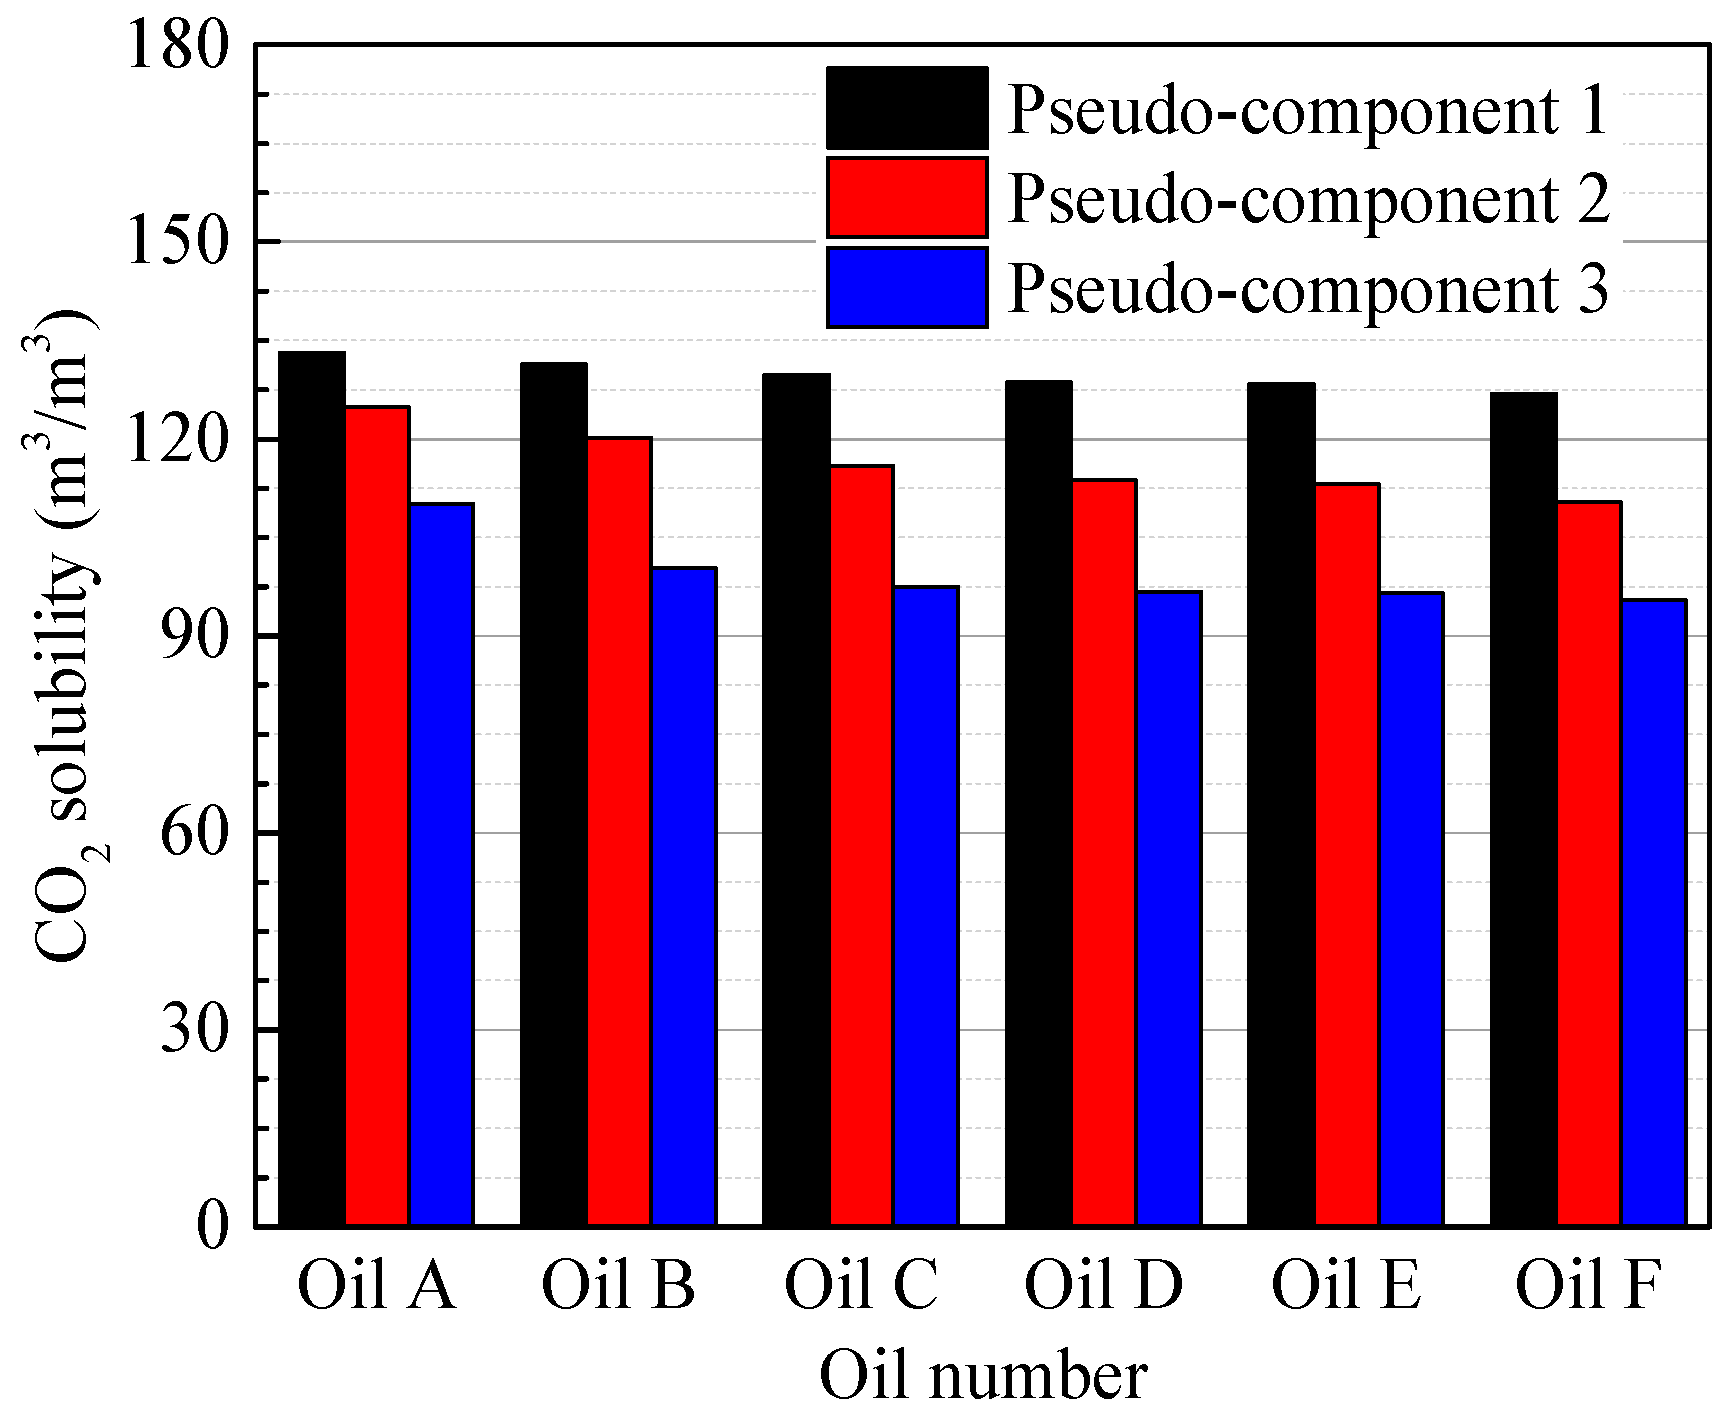
4.1. Characterization of the Oil Samples
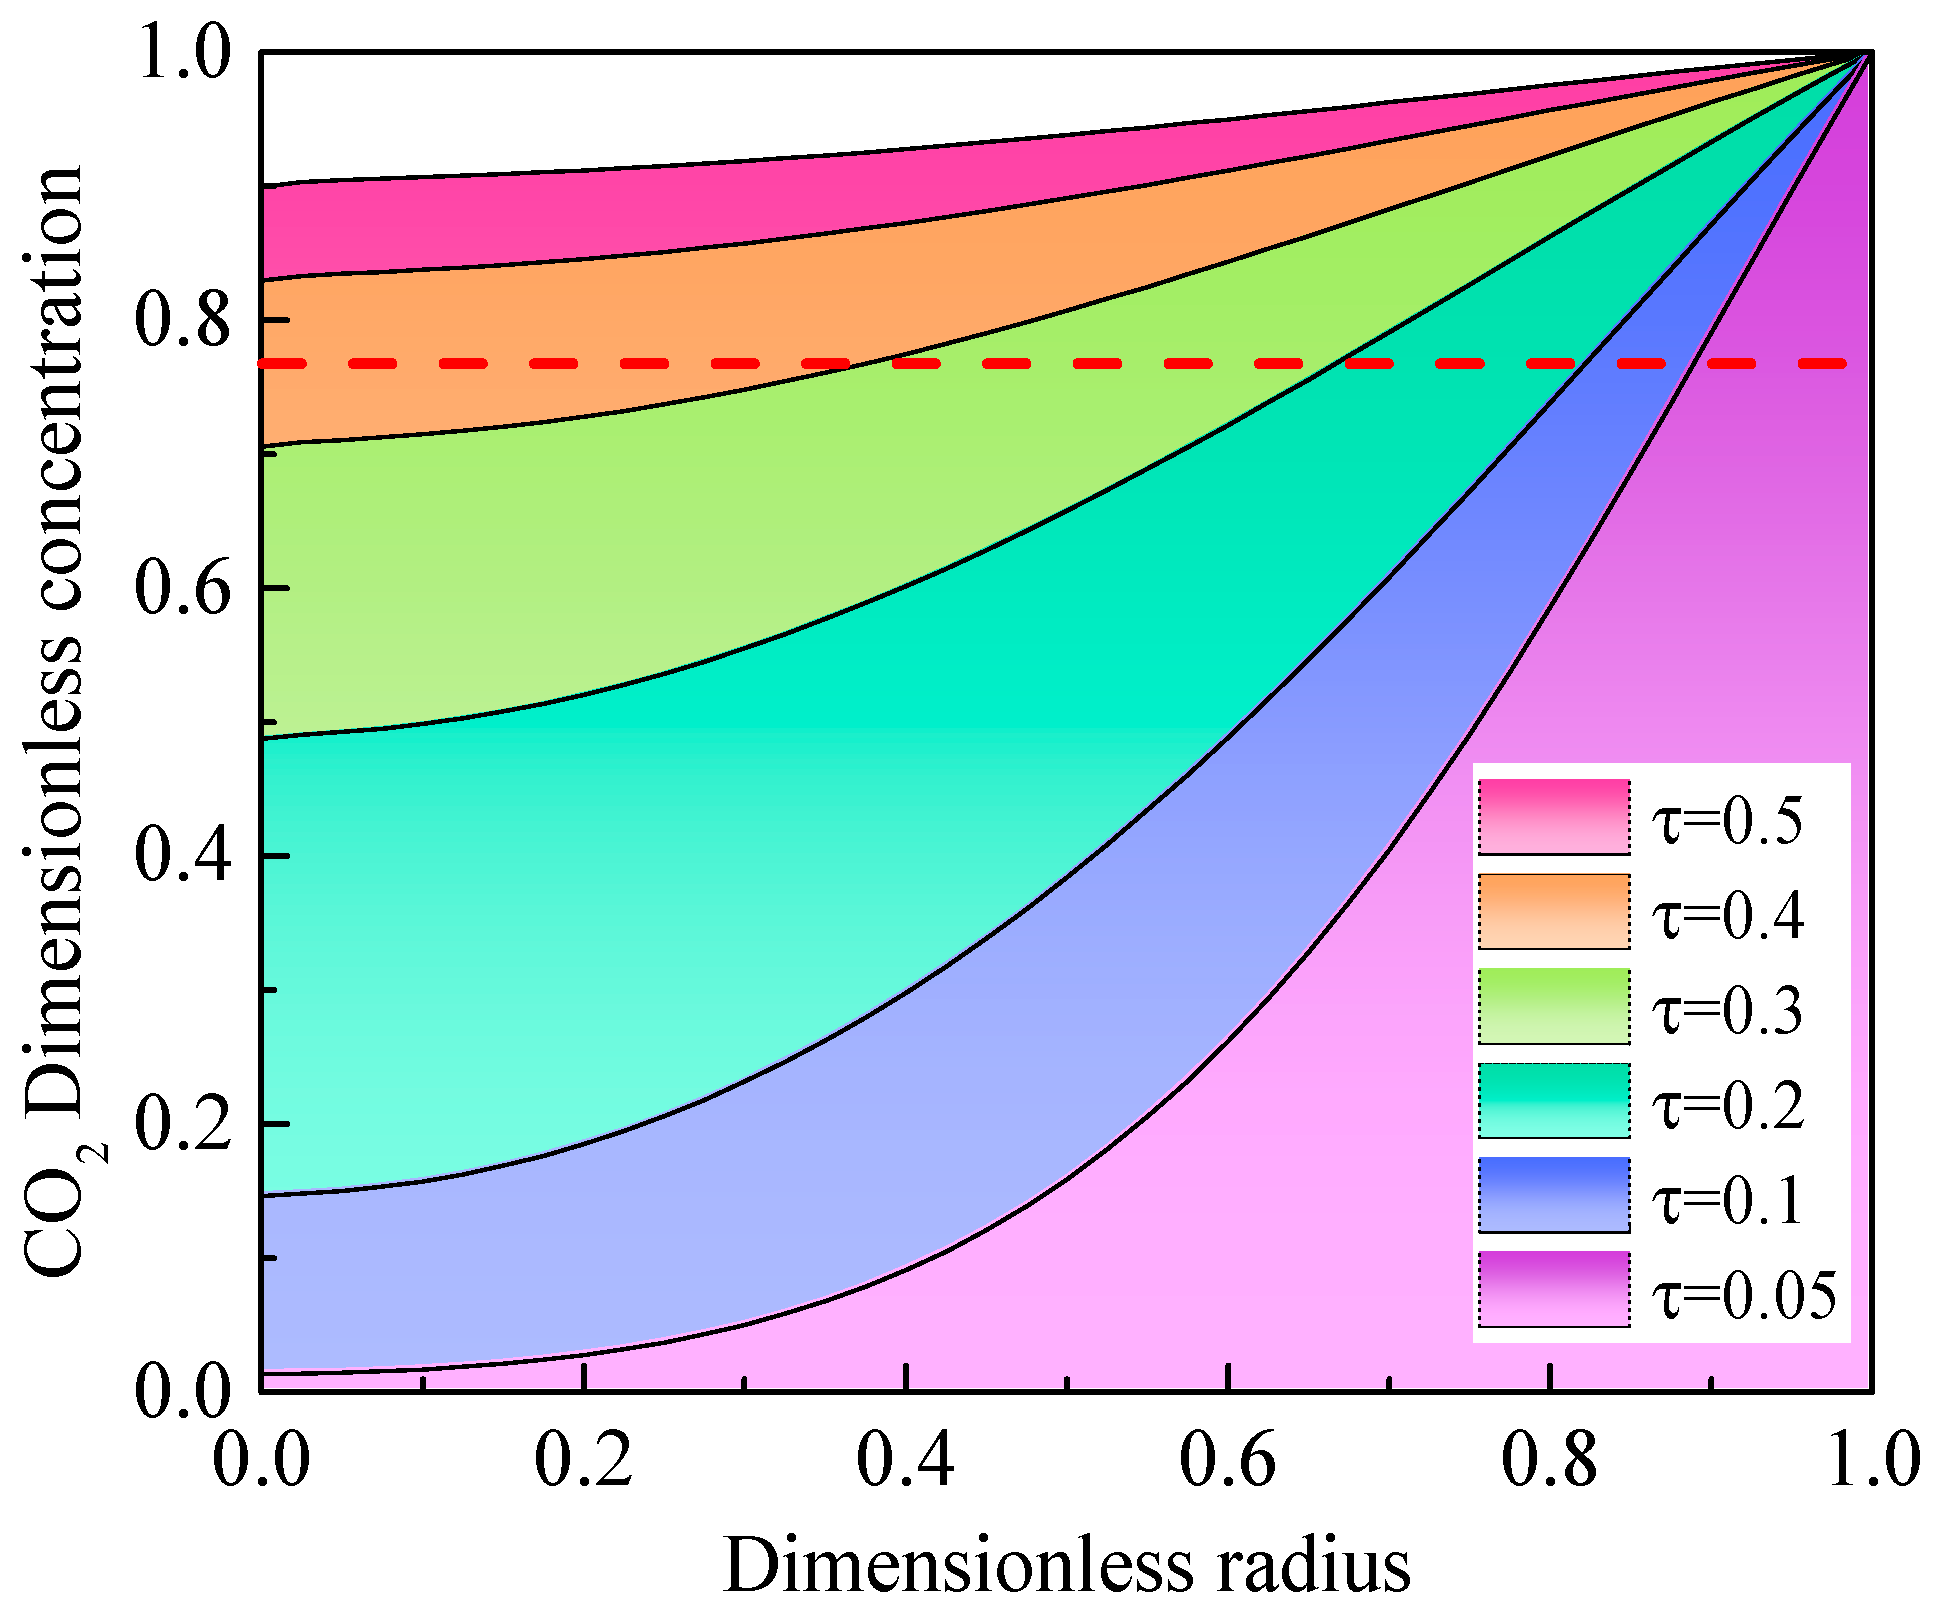
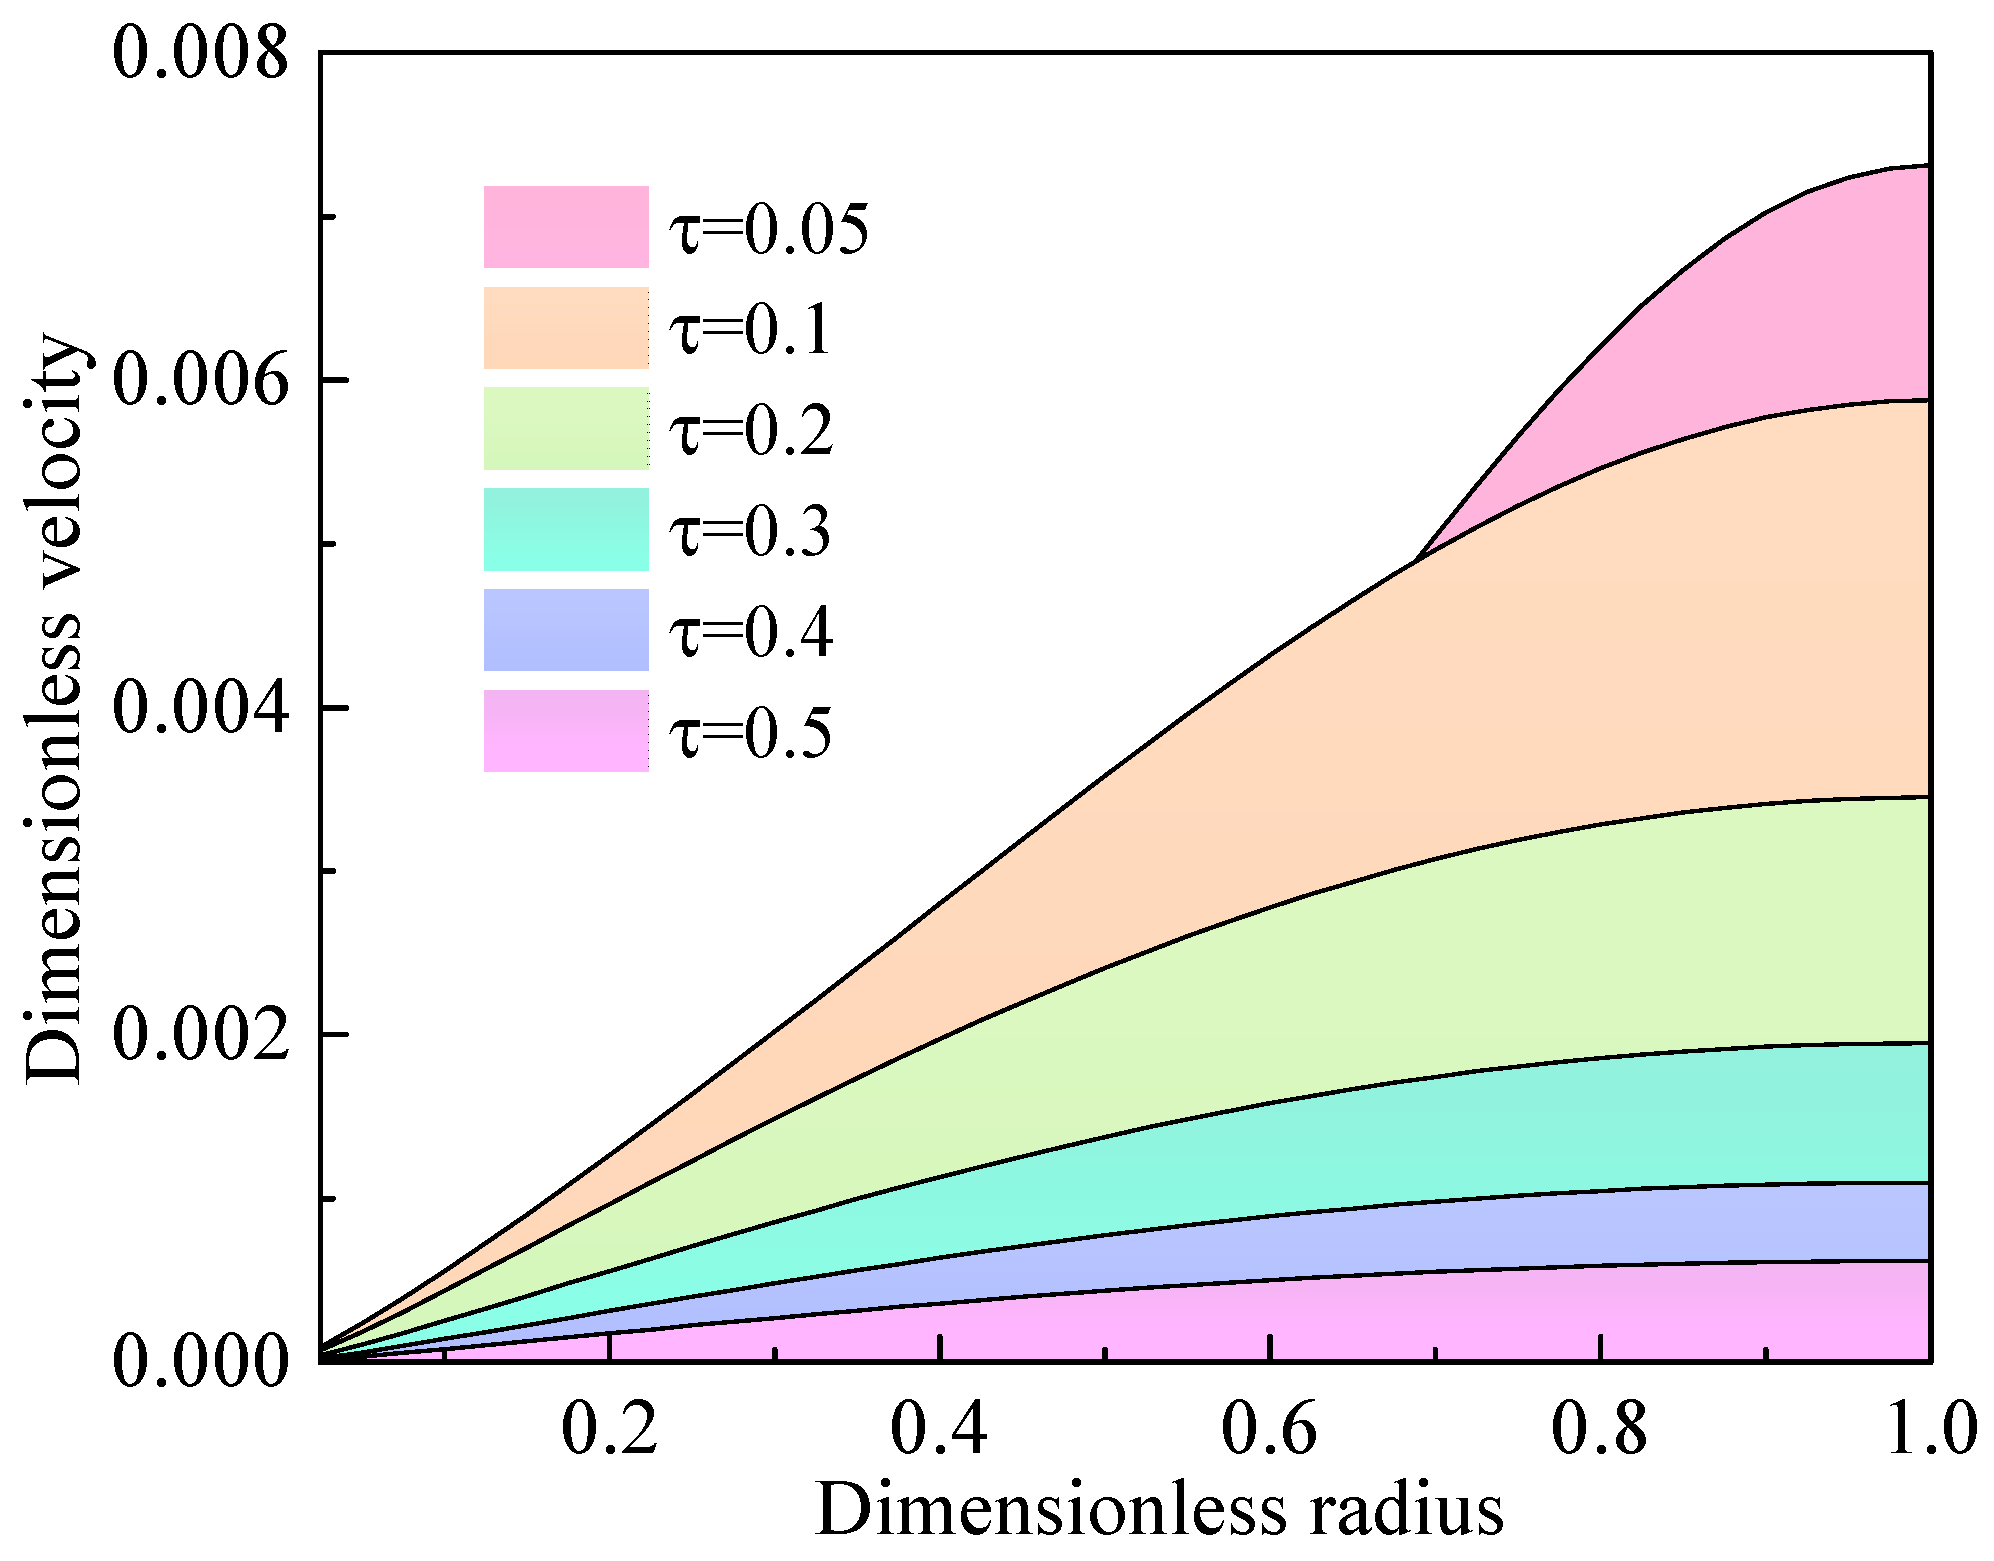
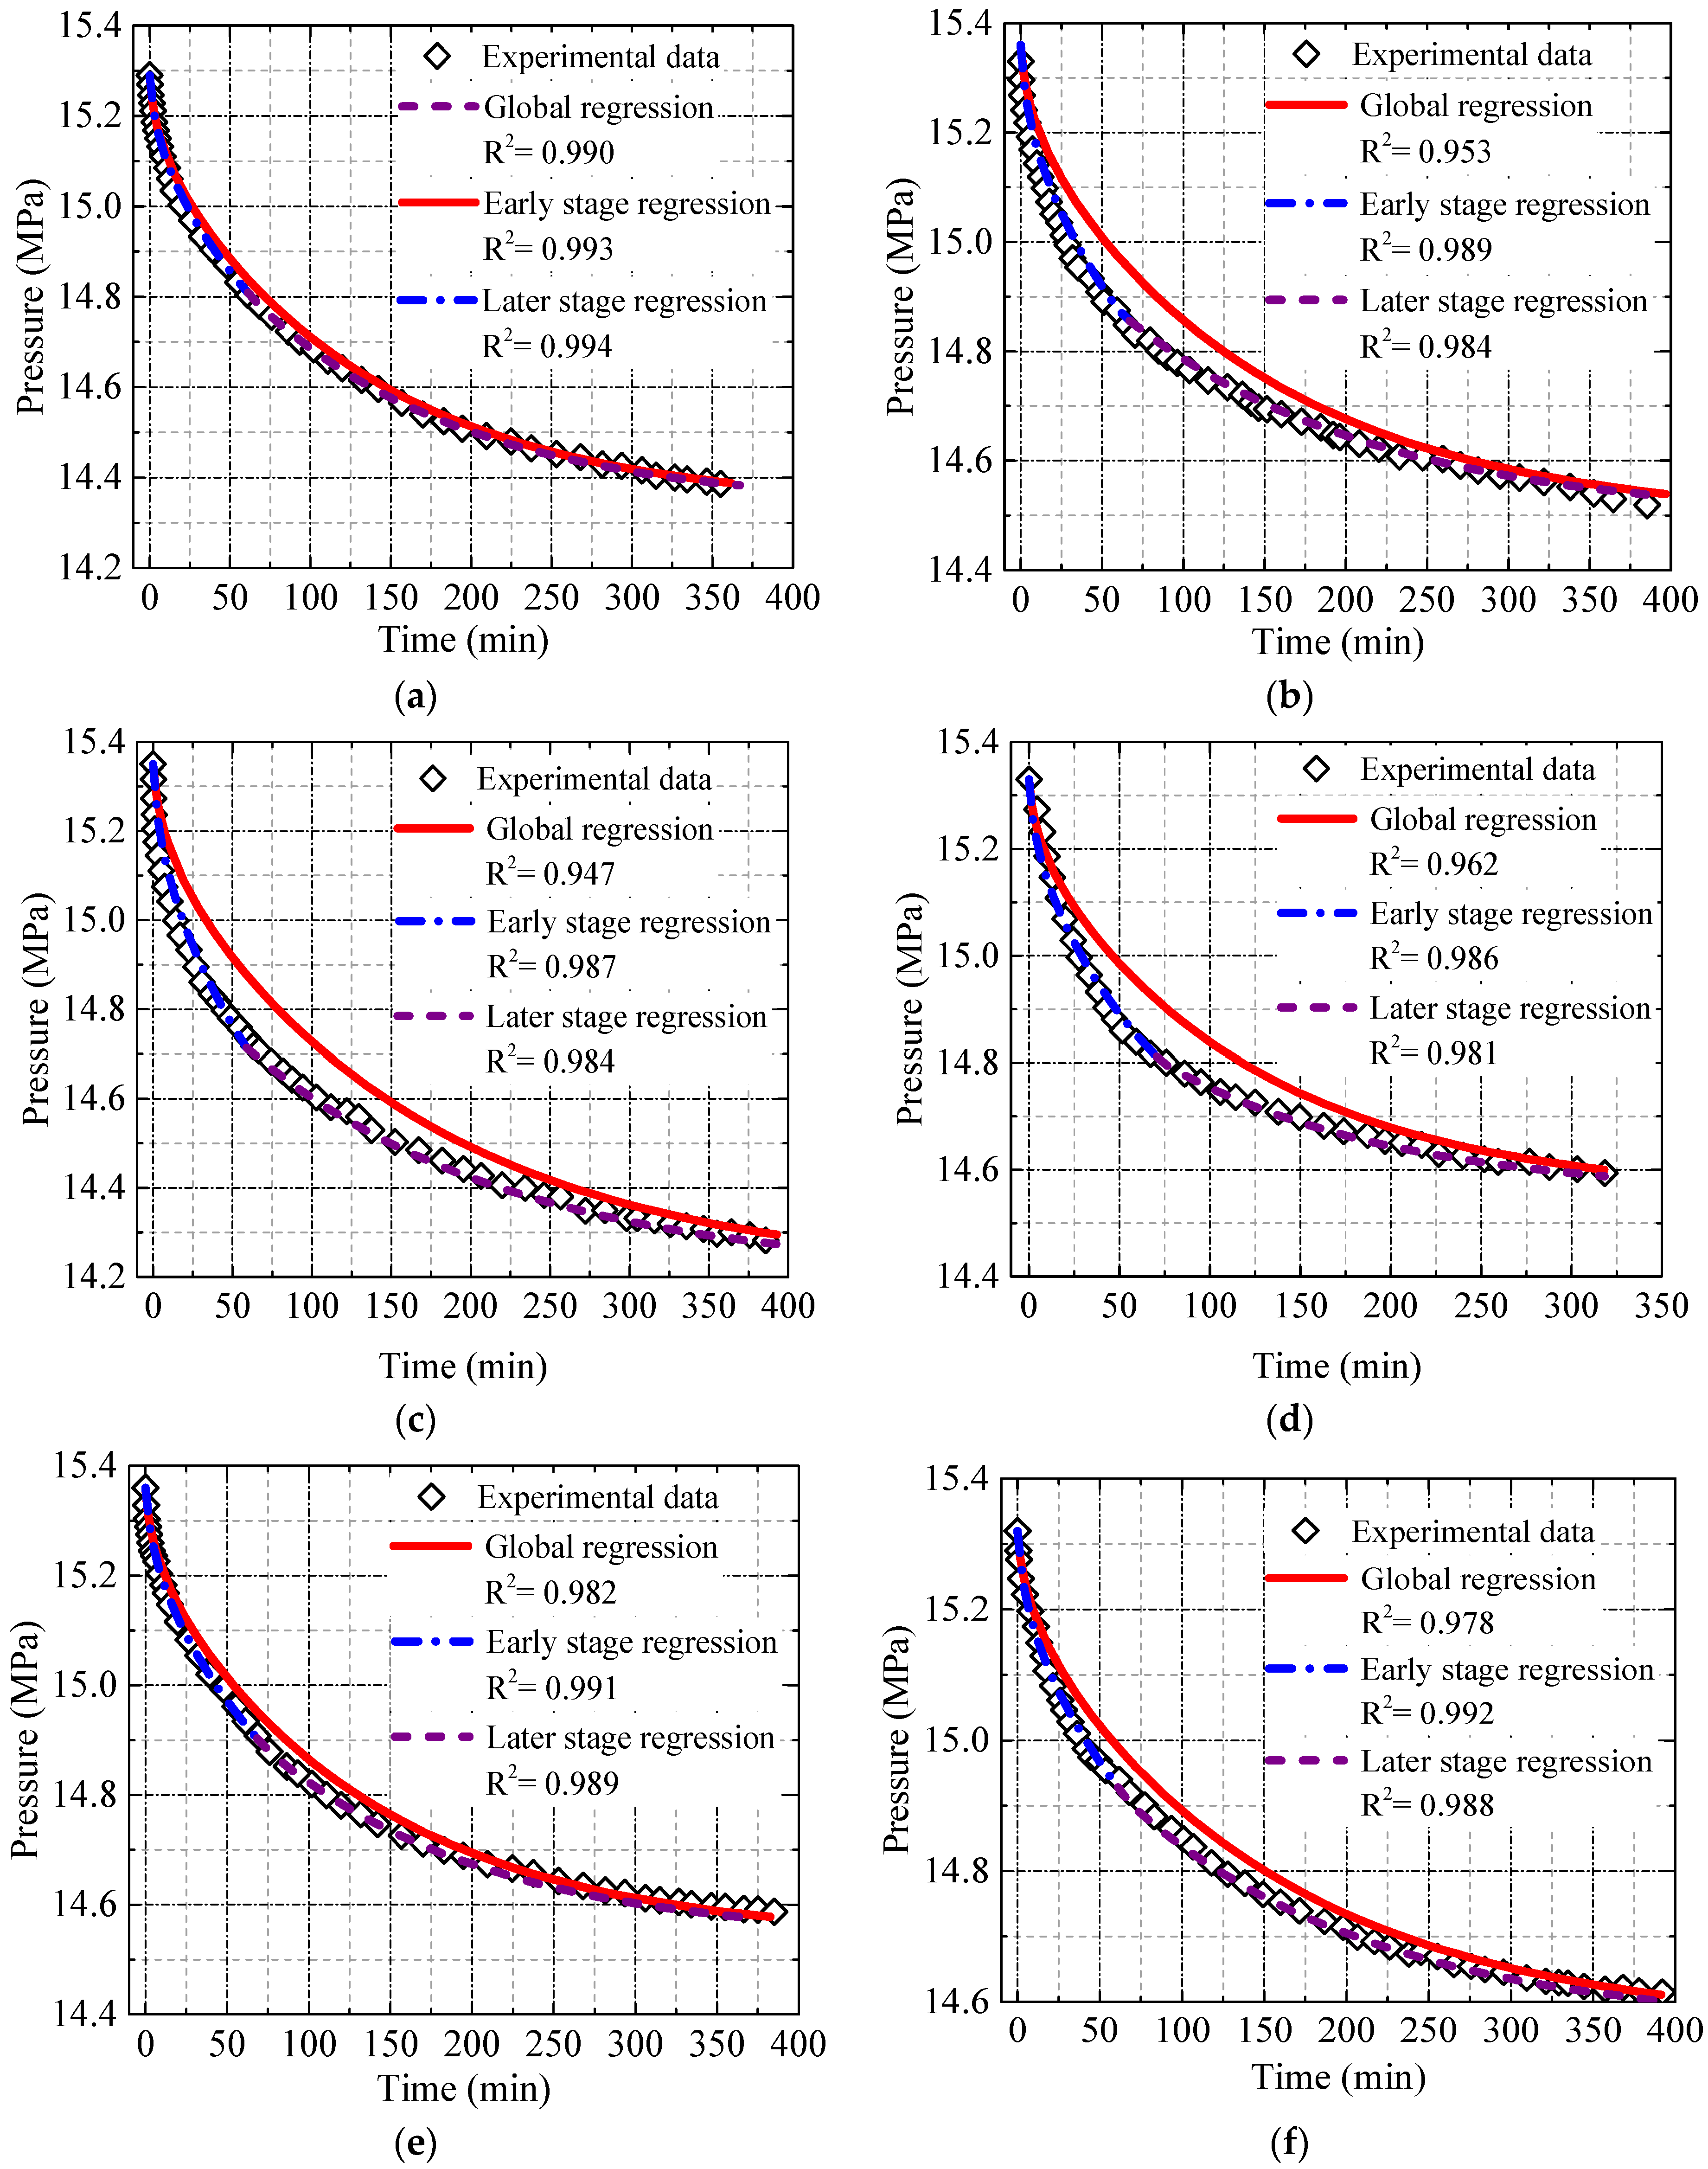
4.2. Solution of the Diffusion Model in the Oil-Saturated Cores
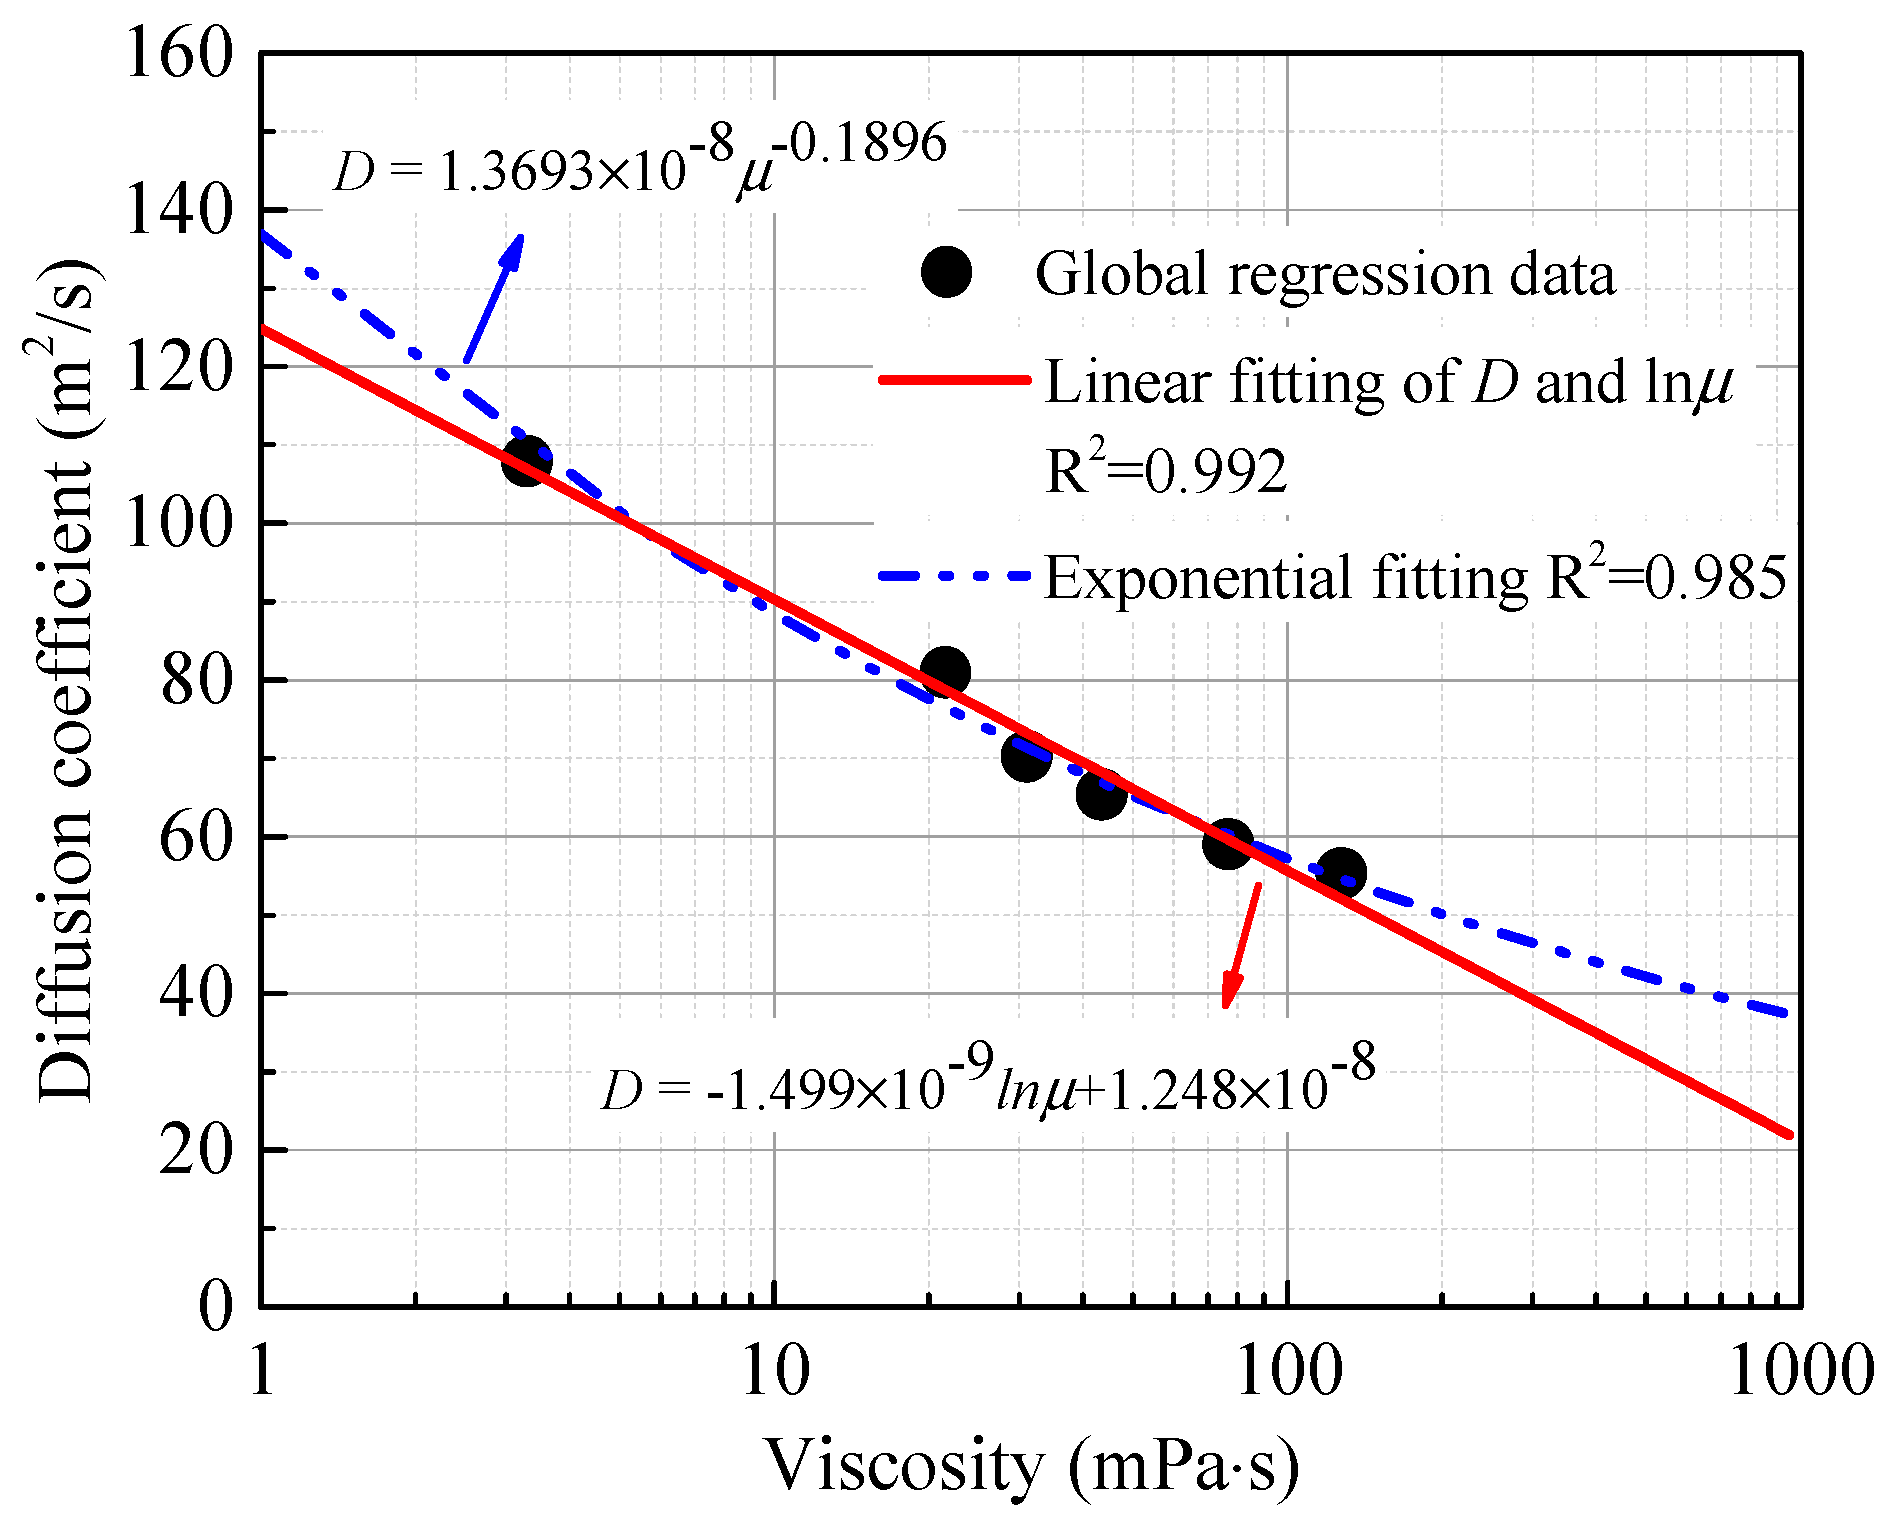
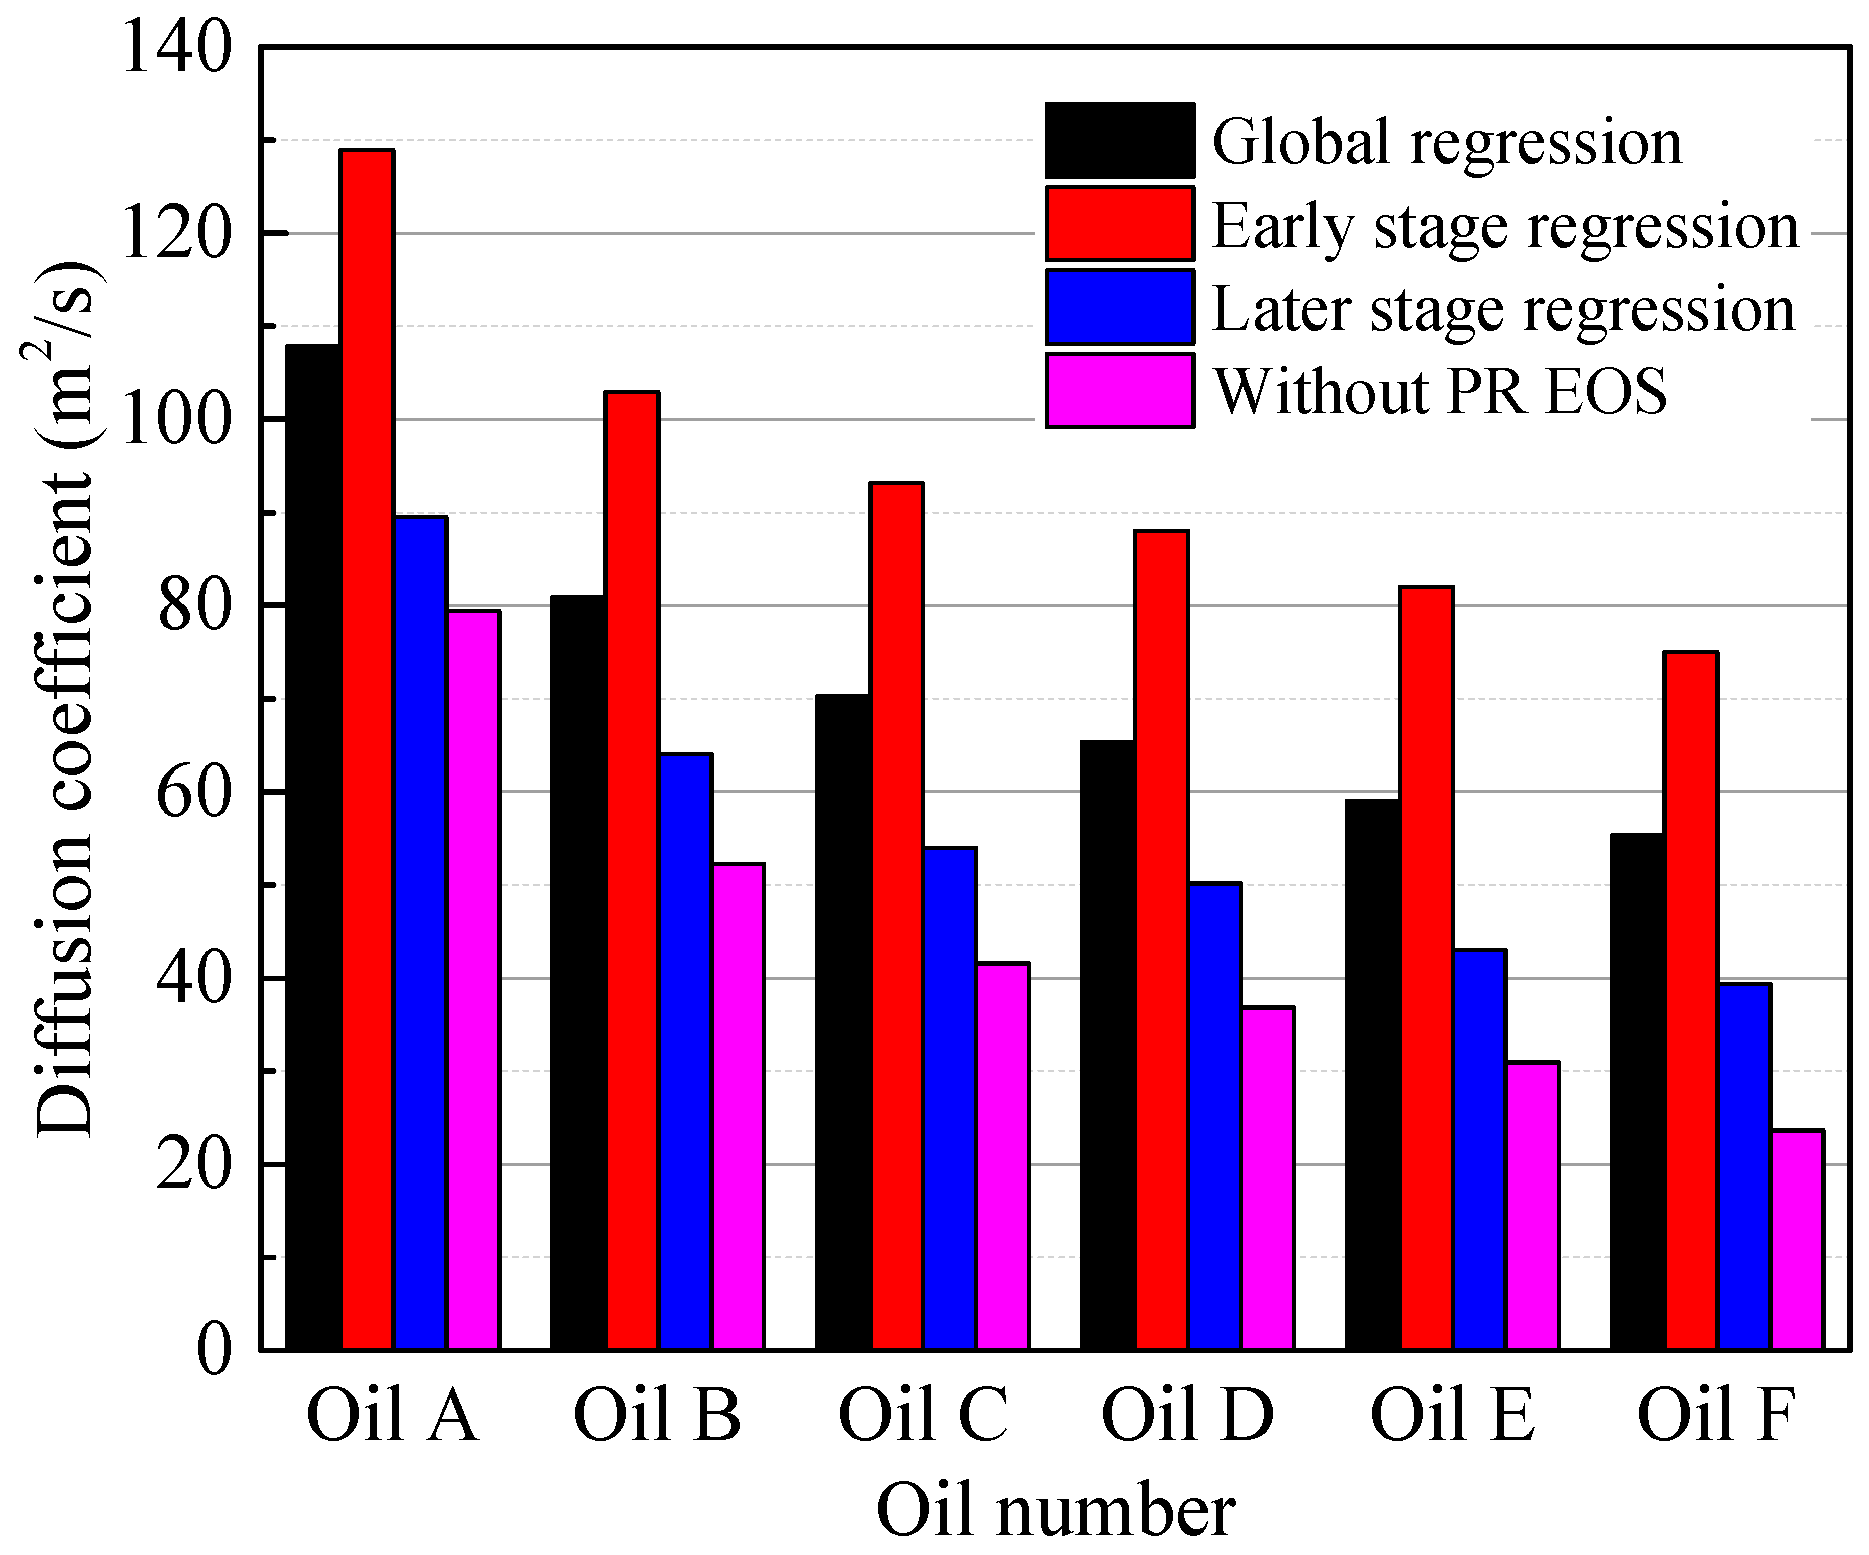
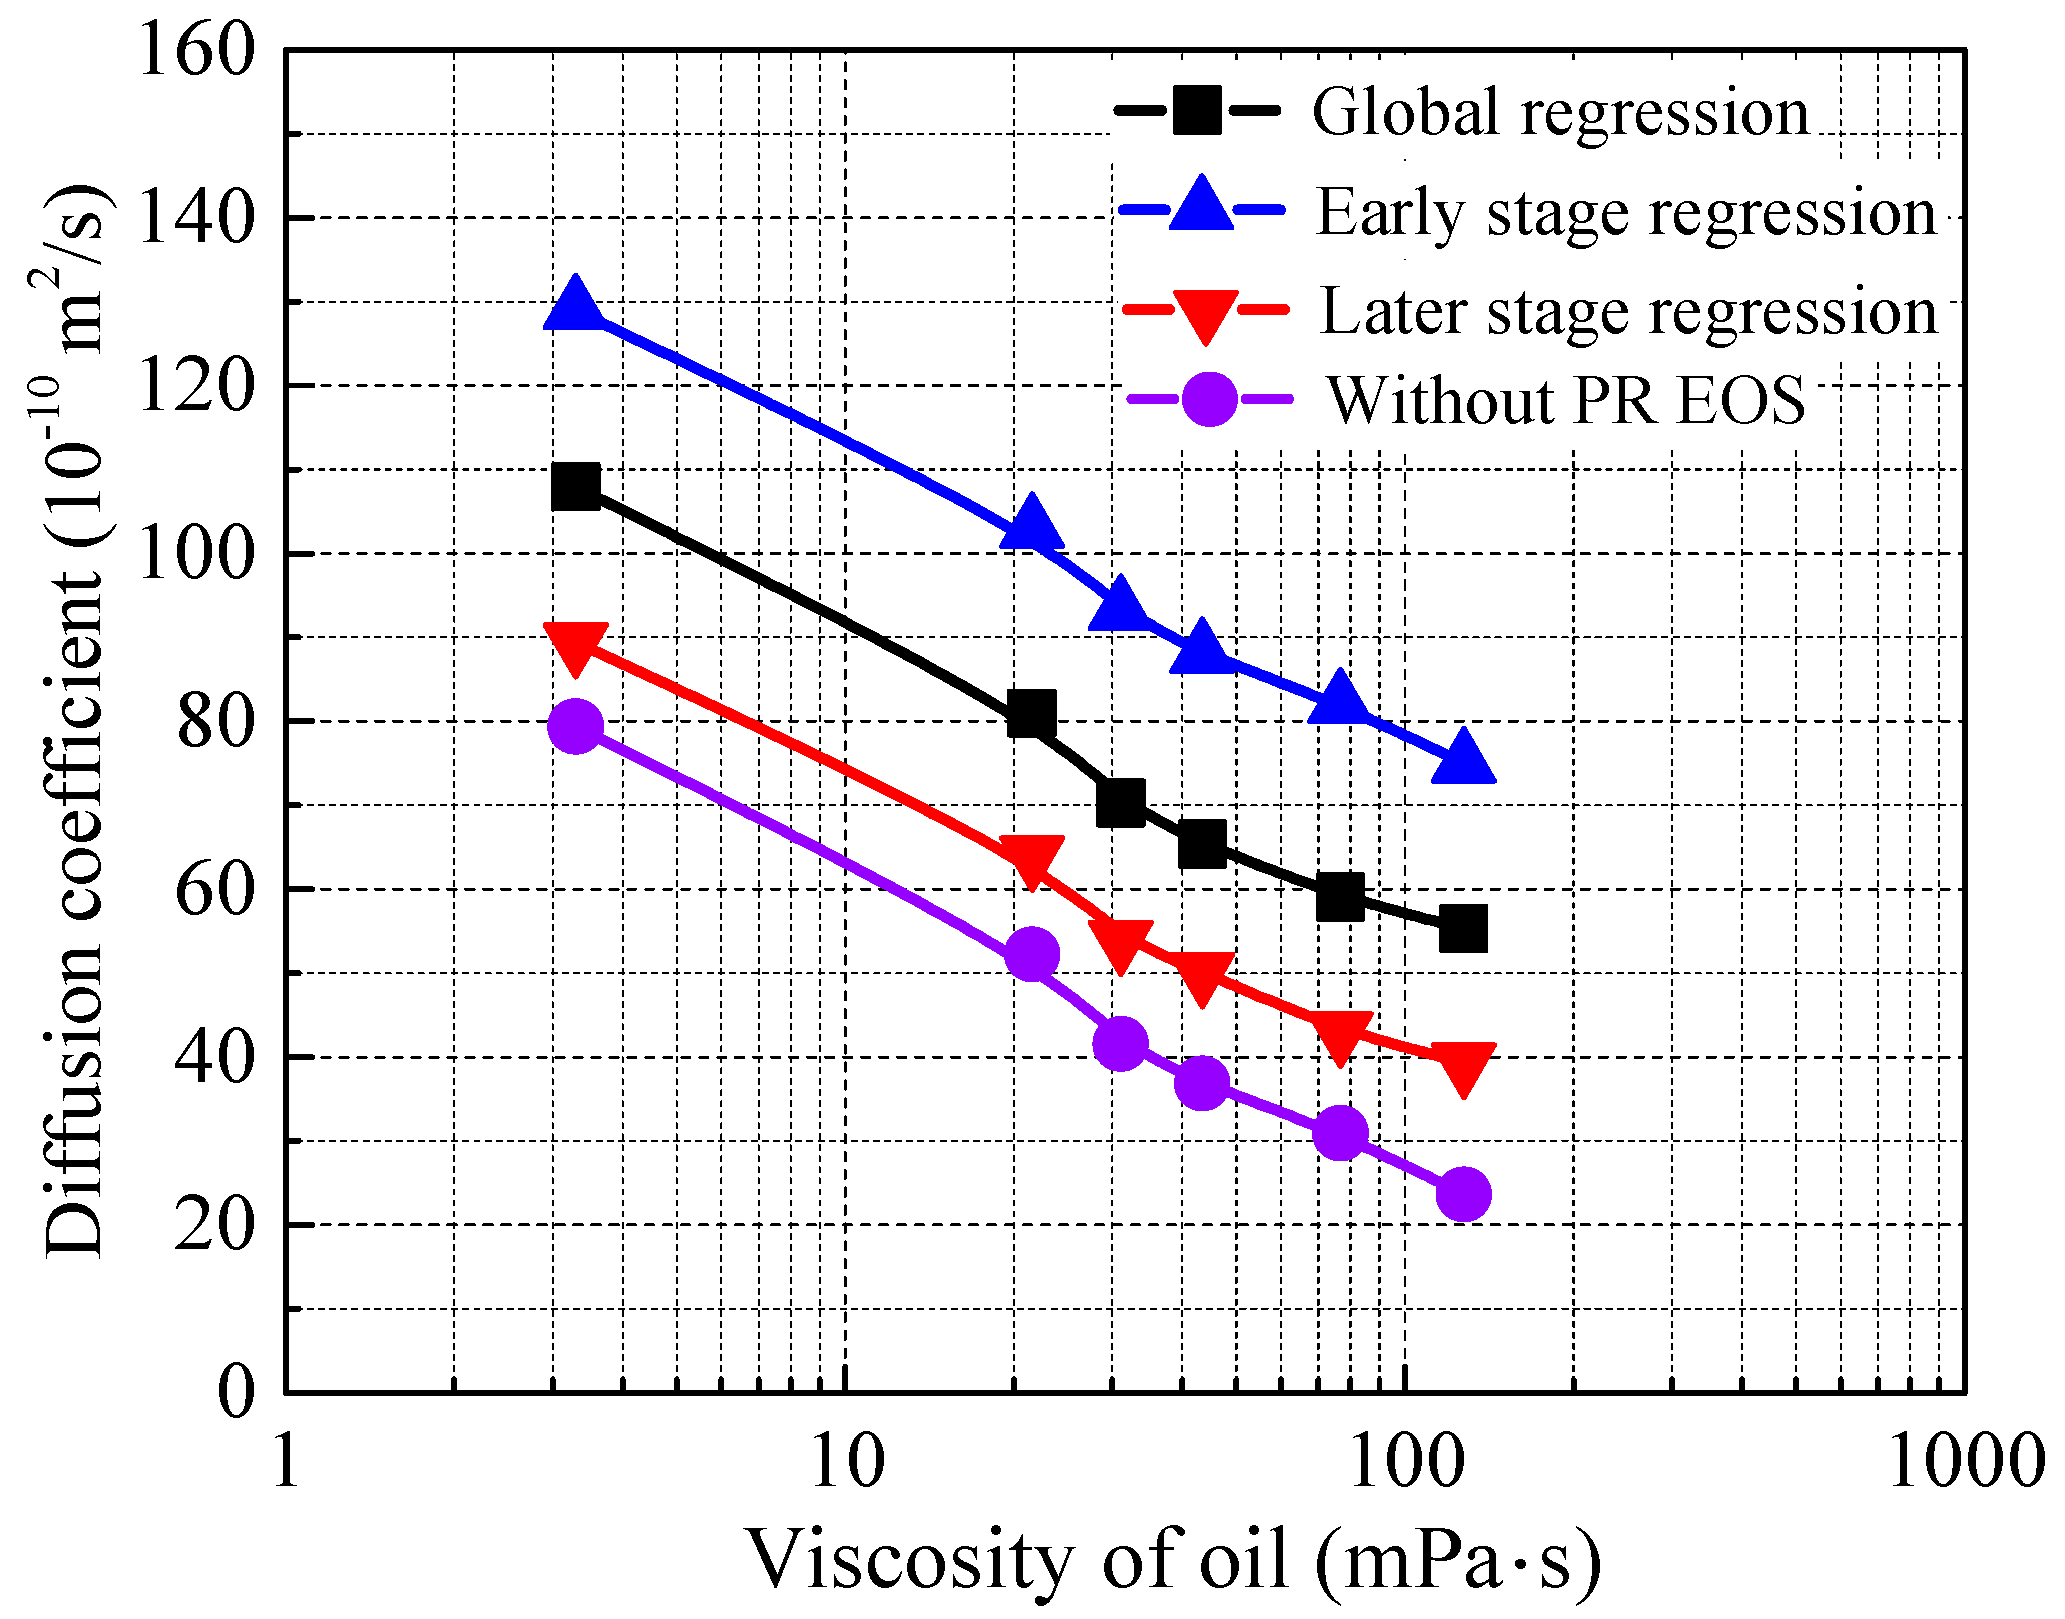
4.3. Effect of the Oil Properties on the Diffusion Coefficient
4.4. Comparison
5. Conclusions
Author Contributions
Acknowledgments
Conflicts of Interest
Appendix A. Parameters in PR EOS of Oil Samples B to F

| Oil No. | Pseudo-Component | Z (mol %) | MW (g/mol) | SG | Tb (K) | Tc (K) | Pc (kPa) | ω |
|---|---|---|---|---|---|---|---|---|
| B | B1 | 47.706 | 150.741 | 0.819 | 466.154 | 655.221 | 2497.765 | 0.472 |
| B2 | 35.239 | 209.78 | 0.857 | 544.786 | 729.824 | 1942.549 | 0.636 | |
| B3 | 17.353 | 439.464 | 0.930 | 726.081 | 886.938 | 1122.854 | 1.043 | |
| C | C1 | 49.459 | 158.515 | 0.824 | 477.370 | 666.098 | 2412.984 | 0.494 |
| C2 | 33.400 | 244.079 | 0.872 | 580.821 | 762.058 | 1739.855 | 0.719 | |
| C3 | 17.143 | 480.992 | 0.941 | 753.344 | 909.992 | 1023.217 | 1.101 | |
| D | D1 | 53.065 | 164.282 | 0.828 | 485.358 | 673.746 | 2354.775 | 0.511 |
| D2 | 30.215 | 263.996 | 0.880 | 600.216 | 779.188 | 1638.055 | 0.763 | |
| D3 | 16.721 | 494.173 | 0.944 | 760.992 | 916.415 | 998.275 | 1.119 | |
| E | E1 | 50.339 | 164.845 | 0.829 | 486.152 | 674.510 | 2348.895 | 0.512 |
| E2 | 32.411 | 268.563 | 0.882 | 604.173 | 782.621 | 1619.513 | 0.771 | |
| E3 | 17.253 | 498.801 | 0.945 | 763.573 | 918.579 | 990.160 | 1.124 | |
| F | F1 | 55.032 | 173.010 | 0.834 | 497.042 | 684.824 | 2272.200 | 0.535 |
| F2 | 28.996 | 298.023 | 0.892 | 630.406 | 805.497 | 1492.491 | 0.831 | |
| F3 | 16.736 | 519.753 | 0.949 | 774.237 | 927.510 | 958.930 | 1.148 |
| Oil No. | Component | B1 | B2 | B3 | CO2 |
|---|---|---|---|---|---|
| B | B1 | 0 | 0 | 0 | 3.652 × 10⁻⁵ |
| B2 | 0 | 0 | 0 | 3.998 × 10⁻⁴ | |
| B3 | 0 | 0 | 0 | 4.415 × 10⁻³ | |
| CO2 | 3.652 × 10⁻⁵ | 3.998 × 10⁻⁴ | 4.415 × 10⁻⁶ | 0 |
| Oil No. | Component | C1 | C2 | C3 | CO2 |
|---|---|---|---|---|---|
| C | C1 | 0 | 0 | 0 | 4.181 × 10⁻⁶ |
| C2 | 0 | 0 | 0 | 9.641 × 10⁻⁴ | |
| C3 | 0 | 0 | 0 | 5.148 × 10⁻³ | |
| CO2 | 4.181 × 10⁻⁶ | 9.641 × 10⁻⁴ | 5.148 × 10⁻³ | 0 |
| Oil No. | Component | D1 | D2 | D3 | CO2 |
|---|---|---|---|---|---|
| D | D1 | 0 | 0 | 0 | 6.155 × 10⁻⁷ |
| D2 | 0 | 0 | 0 | 1.338 × 10⁻³ | |
| D3 | 0 | 0 | 0 | 5.353 × 10⁻³ | |
| CO2 | 6.155 × 10⁻⁷ | 1.338 × 10⁻³ | 5.353 × 10⁻³ | 0 |
| Oil No. | Component | E1 | E2 | E3 | CO2 |
|---|---|---|---|---|---|
| E | E1 | 0 | 0 | 0 | 1.117 × 10⁻⁶ |
| E2 | 0 | 0 | 0 | 1.421 × 10⁻³ | |
| E3 | 0 | 0 | 0 | 5.422 × 10⁻³ | |
| CO2 | 1.117 × 10⁻⁶ | 1.421 × 10⁻³ | 5.422 × 10⁻³ | 0 |
| Oil No. | Component | F1 | F2 | F3 | CO2 |
|---|---|---|---|---|---|
| F | F1 | 0 | 0 | 0 | 2.365 × 10⁻⁵ |
| F2 | 0 | 0 | 0 | 1.998 × 10⁻³ | |
| F3 | 0 | 0 | 0 | 5.704 × 10⁻³ | |
| CO2 | 2.365 × 10⁻⁵ | 1.998 × 10⁻³ | 5.704 × 10⁻³ | 0 |
References
- Yang, Q.; Zhong, C.; Chen, J. Computational study of CO2 storage in metal–organic frameworks. J. Phys. Chem. C 2011, 112, 1562–1569. [Google Scholar] [CrossRef]
- Lydonrochelle, M.T. Amine ccrubbing for CO2 capture. Science 2009, 325, 1652–1654. [Google Scholar]
- Rutqvist, J. The geomechanics of CO2 storage in deep sedimentary formations. Geotech. Geol. Eng. 2012, 30, 525–551. [Google Scholar] [CrossRef]
- Holm, L.W.; Josendal, V.A. Mechanisms of oil displacement by carbon dioxide. J. Pet. Technol. 1974, 26, 1427–1438. [Google Scholar] [CrossRef]
- Monger, T.G.; Ramos, J.C.; Thomas, J. Light oil recovery from cyclic CO2 injection: Influence of low pressure impure CO2 and reservoir gas. SPE Reserv. Eng. 1991, 6, 25–32. [Google Scholar] [CrossRef]
- Moberg, R. The Wyburn CO2 monitoring and storage project. Greenh. Issues 2001, 57, 2–3. [Google Scholar]
- Baines, S.J.; Worden, R.H. Geological storage of carbon dioxide. Rudarsko-Geološko-Naftni Zbornik. 2004, 28, 9–22. [Google Scholar] [CrossRef]
- Wang, S.; Feng, Q.; Javadpour, F.; Xia, T.; Li, Z. Oil Adsorption in shale nanopores and its effect on recoverable oil-in-place. Int. J. Coal Geol. 2015, 147–148, 9–24. [Google Scholar] [CrossRef]
- Zhang, Z.; Chen, F.; Rezakazemi, M.; Zhang, W.; Lu, C.; Chang, H.; Quan, X. Modeling of a CO2-piperazine-membrane absorption system. Chem. Eng. Res. Des. 2018, 131, 375–384. [Google Scholar] [CrossRef]
- Zhang, Z.; Cai, J.; Chen, F.; Li, H.; Zhang, W.; Qi, W. Progress in enhancement of CO2 absorption by nanofluids: A mini review of mechanisms and current status. Renew. Energy 2018, 118, 527–535. [Google Scholar] [CrossRef]
- Yang, Y.; Qiu, L.; Cao, Y.; Chen, C.; Lei, D.; Wan, M. Reservoir quality and diagenesis of the Permian Lucaogou Formation tight ccarbonates in Jimsar Sag, Junggar Basin, West China. J. Earth Sci. 2017, 28, 1032–1046. [Google Scholar] [CrossRef]
- Cao, M.; Gu, Y. Temperature effects on the phase behaviour, mutual interactions and oil recovery of a light crude oil–CO2 system. Fluid Phase Equilib. 2013, 356, 78–89. [Google Scholar] [CrossRef]
- Du, F. An Experimental Study of Carbon Dioxide Dissolution into a Light Crude Oil. Regina. Master’s Thesis, University of Regina, Regina, SK, Canada, 2016. [Google Scholar]
- Luo, P.; Yang, C.; Gu, Y. Enhanced solvent dissolution into in-situ upgraded heavy oil under different pressures. Fluid Phase Equilib. 2007, 252, 143–151. [Google Scholar] [CrossRef]
- Yang, D.; Gu, Y. Visualization of interfacial interactions of crude Oil-CO2 systems under reservoir conditions. In Proceedings of the 14th Symposium on Improved Oil Recovery, Tulsa, OK, USA, 17–21 April 2004. [Google Scholar]
- Cui, G.; Zhang, L.; Tan, C.; Ren, S.; Zhuang, Y.; Enechukwu, C. Injection of supercritical CO2 for geothermal exploitation from sandstone and carbonate reservoirs: CO2–water–rock Interactions and their Effects. J. CO2 Util. 2017, 20, 113–128. [Google Scholar] [CrossRef]
- Zhang, L.; Li, X.; Zhang, Y.; Cui, G.; Tan, C.; Ren, S. CO2 Injection for geothermal development associated with EGR and geological storage in depleted high-temperature gas reservoirs. Energy 2017, 123, 139–148. [Google Scholar] [CrossRef]
- Ghasemi, M.; Astutik, W.; Alavian, S.A.; Whitson, C.H.; Sigalas, L.; Olsen, D. Determining diffusion coefficients for carbon dioxide injection in oil-saturated chalk by use of a constant-volume-diffusion method. SPE J. 2017, 22, 505–520. [Google Scholar] [CrossRef]
- Zhang, K.; Gu, Y. New Qualitative and quantitative technical criteria for determining the minimum miscibility pressures (MMPs) with the rising-bubble apparatus (RBA). Fuel 2016, 175, 172–181. [Google Scholar] [CrossRef]
- Izgec, O.; Demiral, B.; Bertin, H. CO2 Injection into saline carbonate aquifer formations I: Laboratory investigation. Transp. Porous Media 2008, 72, 1–24. [Google Scholar] [CrossRef]
- Sayegh, S.G.; Rao, D.N.; Kokal, S.; Najman, J. Phase behavior and physical properties of lindbergh heavy oil/CO2 mixtures. J. Can. Pet. Technol. 1990, 29, 31–39. [Google Scholar] [CrossRef]
- Comerlati, A.; Ferronato, M.; Gambolati, G.; Putti, M.; Teatini, P. Fluid-dynamic and gmechanical effects of CO2 sequestration below the venice lagoon. Environ. Eng. Geosci. 2006, 12, 211–226. [Google Scholar] [CrossRef]
- Zhang, X.; Trinh, T.T.; Santen, R.A.V. Mechanism of the initial stage of silicate oligomerization. J. Am. Chem. Soc. 2011, 133, 6613–6625. [Google Scholar] [CrossRef] [PubMed]
- Li, Z.; Dong, M. Experimental study of carbon dioxide diffusion in oil-saturated porous media under reservoir conditions. Ind. Eng. Chem. Res. 2009, 48, 9307–9317. [Google Scholar] [CrossRef]
- Jia, Y.; Bian H, B.; Duveau, G.; Shao, J. Numerical analysis of the thermo-hydromechanical behaviour of underground storages in hard rock. In Proceedings of the Geoshanghai International Conference, Shanghai, China, 3–5 June 2010; pp. 198–205. [Google Scholar]
- Li, Z.; Dong, M.; Li, S.; Dai, L. A New method for gas effective diffusion coefficient measurement in water-saturated porous rocks under high pressures. J. Porous Media 2006, 9, 445–461. [Google Scholar] [CrossRef]
- Hou, S.; Liu, F.; Wang, S.; Bian, H. Coupled heat and moisture transfer in hollow Concrete block wall filled with compressed straw bricks. Energy Build. 2017, 135, 74–84. [Google Scholar] [CrossRef]
- Wang, S.; Feng, Q.; Zha, M.; Javadpour, F.; Hu, Q. Supercritical methane diffusion in shale nanopores: Effects of pressure, mineral types, and moisture content. Energy Fuels 2017, 32, 169–180. [Google Scholar] [CrossRef]
- Zhao, P.; Wang, Z.; Sun, Z.; Cai, J.; Wang, L. Investigation on the pore structure and multifractal characteristics of tight oil reservoirs using NMR measurements: Permian Lucaogou Formation in Jimusaer Sag, Junggar Basin. Mar. Petrol. Geol. 2017, 86, 1067–1081. [Google Scholar] [CrossRef]
- Wang, F.; Yang, K.; Cai, J. Fractal characterization of tight oil reservoir pore structure using nuclear magnetic resonance and mercury intrusion porosimetry. Fractals 2018, 2, 1840017. [Google Scholar] [CrossRef]
- Hill, E.S.; Lacey, W.N. Hate of solution of propane in quiescent liquid hydrocarbons. Ind. Eng. Chem. 1934, 25, 1014–1019. [Google Scholar]
- Sigmund, P.M. Prediction of molecular diffusion at reservoir conditions. Part I—Measurement and prediction of binary dense gas diffusion coefficients. J. Can. Pet. Technol. 1976, 15, 48–57. [Google Scholar] [CrossRef]
- Islas-Juarez, R.; Samanego, V.F.; Luna, E.; Perez-Rosales, C.; Cruz, J. Experimental study of effective diffusion in porous media. In Proceedings of the SPE International Petroleum Conference in Mexico, Puebla, Mexico, 7–9 November 2004; pp. 781–787. [Google Scholar]
- Riazi, M.R. A new method for experimental measurement of diffusion coefficients in reservoir fluids. J. Pet. Sci. Eng. 1996, 14, 235–250. [Google Scholar] [CrossRef]
- Upreti, S.R.; Mehrotra, A.K. Experimental measurement of gas diffusivity in bitumen: Results of carbon dioxide. Ind. Eng. Chem. Res. 2000, 39, 1080–1087. [Google Scholar] [CrossRef]
- Zhang, Y.; Hyndman, C.L.; Maini, B.B. Measurement of gas diffusivity in heavy oils. J. Pet. Sci. Eng. 1999, 25, 37–47. [Google Scholar] [CrossRef]
- Tharanivasan, A.K.; Yang, C.; Gu, Y. Measurements of molecular diffusion coefficients of carbon dioxide, methane, and propane in heavy oil under reservoir conditions. Energy Fuels 2006, 20, 2509–2517. [Google Scholar] [CrossRef]
- El-Haj, R.; Lohi, A.; Upreti, S.R. Experimental determination of butane dispersion in vapour extraction of heavy oil and bitumen. J. Pet. Sci. Eng. 2009, 67, 41–47. [Google Scholar] [CrossRef]
- Okazawa, T. Impact of concentration—Dependence of diffusion coefficient on VAPEX drainage rates. J. Can. Pet. Technol. 2009, 48, 47–53. [Google Scholar] [CrossRef]
- Wen, Y.; Bryan, J.; Kantzas, A. Estimation of diffusion coefficients in bitumen solvent mixtures as derived from low field NMR spectra. J. Can. Pet. Technol. 2005, 44, 29–35. [Google Scholar] [CrossRef]
- Afsahi, B. Advanced in Diffusivity and Viscosity Measurements of Hydrocarbon Solvents in Heavy Oil and Bitumen. Master’s Thesis, University of Calgary, Calgary, AB, Canada, 2006. [Google Scholar]
- Guerrero-Aconcha, U.; Salama, D.; Kantzas, A. Diffusion of n-alkanes in heavy oil. In Proceedings of the SPE Annual Technical Conference and Exhibition, Denver, CO, USA, 21–24 September 2008. [Google Scholar]
- Wen, Y.; Kantzas, A.; Wang, G. Estimation of diffusion coefficients in bitumen solvent mixtures using X-ray CAT scanning and low field NMR. In Proceedings of the Canadian International Petroleum Conference, Calgary, AB, Canada, 8–10 June 2004. [Google Scholar]
- Wang, L.; Nakanishi, Y.; Teston, A.D.; Suekane, T. Effect of diffusing layer thickness on the density-driven natural convection of miscible fluids in porous media: Modeling of mass transport. J. Fluid Sci. Technol. 2018, 13, 1–20. [Google Scholar] [CrossRef]
- Yang, C.; Gu, Y. A new method for measuring solvent diffusivity in heavy oil by dynamic pendant drop shape analysis (DPDSA). SPE J. 2006, 11, 48–57. [Google Scholar] [CrossRef]
- Oren, P.E.; Bakke, S.; Arntzen, O.J. Extending predictive capabilities to network models. SPE J. 1998, 3, 324–336. [Google Scholar] [CrossRef]
- Blunt, M.J.; Piri, M.; Valvatne, P. Detailed physics, predictive capabilities and upscaling for pore-scale models of multiphase flow. Adv. Water Resour. 2002, 25, 1069–1089. [Google Scholar] [CrossRef]
- Piri, M.; Blunt, M.J. Pore-scale modeling of three-phase flow in mixed wet systems. In Proceedings of the SPE Annual Technical Conference and Exhibition, San Antonio, TX, USA, 29 September–2 October 2002. [Google Scholar]
- Garmeh, G.; Johns, R.T.; Lake, L.W. Pore-scale simulation of dispersion in porous media. In Proceedings of the SPE Annual Technical Conference and Exhibition, Anaheim, CA, USA, 11–14 November 2007. [Google Scholar]
- Taheri, S.; Kantzas, A.; Abedi, J. Mass diffusion into bitumen: A sub-pore scale modeling approach. In Proceedings of the Canadian Unconventional Resources & International Petroleum Conference, Calgary, AB, Canada, 19–21 October 2010. [Google Scholar]
- De Paoli, M.; Zonta, F.; Soldati, A. Dissolution in anisotropic porous media: Modelling convection regimes from onset to shutdown. Phys. Fluids 2017, 29, 026601. [Google Scholar] [CrossRef]
- Xu, X.; Chen, S.; Zhang, D. Convective stability analysis of the long-term storage of carbon dioxide in deep saline aquifers. Adv. Water Resour. 2006, 29, 397–407. [Google Scholar] [CrossRef]
- De Paoli, M.; Zonta, F.; Soldati, A. Influence of anisotropic permeability on convection in Porous media: Implications for geological CO2 sequestration. Phys. Fluids 2016, 28, 367–370. [Google Scholar] [CrossRef]
- Li, S.; Li, Z.; Dong, Q. Diffusion coefficients of supercritical CO2 in oil-saturated cores under low permeability reservoir conditions. J. CO2 Util. 2016, 14, 47–60. [Google Scholar] [CrossRef]
- Li, S.; Qiao, C.; Zhang, C.; Li, Z. Determination of diffusion coefficients of supercritical CO2 under tight oil reservoir conditions with pressure-decay method. J. CO2 Util. 2018, 24, 430–443. [Google Scholar] [CrossRef]
- Li, H.; Yang, D. Determination of individual diffusion coefficients of solvent/CO2 mixture in heavy oil with pressure-decay method. SPE J. 2015, 21, 131–143. [Google Scholar] [CrossRef]
- Peng, D.; Robinson, D.B. A new two-constant equation of state. Ind. Eng. Chem. Fundam. 1976, 15, 92–94. [Google Scholar] [CrossRef]
- Zuo, J.; Zhang, D. Plus fraction characterization and PVT data regression for reservoir fluids near critical conditions. In Proceedings of the SPE Asia Pacific Oil and Gas Conference and Exhibition, Brisbane, QLD, Australia, 16–18 October 2000. [Google Scholar]
- Zheng, S.; Li, H.; Sun, H.; Yang, D. Determination of diffusion coefficient for alkane solvent–CO2 mixtures in heavy oil with consideration of swelling effect. Ind. Eng. Chem. Res. 2016, 55, 1533–1549. [Google Scholar] [CrossRef]
- Zheng, S.; Yang, D. Determination of individual diffusion coefficients of C3H8/n-C4H10/CO2/heavy-oil systems at high pressures and elevated temperatures by dynamic volume analysis. In Proceedings of the SPE Improved Oil Recovery Conference, Tulsa, OK, USA, 11–13 April 2016. [Google Scholar]
- Fateen, S.E.K.; Khalil, M.M.; Elnabawy, A.O. Semi-empirical correlation for binary interaction parameters of the Peng–Robinson equation of state with the van der Waals mixing rules for the prediction of high-pressure vapor–liquid equilibrium. J. Adv. Res. 2013, 4, 137–145. [Google Scholar] [CrossRef] [PubMed]
- Elsharkawy, A.M. An empirical model for estimating the saturation pressures of crude oils. J. Pet. Sci. Eng. 2003, 38, 57–77. [Google Scholar] [CrossRef]
- Pedersen, K.S.; Thomassen, P.; Fredenslund, A. SRK-EOS calculation for Crude OILS. Fluid Phase Equilib. 1983, 14, 209–218. [Google Scholar] [CrossRef]
- Twu Chorng, H. Prediction of thermodynamic properties of normal paraffins using only normal boiling point. Fluid Phase Equilib. 1983, 11, 65–81. [Google Scholar]
- Twu Chorng, H. An internally consistent correlation for predicting the critical properties and molecular weights of petroleum and coal-tar liquids. Fluid Phase Equilib. 1984, 16, 137–150. [Google Scholar]
- Kesler, M.G.; Lee, B.I. Improve prediction of enthalpy fractions. Hydrocarb. Process. 1976, 55, 153–158. [Google Scholar]
- Danesh, A.; Xu, D.; Todd, A.C. A Grouping method to optimize oil description for compositional simulation of gas-injection processes. SPE Reserv. Eng. 1992, 7, 343–348. [Google Scholar] [CrossRef]
- Renner, T.A. Measurement and correlation of diffusion coefficients for CO2 and rich-gas applications. SPE Reserv. Eng. 1988, 3, 517–523. [Google Scholar] [CrossRef]
- Moysan, J.M.; Paradowski, H.; Vidal, J. Prediction of phase behaviour of gas-containing systems with cubic equations of state. Chem. Eng. Sci. 1986, 41, 2069–2074. [Google Scholar] [CrossRef]
- Crank, J. The Mathematics of Diffusion; Oxford University Press: Oxford, UK, 1979. [Google Scholar]
- Zhao, R.; Ao, W.; Xiao, A.; Yan, W.; Yu, Z.; Xiao, X. Diffusion law and measurement of variable diffusion coefficient of CO2 in oil. J. China Univ. Pet. 2016, 40, 136–142. [Google Scholar]
- Kavousi, A.; Torabi, F.; Chan, C.W.; Shirif, E. Experimental measurement and parametric study of CO2 solubility and molecular diffusivity in heavy crude oil systems. Fluid Phase Equilib. 2014, 371, 57–66. [Google Scholar] [CrossRef]
- Behzadfar, E.; Hatzikiriakos, S.G. Diffusivity of CO2 in bitumen: Pressure–decay measurements coupled with rheometry. Energy Fuels 2014, 28, 1304–1311. [Google Scholar] [CrossRef]
- Umesi, N.O.; Danner, R.P. Predicting diffusion coefficients in nonpolar solvents. Ind. Eng. Chem. Proc. Des. Dev. 1981, 20, 662–665. [Google Scholar] [CrossRef]
- Upreti, S.R.; Mehrotra, A.K. Diffusivity of CO2, CH4, C2H6 and N2 in athabasca bitumen. Can. J. Chem. Eng. 2002, 80, 116–125. [Google Scholar] [CrossRef]
- Rasmussen, M.L.; Civan, F. Parameters of gas dissolution in liquids obtained by isothermal pressure decay. AICHE J. 2009, 55, 9–23. [Google Scholar] [CrossRef]
- Hayduk, W.; Cheng, S.C. Review of relation between diffusivity and solvent viscosity in dilute liquid solutions. Chem. Eng. Sci. 1971, 26, 635–646. [Google Scholar] [CrossRef]
- Dan, V.N.; Graciaa, A. A new reduction method for phase equilibrium calculations. Fluid Phase Equilib. 2011, 302, 226–233. [Google Scholar]
- Leibovici, C.F.; Neoschil, J. A solution of Rachford-Rice equations for multiphase systems. Fluid Phase Equilib. 1995, 112, 217–221. [Google Scholar] [CrossRef]
- Okuno, R.; Johns, R.T.; Sepehrnoori, K. Application of a reduced method in compositional simulation. SPE J. 2010, 15, 39–49. [Google Scholar] [CrossRef]
- Shu, W.R. Viscosity correlation for mixtures of heavy oil, bitumen, and petroleum fractions. SPE J. 1984, 24, 277–282. [Google Scholar] [CrossRef]


| Test No. | Core Diameter (mm) | Core Length (mm) | Permeability (mD) | Porosity (%) | Initial Pressure (MPa) | Temperature (°C) |
|---|---|---|---|---|---|---|
| 1 | 38.16 | 90.42 | 0.102 | 3.92 | 15.29 | 70 |
| 2 | 38.18 | 90.20 | 0.099 | 3.83 | 15.36 | 70 |
| 3 | 38.14 | 89.66 | 0.096 | 4.95 | 15.35 | 70 |
| 4 | 38.20 | 89.12 | 0.103 | 3.76 | 15.33 | 70 |
| 5 | 38.18 | 89.74 | 0.100 | 4.16 | 15.36 | 70 |
| 6 | 38.16 | 89.40 | 0.102 | 3.75 | 15.32 | 70 |
| Oil No. | Pseudo-Component | Z (mol %) | MW (g/mol) | SG | Tb (K) | Tc (K) | Pc (kPa) | ω |
|---|---|---|---|---|---|---|---|---|
| A | A1 | 43.302 | 143.19 | 0.813 | 454.768 | 644.008 | 2587.222 | 0.449 |
| A2 | 34.479 | 180.762 | 0.841 | 509.554 | 697.369 | 2168.917 | 0.559 | |
| A3 | 22.220 | 315.116 | 0.893 | 632.112 | 806.063 | 1527.015 | 0.832 |
| Oil No. | Component | A1 | A2 | A3 | CO2 |
|---|---|---|---|---|---|
| A | A1 | 0 | 0 | 0 | 1.027 × 10⁻⁴ |
| A2 | 0 | 0 | 0 | 7.162 × 10⁻⁵ | |
| A3 | 0 | 0 | 0 | 2.057 × 10⁻³ | |
| CO2 | 1.027 × 10⁻⁴ | 7.162 × 10⁻⁵ | 2.057 × 10⁻³ | 0 |
| Fluid | Viscosity (mPa∙s) | Pressure (MPa) | Temperature (K) | Permeability (mD) | Diffusion Coefficient (10−10 m2/s) | Sources | |
|---|---|---|---|---|---|---|---|
| Mixed oil samples | 3.30–127.47 @343.15K | 15.29–15.36 | 343.15 | 0.096–0.103 | Early stage | Later stage | This study |
| 74.97–128.92 | 39.38–89.46 | ||||||
| Global regression | |||||||
| 55.33–107.89 | |||||||
| Without PR EOS | |||||||
| 23.63–79.37 | |||||||
| Changji light oil | 7.26 @323.15K | 14.56–14.89 | 298.15–358.15 | 0.058–0.192 | Early stage | Later stage | Li et al. [54] |
| 67.04–164.38 | 33.82–100.37 | ||||||
| N-hexadecan | 2.14 @313.15 | 2.28–6.03 | 313.15 | 80.67–227.74 | 5.98–8.01 | Li et al. [24] | |
| Lloydminster heavy oil | 12,854.00 @294.55K | 3.74–3.37 | 294.55 | / | 4.30 | Zheng et al. [58] | |
| Lloydminster heavy oil | 12,854.00 @294.55K | 5.40 | 317.65 | / | 14.97 | Zheng et al. [59] | |
| Athabasca bitumen | 821,000.00 @298.15K | 4.00–8.00 | 323.15 | / | 2.20–8.90 | Upreti [74] | |
| Lloydminster heavy oil | 23,000.00 @297.15K | 2.00–6.00 | 297.15 | / | 2.00–5.50 | Yang [45] | |
| Athabasca bitumen | 106,000.00 @313.15K | 3.24 | 348.15 | / | 5.03 | Rasmussen et al. [75] | |
© 2018 by the authors. Licensee MDPI, Basel, Switzerland. This article is an open access article distributed under the terms and conditions of the Creative Commons Attribution (CC BY) license (http://creativecommons.org/licenses/by/4.0/).
Share and Cite
Zhang, C.; Qiao, C.; Li, S.; Li, Z. The Effect of Oil Properties on the Supercritical CO2 Diffusion Coefficient under Tight Reservoir Conditions. Energies 2018, 11, 1495. https://doi.org/10.3390/en11061495
Zhang C, Qiao C, Li S, Li Z. The Effect of Oil Properties on the Supercritical CO2 Diffusion Coefficient under Tight Reservoir Conditions. Energies. 2018; 11(6):1495. https://doi.org/10.3390/en11061495
Chicago/Turabian StyleZhang, Chao, Chenyu Qiao, Songyan Li, and Zhaomin Li. 2018. "The Effect of Oil Properties on the Supercritical CO2 Diffusion Coefficient under Tight Reservoir Conditions" Energies 11, no. 6: 1495. https://doi.org/10.3390/en11061495
APA StyleZhang, C., Qiao, C., Li, S., & Li, Z. (2018). The Effect of Oil Properties on the Supercritical CO2 Diffusion Coefficient under Tight Reservoir Conditions. Energies, 11(6), 1495. https://doi.org/10.3390/en11061495