1. Introduction
The oil-impregnated paper (OIP) condenser bushing is the most common device for power transmission in service. It provides a fundamental connection to carry the electric current passing through different potential conductors in electrical equipment [
1,
2]. OIP bushings ensure complex electrical, mechanical, thermal, and environmental stresses in operation and can easily be violated by insulation defects.
The accurate assessment of moisture content in a moistened OIP bushing is of great significance for the safe and reliable operation and maintenance in a power system. As has been frequently reported, the failures of OIP bushings could be induced by moisture ingress (MI), which might initiate a partial discharge (PD) and even explosion accidents of the power apparatus in a substation [
3,
4]. According to the data from various research and electric power utilities in use, around one quarter of the total transformer failures were caused by bushings failures [
5,
6], which can completely destroy a transformer and bring huge collateral damages to the transmission substation [
7]. Operational records report that about 90% of bushing failures were triggered by the MI into the bushing through leaky gaskets or other openings [
8,
9,
10]. Due to an unreasonable sealing structure or destroyed sealing system [
11,
12], it is easy to breathe in moisture from the external environment to the bushings, which could easily cause the insulation deterioration of the bushing. However, the mechanism and characteristics of insulation deterioration by MI in bushings remain far from clear. Therefore, it is important to identify the fault mechanism, characteristic, and diagnosis methods of insulation deterioration initiated by MI in bushings with the aim to minimize the risk of failures in power systems and reduce unnecessary economic losses.
Existing research on bushings mainly focuses on the qualitative diagnosis of moisture content in a bushing. However, the mechanism and new diagnostic features for MI into bushings were not distinct enough in order to detect insulation accidents induced by MI for bushings, which passed the existing standards. David J. Smith [
13] from Glasgow Caledonian University used Finite Element Modeling (FEM) modelling of bushings to simulate the dissipation factor and capacitance for various moisture contents over a frequency range between 0.001 Hz and 1000 Hz and a temperature range between 0 and 90 °C. It was found that capacitance measurements at power frequency were not sensitive enough to detect the changes in moisture content. M. Krüge [
14] from OMICRON Energy measured the new and aged bushings using the Frequency Domain Spectroscopy (FDS) method, which proved to be a very promising approach to detect the aging and moisture in bushings with high sensitivity. Victor Sokolov [
15,
16] from ZTZ-Service studied the typical defect and failure modes of HV bushings and modified the equivalent of the dissipation factor to diagnose the local moisture contamination of bushings. However, few analyses have been done in terms of MI into bushings. There remains an urgent need to study the mechanism of MI into bushings so as to achieve the precise diagnosis of the moisture related to bushing failures.
In the present research, a transparent bushing model was designed and an ultrasonic humidifier device was adopted to simulate the MI process. The parameters of the dielectric dissipation factor (tanδ), capacitance, PD, FDS, and moisture content in oil were measured at room temperature with time. The moisture content in the paper of the bushing model was measured until PD obviously occurred. It was expected that the test results could provide applicable reference for condition monitoring and maintenance of OIP bushing in the power system.
2. Test Setup and Methods
2.1. Bushing Model
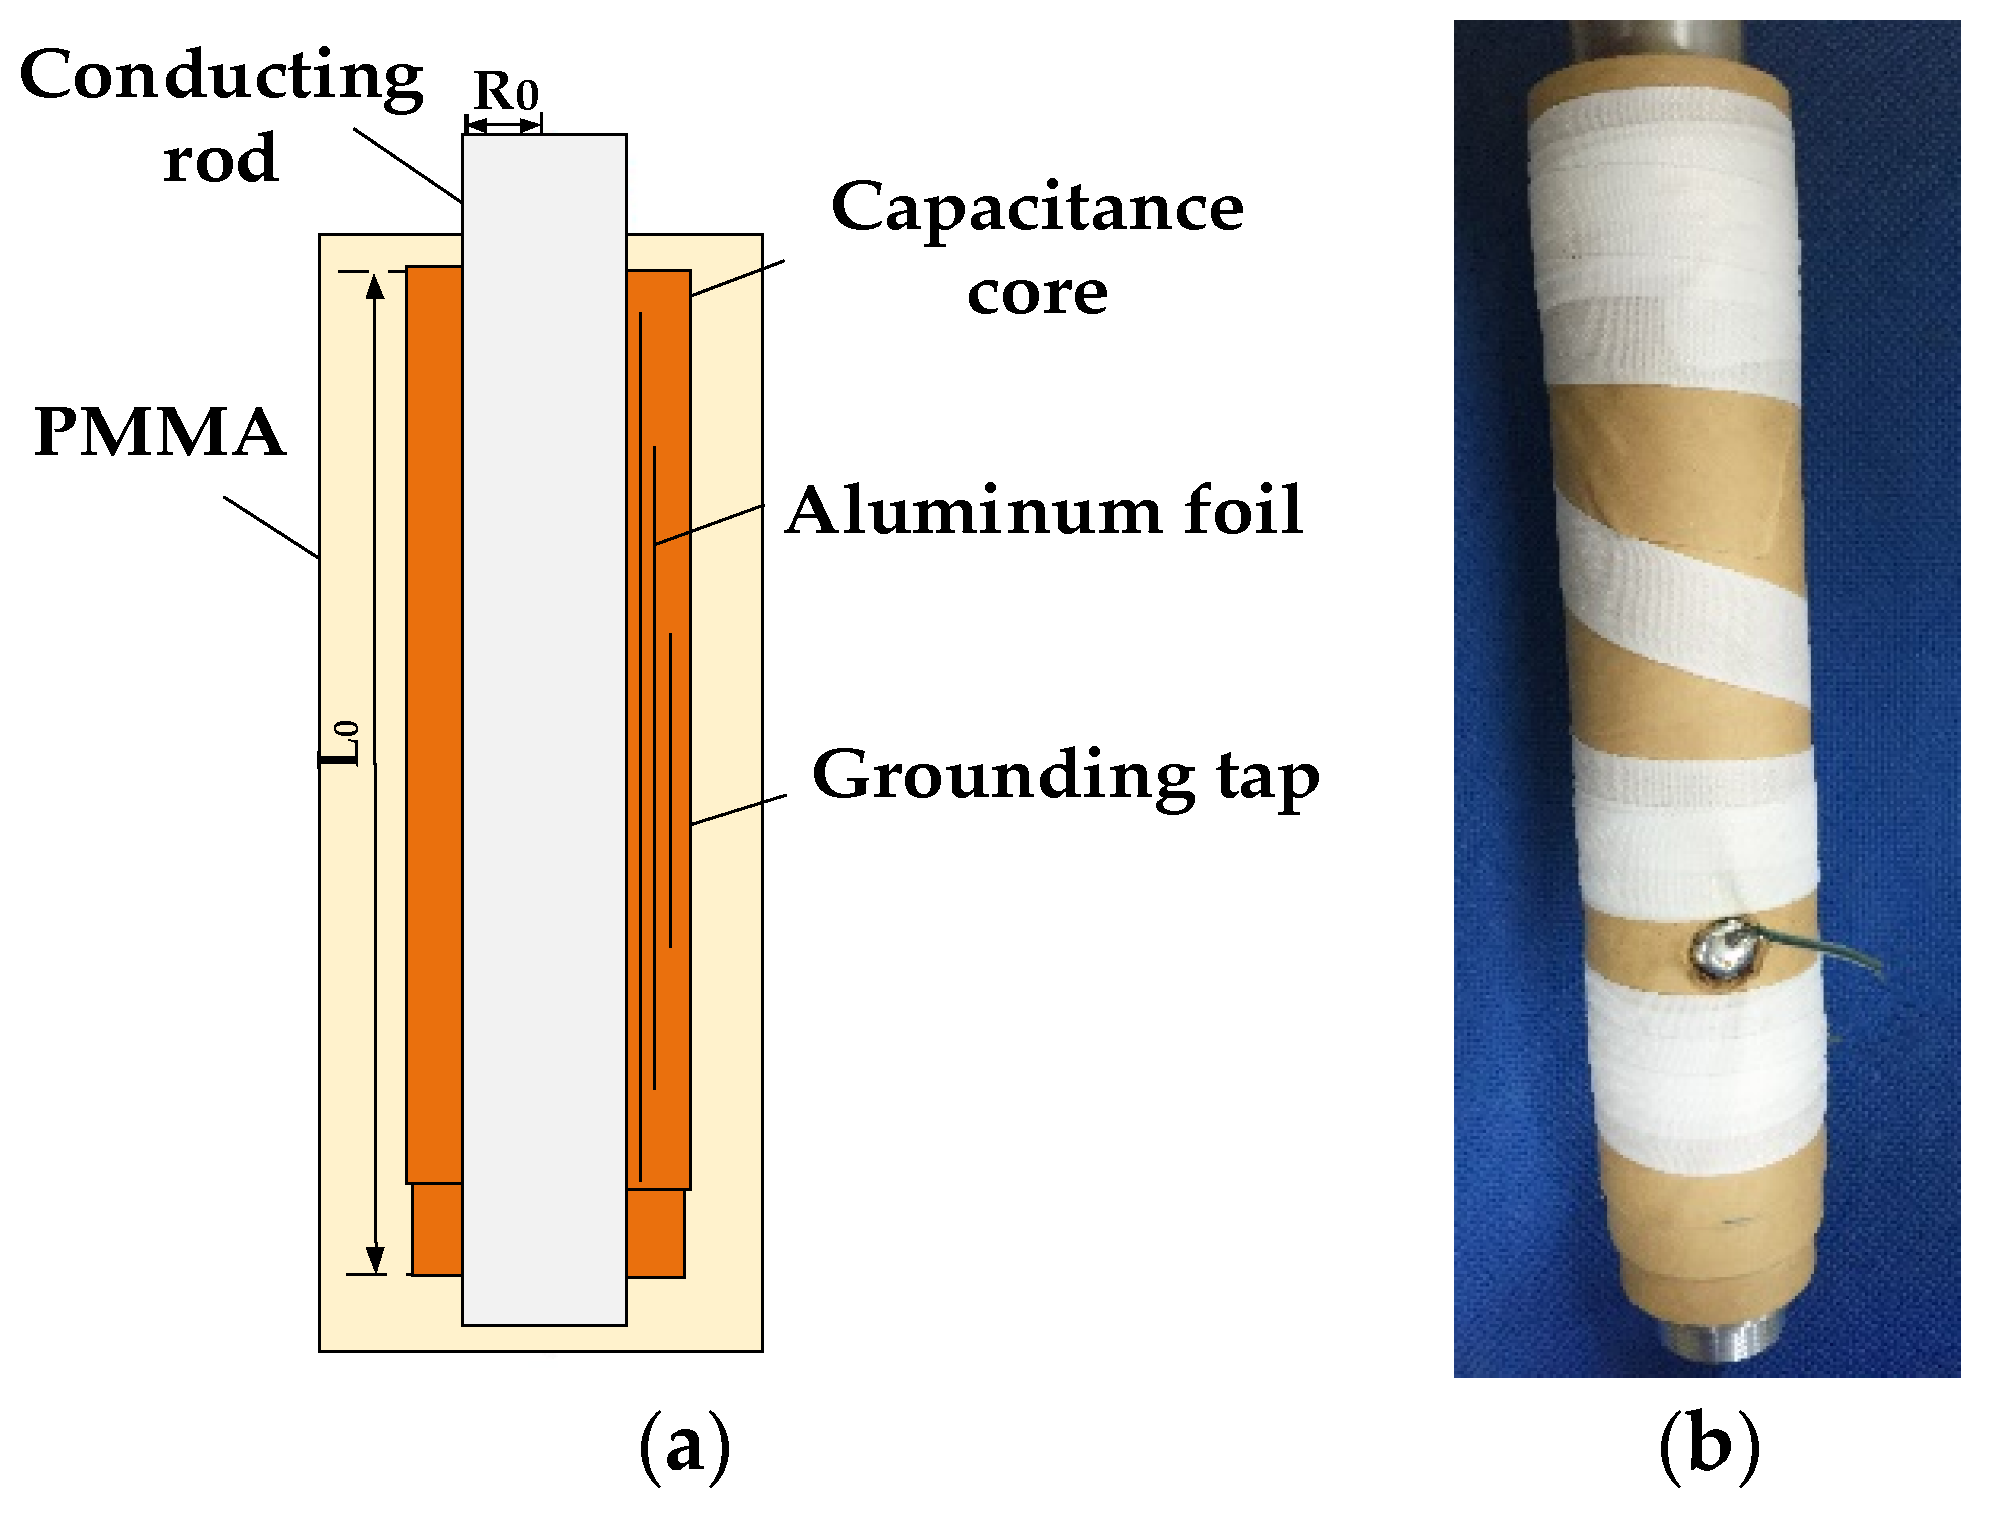
As shown in
Figure 1, the bushing model was composed of the capacitor core, polyethylene methacrylate (PMMA) chamber, conducting rod, oil, and tap grounding device.
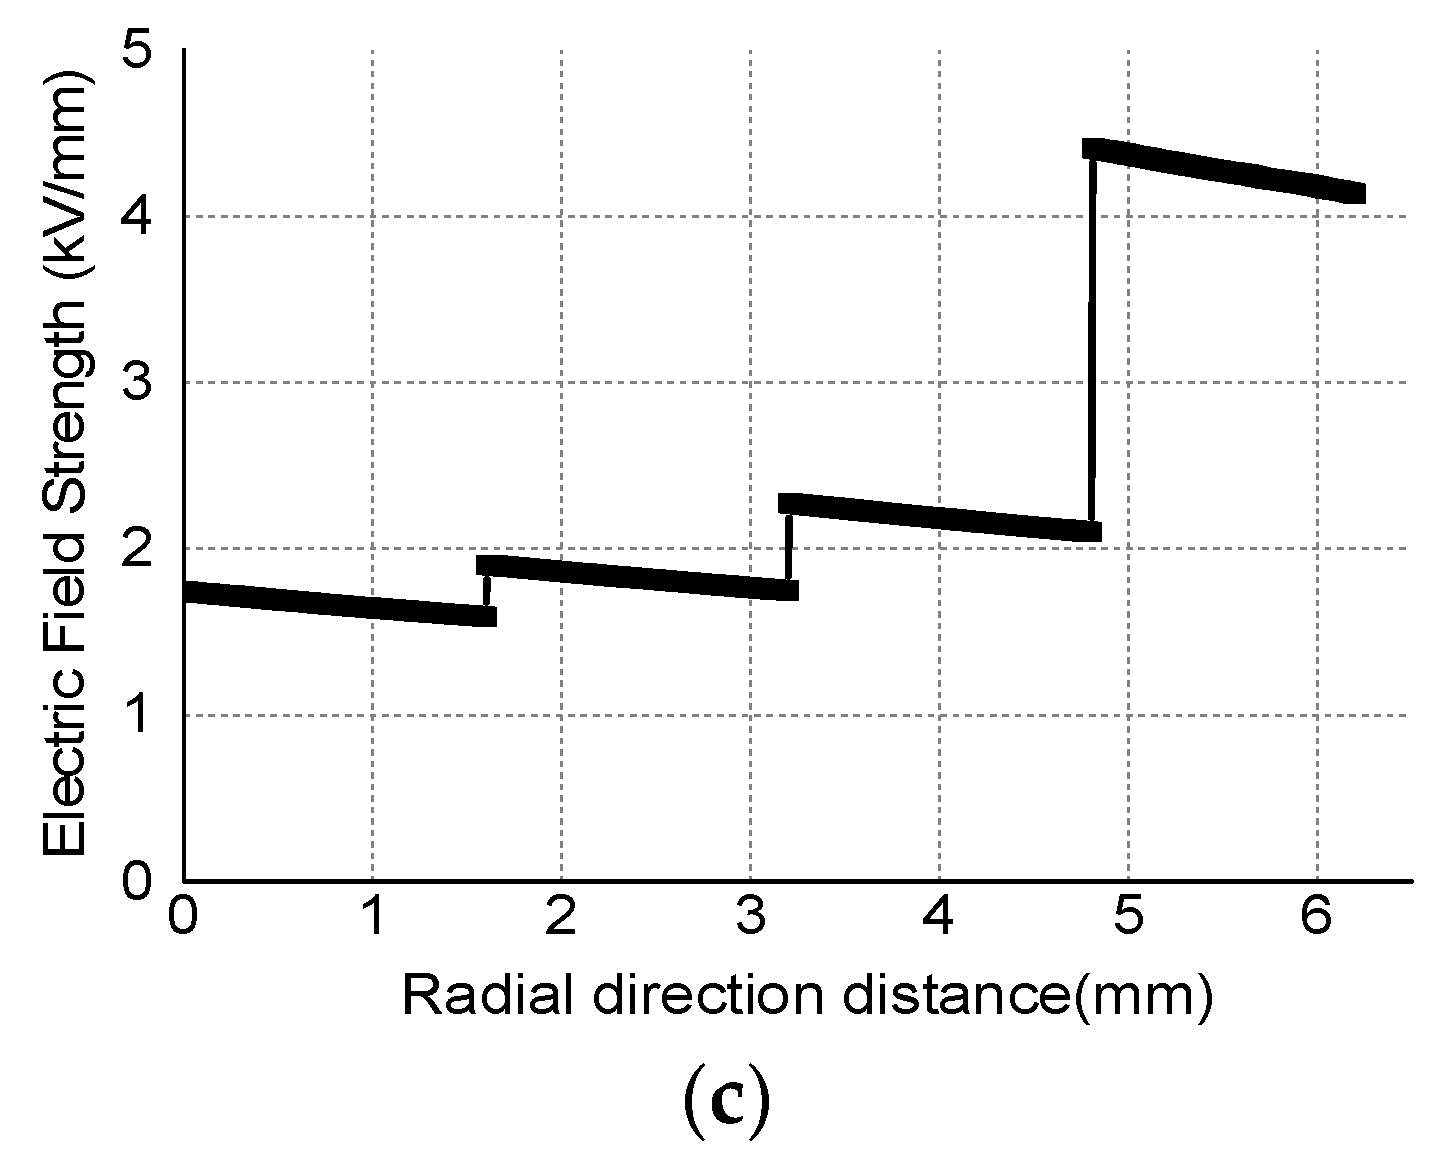
The PMMA chamber functioned as the shield of the bushing, which was transparent and easily operated to observe the MI and gas phenomenon of the bushing. The size of the PMMA chamber has an inner size of Φ 100 mm × 300 mm and could withstand a temperature of 80 °C and an AC voltage of 50 kV. By using the capacitance radial grading technique, the present research designed a 26 kV OIP capacitance core, which consists of four layers of aluminum foil plating and paper in maximum lengths of 250 mm. The maximum radial electric field strength was recorded as 4.4 kV/mm. The maximum upper and lower axial electric field strengths were 0.1 kV/mm and 0.43 kV/mm, respectively.
2.2. Test Circuit
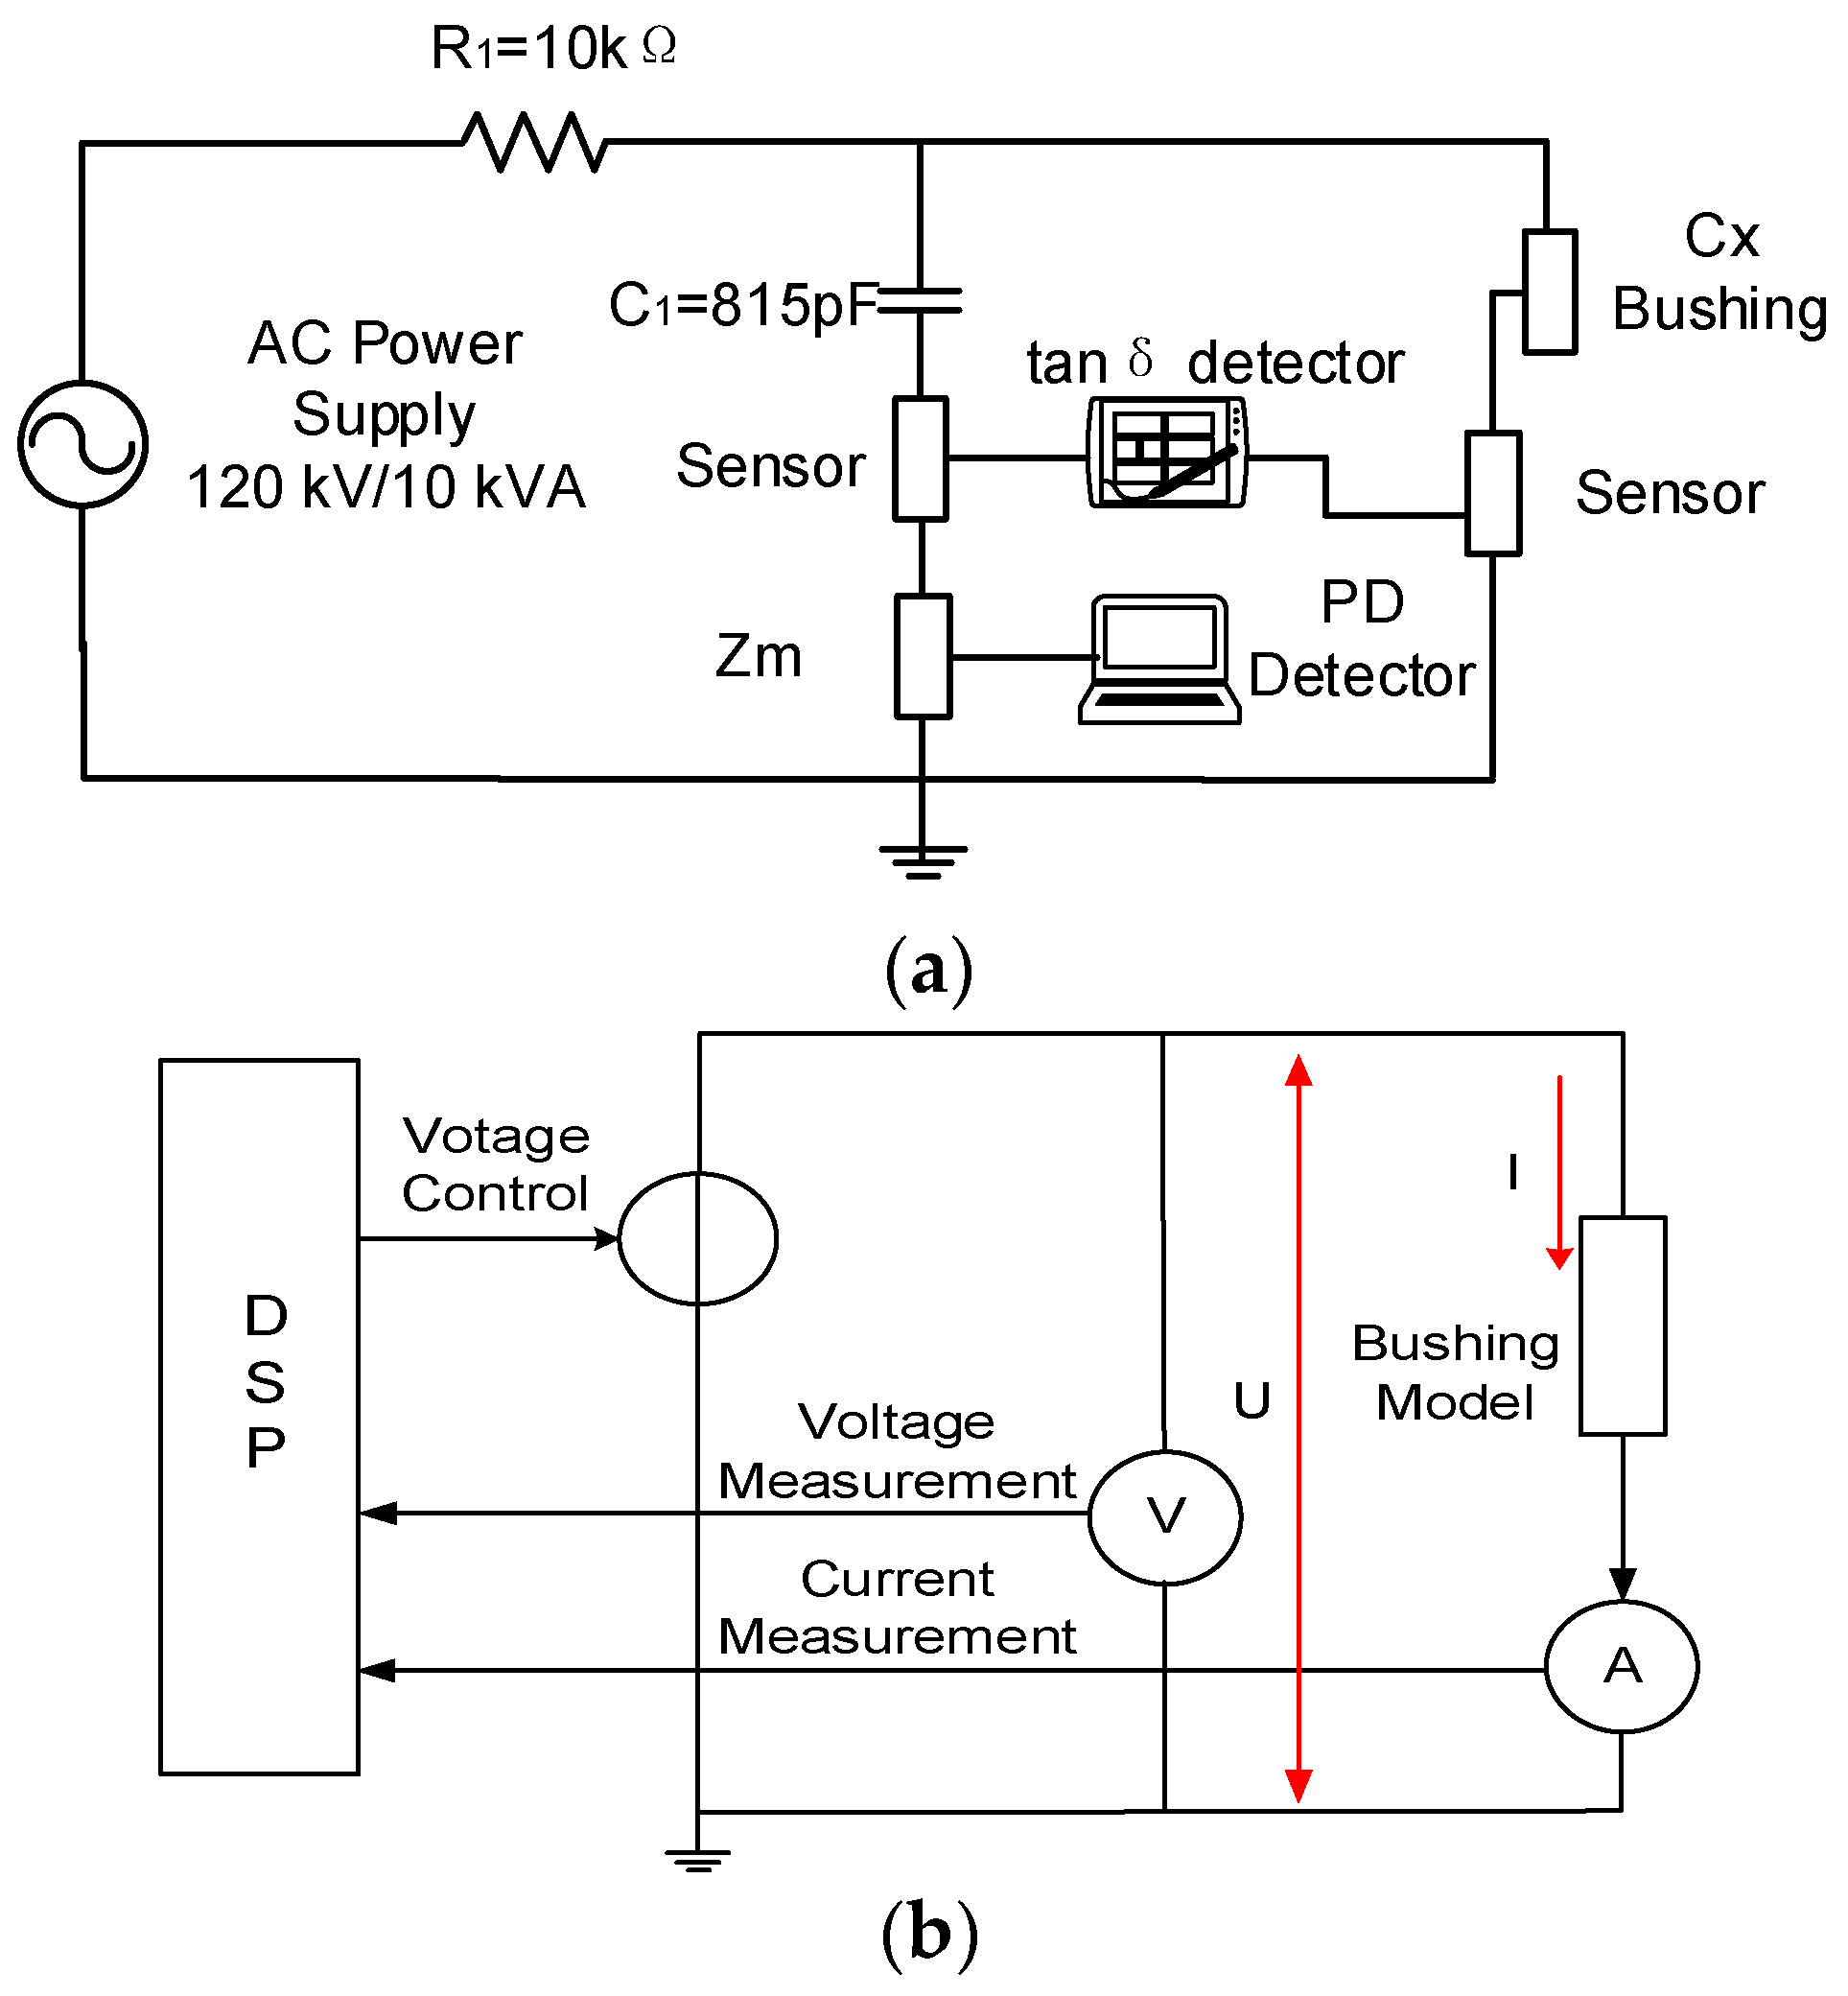
The test circuit is shown in
Figure 2. The resistance of the protective resistor R1 and the capacitance of coupling capacitor C1 for AC power supply were selected as 10 kΩ and 815 pF. The PD detector Zm (LDS-6) with a sensitivity of ≤1 pC was connected to the coupling capacitor C1. The cross-core tanδ sensors with an accuracy of ≤0.04% detected the currents of the bushing model and coupled capacitor separately at the same time. The tanδ from 0.001 to 1 Hz was measured by the FDS system of IDAX300 (Megger, Danderyd, Sweden), whose test circuit in the bushing model was shown in
Figure 2b.
2.3. Test Voltage
With reference to the output capacity of the experiment equipment, boosting voltages were applied to the bushing model. The AC voltage was applied to the bushing model every 5 min with a step of 5 kV, and the tanδ, capacitance, and PD were measured online under the applied AC voltage of 10 kV, 15 kV, 20 kV, 25 kV, and 30 kV, respectively. The amplitude of output voltage of the frequency domain response was set as 200 V by the IDAX software.
2.4. Moisture Ingress Method
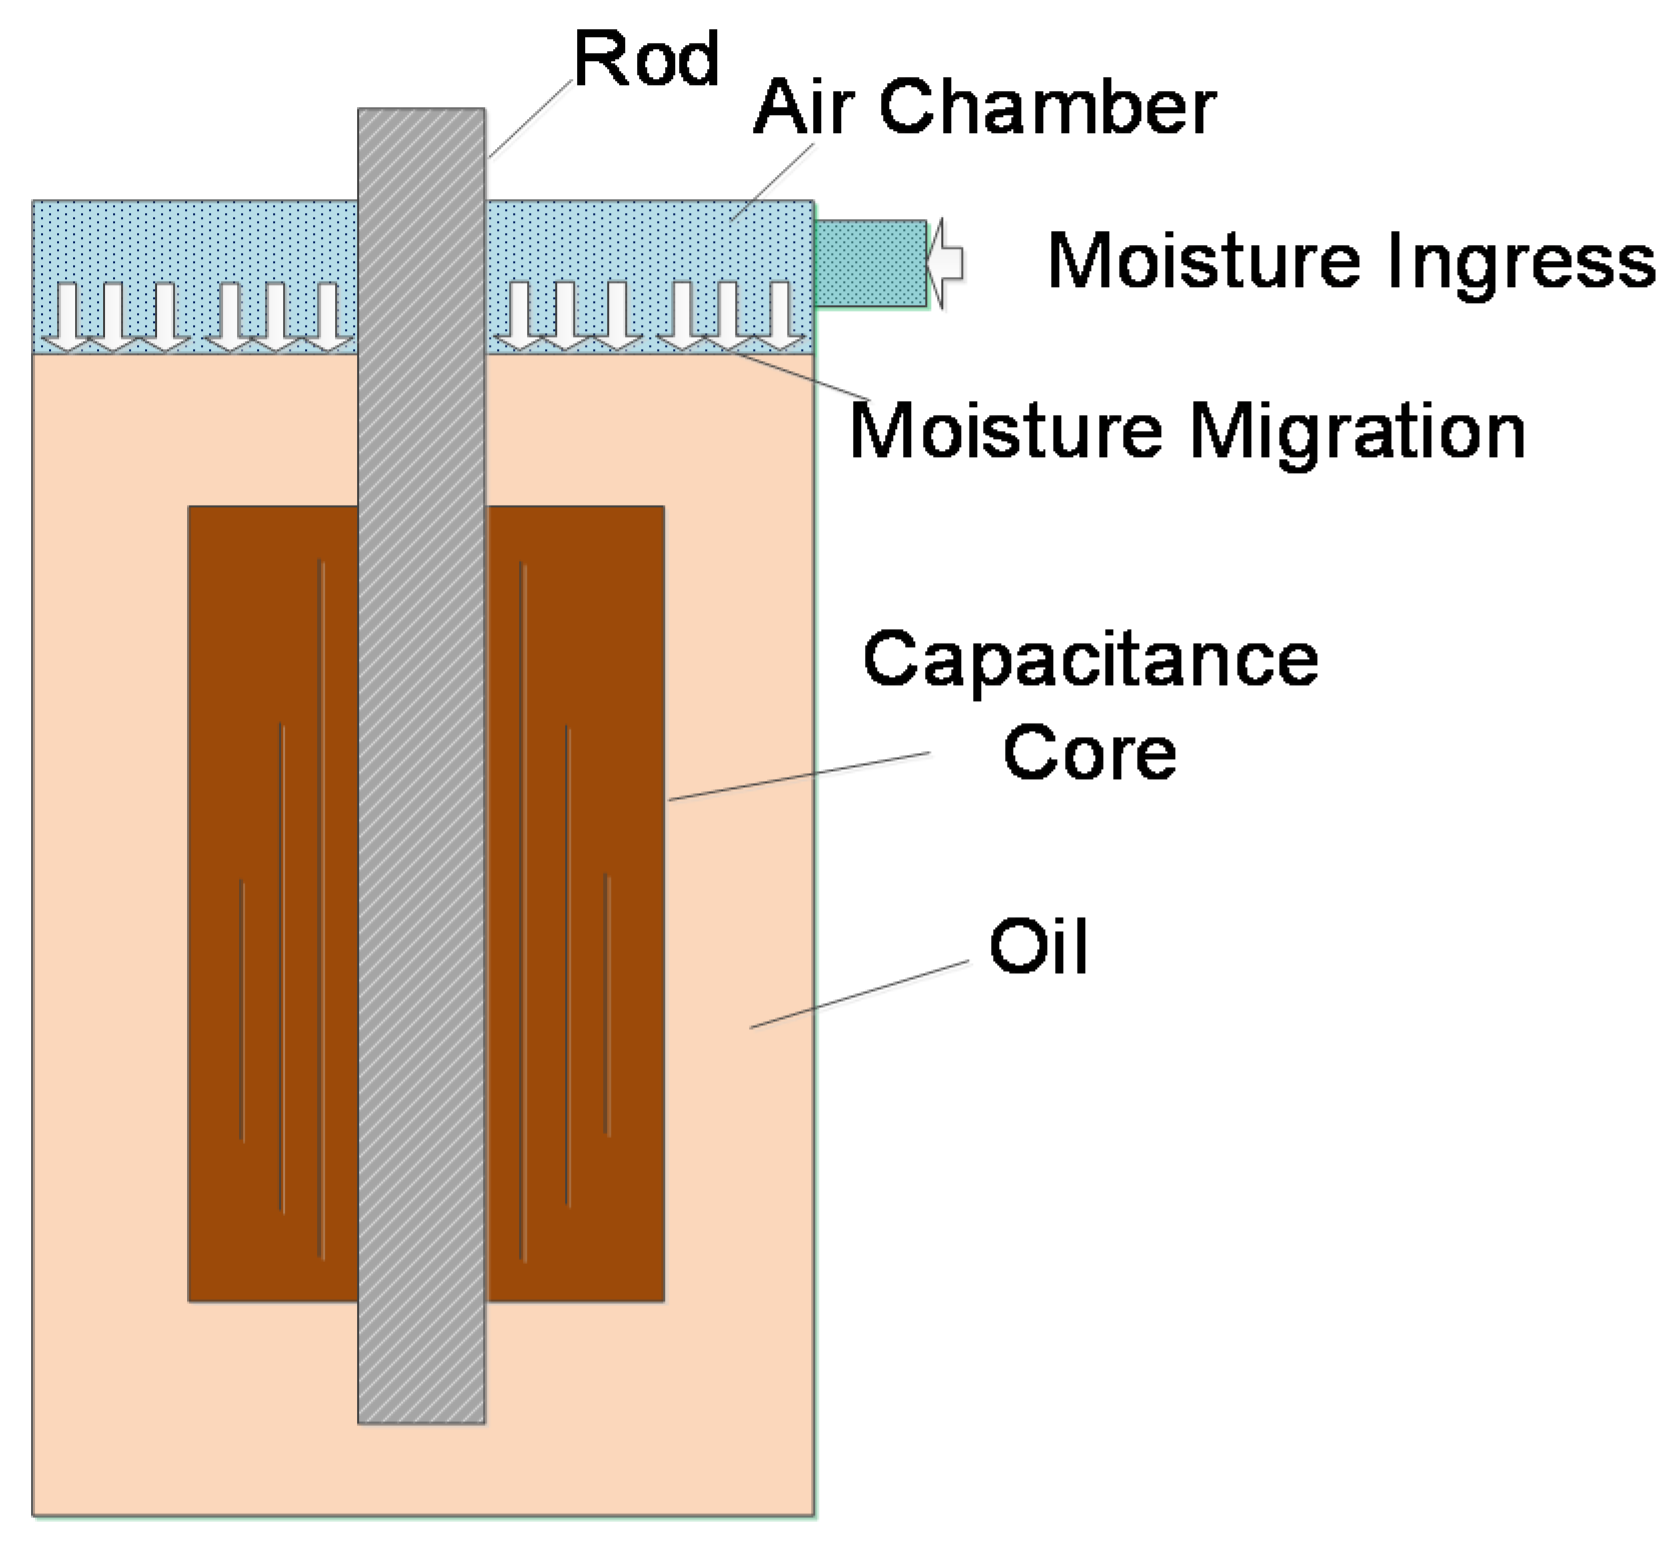
As illustrated in
Figure 3, the phenomenon of MI into the bushing was simulated by an ultrasonic humidifier through the crack of the top of bushing. The time of MI in the bushing was one hour with the maximum moisture flow. The micron-sized diameter of moisture was produced by an ultrasonic humidifier.
3. Characteristic of Moisture Ingress on Oil-Impregnated Paper Bushing
3.1. Moisture Ingress Phenomenon
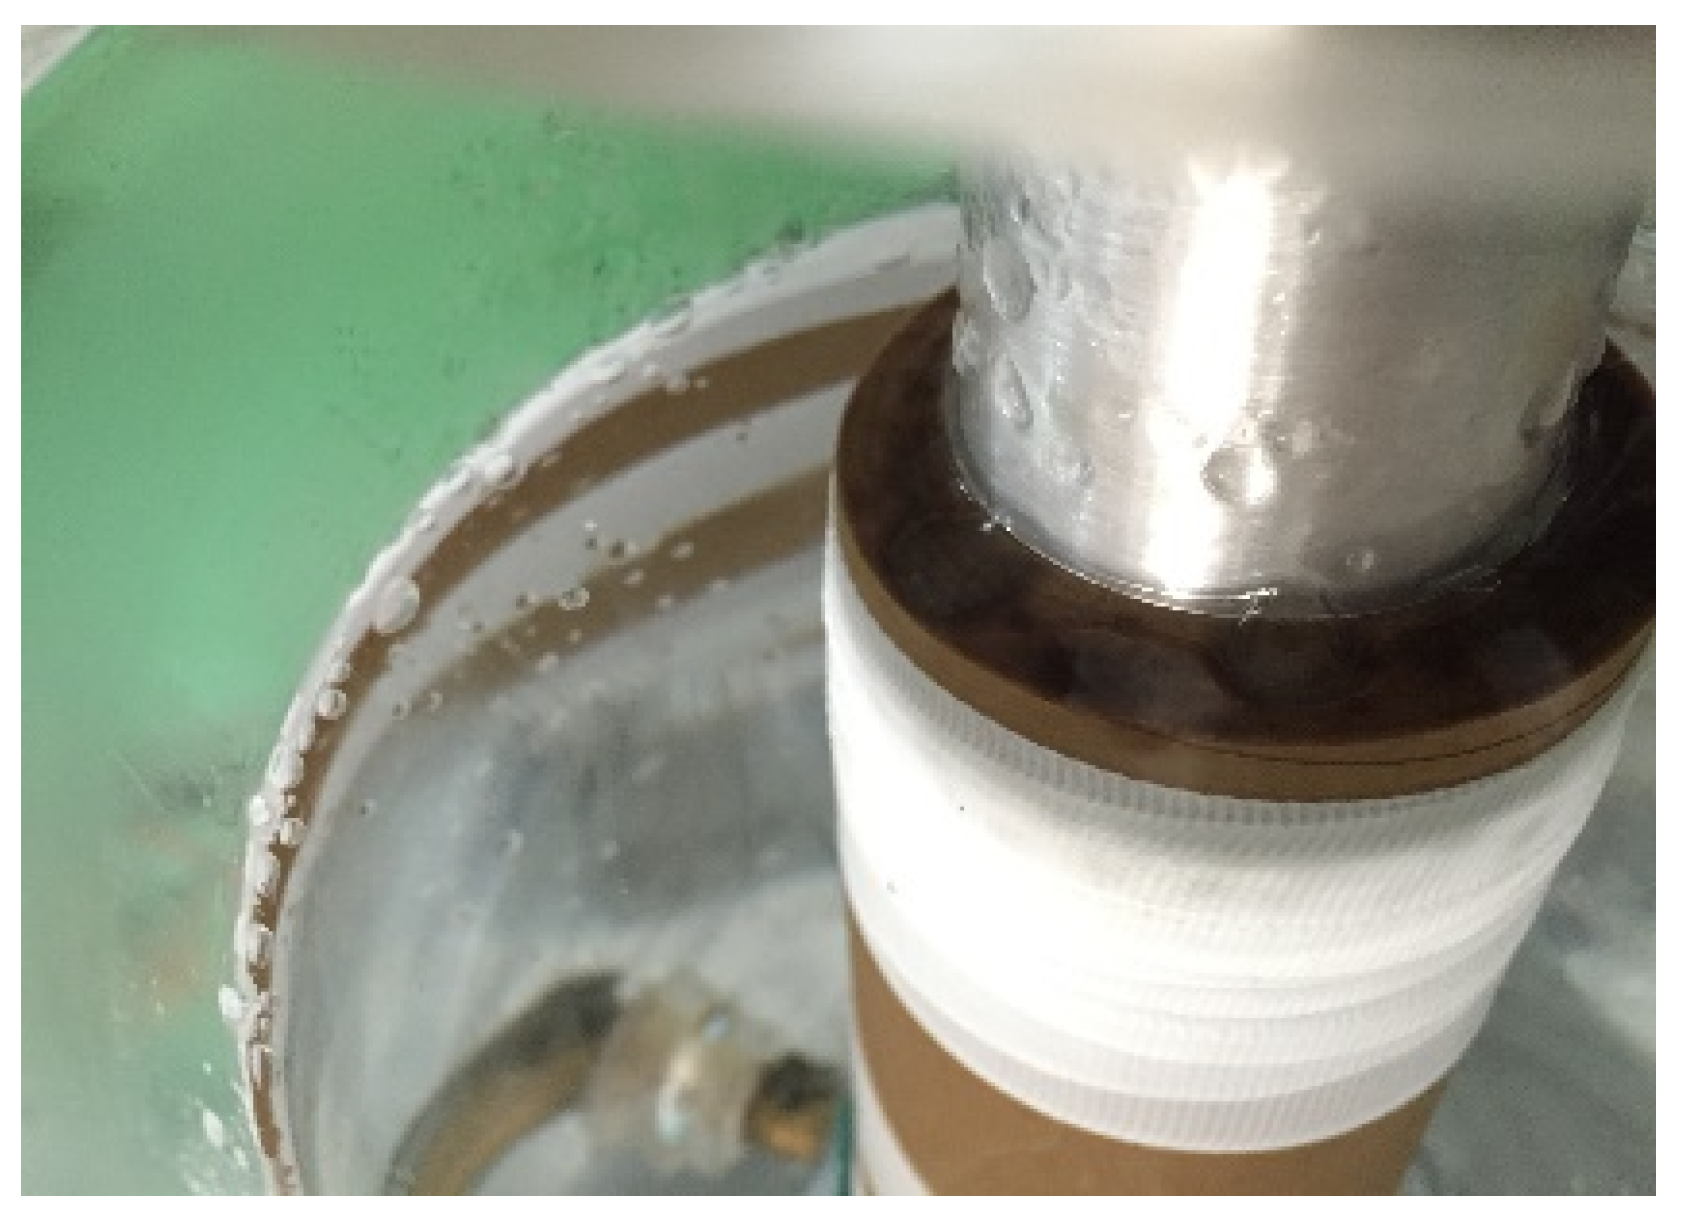
As shown in
Figure 4, before MI into the bushing model, the oil in the bushing model was clear and uncontaminated. After MI into the top of the bushing model, the moisture condensation was inching closer to the surface of the oil in the top of the bushing model. It was observed that MI into the bushing from the crack of the bushing top was a long process of moisture dissolved in oil.
3.2. Moisture in Oil
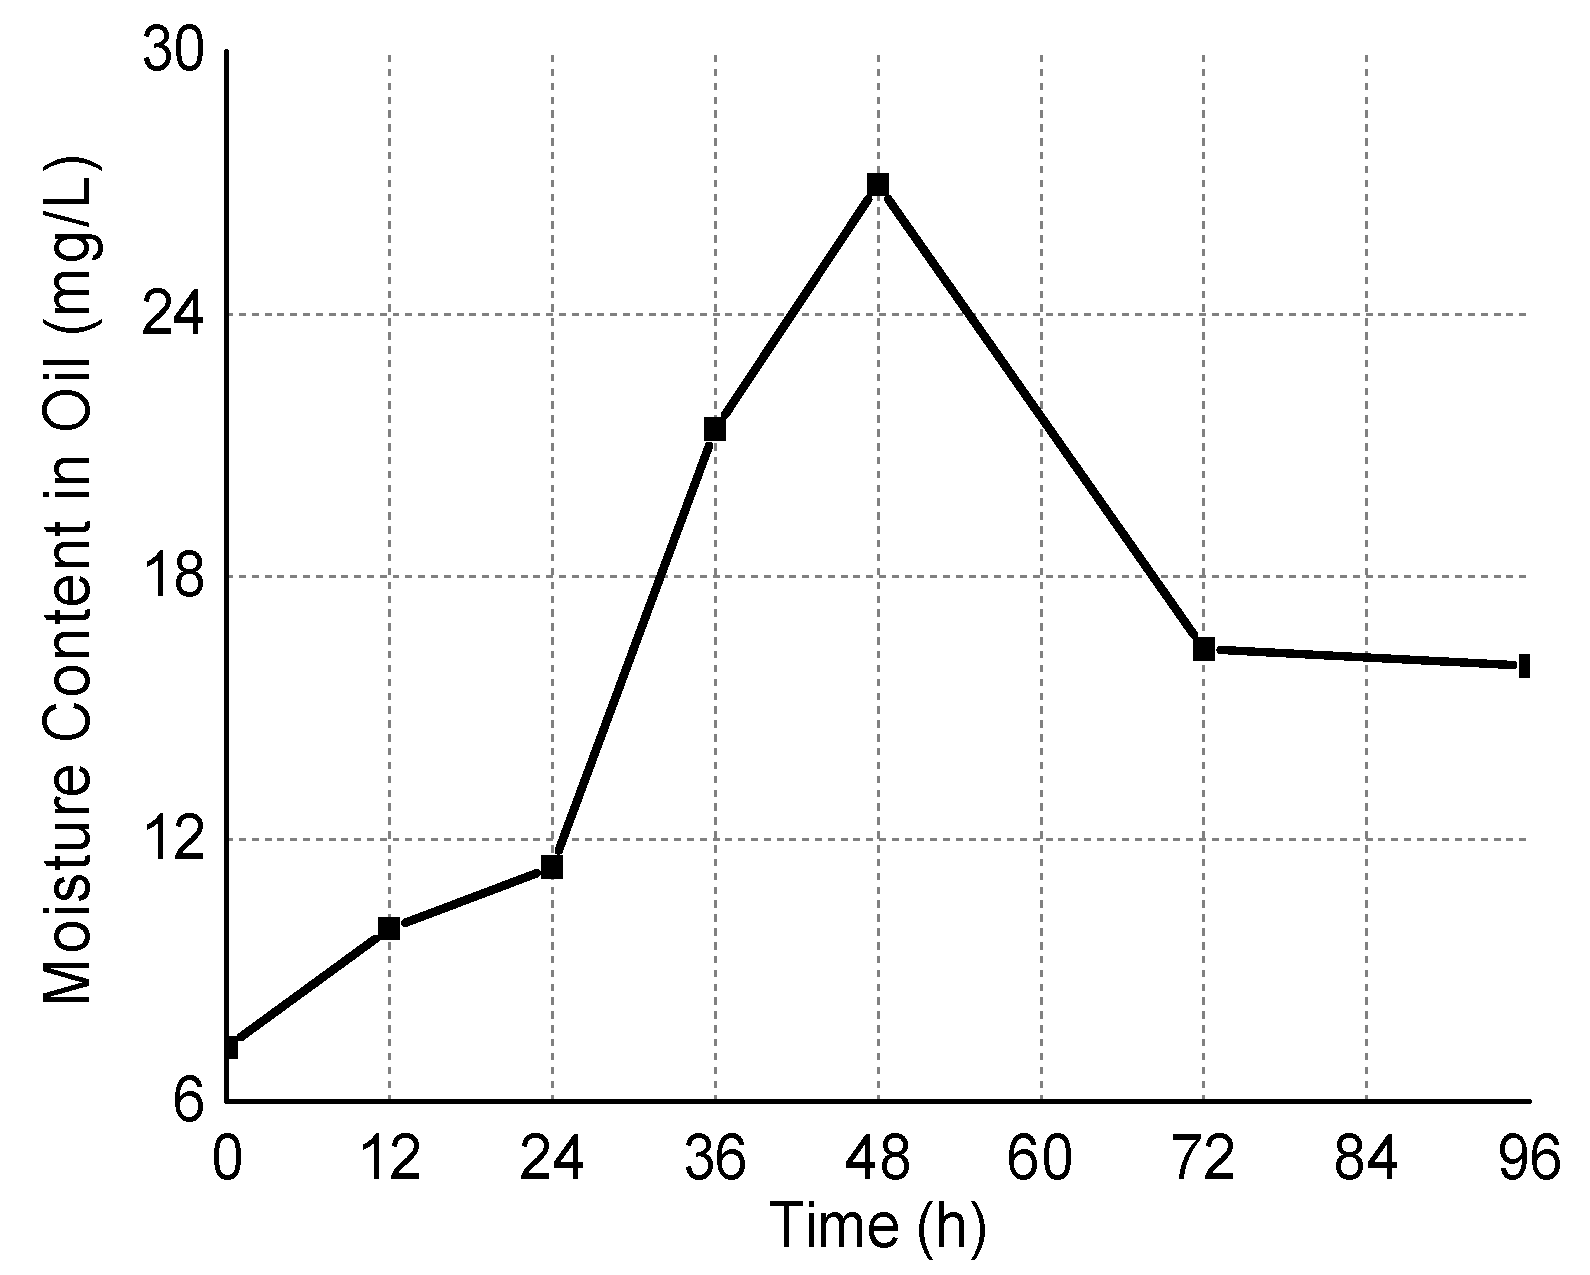
Before MI into the bushing model, the moisture content in oil was 7.24 mg/L at room temperature. However, after MI in the bushing for one hour, the bushing model was placed on the shelf with the top sealed.
As shown in
Figure 5, the moisture content in oil was increased within the first 48 h moistening and decreased after the MI into the bushing. After 12 h, the moisture content in the oil of the bushing was increased to 9.95 mg/L. It can be seen from
Figure 6 that the moisture content in oil increased slowly at the beginning and then went on a decline at a later stage. It signifies that the capacity of moisture absorption in oil was rather weak and thus the speed of the moisture migration between the oil in the bushing and outside the damped environment was slow. With the stronger capacity of moisture absorption in paper, the moisture content in the oil then witnessed a decline. Therefore, it would lead to an erroneous judgement on the insulation condition of the bushings by measuring the moisture content in oil alone.
3.3. Change of Tanδ and Capacitance
As presented in
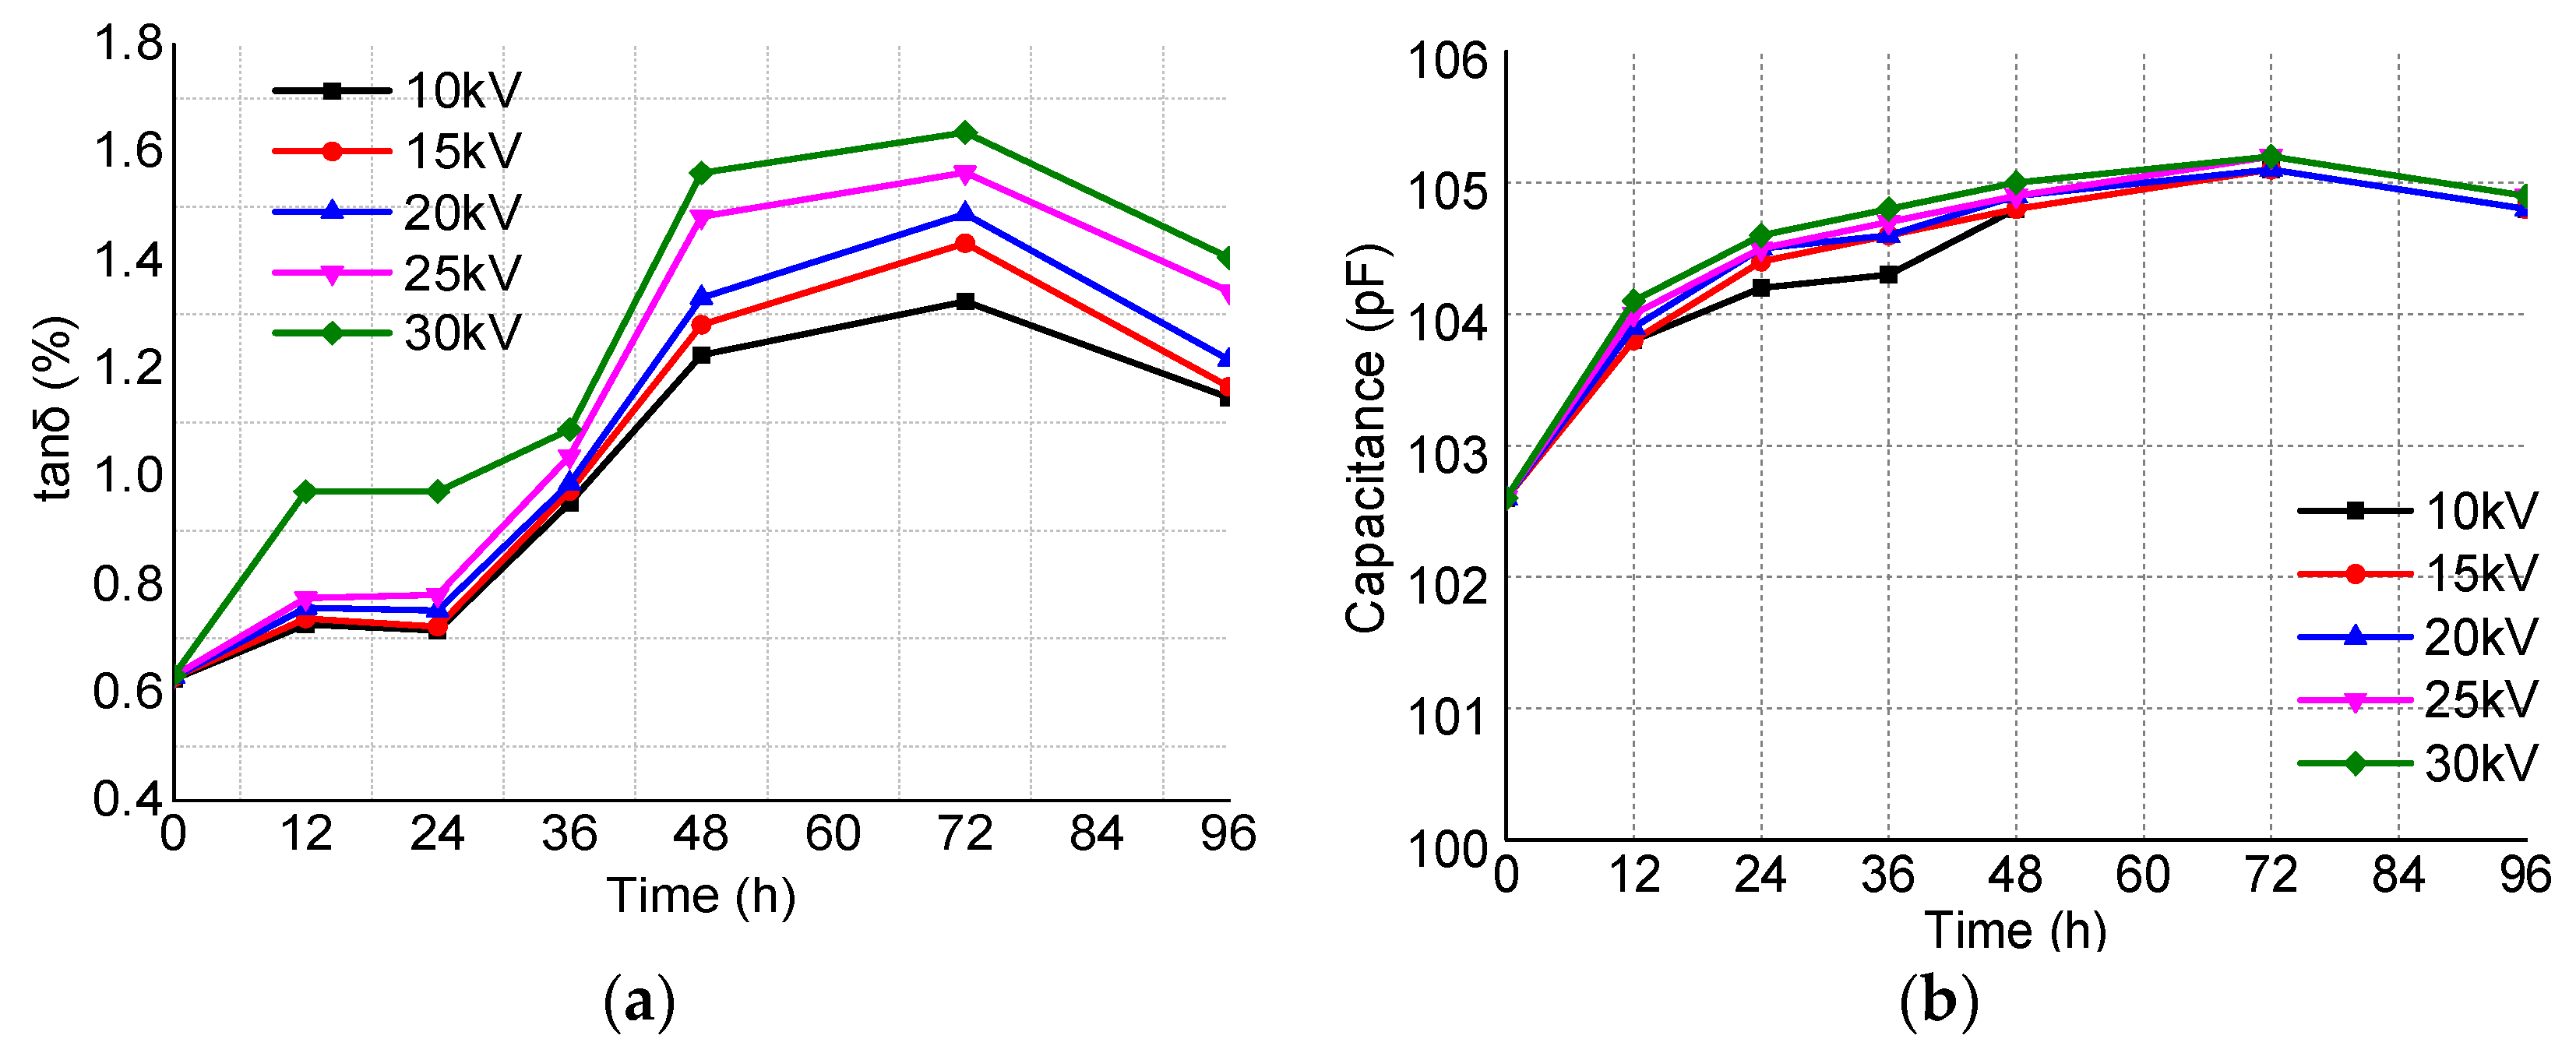
Figure 6a, the tanδ of the normal bushing model was stable and almost unchanged with the applied boosting of the AC voltage. As demonstrated in
Figure 6b, prior to MI, the capacitance of the bushing model witnessed limited changes as the applied voltage was stepped up.
After MI into the bushing, the tanδ of the bushing model was increased from 0.62% to 0.73% under the AC voltage of 10 kV. When the applied voltage was boosted to 30 kV, the tanδ of the bushing model was increased to 0.97%, an increment of 32.88%, comparing to the value of tanδ at 10 kV. After MI, however, the capacitance grew from 102.6 to 103.8 pF under the AC voltage of 10 kV. Under the voltage of 30 kV, the capacitance mounted up to 104.1 pF with an increment rate of 0.28% in comparison to that at 10 kV. Therefore, it was inferred that the tanδ for the moistened bushing showed a higher sensitivity than the capacitance under different amplitudes of applied voltage.
3.4. Change of Partial Discharge
Prior to MI, the magnitude of PD was registered as less than 10 pC in the bushing model under 40 kV AC voltage.
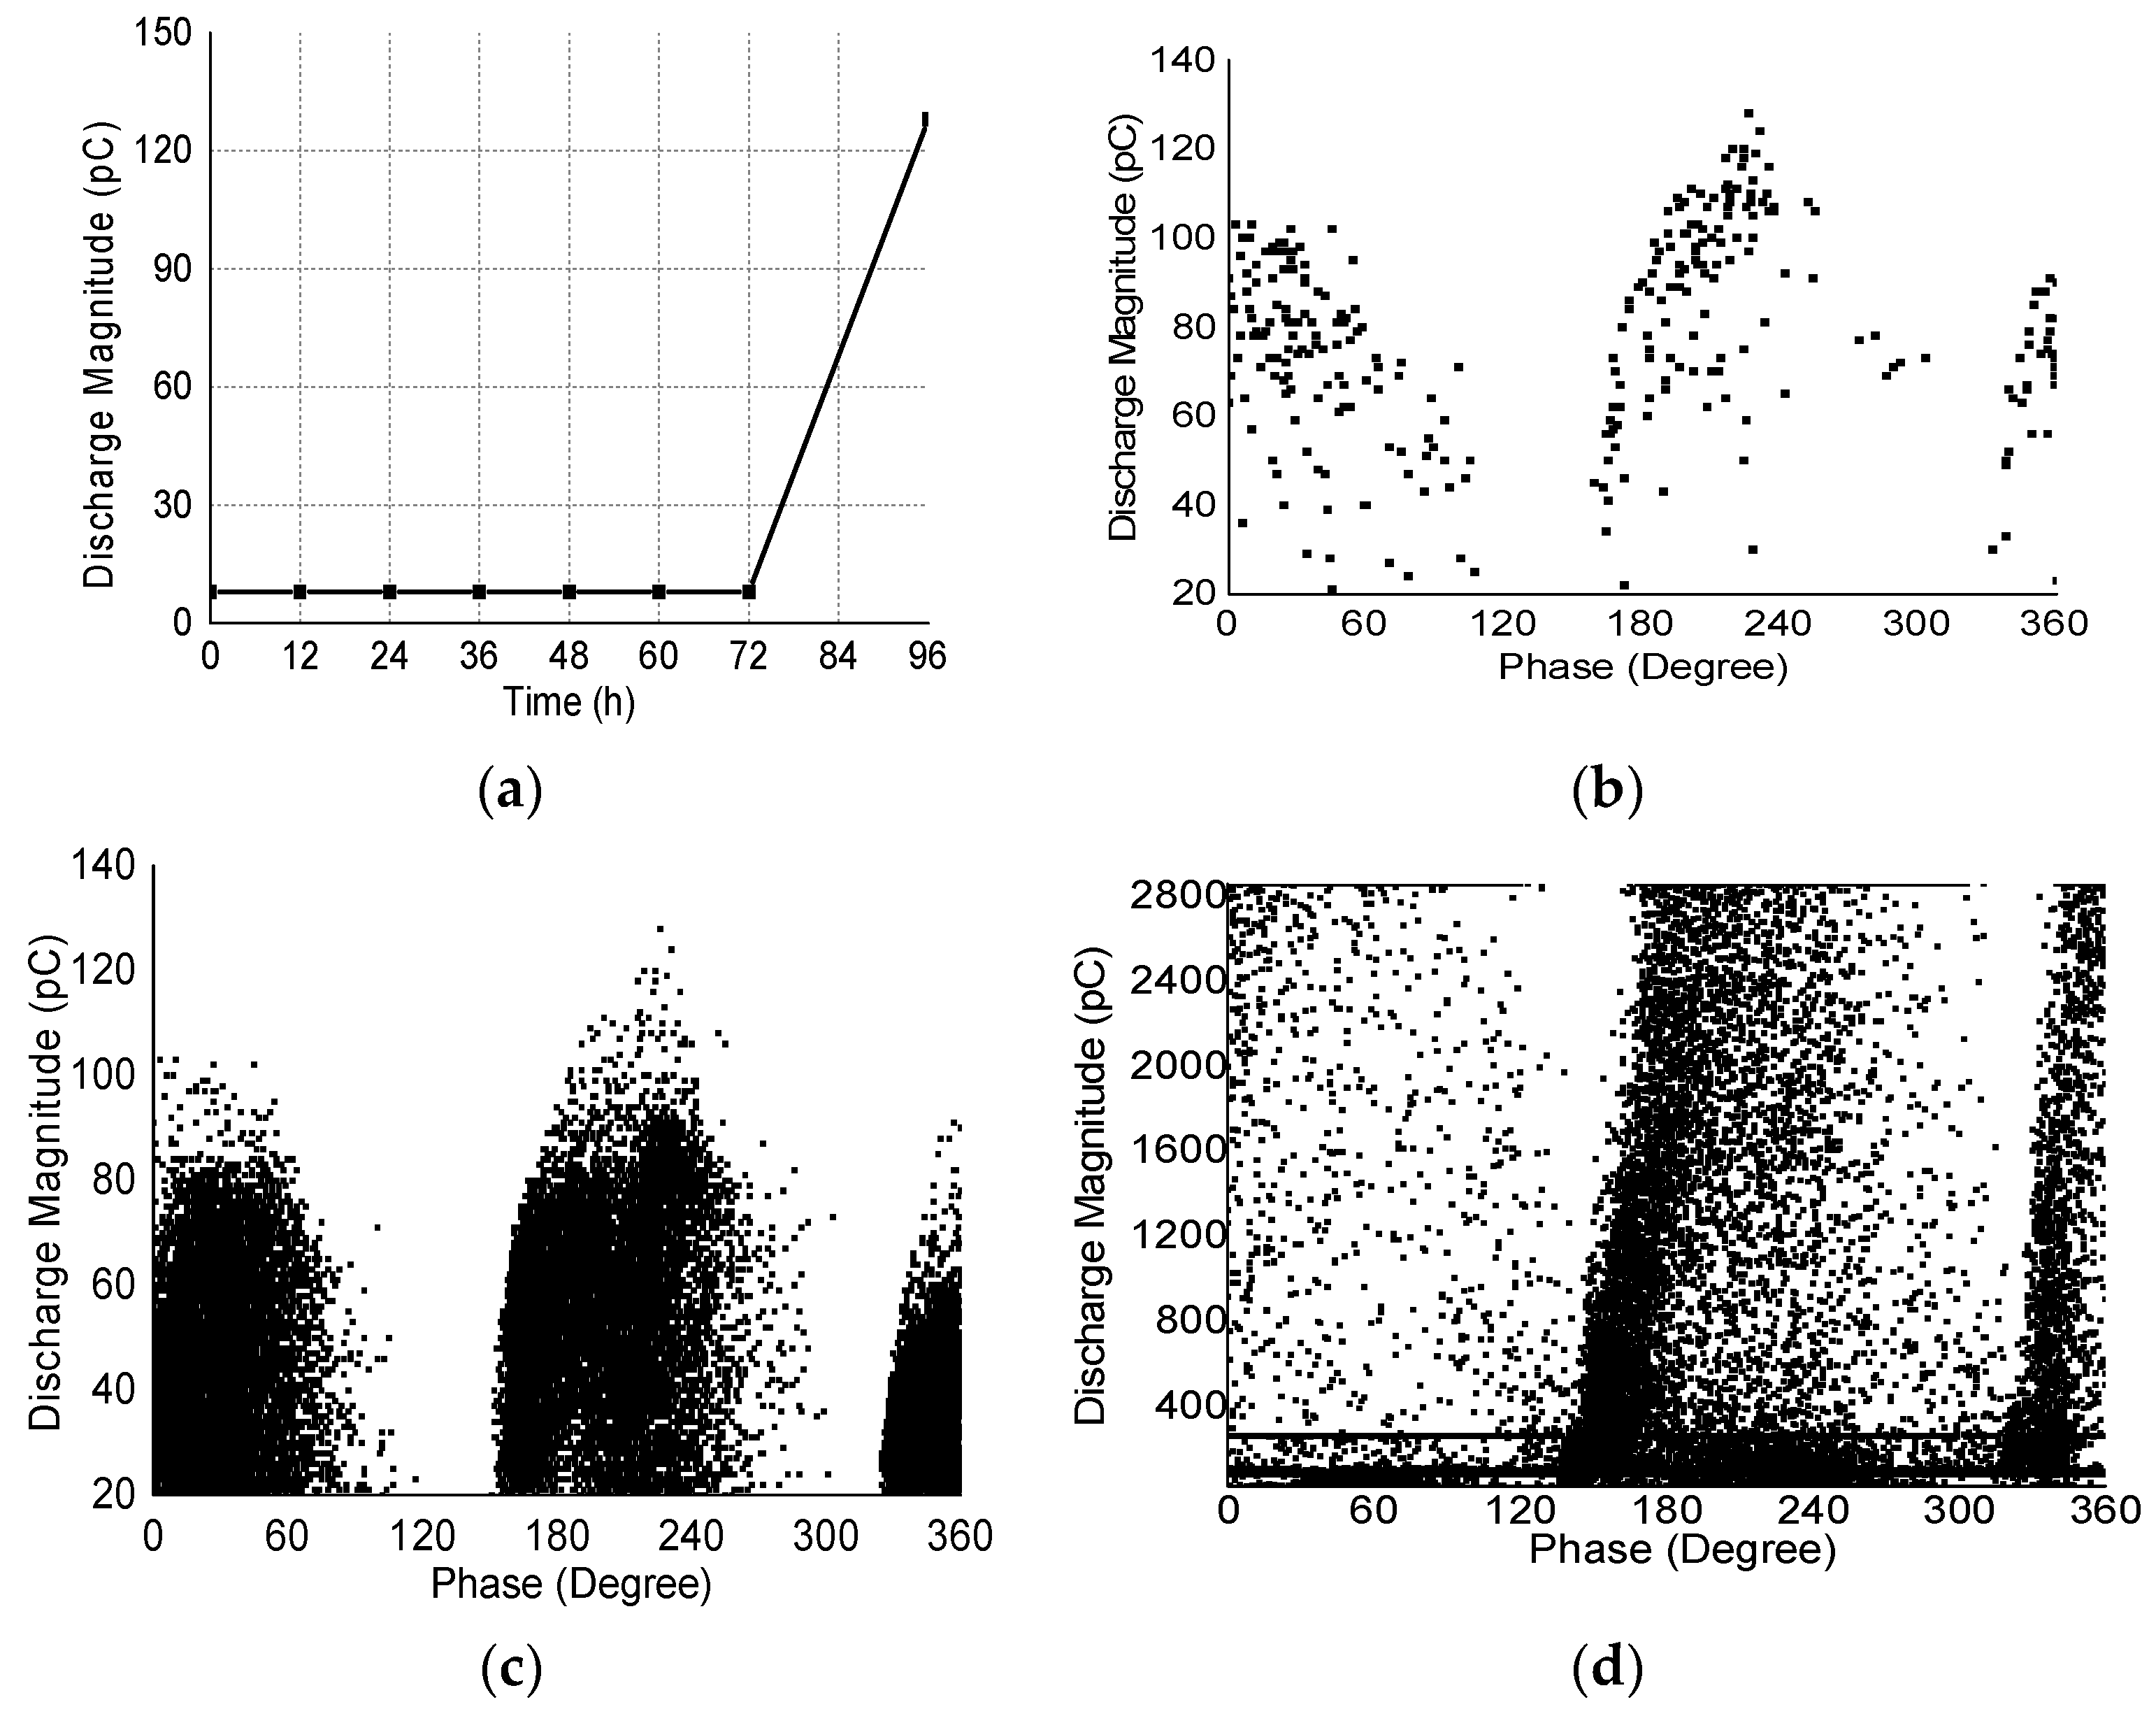
After MI from the top of the bushing model, the maximum value of PD was still less than 10 pC under the applied voltage of 30 kV at 72 h. However, as shown in
Figure 7a, prominent PD occurred under the voltage of 30 kV when the time is at 96 h. Within 1 min upon initiation of the PD, the phase resolved partial discharge (PRPD) pattern was presented in
Figure 7b, which shows a distributed scope of 0–107°, 159–303°, and 332–360°. In comparison, as demonstrated in
Figure 7c, the PRPD widened a little in the region of 0–117°, 151–303°, and 325–360° within 30 min after the initiation of the PD. As presented in
Figure 7d, the magnitude of the PD dramatically increased and exceeded 2856 pC at min 31 of PD initiation, while discharge flashover occurred at the same time. Then, the bushing model was dissected immediately.
3.5. Change of FDS
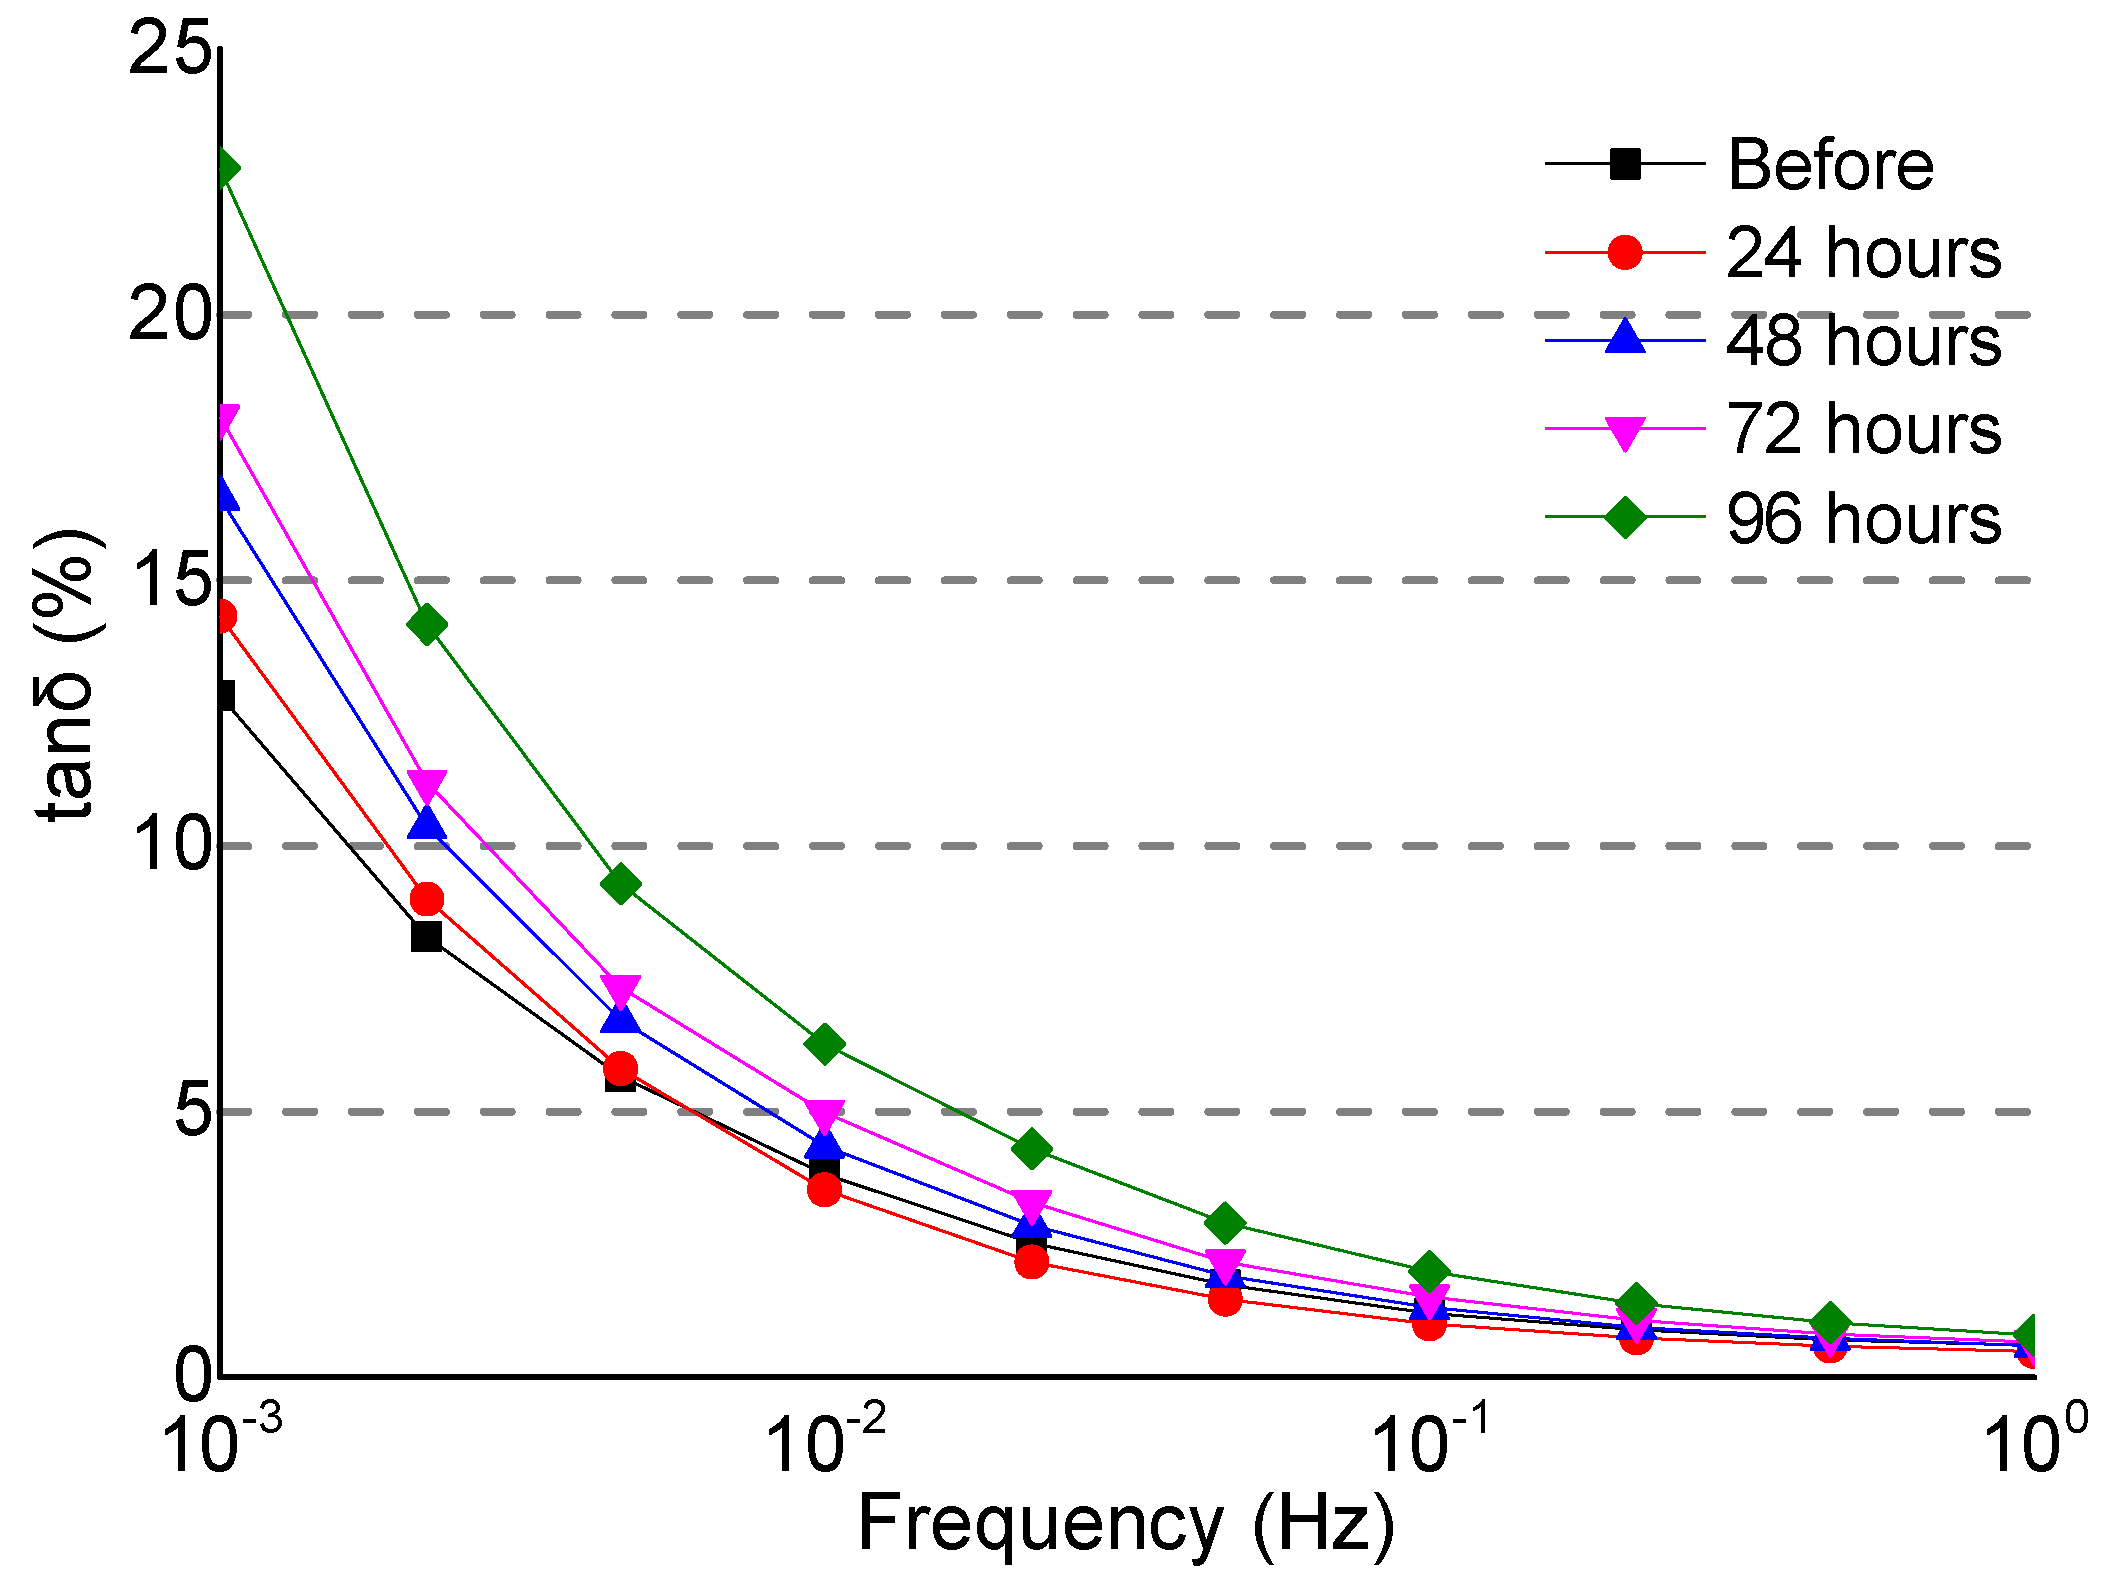
After the bushing model was damped at different times, parameters of tan from 0.001 to 1 Hz were measured and are presented in
Figure 8. The results show that the tanδ changed more obviously at the first 24 h of MI at 0.001 Hz than that at the 50 Hz. Given its higher sensitivity, it was suggested to measure the tanδ at 0.001 Hz for the diagnosis of early MI in the OIP bushing.
4. Fault Mechanism of Moisture Ingress into Oil-Impregnated Paper Bushing
4.1. Distribution of Moisture Content in Bushing
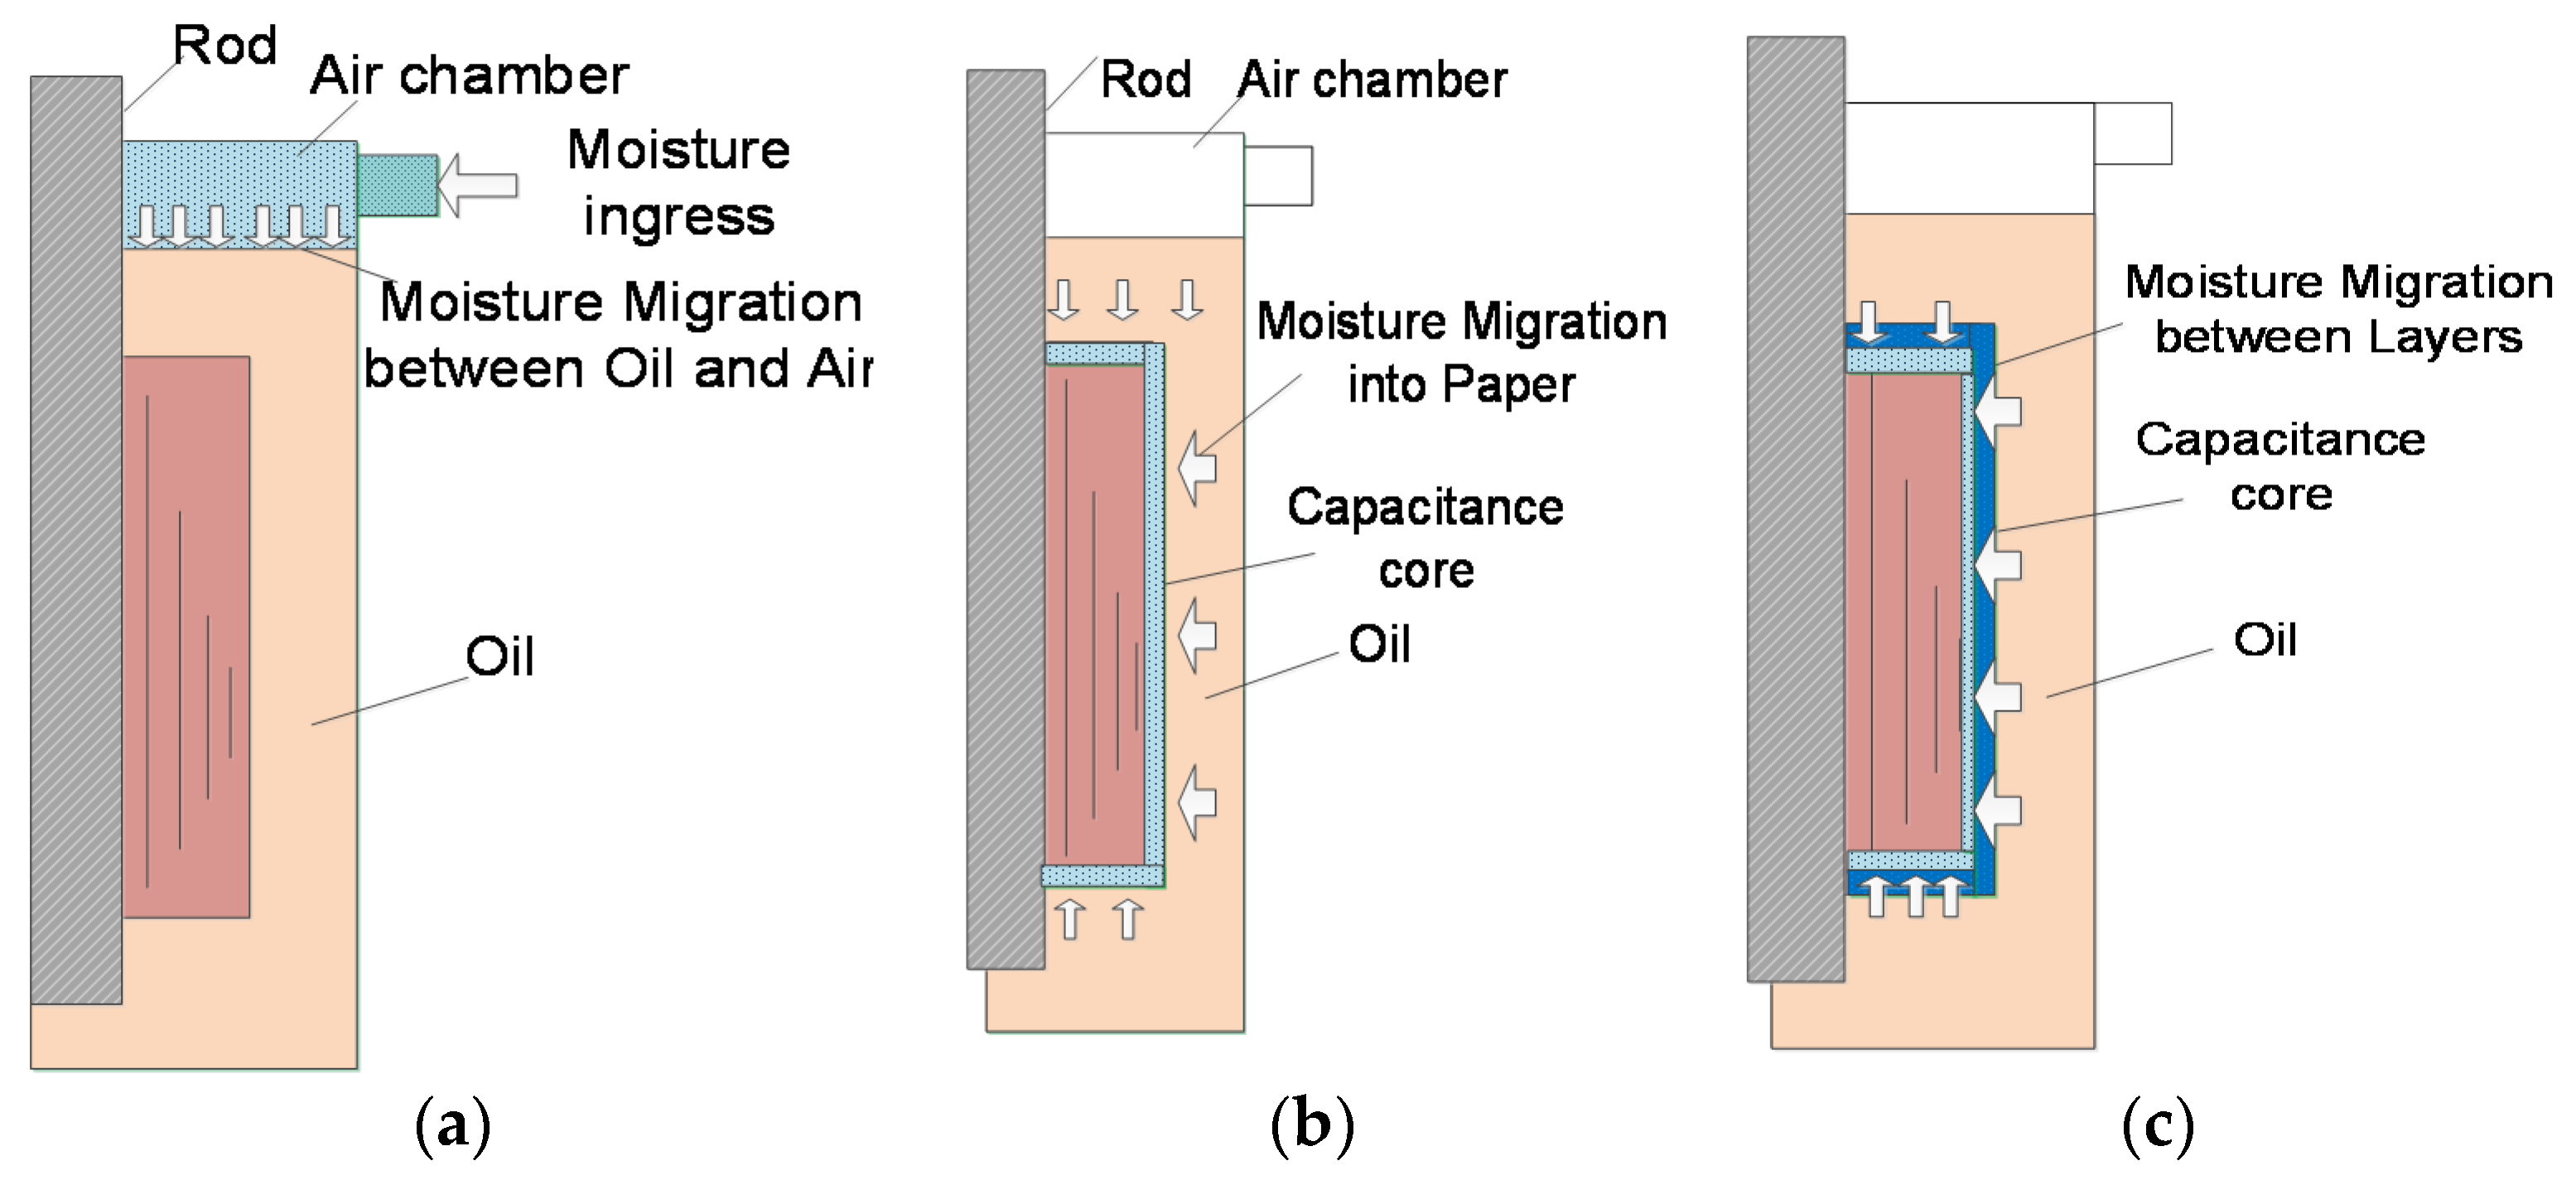
Atmosphere water is the main source of the bushing moisture defect. Atmosphere moisture invaded into the bushing from the crack on the top in the form of water molecules as a result of the gradient differences between the water concentration in the atmosphere and inside the top of the bushing. Firstly, due to its own gravity and the absorption by the oil in the bushing, the invaded moisture gradually deposits itself and dissolves in the transformer oil.
Secondly, the moisture could be migrating from the oil to the paper of capacitance core insulation. At last, the moisture in paper continued to migrating from the outer layers to the inner layers of the capacitance core insulation for the density gradient of moisture concentrations. In other words, the moisture in the humid atmosphere would be penetrating the inner insulation of the bushing via the weakest sealing point of the density gradient of moisture in various parts of bushings.
The migration path of moisture in the bushing was shown in
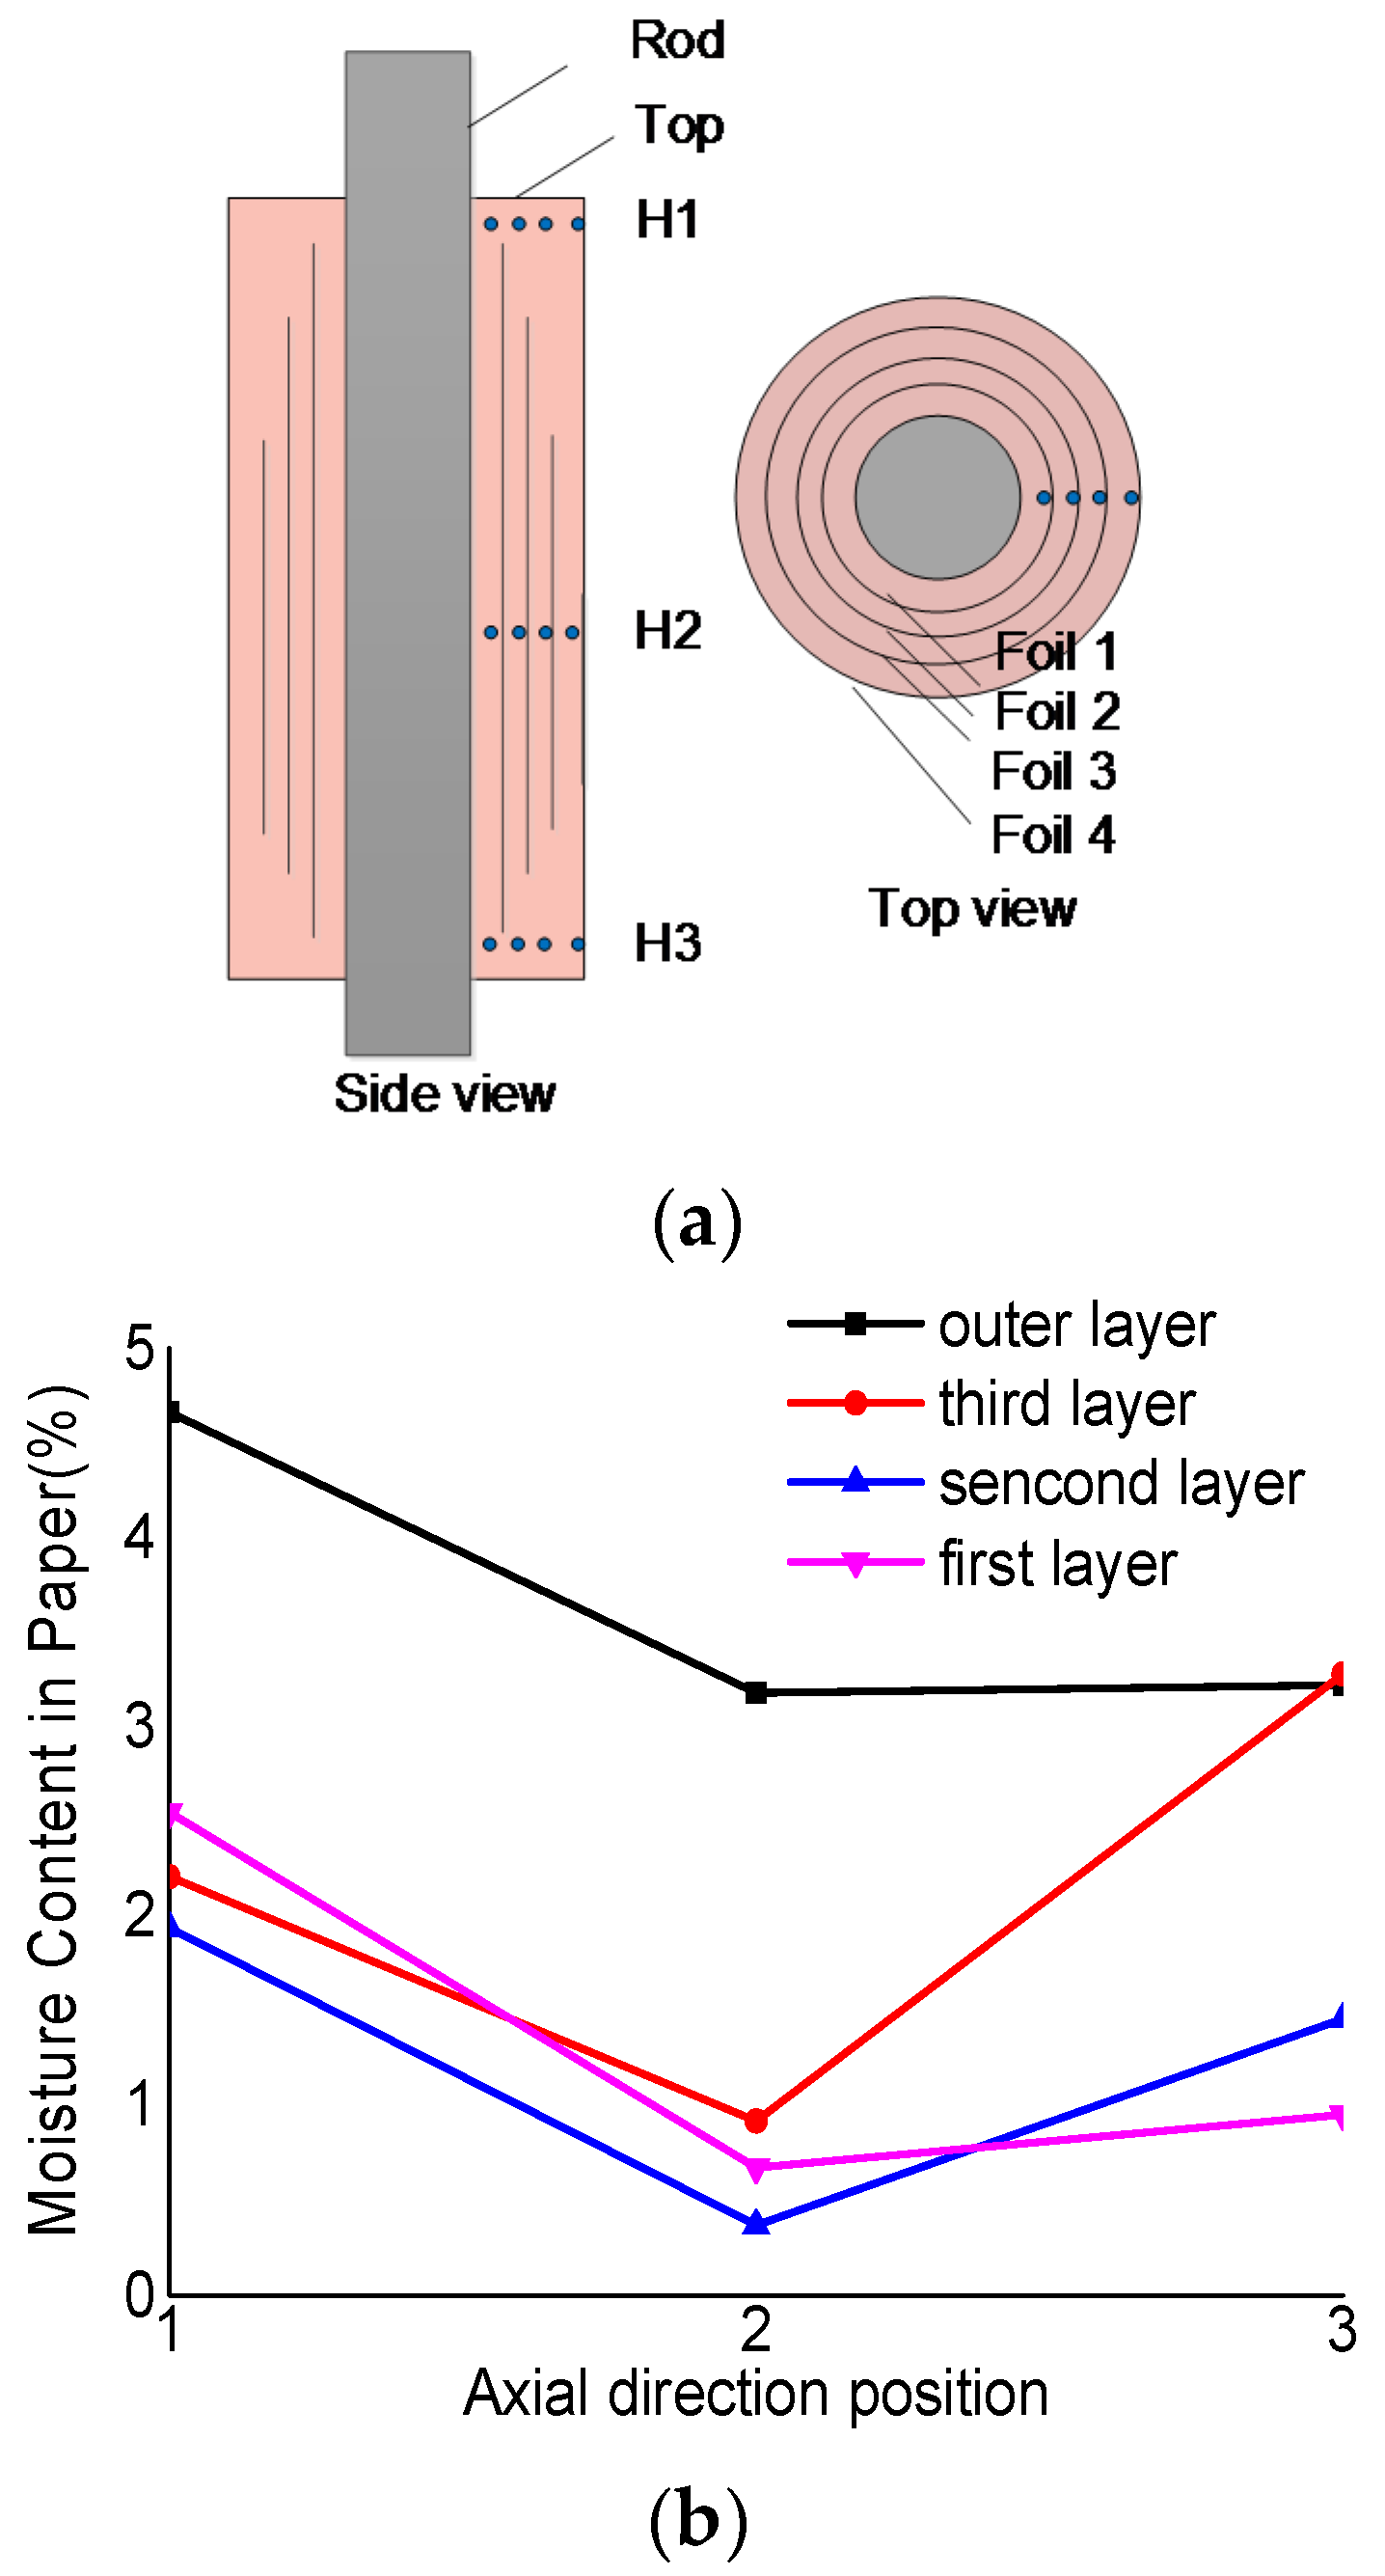
Figure 9. With the Karl–Fischer measurement instrument, the moisture content in the paper of the bushing cores were measured immediately after the PD mutation. Sampling points of the paper moisture measurement are shown in
Figure 10a,b, which involves three points in the axial direction and four points in the radial direction.
The distribution of the moisture in the paper of the bushing core was non-uniform and the moisture of the outer layer was higher than the inner ones. The moisture in the top and bottom parts of the bushing core was higher than in the middle part. Therefore, the highest concentration of moisture was expected at the outer surface of the core. The aluminum foil has important influence on the moisture migration between the layers of cores, which will prevent the moisture from migrating between the layers.
Moisture is one of the most harmful agents for cellulose insulation. Its presence accelerates the insulation aging process, reduces the dielectric margin, and decreases the PD inception voltage, which consequently increases the probability of unexpected failures.
From the distribution of the water concentration, it was inferred that the outer layer of the capacitance core constitutes the weakest dielectric point. The electric field strength at the foil edge was extremely higher than its other part in the bushing. Its distribution is also non-uniform. The PD incurred at the foil edge of the outer layer would be greatly harmful to the insulation of the bushing.
4.2. Discharge Path Initiated by MI into OIP Bushing
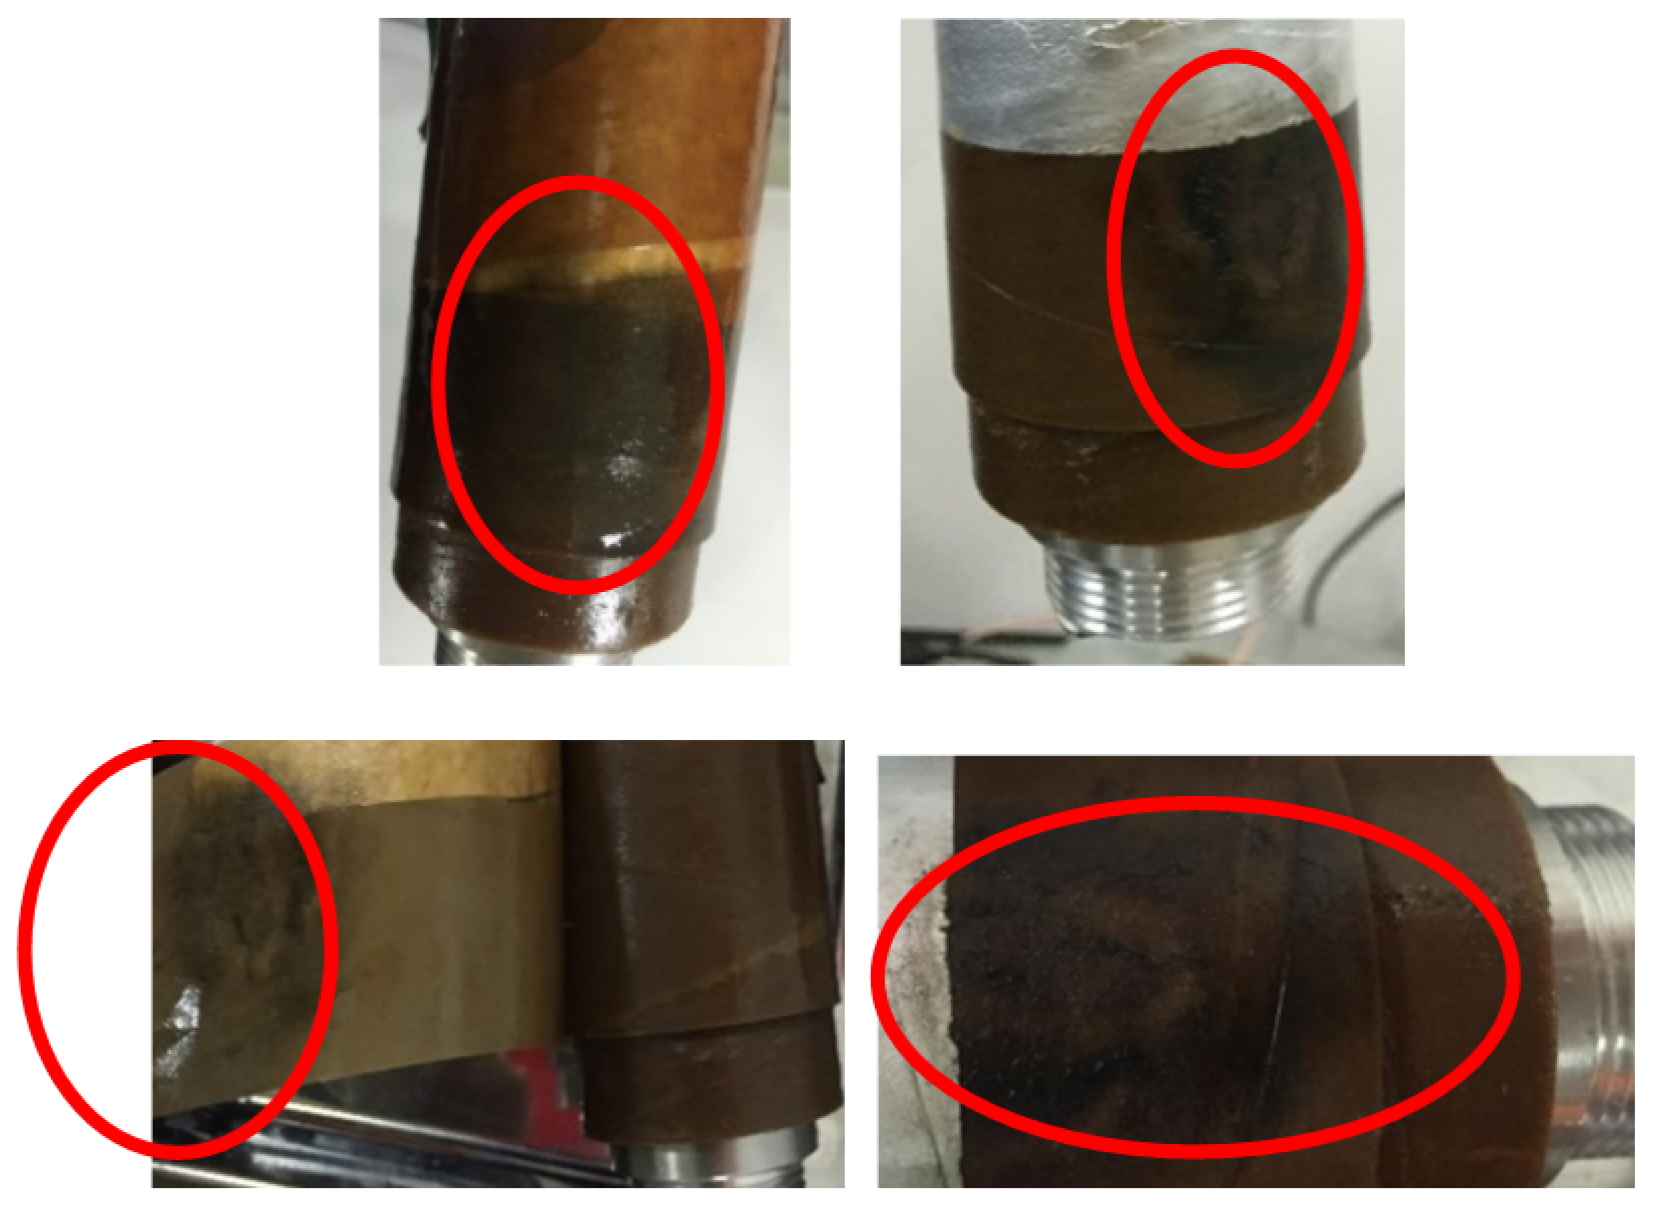
The bushing model was dissected immediately after the flashover discharge. One discharge point was found in the outer-layer foil edge of the bushing model, as illustrated by
Figure 11. The discharge path initiated by MI into the bushing was from the foil edge of the last layer along the surface of the paper to the current rod. It might be easy to break down along the axial direction of the paper surface instead of the radial direction in the paper layers of the cores for MI into the bushing.
The partial region of the capacitance cores are highly moistened by the MI. Thus the dielectric strength of the partially moistened region in the bushing might be weakened and even be developed to the flashover between the foil edge and the metal current rod. Therefore, the non-uniform moistened capacitance cores by MI should be diagnosed early for the safe and steady operation of OIP bushings.
5. Diagnosis of MI in Oil-Impregnated Paper Bushing
The power factor (PF) and capacitance are accepted for the condition evaluation of the bushing insulation. Conventionally, the insulation diagnostic tests of the dissipation factors and the capacitance are conducted at a power frequency of 50/60 Hz. However, the dissipation factor shows a lower sensitivity in the moisture content. In comparison, the lower frequency FDS as an accurate and non-destructive test method proves to be more sensitive in detecting and capturing the moisture defect dynamics in the bushing. Therefore, it was essential to measure the FDS increment at 0.001 Hz in order to identify the early moisture stage of the bushing, which may provide a reference for the condition monitoring and maintenance of the OIP in the power system.
5.1. New Features for Earlier Moisture Defection in OIP Bushing
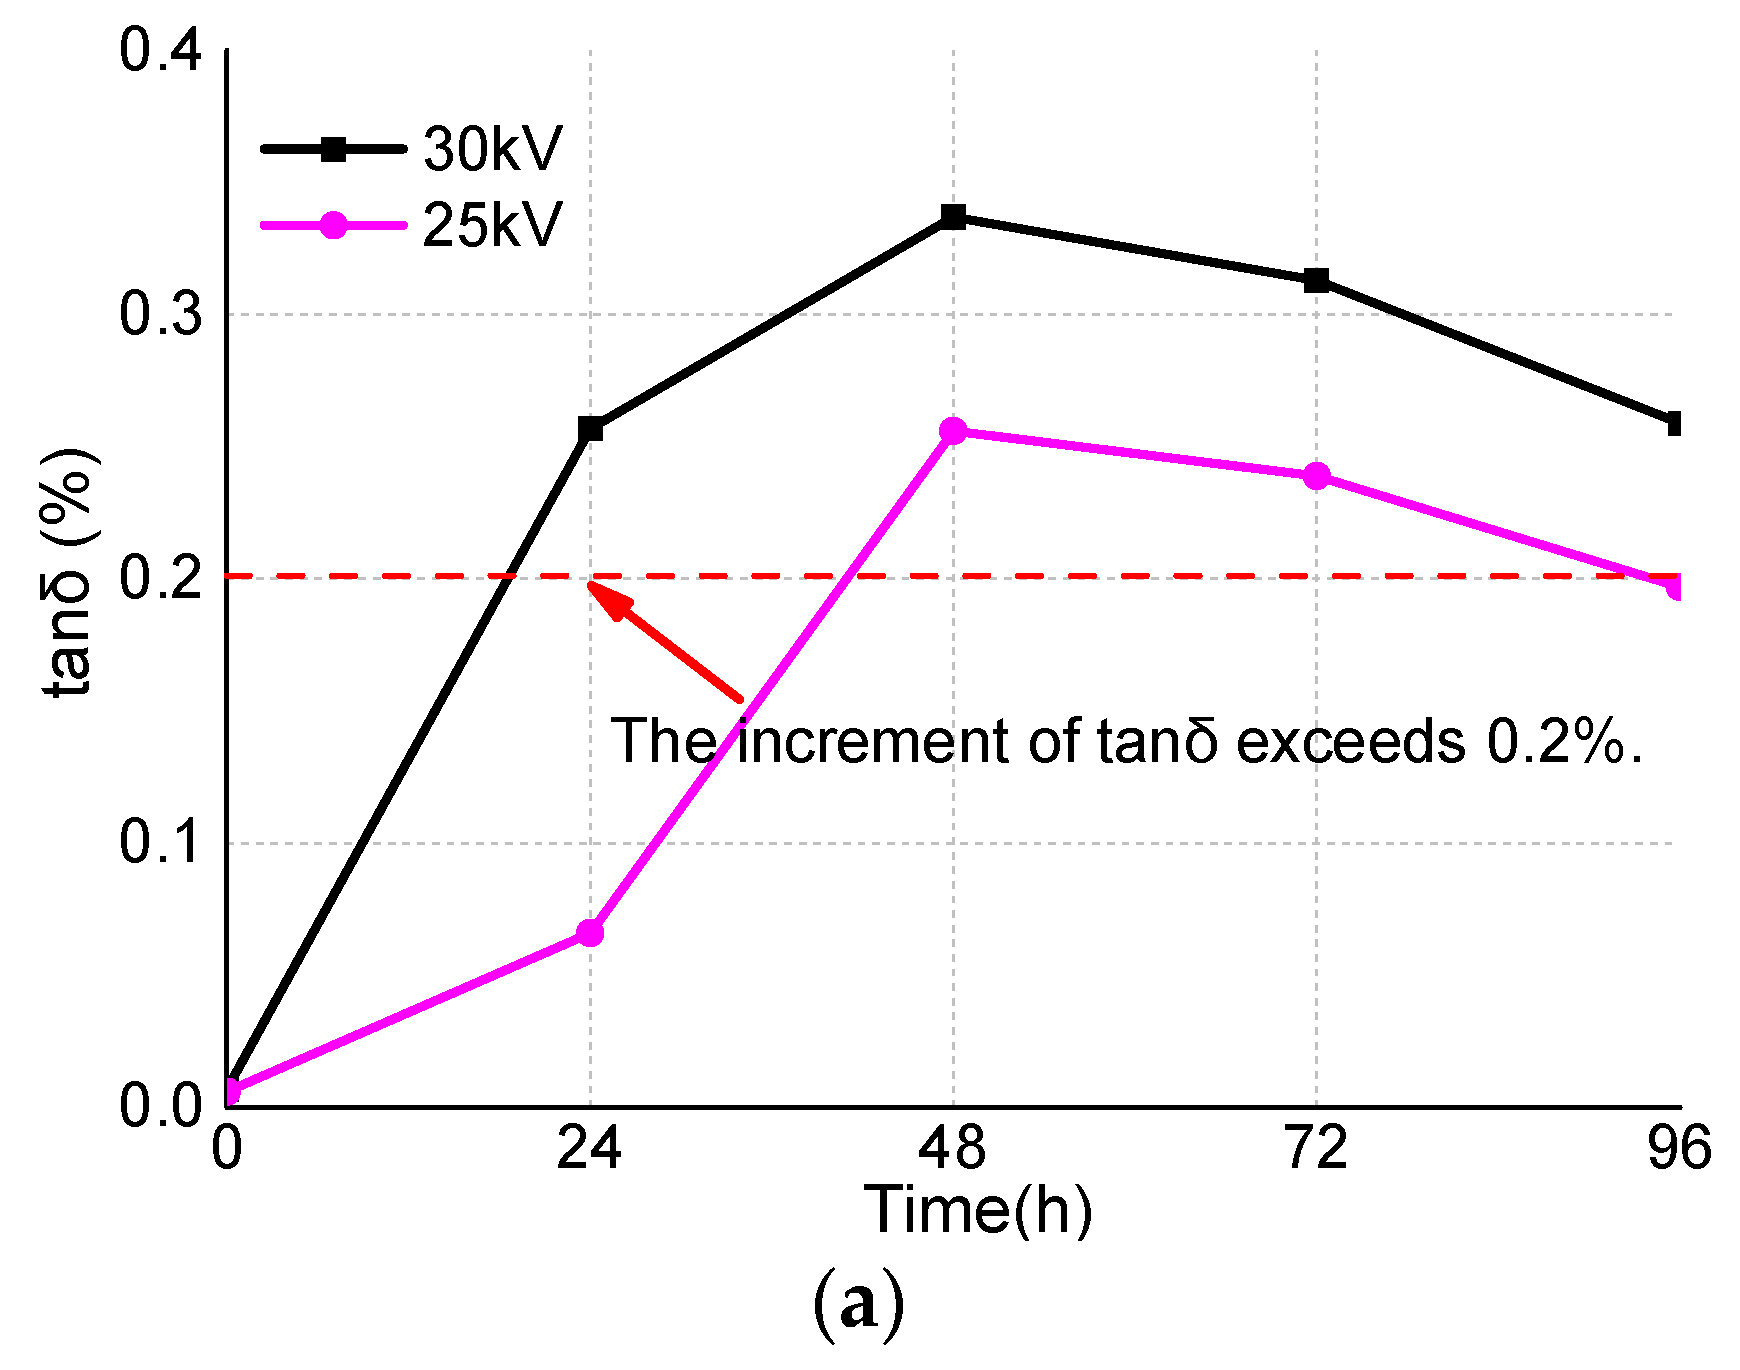
It is presented in
Figure 12a that the increment of tanδ from 10 to 25 kV under the highest voltage for equipment (U
m) only reached 0.06% at 24 h, while it exceeded 0.2% from 10 to 30 kV in the context of 1.2 U
m.
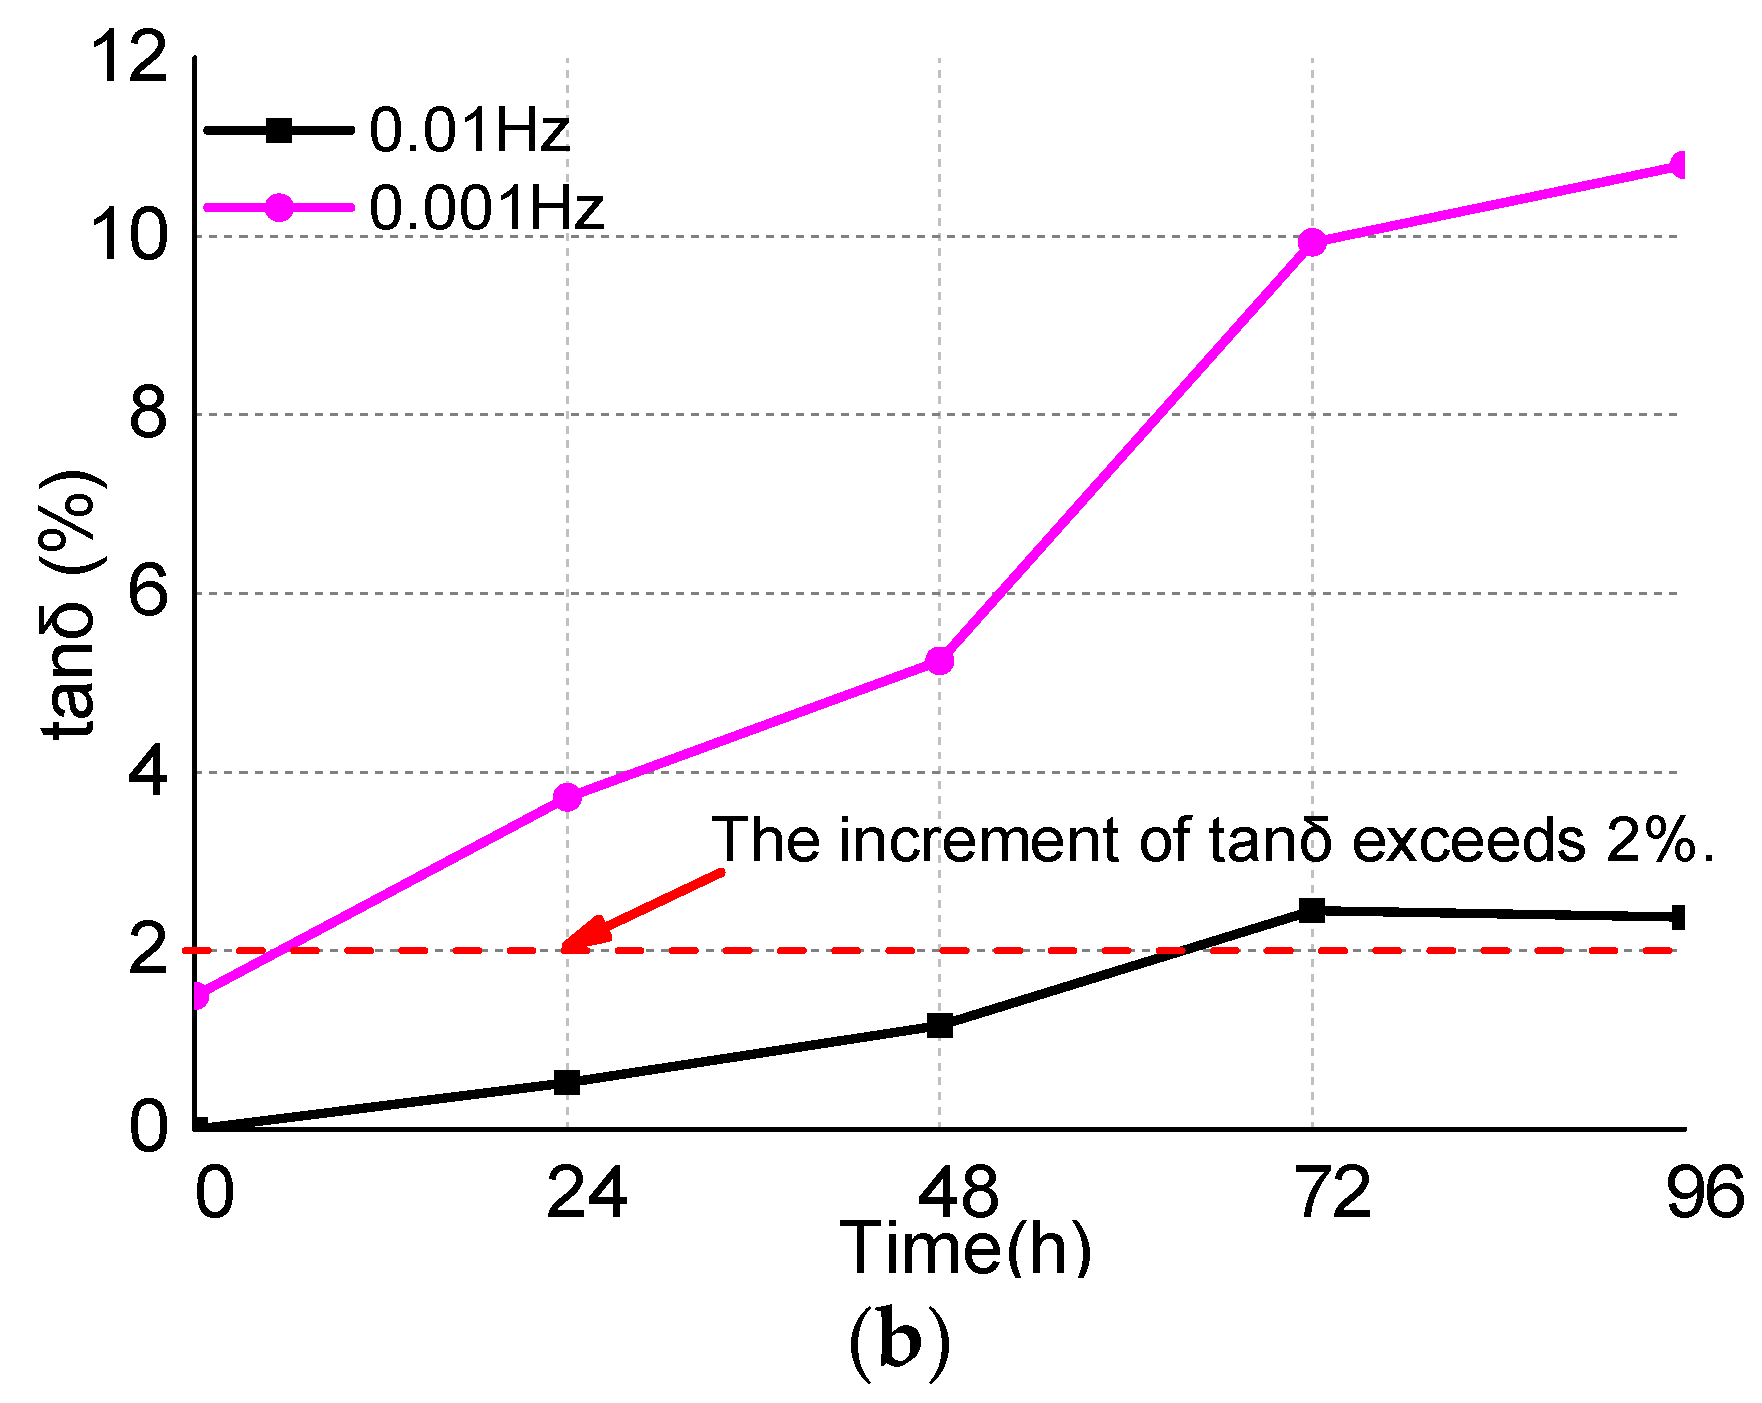
It could be seen from
Figure 12b that the tanδ increment was registered as only 0.52% at 0.01 Hz but >2% at 0.001 Hz. It was indicated that the dissipation factor increment under lower frequencies was more significant than under higher ones. Therefore, it is suggested that the tanδ increment >2% at 0.001 Hz be adopted as the new criteria for the detection of the moisture defect in the bushing.
Given that the increment of the dissipation factor at the voltage of 1.2 Um is more obvious compared to the lower voltages applied, it is suggested that the tanδ increment of 0.2% under 10 kV voltage (1.2 Um) be set as the new criteria for the early detection of MI into the bushing.
5.2. Deterioration State Diagnosis for Defects Initiated by MI in OIP Bushing
The development of insulation deterioration initiated by MI in the OIP bushing can be classified into three phases in reference to the distinctive characters of tanδ, PD, and FDS. As shown in
Table 1, the increment of tanδ at 0.001 Hz and from 10 kV to 1.2 U
m are key features for insulation deterioration. It falls into three stages: the normal state (S
1), initial moisture stage (S
2), and the severe fault stage (S
3).
In the S1 stage, there is not yet a PD occurrence at 1.2 Um. The increment value of tanδ at 0.001 Hz reads 2% and the same value under 10 kV of 1.2 Um is less than or equal to 0.2% at some temperature. In the S2 state, the tanδ increment was over 2% at 0.001 Hz and the tanδ value was over 1% under 1.2 Um at temperature. No PD occurrence was witnessed at 1.2 Um. In the S3 state, the PD was incurred obviously in the form of surface discharge and concentrated around the phases of 0–117°, 151–303°, and 325–360°. It represents the most severe insulation deterioration in the bushing. The total quantity and distribution of MI into the paper were different between S1, S2, and S3. The the moisture content was increasing from S1 to S2, from S2 to S3.
For the operative bushings, the FDS measurement at the frequency of 1 mHz and 10 kHz was recommended firstly as the lossless detection method. The increasing values of tanδ at the frequency of 1 mHz between 24 h could be the diagnostic basis for the wetting stage of the bushing at some temperature. Then, if the value of tanδ at the frequency of 1 mHz was exceeding the criterion, it could be recommended to return to the factory and measure the PD for further inspection.
6. Conclusions
The characteristics and mechanism of insulation deterioration caused by MI in the OIP bushing were observed and analyzed in this paper, which could provide a useful reference for the condition monitoring and fault diagnosis of the OIP bushing.
Under the current model, the moisture in the oil and paper of the bushing would be increasing and the insulation strengths of the bushing would be weakening until insulation failure after MI into the bushing. At the declining stage of the moisture in oil, the pulse of PD occurred obviously and increased rapidly until the surface flashover.
The distribution of moisture in the capacitance core of the bushing was extremely non-uniform in the capacitance core after MI into the bushing. The aluminum foil has important influences on the moisture migration between the layers of cores, which prevents the moisture from migrating between layers. It might be easy to breakdown along the axial direction of the paper surface instead of the radial direction in the paper layers of the cores for MI in the bushing.
The increment of tanδ at the frequency of 0.001 Hz under 200 V and 50 Hz under 1.2 Um should be suggested as the new referential method for early diagnosis of insulation by MI in the bushing. The phases of PD could be diagnosed for moisture defect of the capacitance cores in the bushing. Especially for the operative bushings, the increment detection of FDS at the frequency of 1 mHz and 10 kHz was recommended firstly as the lossless detection method.
Author Contributions
B.Q. and Q.D. designed the methodology and wrote the manuscript. C.L. and M.F. conceived and design the experiments. Z.Z. and R.Z. implemented the experiments. All authors contributed improving the quality of the manuscript.
Acknowledgments
The authors would like to thank National Natural Science Foundation of China (51477052), National Key R&D Program of China (2017YFB0902704) and China Southern Power Grid Research Program (K-KY2014-002), as well as the reviewers for reviewing the manuscript.
Conflicts of Interest
The authors declare no conflict of interest. The founding sponsors had no role in the design of the study; in the collection, analyses or interpretation data; in the writing of the manuscript; nor in the decision to publish the results.
References
- Lachman, M.F.; Walter, W.; von Guggenberg, P.A. On-line diagnostics of high-voltage bushings and current transformers using the sum current method. IEEE Trans. Power Deliv. 2000, 15, 155–162. [Google Scholar] [CrossRef]
- Braun, J.M.; Densley, R.J.; Sedding, H.G.; Biksa, V.; Yung, C.; Bialek, T.; Nothelfer, A.; Sharp, R. Accelerated Aging and Diagnostic Testing of 115 kV Type U Bushings. In Proceedings of the Conference Record of the 2000 IEEE International Symposium on Electrical Insulation, Anaheim, CA, USA, 5 April 2000; pp. 469–472. [Google Scholar]
- Gubanski, S.M.; Boss, P.; Csépes, G.; der Houhanessian, V.; Filippini, J.; Guuinic, P.; Gafvert, U.; Karius, V.; Lapworth, J.; Urbani, G.; et al. Dielectric response methods for diagnostics of power transformers. IEEE Electr. Insul. Mag. 2003, 9, 12–18. [Google Scholar]
- Setayeshmehr, A.; Fofana, I.; Eichler, C.; Akbari, A.; Borsi, H.; Gockenbach, E. Dielectric spectroscopic measurements on transformer oil-paper insulation under controlled laboratory conditions. IEEE Trans. Dielectr. Electr. Insul. 2008, 15, 1100–1111. [Google Scholar] [CrossRef]
- Zhang, S. Evaluation of Thermal Transient and Overload Capability of High-Voltage Bushings with ATP. IEEE Trans. Power Deliv. 2009, 24, 1295–1301. [Google Scholar] [CrossRef]
- Blennow, J.; Ekanayake, C.; Walczak, K.; Garcia, B.; Gubanski, S.M. Field experiences with measurements of dielectric response in frequency domain for power transformer diagnostics. IEEE Trans. Power Deliv. 2006, 21, 681–688. [Google Scholar] [CrossRef]
- Lokhanin, A.K.; Shneider, G.Y.; Sokolov, V.V.; Chornogotsky, V.M. Internal Insulation Failure Mechanisms of HV Equipment under Service Conditions; CIRGE: Paris, France, 2002. [Google Scholar]
- Saha, T.K.; Purkait, P.; Muller, F. Deriving an equivalent circuit of transformers insulation for understanding the dielectric response measurements. IEEE Trans. Power Deliv. 2005, 20, 149–157. [Google Scholar] [CrossRef]
- Setayeshmehr, A.; Akbari, A.; Borsi, H.; Gockenbach, E. On-line monitoring and diagnoses of power transformer bushings. IEEE Trans. Dielectr. Electr. Insul. 2006, 13, 608–615. [Google Scholar] [CrossRef]
- Dai, Q.; Qi, B.; Zhou, R.; Pan, Q.; Zhu, K.; Li, C.; Fu, M. The influence of mass moisture invading on electrical features for oil-impregnated paper bushing. In Proceedings of the 2016 IEEE Conference on Electrical Insulation and Dielectric Phenomena (CEIDP), Toronto, ON, Canada, 16–19 October 2016; pp. 319–322. [Google Scholar]
- De Rybel, T.; Singh, A.; Vandermaar, J.A.; Wang, M.; Marti, J.R.; Srivastava, K.D. Apparatus for Online Power Transformer Winding Monitoring Using Bushing Tap Injection. IEEE Trans. Power Deliv. 2009, 24, 996–1003. [Google Scholar] [CrossRef]
- Wańkowicz, J.; Bielecki, J.; Szrot, M.; Malewski, R. HV Bushing Failure in Service, Diagnostics and Modeling of Oil-Type Bushings; CIGRE: Paris, France, 2010. [Google Scholar]
- Smith, D.J.; Mcmeekin, S.G.; Stewart, B.G.; Wallace, P.A. A dielectric frequency response model to evaluate the moisture content within an oil impregnated paper condenser bushing. IET Sci. Meas. Technol. 2013, 7, 223–231. [Google Scholar] [CrossRef]
- Kruger, M.; Kraetge, A.; Koch, M. New Diagnostic Tools for High Voltage Bushings; CIGRE: Paris, France, 2010. [Google Scholar]
- Sokolov, V.V. Considerations on power transformer condition based maintenance. In Proceedings of the EPRI Substation Equipment Diagnostic Conference VIII, New Orleans, LA, USA, 20–23 February 2000. [Google Scholar]
- Sokolov, V.V.; Vanin, B.V. Evaluation and identification of typical defects and failure-modes of 110–750 kV bushings. In Proceedings of the Sixty-Fourth Annual International Conference of Doble Clients; 1997. Section 3.3. Available online: http://www.cgti.org.br/publicacoes/wp-content/uploads/2015/10/FALHAS_bushings.pdf (accessed on 1 May 2018).
© 2018 by the authors. Licensee MDPI, Basel, Switzerland. This article is an open access article distributed under the terms and conditions of the Creative Commons Attribution (CC BY) license (http://creativecommons.org/licenses/by/4.0/).
