Article

Flow Simulation of Artificially Induced Microfractures Using Digital Rock and Lattice Boltzmann Methods

1
Research Centre of Multiphase Flow in Porous Media, China University of Petroleum (East China), Qingdao 266580, Shandong, China
2
Institute of Petroleum Engineering, Heriot-Watt University, Riccarton, Edinburgh EH14 4AS, UK
3
Department of Chemical and Petroleum Engineering, University of Calgary, Calgary, Alberta T3A 6C9, Canada
4
Hydrosciences Montpellier, Université Montpellier, CNRS, IRD, 300 Avenue du Pr. Emile Jeanbrau CC57, 34090 Montpellier, France
*
Author to whom correspondence should be addressed.
Energies 2018, 11(8), 2145; https://doi.org/10.3390/en11082145
Submission received: 5 July 2018 / Revised: 31 July 2018 / Accepted: 9 August 2018 / Published: 17 August 2018

Abstract

:
Microfractures have great significance in the study of reservoir development because they are an effective reserving space and main contributor to permeability in a large amount of reservoirs. Usually, microfractures are divided into natural microfractures and induced microfractures. Artificially induced rough microfractures are our research objects, the existence of which will affect the fluid-flow system (expand the production radius of production wells), and act as a flow path for the leakage of fluids injected to the wells, and even facilitate depletion in tight reservoirs. Therefore, the characteristic of the flow in artificially induced fractures is of great significance. The Lattice Boltzmann Method (LBM) was used to calculate the equivalent permeability of artificially induced three-dimensional (3D) fractures. The 3D box fractal dimensions and porosity of artificially induced fractures in Berea sandstone were calculated based on the fractal theory and image-segmentation method, respectively. The geometrical parameters (surface roughness, minimum fracture aperture, and mean fracture aperture), were also calculated on the base of digital cores of fractures. According to the results, the permeability lies between 0.071–3.759 (dimensionless LB units) in artificially induced fractures. The wide range of permeability indicates that artificially induced fractures have complex structures and connectivity. It was also found that 3D fractal dimensions of artificially induced fractures in Berea sandstone are between 2.247 and 2.367, which shows that the artificially induced fractures have the characteristics of self-similarity. Finally, the following relations were studied: (a) exponentially increasing permeability with increasing 3D box fractal dimension, (b) linearly increasing permeability with increasing square of mean fracture aperture, (c) indistinct relationship between permeability and surface roughness, and (d) linearly increasing 3D box fractal dimension with increasing porosity.

1. Introduction

The study of fractures has great importance in performing the following tasks: (a) properly characterizing and developing fractured oil and gas reservoirs, (b) nuclear-waste repository performance-assessment studies, (c) geothermal energy development, (d) studies of groundwater contamination, etc. In oil and gas development, microfractures are divided into natural microfractures and induced microfractures. Inducing fractures by hydraulic fracturing is one of the main methods to increase production. The existence of induced fractures will affect the fluid-flow system (expand the drainage radius of production wells), and act as flow paths for the leakage of fluids injected to the wells, and even facilitate depletion in tight reservoirs. Therefore, the characteristic of the flow in artificially induced fractures is of great significance.
Significant attention has been paid to the analysis of the microflow mechanism in fractures. The effect of fracture size and data uncertainties on fractured-rock permeability was analyzed by Sagar et al. [1]; the parameters influencing the interaction among closely spaced hydraulic fractures were reported by Bunger [2]; the hydraulic conductivity of rough fracture surface was studied by References [3,4,5]. It is well known that the flow in fractures is influenced by many factors [6], such as: (1) flow behavior through single fractures, (2) fracture network pattern, and (3) in situ stress system. It can be found that the induced fractures are composed of many intersected single fractures. The flow and stress-coupling characteristics of a rock depend largely on the behavior of the fluid flowing through a single fracture. Hence, the study of fluid flow through single fractures is essential.
Research on the flow through single fractures has been extensive and has led to a general understanding that the fractures in reservoirs are usually rough and it is impossible to put forward a fixed value of a fracture aperture. Therefore, the validity of the cubic law [7] is inappropriate for this case.
Q / Δ h = γ 12 μ w L b 3  
where Q, w, b, L, Δh, γ, and μ represent the linear fluid-flow rate, fracture width, fracture aperture, fracture length, total hydraulic head drop along the length of the fracture, weight of the flowing fluid, and the dynamic viscosity of the flowing fluid, respectively.
For rough fractures, various methods have been proposed. The roughness was incorporated into cubic-law simulations by many studies [8,9,10]: fractal theory was used to generate fracture models with different roughness [11], and the aperture of the idealized parallel smooth fracture was also replaced by the hydraulic aperture in many reports [12,13,14]. But so far none of these methods is unanimous.
The Lattice Boltzmann method (LBM) is a discrete approximation of the incompressible Navier–Stokes (N-S) equations based on kinetic theory [15]. This method is becoming a strong tool to simulate fluid flow in complex geometries. Besides, numerous studies extended LBM to perform the simulations from a microscale to a macroscale, which made it possible for LBM to be widely used. LBM has also been used to analyze the influence of wettability on fluid flow based on an ideal model [16] or generated self-affine rough fracture [17]. However, there were few reports on fluid-flow simulations in real three-dimensional (3D)-induced rough fractures based on LBM. A characterization of the flow simulations considering real rough-walled fractures is significant to many studies, such as the mechanical properties and transport properties of fractures [18].
Researchers made use of many techniques to obtain the structure of fractures in rocks, such as stylus profilemeters [19,20], surface laser scanning [21,22], nuclear magnetic-resonance imaging [14,23], and computed tomography (CT) scanning [3,24,25]. CT scanning and nuclear magnetic-resonance imaging are two methods by which we can get the structure of fractures without destroying the core.
The CT scanning method, which is known as X-ray computed tomography, can detect the inner structure of nontransparent objects without damage. Because the different components of the rock have different densities, which result in different X-ray absorption coefficients, the skeleton and pore space of rocks can be distinguished. CT scanning was applied widely on the characterization of fractures [26,27,28,29,30]. OP Wennberg et al. scanned the core samples to investigate the effect of natural open fractures on reservoir flow [31]; precise 3D numerical modeling was coupled with X-ray CT to analyze the heterogeneous fracture flow as well as measure porosity and permeability [32]. The X-ray CT scanning experiment is the most accurate and direct method for establishing a 3D digital core, which provides a basis for quantitative analysis and flow simulation of fractures.
In this study, LBM is used to simulate single-phase fluid flow through nine 3D actual fractures and calculate the equivalent permeability of the digital cores. Based on fractal theory, the fractal dimensions of artificially induced fractures in Berea sandstone are calculated. The geometric parameters (porosity, surface roughness, and mean fracture aperture) of the digital cores were calculated. Besides, the following relations were studied: (a) permeability versus 3D box fractal dimension in induced fractures, (b) permeability versus surface roughness, (c) permeability versus mean fracture aperture, and (d) 3D box fractal dimension versus porosity, etc. Finally, partial least square (PLS) regression was applied to observe the marginal effect of each independent variable (3D box fractal dimension, mean fracture aperture, surface roughness and minimum fracture aperture) in explaining permeability.

2. Methodology

2.1. The 3D Digital Core

The 3D digital core is a 3D digital image of the rock, which reflects the microscopic pore structure of the rock on the pore scale. In 2003, Dvorki et al. put forward the concept of Digital Rock Physics (DRP) technology, which is based on the 3D digital core and uses the numerical simulation algorithm to accurately calculate the acoustic, electrical, nuclear magnetic resonance, and seepage characteristics of the rock [33]. Compared to petrophysics experiments, DRP experiments are fast and low in cost. They can simulate different rock physical properties based on the same 3D digital core, and it is easy to analyze the correlation between different physical attributes.
The common methods for constructing a 3D digital core are divided into two types: an X-ray CT-scanning experiment and reconstruction method based on a couple of two-dimensional (2D) images. The reconstruction method based on 2D images is not accurate when compared with an X-ray CT-scanning experiment because the 2D images contain less information of the pore structure. The X-ray CT-scanning experiment is the most accurate and direct method for establishing a 3D digital core, although the capacity of pore recognition is limited by the resolution of the instrument. The schematic diagram is shown in Figure 1.
An X-ray CT-scanning experiment was conducted to construct the 3D digital cores of the fractured cores, which are Berea sandstones with an induced fracture. The fracture was artificially induced using a modified Brazilian technique, which was created by Karpyn et al. [34].

2.2. Fractal Theory and Fractal Dimension

2.2.1. The Concept of “Fractals”

In 1967, Mandelbrot published the title of "How long is the British coastline?” in the journal Science [35]. Comparing the photo of 100 kilometers of the coastline in the air to the enlarged 10 kilometers of the coastline, he found that the two pictures were very similar; Mandelbrot called the part, similar to the whole phenomenon, as the “Fractal”.
Fractals include regular fractals and irregular fractals. Regular fractals can be generated by simple iterations or by certain rules, such as the Cantor set and Koch curve; the self-similarity and scaling invariance of the regular fractal are theoretically infinite. Irregular fractals refer to randomly generated nonsmooth fractal objects that have statistical self-similarity. Porous media are a kind of irregular fractal object, the fractal research of which has been various [36,37,38,39,40].

2.2.2. The Box-Counting Method and Fractal Dimension

The box-counting method is one of the most familiar methods of calculating the fractal dimension. In the past 20 years, the box-counting method has been applied to various subjects, such as medical studies, physical studies, and chemical studies.
The box-counting method is implemented by covering the function with a grid of identical square boxes and counting the number of boxes intersecting the function as a function of the box size [41,42].
N ( r ) = 1 r D f = r D f  
D f = ln N ( r ) ln ( 1 / r )  
In Equation (3), D f is called the fractal dimension (also called Hausdorff dimension); the fracture is covered with different box sizes r , and the resulting number of boxes N ( r ) , and the corresponding box sizes can be used to compute the fractal dimension.
Fractal dimension is the most important concept and content in fractal theory, and which is proposed by Mandelbrot for the study of complexity and the nondifferentiability (at everywhere) of surface curves. Fractal dimension is the main tool to characterize the complex structure of the fractal object, and the introduction of which is the novelty of fractal theory. It can be easily noticed from existing fractal research that the relationship between the fractal dimensions of the research objects and other physical parameters is the focus of many studies [43,44].
The 2D box fractal dimension was extended to 3D in this work to fully characterize fractures, and then 3D fractal dimensions of artificially induced fractures in Berea sandstone were calculated.

2.3. The Calculating of Permeability by LBM

The LBM is applied to the numerical simulations of different physical phenomena and is the primary domain of application is fluid dynamics. The advantage of the LBM is based on its ability to easily simulate complex practical problems in simulation. To calculate the dimensionless equivalent permeability of fractures by LBM, the binary data of digital cores were the input file of the program.
In the present work, the D3Q19 lattice model was used [45]. Where D represents the space dimension, Q represents the number of discrete velocity vectors. The distribution function, fi(x) (at each site x, for each lattice vector ei), stands for the average movement of fluid particles. Figure 2 illustrates the numerical model of LBM. The Lattice Bhatnagar–Gross–Krook (LBGK) approximation was applied for distribution function at time t [45]:
f i ( x + e i Δ t , t + Δ t ) f i ( x , t ) = 1 τ [ f i ( x , t ) f i eq ( x , t ) ]  
The left part of Equation (4) represents the streaming step, while the right represents the collision in the evolution of the distribution function. f i eq ( x , t ) is the equilibrium distribution function, and τ is the relaxation parameter.
τ = υ c s 2 Δ t + 0.5  
where υ and c s represent the kinematic viscosity of fluid and the lattice pseudo-sound-speed, respectively. And the value of c s is 1 3 .
According to the incompressible LBM [46], the equilibrium distribution function for model D3Q19 is:
f i eq ( x ) = ω i [ ρ ( x ) + ρ 0 ( 3 ( e i u ) + 9 2 ( e i u ) 3 2 ( u u ) ) ]  
where ρ 0 is the mean density and ω i is the weight factor in i-th direction. ω i for D3Q19 is specified as:
ω i = { 1 / 3 ,   i = 0 , 1 / 18 ,   i = 1 , 2 , 3 , 4 , 5 , 6 , 1 / 36 ,   i = 7 , 8 , 9 , 10 , 11 , 12 , 13 , 14 , 15 , 16 , 17 , 18  
And the fluid macroscopic density ( ρ ) and velocity ( u ) at a node x , are defined as:
ρ ( x ) = i = 0 18 f i ( x )  
u = 1 ρ ( x ) i = 0 18 f i ( x ) e i  
Besides, the pressure in the calculating of LBM is defined as:
p ( x ) = c s 2 ρ ( x )  
In this work, the single-phase fluid is driven by pressure difference, which is realized by setting the inlet and outlet pressure as fixed values. As represented in Figure 2, the pressure-boundary condition was set on inlet surface and outlet surface, and the pressure gradient was 0.00005 for all fractures. Using the segmented images as input data, the walls of the porous medium are converted to bounce-back boundary conditions. A bounce-back scheme is a common scheme for dealing with no-slip boundaries. In this scheme, when the particle reaches the wall node, the particle will return to the fluid node along the original path, and the direction is opposite to the incident direction. It is worth noting that particles do not collide on the wall. The bounce-back scheme is very easy to implement, and is suitable for handling systems with complex geometry [47].
The steady state is reached by checking the velocity and density of the fluid in fracture every 1000 steps, until the difference between the 2 adjacent times is less than 10−6. According to Darcy’s law, Equation (11), the equivalent permeability of the induced fracture in Berea sandstone was calculated.
d P d x = μ k U  

3. Results and Discussion

3.1. The Digital Rocks of Fractures

The digital rocks presented in this study are Berea sandstone (with an induced fracture), which were downloaded in the sharing portal [48]. The core samples were prepared in such a way that the images are denoised and smoothed, then fractures were segmented by the multithresholding segmentation method, and the results are shown in Figure 3.
The minimum aperture values, the mean aperture values, surface roughness, and the fracture porosity (which is the ratio of fracture volume to total volume) of all the fractures are shown in Table 1.
Tamura et al. generalized six image texture features related to human visual perception. Roughness is one of them, and its ability to describe texture is very strong. It has more application value in texture synthesis, image analysis and recognition, color migration, and so on. The calculation method of surface roughness came from his article [49].

3.2. Fractal Dimension Calculating of Fractures

The digital cores shown in Section 3.1 were used to calculate the fractal dimensions of different fractures. It is noticeable that the 3D box fractal dimension was the fractal dimension of fracture, which was carried out by inverting the pore phase and skeleton phase in Figure 3, and then obtaining the structure of complete fracture, as shown in Figure 4, and Table 2 and Table 3:

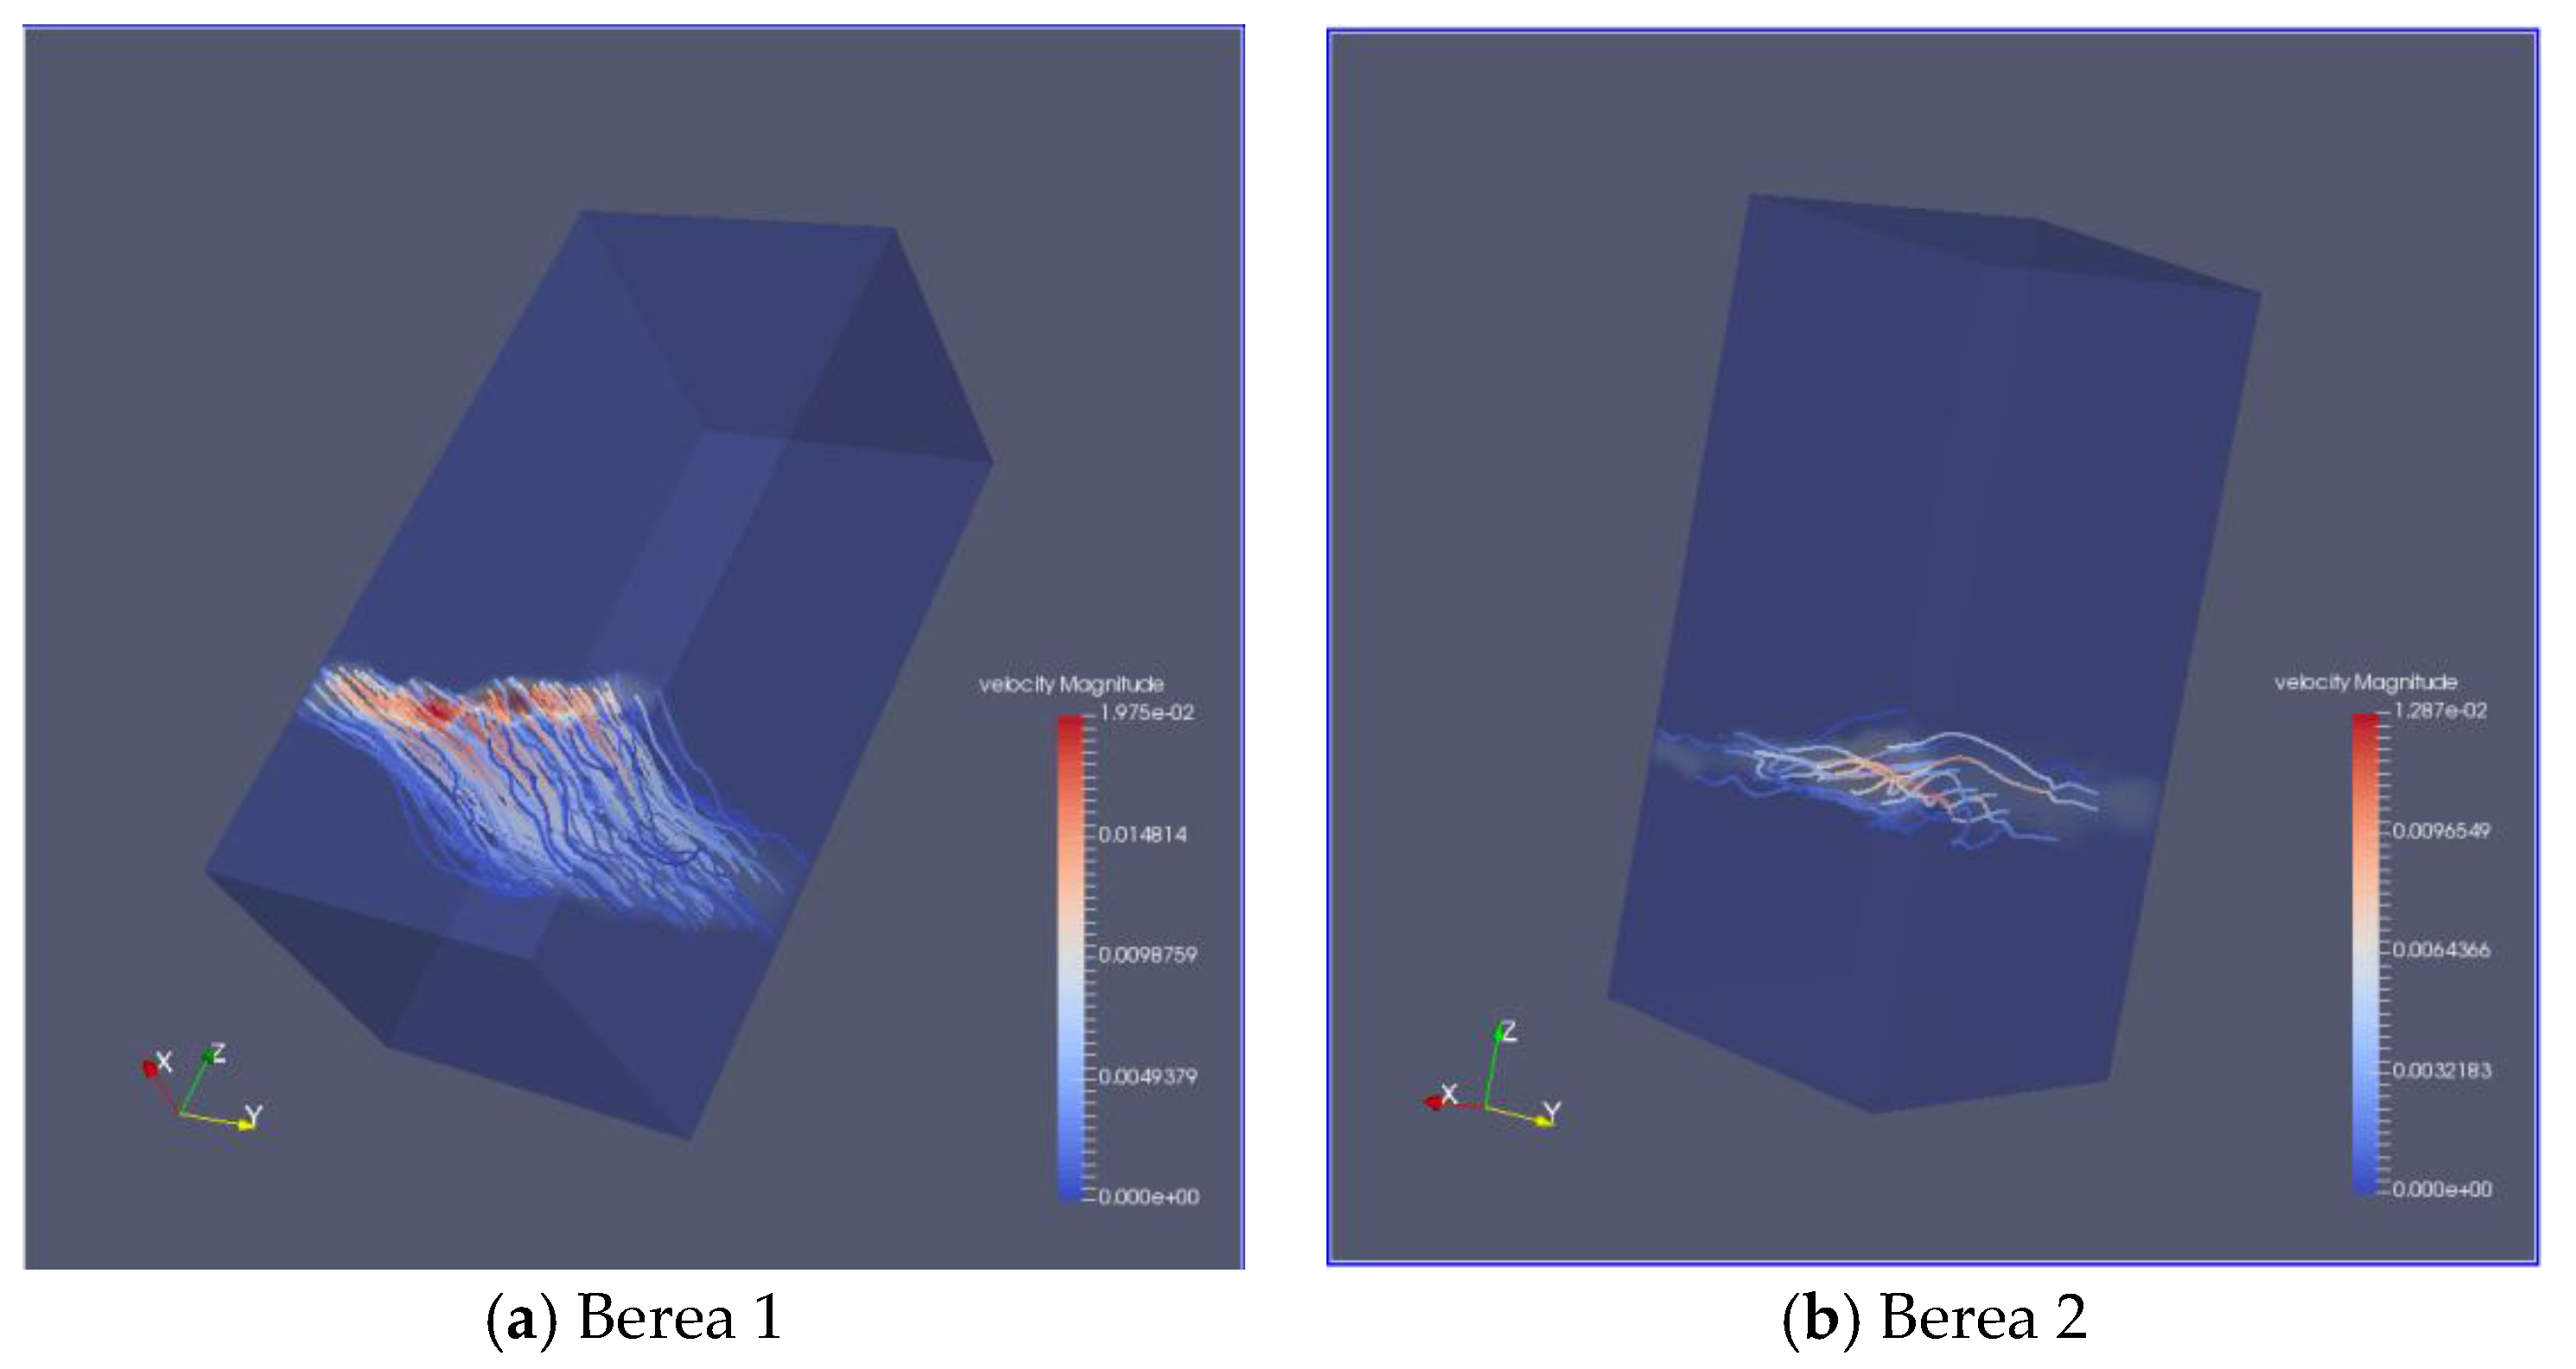
3.3. The Permeability of Fractures

The streamlines of induced fractures are shown in Figure 5, and the permeability of induced fractures in Berea sandstone is obtained in Table 4. It should be noted that all units in this work are nondimensional LB units.

3.4. The Relations of Permeability and Other Parameters

Fluid flow through a single fracture was determined by spatial distribution of fracture aperture, which can be quantified by fractal parameter, mean aperture, or surface roughness. So we study the functional relations between (a) permeability and 3D box fractal dimension, (b) permeability and surface roughness, (c) permeability and mean fracture aperture, (d) 3D box fractal dimension and porosity, and (e) 3D box fractal dimension and mean fracture aperture.

3.4.1. Permeability versus 3D Box Fractal Dimension

The correlation between permeability and 3D box fractal dimension is widely studied; Ju et al. investigated the mechanism of fluid flow through a single rough fracture of rocks, and a nonlinear relationship between the fractal equivalent permeability of a single fracture and the fractal dimension D of its rough structure [11]. They generated a single fracture based on the Weierstrass–Mandelbrot fractal function. The relationship between permeability and 3D box fractal dimension obtained in this work is different from theirs, which is shown in Figure 6:
The equivalent permeability (dimensionless LB units) of induced fracture, k L B e q u , increase exponentially with the increasing of 3D box fractal dimension, FD3d. The equation between permeability and 3D box fractal dimension obtained is:
k L B e q u = e 10.32 + 14.92 F D 3 d 0.553  

3.4.2. Permeability versus Surface Roughness

The relationship between permeability and surface roughness is shown in Figure 7. The roughness of natural rock fractures is a topic of interest to many researchers, including rock hydrogeologists, geochemists, and geophysicists. The complexity of fracture morphology (the roughness and variability in fracture aperture) is the fundamental property that keeps fractures open and makes flow through fractures significant and important to subsurface fluid flow. Nevertheless, this parameter is hard to measure and determine [49].
Tayfun et al. found that surface roughness of fracture walls had a critical effect on the hydraulic conductivity of a fracture [50]. The hydraulic conductivity ratio also shows decreasing trend with increasing fracture surface roughness.
However, in this study, the relationship between permeability and surface roughness is indistinct in Berea sandstone with an induced fracture and the permeability shows an increasing trend with the increase of surface roughness. This is because of the difference between real fractures and the artificially generated fracture by the Weierstrass–Mandelbrot fractal function. Real fractures have no fixed aperture, and the roughness of fractures with a different aperture is varied, which results in increasing permeability with the increase of surface roughness. In large part, it is caused by the influence of other factors, for instance, the mean fracture aperture on permeability. As shown in Section 3.6, the influence of surface roughness on a dependent variable is much weaker compared with the square of mean fracture aperture and minimum fracture aperture.

3.4.3. Permeability versus Mean Fracture Aperture

Although it is impossible to put forward a fixed value of fracture aperture, the relationship between permeability and mean fracture aperture is still worth analyzing, as illustrated in Figure 8. It is generally known that the relationship between permeability and the square of mean fracture aperture for a horizontal flat-plate model is:
k e q u = b 2 12  
where k e q u is the equivalent permeability of the horizontal flat-plate model.
So the relationship between permeability and the square of mean fracture aperture is studied in the following figure:
Figure 8 shows a very strong linear relation between permeability and mean fracture aperture, which illustrates that the equivalent permeability of real fractures is proportional to the square of the mean fracture aperture. High R2 also indicates that there is a strong correlation between permeability and the square of mean fracture aperture.

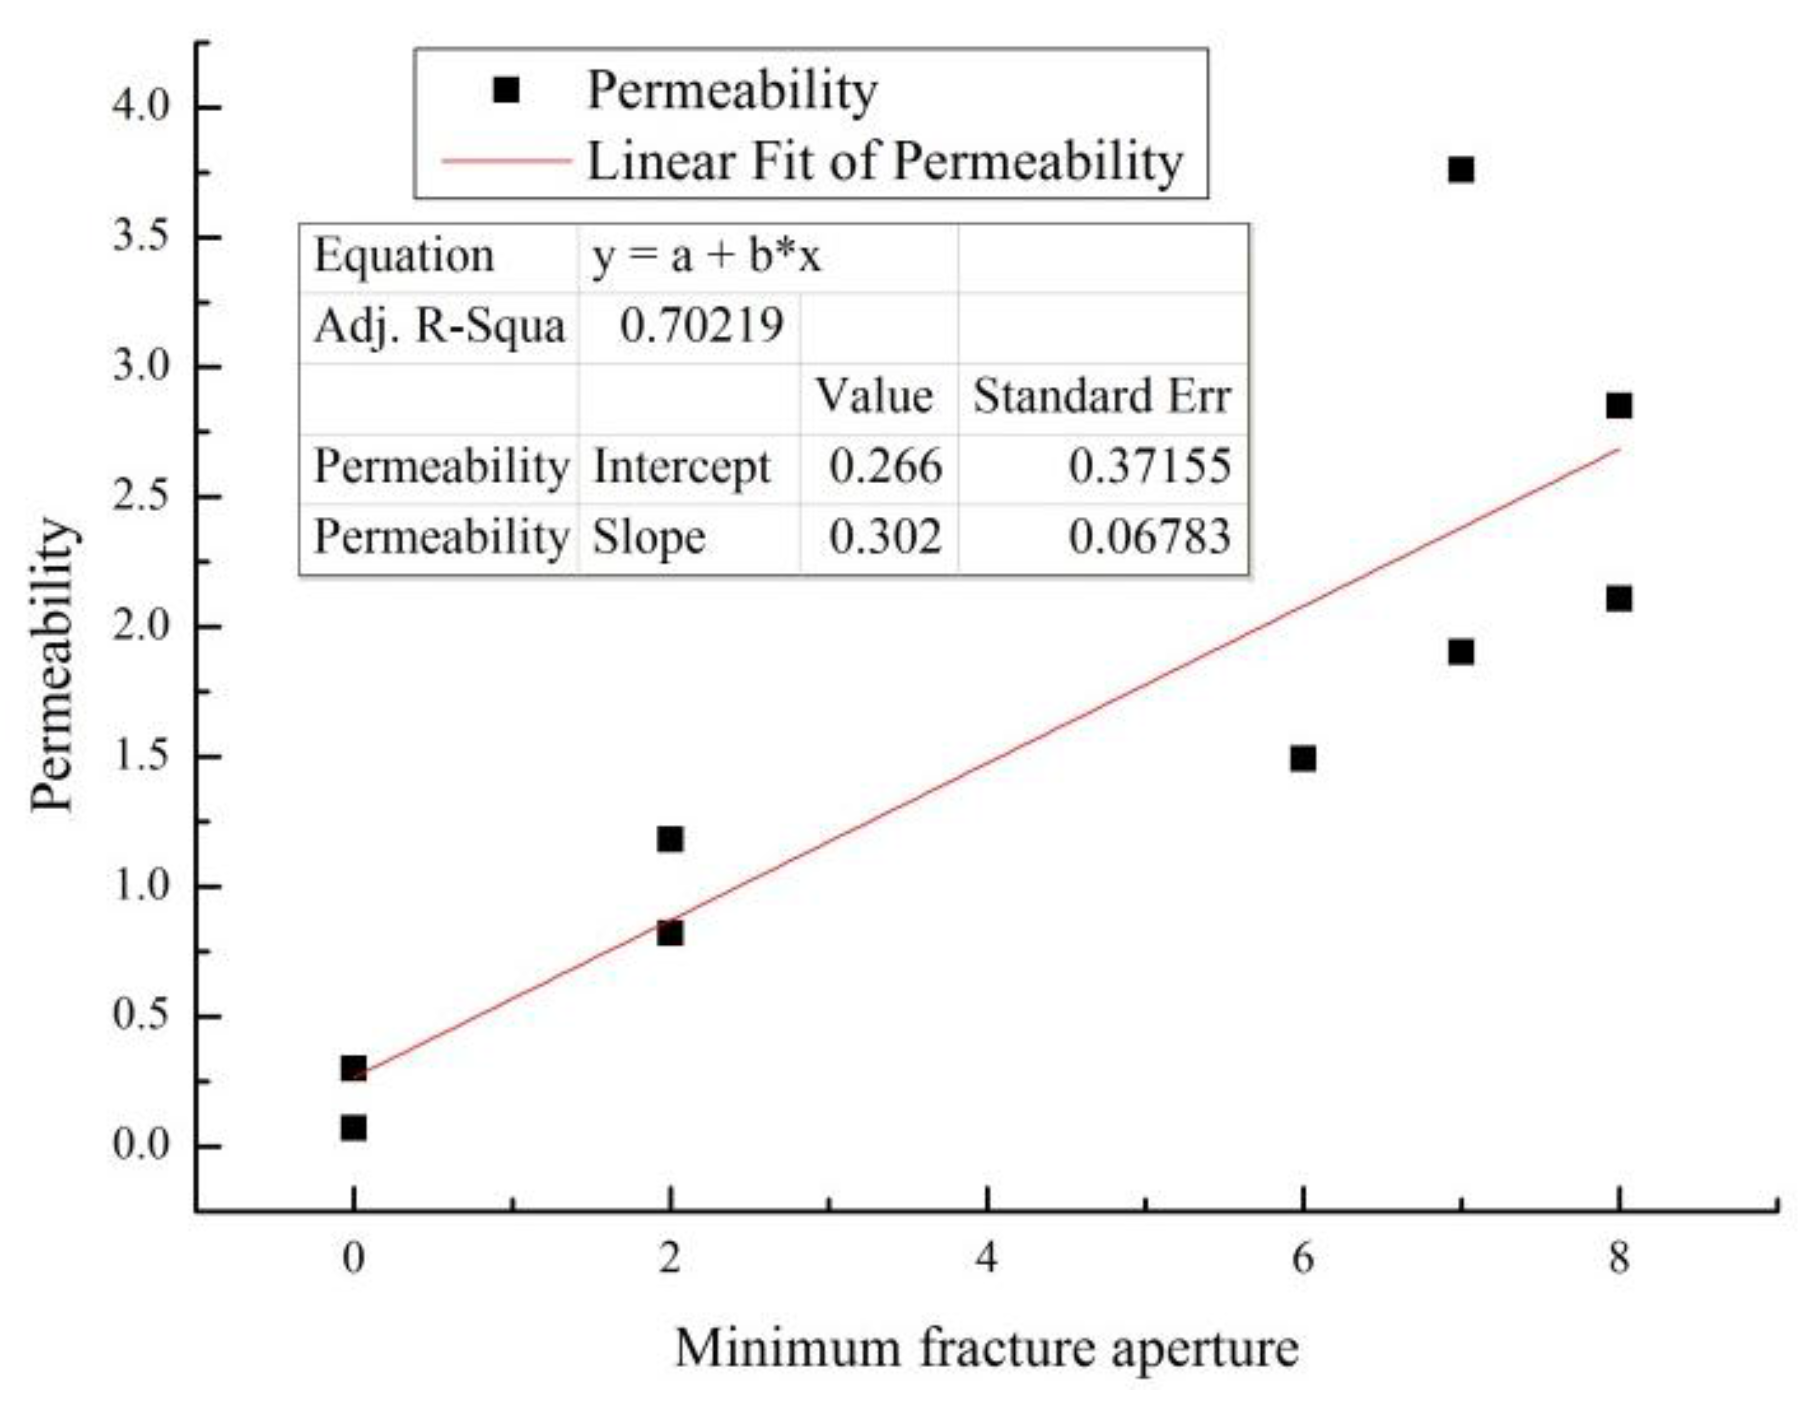
3.4.4. Permeability versus Minimum Fracture Aperture

In Figure 9, the relationship between permeability and minimum fracture aperture is shown. Minimum fracture aperture has a significant impact on the flow because, the smaller the minimum fracture aperture is, the greater the pressure drops. From Figure 9 we can also conclude that permeability increases with the increasing minimum fracture aperture.

3.5. The Relationship of 3D Box Fractal Dimension and Other Parameters

To characterize the spatial distribution of fracture aperture, the 3D box fractal dimension, FD3d, was used to characterize 3D artificially induced fractures in Berea sandstone. The relationship of 3D box fractal dimension and other parameters was analyzed below.

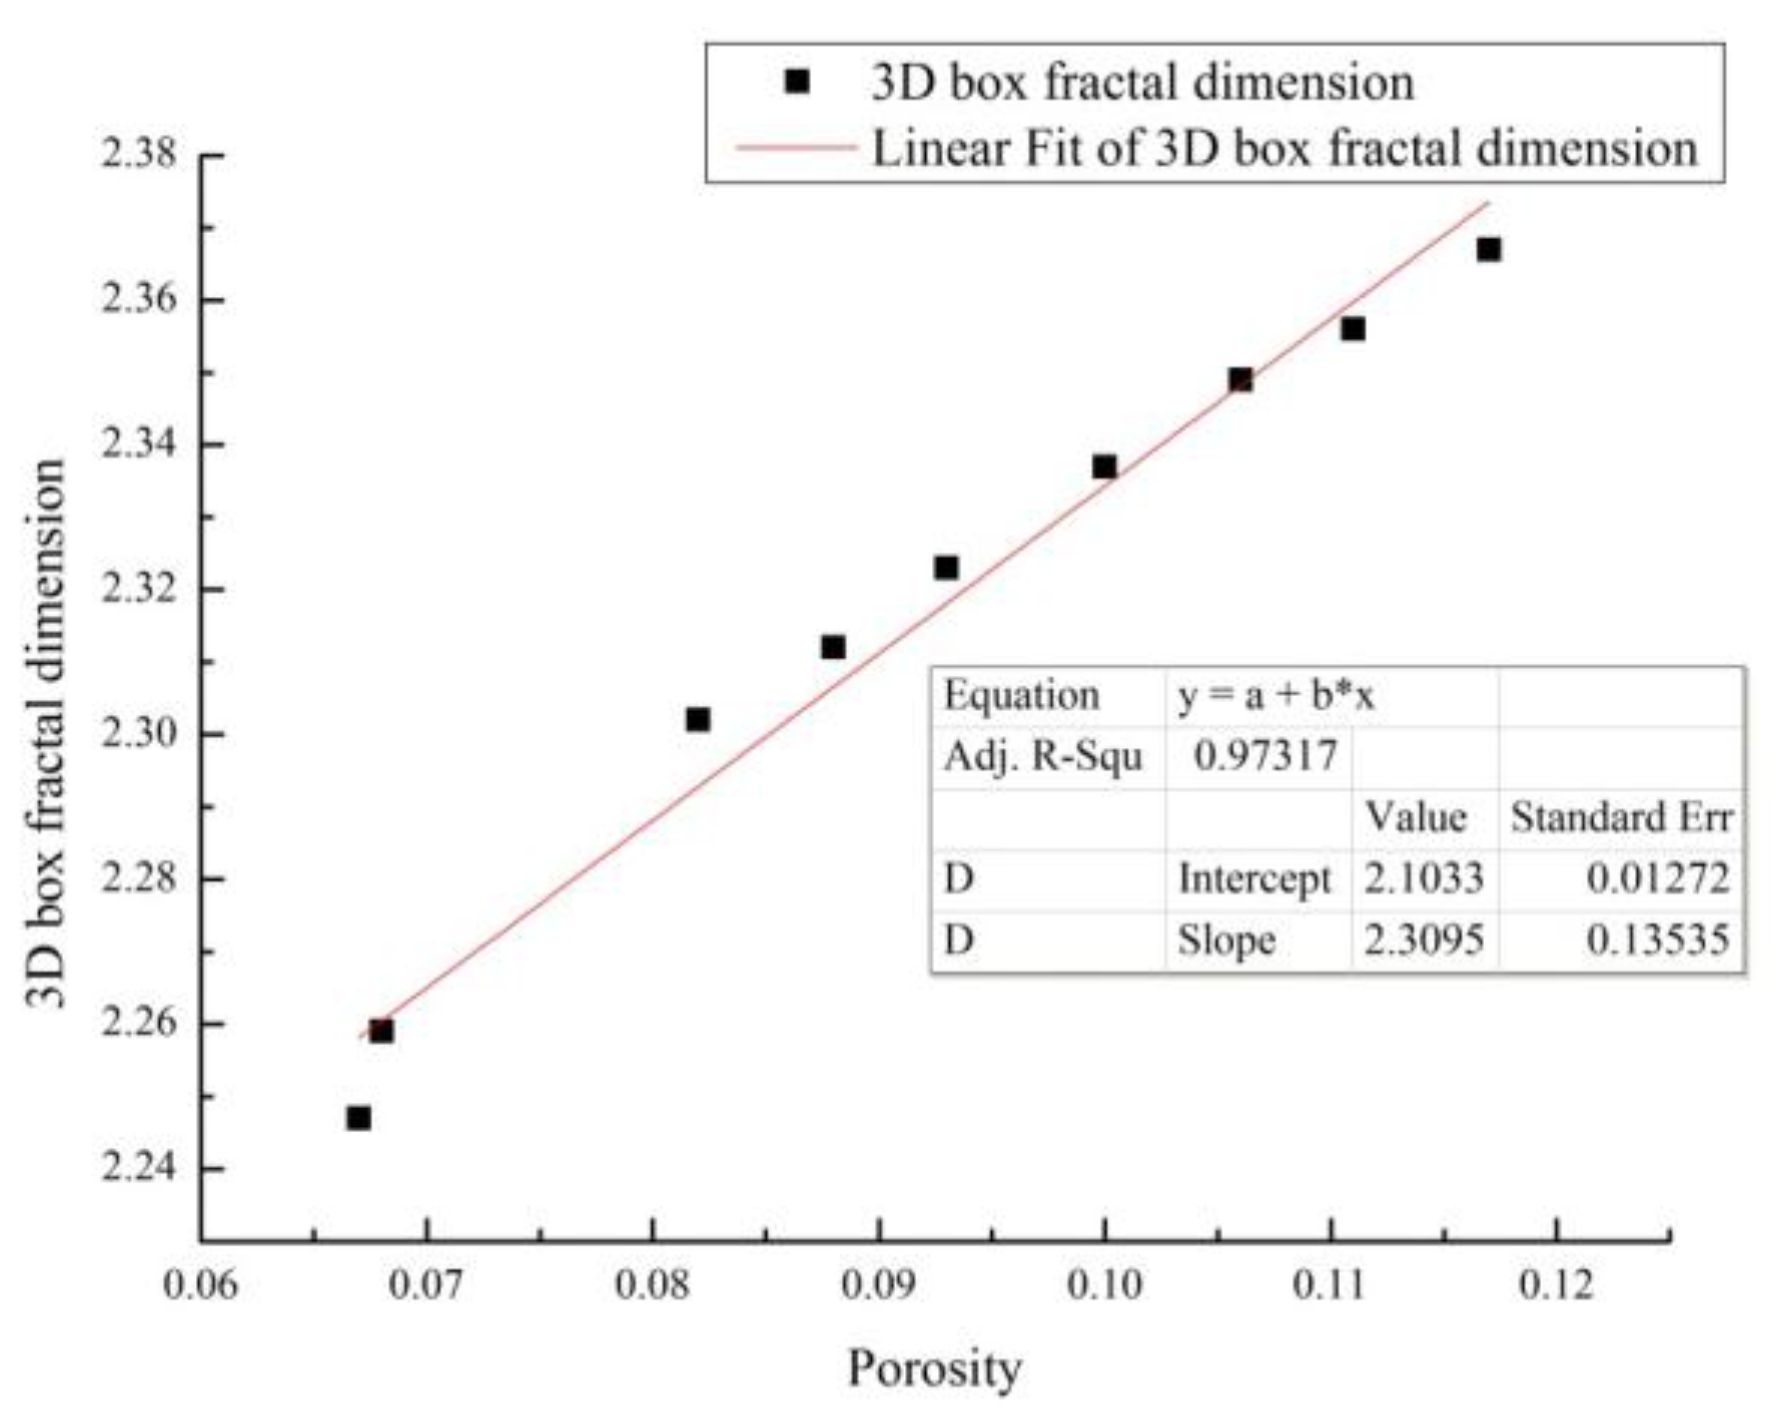
3.5.1. 3D Box Fractal Dimension versus Porosity

Figure 10 displays the curve of the 3D box fractal dimension versus porosity, which shows that the 3D box fractal dimension increases linearly with increasing porosity.
The figure shows a very strongly linear relation between the 3D box fractal dimension and porosity (R2 value is greater than 0.97). The standard errors of slope and intercept of the linear relationship lie in a small range.

3.5.2. 3D Box Fractal Dimension versus Mean Fracture Aperture

In the previous sections, it was found that the relationship between 3D box fractal dimension and porosity is strongly linear, and the relationship between permeability and mean fracture aperture is almost the same as the relationship between permeability and porosity, as shown in Figure 11.
It is not difficult to see that the R2 value of the relationship between 3D box fractal dimension and mean fracture aperture is even larger than that of 3D box fractal dimension and porosity, which indicates that mean fracture aperture has a great impact on 3D box fractal dimension.

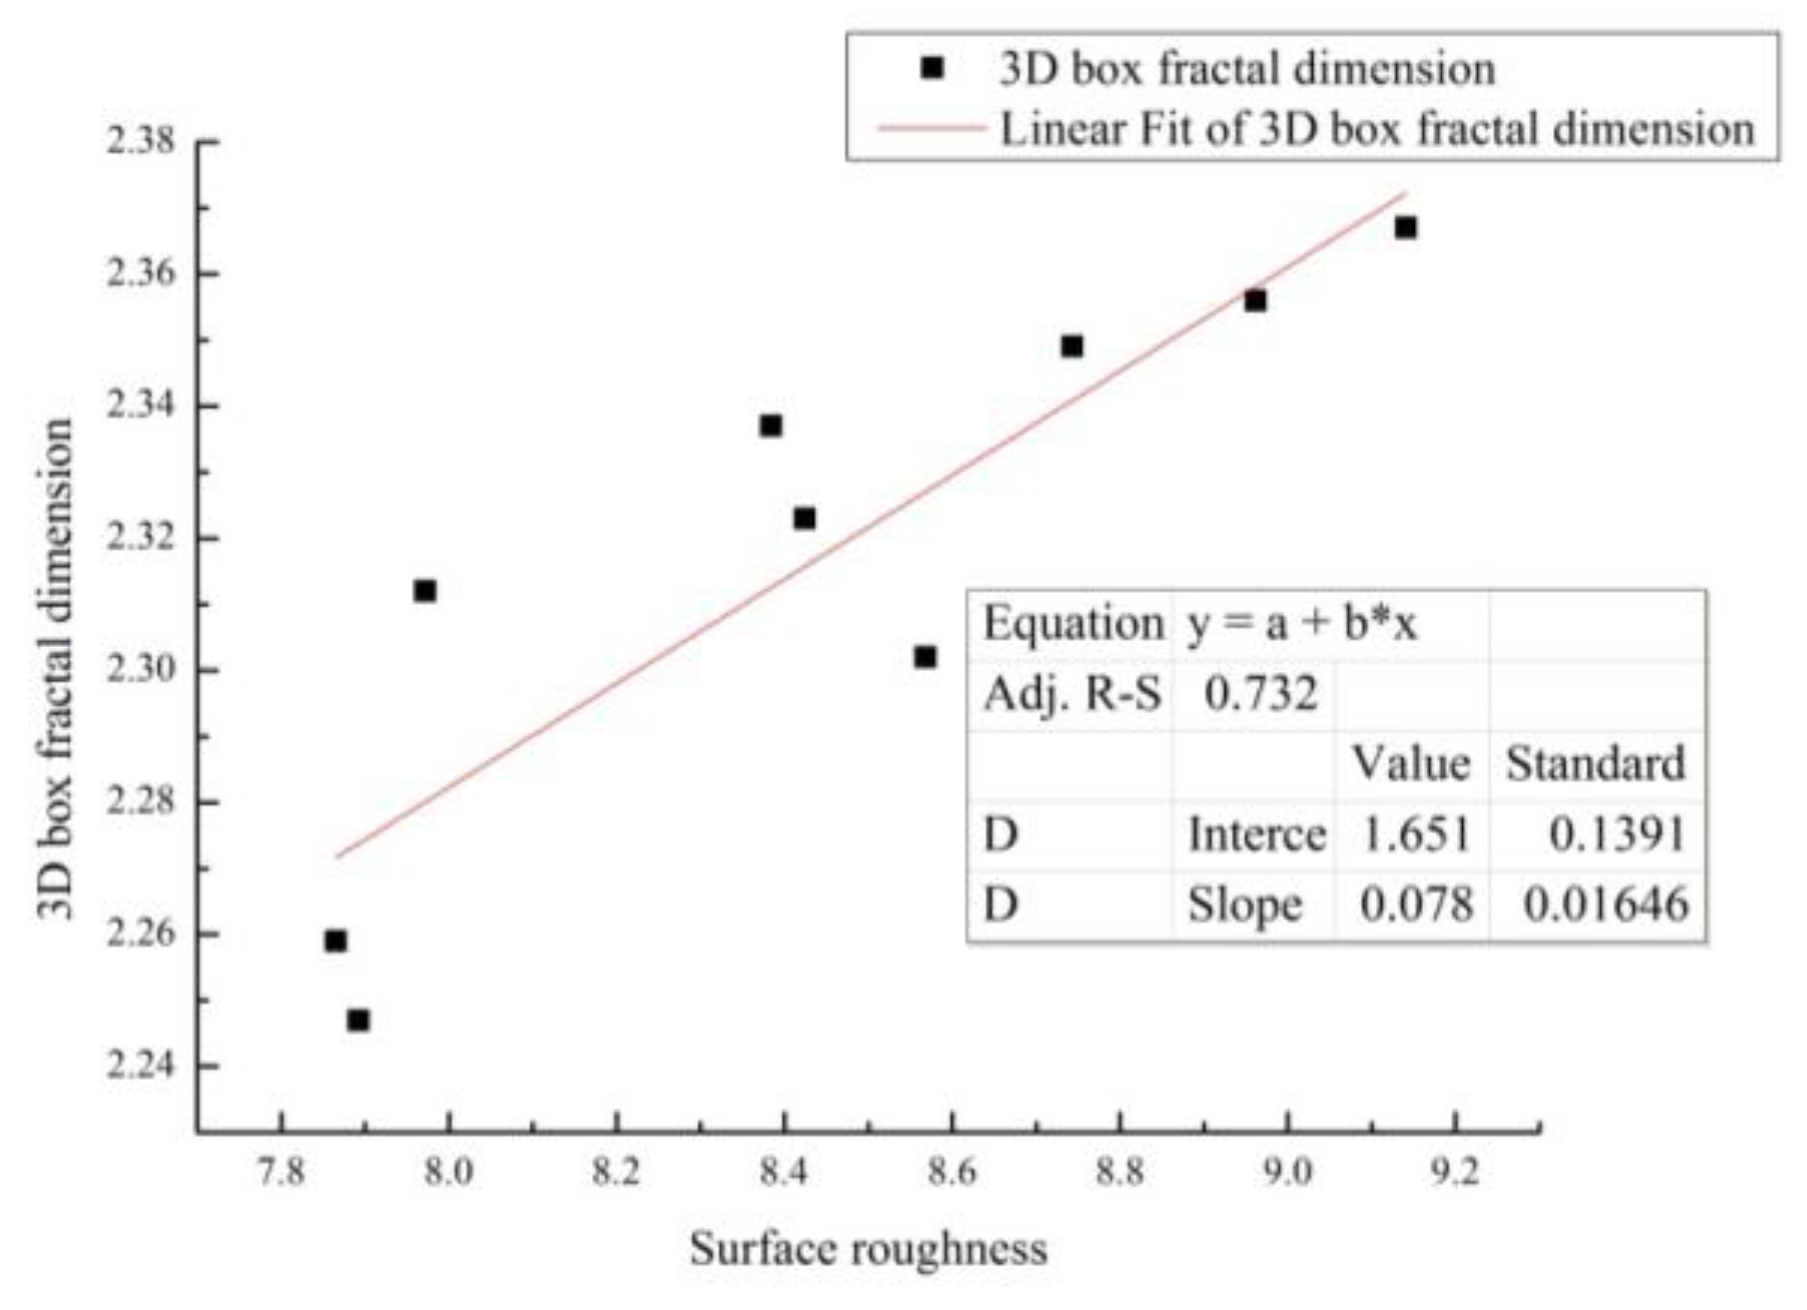
3.5.3. 3D Box Fractal Dimension versus Surface Roughness
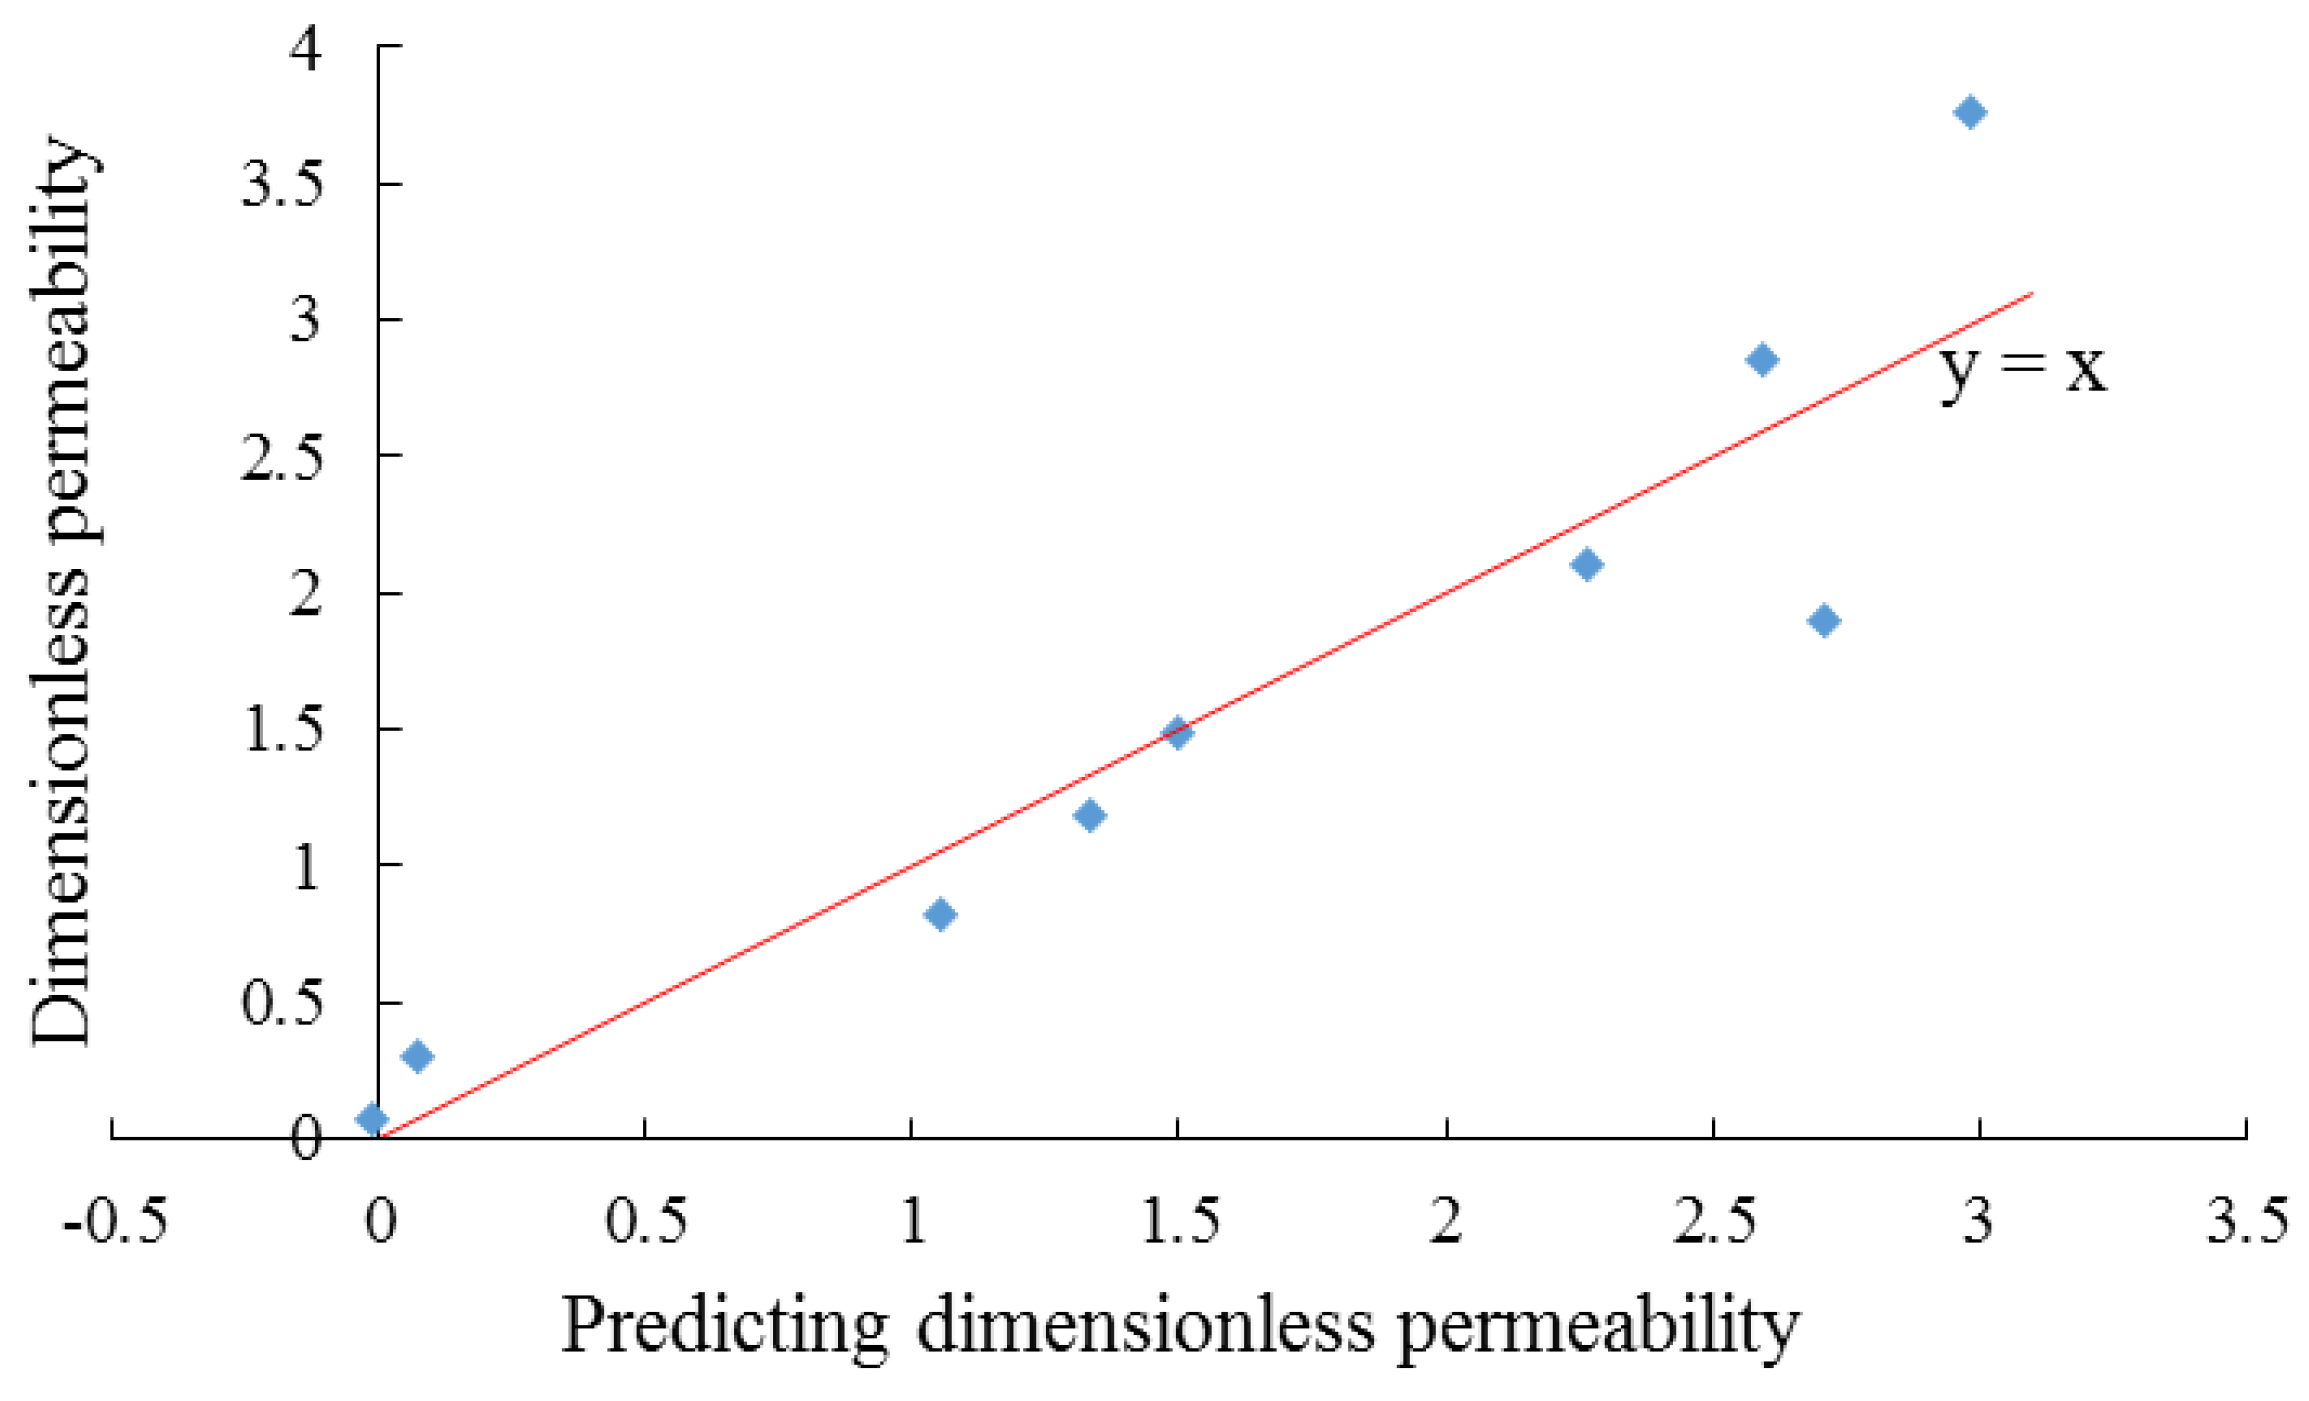
Surface roughness may have a great impact on 3D box fractal dimension because more boxes are counted by the box-counting method if surface roughness is larger. The relationship between 3D box fractal dimension and surface roughness of Berea sandstone with an induced fracture is shown in Figure 12.
The Figure 12 shows that 3D box fractal dimension increases with the increasing surface roughness in Berea sandstone; however, a good linear fit was not achieved (R2 = 0.733).

3.6. PLS Regression

In order to observe the marginal effect of each independent variable in explaining permeability more quickly and intuitively, we can draw a regression coefficient map, as shown in Figure 13, which is based on regression equation for standardized data.
It can be observed from the regression coefficient diagram that the minimum fracture aperture and square of mean fracture aperture play a very important role in explaining the regression equation. At the same time, it can be seen from the Figure 13 that the influence of surface roughness on dependent variable is weaker than other variables, which indicates that the permeability of real fractures is more strongly affected by other parameters.
In order to investigate the accuracy of the regression equation model, we used ( k ^ L B e q u , k L B e q u ) as the coordinate values to draw the prediction map for all the sample points. k ^ L B e q u was the predicted value of the sample point ( k L B e q u ). As shown in Figure 14, all points are evenly distributed near the diagonal of the graph, the difference between the fitting value of the equation and the original value is very small, and the fitting effect of the equation is satisfactory.
The regression equation is:
k L B e q u = 9.0185 + 0.6541 exp ( F D 3 d ) + 0.0023 b ¯ 2 0.2945 R a + 0.1198 b min  
where b ¯ , R a and b min represent mean fracture aperture, surface roughness, and minimum fracture aperture, respectively.

4. Conclusions

(1) Artificially induced fractures were studied in this work, and their geometrical parameters (porosity, surface roughness, minimum fracture aperture, and mean fracture aperture) were calculated. 3D box fractal dimension of fractures was also calculated; it was found that a 3D box fractal dimension is between 2.247–2.367, which shows that the artificially induced fractures have the characteristics of self-similarity.
(2) LBM was used to compute the permeability of artificially induced fractures; the permeability was between 0.071–3.759 (dimensionless LB units). The difference in permeability indicates that artificially induced fractures have complex structures.
(3) The following relations have been identified: (a) exponentially increasing permeability with increasing 3D box fractal dimension in induced fractures, (b) linearly increasing permeability with increasing square of mean fracture aperture, (c) indistinct relationship between permeability and surface roughness, and (d) linearly increasing 3D box fractal dimension with increasing porosity, mean fracture aperture, and surface roughness.
(4) By PLS regression, it can be concluded that minimum fracture aperture and mean fracture aperture play a significant role in explaining the fracture permeability. The influence of surface roughness on dependent variables is much weaker compared with the square of mean fracture aperture and minimum fracture aperture. Besides, the regression equation was obtained, and the fitting result of which was satisfactory.

Author Contributions

Each author has made contribution to the present paper. Y.Y., Z.L. and L.Z. conceived and designed the experiments; Z.L., T.D.N. and S.H.H. performed the experiments; Y.Y. and L.Z. processed and analyzed the experimental data; J.Y. provided the experimental support. General supervision was provided by J.M. and L.L. All authors have read and approved the final manuscript.

Funding

We would like to express appreciation to the following for their financial support: the National Natural Science Foundation of China (No. 51674280, 51711530131,51490654), Key Research and Development Plan of Shandong Province (2018GSF116009), Applied Basic Research projects of Qingdao Innovation Plan (16-5-1-38-jch), the Fundamental Research Funds for the Central Universities (No. 17CX05003, 18CX02031A), National Science and Technology Major Project (2016ZX05010002005), and Program for Changjiang Scholars and Innovative Research Team in University (IRT_16R69). Hossein Hejazi acknowledges partial support from the University of Calgary Beijing Research Site, a research initiative associated with the University of Calgary Global Research Initiative in Sustainable Low Carbon Unconventional Resources, and the Kerui Group.

Conflicts of Interest

The authors declare no conflict of interest.

References

  1. Sagar, B.; Runchal, A. Permeability of fractured rock: Effect of fracture size and data uncertainties. Water Resour. Res. 1982, 18, 266–274. [Google Scholar] [CrossRef]
  2. Bunger, A.P.; Zhang, X.; Jeffrey, R.G. Parameters Affecting the Interaction Among Closely Spaced Hydraulic Fractures. SPE J. 2012, 17, 292–306. [Google Scholar] [CrossRef]
  3. Akhavan, A.; Shafaatian, S.M.H.; Rajabipour, F. Quantifying the effects of crack width, tortuosity, and roughness on water permeability of cracked mortars. Cem. Concr. Res. 2012, 42, 313–320. [Google Scholar] [CrossRef]
  4. Neuman, S.P. Trends, prospects and challenges in quantifying flow and transport through fractured rocks. Hydrogeol. J. 2005, 13, 124–147. [Google Scholar] [CrossRef]
  5. Or, D.; Tuller, M. Flow in unsaturated fractured porous media: Hydraulic conductivity of rough surfaces. Water Resour. Res. 2000, 36, 1165–1177. [Google Scholar] [CrossRef] [Green Version]
  6. Samuel, F.; Pejman, T.; Mohammed, P. Interaction Between Fluid and Porous Media with Complex Geometries: A Direct Pore-Scale Study. Water Resour. Res. 2018. [Google Scholar] [CrossRef]
  7. Snow, D.T. A Parallel Plate Model Of Fractured Permeable Media. Ph.D. Thesis, University of California, ‎Oakland, CA, USA, 1965. [Google Scholar]
  8. Ge, S. A governing equation for fluid flow in rough fractures. Water Resour. Res. 1997, 33, 53–61. [Google Scholar] [CrossRef] [Green Version]
  9. Genabeek, O.V.; Rothman, D.H. Critical behavior in flow through a rough-walled channel. Phys. Lett. A 1999, 255, 31–36. [Google Scholar] [CrossRef]
  10. Konzuk, J.S.; Kueper, B.H. Evaluation of cubic law based models describing single-phase flow through a rough-walled fracture. Water Resour. Res. 2004, 40, 389–391. [Google Scholar] [CrossRef]
  11. Yang, J.; Zhang, Q.G.; Yang, Y.M.; Xie, H.P.; Gao, F.; Wang, H.J. An experimental investigation on the mechanism of fluid flow through single rough fracture of rock. Sci. China Technol. Sci. 2013, 56, 2070–2080. [Google Scholar]
  12. Bertels, S.P.; Dicarlo, D.A.; Blunt, M.J. Measurement of aperture distribution, capillary pressure, relative permeability, and in situ saturation in a rock fracture using computed tomography scanning. Water Resour. Res. 2001, 37, 649–662. [Google Scholar] [CrossRef] [Green Version]
  13. Brown, S.R. Transport of fluid and electric current through a single fracture. J. Geophys. Res. Solid Earth 1989, 94, 9429–9438. [Google Scholar] [CrossRef]
  14. Renshaw, C.E.; Dadakis, J.S.; Brown, S.R. Measuring fracture apertures: A comparison of methods. Geophys. Res. Lett. 2000, 27, 289–292. [Google Scholar] [CrossRef] [Green Version]
  15. Wolf-Gladrow, D.A. Lattice Gas Cellular Automata and Lattice Boltzmann Models; Springer: Tokyo, Japan, 2000. [Google Scholar]
  16. Zhang, L.; Yao, J.; Zhao, J.L.; Li, A.; Sun, H.; Wan, Y.; Su, Y. The influence of wettability and shut-in time on oil recovery through microscale simulation based on an ideal model. J. Nat. Gas Sci. Eng. 2017, 48, 178–185. [Google Scholar] [CrossRef]
  17. Dou, Z.; Zhou, Z.; Sleep, B.E. Influence of wettability on interfacial area during immiscible liquid invasion into a 3D self-affine rough fracture: Lattice Boltzmann simulations. Adv. Water Resour. 2013, 61, 1–11. [Google Scholar] [CrossRef]
  18. Chen, Y.F.; Zhou, J.Q.; Hu, S.H.; Hu, R.; Zhou, C.B. Evaluation of Forchheimer equation coefficients for non-Darcy flow in deformable rough-walled fractures. J. Hydrol. 2015, 529, 993–1006. [Google Scholar] [CrossRef]
  19. Tsang, Y.W. The Effect of Tortuosity on Fluid Flow Through a Single Fracture. Water Resour. Res. 1984, 20, 1209–1215. [Google Scholar] [CrossRef]
  20. Alyaarubi, A.H.; Pian, C.C.; Grattoni, C.A.; Zimmerman, R.W. Navier-stokes simulations of fluid flow through a rock fracture. Geophys. Monogr. 2013, 162, 55–64. [Google Scholar]
  21. Hans, J.; Boulon, M. A new device for investigating the hydro-mechanical properties of rock joints. Int. J. Numer. Anal. Meth. Geomech. 2003, 27, 513–548. [Google Scholar] [CrossRef]
  22. Koyama, T.; Neretnieks, I.; Jing, L. A numerical study on differences in using Navier–Stokes and Reynolds equations for modeling the fluid flow and particle transport in single rock fractures with shear. Int. J. Rock Mech. Min. Sci. 2008, 45, 1082–1101. [Google Scholar] [CrossRef] [Green Version]
  23. Brown, S.; Caprihan, A.; Hardy, R. Experimental observation of fluid flow channels in a single fracture. J. Geophys. Res. Solid Earth 1998, 103, 5125–5132. [Google Scholar] [CrossRef] [Green Version]
  24. Berkowitz, B. Characterizing flow and transport in fractured geological media: A review. Adv. Water Resour. 2002, 25, 861–884. [Google Scholar] [CrossRef]
  25. Liu, Z.; Yang, Y.; Yao, J.; Zhang, Q.; Ma, J.; Qian, Q. Pore-scale remaining oil distribution under different pore volume water injection based on CT technology. Adv. Geo-energ. Res. 2017, 1, 171–181. [Google Scholar] [CrossRef] [Green Version]
  26. Cai, Y.; Liu, D.; Mathews, J.P.; Pan, Z.; Elsworth, D.; Yao, Y.; Li, J.; Guo, X. Permeability evolution in fractured coal—Combining triaxial confinement with X-ray computed tomography, acoustic emission and ultrasonic techniques. Int. J. Coal. Geol. 2014, 122, 91–104. [Google Scholar] [CrossRef]
  27. Heriawan, M.N.; Koike, K. Coal quality related to microfractures identified by CT image analysis. Int. J. Coal. Geol. 2015, 140, 97–110. [Google Scholar] [CrossRef]
  28. Mazumder, S.; Wolf, K.-H.A.A.; Elewaut, K.; Ephraim, R. Application of X-ray computed tomography for analyzing cleat spacing and cleat aperture in coal samples. Int. J. Coal. Geol. 2006, 68, 205–222. [Google Scholar] [CrossRef]
  29. Montemagno, C.D.; Pyrak-Nolte, L.J. Fracture network versus single fractures: Measurement of fracture geometry with X-ray tomography. Phys. Chem. Earth Part A 1999, 24, 575–579. [Google Scholar] [CrossRef]
  30. Yang, Y.; Liu, Z.; Sun, Z.; An, S.; Zhang, W.; Liu, P.; Yao, P.; Ma, J. Research on Stress Sensitivity of Fractured Carbonate Reservoirs Based on CT Technology. Energies 2017, 10, 1833. [Google Scholar] [CrossRef]
  31. Wennberg, O.P.; Rennan, L.; Basquet, R. Computed tomography scan imaging of natural open fractures in a porous rock; geometry and fluid flow. Geophys. Prospect. 2009, 57, 239–249. [Google Scholar] [CrossRef]
  32. Watanabe, N.; Ishibashi, T.; Hirano, N.; Ohsaki, Y.; Tsuchiya, Y.; Tamagawa, T.; Okabe, H.; Tsuchiya, N. Precise 3D Numerical Modeling of Fracture Flow Coupled With X-Ray Computed Tomography for Reservoir Core Samples. SPE J. 2011, 16, 683–691. [Google Scholar] [CrossRef]
  33. Jack, D.; Qian, F.; Naum, D. Etudes in computational rock physics: Alterations and benchmarkingEtudes in computational rock physics. Geophysics 2012, 77, D45–D52. [Google Scholar]
  34. Karpyn, Z.T.; Grader, A.S.; Halleck, P.M. Visualization of fluid occupancy in a rough fracture using micro-tomography. J. Colloid. Interface Sci. 2007, 307, 181–187. [Google Scholar] [CrossRef] [PubMed]
  35. Mandelbrot, B.B. How long is the coastline of Britain. Science 1967, 156, 3775. [Google Scholar] [CrossRef] [PubMed]
  36. Cai, J.; Wei, W.; Hu, X.Y.; Liu, R.H.; Wang, J.J. Fractal characterization of dynamic fracture network extension in porous media. Fractals 2017, 25, 1750023. [Google Scholar] [CrossRef]
  37. Cai, J.; Yu, B.; Zou, M.; Luo, L. Fractal characterization of spontaneous co-current imbibition in porous media. Energy Fuels 2010, 24, 1860–1867. [Google Scholar] [CrossRef]
  38. King, P.R. The fractal nature of viscous fingering in porous media. J. Phys. Math. Gen. 1987, 20, L529. [Google Scholar] [CrossRef]
  39. Xie, S.; Cheng, Q.; Ling, Q.; LI, B.; Bao, Z.; Fan, P. Fractal and multifractal analysis of carbonate pore-scale digital images of petroleum reservoirs. Mar. Pet. Geol. 2010, 27, 476–485. [Google Scholar] [CrossRef]
  40. Zheng, Q.; Yu, B. A fractal permeability model for gas flow through dual-porosity media. J. Appl. Phys. 2012, 111, 024316. [Google Scholar] [CrossRef]
  41. Mandelbrot, B.B.; Wheeler, J.A. The Fractal Geometry of Nature. Am. J. Phys. 1983, 51, 468. [Google Scholar] [CrossRef]
  42. Li, J.; Liu, Z.; Li, J.; Lu, S.F. Fractal characteristics of continental shale pores and its significance to the occurrence of shale oil in china: A case study of biyang depression. Fractals 2018, 26, 1840008. [Google Scholar] [CrossRef]
  43. Yuliang, S.; Sheng, G.; Wang, W.; Zhang, Q.; Lu, M.; Ren, L. A mixed-fractal flow model for stimulated fractured vertical wells in tight oil reservoirs. Fractals 2016, 24, 1650006. [Google Scholar]
  44. Wang, F.; Liu, Z.; Jiao, L.; Wang, C.; Guo, H. A fractal permeability model coupling boundary-layer effect for tight oil reservoirs. Fractals 2017, 25, 1750042. [Google Scholar] [CrossRef]
  45. Qian, Y.H.; D'Humières, D.; Lallemand, P. Lattice BGK Models for Navier-Stokes Equation. Europhys. Lett. 1992, 17, 479. [Google Scholar]
  46. He, X.; Luo, L.S. Lattice Boltzmann Model for the Incompressible Navier–Stokes Equation. J. Stat. Phys. 1997, 88, 927–944. [Google Scholar] [CrossRef]
  47. Qisu, Z.; He, X. On pressure and velocity boundary conditions for the lattice Boltzmann BGK model. Phys. Fluids 1997, 9, 1591–1598. [Google Scholar] [Green Version]
  48. Induced Rough Fracture in Berea Sandstone Core Digital Rocks Portal. 2016. Available online: http://www.digitalrocksportal.org/projects/31 (accessed on 10 August 2018).
  49. Tamura, H.; Mori, S.; Yamawaki, T. Textural Features Corresponding to Visual Perception. IEEE Trans. Syst. Man Cybern. 1978, 8, 460–473. [Google Scholar] [CrossRef]
  50. Babadagli, T.; Ren, X.; Develi, K. Effects of fractal surface roughness and lithology on single and multiphase flow in a single fracture: An experimental investigation. Int. J. Multiph. Flow 2015, 68, 40–58. [Google Scholar] [CrossRef]
Figure 1. Schematic plot of X-ray micro-CT setup.
Energies 11 02145 g001
Figure 2. The numerical model of the lattice Boltzmann method (LBM) (The lattice Bhatnagar–Gross–Krook (LBGK) approximation was applied).
Energies 11 02145 g002
Figure 3. Digital cores of Berea sandstone with induced fracture (the size of every digital core is 2.743 × 2.743 × 6.035 mm3), (a) Berea 1 to (f) Berea 6 are samples of all nine digital cores; their aperture and roughness are totally different.
Energies 11 02145 g003aEnergies 11 02145 g003b
Figure 4. Fractal dimension calculating of (a) Berea 1 and (b) Berea 2.
Energies 11 02145 g004
Figure 5. The streamlines of induced fractures in Berea.
Energies 11 02145 g005aEnergies 11 02145 g005b
Figure 6. The relationship between permeability and 3D box fractal dimension.
Energies 11 02145 g006
Figure 7. The relationship between permeability and surface roughness.
Energies 11 02145 g007
Figure 8. The relationship between permeability and the square of mean fracture aperture of Berea sandstone with an induced fracture.
Energies 11 02145 g008
Figure 9. The relationship between permeability and minimum fracture aperture of Berea sandstone with an induced fracture.
Energies 11 02145 g009
Figure 10. The relationship between the 3D box fractal dimension and porosity of Berea sandstone with an induced fracture.
Energies 11 02145 g010
Figure 11. The relationship between 3D box fractal dimension and mean fracture aperture.
Energies 11 02145 g011
Figure 12. The relationship between 3D box fractal dimension and surface roughness of Berea sandstone with an induced fracture.
Energies 11 02145 g012
Figure 13. Regression coefficient map based on regression equations for standardized data.
Energies 11 02145 g013
Figure 14. The fitting value of the equation versus the original value.
Energies 11 02145 g014
Table 1. The minimum aperture values, mean aperture values, and fracture porosity of all the fractures.
Core SamplePorosityMinimum Fracture Aperture/PixelsMean Fracture Aperture/PixelsSurface Roughness/Pixels
Berea 10.111724.48.962
Berea 20.082218.48.568
Berea 30.068015.07.865
Berea 40.067014.77.892
Berea 50.093220.58.424
Berea 60.100821.98.384
Berea 70.117725.79.141
Berea 80.088619.37.972
Berea 90.106823.38.743
Table 2. Statistical results of 3D box fractal dimensions.
r1248163264128256
N(r)Berea 1243,73964,47314,95238996821121621
Berea 2184,08449,75412,94637146791121621
Berea 3149,77740,92110,97033026401041621
Berea 4146,85839,713993629826371071621
Berea 5205,17854,84113,68737516851121621
Berea 6219,44158,32814,33938666851121621
Berea 7256,97367,77115,53740256861121621
Berea 8193,45051,95313,33937346861121621
Berea 9232,92561,92914,80139266861121621
Table 3. 3D box fractal dimension of Berea with an induced fracture.
Core Sample Berea 1Berea 2Berea 3Berea 4Berea 5Berea 6Berea 7Berea 8Berea 9
3D Box Fractal Dimension2.3562.3022.2592.2472.3232.3372.3672.3122.349
Table 4. The permeability of Berea with an induced fracture.
Core SampleBerea 1Berea 2Berea 3Berea 4Berea 5Berea 6Berea 7Berea 8Berea 9
Permeability1.9030.8200.3000.0711.1832.1083.7591.4922.852

