Article

The Effect of Oil Properties on the Supercritical CO2 Diffusion Coefficient under Tight Reservoir Conditions

College of Petroleum Engineering, China University of Petroleum, Qingdao 266580, China
*
Author to whom correspondence should be addressed.
These authors contributed equally to this work.
Energies 2018, 11(6), 1495; https://doi.org/10.3390/en11061495
Submission received: 18 May 2018 / Revised: 5 June 2018 / Accepted: 6 June 2018 / Published: 8 June 2018

Abstract

:
In this paper, a generalized methodology has been developed to determine the diffusion coefficient of supercritical CO2 in cores that are saturated with different oil samples, under reservoir conditions. In theory, a mathematical model that combines Fick’s diffusion equation and the Peng-Robinson equation of state has been established to describe the mass transfer process. In experiments, the pressure decay method has been employed, and the CO2 diffusion coefficient can be determined once the experimental data match the computational result of the theoretical model. Six oil samples with different compositions (oil samples A to F) are introduced in this study, and the results show that the supercritical CO2 diffusion coefficient decreases gradually from oil samples A to F. The changing properties of oil can account for the decrease in the CO2 diffusion coefficient in two aspects. First, the increasing viscosity of oil slows down the speed of the mass transfer process. Second, the increase in the proportion of heavy components in oil enlarges the mass transfer resistance. According to the results of this work, a lower viscosity and lighter components of oil can facilitate the mass transfer process.

1. Introduction

Insufficient oil and gas supplies and global warming have aroused interest in enhanced oil recovery (EOR) with CO2 and geological CO2 storage [1,2,3]. CO2 is usually injected into geological formations to improve oil recovery and to store and sequester the greenhouse gas in the atmosphere through the interaction of CO2 with the crude oil, which restricts CO2 molecules in the pores of the rock, and the reaction of CO2 molecules with mineral grains. The main purpose of CO2 EOR is to produce more hydrocarbons from oil reservoirs [4,5,6,7,8]. Therefore, a full understanding of the behavior of CO2 under reservoir conditions has always been one of the main interests of researchers and the petroleum industry. There are several processes involved in the CO2 EOR, i.e., diffusion of CO2 into the crude oil in the porous rocks [9,10,11,12,13,14,15,16,17,18,19], the chemical reaction of CO2 with formation minerals [20,21], and rock mechanics caused by pore pressure changes [22]. Only the first process of CO2 diffusion in porous media is considered in this study, which has theoretical importance and meaning for applications in the petroleum industry.
Diffusion is a spontaneously dispersing process of molecules or ions [23], which is caused by the concentration difference in solutions or dispersions. The quantitative description of the rate of the diffusion process is usually expressed by the diffusion coefficient [24,25,26,27]. There have been several methods for the quantitative determination of the gas (N2, CO2, CH4 [28], C2H6, C3H8, or a mixture gas) diffusion coefficient in crude oil. These methods include the pressure decay method, X-ray computer-assisted tomography (CAT) method, magnetic resonance imaging (MRI) method [29,30], dynamic drop volume analysis (DPDVA), and pore-scale network modeling method. All of these methods have advantages and flaws:
Direct testing method. Hill and Lacey [31] tested the diffusion coefficient of CH4 in isopentane with a constant pressure method in a Pressure-Volume-Temperature (PVT) system. Sigmund [32] also used this method to study the binary dense gas diffusion coefficients under reservoir conditions. Islas-Juarez et al. [33] set up an experimental device to determine the effective diffusion coefficient of N2 in a sandpack model. They devised a special setting to sample crude oil that was dissolved with N2 in their porous model. The samples were then analyzed by gas chromatograph, and the gas concentration in the oil phase was determined. The corresponding diffusion coefficient was determined by matching the mathematical diffusion model with the experimentally measured concentration curve. The main shortcomings of the direct testing method for the solvent diffusion coefficient are that it is both time and labor consuming, which results in an expensive process.
Pressure decay method. Riazi [34] proposed a technique known as the pressure decay method based on the fact that the pressure of the gas phase in a closed diffusion cell decreases with the migration of the gas phase into the liquid phase. One of the remarkable features of this method is that it does not require costly component measurements. In the following two decades, many scholars adopted this method to test the diffusion coefficient for different gas and oil systems and modified the basic method for even more complex conditions and higher accuracy [35,36,37,38,39].
CAT and MRI methods. Wen et al. [40] and Afsahi [41] utilized the nuclear magnetic resonance (NMR) method to estimate the diffusion coefficients in bitumen and solvent mixtures. Guerrero-Aconcha et al. [42] used CAT to obtain the density profiles and then back-calculated the concentration-dependent diffusion coefficients. Wen et al. [43] used the two nondestructive methods of NMR and CAT to determine the solubility profile inside a solvent and heavy oil system. Wang et al. [44] estimated the diffusion coefficients in porous media with an X-ray and investigated the effect of the thickness of a diffusion interface on convection flow. The advantage of NMR and CAT is that they are nondestructive and do not affect the distribution of the solvent in the liquid and diffusion process. However, the flaw is the requirement of expensive equipment.
DPDVA method. Yang and Gu [45] studied the mass transfer behavior of CO2–crude oil systems with DPDVA technology and measured solvent diffusivity in heavy oil under reservoir pressure and temperature. The DPDSA is a special method that correlates the oil swelling effect due to the mass transfer from the solvent into crude oil to the interfacial tension reduction between the oil and the solvent phases.
Pore-scale network modeling method. Recently, pore-scale network modeling has aroused the research interests of scholars in petroleum engineering [46,47,48]. The method can now be used as a platform to analyze various phenomena in porous media, including wettability alternation, multiphase flow, mass transfer process, etc. Garmeh et al. [49] solved the single-phase flow in a pore-scale network model to study the dispersion and mixing phenomena in porous media. Taheri et al. [50] predicted the solvent diffusion coefficient in heavy oil and bitumen with the sub-pore-scale modeling method and drew the conclusion that it produced similar results to classic experimental measurements.
The CO2 diffusion coefficients in bulk crude oils and in cores that are saturated with formation fluids have had wide concern recently due to the popularity of CO2 EOR. Many significant studies have been conducted in this field, while few attempts have been made to analyze the effect of crude oil properties on the CO2 diffusion process. In this paper, a generalized methodology has been developed to determine the diffusion coefficient of supercritical CO2 for cores that are saturated with different crude oils, under reservoir conditions. In theory, a mathematical model that describes the mass transfer process of CO2 in crude-oil-saturated cores has been established and combines the Peng-Robinson equation of state (PR EOS) and Fick’s diffusion equation. Experimentally, the pressure decay method has been employed to determine the diffusion coefficient. The pressure of the CO2 phase in the annular space of the diffusion cell was monitored and recorded during the mass transfer process of CO2 into the oil-saturated low-permeable cores. Once the difference between the tested and calculated pressure decay curves reached a minimum value, the diffusion coefficient of CO2 could be determined. In addition, the influence of oil properties on the CO2 diffusion coefficient has also been analyzed.

2. Experimental Section

2.1. Materials

The oil samples used in the present work were obtained by mixing kerosene and crude oil in various ratios to form a series of oil samples with different viscosities and component proportions. The kerosene was purchased from the China University of Petroleum (East China) and has a density and viscosity of 802.1 kg/m3 and 1.34 mPa∙s under 50 °C and atmospheric pressure, respectively. The crude oil used in this work was collected from Changji Oilfield in Xinjiang Province (China). The crude oil sample is dead oil without sands and brine, whose density measured with a densitometer (DMA 4200M, Anton Paar, Graz, Austria) was 936.8 kg/m3 under 50 °C and atmospheric pressure. The viscosity, which was measured by a rheometer (MCR 302, Anton Paar), is 1770.91 mPa∙s under the same conditions. The component distributions of both the kerosene and crude oil were determined with gas chromatography (GC), and the result is depicted in Figure 1. The CO2 used in this work was purchased from Tianyuan Co., Ltd. (Qingdao, China) and has a purity higher than 99.99 mol %. Artificial cores with a permeability that ranged from 0.096 to 0.103 mD were used as porous media in this work and were compressed with sand particles. The diameters of the sand particles in the cores were restricted to a tiny range, which can ensure the homogeneity and isotropy of the cores. The parameters of the cores used in this work are tabulated in Table 1.
Real reservoirs are heterogeneous and anisotropic, which makes the mass transfer process in reservoirs complicated [51,52,53]; however, this paper concentrates on the effect of oil properties on the CO2 diffusion coefficients. To simplify the model and analysis, artificial cores are introduced to eliminate the influence of this factor. Therefore, the effects of heterogeneity and anisotropy are ignored in this study.
According to Table 1, the characteristics (porosity and permeability) of the cores are not exactly the same. The artificial cores are compressed with sand particles and crosslinker; therefore, two factors contribute to the variable characteristics of the cores. First, the sand particles are not identical; thus, the inner structure of the cores is not totally regular. Second, the distribution of crosslinker may influence the properties of the cores; for instance, the layer of crosslinker on the particle surface can decrease the diameter of the pores. However, the properties of the cores that are employed in this work are so similar that the influence of different cores can be ignored.

2.2. Apparatus

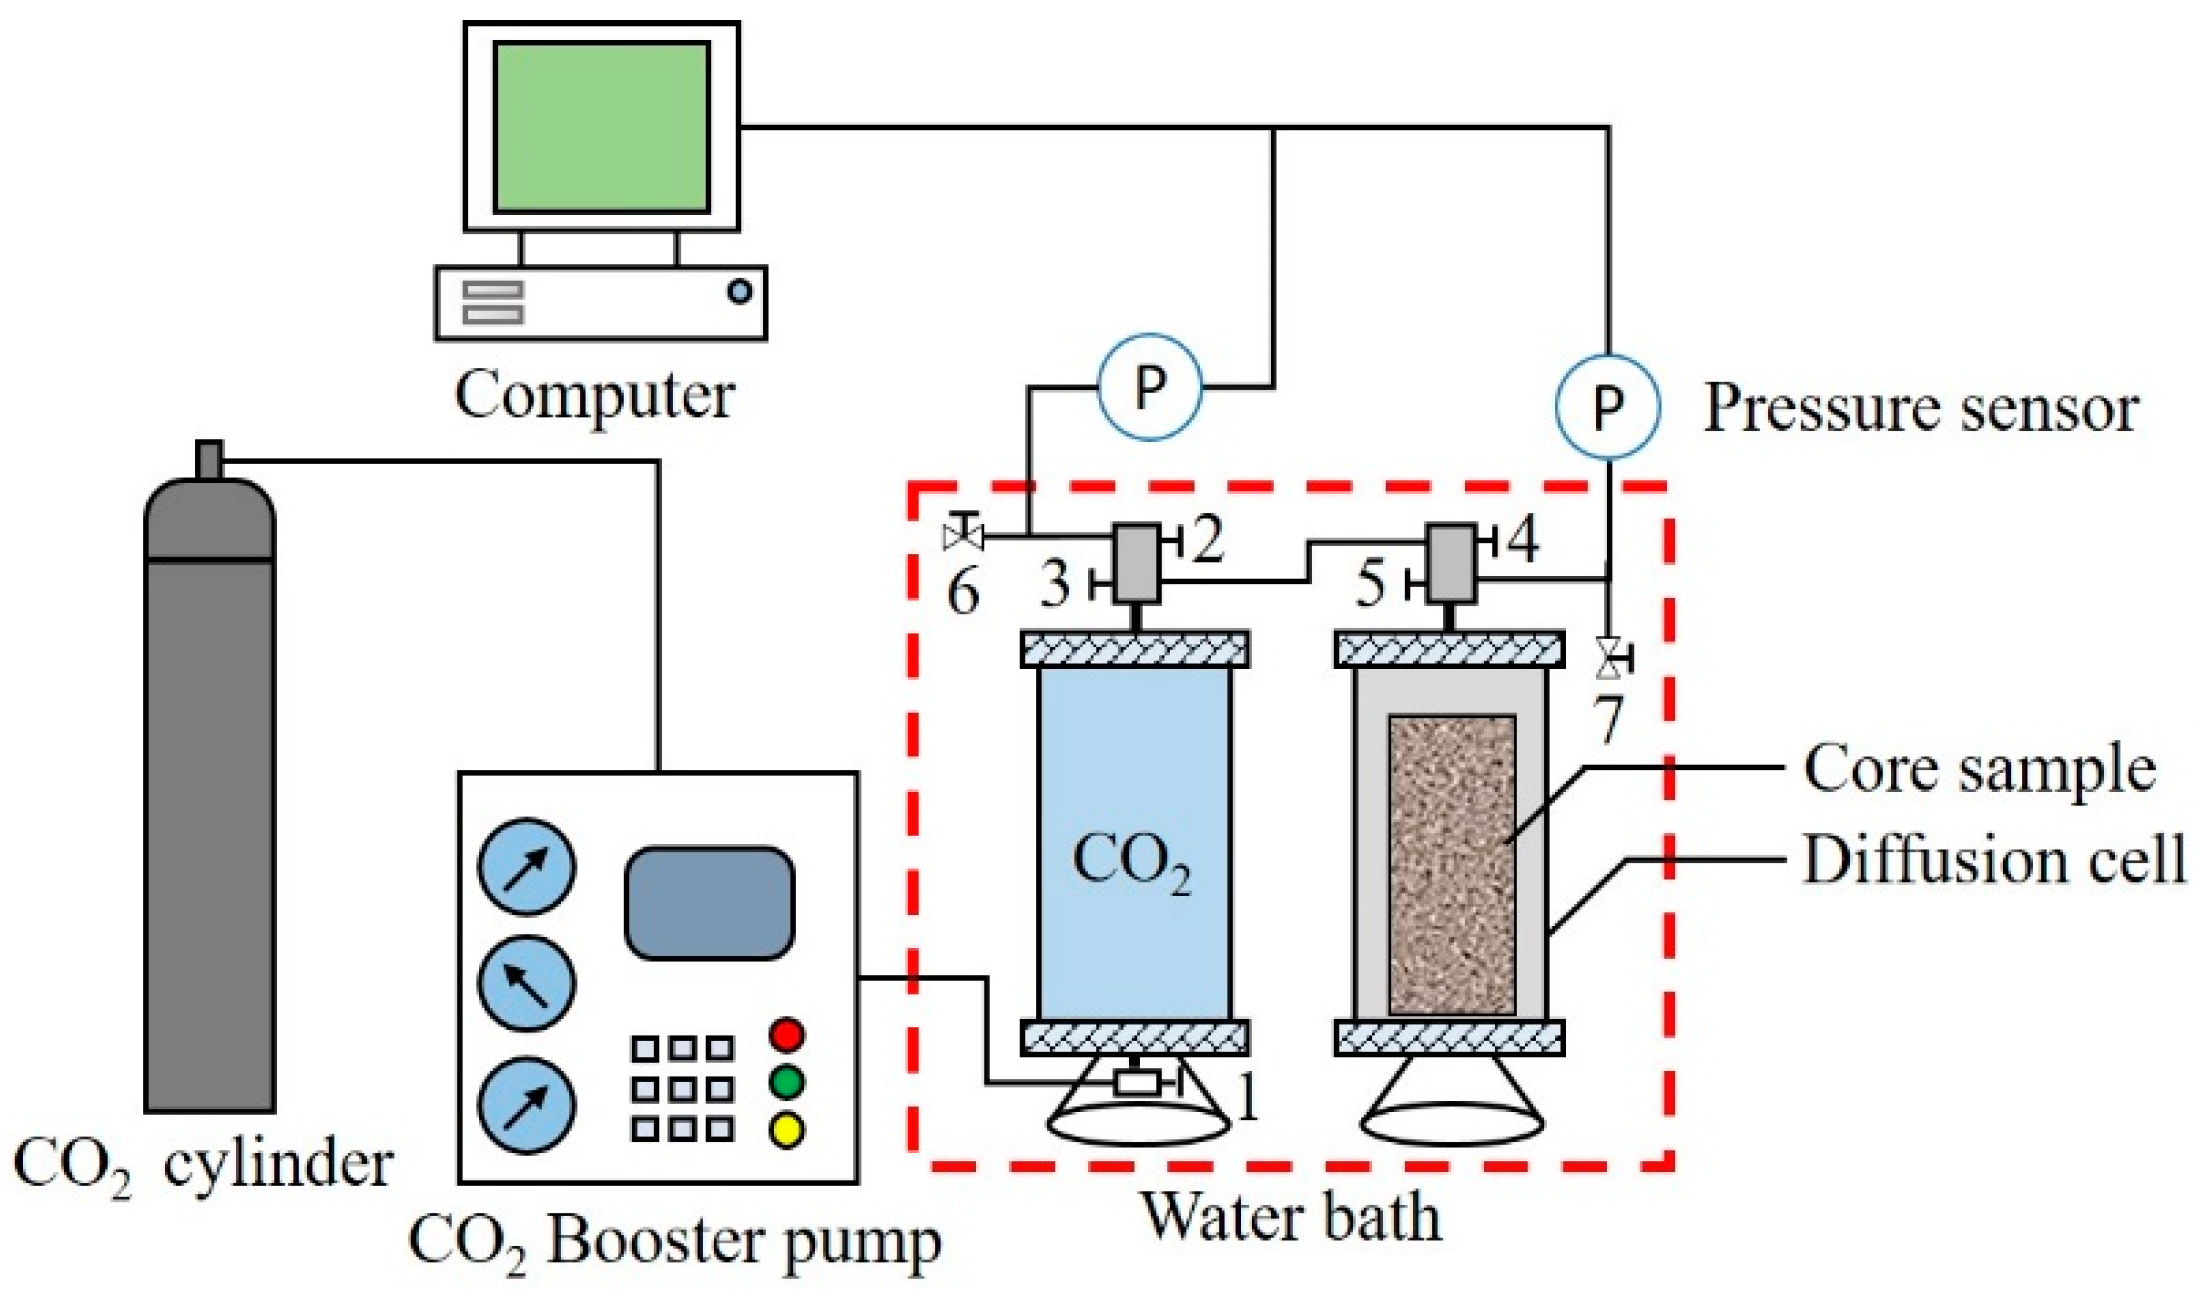
The schematic diagram of the apparatus used in this paper was illustrated in our previously published work and again in Figure 2 [54,55]. The CO2 diffusion experiments are conducted in a diffusion cell located in a water bath to keep a constant temperature for all the experiments. The core is placed in the center of the diffusion cell, and CO2 is introduced into the cylinder. The pressure of the CO2 decreases due to the diffusion of CO2 into the core. The pressure decay of the CO2 in the diffusion cell during each experiment is monitored and recorded by a pressure transducer, which can be used for diffusion coefficient calculation.

2.3. Experimental Procedures

The experimental procedures used in this study to test the CO2 diffusion coefficients in the oil-saturated cores are described as follows:
(a)
Clean and dry the core for the experiment, put it into an intermediate container and vacuum for 10.0 h. Then, the oil sample is injected into the intermediate container at room temperature until the pressure of the oil sample reaches 15.0 MPa; maintain this pressure for 48.0 h to ensure that the core pores are completely saturated with crude oil.
(b)
Seal the two ends of the oil-saturated core with epoxy resin and aluminum foil to ensure that CO2 can diffuse only through the side surface of the core.
(c)
Connect the apparatus that is required for the diffusion experiment according to Figure 2. After testing the air tightness of the diffusion cell, place the core in it. Replace the air in the diffusion cell with low pressure CO2.
(d)
Put the diffusion cell and CO2 container into the water bath at the required temperature for 4.0 h, and open valve 5 to monitor the pressure in the CO2 container.
(e)
When the pressure inside the CO2 container is stable, open valves 2, 3 and 4 to inject CO2 into the diffusion cell. Close valves 3 and 4 quickly after the pressure in the diffusion cell and CO2 container reach a balance, and record the pressure decay in the diffusion cell.
(f)
When the pressure in the diffusion cell does not change, finish the diffusion experiment. Slowly open all valves, release the fluid in the diffusion cell, and clean the equipment for the next set of experiments.

3. Mathematical Model

3.1. Diffusion Model in Porous Media

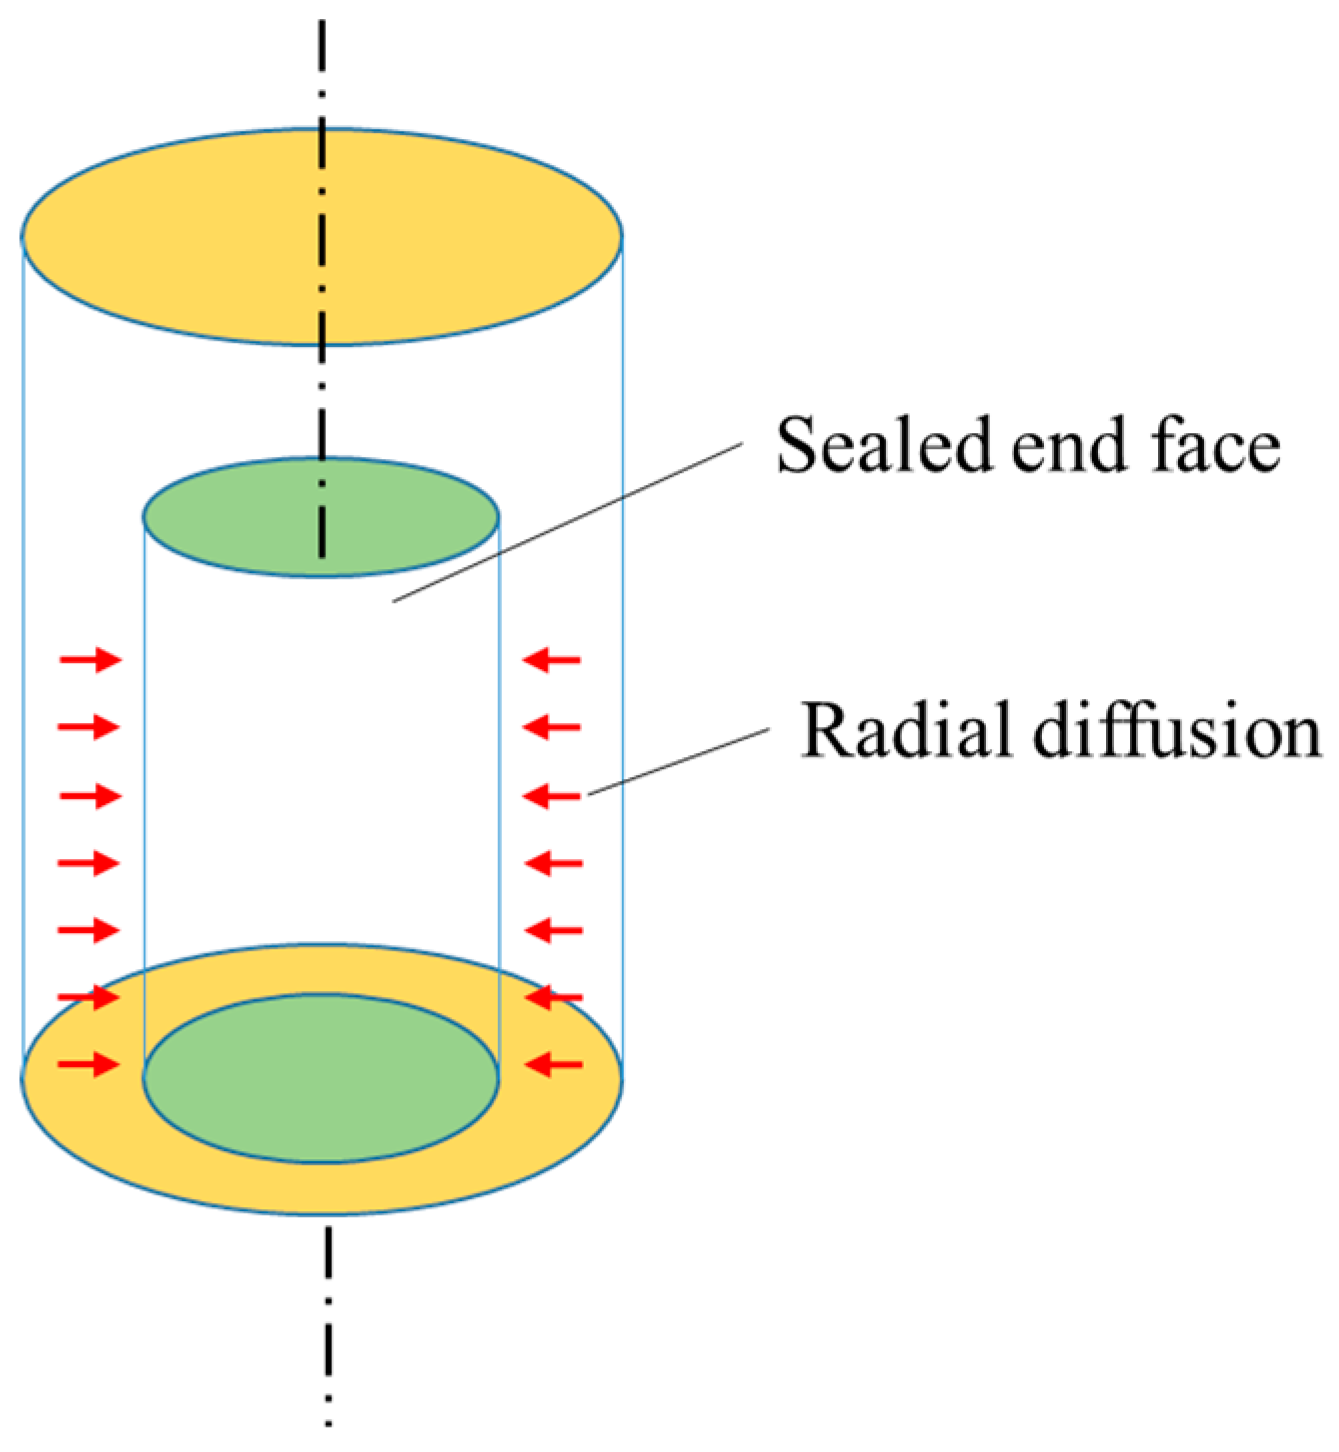
The physical model used in this study is shown in Figure 3 [54,55]. The two end faces of the core sample are sealed with aluminum foil with epoxy resin, just as we did in our previous work [55], which makes the end faces impermeable. Thus, CO2 can diffuse only in the radial direction of the core. The mathematical model used in this study includes Fick’s diffusion equation and PR EOS to describe the diffusion process from the CO2 phase to the cores being saturated with different oil samples. The mass transfer of CO2 is considered by the diffusion equation, while the phase behavior between CO2 and the oil sample is described by PR EOS. Several assumptions that were adopted for this mathematical model are elaborated below:
(1)
Cores are homogenous and isotropic, i.e., the influences of different cores are ignored.
(2)
Oil saturates all pores in the cores, i.e., oil saturation is 100%.
(3)
CO2 concentration at the side surface of the core is constant during the diffusion process.
(4)
The extraction effect of CO2 on oil is negligible. (The literature has reported that the extraction effect of CO2 on hydrocarbons that are heavier than C9 is tiny [56], and Figure 1 shows that it is reasonable to ignore extraction in this study.)
(5)
The convection flow caused by the density difference is ignored.
(6)
The CO2 transfer process occurs only in the radial direction.
(7)
There is no heat exchange during the diffusion process.
In the cylindrical coordinates system, Equation (1) is used to describe the radial diffusion process of CO2 in oil-saturated porous media. A velocity item is introduced into the equation to consider the influence of oil swelling due to CO2 dissolution:
c t = D 2 c r 2 c u r c u r ( u D r ) c r
where c is the concentration of CO2 in the oil sample, mol/m3, t is diffusion time, s, u is the flow velocity that is generated by the volume expansion of the oil sample, m/s, r is the distance to the central axis of the core, m, and D is the effective diffusion coefficient of CO2 in the oil-saturated core, m2/s.
To facilitate the solution of the mathematical model, Equation (2) is used to nondimensionalize the diffusion equation, which can be expressed as Equation (3):
{ r ¯ = r r 0   c ¯ = c c 0 τ = t D r 0 2   u ¯ = u r 0 D λ = u ¯ 1 r ¯
c ¯ τ = 2 c ¯ r ¯ 2 λ c ¯ r ¯ c ¯ u ¯ r ¯ c ¯ u ¯ r ¯
where r ¯ is the dimensionless distance, r0 is the radius of the core, m, c ¯ is the dimensionless concentration, c0 is the saturation concentration of CO2 in crude oil under experimental conditions, mol/m3, τ is dimensionless time and u ¯ is the dimensionless velocity.
According to the characteristics of diffusion, the side surface of the core can be considered the Dirichlet boundary, and the central axis of the core can be considered a closed boundary. The boundary conditions and initial conditions of the mathematical model can be represented by Equations (4) and (5), respectively. The full implicit finite difference method is employed to solve the above model. In the discrete process, the derivative of the concentration and velocity with space is a second-order central difference scheme, and the derivative of concentration with time is a first-order forward difference scheme:
{ c ¯ = 1 ( r ¯ = 1 , τ > 0 ) u ¯ = 0 , c ¯ r ¯ = 0 ( r ¯ = 0 , τ 0 ) ,
{ u ¯ = 0 , c ¯ = 1 ( r ¯ = 1 , τ = 0 ) u ¯ = 0 , c ¯ = 0 ( r ¯ < 1 , τ = 0 ) ,

3.2. Peng-Robinson Equation of State (PR EOS)

The CO2 pressure of the diffusion cell is recorded for the pressure decay method, and the pressure prediction thus affects the accuracy of the CO2 diffusion coefficient. PR EOS is introduced in this paper, and the interaction between CO2 and the oil sample is considered, which increases the calculation accuracy of the annular pressure and diffusion coefficient. PR EOS is a third-order equation with two constants that were proposed by Peng and Robinson [57]. It is a semi-empirical model that is widely applied in the petrochemical industry, and it describes the phase behavior and phase equilibrium of multicomponent systems. PR EOS requires the specific parameters of the components in the system and the binary interaction parameters (BIPs) between each component. PR EOS can be expressed by Equations (6) and (7):
P = R T V b a V ( V + b ) + b ( V b )
{ a = a c α ( T r , ω ) a c = 0.457235 R 2 T c 2 P c b = 0.0777969 R T c P c
where P is the system pressure, Pa, R is the general gas constant, 8.314 J/mol/K, T is the system temperature, K, V is the molar volume, m3/mol, Tc is the critical temperature, K, and Pc is the critical pressure, Pa. α is a function of the relative temperature and acentric factor.
The composition of the oil sample is complex. Although PR EOS sets no restriction on the number of components in the mixture, the computing load sharply increases with the number of components. Thus, it is important to simplify the calculation process with the prerequisite of ensuring a high accuracy of calculation. In this study, several pseudo-components are introduced as substitutes for all hydrocarbon components in the oil sample, which can efficiently decrease the calculation load of PR EOS without influencing the computing accuracy [56,57,58]. Specifically, in this work, hydrocarbons with a single carbon number (SCN) are lumped into three pseudo-components, which have been tested as having a good result on the oil/CO2 system [59,60]. The parameters of the pseudo-components were determined with a series of empirical models [61,62,63,64,65,66,67,68], and the specific data are listed in the results section.

3.3. Determination of the Diffusion Coefficients

The CO2 diffusion coefficient is determined by fitting the experimental and calculated data with particle swarm optimization (PSO). The calculated pressure-time (p-t) curve can be adjusted to minimize the error with a measured p-t curve by optimizing the value of the diffusion coefficient, according to Equation (2). The CO2 diffusion coefficient is determined once the value of the objective function reaches a minimum, which is shown in Equation (8):
Error = 1 PN i = 1 PN ( t E i t C i ) 2
where PN is the data number of the p-t curve, and tEi and tCi are the experimental and calculated times, respectively. For the calculated p-t curve, the pressure values can be determined with the following steps:
(1)
Determine CO2 concentration distribution in the core.
(2)
Calculate the mole composition in the annular space of the diffusion cell according to the amount of swelled oil and dissolved CO2.
(3)
Determine the pressure value by solving PR EOS with data that are obtained in step 2.
Moreover, global regression and piecewise regression are employed to determine the CO2 diffusion coefficients. In a global regression, all experimental data points are used, and a constant coefficient is obtained to describe the average rate of mass transfer. In the early stage and later stage regressions, part of the data points is employed to calculate the diffusion coefficients, and two diffusion coefficients are obtained to describe the rate of mass transfer in the early and later stages, respectively. The relevant contents will be elaborated in the Results section.

4. Results and Discussion

4.1. Characterization of the Oil Samples

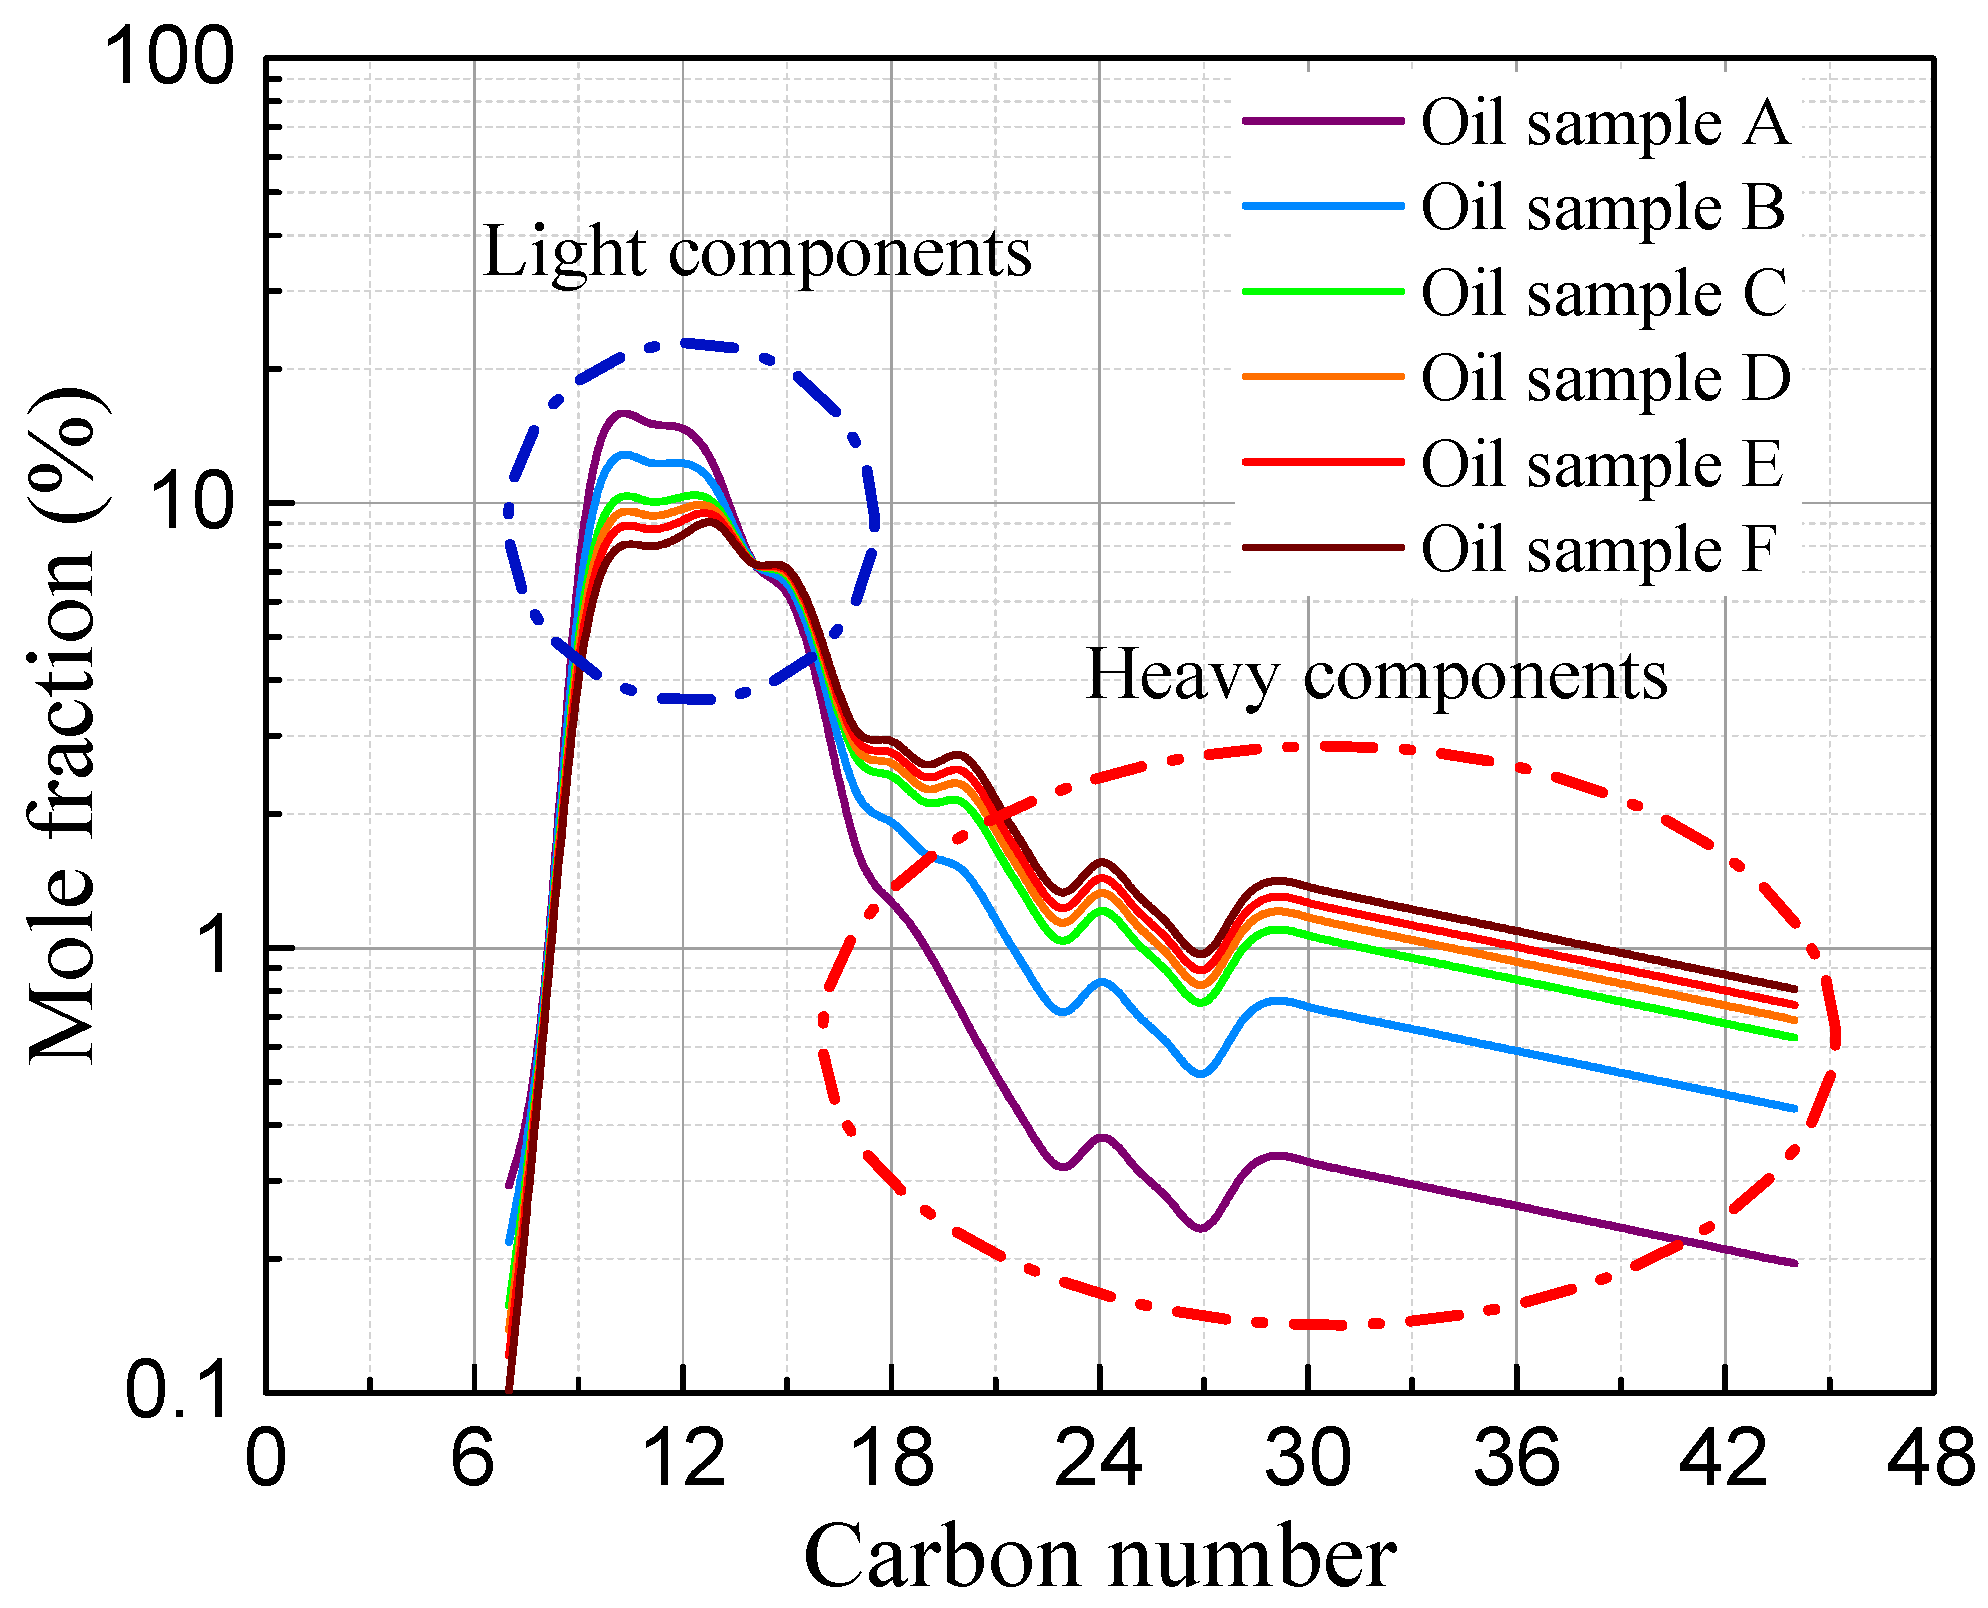
Six groups of oil samples, which were prepared by mixing kerosene and crude oil under different volume ratios, are used in the diffusion experiments to study the influence of oil properties on the CO2 diffusion coefficient. The viscosity-temperature curves of the oil samples are presented in Figure 4, and the viscosity of each oil sample at the experimental temperature is marked in the figure (the pentagram symbols). The carbon distributions of the oil samples that were determined with the method in the literatures [55,59] are illustrated in Figure 5. It is notable that the carbon distributions of kerosene and crude oil are determined with the above method, and the carbon distribution of mixed oil is determined by combining the carbon distribution of the two oils according to their mixing ratio. The detailed process can be described with Equation (9):
z i = z i c n c + z i k n k n c + n k
where zi, z i c and z i k are the mole friction of component i in the mixed oil, crude oil and kerosene samples, respectively, and nc and nk are the mole numbers of crude oil and kerosene, respectively.
Figure 5 shows that the components lighter than C9 account for a tiny part of those oil samples (<1%), which means that there is no obvious extraction effect during the mass transfer process [56,59,60]. The components of the CO2 phase were analyzed by a GC method after the diffusion experiments, and no hydrocarbons were found in the CO2 phase. The GC analysis result agrees with our previous work [55] and proves that neglecting the extraction effect is reasonable. According to the figure, from oil samples A to E, the number of light components (C9–C15) decreases, while the amount of heavy components (heavier than C18) increases gradually. Multiple pseudo-components are introduced in this work to replace the entire carbon distribution to characterize the oil samples, which greatly reduces the computational cost [60]. The pseudo-component parameters are tabulated in Table 2. The tendencies and values of the data in Table 2 are analogous to our previous work [55], which proves the reliability of the parameters. The binary interaction parameter (BIP) matrix is listed in Table 3 and describes the interactions among the components in the system. BIPs between hydrocarbons are set at 0 according to [61,69]. Moreover, only the parameters of oil sample A are given in Table 2 and Table 3; the parameters of the other oil samples are presented in the Appendix A.

4.2. Solution of the Diffusion Model in the Oil-Saturated Cores

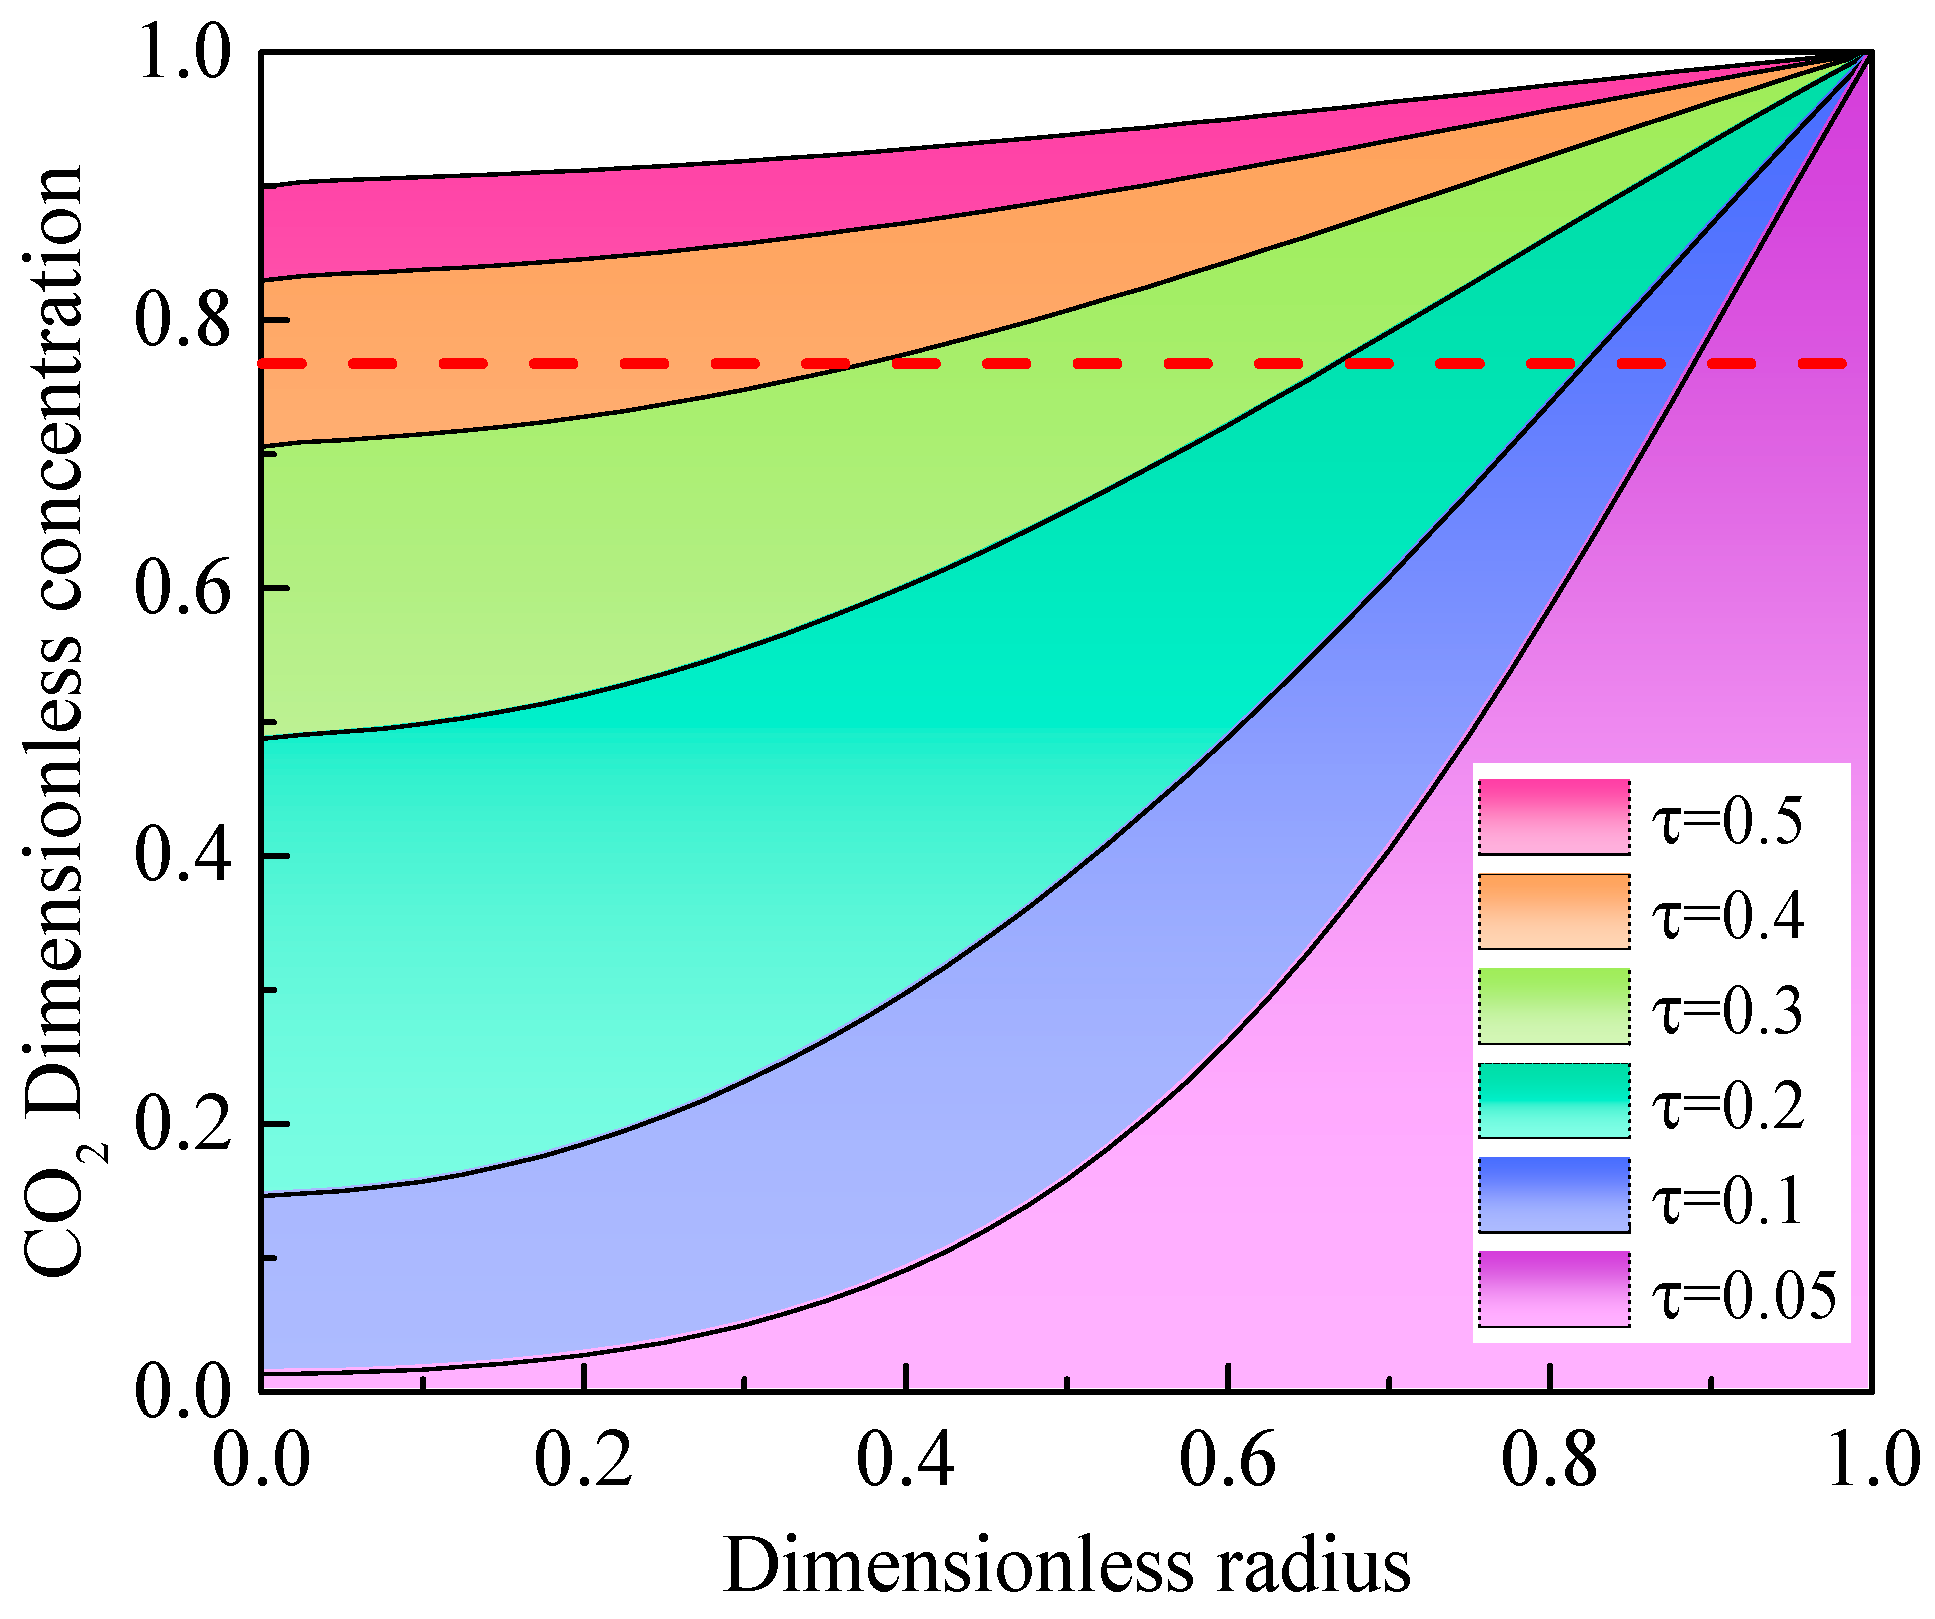
The features of the CO2 diffusion process in the oil-saturated porous media can be characterized by concentration and velocity profiles, which are obtained by solving the diffusion mathematical model that is proposed in Section 3.1 [54,55]. The CO2 concentration profile during the diffusion process is presented in Figure 6, where black curves identify the CO2 concentrations at different space and time grids.
The area between a curve and the x-axis characterizes the total CO2 amount in the core at a specific time point, and the area between two curves can characterize the increment of CO2 during this period of time. According to Figure 6, the CO2 concentration at the central axis ( r ¯ = 0 ) almost reaches 0.5 when dimensionless time is 0.2, and the area between the curve and the x-axis show that the average CO2 concentration was above 0.7 at this moment (the red dashed line in Figure 6). The tendency shows that most of the CO2 diffuses into the oil-saturated core at the early stage of the diffusion process. Moreover, the area of the colored region between two curves decreases with the increase in dimensionless time, which shows that the increase in CO2 in the core gradually slows down, i.e., the speed of mass transfer slows down. Therefore, the diffusion process is divided into two stages, namely, an early stage with a high diffusion rate and a later stage with a lower diffusion rate, which is identical to our previous work [55].
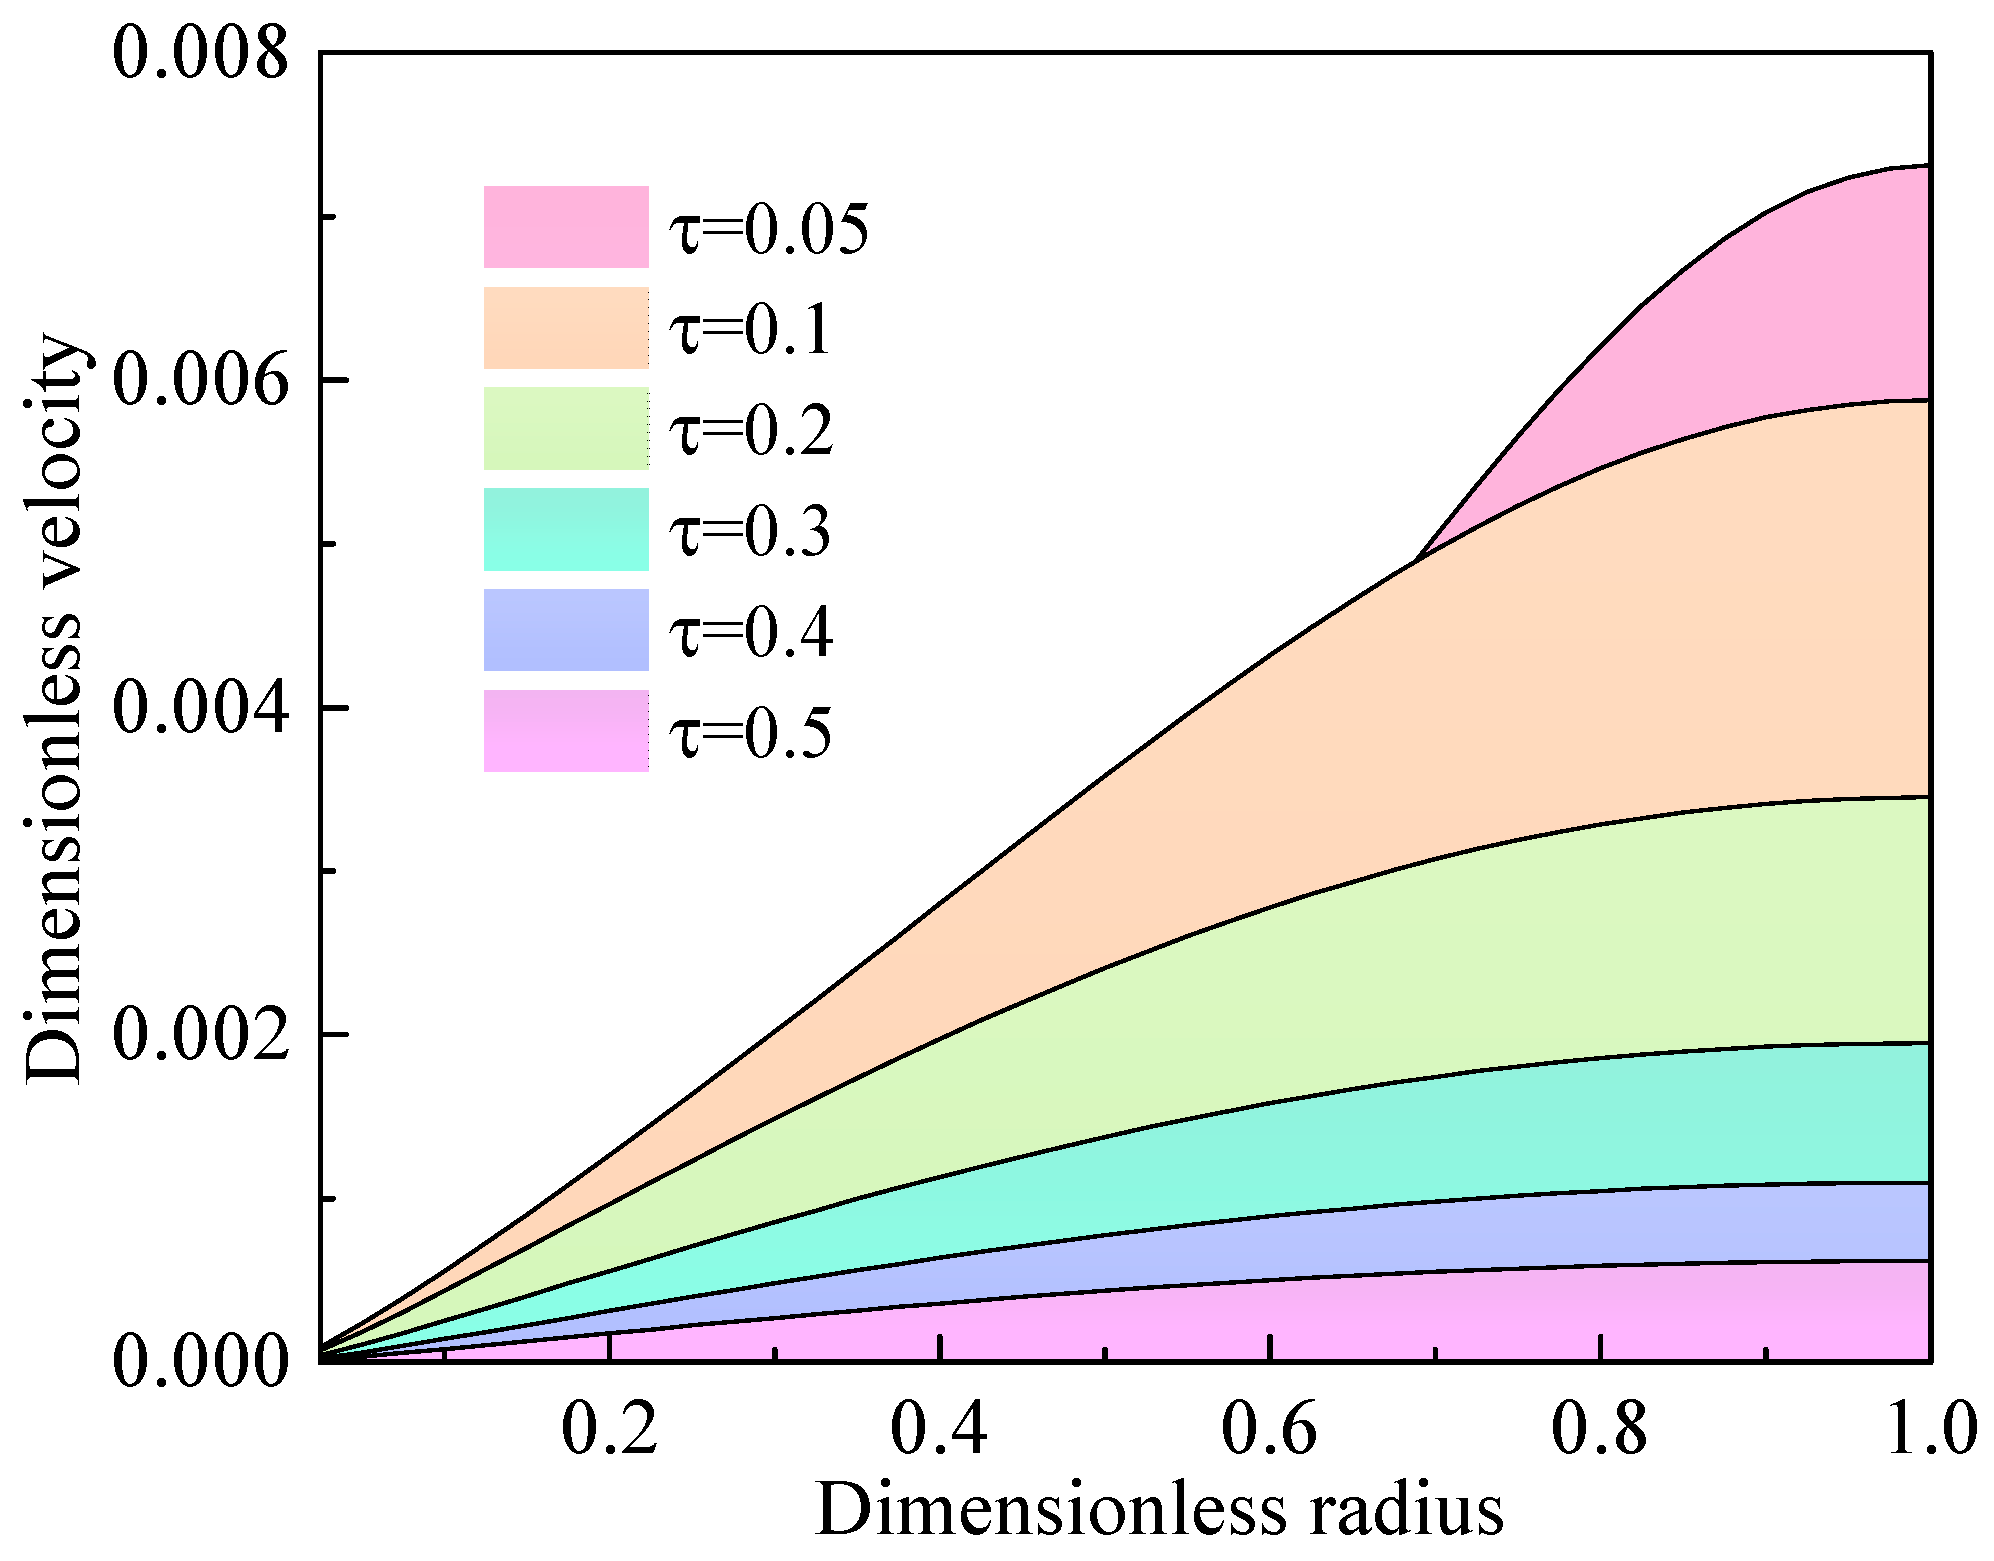
The velocity profile caused by oil volume swelling is illustrated in Figure 7. The trend of Figure 7 shows that the velocity of oil is relatively high at the early stage (τ < 0.2), which means that the fast volume expansion of oil, i.e., the diffusion rate of CO2, is relatively high. The following decrease in velocity characterizes the relatively slow diffusion rate in the later stage. Thus, Figure 6 and Figure 7 complement and confirm one another. It should be noted that the velocity difference between the outer part and inner part of the core is obvious at an early stage; then, the difference decreases gradually, which shows CO2 diffusing from the outer part to the inner part of the core. More details have already been elaborated in our previous work.

4.3. Effect of the Oil Properties on the Diffusion Coefficient

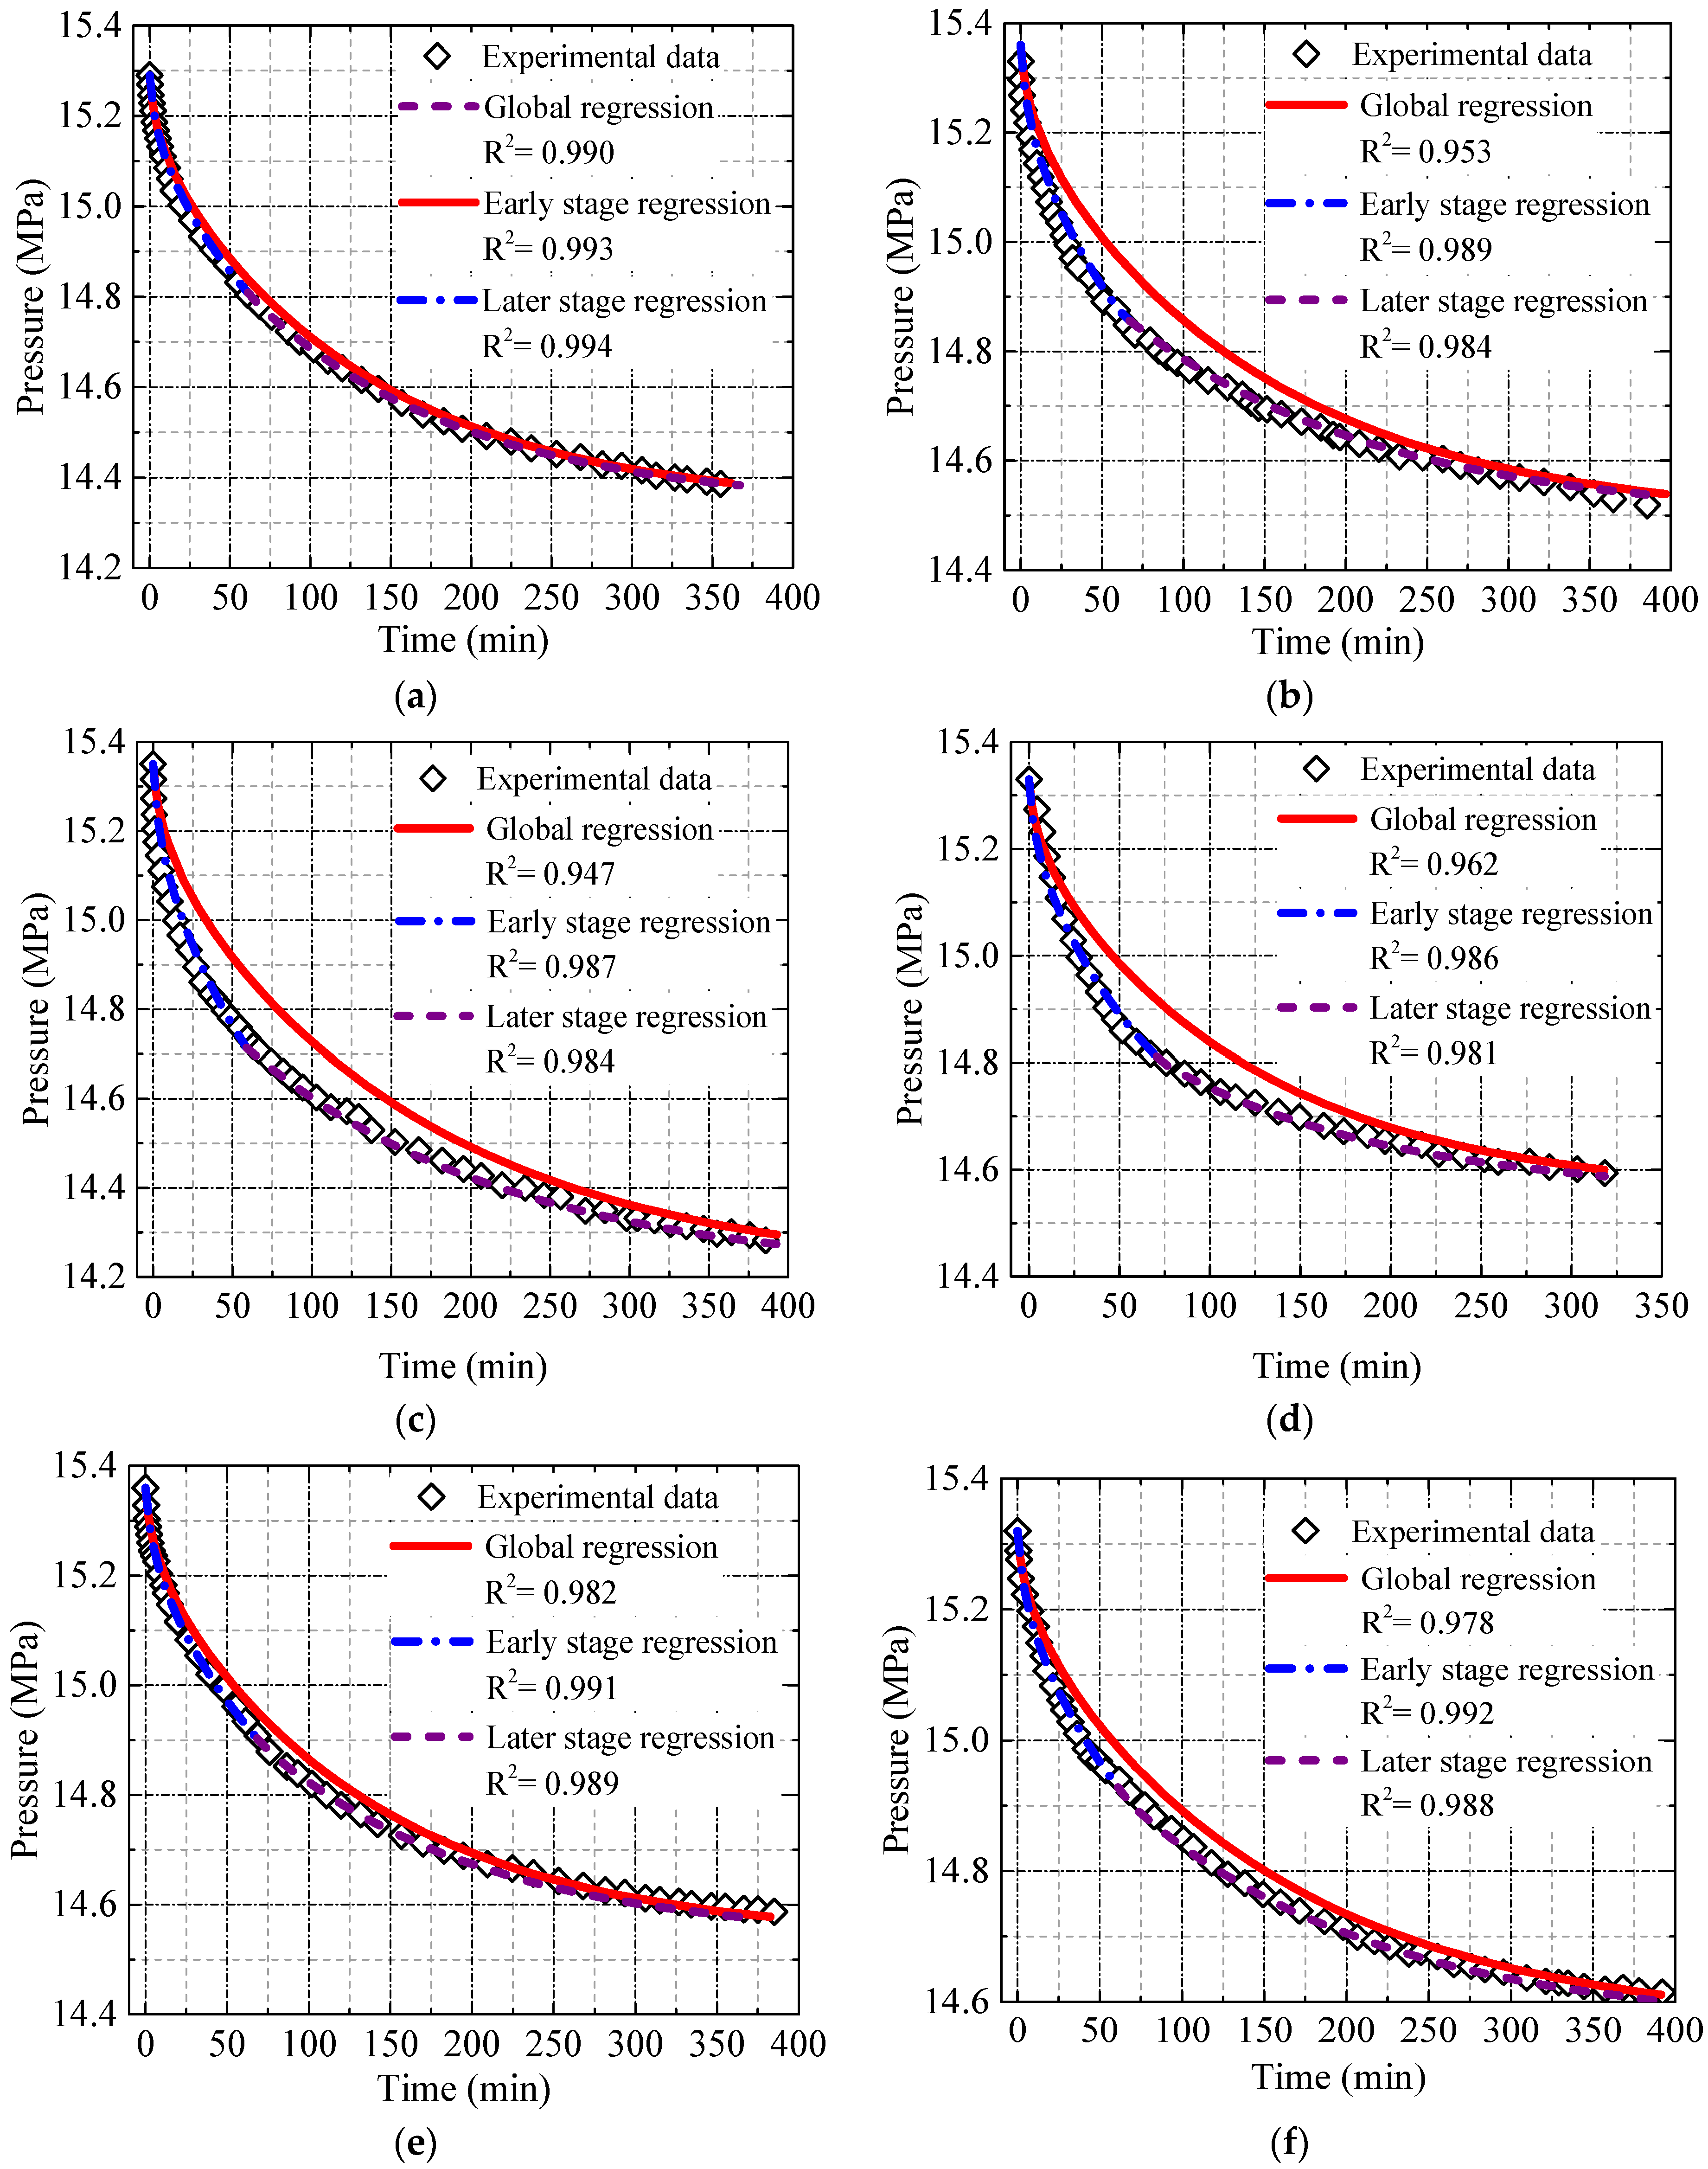
A pressure decay experiment is employed in this paper to study the CO2 diffusion process in oil-saturated tight cores under reservoir conditions. The diffusion coefficient of CO2 is determined with the experimental pressure recording and mathematical model that is listed in Section 3, and the pressure curves of the diffusion experiments with different oil samples are depicted in Figure 8. Except for the experimental data, the global fitting (red line) with a constant diffusion coefficient and the piecewise fitting (blue and violet dashed lines) with variable diffusion coefficients are also given in Figure 8. Although there are some differences between the results of the global regression of the different experiments (see Figure 8a,b), which can be attributed to experimental and calculation errors, the value of the goodness-of-fit in each set of experiments shows that both regression methods have acceptable accuracy. This value also shows that the piecewise regression has a better result than the global regression. The highly precise result of the piecewise fitting agrees with the literature [70,71] that suggests that the diffusion coefficient is a variable during the diffusion process, and it also proves the reliability of the conclusions in Section 4.2.
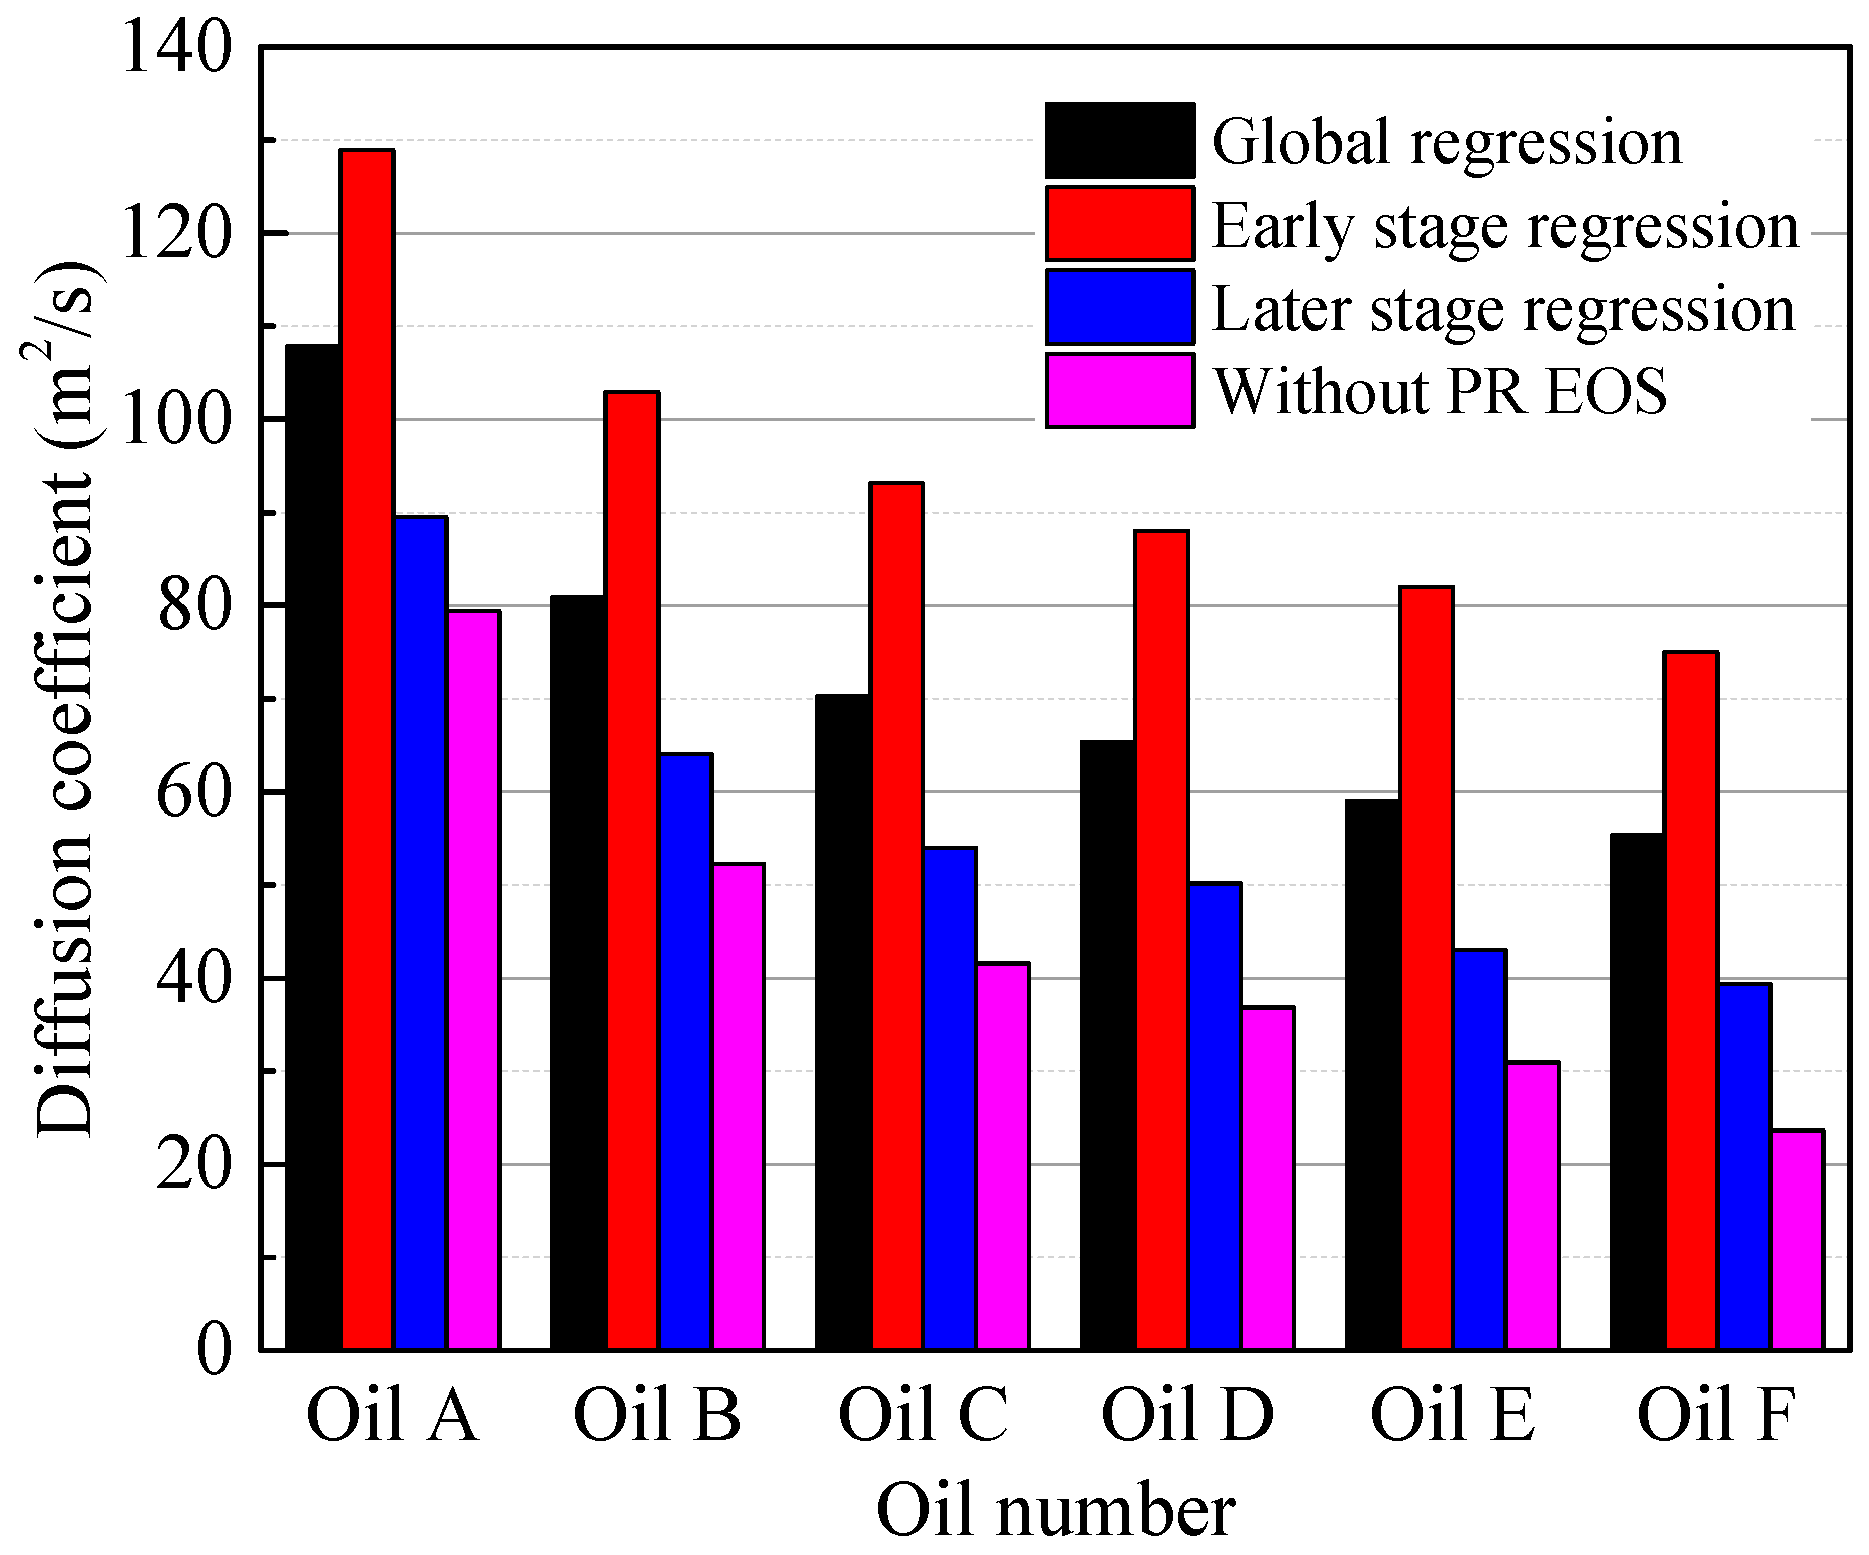
The CO2 diffusion coefficients in tight porous media that is saturated with different oil samples, at 70 °C and 15.29–15.36 MPa, are illustrated in Figure 9. In the experimental range of this study, the diffusion coefficients obtained with the global regression range from 55.325 × 10⁻¹⁰ to 107.886 × 10⁻¹⁰ m2/s. For the piecewise regression, the diffusion coefficients range from 74.975 × 10⁻¹⁰ to 128.925 × 10⁻¹⁰ m2/s at the early stage and from 39.389 × 10⁻¹⁰ to 89.462 × 10⁻¹⁰ m2/s at the later stage. The figure also shows that the CO2 diffusion coefficient decreases gradually from oil samples A to F, and the decreasing tendency can be attributed to the following two factors:
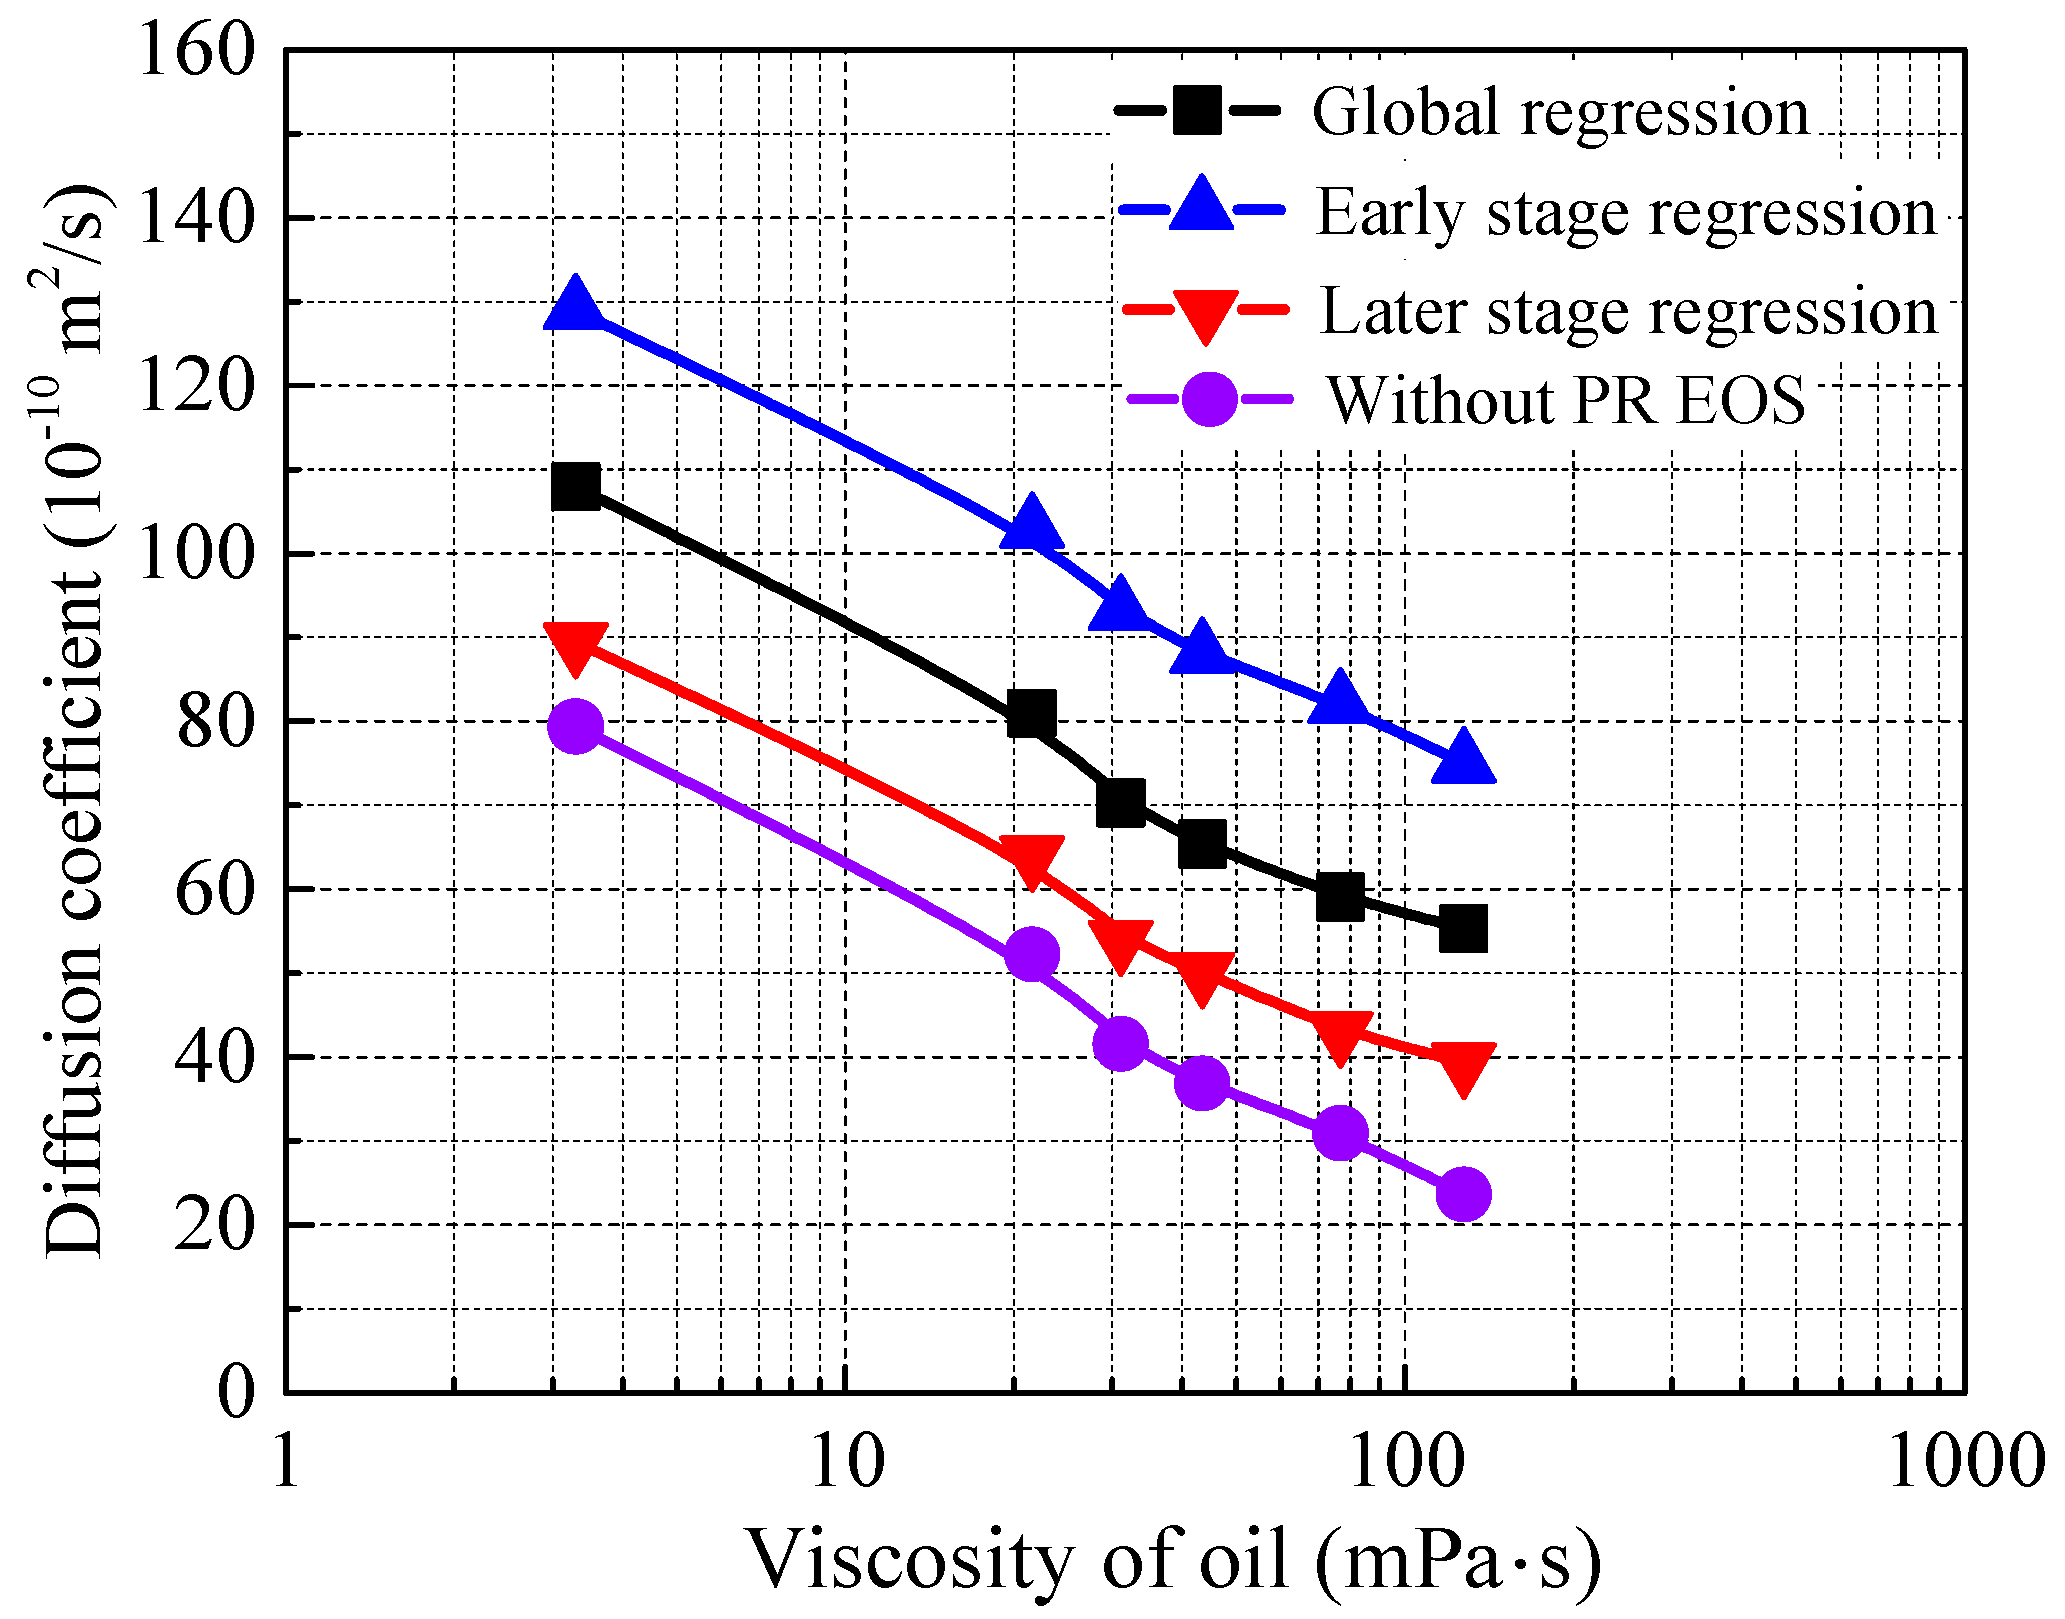
(1) The increase in the viscosity of the oil samples. Numerous scholars have indicated that the viscosity of the liquid phase has an obvious influence on the diffusion coefficient [59,72,73,74,75]. The effect of oil viscosity on the CO2 diffusion coefficient is depicted in Figure 10. The figure shows that a lower viscosity can facilitate the CO2 diffusion process, which agrees with the negative relationship between the two parameters that are proposed in the literature [59,74,75,76]. Moreover, Figure 9 and Figure 10 also show the obvious tendency of the diffusion coefficients at different stages. The diffusion coefficient at the early stage is always higher than the average level (global regression), while the diffusion coefficient at the later stage is always lower than the average level. The coefficient that is determined without PR EOS is minimal because it ignores the interaction of oil and CO2. It is notable that the experimental data form a good linear trend in the semilogarithmic coordinate system.
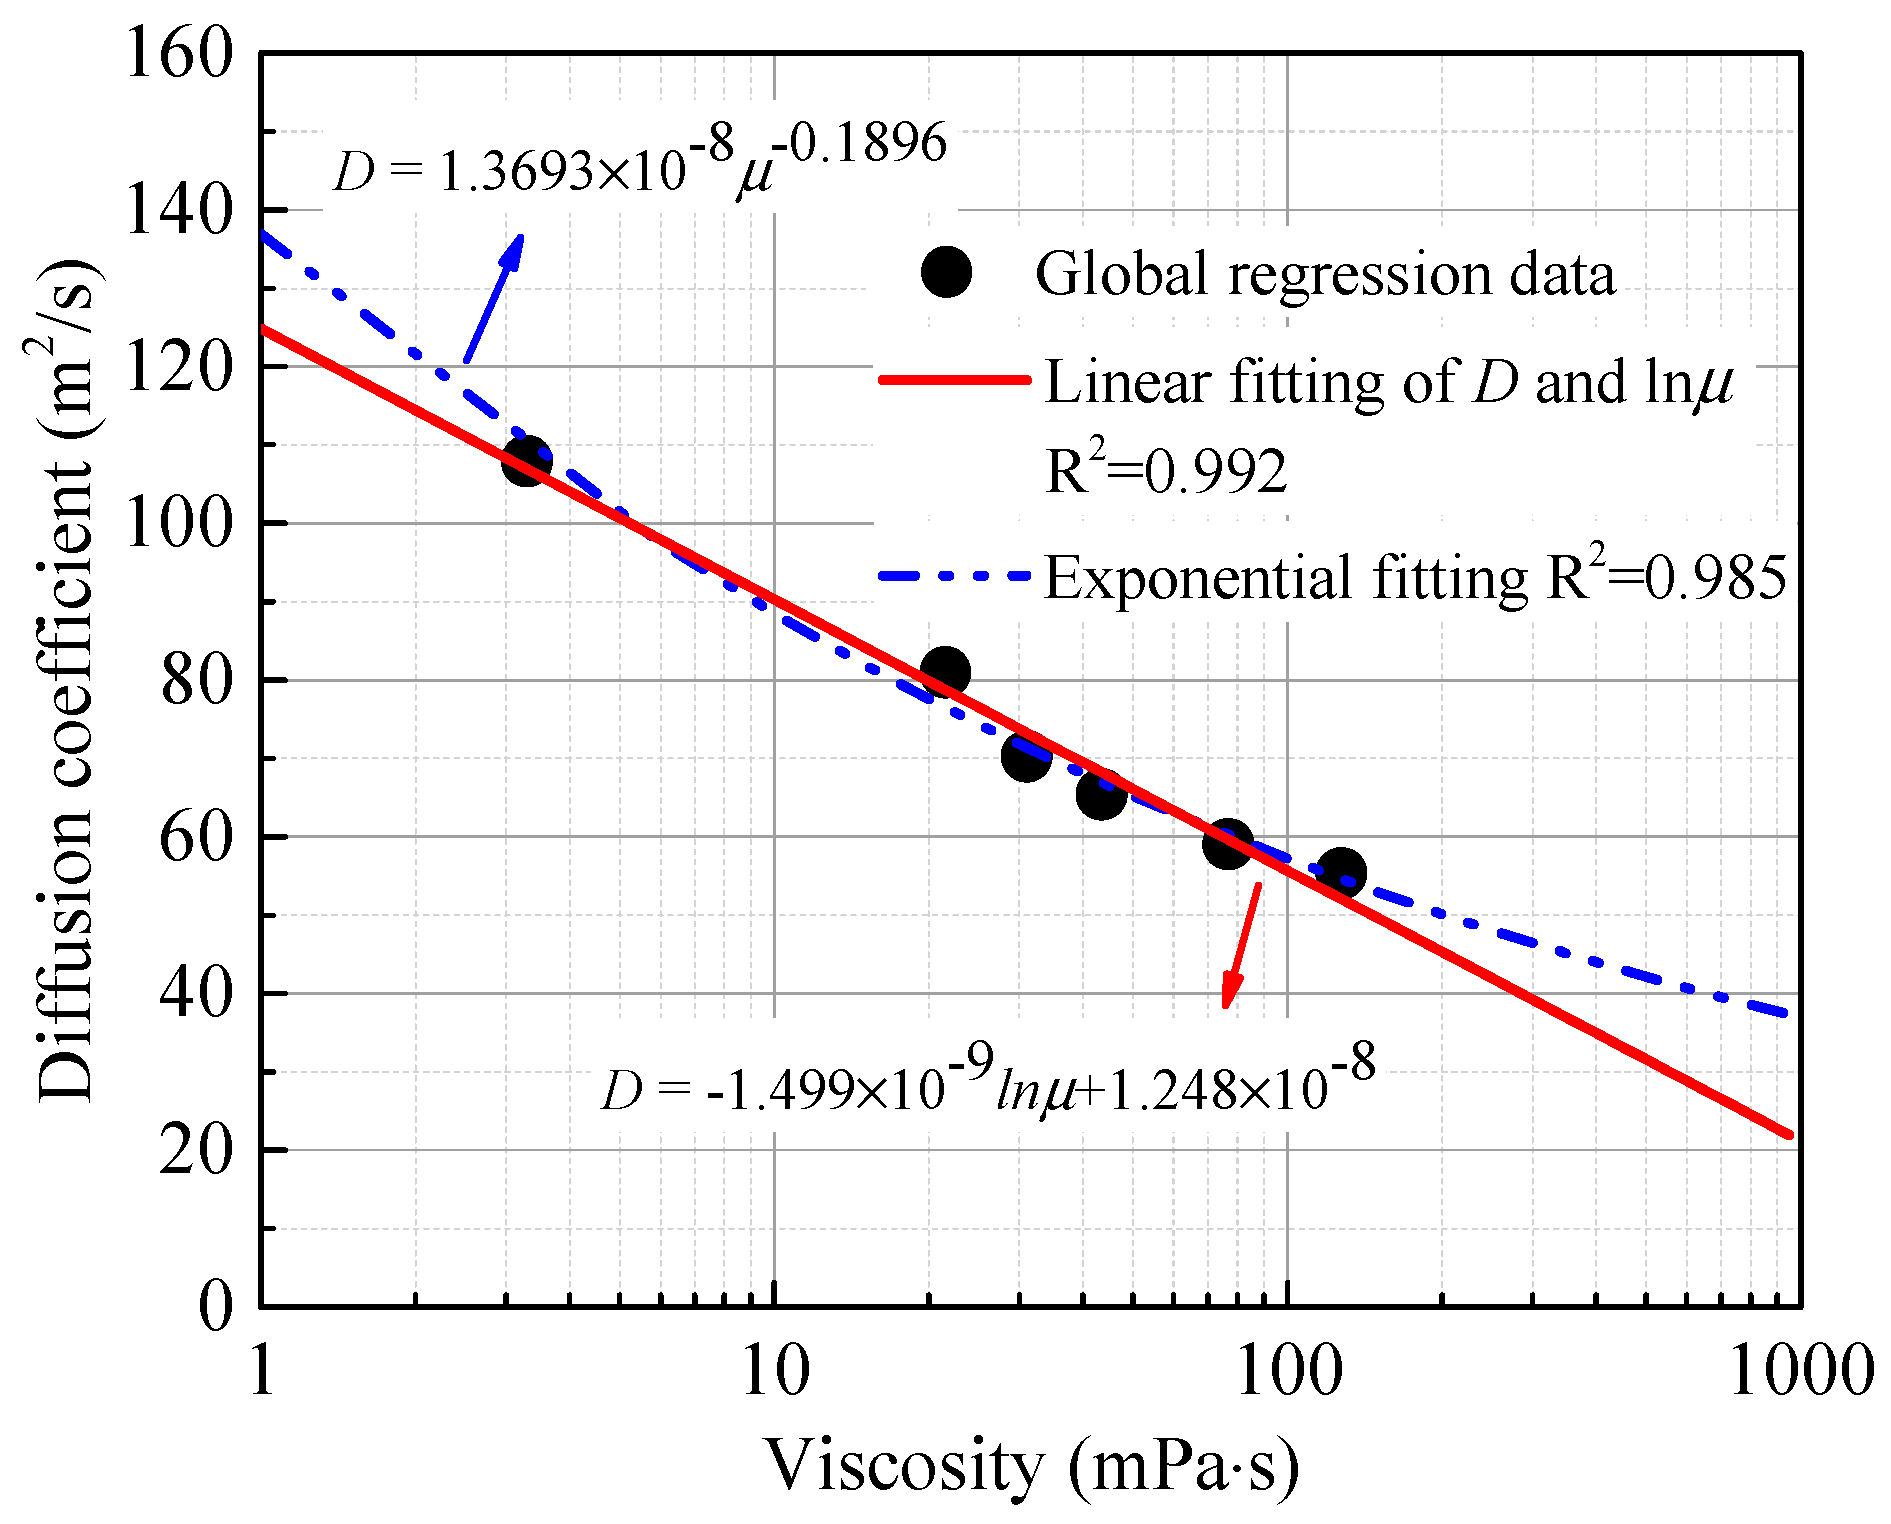
Hayduk and Cheng [77] tested a large amount of the experimental data in the literature to reveal the relationship between the diffusion coefficient and the viscosity of the solvent. They indicated that any diffusing substance has a specific exponential correlation between its diffusion coefficient and the viscosity of the solvent (or pure liquid phase), which is irrelevant to the components of the solvent. Their conclusion is summarized as equation 10, where μ is the viscosity of the solvent or pure liquid phase:
D = A μ B
Equation (10) is employed to fit the diffusion coefficient data in Figure 10, which are obtained from the global regression. Moreover, a linear fitting method in a semi-logarithmic coordinate system is also introduced, because of the obvious linear relationship between the diffusivity and viscosity in Figure 10. The experimental data and two fitting lines are illustrated in Figure 11. As seen, both fitting methods have a satisfactory goodness-of-fit. The similar trend of experimental data and the classic exponential model (the blue dash-and-dotted line in Figure 11) proves that the data in this paper are reliable and that the viscosity of the liquid phase greatly influences the diffusion process. However, the linear fitting of D and lnμ shows a better result than the exponential model, and the deviation between the two fitting lines increases gradually as the viscosity increases. This finding may reveal that for a complex liquid such as petroleum, viscosity is not the exclusive factor that affects the diffusion process.
(2) The increasing proportion of heavy components in the oil samples. As shown in Figure 5, from oil samples A to F, the proportion of heavy components increases gradually. Several scholars have suggested that the components of oil also directly influence the diffusion process of CO2 [73,75].
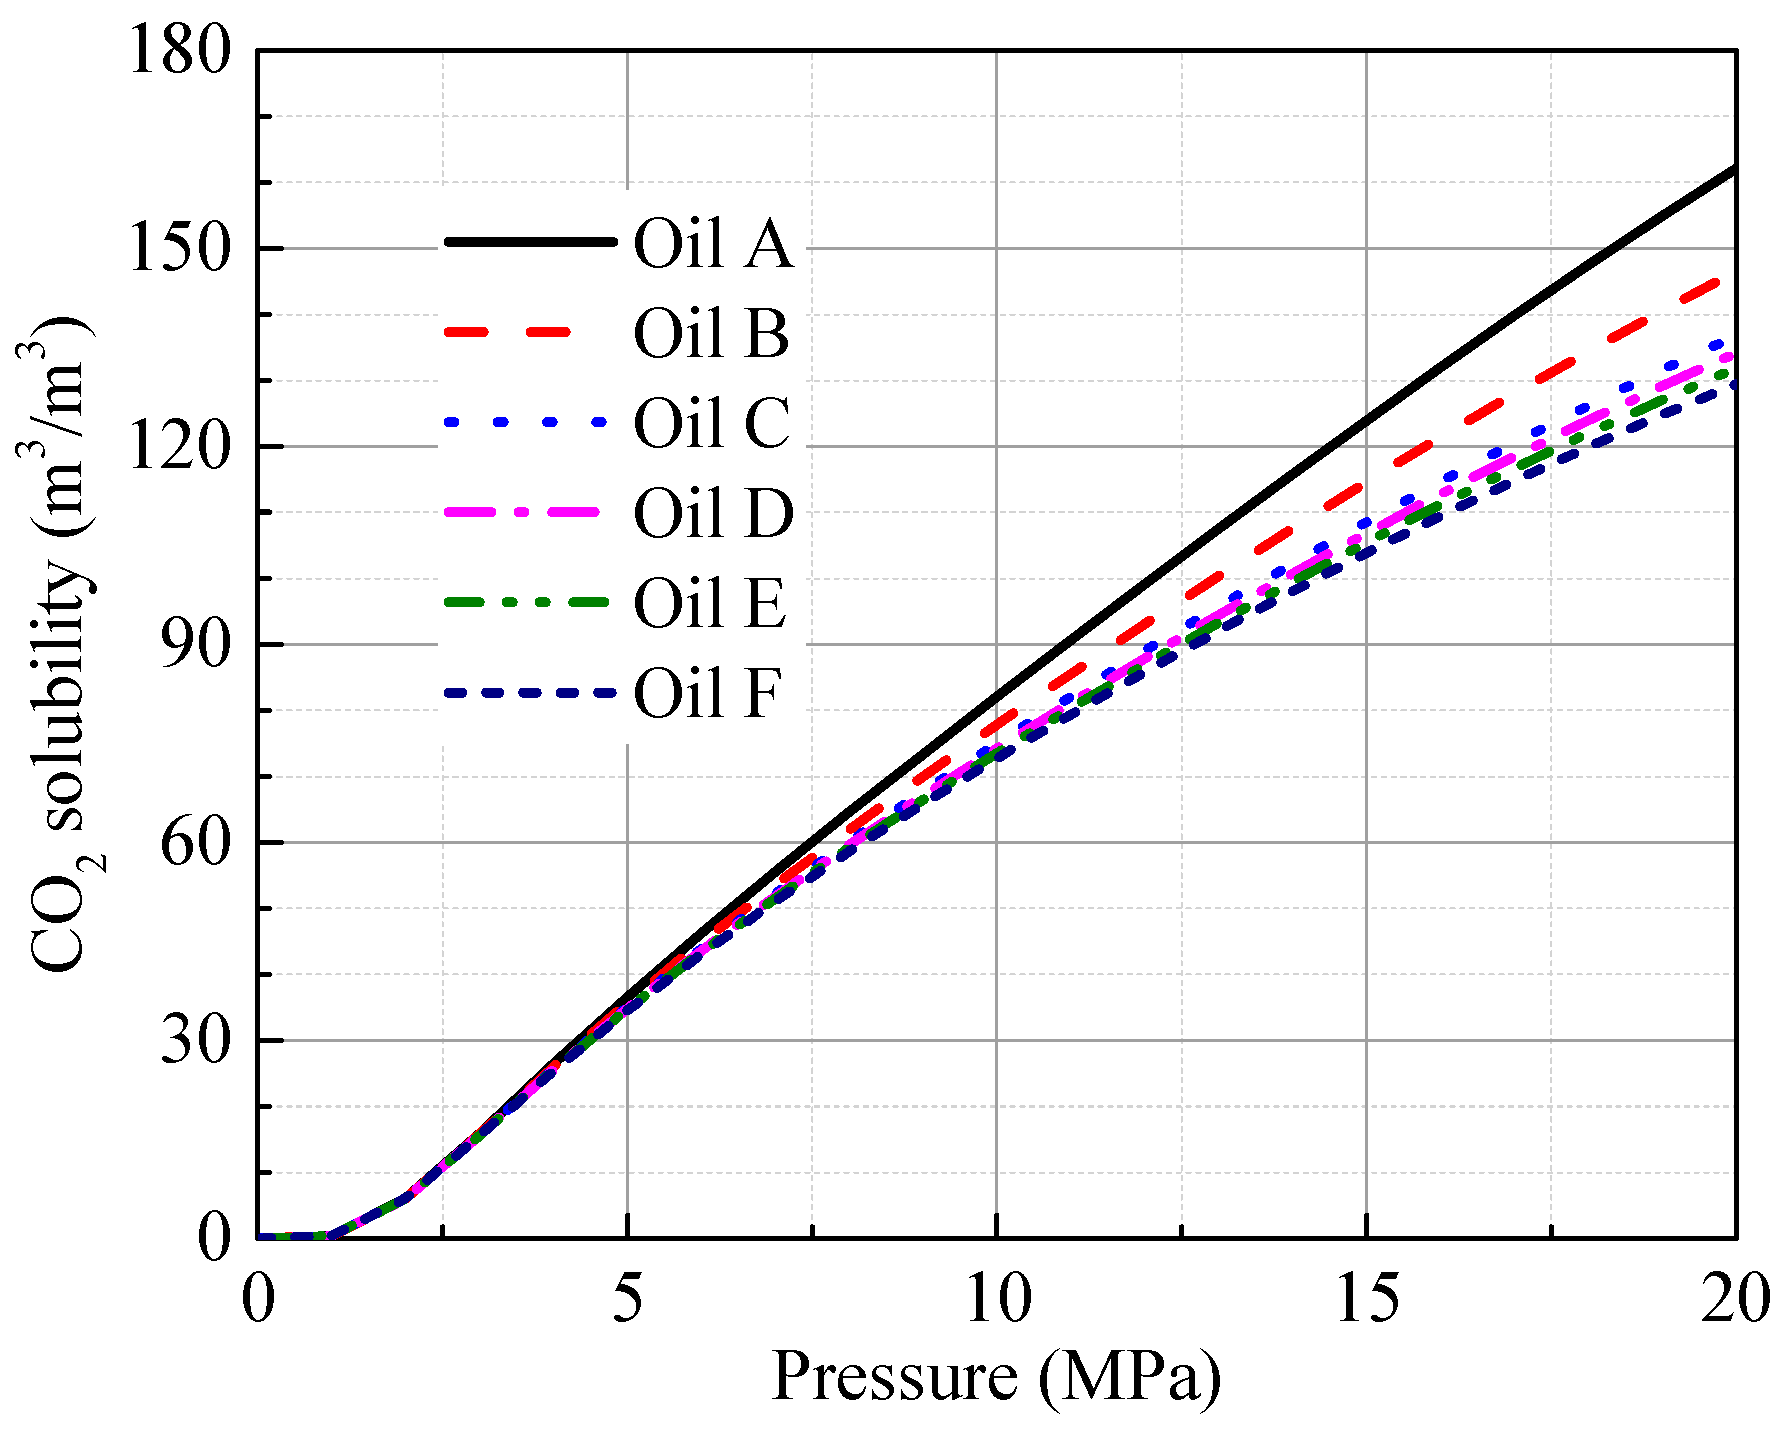
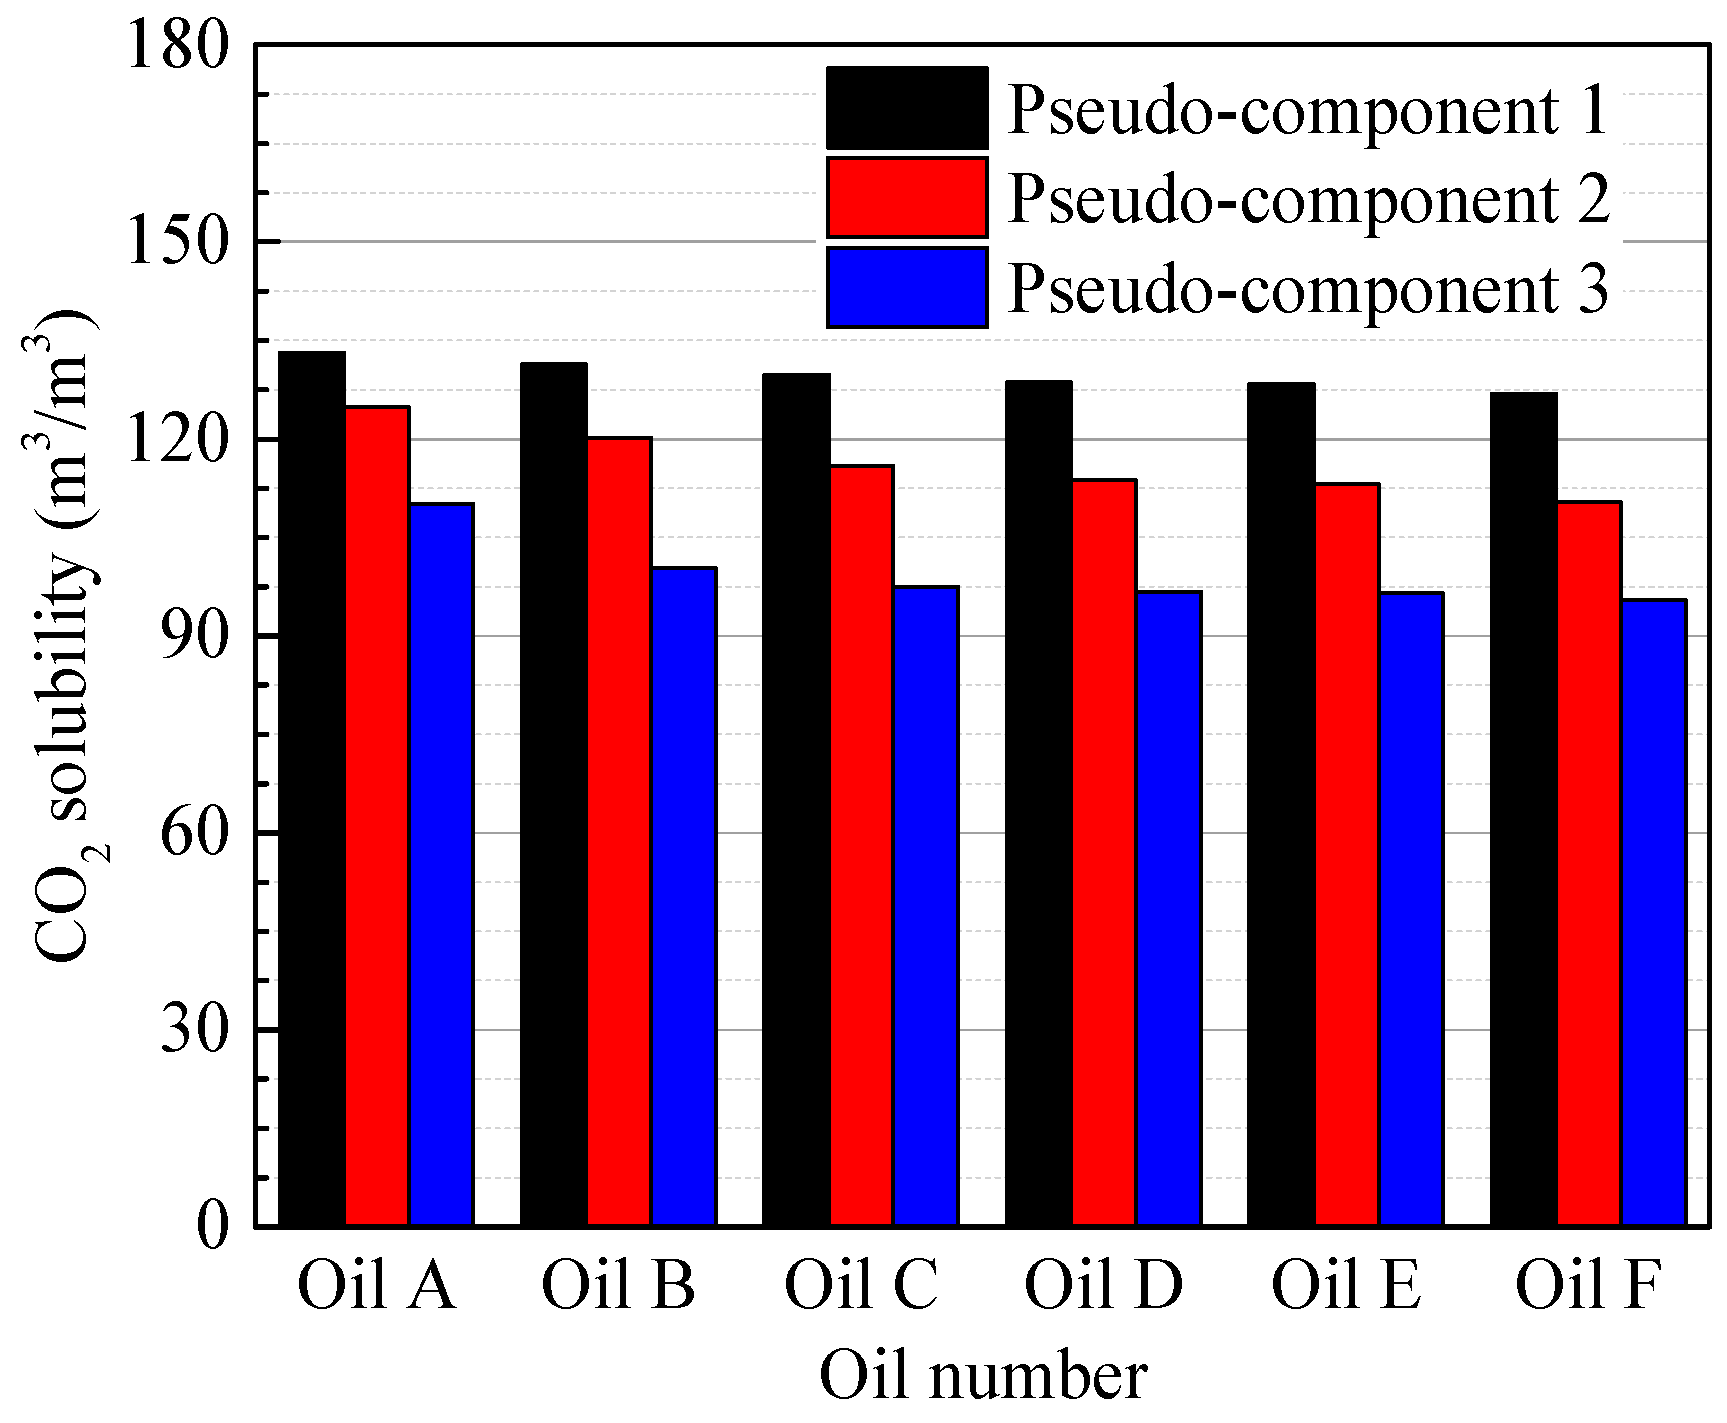
The solubility of CO2 in each oil sample, which is determined with a two-phase equilibrium calculation [78,79,80], is presented in Figure 12 and reflects the capacity of oil to accommodate CO2. Furthermore, the CO2 solubility of each pseudo-component at 15.3 MPa and 70 °C is depicted in Figure 13. Figure 12 and Figure 13 show that the CO2 solubility decreases with the increase in the proportion of heavy components in oil, i.e., the resistance for CO2 diffusing into oil increases [55]. Thus, the increase in the proportion of heavy components restricts the diffusion process from two aspects. First, it improves the viscosity of oil, which indirectly decreases the diffusion coefficient [81]. Second, heavy components directly increase the mass transfer resistance. Moreover, the resistance effect of heavy components also accounts for the deviation between the experimental data and the exponential model in Figure 11.

4.4. Comparison

The data of the CO2 diffusion coefficient in this paper are compared with the data in the literature, and both are listed in Table 4.
According to the data in the table, the CO2 diffusivity that was obtained in this paper is somewhat larger than the CO2 diffusivity in the literature. However, it is still within a reasonable range, and the differences in the data in the different papers can be attributed to several reasons. First, the experimental pressure and temperature in this work are higher than the experimental pressure and temperature in the literature [59,60,75,76]. Thus, the larger diffusion coefficient in this study agrees with the theory that an increase in pressure or temperature facilitates the diffusion process. Second, the viscosities of the oil samples used in this work are lower than the viscosities of the heavy oils used in the literature, which contributes to the high diffusion rate. Third, the proportion of heavy components in the oil samples used in this paper is smaller (by comparing Figure 1 and other works [59,60]); thus, the resistance for CO2 diffusing into oil is small [55]. Moreover, the interaction between CO2 and the oil samples is characterized by PR EOS in this work, and the data that were obtained with this model are more precise.

5. Conclusions

A generalized methodology was developed in this paper to determine the diffusion coefficient of supercritical CO2 in cores saturated with different oil samples, under reservoir conditions. A mathematical model that describes the mass transfer process of CO2 in oil-saturated cores was established. The pressure decay method was used to determine the diffusion process. The results show that the supercritical CO2 diffusion coefficient decreases gradually from oil samples A to F. It decreases from 128.92 × 10⁻¹⁰ to 74.97 × 10⁻¹⁰ m2/s at the early stage, decreases from 89.46 × 10⁻¹⁰ to 39.38 × 10⁻¹⁰ m2/s at the later stage, and decreases from 107.89 × 10⁻¹⁰ to 55.33 × 10⁻¹⁰ m2/s with the global regression method. The changing properties of oil can account for the decrease in the CO2 diffusion coefficient in two aspects. First, the increasing viscosity of oil slows down the speed of the mass transfer process. Second, the increase in the proportion of heavy components in oil enlarges the mass transfer resistance. These findings can provide direction in predicting CO2 storage potential in reservoirs and the effect of CO2 EOR. Moreover, these findings can also help to optimize engineering techniques in oil fields.

Author Contributions

Data curation, C.Z.; Investigation, C.Z. and C.Q.; Methodology, C.Q.; Supervision, S.L. and Z.L.; Writing—original draft, C.Z. and C.Q.; Writing—review & editing, S.L.

Acknowledgments

This work was supported by the National Key Basic Research Program of China (2015CB250904), the National Natural Science Foundation of China (No. 51774306), the National Science and Technology Major Project of China (2017ZX05072005-004), the National Key Scientific, Technological Project for the Oil & Gas Field and Coalbed Methane of China (2016ZX05031002-004-002), the Natural Science Foundation of Shandong Province, China (Grant ZR2017BEE059), the China Postdoctoral Science Foundation (Grant 2016M600572), and Fundamental Research Funds for the Central Universities (14CX02185A and 18CX02160A). The authors sincerely thank their colleagues at the Foam Fluid Research Center at the China University of Petroleum (East China) for helping us with the experiments.

Conflicts of Interest

The authors declare no conflict of interest.

Appendix A. Parameters in PR EOS of Oil Samples B to F

Table A1. Properties of the pseudo-components of oil samples B to F.
Oil No.Pseudo-ComponentZ (mol %)MW (g/mol)SGTb (K)Tc (K)Pc (kPa)ω
BB147.706150.7410.819466.154655.2212497.7650.472
B235.239209.780.857544.786729.8241942.5490.636
B317.353439.4640.930726.081886.9381122.8541.043
CC149.459158.5150.824477.370666.0982412.9840.494
C233.400244.0790.872580.821762.0581739.8550.719
C317.143480.9920.941753.344909.9921023.2171.101
DD153.065164.2820.828485.358673.7462354.7750.511
D230.215263.9960.880600.216779.1881638.0550.763
D316.721494.1730.944760.992916.415998.2751.119
EE150.339164.8450.829486.152674.5102348.8950.512
E232.411268.5630.882604.173782.6211619.5130.771
E317.253498.8010.945763.573918.579990.1601.124
FF155.032173.0100.834497.042684.8242272.2000.535
F228.996298.0230.892630.406805.4971492.4910.831
F316.736519.7530.949774.237927.510958.9301.148
Table A2. BIP matrix of oil sample B.
Oil No.ComponentB1B2B3CO2
BB10003.652 × 10−5
B20003.998 × 10−4
B30004.415 × 10−3
CO23.652 × 10−53.998 × 10−44.415 × 10−60
Table A3. BIP matrix of oil sample C.
Oil No.ComponentC1C2C3CO2
CC10004.181 × 10−6
C20009.641 × 10−4
C30005.148 × 10−3
CO24.181 × 10−69.641 × 10−45.148 × 10−30
Table A4. BIP matrix of oil sample D.
Oil No.ComponentD1D2D3CO2
DD10006.155 × 10−7
D20001.338 × 10−3
D30005.353 × 10−3
CO26.155 × 10−71.338 × 10−35.353 × 10−30
Table A5. BIP matrix of oil sample E.
Oil No.ComponentE1E2E3CO2
EE10001.117 × 10−6
E20001.421 × 10−3
E30005.422 × 10−3
CO21.117 × 10−61.421 × 10−35.422 × 10−30
Table A6. BIP matrix of oil sample F.
Oil No.ComponentF1F2F3CO2
FF10002.365 × 10−5
F20001.998 × 10−3
F30005.704 × 10−3
CO22.365 × 10−51.998 × 10−35.704 × 10−30

References

  1. Yang, Q.; Zhong, C.; Chen, J. Computational study of CO2 storage in metal–organic frameworks. J. Phys. Chem. C 2011, 112, 1562–1569. [Google Scholar] [CrossRef]
  2. Lydonrochelle, M.T. Amine ccrubbing for CO2 capture. Science 2009, 325, 1652–1654. [Google Scholar]
  3. Rutqvist, J. The geomechanics of CO2 storage in deep sedimentary formations. Geotech. Geol. Eng. 2012, 30, 525–551. [Google Scholar] [CrossRef]
  4. Holm, L.W.; Josendal, V.A. Mechanisms of oil displacement by carbon dioxide. J. Pet. Technol. 1974, 26, 1427–1438. [Google Scholar] [CrossRef]
  5. Monger, T.G.; Ramos, J.C.; Thomas, J. Light oil recovery from cyclic CO2 injection: Influence of low pressure impure CO2 and reservoir gas. SPE Reserv. Eng. 1991, 6, 25–32. [Google Scholar] [CrossRef]
  6. Moberg, R. The Wyburn CO2 monitoring and storage project. Greenh. Issues 2001, 57, 2–3. [Google Scholar]
  7. Baines, S.J.; Worden, R.H. Geological storage of carbon dioxide. Rudarsko-Geološko-Naftni Zbornik. 2004, 28, 9–22. [Google Scholar] [CrossRef]
  8. Wang, S.; Feng, Q.; Javadpour, F.; Xia, T.; Li, Z. Oil Adsorption in shale nanopores and its effect on recoverable oil-in-place. Int. J. Coal Geol. 2015, 147–148, 9–24. [Google Scholar] [CrossRef]
  9. Zhang, Z.; Chen, F.; Rezakazemi, M.; Zhang, W.; Lu, C.; Chang, H.; Quan, X. Modeling of a CO2-piperazine-membrane absorption system. Chem. Eng. Res. Des. 2018, 131, 375–384. [Google Scholar] [CrossRef]
  10. Zhang, Z.; Cai, J.; Chen, F.; Li, H.; Zhang, W.; Qi, W. Progress in enhancement of CO2 absorption by nanofluids: A mini review of mechanisms and current status. Renew. Energy 2018, 118, 527–535. [Google Scholar] [CrossRef]
  11. Yang, Y.; Qiu, L.; Cao, Y.; Chen, C.; Lei, D.; Wan, M. Reservoir quality and diagenesis of the Permian Lucaogou Formation tight ccarbonates in Jimsar Sag, Junggar Basin, West China. J. Earth Sci. 2017, 28, 1032–1046. [Google Scholar] [CrossRef]
  12. Cao, M.; Gu, Y. Temperature effects on the phase behaviour, mutual interactions and oil recovery of a light crude oil–CO2 system. Fluid Phase Equilib. 2013, 356, 78–89. [Google Scholar] [CrossRef]
  13. Du, F. An Experimental Study of Carbon Dioxide Dissolution into a Light Crude Oil. Regina. Master’s Thesis, University of Regina, Regina, SK, Canada, 2016. [Google Scholar]
  14. Luo, P.; Yang, C.; Gu, Y. Enhanced solvent dissolution into in-situ upgraded heavy oil under different pressures. Fluid Phase Equilib. 2007, 252, 143–151. [Google Scholar] [CrossRef]
  15. Yang, D.; Gu, Y. Visualization of interfacial interactions of crude Oil-CO2 systems under reservoir conditions. In Proceedings of the 14th Symposium on Improved Oil Recovery, Tulsa, OK, USA, 17–21 April 2004. [Google Scholar]
  16. Cui, G.; Zhang, L.; Tan, C.; Ren, S.; Zhuang, Y.; Enechukwu, C. Injection of supercritical CO2 for geothermal exploitation from sandstone and carbonate reservoirs: CO2–water–rock Interactions and their Effects. J. CO2 Util. 2017, 20, 113–128. [Google Scholar] [CrossRef]
  17. Zhang, L.; Li, X.; Zhang, Y.; Cui, G.; Tan, C.; Ren, S. CO2 Injection for geothermal development associated with EGR and geological storage in depleted high-temperature gas reservoirs. Energy 2017, 123, 139–148. [Google Scholar] [CrossRef]
  18. Ghasemi, M.; Astutik, W.; Alavian, S.A.; Whitson, C.H.; Sigalas, L.; Olsen, D. Determining diffusion coefficients for carbon dioxide injection in oil-saturated chalk by use of a constant-volume-diffusion method. SPE J. 2017, 22, 505–520. [Google Scholar] [CrossRef]
  19. Zhang, K.; Gu, Y. New Qualitative and quantitative technical criteria for determining the minimum miscibility pressures (MMPs) with the rising-bubble apparatus (RBA). Fuel 2016, 175, 172–181. [Google Scholar] [CrossRef]
  20. Izgec, O.; Demiral, B.; Bertin, H. CO2 Injection into saline carbonate aquifer formations I: Laboratory investigation. Transp. Porous Media 2008, 72, 1–24. [Google Scholar] [CrossRef]
  21. Sayegh, S.G.; Rao, D.N.; Kokal, S.; Najman, J. Phase behavior and physical properties of lindbergh heavy oil/CO2 mixtures. J. Can. Pet. Technol. 1990, 29, 31–39. [Google Scholar] [CrossRef]
  22. Comerlati, A.; Ferronato, M.; Gambolati, G.; Putti, M.; Teatini, P. Fluid-dynamic and gmechanical effects of CO2 sequestration below the venice lagoon. Environ. Eng. Geosci. 2006, 12, 211–226. [Google Scholar] [CrossRef]
  23. Zhang, X.; Trinh, T.T.; Santen, R.A.V. Mechanism of the initial stage of silicate oligomerization. J. Am. Chem. Soc. 2011, 133, 6613–6625. [Google Scholar] [CrossRef] [PubMed]
  24. Li, Z.; Dong, M. Experimental study of carbon dioxide diffusion in oil-saturated porous media under reservoir conditions. Ind. Eng. Chem. Res. 2009, 48, 9307–9317. [Google Scholar] [CrossRef]
  25. Jia, Y.; Bian H, B.; Duveau, G.; Shao, J. Numerical analysis of the thermo-hydromechanical behaviour of underground storages in hard rock. In Proceedings of the Geoshanghai International Conference, Shanghai, China, 3–5 June 2010; pp. 198–205. [Google Scholar]
  26. Li, Z.; Dong, M.; Li, S.; Dai, L. A New method for gas effective diffusion coefficient measurement in water-saturated porous rocks under high pressures. J. Porous Media 2006, 9, 445–461. [Google Scholar] [CrossRef]
  27. Hou, S.; Liu, F.; Wang, S.; Bian, H. Coupled heat and moisture transfer in hollow Concrete block wall filled with compressed straw bricks. Energy Build. 2017, 135, 74–84. [Google Scholar] [CrossRef]
  28. Wang, S.; Feng, Q.; Zha, M.; Javadpour, F.; Hu, Q. Supercritical methane diffusion in shale nanopores: Effects of pressure, mineral types, and moisture content. Energy Fuels 2017, 32, 169–180. [Google Scholar] [CrossRef]
  29. Zhao, P.; Wang, Z.; Sun, Z.; Cai, J.; Wang, L. Investigation on the pore structure and multifractal characteristics of tight oil reservoirs using NMR measurements: Permian Lucaogou Formation in Jimusaer Sag, Junggar Basin. Mar. Petrol. Geol. 2017, 86, 1067–1081. [Google Scholar] [CrossRef]
  30. Wang, F.; Yang, K.; Cai, J. Fractal characterization of tight oil reservoir pore structure using nuclear magnetic resonance and mercury intrusion porosimetry. Fractals 2018, 2, 1840017. [Google Scholar] [CrossRef]
  31. Hill, E.S.; Lacey, W.N. Hate of solution of propane in quiescent liquid hydrocarbons. Ind. Eng. Chem. 1934, 25, 1014–1019. [Google Scholar]
  32. Sigmund, P.M. Prediction of molecular diffusion at reservoir conditions. Part I—Measurement and prediction of binary dense gas diffusion coefficients. J. Can. Pet. Technol. 1976, 15, 48–57. [Google Scholar] [CrossRef]
  33. Islas-Juarez, R.; Samanego, V.F.; Luna, E.; Perez-Rosales, C.; Cruz, J. Experimental study of effective diffusion in porous media. In Proceedings of the SPE International Petroleum Conference in Mexico, Puebla, Mexico, 7–9 November 2004; pp. 781–787. [Google Scholar]
  34. Riazi, M.R. A new method for experimental measurement of diffusion coefficients in reservoir fluids. J. Pet. Sci. Eng. 1996, 14, 235–250. [Google Scholar] [CrossRef]
  35. Upreti, S.R.; Mehrotra, A.K. Experimental measurement of gas diffusivity in bitumen: Results of carbon dioxide. Ind. Eng. Chem. Res. 2000, 39, 1080–1087. [Google Scholar] [CrossRef]
  36. Zhang, Y.; Hyndman, C.L.; Maini, B.B. Measurement of gas diffusivity in heavy oils. J. Pet. Sci. Eng. 1999, 25, 37–47. [Google Scholar] [CrossRef]
  37. Tharanivasan, A.K.; Yang, C.; Gu, Y. Measurements of molecular diffusion coefficients of carbon dioxide, methane, and propane in heavy oil under reservoir conditions. Energy Fuels 2006, 20, 2509–2517. [Google Scholar] [CrossRef]
  38. El-Haj, R.; Lohi, A.; Upreti, S.R. Experimental determination of butane dispersion in vapour extraction of heavy oil and bitumen. J. Pet. Sci. Eng. 2009, 67, 41–47. [Google Scholar] [CrossRef]
  39. Okazawa, T. Impact of concentration—Dependence of diffusion coefficient on VAPEX drainage rates. J. Can. Pet. Technol. 2009, 48, 47–53. [Google Scholar] [CrossRef]
  40. Wen, Y.; Bryan, J.; Kantzas, A. Estimation of diffusion coefficients in bitumen solvent mixtures as derived from low field NMR spectra. J. Can. Pet. Technol. 2005, 44, 29–35. [Google Scholar] [CrossRef]
  41. Afsahi, B. Advanced in Diffusivity and Viscosity Measurements of Hydrocarbon Solvents in Heavy Oil and Bitumen. Master’s Thesis, University of Calgary, Calgary, AB, Canada, 2006. [Google Scholar]
  42. Guerrero-Aconcha, U.; Salama, D.; Kantzas, A. Diffusion of n-alkanes in heavy oil. In Proceedings of the SPE Annual Technical Conference and Exhibition, Denver, CO, USA, 21–24 September 2008. [Google Scholar]
  43. Wen, Y.; Kantzas, A.; Wang, G. Estimation of diffusion coefficients in bitumen solvent mixtures using X-ray CAT scanning and low field NMR. In Proceedings of the Canadian International Petroleum Conference, Calgary, AB, Canada, 8–10 June 2004. [Google Scholar]
  44. Wang, L.; Nakanishi, Y.; Teston, A.D.; Suekane, T. Effect of diffusing layer thickness on the density-driven natural convection of miscible fluids in porous media: Modeling of mass transport. J. Fluid Sci. Technol. 2018, 13, 1–20. [Google Scholar] [CrossRef]
  45. Yang, C.; Gu, Y. A new method for measuring solvent diffusivity in heavy oil by dynamic pendant drop shape analysis (DPDSA). SPE J. 2006, 11, 48–57. [Google Scholar] [CrossRef]
  46. Oren, P.E.; Bakke, S.; Arntzen, O.J. Extending predictive capabilities to network models. SPE J. 1998, 3, 324–336. [Google Scholar] [CrossRef]
  47. Blunt, M.J.; Piri, M.; Valvatne, P. Detailed physics, predictive capabilities and upscaling for pore-scale models of multiphase flow. Adv. Water Resour. 2002, 25, 1069–1089. [Google Scholar] [CrossRef]
  48. Piri, M.; Blunt, M.J. Pore-scale modeling of three-phase flow in mixed wet systems. In Proceedings of the SPE Annual Technical Conference and Exhibition, San Antonio, TX, USA, 29 September–2 October 2002. [Google Scholar]
  49. Garmeh, G.; Johns, R.T.; Lake, L.W. Pore-scale simulation of dispersion in porous media. In Proceedings of the SPE Annual Technical Conference and Exhibition, Anaheim, CA, USA, 11–14 November 2007. [Google Scholar]
  50. Taheri, S.; Kantzas, A.; Abedi, J. Mass diffusion into bitumen: A sub-pore scale modeling approach. In Proceedings of the Canadian Unconventional Resources & International Petroleum Conference, Calgary, AB, Canada, 19–21 October 2010. [Google Scholar]
  51. De Paoli, M.; Zonta, F.; Soldati, A. Dissolution in anisotropic porous media: Modelling convection regimes from onset to shutdown. Phys. Fluids 2017, 29, 026601. [Google Scholar] [CrossRef]
  52. Xu, X.; Chen, S.; Zhang, D. Convective stability analysis of the long-term storage of carbon dioxide in deep saline aquifers. Adv. Water Resour. 2006, 29, 397–407. [Google Scholar] [CrossRef]
  53. De Paoli, M.; Zonta, F.; Soldati, A. Influence of anisotropic permeability on convection in Porous media: Implications for geological CO2 sequestration. Phys. Fluids 2016, 28, 367–370. [Google Scholar] [CrossRef]
  54. Li, S.; Li, Z.; Dong, Q. Diffusion coefficients of supercritical CO2 in oil-saturated cores under low permeability reservoir conditions. J. CO2 Util. 2016, 14, 47–60. [Google Scholar] [CrossRef]
  55. Li, S.; Qiao, C.; Zhang, C.; Li, Z. Determination of diffusion coefficients of supercritical CO2 under tight oil reservoir conditions with pressure-decay method. J. CO2 Util. 2018, 24, 430–443. [Google Scholar] [CrossRef]
  56. Li, H.; Yang, D. Determination of individual diffusion coefficients of solvent/CO2 mixture in heavy oil with pressure-decay method. SPE J. 2015, 21, 131–143. [Google Scholar] [CrossRef]
  57. Peng, D.; Robinson, D.B. A new two-constant equation of state. Ind. Eng. Chem. Fundam. 1976, 15, 92–94. [Google Scholar] [CrossRef]
  58. Zuo, J.; Zhang, D. Plus fraction characterization and PVT data regression for reservoir fluids near critical conditions. In Proceedings of the SPE Asia Pacific Oil and Gas Conference and Exhibition, Brisbane, QLD, Australia, 16–18 October 2000. [Google Scholar]
  59. Zheng, S.; Li, H.; Sun, H.; Yang, D. Determination of diffusion coefficient for alkane solvent–CO2 mixtures in heavy oil with consideration of swelling effect. Ind. Eng. Chem. Res. 2016, 55, 1533–1549. [Google Scholar] [CrossRef]
  60. Zheng, S.; Yang, D. Determination of individual diffusion coefficients of C3H8/n-C4H10/CO2/heavy-oil systems at high pressures and elevated temperatures by dynamic volume analysis. In Proceedings of the SPE Improved Oil Recovery Conference, Tulsa, OK, USA, 11–13 April 2016. [Google Scholar]
  61. Fateen, S.E.K.; Khalil, M.M.; Elnabawy, A.O. Semi-empirical correlation for binary interaction parameters of the Peng–Robinson equation of state with the van der Waals mixing rules for the prediction of high-pressure vapor–liquid equilibrium. J. Adv. Res. 2013, 4, 137–145. [Google Scholar] [CrossRef] [PubMed]
  62. Elsharkawy, A.M. An empirical model for estimating the saturation pressures of crude oils. J. Pet. Sci. Eng. 2003, 38, 57–77. [Google Scholar] [CrossRef]
  63. Pedersen, K.S.; Thomassen, P.; Fredenslund, A. SRK-EOS calculation for Crude OILS. Fluid Phase Equilib. 1983, 14, 209–218. [Google Scholar] [CrossRef]
  64. Twu Chorng, H. Prediction of thermodynamic properties of normal paraffins using only normal boiling point. Fluid Phase Equilib. 1983, 11, 65–81. [Google Scholar]
  65. Twu Chorng, H. An internally consistent correlation for predicting the critical properties and molecular weights of petroleum and coal-tar liquids. Fluid Phase Equilib. 1984, 16, 137–150. [Google Scholar]
  66. Kesler, M.G.; Lee, B.I. Improve prediction of enthalpy fractions. Hydrocarb. Process. 1976, 55, 153–158. [Google Scholar]
  67. Danesh, A.; Xu, D.; Todd, A.C. A Grouping method to optimize oil description for compositional simulation of gas-injection processes. SPE Reserv. Eng. 1992, 7, 343–348. [Google Scholar] [CrossRef]
  68. Renner, T.A. Measurement and correlation of diffusion coefficients for CO2 and rich-gas applications. SPE Reserv. Eng. 1988, 3, 517–523. [Google Scholar] [CrossRef]
  69. Moysan, J.M.; Paradowski, H.; Vidal, J. Prediction of phase behaviour of gas-containing systems with cubic equations of state. Chem. Eng. Sci. 1986, 41, 2069–2074. [Google Scholar] [CrossRef]
  70. Crank, J. The Mathematics of Diffusion; Oxford University Press: Oxford, UK, 1979. [Google Scholar]
  71. Zhao, R.; Ao, W.; Xiao, A.; Yan, W.; Yu, Z.; Xiao, X. Diffusion law and measurement of variable diffusion coefficient of CO2 in oil. J. China Univ. Pet. 2016, 40, 136–142. [Google Scholar]
  72. Kavousi, A.; Torabi, F.; Chan, C.W.; Shirif, E. Experimental measurement and parametric study of CO2 solubility and molecular diffusivity in heavy crude oil systems. Fluid Phase Equilib. 2014, 371, 57–66. [Google Scholar] [CrossRef]
  73. Behzadfar, E.; Hatzikiriakos, S.G. Diffusivity of CO2 in bitumen: Pressure–decay measurements coupled with rheometry. Energy Fuels 2014, 28, 1304–1311. [Google Scholar] [CrossRef]
  74. Umesi, N.O.; Danner, R.P. Predicting diffusion coefficients in nonpolar solvents. Ind. Eng. Chem. Proc. Des. Dev. 1981, 20, 662–665. [Google Scholar] [CrossRef]
  75. Upreti, S.R.; Mehrotra, A.K. Diffusivity of CO2, CH4, C2H6 and N2 in athabasca bitumen. Can. J. Chem. Eng. 2002, 80, 116–125. [Google Scholar] [CrossRef]
  76. Rasmussen, M.L.; Civan, F. Parameters of gas dissolution in liquids obtained by isothermal pressure decay. AICHE J. 2009, 55, 9–23. [Google Scholar] [CrossRef]
  77. Hayduk, W.; Cheng, S.C. Review of relation between diffusivity and solvent viscosity in dilute liquid solutions. Chem. Eng. Sci. 1971, 26, 635–646. [Google Scholar] [CrossRef]
  78. Dan, V.N.; Graciaa, A. A new reduction method for phase equilibrium calculations. Fluid Phase Equilib. 2011, 302, 226–233. [Google Scholar]
  79. Leibovici, C.F.; Neoschil, J. A solution of Rachford-Rice equations for multiphase systems. Fluid Phase Equilib. 1995, 112, 217–221. [Google Scholar] [CrossRef]
  80. Okuno, R.; Johns, R.T.; Sepehrnoori, K. Application of a reduced method in compositional simulation. SPE J. 2010, 15, 39–49. [Google Scholar] [CrossRef]
  81. Shu, W.R. Viscosity correlation for mixtures of heavy oil, bitumen, and petroleum fractions. SPE J. 1984, 24, 277–282. [Google Scholar] [CrossRef]
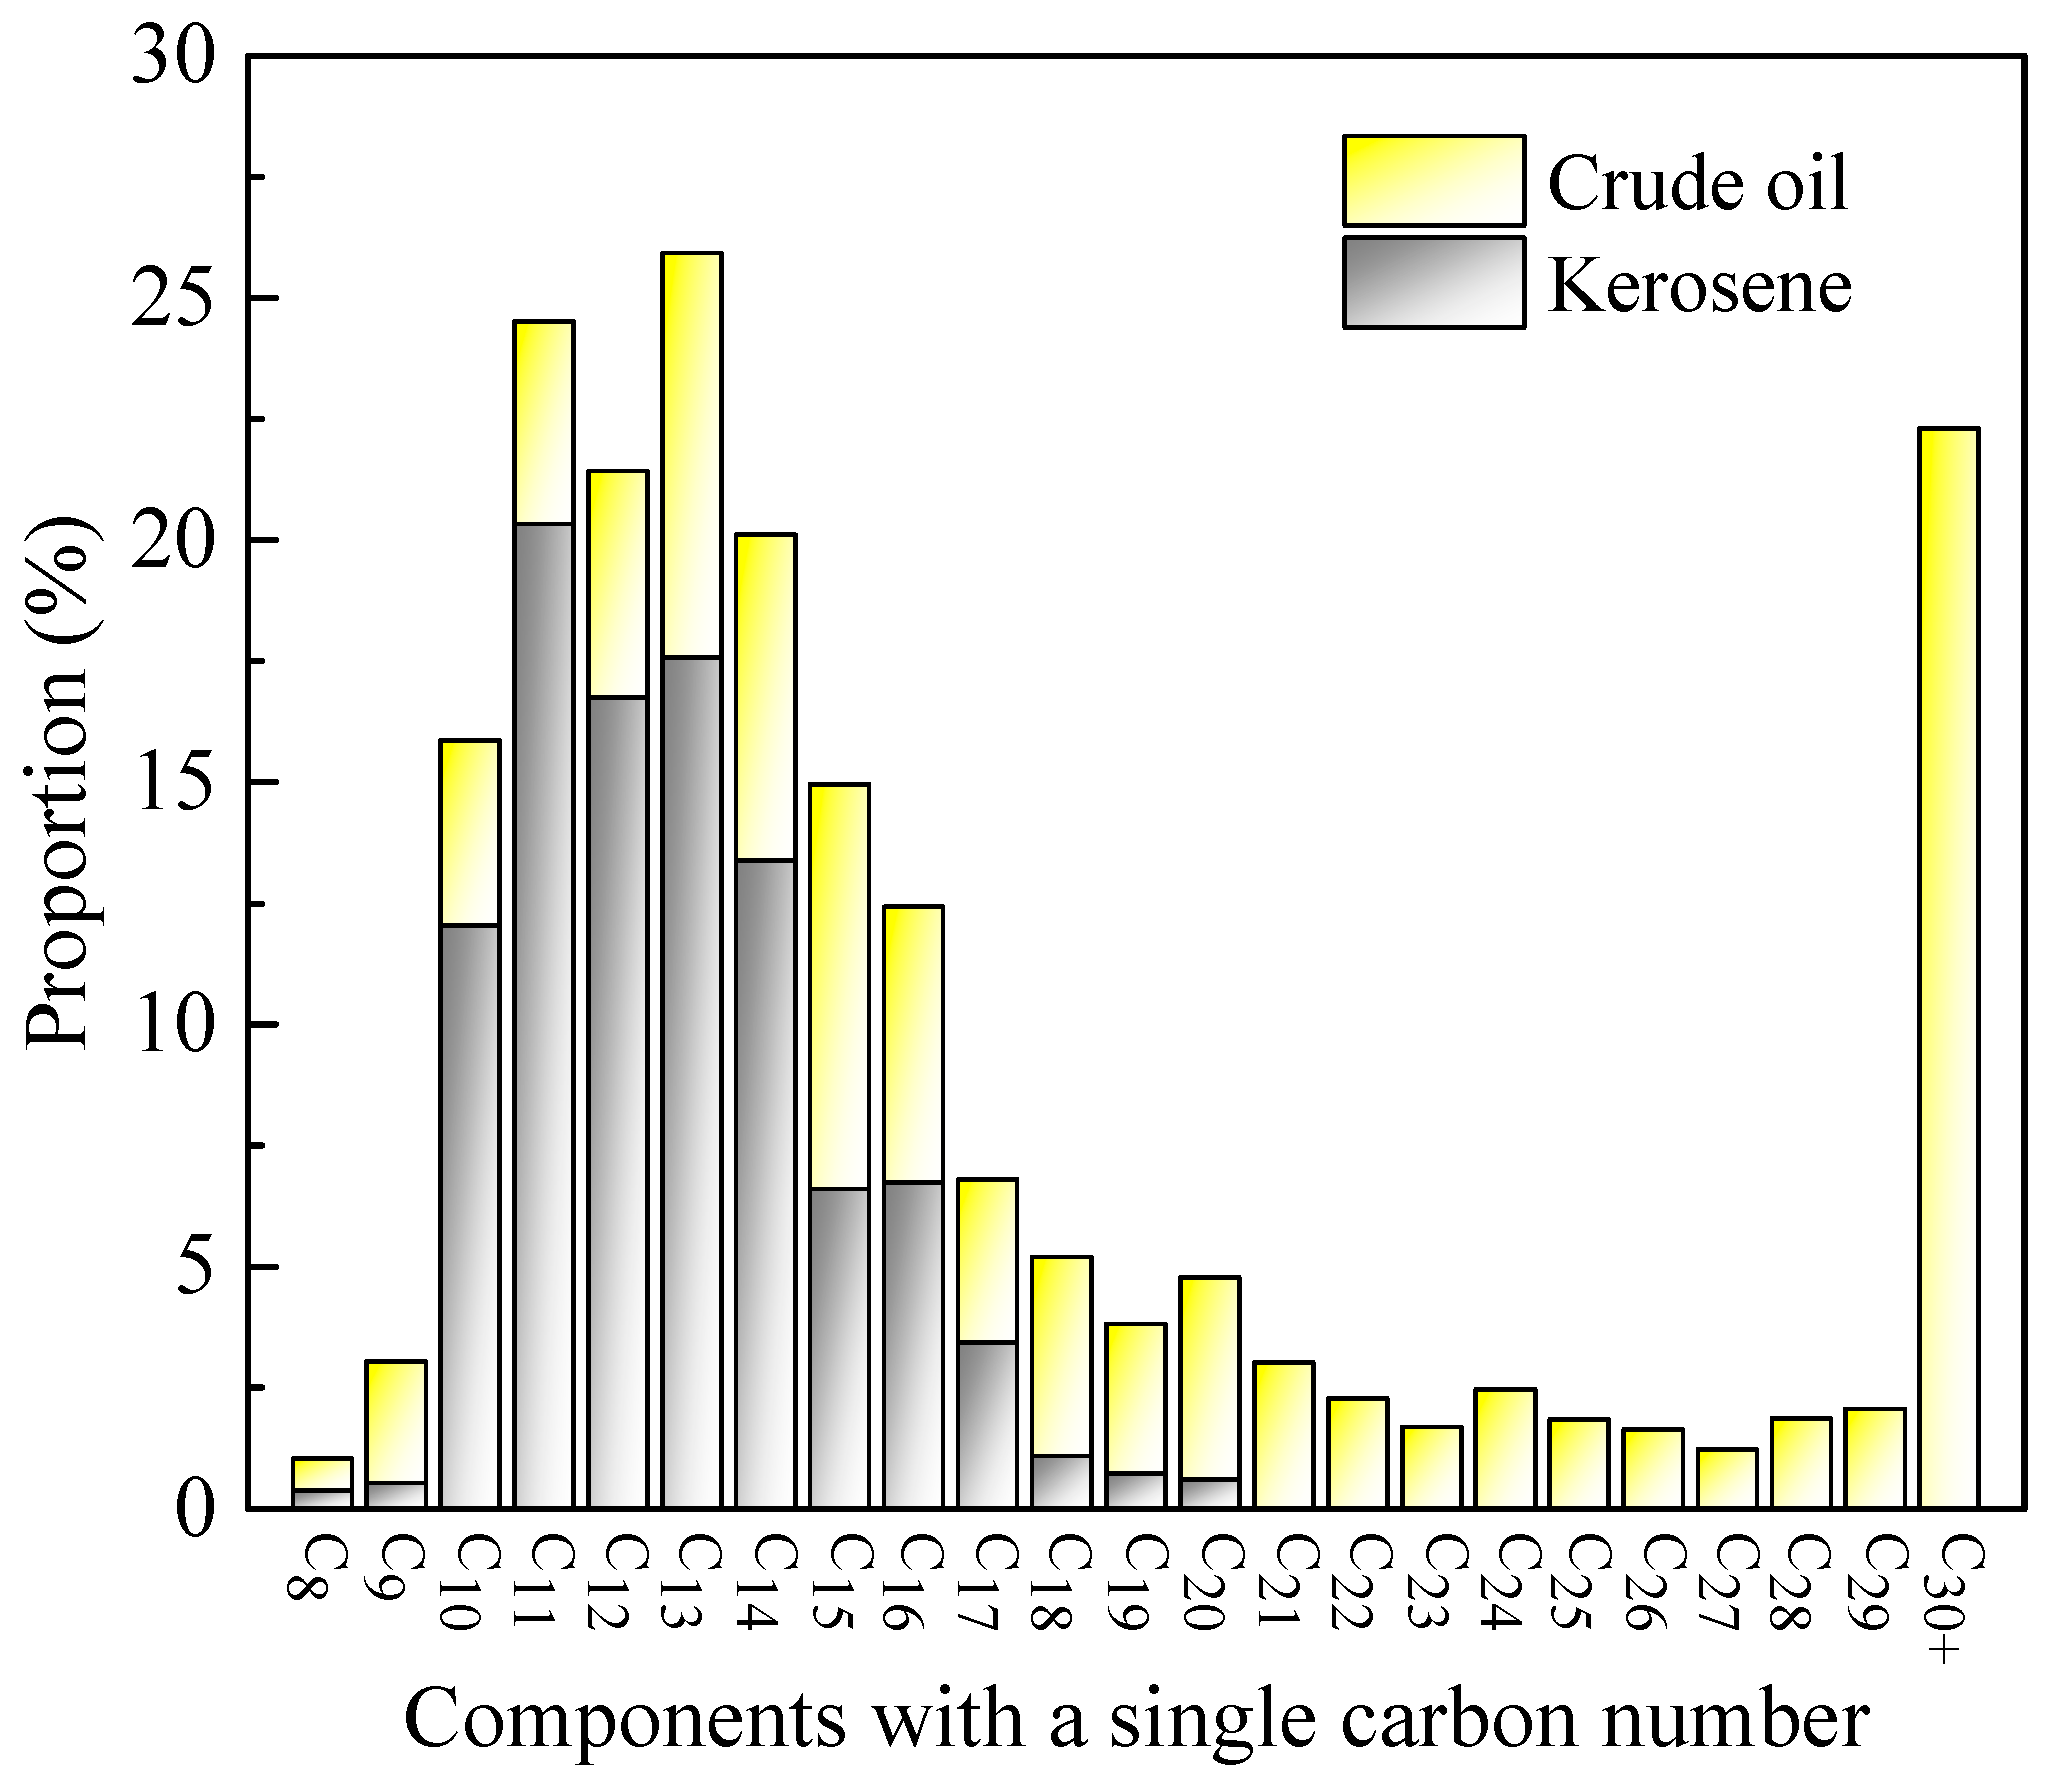
Figure 1. The component distributions of kerosene and the crude oil.
Energies 11 01495 g001
Figure 2. The schematic diagram of the apparatus used in the CO2 diffusion experiment.
Energies 11 01495 g002
Figure 3. The diagram of the physical model for CO2 diffusion.
Energies 11 01495 g003
Figure 4. Viscosity-temperature curves of the oil samples (the pentagram symbols are the viscosities of the oil samples under experimental conditions.).
Energies 11 01495 g004
Figure 5. The composition analysis of the oil samples.
Energies 11 01495 g005
Figure 6. CO2 concentration profile of the cores in the diffusion process (the red line reflects the average CO2 dimensionless concentration in the core at τ = 0.2.).
Energies 11 01495 g006
Figure 7. Velocity of oil in the cores caused by volume swelling.
Energies 11 01495 g007
Figure 8. Pressure-time curves of the CO2 diffusion experiments. (a) Oil sample A, 3.30 mPa∙s; (b) Oil sample B, 21.57 mPa∙s; (c) Oil sample C, 31.09 mPa∙s; (d) Oil sample D, 43.50 mPa∙s; (e) Oil sample E, 76.81 mPa∙s; (f) Oil sample F, 127.47 mPa∙s.
Energies 11 01495 g008
Figure 9. The CO2 diffusion coefficient in tight cores saturated with different oil samples (70 °C, 15.29–15.36 MPa).
Energies 11 01495 g009
Figure 10. The effect of oil viscosity on the CO2 diffusion coefficient.
Energies 11 01495 g010
Figure 11. The effect of oil viscosity on the CO2 diffusion coefficient.
Energies 11 01495 g011
Figure 12. CO2 solubility of the oil samples at 70 °C.
Energies 11 01495 g012
Figure 13. CO2 solubility of the pseudo-components (70 °C, 15.3 MPa).
Energies 11 01495 g013
Table 1. Detailed parameters of the artificial cores.
Test No.Core Diameter (mm)Core Length (mm)Permeability (mD)Porosity (%)Initial Pressure (MPa)Temperature (°C)
138.1690.420.1023.9215.2970
238.1890.200.0993.8315.3670
338.1489.660.0964.9515.3570
438.2089.120.1033.7615.3370
538.1889.740.1004.1615.3670
638.1689.400.1023.7515.3270
Table 2. Parameters of the pseudo-components of oil sample A.
Oil No.Pseudo-ComponentZ (mol %)MW (g/mol)SGTb (K)Tc (K)Pc (kPa)ω
AA143.302143.190.813454.768644.0082587.2220.449
A234.479180.7620.841509.554697.3692168.9170.559
A322.220315.1160.893632.112806.0631527.0150.832
Table 3. BIP matrix for the CO2 and pseudo-components.
Oil No.ComponentA1A2A3CO2
AA10001.027 × 10−4
A20007.162 × 10−5
A30002.057 × 10−3
CO21.027 × 10−47.162 × 10−52.057 × 10−30
Table 4. Data in the literature of the CO2 diffusion coefficient in porous media saturated with oil.
FluidViscosity (mPa∙s)Pressure (MPa)Temperature (K)Permeability (mD)Diffusion Coefficient (10−10 m2/s)Sources
Mixed oil samples3.30–127.47
@343.15K
15.29–15.36343.150.096–0.103Early stageLater stageThis study
74.97–128.9239.38–89.46
Global regression
55.33–107.89
Without PR EOS
23.63–79.37
Changji light oil7.26
@323.15K
14.56–14.89298.15–358.150.058–0.192Early stageLater stageLi et al. [54]
67.04–164.3833.82–100.37
N-hexadecan2.14
@313.15
2.28–6.03313.1580.67–227.745.98–8.01Li et al. [24]
Lloydminster heavy oil12,854.00
@294.55K
3.74–3.37294.55/4.30Zheng et al. [58]
Lloydminster heavy oil12,854.00
@294.55K
5.40317.65/14.97Zheng et al. [59]
Athabasca bitumen821,000.00
@298.15K
4.00–8.00323.15/2.20–8.90Upreti [74]
Lloydminster heavy oil23,000.00
@297.15K
2.00–6.00297.15/2.00–5.50Yang [45]
Athabasca bitumen106,000.00
@313.15K
3.24348.15/5.03Rasmussen et al. [75]