Article

Mechanical Property Measurements and Fracture Propagation Analysis of Longmaxi Shale by Micro-CT Uniaxial Compression

1
Key Laboratory of Shale Gas and Geoengineering, Institute of Geology and Geophysics, Chinese Academy of Sciences, Beijing 100029, China
2
Institution of Earth Science, Chinese Academy of Science, Beijing 100029, China
3
College of Earth Science, University of Chinese Academy of Sciences, Beijing 100049, China
*
Author to whom correspondence should be addressed.
Energies 2018, 11(6), 1409; https://doi.org/10.3390/en11061409
Submission received: 19 April 2018 / Revised: 16 May 2018 / Accepted: 30 May 2018 / Published: 31 May 2018
(This article belongs to the Special Issue Unconventional Natural Gas (UNG) Recoveries 2018)

Abstract

:
The mechanical properties and fracture propagation of Longmaxi shale loading under uniaxial compression were measured using eight cylindrical shale specimens (4 mm in diameter and 8 mm in height), with the bedding plane oriented at 0° and 90° to the axial loading direction, respectively, by micro computed tomography (micro-CT). Based on the reconstructed three-dimensional (3-D) CT images of cracks, different stages of the crack growth process in the 0° and 90° orientation specimen were revealed. The initial crack generally occurred at relatively smaller loading force in the 0° bedding direction specimen, mainly in the form of tensile splitting along weak bedding planes. Shear sliding fractures were dominant in the specimens oriented at 90°, with a small number of parallel cracks occurring on the bedding plane. The average thickness and volume of cracks in the 90° specimen is higher than those for the specimen oriented at 0°. The geometrical characterization of fractures segmented from CT scan binary images shows that a specific surface area correlates with tortuosity at the different load stages of each specimen. The 3-D box-counting dimension (BCD) calculations can accurately reflect crack evolution law in the shale. The results indicate that the cracks have a more complex pattern and rough surface at an orientation of 90°, due to crossed secondary cracks and shear failure.

1. Introduction

Shale is a laminated sedimentary rock composed of highly compacted and fine-grained particles of micrometer to sub-micrometer size, with nano- to macro-scale heterogeneity [1]. Over the last decade, significant attention has been given to organic-rich shale in the petroleum industry, for its gas-bearing properties and associated prospects of massive gas reserves [2,3]. However, it is characterized by low porosity and permeability, thin beds, and strong anisotropy between parallel and perpendicular directions to bedding, which greatly increase the difficulty of gas extraction [4,5]. The application of new techniques, e.g., hydraulic fracturing and horizontal drilling, have significantly promoted gas production [6,7,8], which has benefited from the investigation of mechanical properties and anisotropic brittleness of shale at multiple scales [9,10,11,12,13]. The understanding of fracture generation and propagation with different bedding orientation remains a key step to successful well drilling (well bore stability) [14].
Various experimental methods, e.g., electromagnetic radiation (EMR), acoustic emission (AE), micro-seismic (MS), infrared technique, high speed digital imaging, and computerized tomography (CT), have been used to analyze the mechanical behavior of rocks (including shale) during uniaxial or triaxial loading [15,16,17,18,19,20,21]. CT scanning has been widely applied in the investigation of damage propagation since 1997, due to the three-dimensional (3-D) visualization and high-resolution imaging [22,23,24,25,26,27,28]. Kawakata et al. used CT to study the initial mesoscopic damage characteristics of rock materials, and observed spatial fault development in granite undergoing compression [29,30]. In the experiment, only the damaged specimens, rather than the entire process from crack initiation to specimen destruction, were scanned, and then observed by 3-D reconstruction of X-ray CT images. To examine the entire process, Ge et al. investigated rock compression with a real-time CT test [23]. Through the use of the industrial CT images, the rock meso-damage propagation law was revealed. Rock failure started with micro-pore and micro-crack compression, growth, bifurcation, and development, followed by fracture. Sun et al. displayed real-time deformation in backfill body under loading using industrial CT in several slices, and provided insights into the process of faulting [31]. However, the relatively low spatial resolution and image quality of conventional industrial CT is not suitable for fine-grained rocks. Furthermore, the 3-D information was not fully captured or used, which limited the accuracy of further calculation when analyzing with limited slices. Thus, micro-CT with better spatial resolution became a better option for observing and analyzing micro-cracks in shale [32,33,34].
In addition, layer orientation and fabric characteristics were generally believed to play major roles in influencing the mechanical properties and the fracture propagation under unconfined compression [6,23,35,36,37,38,39]. However, previous studies did not take into account the factor of bedding orientation, and lacked the comparison of quantitative characteristics of fracture when examining 3-D data of shale cracking process. To reveal the difference of crack propagation in different bedding orientation, research is needed to perform not only morphological observation, but also quantitative analyses based on 3-D reconstruction of cracks in different stages.
In this study, we use high-resolution micro-CT to obtain the 3-D data of the fracture propagation and analyze the geometrical characteristics and complexity of the Longmaxi shale during uniaxial compression at both 0° and 90° bedding orientations. The results of our study will be valuable in providing a theoretical basis for planning drilling operations and enhancing wellbore stability during hydraulic fracturing processes.

2. Specimen Preparation and Experimental Procedure
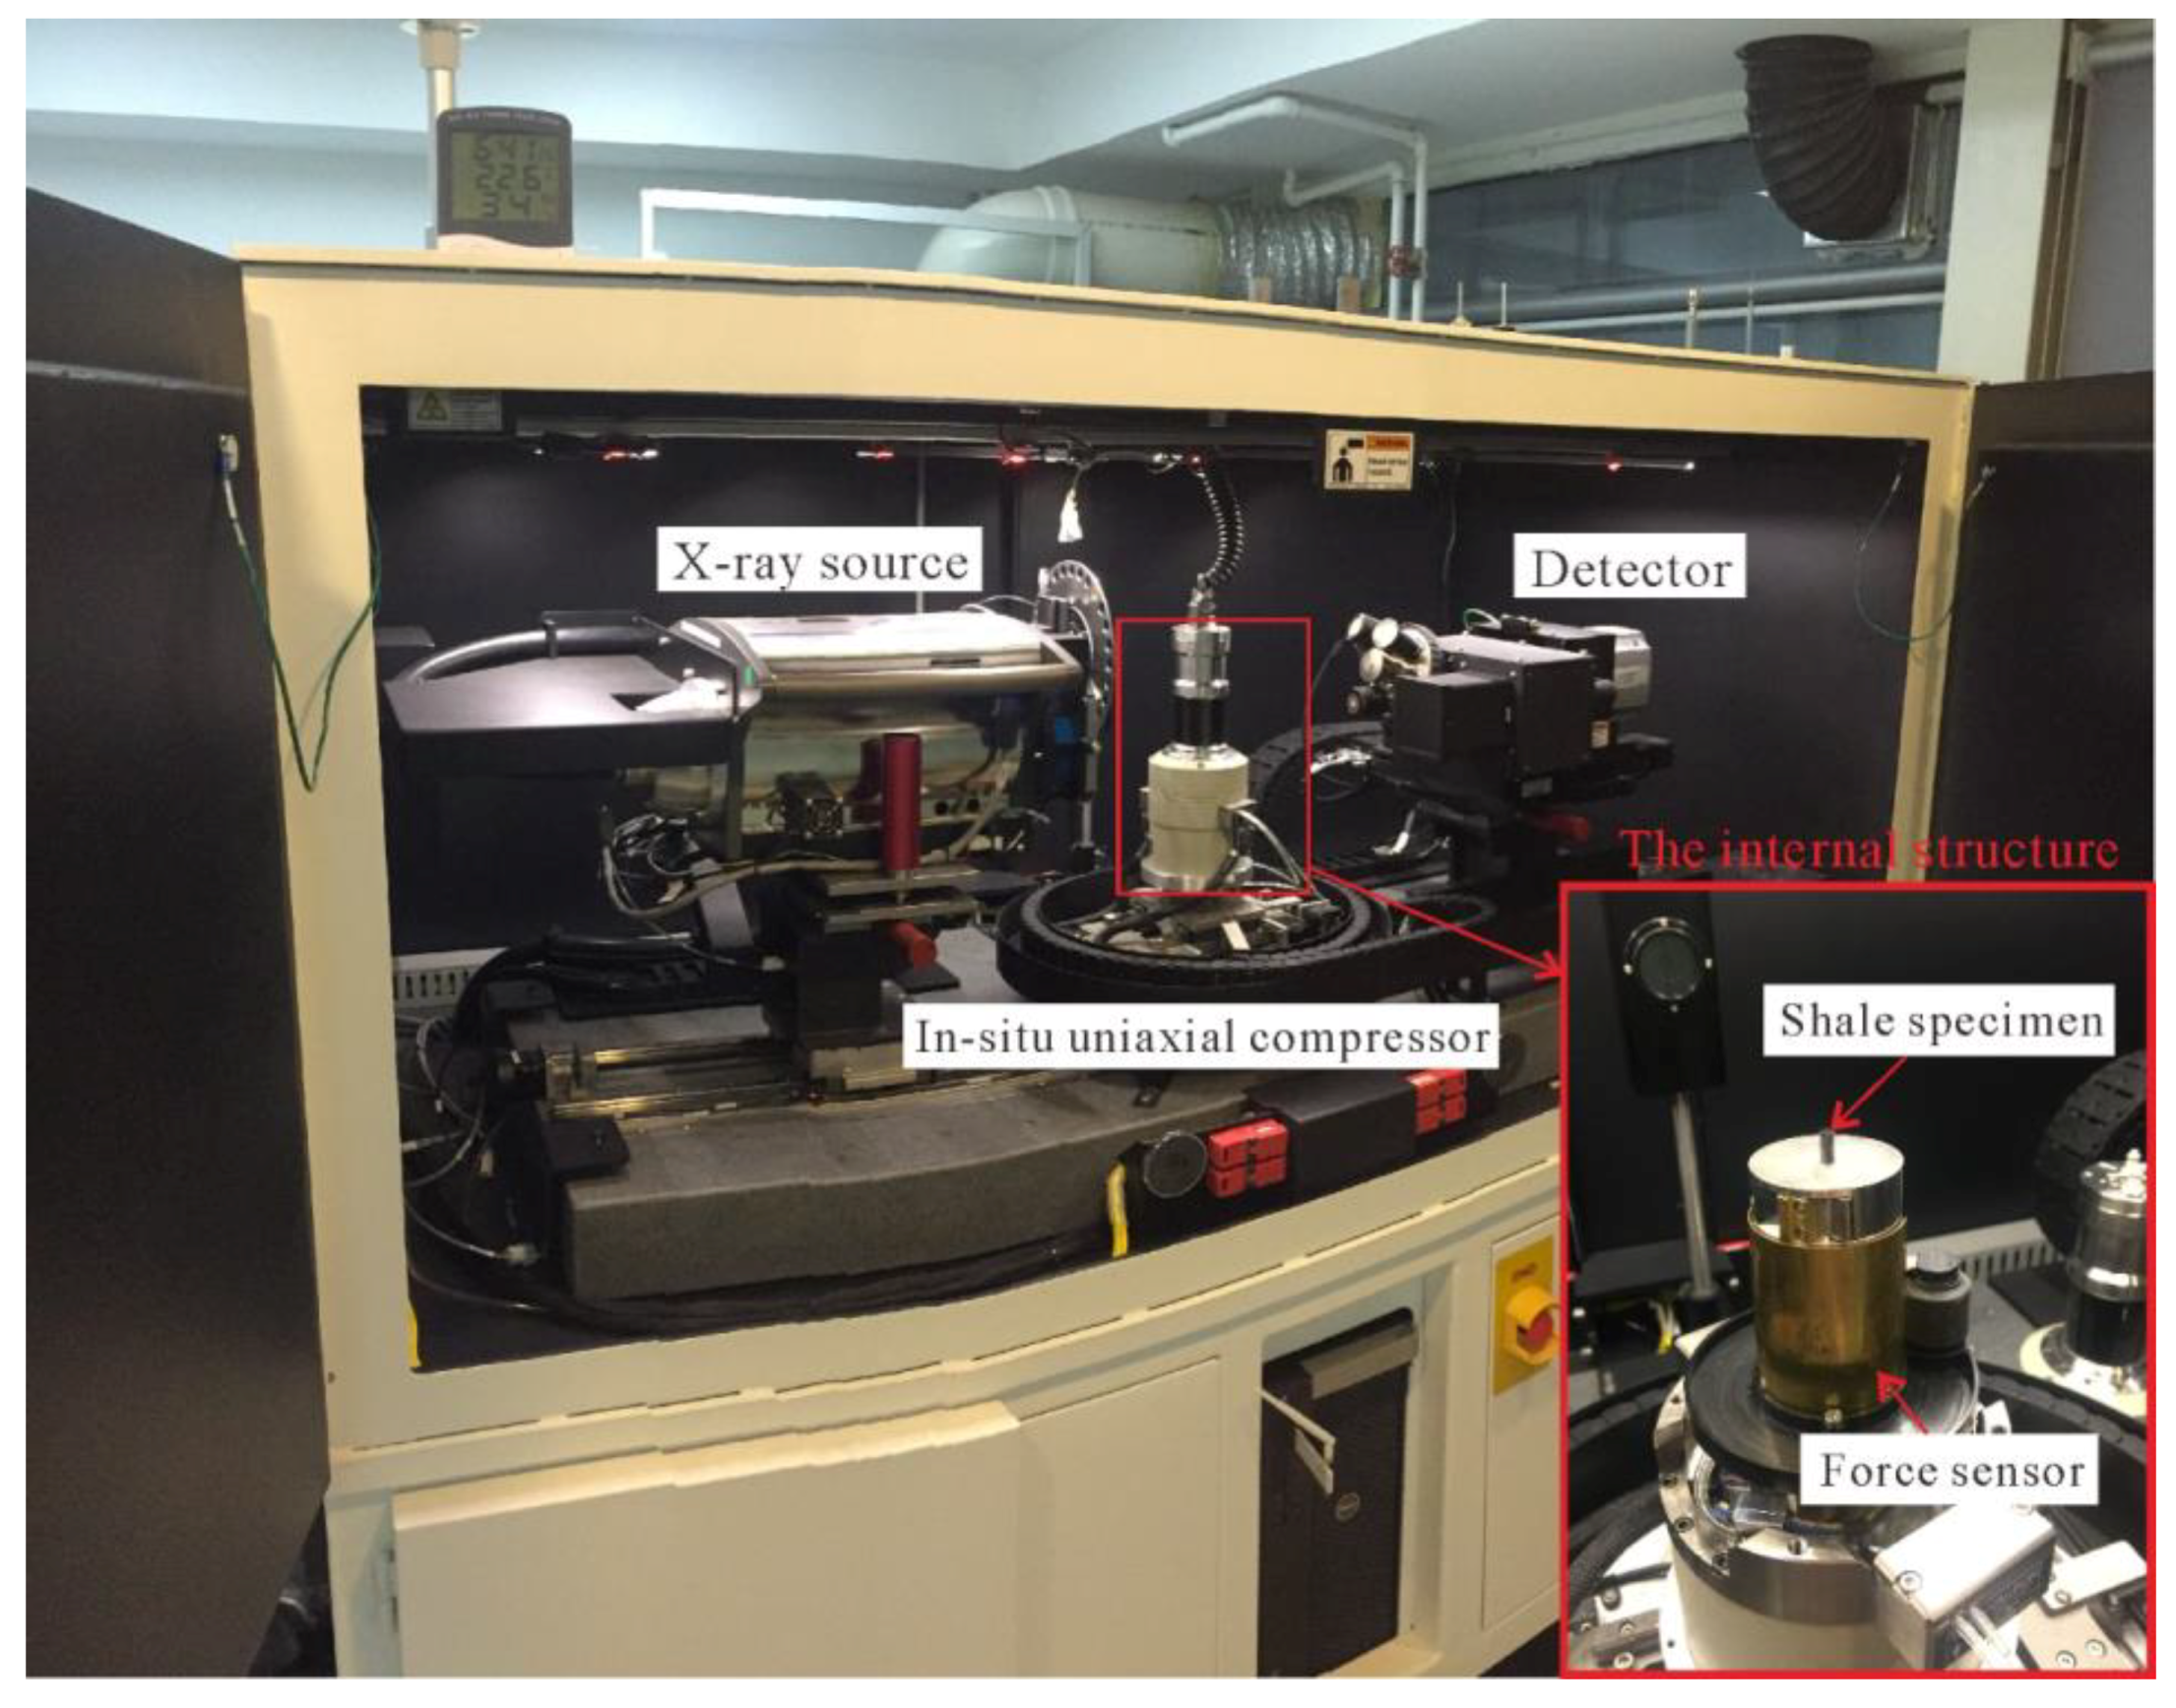
2.1. Testing Device

The uniaxial compression tests were performed on a Deben MICROTEST compression stage installed inside a ZEISS Xradia 520 Versa 3-D X-ray microscope (Figure 1), sometimes called micro-CT, at the Institute of Geology and Geophysics, Chinese Academy of Sciences, Beijing, China. The micro-CT has a minimum spatial resolution of 0.7 μm, and an energy range from 30 kV to 160 kV. The collection rate of the compression stage was 10 points/s, with a maximum load capacity of 5 kN. Mineral analysis of shale was measured on argon-ion-milled specimens, and examined with a ZEISS Merlin field emission scanning electron microscope (FE-SEM), with a Mineral Identification and Characterization System (AMICS) software package, at the Institute of Geology and Geophysics, Chinese Academy of Sciences, Beijing, China. The spatial resolution of the FE-SEM is 0.8 nm at 15 kV.

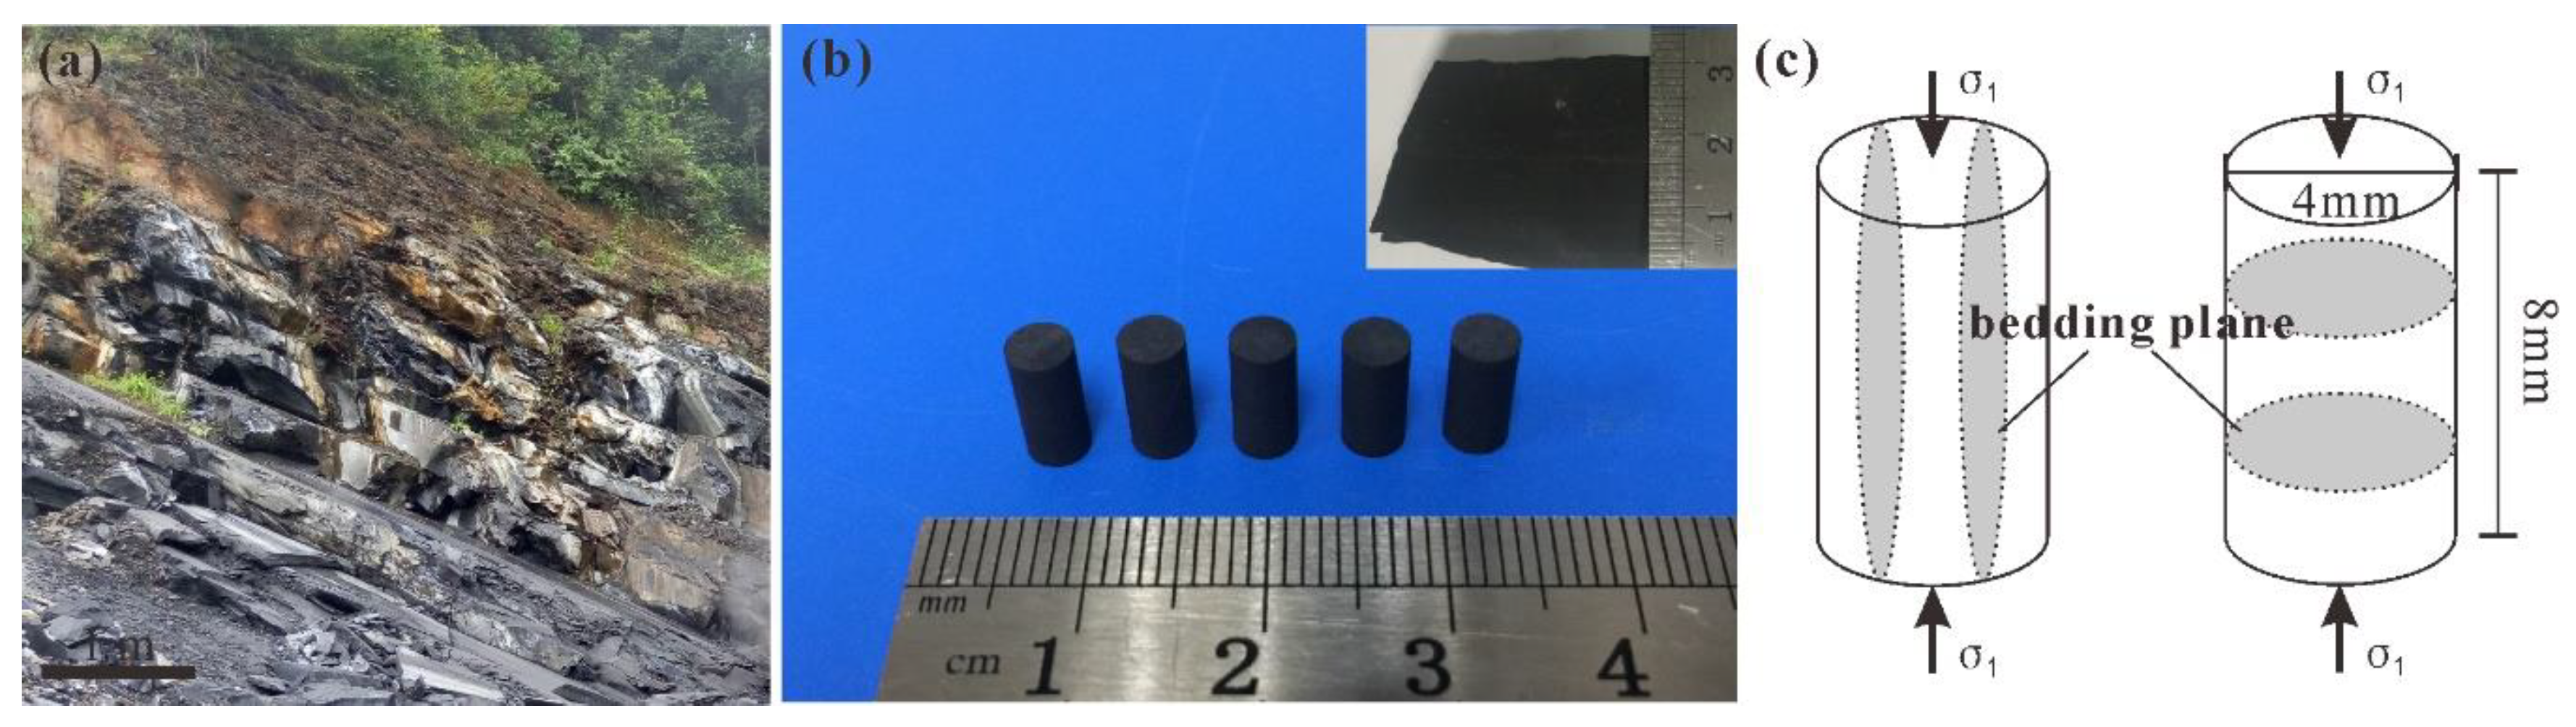
2.2. Specimen Preparation

The black shale specimens for testing were obtained from a Lower Silurian Longmaxi Formation outcrop (Figure 2a), located in southeastern Sichuan Basin at Shizhu county, Chongqing, China. We selected unweathered and unoxidized shale. The bedding planes on a centimeter-level scale macroscopically obscure (Figure 2b).
To investigate the effect of the bedding plane direction on mechanical property and fracture propagation during deformation, cylindrical plugs with a diameter of 4 mm were cored from the shale at the same level, along directions perpendicular to and parallel to the bedding plane (Figure 2c), using a hollow cylindrical, rotary core bit mounted on a drill press. Cylindrical plugs were then cut to a height of 8 mm, with the end surface flat and parallel (Ф4 mm× H8 mm), having less than ±0.6 mm error. Finally, the two ends of the plugs were mechanically polished to reduce end effects during uniaxial compression. For the uniaxial compression test, eight plugs were prepared and divided into two groups. Four plugs (numbers: SZA1-SZA4) were prepared for loading parallel to the bedding orientation (0° orientation), and the other four (numbers: SZB1-SZB4) were prepared for loading perpendicular to the bedding orientation (90° orientation). We did mechanical polishing and argon-ion-milling on one cut end of a cylindrical specimen for FE-SEM observation and AMICS analysis.

2.3. Experimental Procedure

To obtain the micro structure and mineral composition, FE-SEM backscattered electron (BSE) images on argon-milled specimen surfaces were used. The energy dispersive spectrometer (EDS) analysis was performed on a 300 μm × 300 μm region coated with carbon film, and mineral identification and analysis were automatically carried out using AMICS software.
Before uniaxial loading tests, all specimens were wrapped with a very thin polymer film, except both ends, to insure the integrity of specimens after fracturing. Vaseline was applied on both ends of specimen to reduce friction and the end effects. Specimens SZA1, SZA2, SZB1 and SZB2 were put directly under uniaxial compression to obtain stress-strain curves, and to identify the load conditions which represent the corresponding crack closure and linear elastic stage, and crack damage and unstable propagation stage. During the loading process on specimens SZA3, SZA4, SZB3, and SZB4, stress-strain curves were recorded. The specimen displacement was kept unchanged during a 40 min 3-D CT scan. Eventually, the stress was unloaded when specimen failure was detected, and final 3-D CT scan was conducted. Using these CT images, we restructured 3-D images of the micro cracks at different stress stages. All specimens were scanned at 90 kV/87 mA. A pixel number of 1024 × 1024 and pixel size at 11.27 μm were used. The loading was carried out at a speed of 0.03 mm/min and a room temperature of 22 °C.

3. Results and Discussion

3.1. Micro Structure and Mineral Composition

Based on a 300 μm × 300 μm region of a BSE image (Figure 3a), the mineral compositions of shale specimens were obtained using AMICS (Figure 3b). Clay minerals, albite, and organic-matter are aligned parallel to the bedding (Figure 3a). The quantitative AMICS results (Figure 3d) show that the quartz content in Longmaxi Formation shale is approximately 32.62 wt %. Other minerals include orthoclase (35.42 wt %), plagioclase (albite and oligoclase, 17.33 wt %), carbonates (calcite and dolomite, 5.99 wt %), clay minerals (illite, 4.73 wt %; chlorite, 0.02 wt %), pyrite (2.97 wt %), and minor rutile and apatite (0.33 wt %). Brittle minerals (quartz, feldspar and calcite [40]) dominate (88.49 wt %) the Longmaxi shale. Calculations based on gray-scale segmentation of the BSE image using the ImageJ program indicate that both organic matter and pores account for about 2.66% of the total area in the Longmaxi shale (Figure 3c).
The 3-D micro-CT images of shale specimens before uniaxial loading (see Figure 4) show that pyrite in the laminae has the highest density, pores have the lowest density, and organic matter is in between. Pyrite laminae are less than 100 μm thick, which are difficult to see macroscopically, but are easily detected by CT images. They developed as lens-shaped at diverse positions of both 0° and 90° specimens, indicating heterogeneity of structure and mineral composition. The volume percentage of pyrite in specimens SZA3, SZA4, SZB3, SZB4 is 2.58%, 2.09%, 1.89%, and 1.63%, respectively. No visible original fracture can be seen in the specimens, which provides good experimental conditions for comparison with crack propagation.

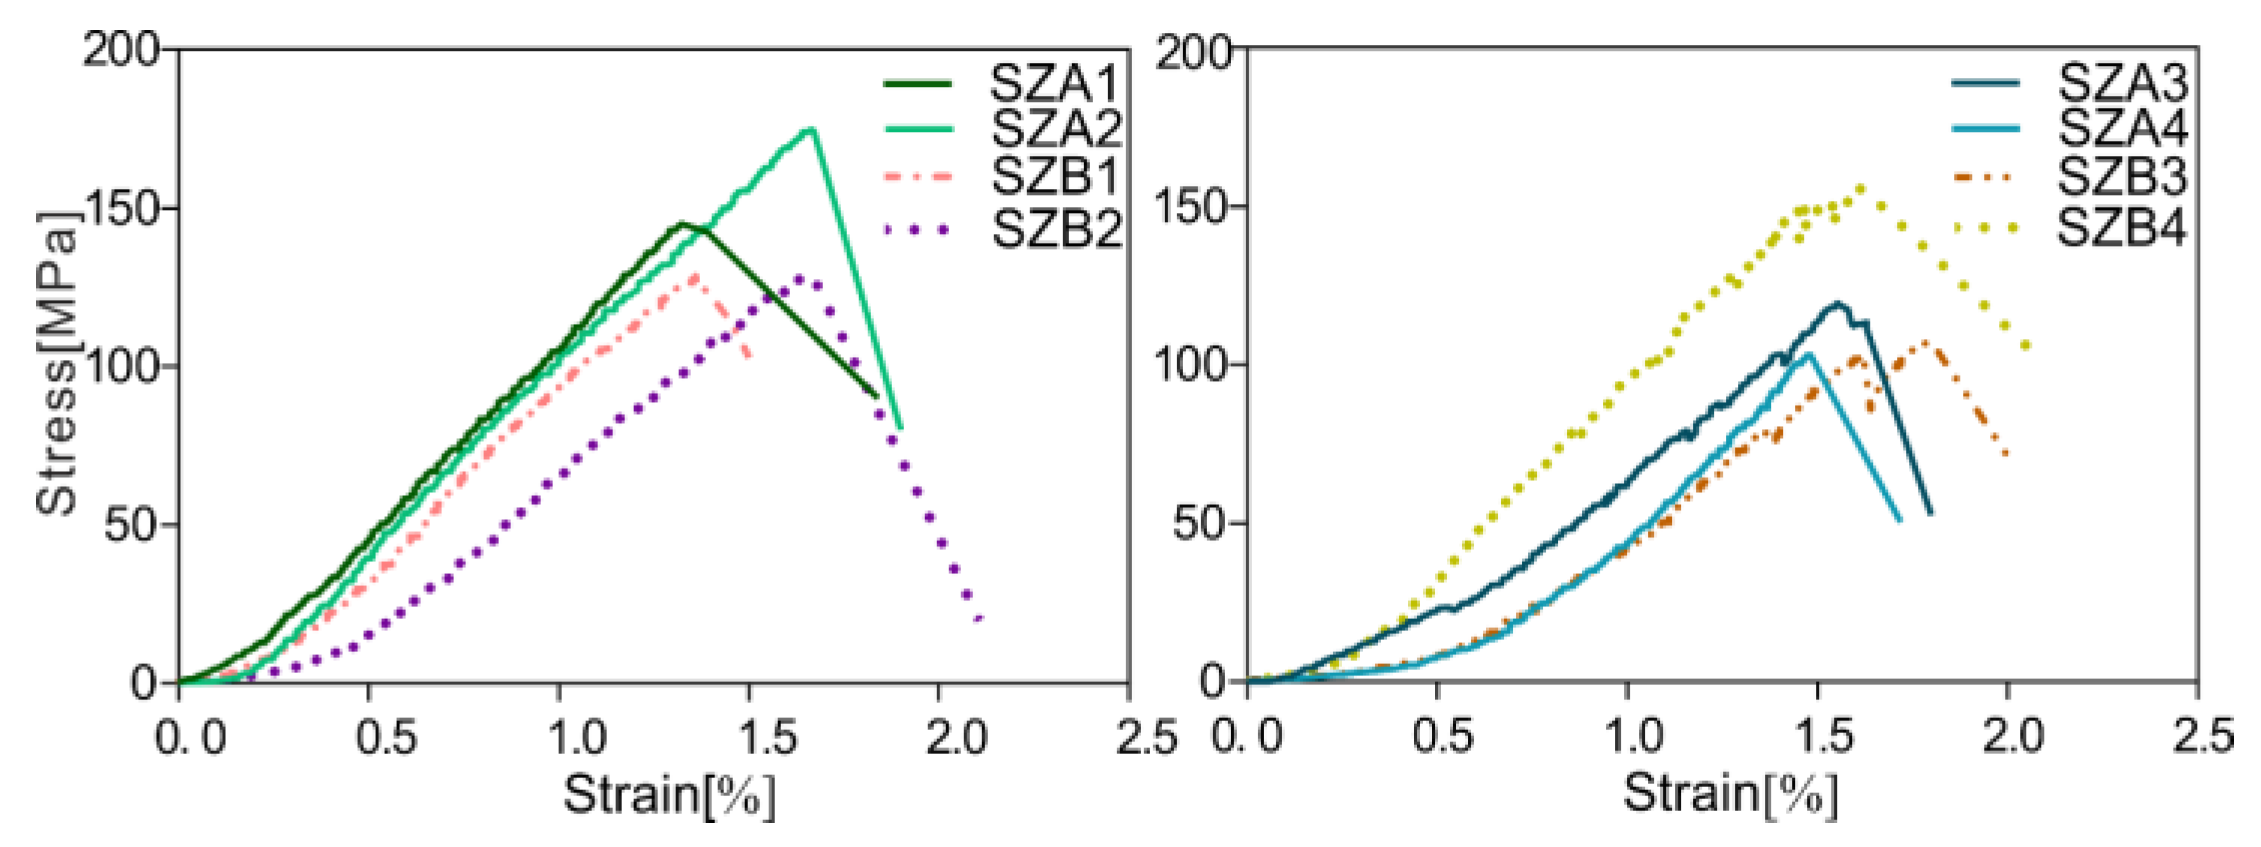
3.2. Mechanical Property Measurements

The stress-stain curves of the Shizhu Longmaxi shale suggest that the shale is brittle (Figure 5). The curve slope rises slowly during the initial compaction stage. As loading increases, the curve slope remains basically unchanged at the linear elastic deformation stage. No obvious plastic deformation stage can be noticed, and it is difficult to identify the yield point. After the loading reaches peak, the stress falls immediately and steeply, without residual strength after the break-up of the specimen. Each time the compression process was paused for CT scanning, no further displacement occurred. This phenomenon of stress relaxation can be seen on the curves, though it had little impact on numerical results.
The uniaxial compressive strength (UCS) and Young’s modulus (E) test (Table 1) show that, for the SZA specimens with 0° orientation, the UCS ranges from 103.52 to 174.63 MPa (with an average at 135.75 MPa), and E ranges from 10.09 to 12.93 GPa (with an average at 11.91 GPa). The UCS of SZB with 90° orientation is in the range of 107.16–155.76 MPa (with an average at 134.67 MPa), and E is between 8.77 and 11.91 GPa (with an average at 10.70 GPa). The average values of the UCS and E for specimens at 0° orientation are both slightly higher than the average values obtained at 90° orientation. In addition, the UCS values at 0° and 90° orientation are all characterized by large variation, but there was little variation among E values, supposedly caused by the heterogeneity of structure and mineral composition.
The height-diameter ratio of specimens in this paper is 2:1, with dimensions of Ф4 mm × H8 mm, as this is suitable for high resolution micro-fracture propagation observation in micro-CT and burst modes analysis.
The average UCS of the Longmaxi shale specimens is 135.21 MPa, which falls in the range of the UCS (81.9–157.2 MPa) measured by previous studies [14,41,42] using specimens (Ф50 mm× H100 mm) from the adjacent area. E values from current study (11.24 GPa in average, Table 1) are consistently smaller than the previously measured E values (14.9–44.5 GPa) using Ф50 mm × H100 mm specimens. Also, a previous compression experiment tested Ф4 mm × H8 mm specimens showed that the E values ranged from 4.19–10.38 GPa [32]. Three out of four E values from the previous study are smaller than the values obtained during current tests. Ruling out the existence of test errors, it is probably a function of specimen size.
Although the size effect on mechanical properties, especially for rock, is very complicated, it has been revealed that UCS reduces with an increase in specimen size, following the exponential decay laws on the basis of majority tests on coal specimens with increasing diameter [43,44,45,46,47]. The elastic modulus of coal specimens decreased with an increase of diameter by means of a negative power function, nearly independent of the confining pressure. Since few previous rock compression experiments with the diameter below 10 mm have been reported, accurate size effects at this scale are still lacking.

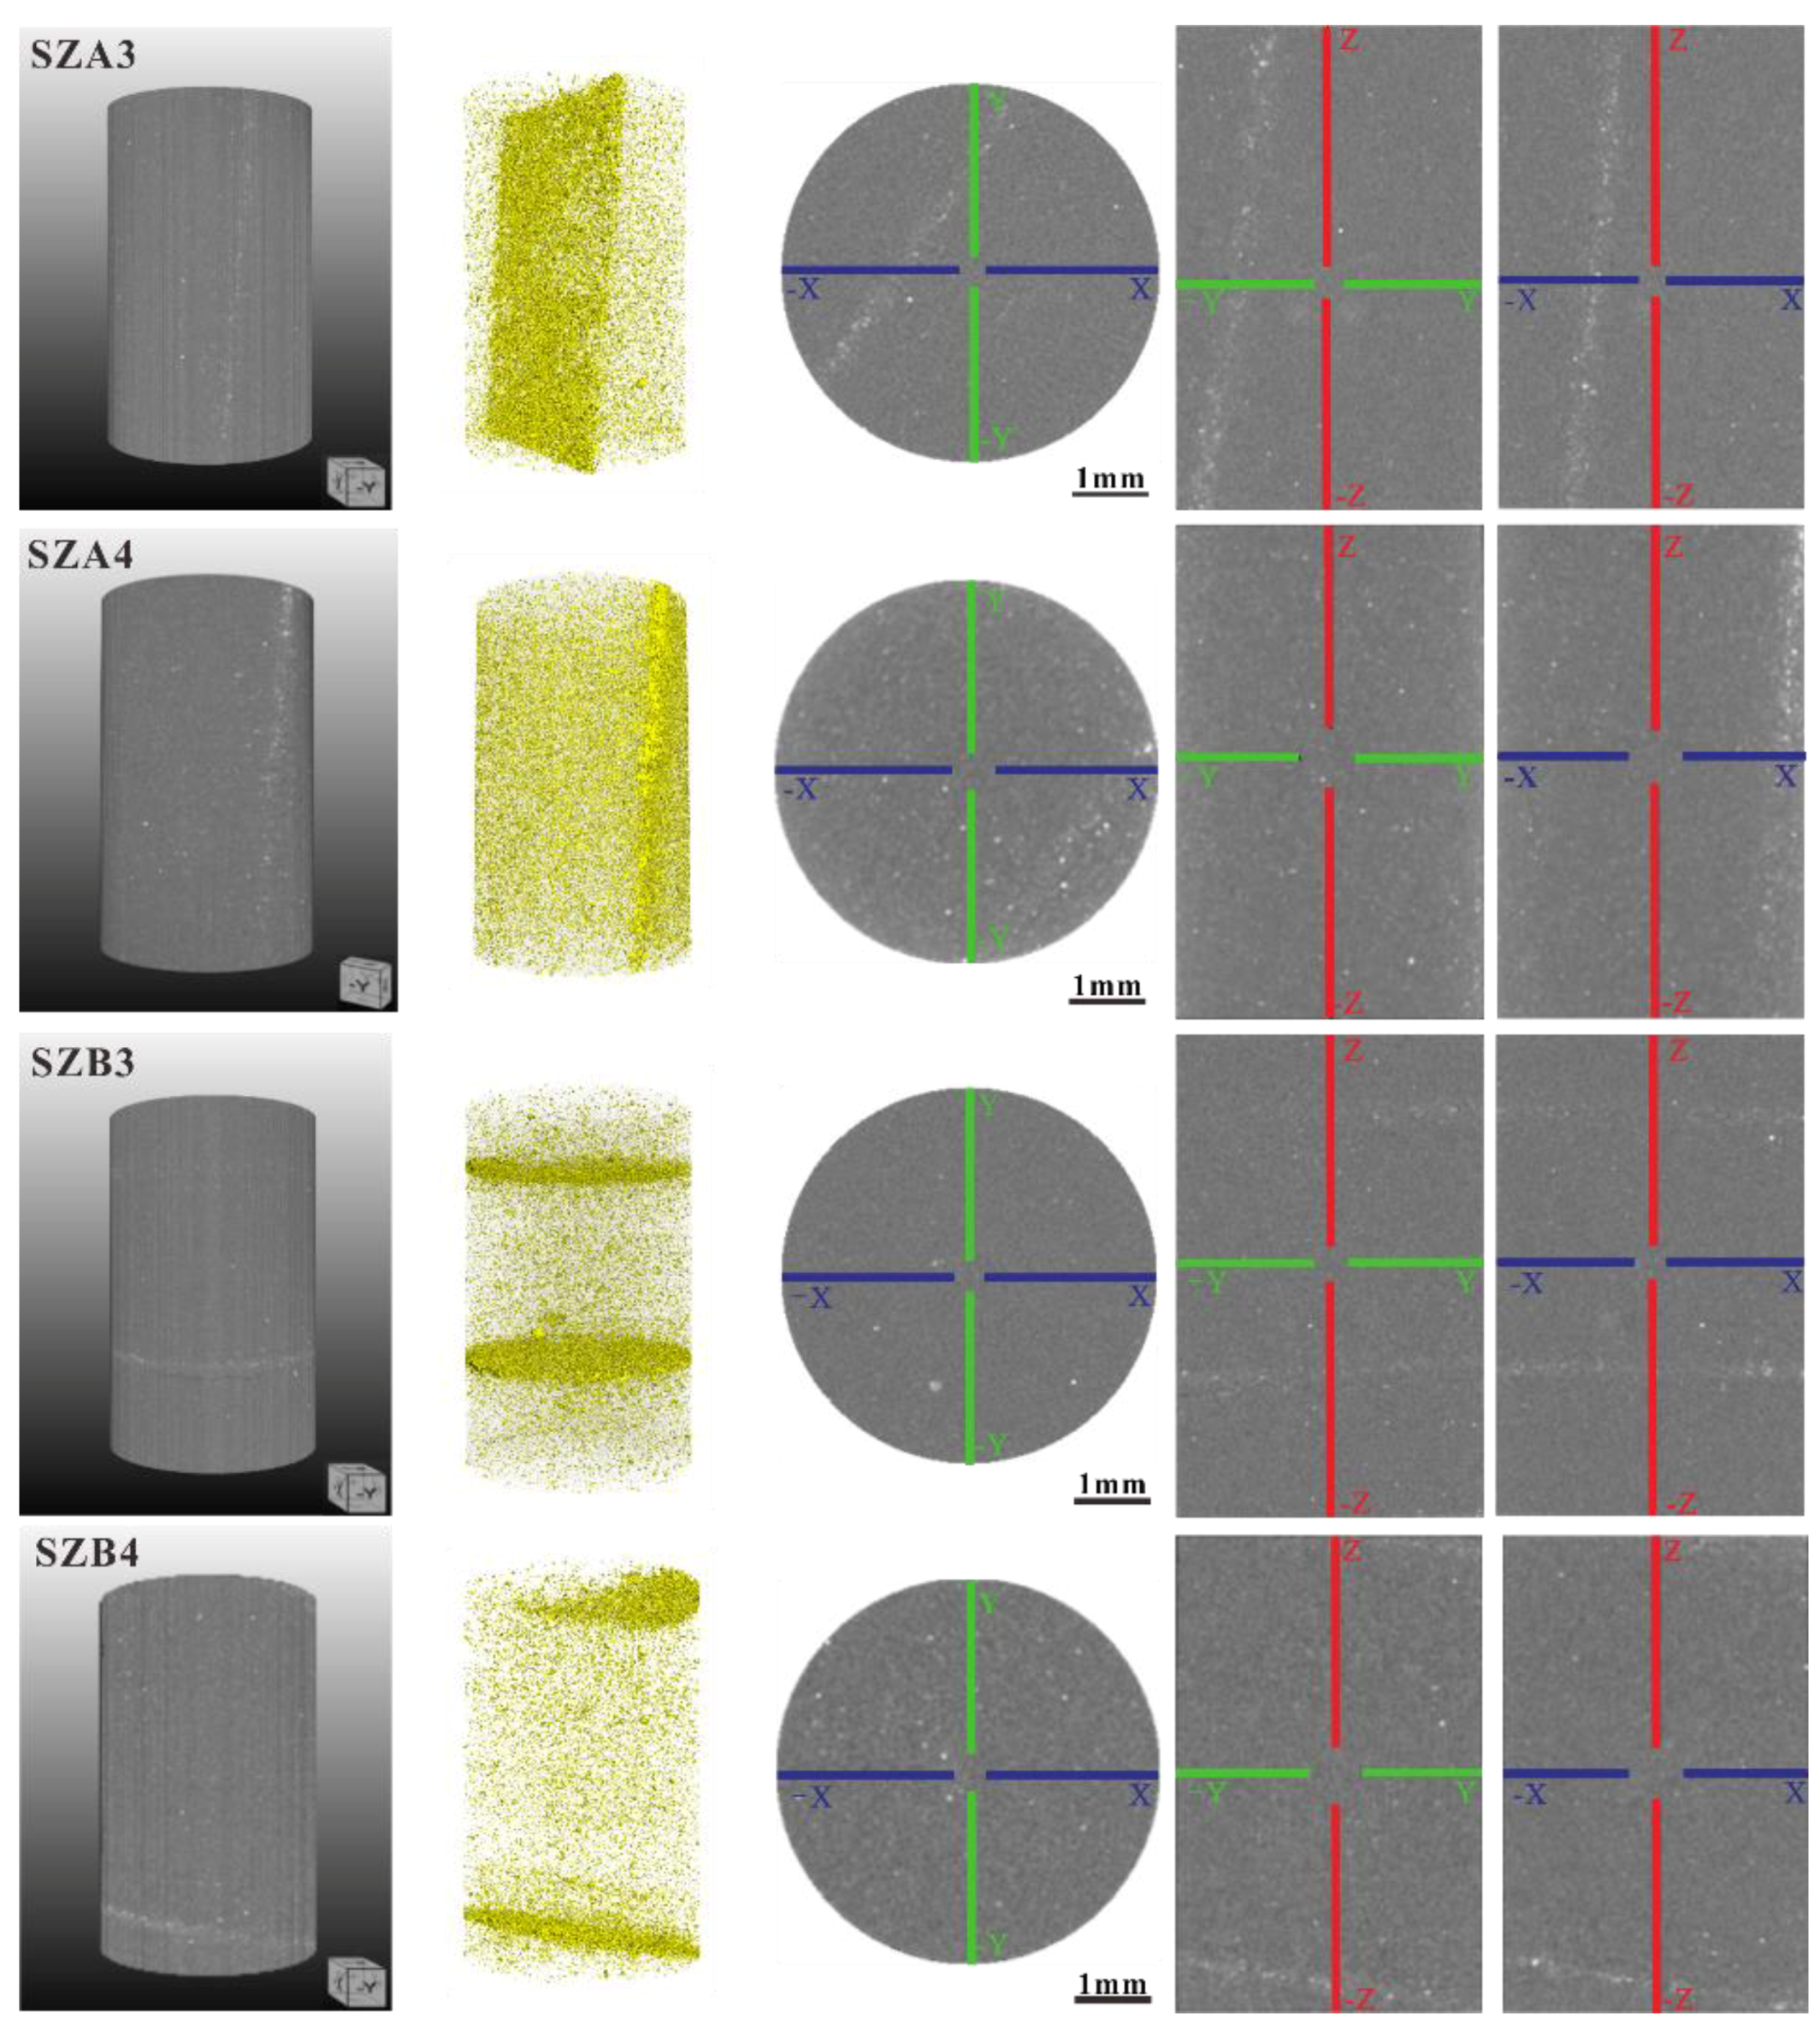
3.3. Cracks Propagation Analysis

The cracks and pores in 3-D reconstructed micro-CT image were segmented using the ORS Visual image processing software. Firstly, we selected an appropriate threshold for segmentation. Secondly, a seed algorithm was applied to the connectivity analysis of extracted cracks (connected pores), using Connected Component Analysis Module in ORS Visual. Finally, the distribution of crack thicknesses was counted and presented in histograms. However, the threshold segmentation of these micro-CT images cannot guarantee data accuracy due to nanoscale shale pore size. Cracks were quantitatively characterized for the samples examined in this paper.

3.3.1. 0° Orientation

The crack propagation pattern at different compression stages in SZA3 are presented in Figure 6. An initial tensile crack appeared when the load stress σ1 = 79.58 MPa (Figure 6a,b). With the load increasing, a secondary crack occurred when σ1 = 103.45 MPa (Figure 6c,d), while the original primary crack kept expanding. Finally, two fracture planes and a micro crack appeared in the fractured specimen at 119.72 MPa (Figure 6e,f).
The thicknesses of micro-cracks at different compression stages show a unimodal distribution, as indicated in Figure 7. At σ1 = 79.58 MPa, the thickness of >99.99% captured micro-cracks ranges from 10.17 μm to 114.38 μm (the rest, <0.01%, have too low frequency to be displayed) and 39.16% of the micro-cracks are 60–80 μm thick. At 103.45 MPa, the thickness of >99.99% micro-cracks ranges from 10.75–127.66 μm, and the thickness of 49.93% cracks is within a range from 60–80 μm. The increase of the 60–80 μm thick micro-cracks may be caused by the development of new micro-cracks and/or the enlargement of the smaller micro-cracks that developed during the previous stage. In addition, a secondary crack emerged in the middle of the specimen, connected to the primary crack and with a smaller crack on one side. Of the micro-crack thickness, 99.99% of completely fractured specimens ranges from 11.83–193.23 μm. The 40–120 μm micro-cracks accounted for 85.65%, indicating that the micro-cracks of different thickness are distributed more evenly with an increase in load stress.
As shown by the specimen SZA4 in Figure 8, a micro-crack appeared at the bottom at σ1 = 87.54 MPa (Figure 8), and its gray value contrast was too small to segment accurately. Therefore, we did not acquire its individual image and thickness distribution. However, we can determine from the 3-D reconstructed image that a primary fracture developed through the specimen along the Z-axis. In addition, a micro-crack developed a branch and cut through in the XY plane. The length and thickness of the branch expanded more than that of the crack in the original direction. At σ1 = 103.52 MPa, the specimen ruptured with several tensile cracks, three of which had not passed through the specimen (Figure 9a). The primary fracture has an oblique angle in the upper part, indicating the existence of a shear fracture in the 0° orientation specimen. Of the micro-crack thicknesses, 99% of the fractured SZA4 range from 10 μm to 194 μm, with most in the 50 μm–110 μm range (Figure 9b).

3.3.2. 90° Orientation

By applying the SZA3 protocol to the group B specimens, we found that the cracks of group B appeared relatively late, and the fractures tended to form quickly, suggesting a higher crack initiation stress. The first cracks were seen when σ1 = 103.45 MPa for specimen SZB3 (Figure 10), partly as a result of tension cracks. Compared to specimen SZA3, the direction of the first crack is not entirely parallel to that of the principal stress. The thicknesses of micro-cracks at different compression stages are summarized in Figure 11. The 40–80 μm thick cracks accounted for 66.56% of the total. As the stress increased, a secondary crack developed and joined the primary crack. The damage progressed by further crack propagation, which crossed and connected to the previous ones. These were accompanied by the micro-cracks oriented parallel to the bedding plane, and followed by the specimen bursting apart. Since there was a small part of the SZB3 specimen splitting after the specimen fractured, the image of the primary crack in the -YZ view was not fully displayed after the image cropping process, which overestimated the number of micro crack >160 μm thick. The thickness of the micro-cracks ranges from 20 to 60 μm, accounting for 48.15% of the total.
In specimen SZB4, a crack was not observed until σ1 = 127.32 MPa. It developed locally at the bottom of specimen, branching along the XY plane (Figure 11). The thickness of micro-cracks is less than 100 μm (Figure 12). When stress reached peak strength, many cracks appeared, with the thickness increasing to 10.47–361.06 μm. Shear sliding fractures oriented at an angle of about 70° to the horizontal direction, and short parallel cracks can be easily found along the bedding plane orientation. The mid-value thickness of cracks is higher than that in SZA3 and SZA4.
Crack evolution in shale specimens with horizontal bedding planes during compressive deformation has been reported [33]. Wang et al. observed the spatial changes of organic matter and pyrite before sample failure and found macroscopic fractures ~20° oblique to the loading direction in an “X” shape. To reduce random error from threshold segmentation of fine-grain shale, we used connectivity analysis, and focused on crack growth from crack initiation to sample failure. The failure pattern of specimen at 90° bedding orientation, composed of tensile cracks and shear cracks, is similar to the results of previous reports [33]. Comparing 0° and 90° bedding orientations, it is shown that layered structure and weak cementation between layers greatly impact the failure pattern in shale.

3.4. Quantitative Characterization of Cracks

We characterized the crack in volume percentage, surface area, volume, and specific surface area (SSA) with Connected Component Analysis Module in ORS Visual. The tortuosity was calculated in the Avizo Tortuority Module, and the fractal dimensions were analyzed by MatLab software with the segmented and binary CT scan images. The results are listed in Table 2. Clearly, the volume and surface area of cracks increased as the cracks developed. Furthermore, the volume of fracture in specimen at 90° bedding orientation is higher than that of 0° (Figure 13a), along with the higher average thickness. The following section will focus on the change of SSA, tortuosity and fractal dimension during uniaxial compression.

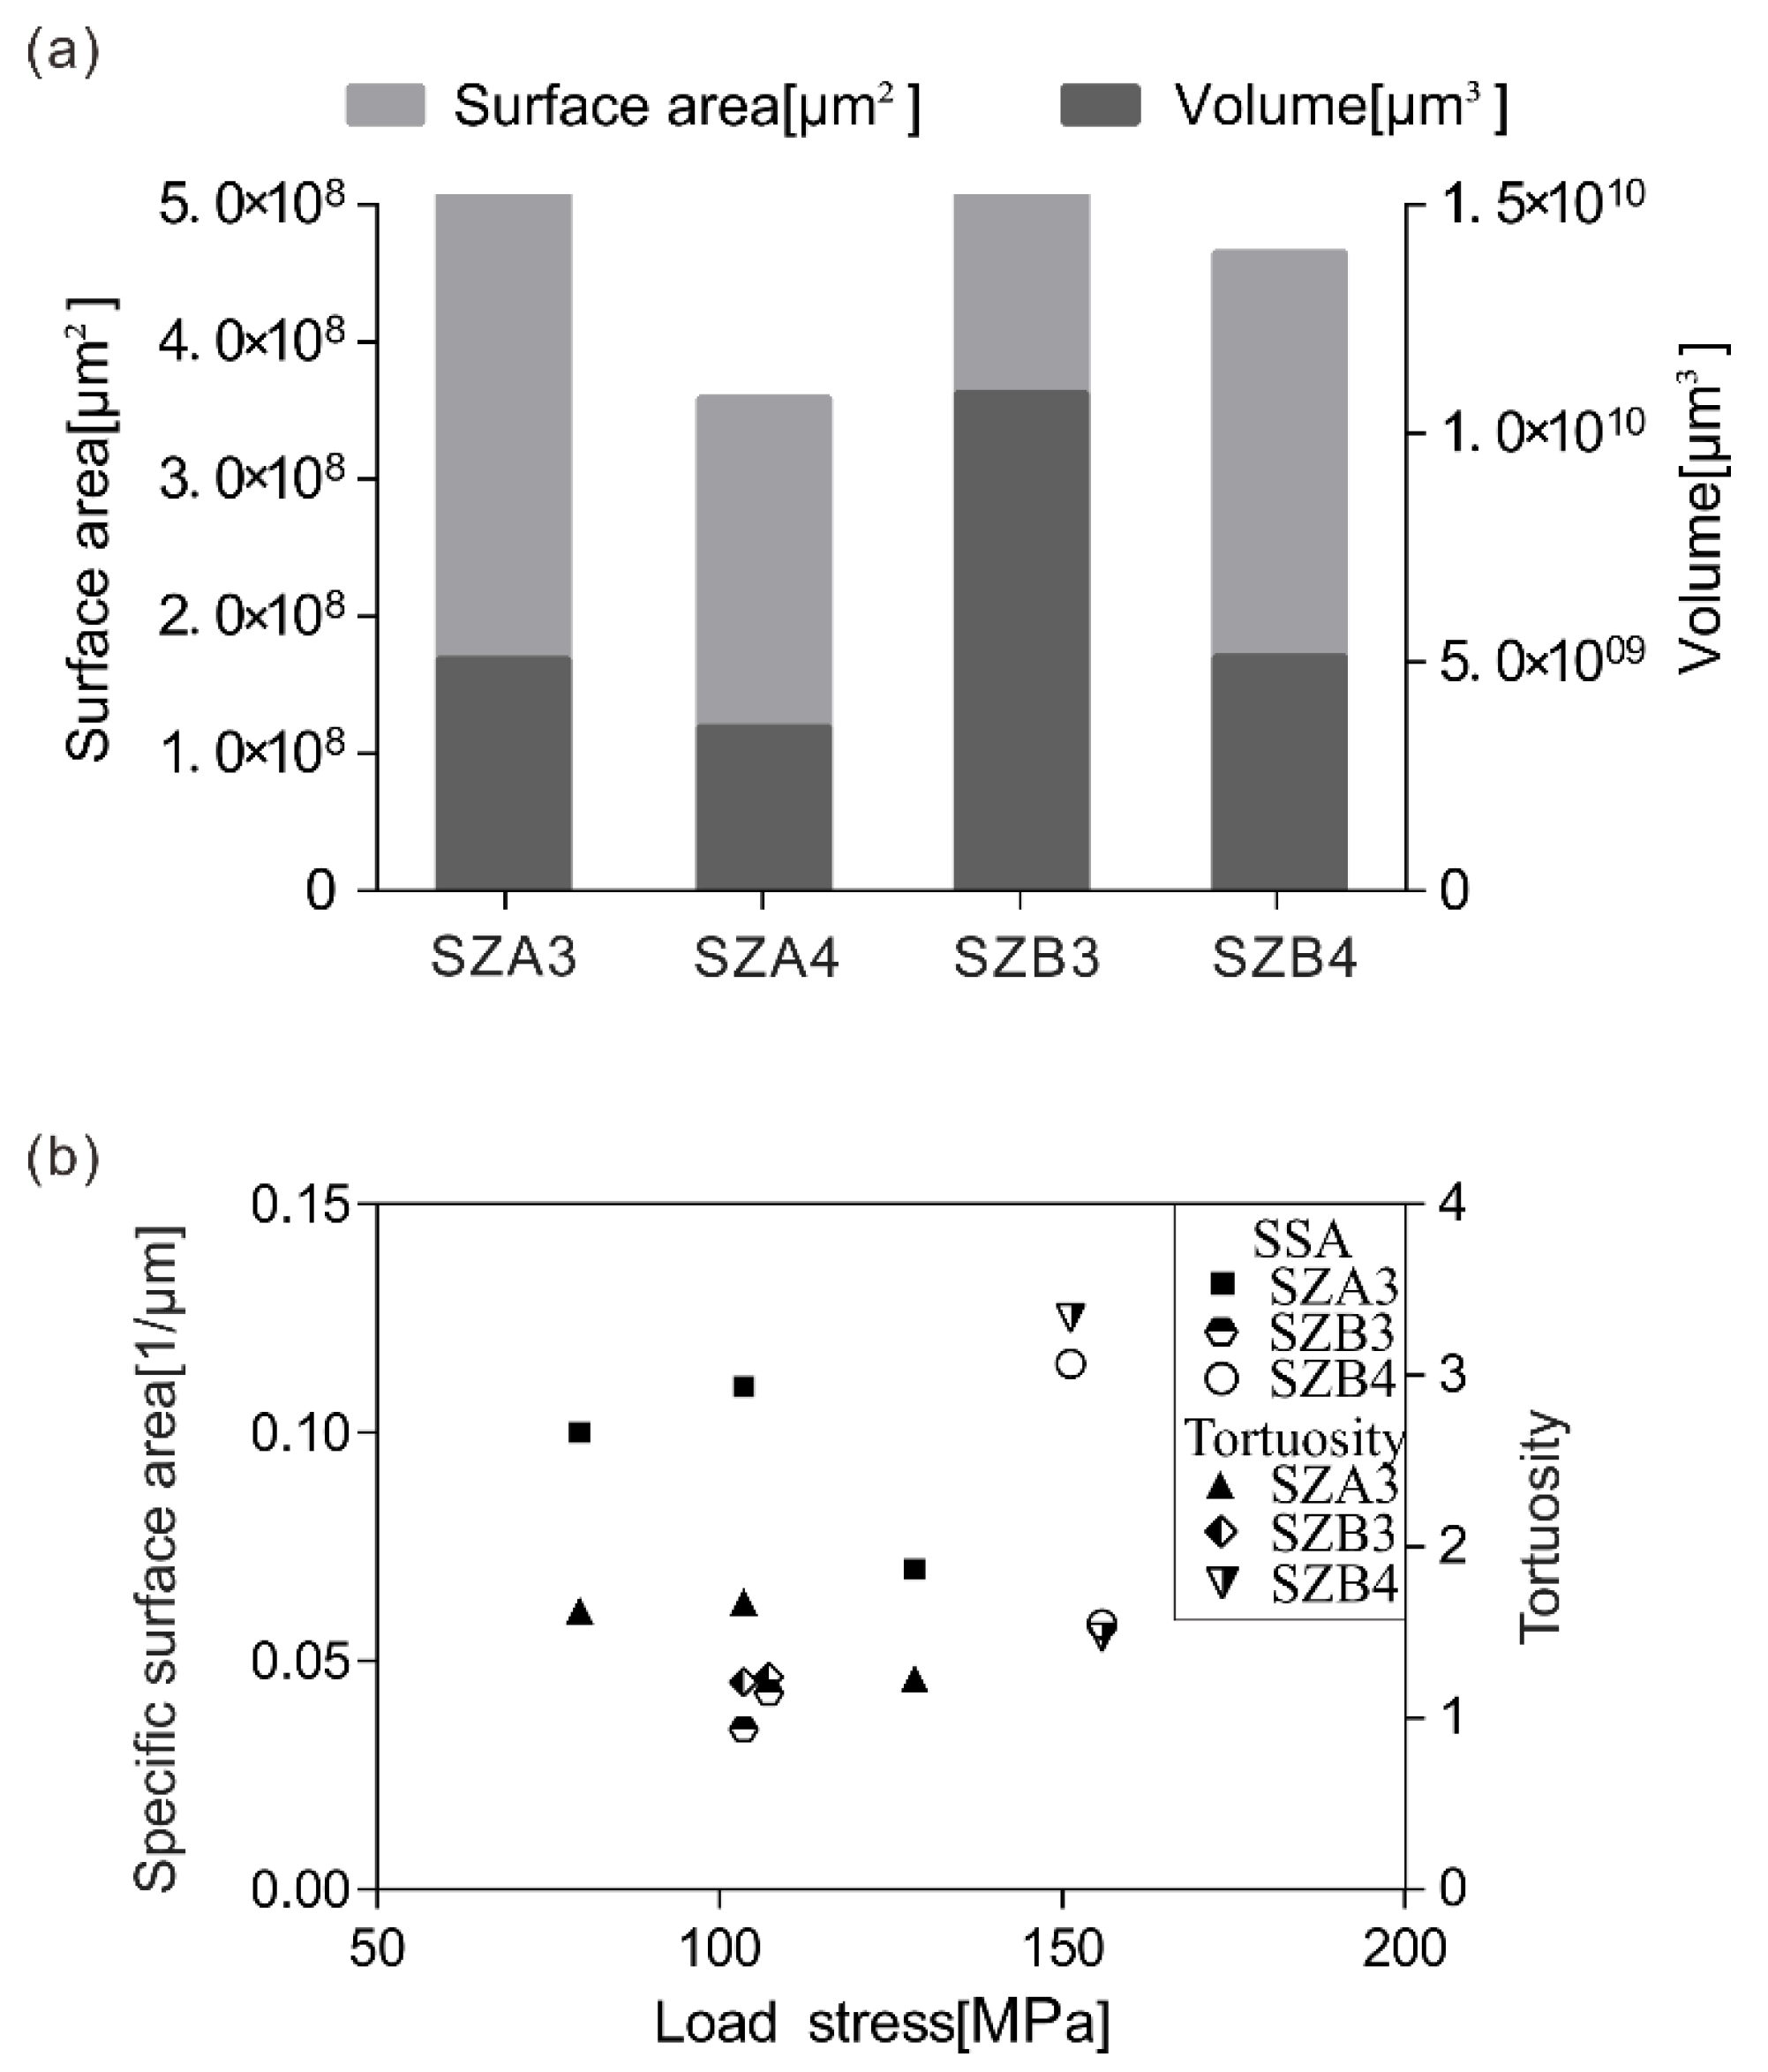
3.4.1. Crack SSA and Tortuosity

Specific surface area (the surface area per bulk unit volume) and tortuosity are important macroscopic pore structure parameters of porous material [48,49,50], which can reflect structural properties of the cracks in shale [51]. In this study, the tortuosity is defined as the ratio of the length of the path and the distance between its ends along z-axis [52] (Figure 14).
Although SSA and tortuosity are positively correlated at different load stages, they display different patterns in different specimens (Figure 13b). For specimen SZA3, the tortuosity of fracture slightly increased, with a new crack developing, then reduced when load stress reached the peak strength of the specimen. Likewise, the tortuosity of specimen SZB4 declined sharply as local cracks grew and became fully fractured. The tortuosity declined as fracturing completed, except for a slight deviation in specimen SZB3. This specimen ruptured with a small part splitting at σ1 = 103.45 MPa (Figure 10), which enlarged the surface area of the entire fracture, and probably caused the slight increase of SSA and tortuosity.
Tortuosity is commonly used to describe diffusion in porous media. In our case, it can reflect the morphological changes of fracturing at different layer orientation. Moreover, the analysis would have significance for promoting shale gas extraction during hydraulic fracturing.

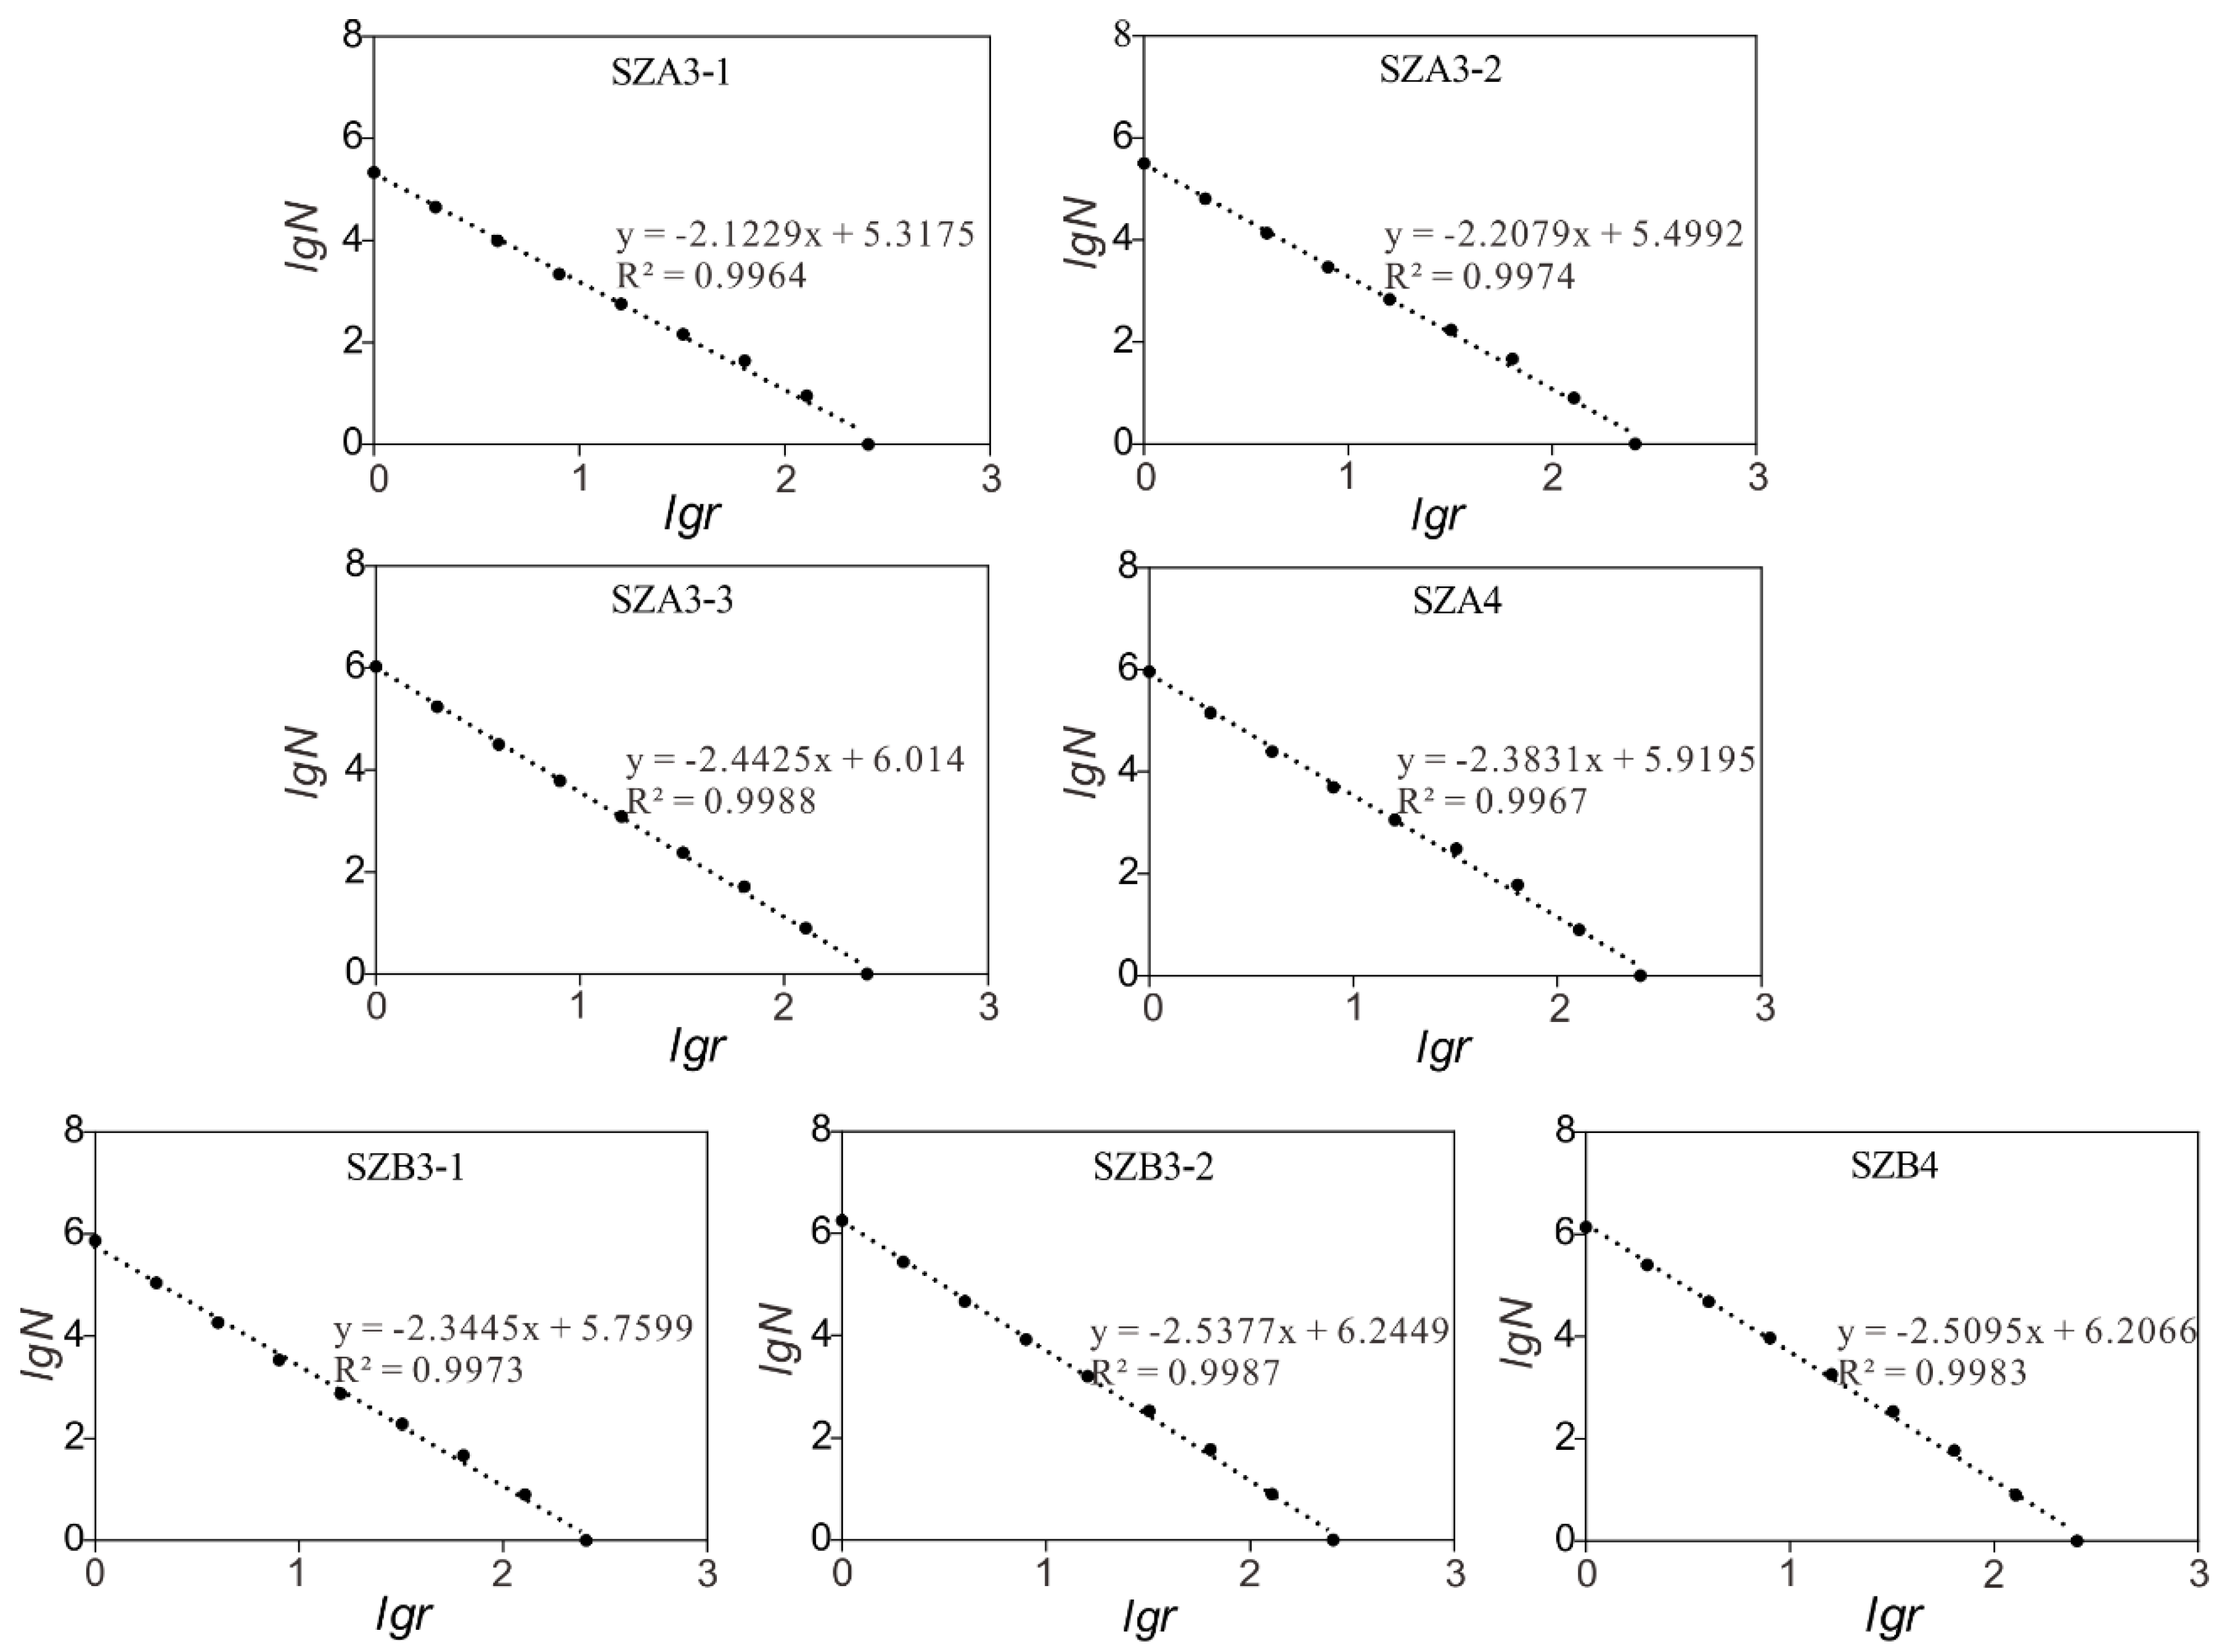
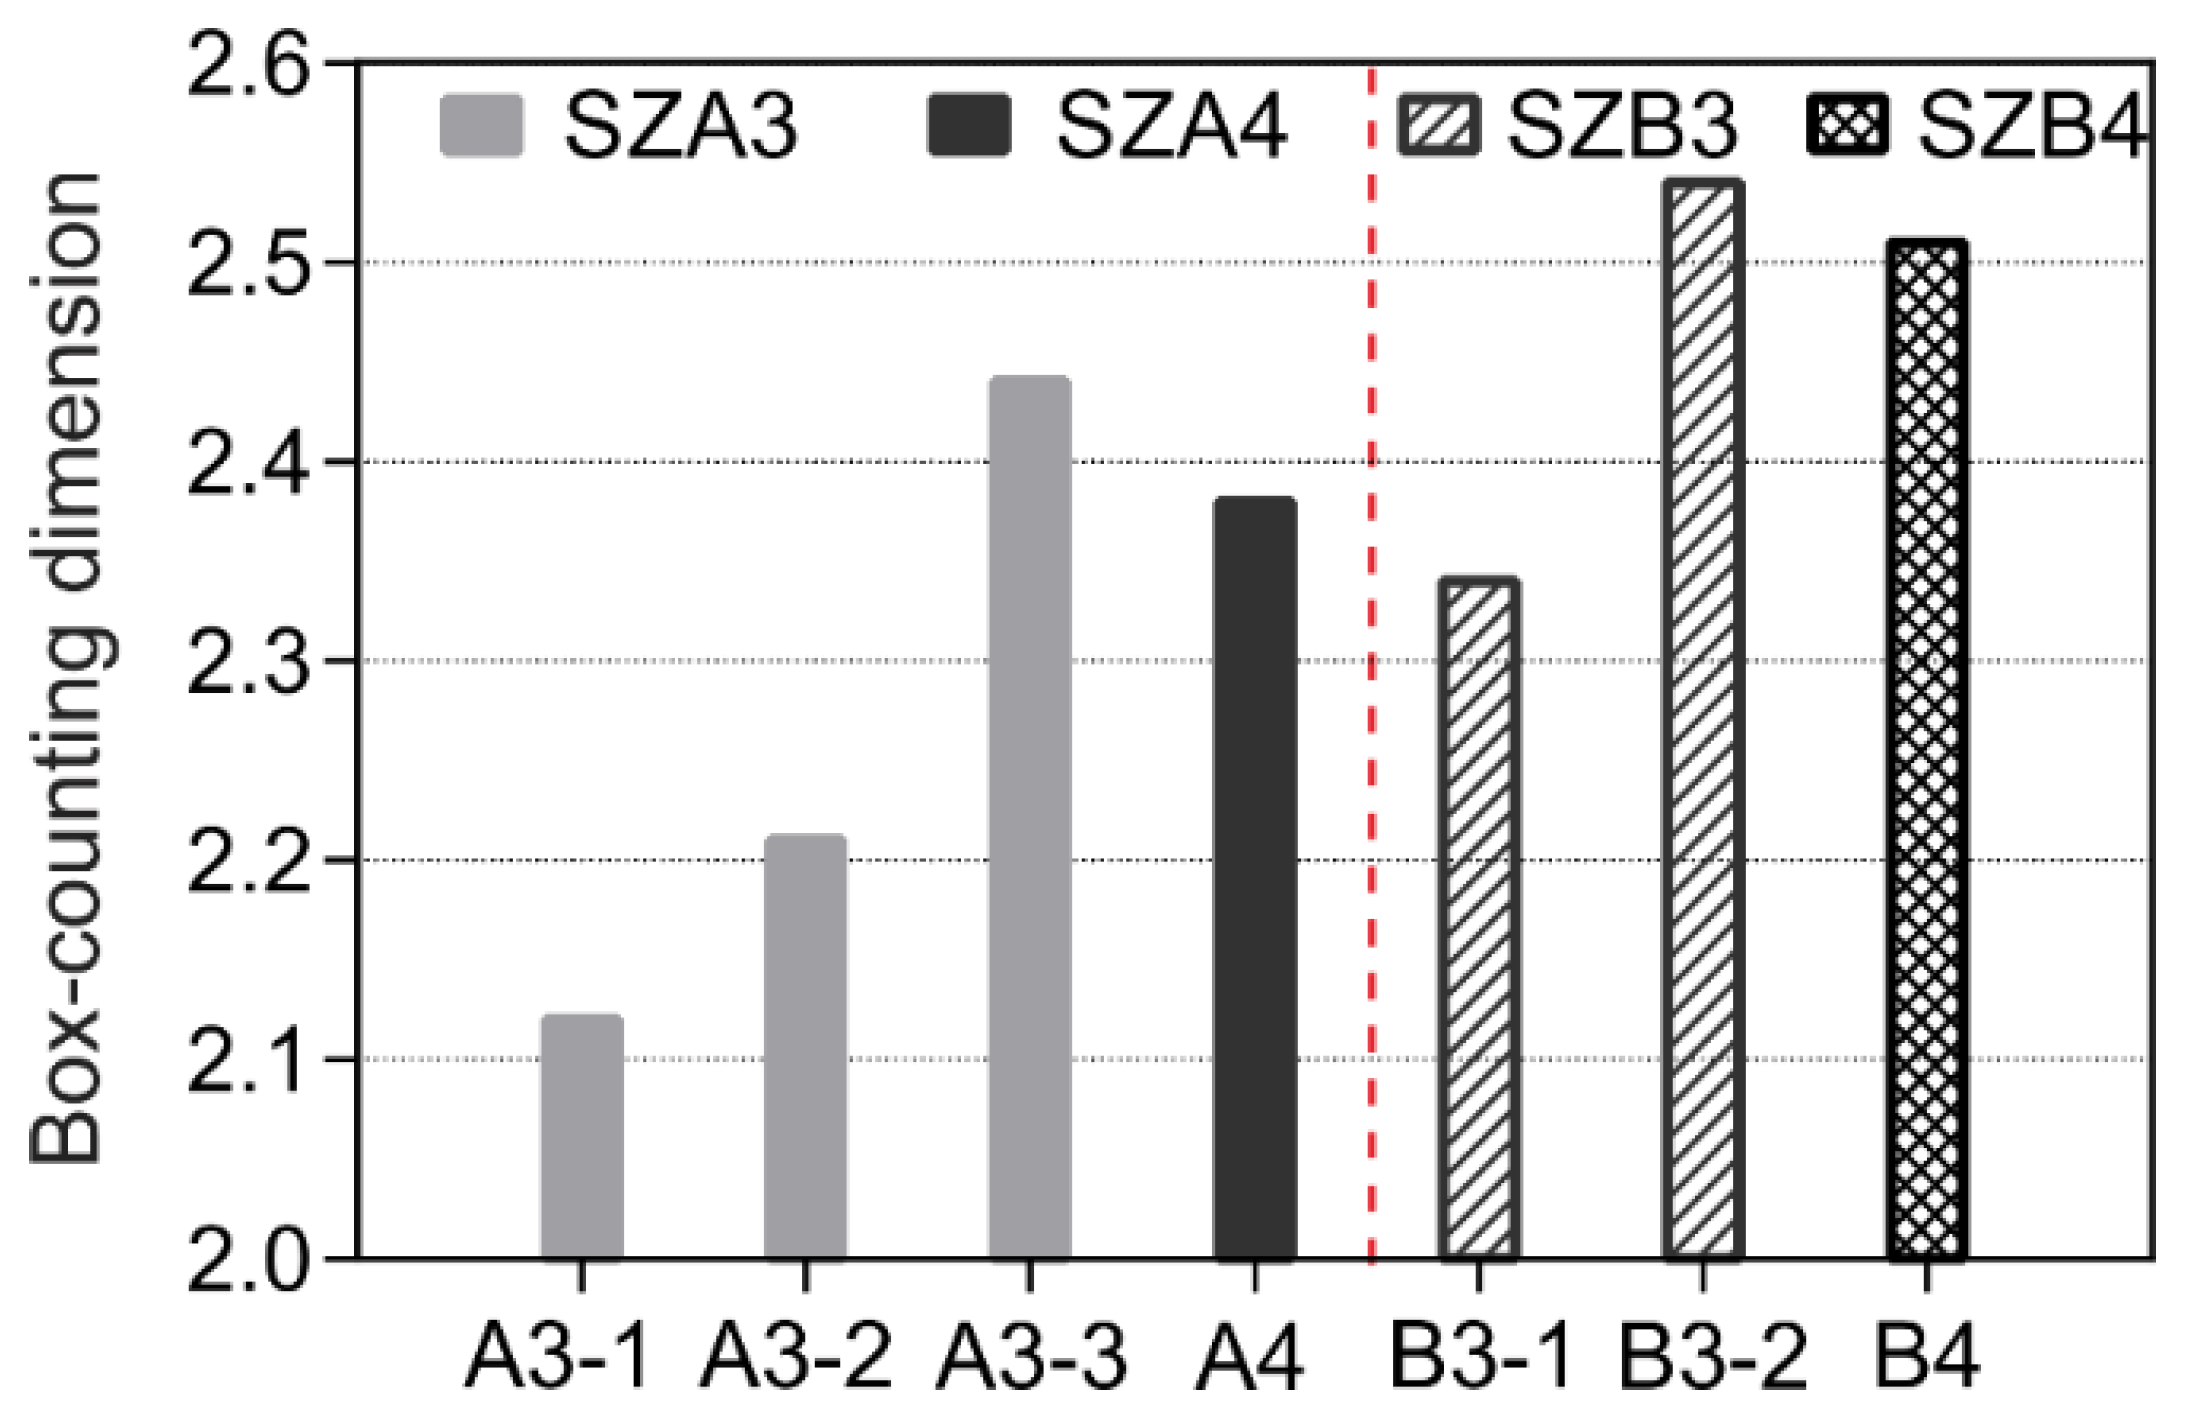
3.4.2. Crack Fractal Dimension

To develop fracturing technology in shale reservoirs, understanding the complexity of fractures in shale is essential. Given that different fracture modes occur in two group of shale specimens, the box-counting dimension (BCD) was used to characterize the fracture. BCD is one of the most common methods for defining fractal dimensions, because its mathematical calculation is relatively simple, and it has intuitive physical significance. Therefore, BCD was applied to characterize roughness and self-similarity in an image [24,53].
Defining a cube core which is accomplished by fully covering the specimen with a series of small boxes with a bottom edge length of r, and the number N of boxes containing cracks and pores. As the box side length r increases/decreases, the box number N changes. According to the previous definition, when lgN and lgr are projected in an orthogonal logarithmic coordinate system, the slope is the box dimension (D) of the cracks. The formula is defined as follows [54,55]:
D = l g N l g r
where, r is the measured unit size, N is the number of boxes, D is the BCD. The fractal dimension of a two-dimensional image is between 1 and 2, while that of a 3-D image is between 2 and 3. The higher the value of D, the more complex the crack will be.
We selected an appropriate threshold value and binarized the cracks of micro-CT image using ImageJ. We picked a cube of 256 × 256 × 256 pixels from center of the specimens and calculated the 3-D BCD from binary images of CT slices, which are listed in Figure 15. The results show good linear relationships between lgr and lgN (R = 0.998 average), which confirm the credibility of 3-D BCD values in reconstructed CT images. As the loading increased in SZA3, 3-D BCD increased from 2.12, 2.21 to 2.44 (Figure 16). The same pattern also appears in SZB3, indicating that the complexity of fracture increased both in the 0° and 90° bedding orientation specimens during the uniaxial compression. Thus, the 3-D BCD can accurately reflect the crack evolution law of shale specimens, the result of which is consistent with the CT scans.
Furthermore, the 3-D BCD for 0° bedding orientation is 2.44 and 2.38, lower than that of 90° bedding orientation of 2.53 and 2.50 (Table 2), suggesting that the cracks produced in 90° bedding orientation are more complex and heterogenous than the 0° orientation. It is speculated that the group A specimens (0° bedding orientation) rupture along the bedding direction. Consequently, most of the fractures are simple, smooth and vertical. Collectively, tension-shear cracks tend to be failure pattern cracks in group B specimens (90° bedding orientation), with more secondary cracks running along the primary crack. Even though the cracks of the group A specimens occurred earlier than those of group B, they are connected to each other as the load increases, which decrease in complexity, and lead to lower fractal dimensions. The comparison of fracture complexity at 0° and 90° will contribute to a better understanding of fracture propagation and failure patterns at different layer orientation.

4. Conclusions

(1)
The Longmaxi shale specimens are characterized by a high content (88.49 wt %) of brittle minerals and low porosity (organic matter and pores account for about 2.66%), as tested by mineral composition analysis on a 300 μm × 300 μm region of a BSE image using AMICS. The mineral grains are highly compacted and are distributed in laminae. During uniaxial compression, the Longmaxi shale does not have any inelastic range on the stress-stain curve, showing typical brittle fracture characteristics. The UCS values of shale show great variation, ranging from 103.52 to 174.63 MPa, probably caused by the heterogeneity of structure and mineral composition at millimeter-scale.
(2)
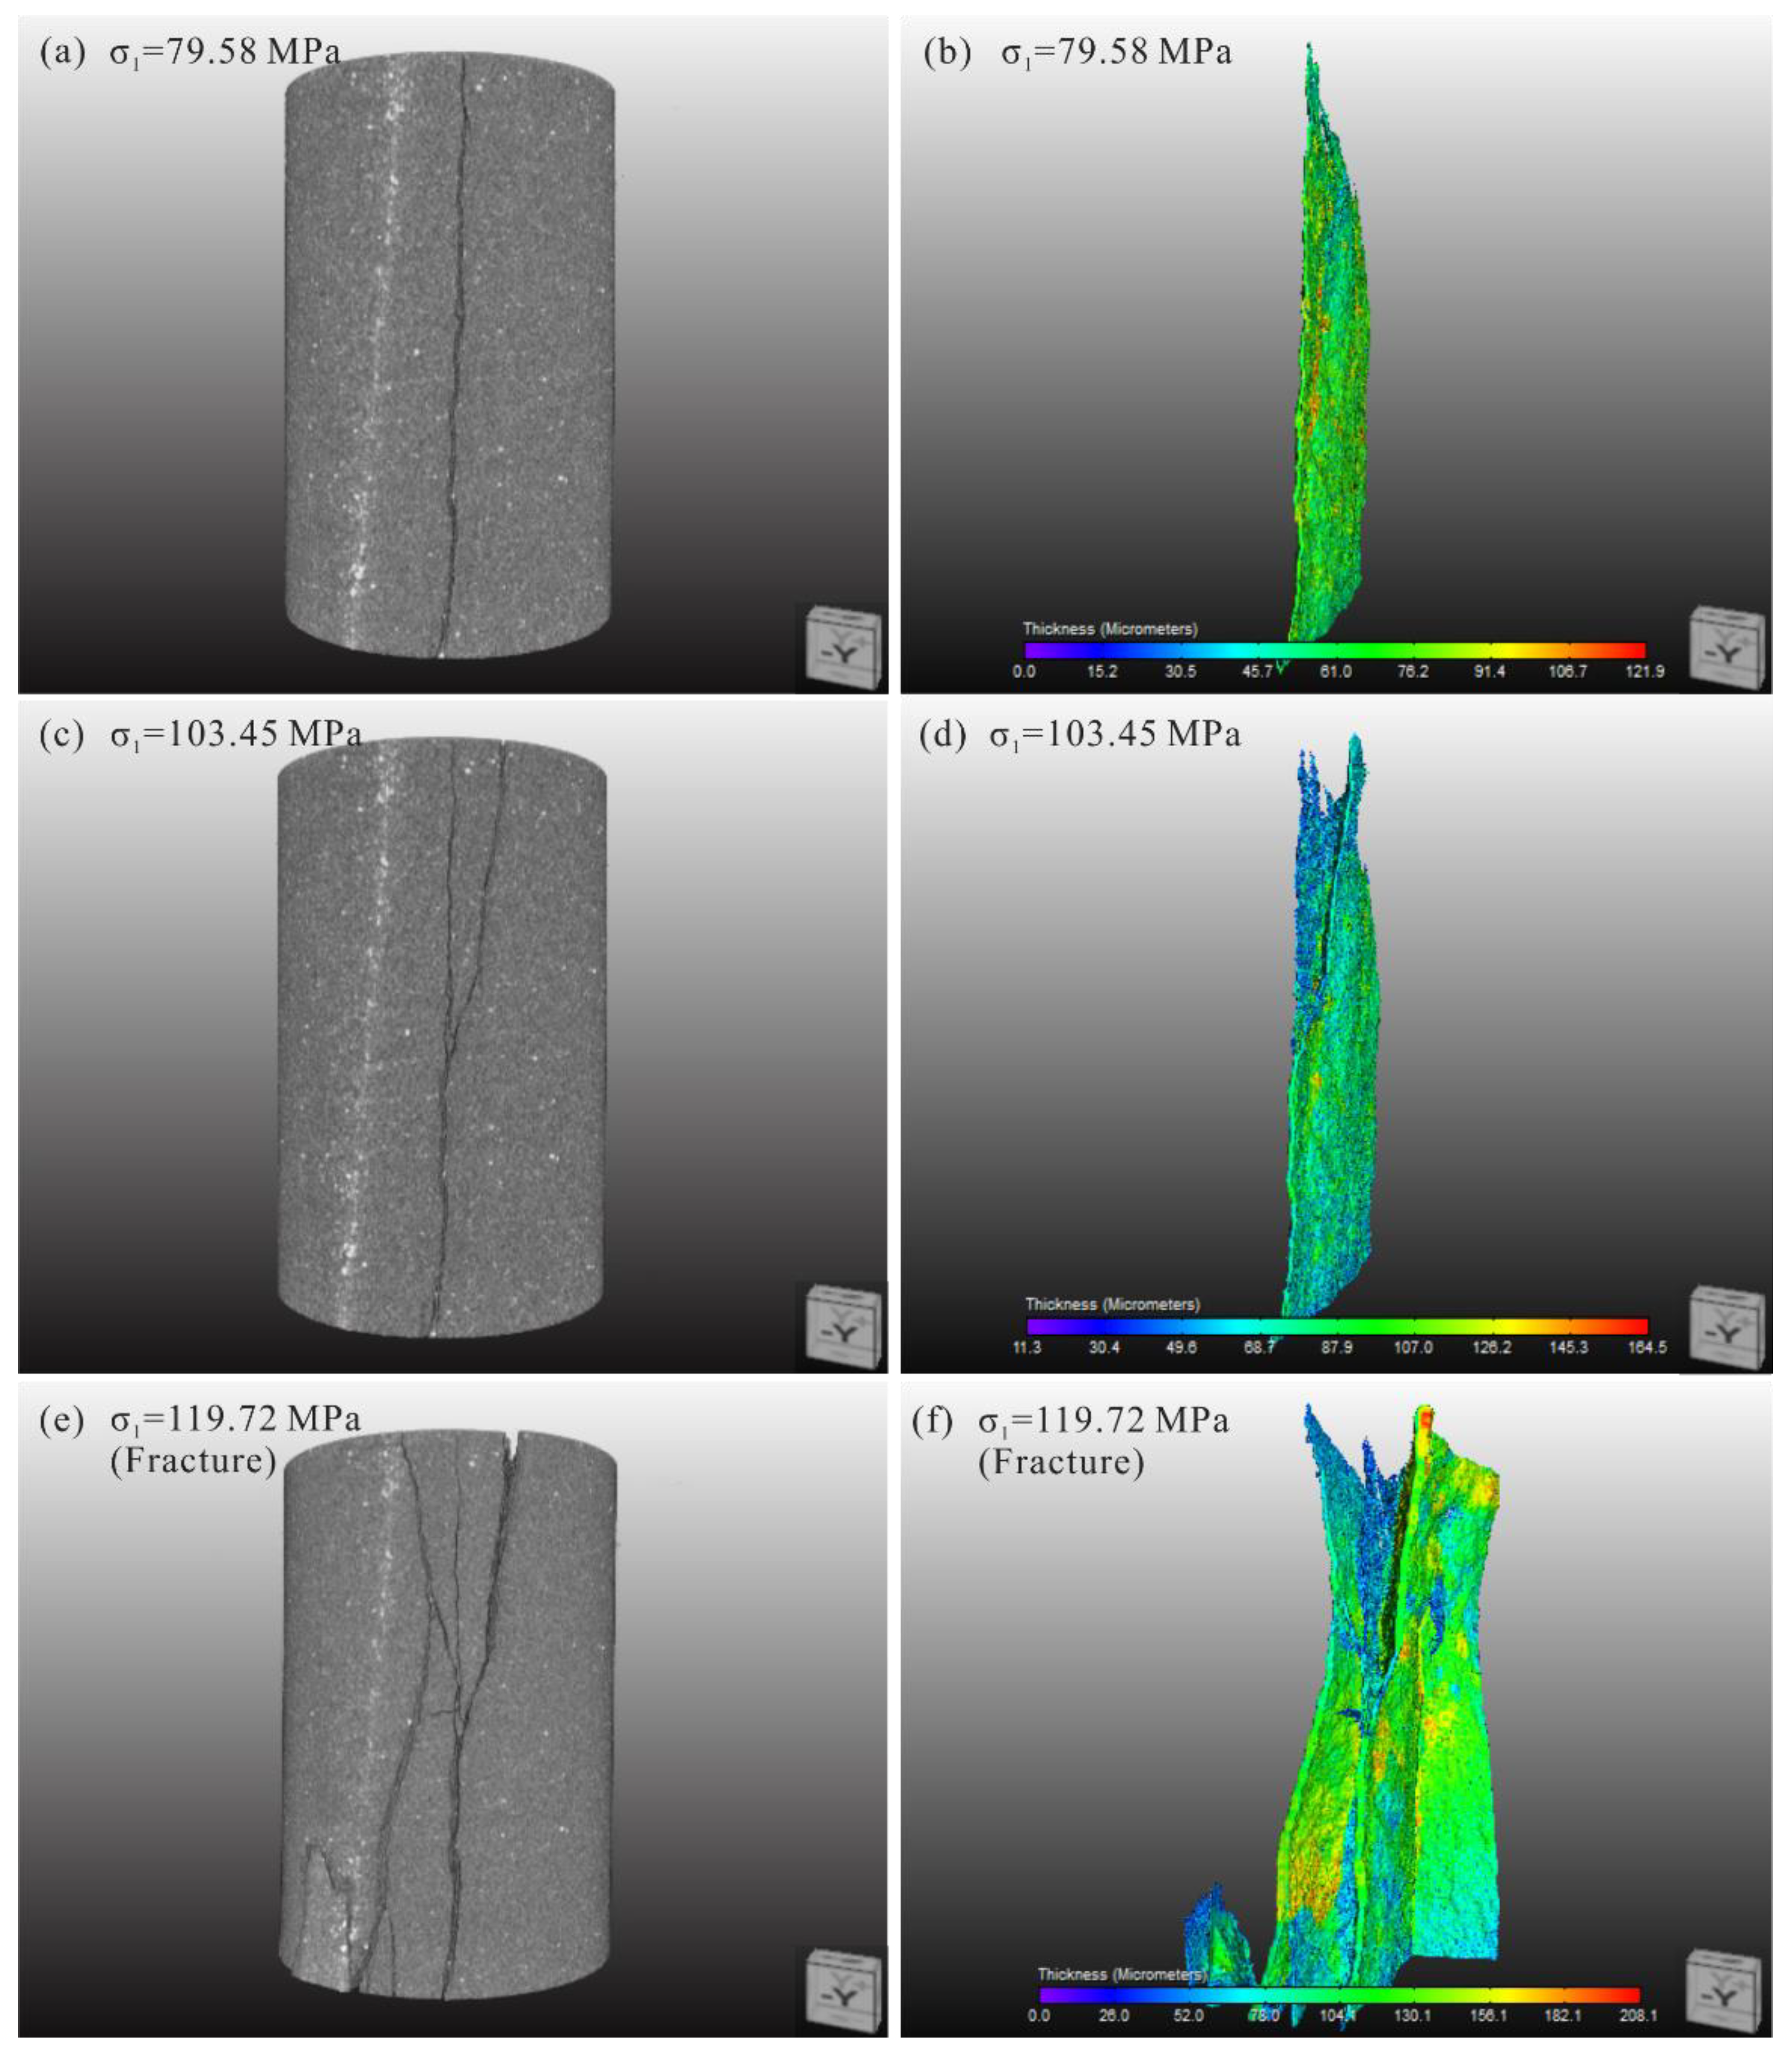
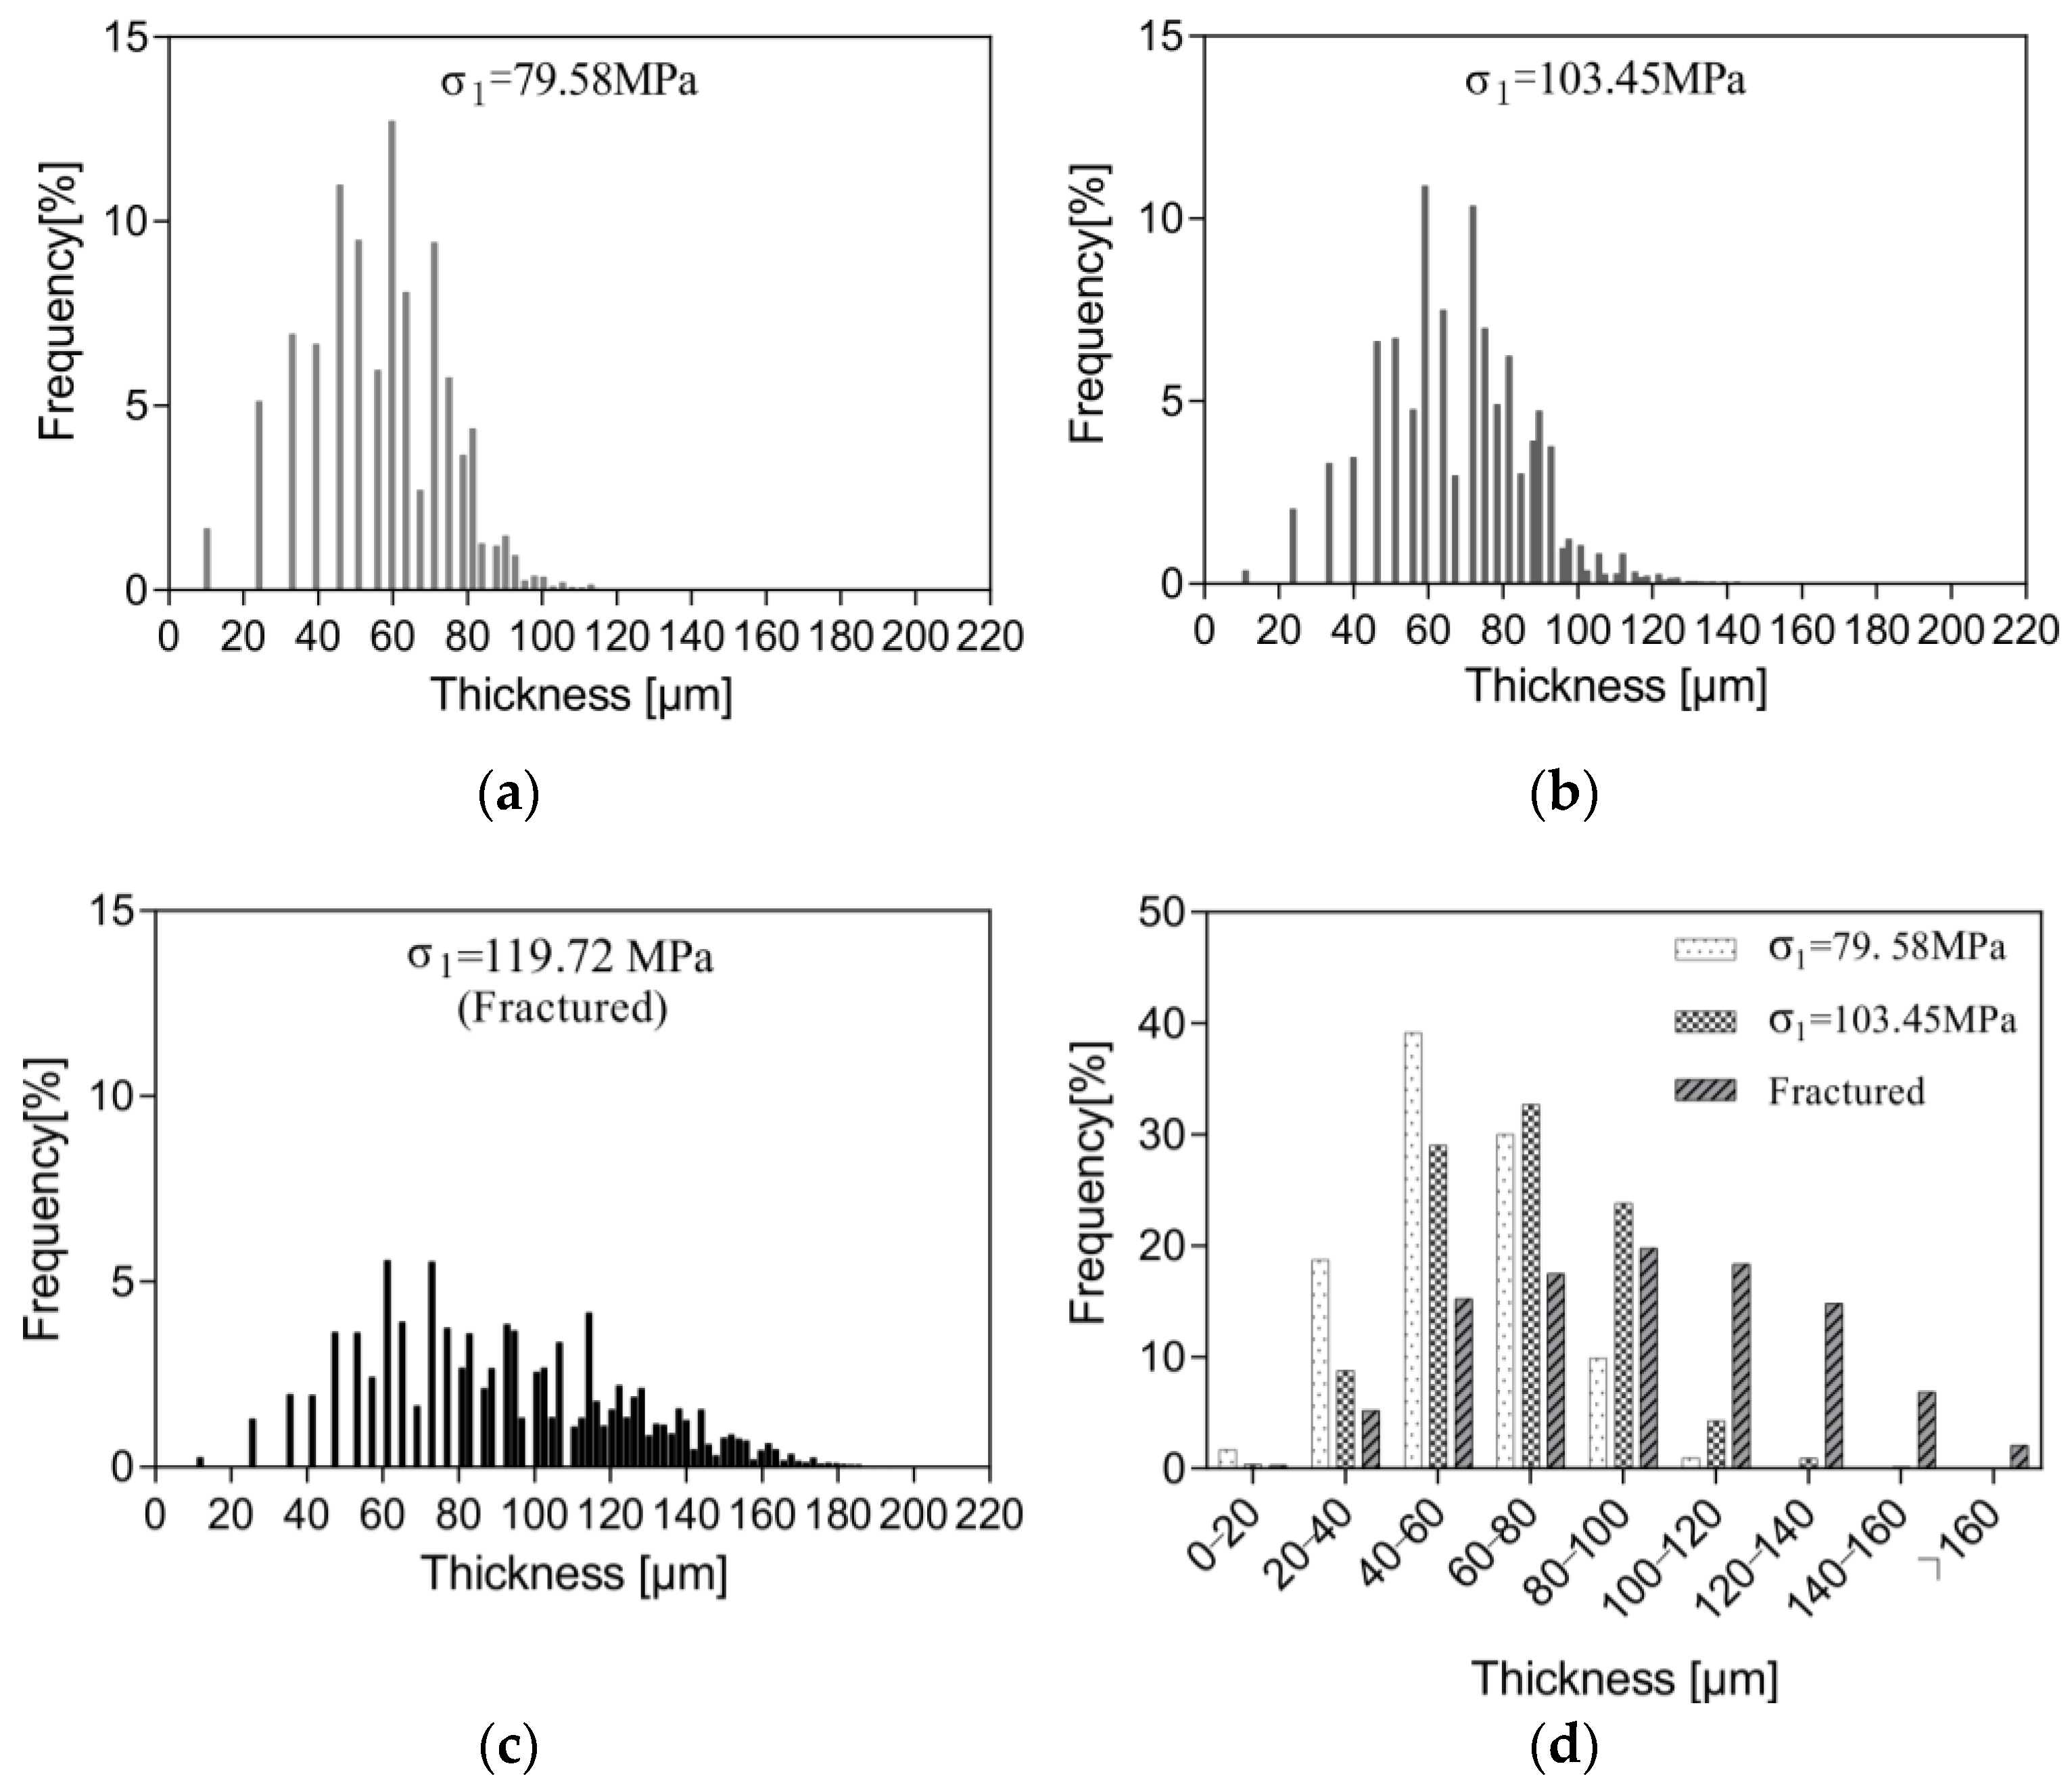
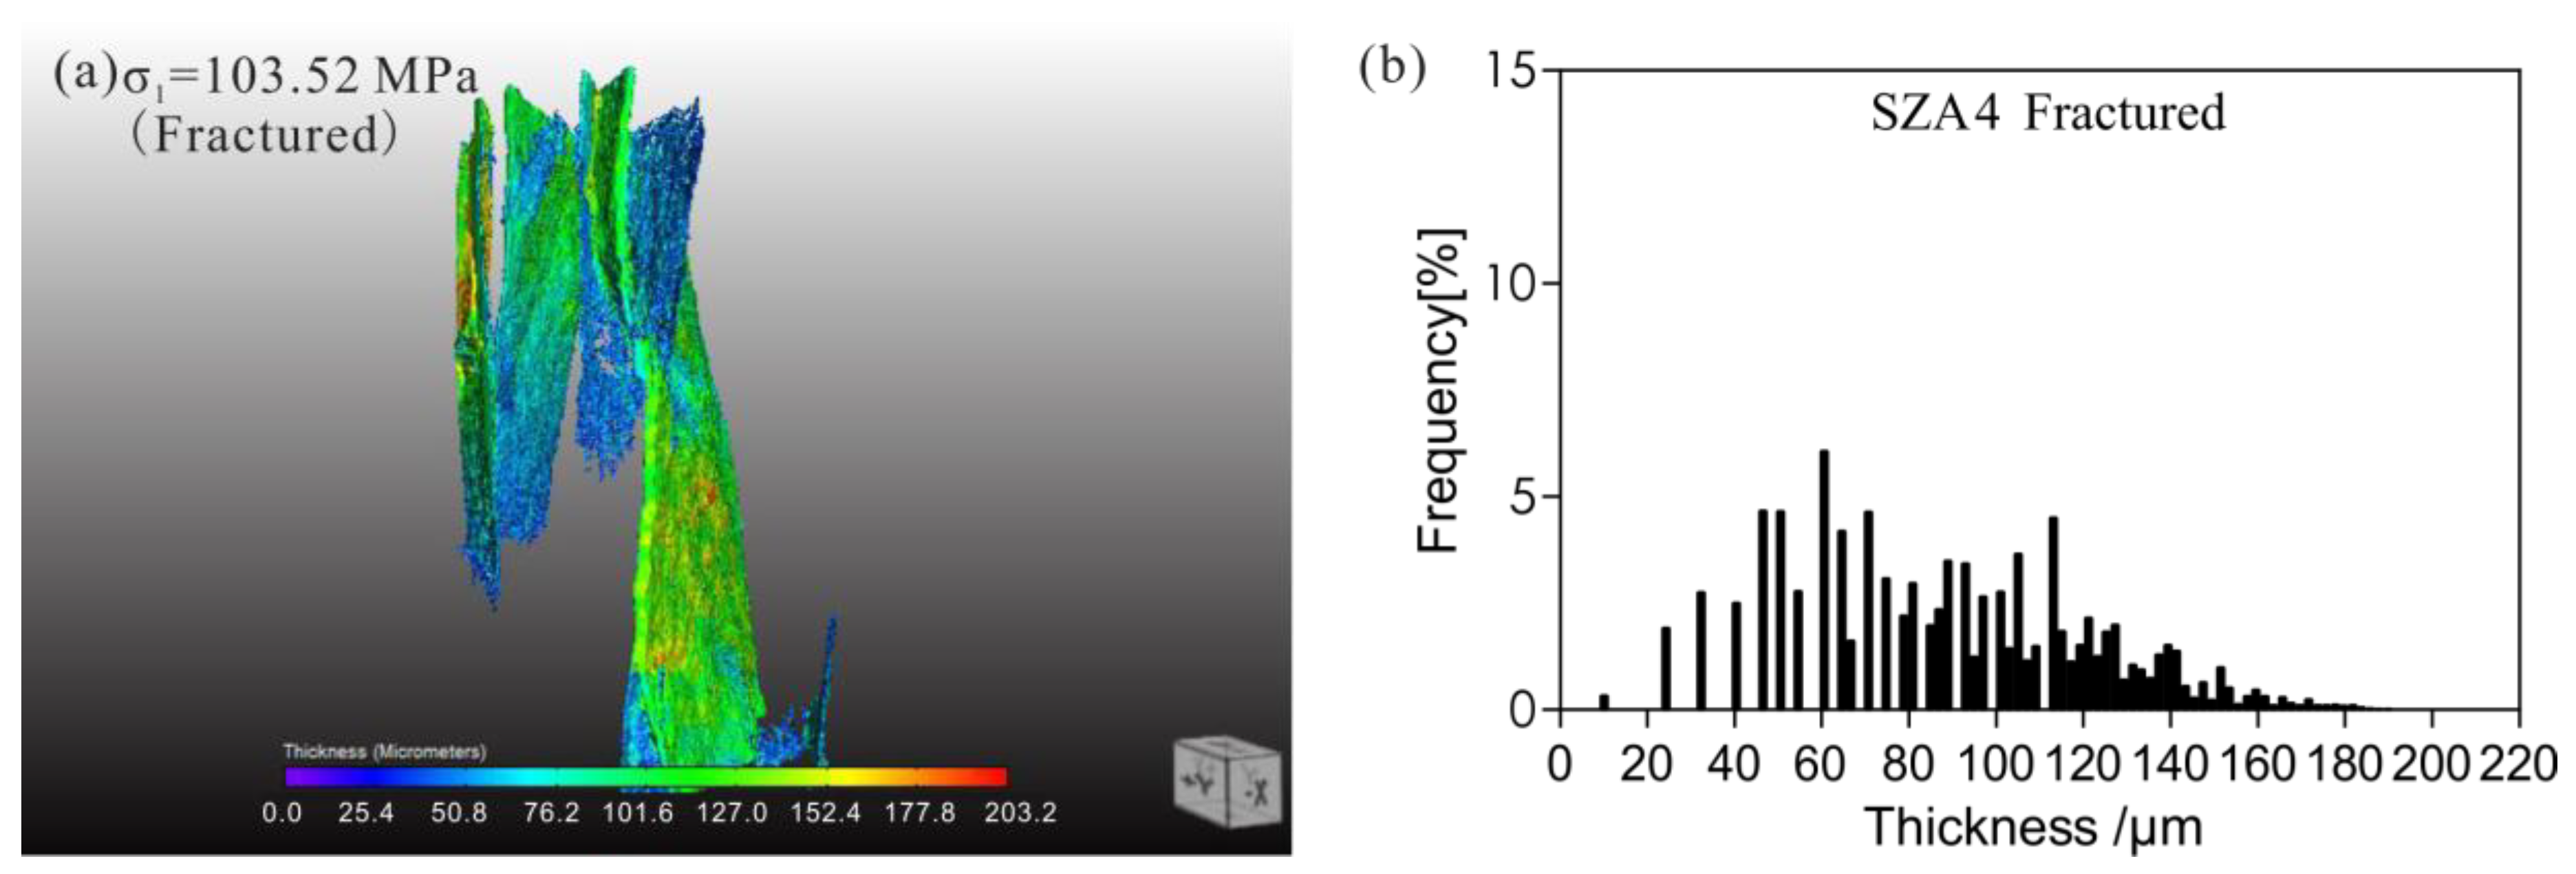
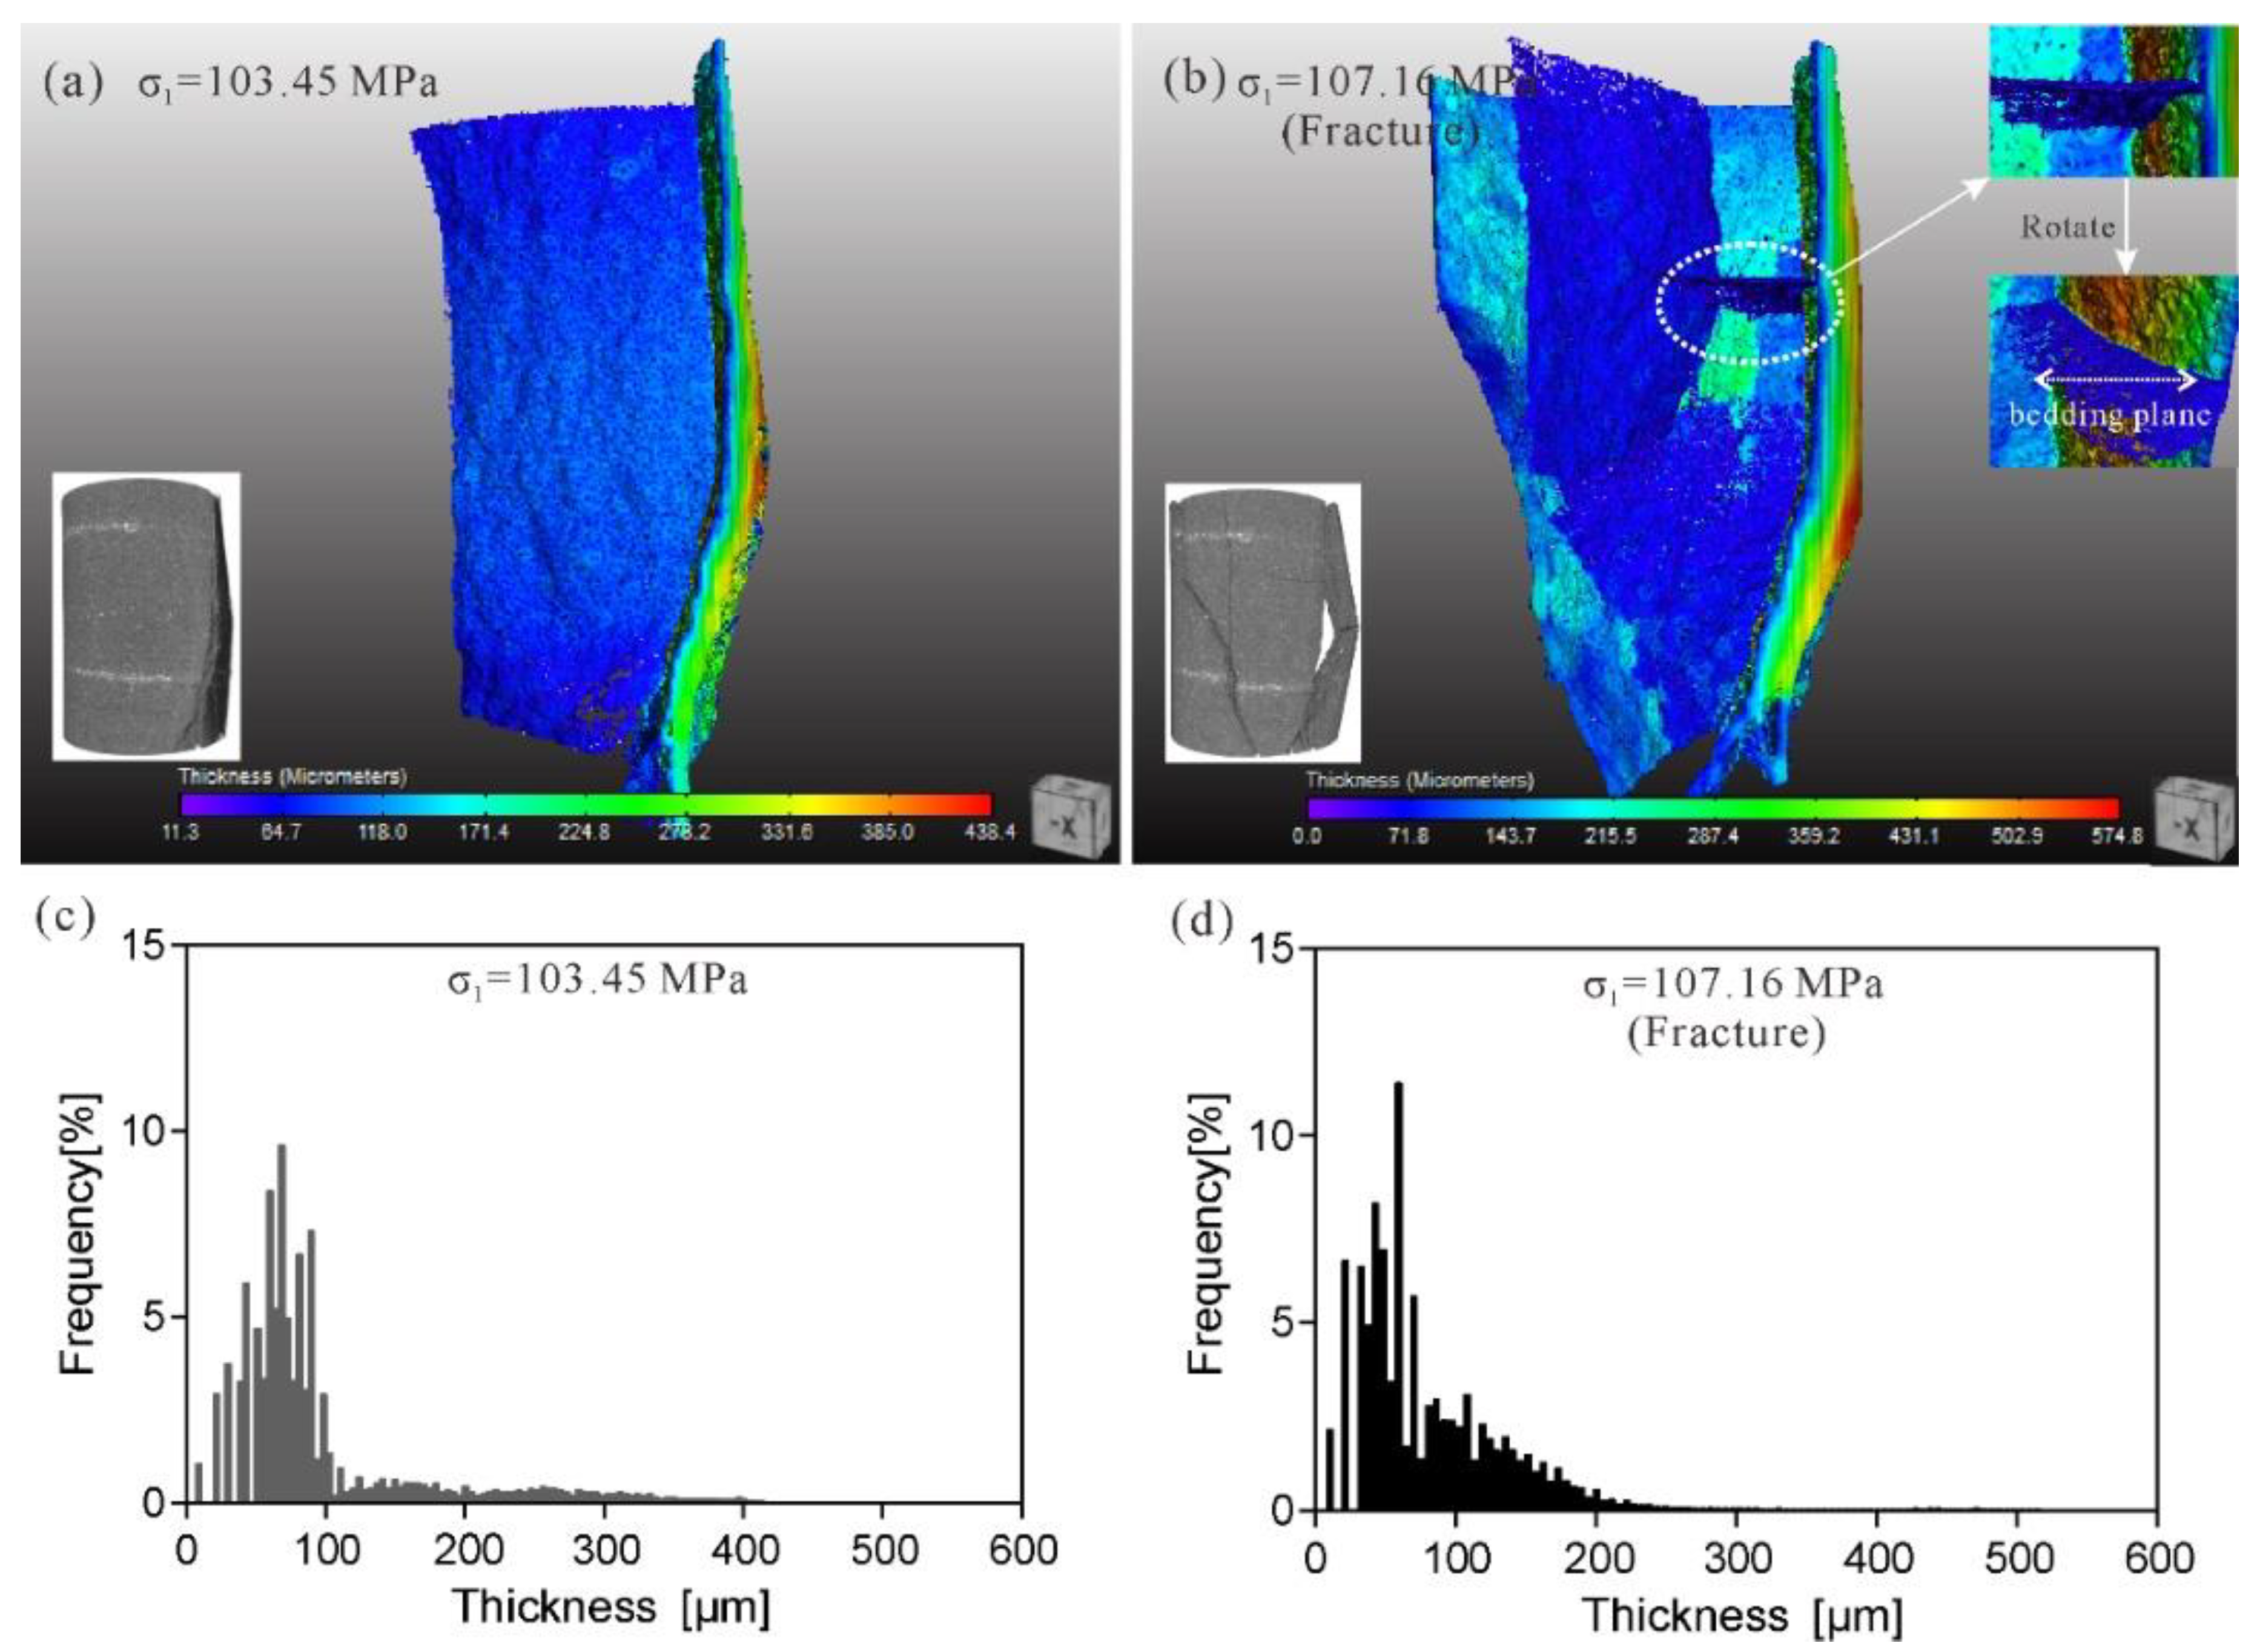
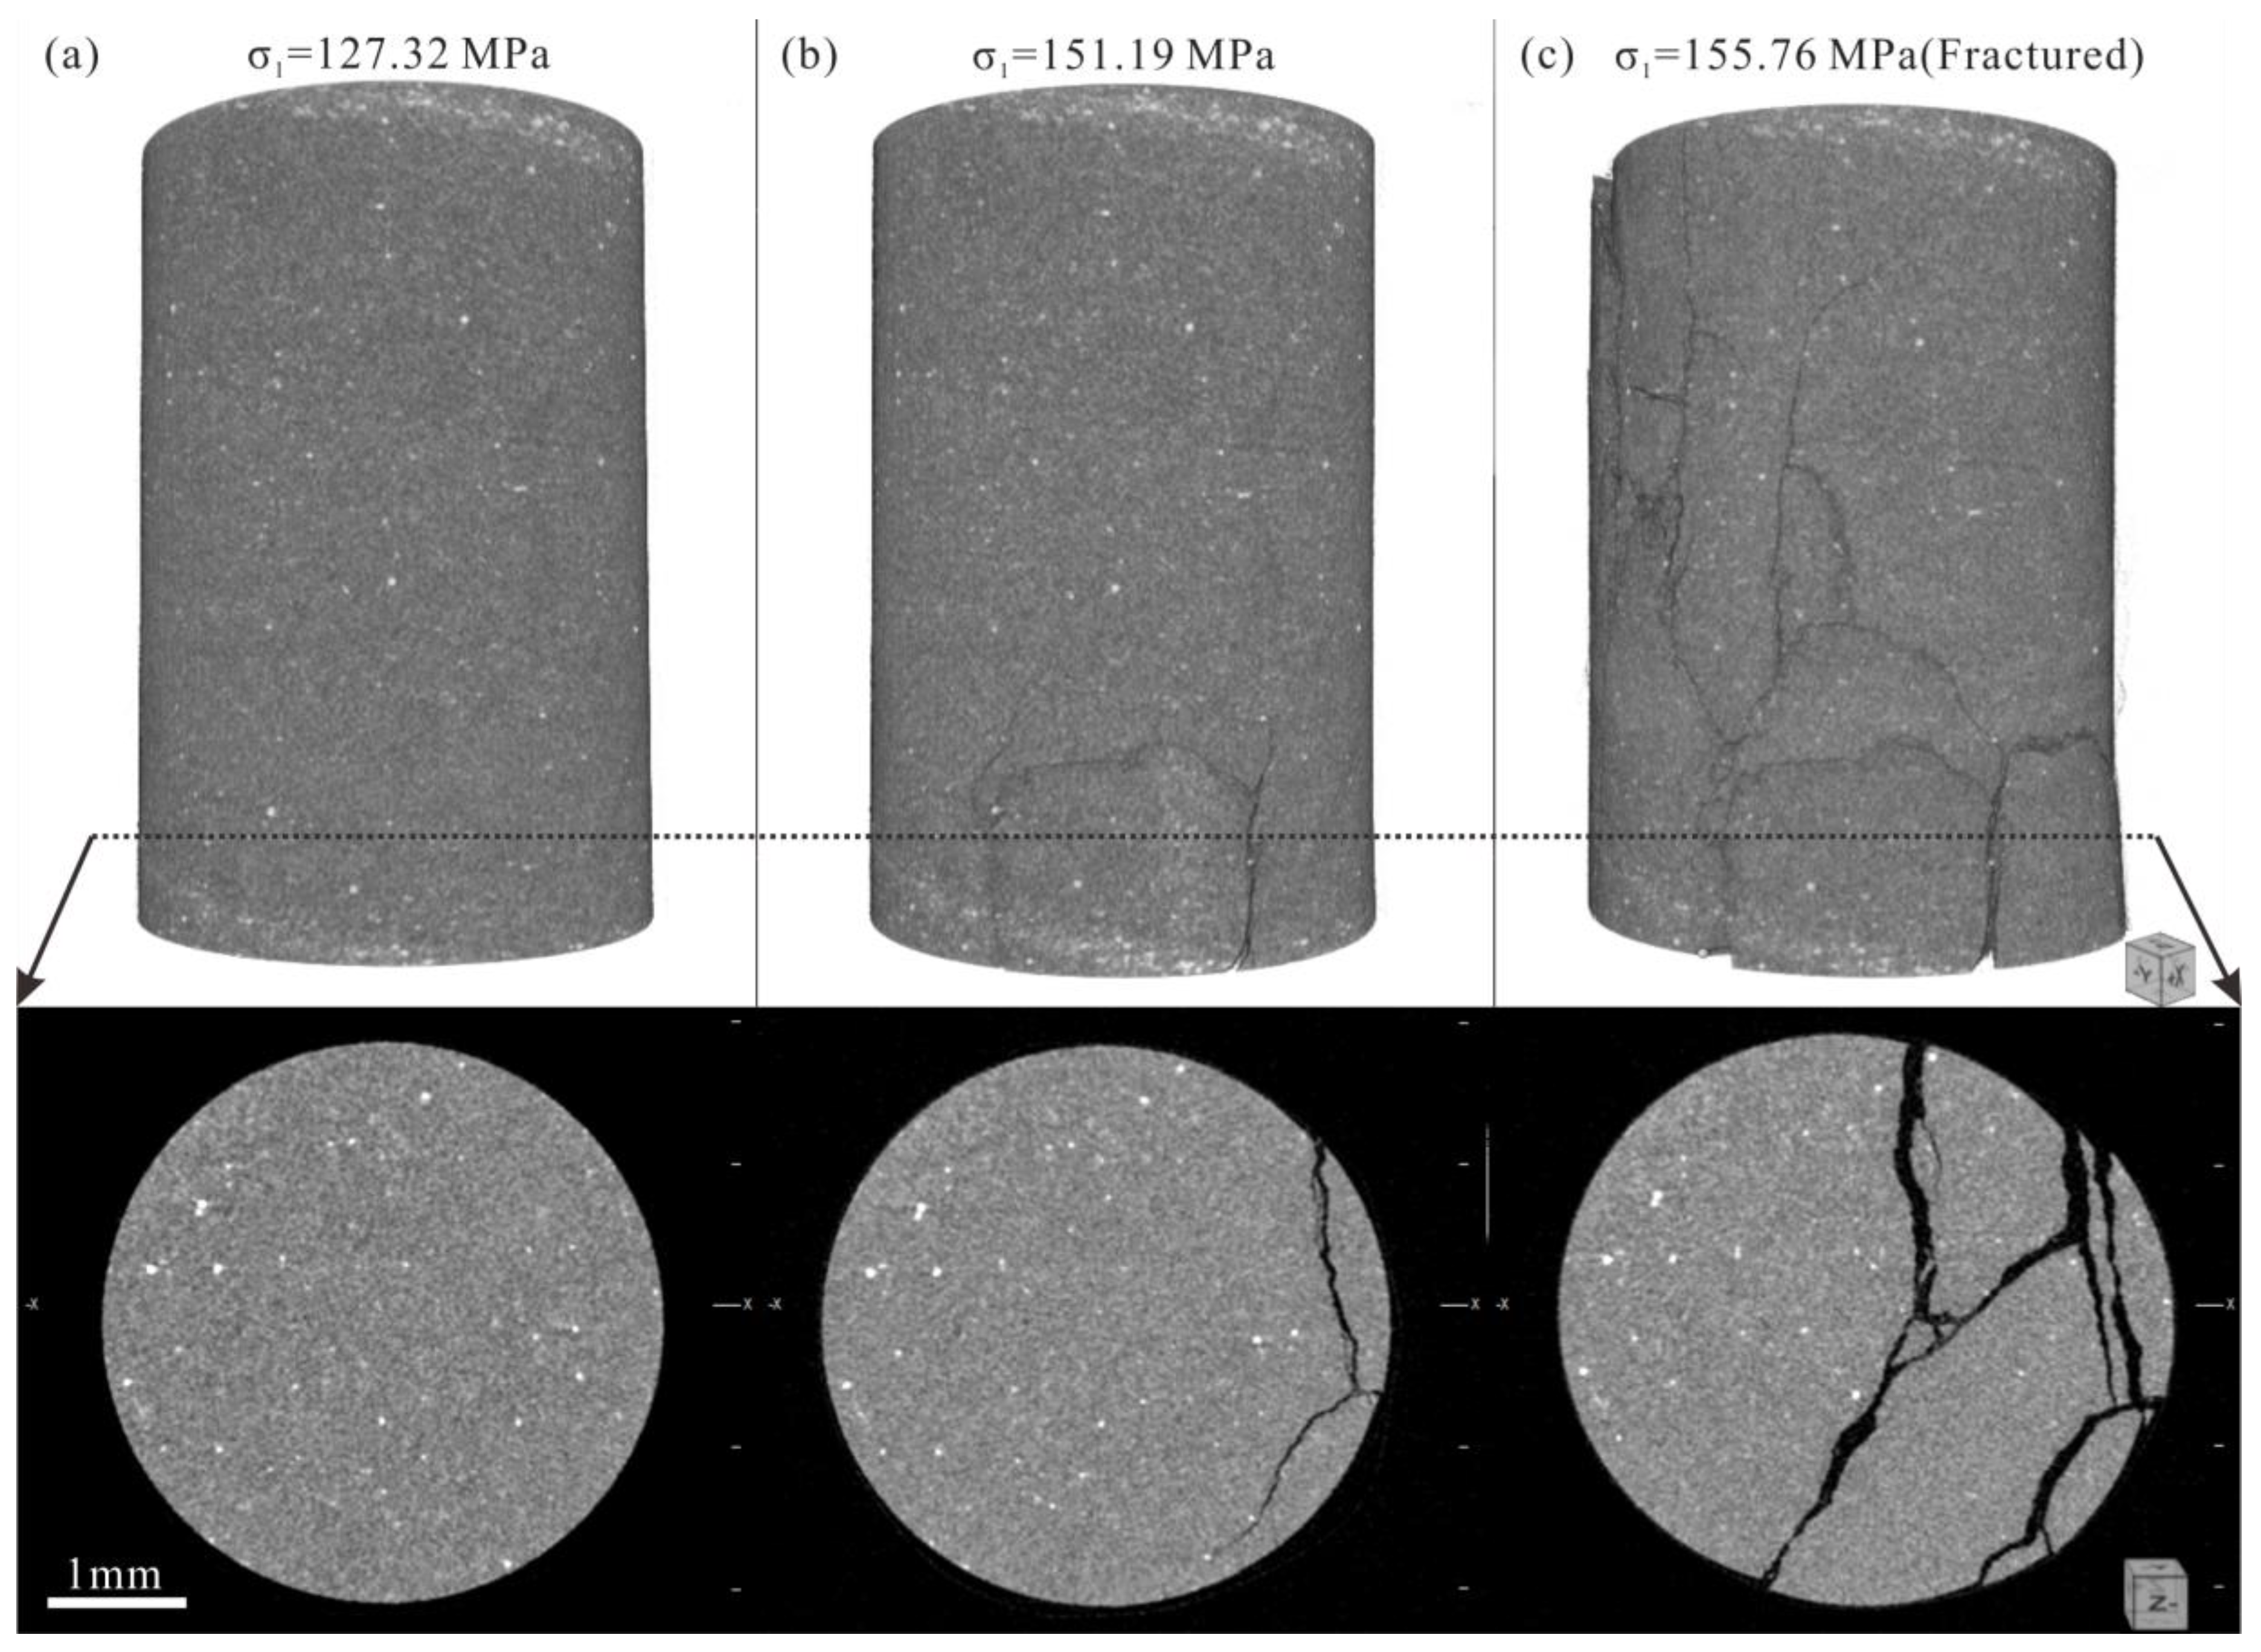
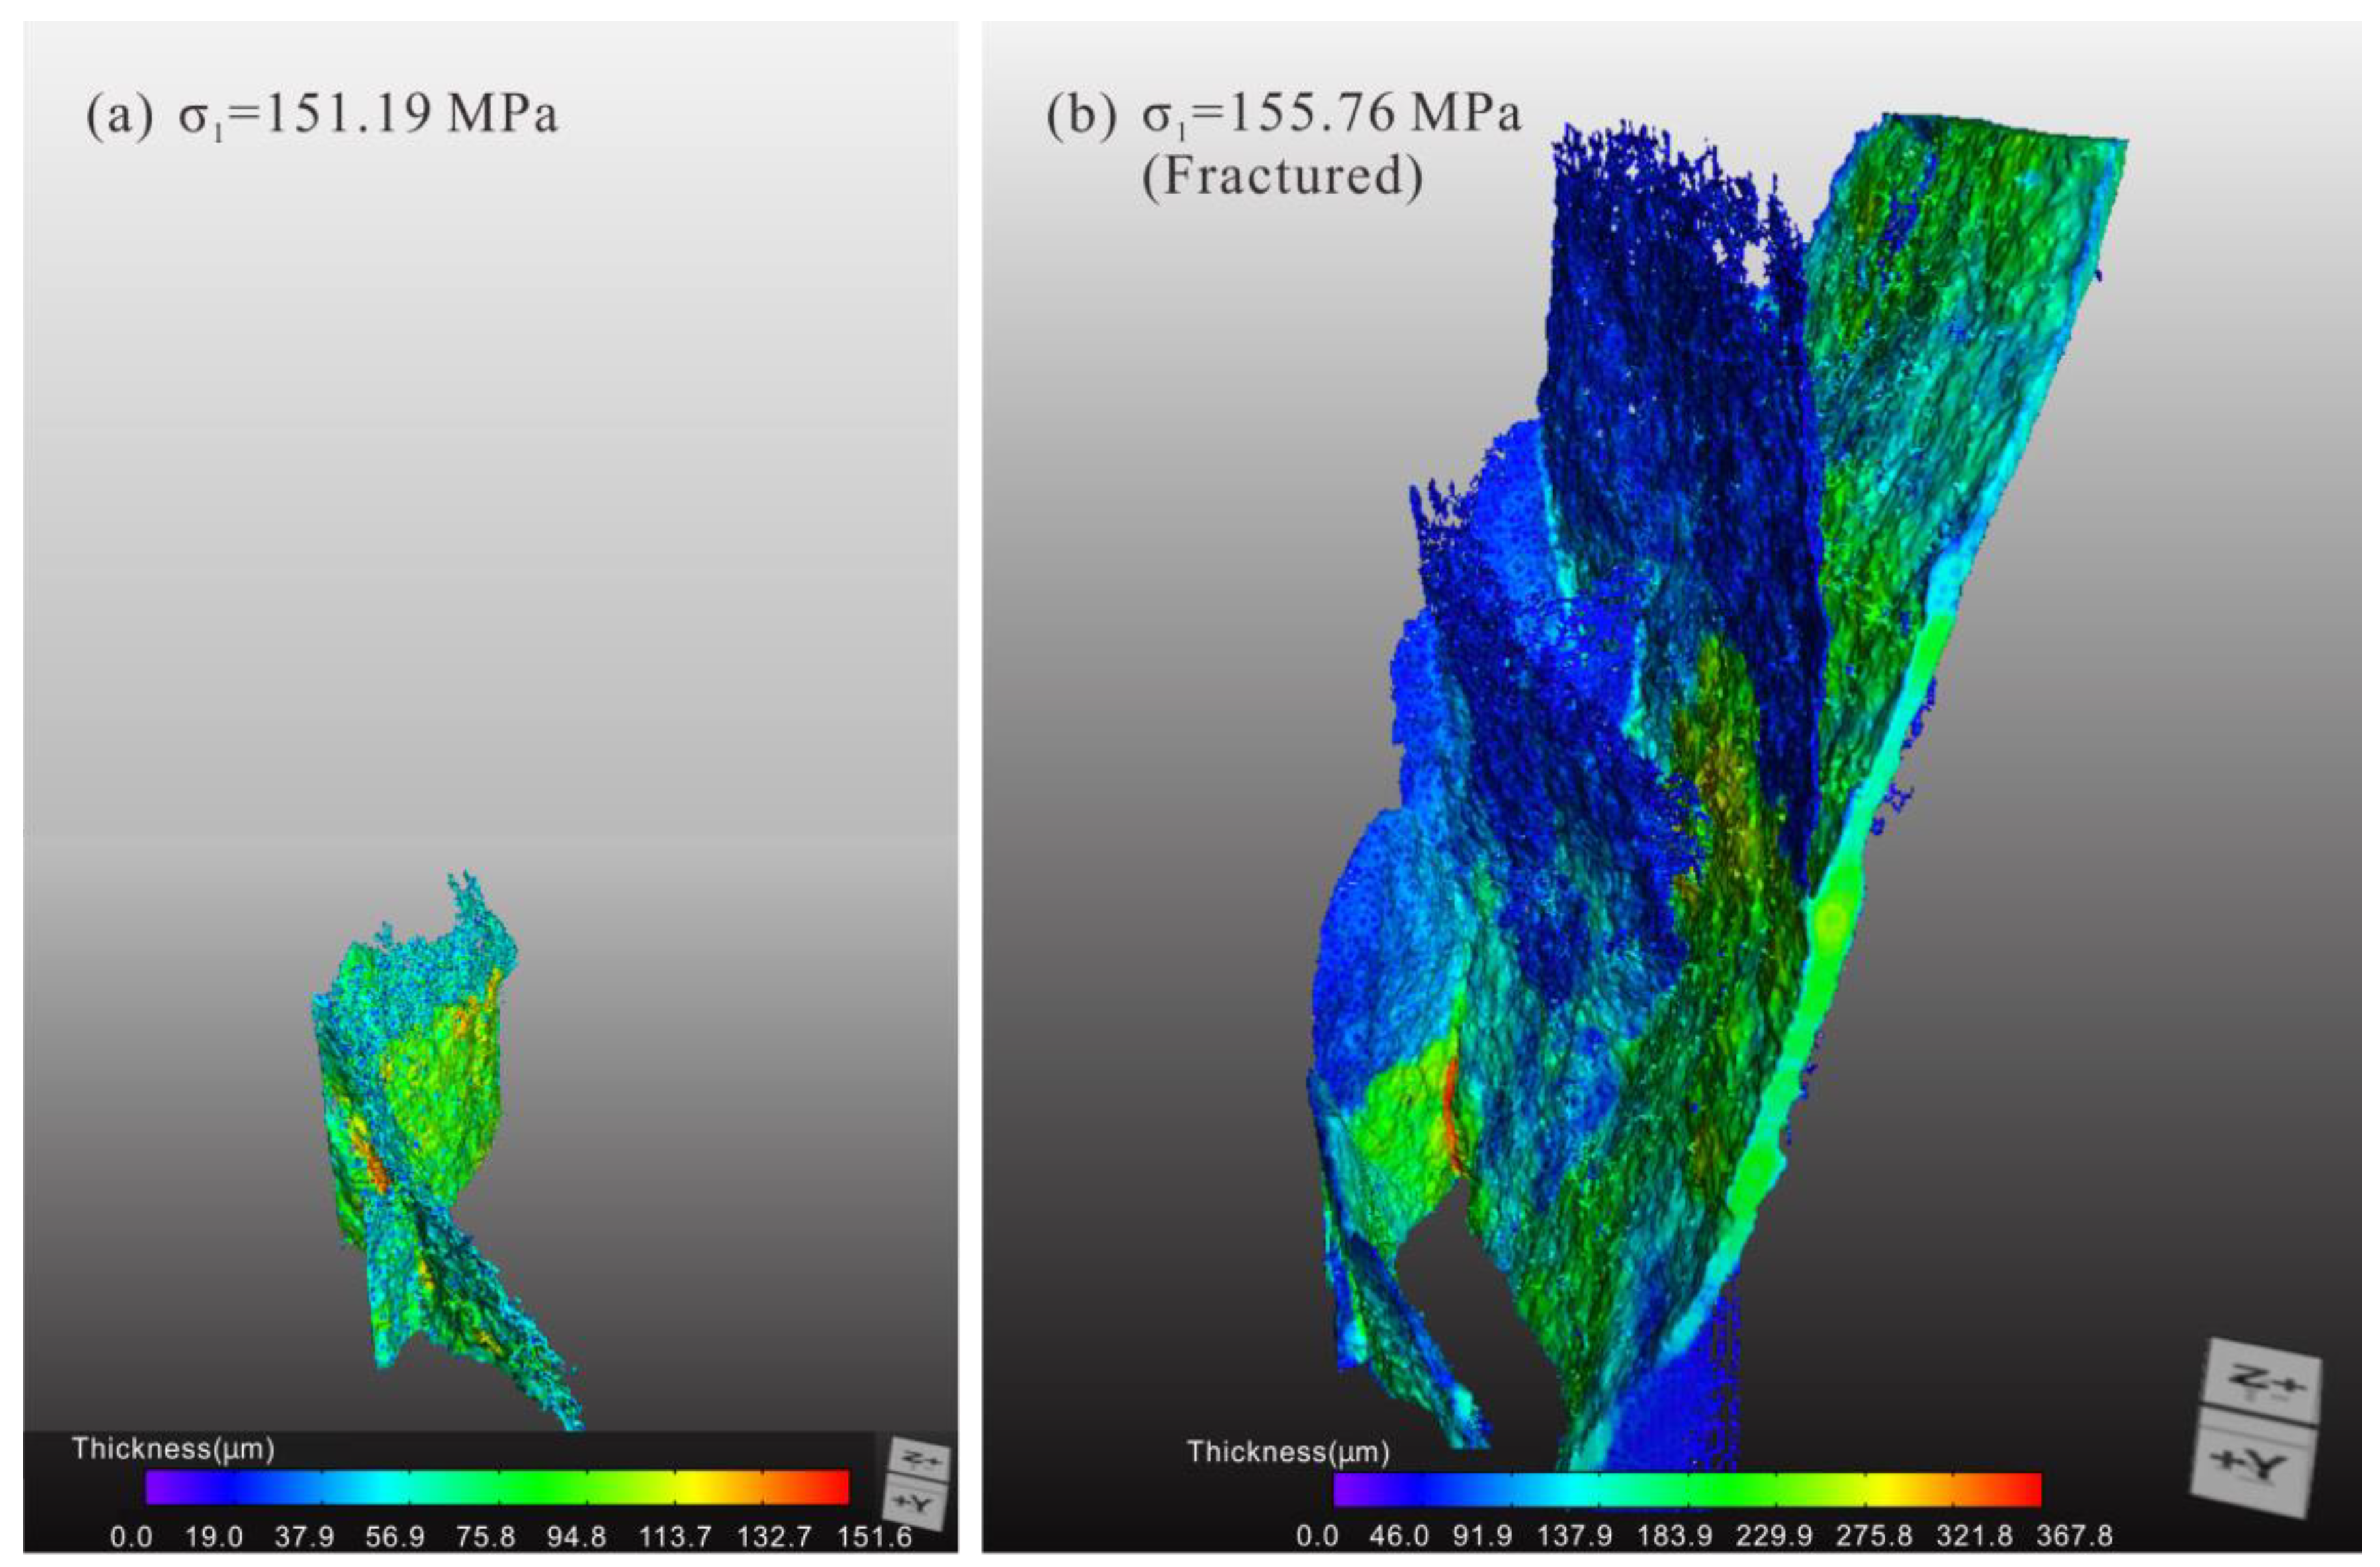
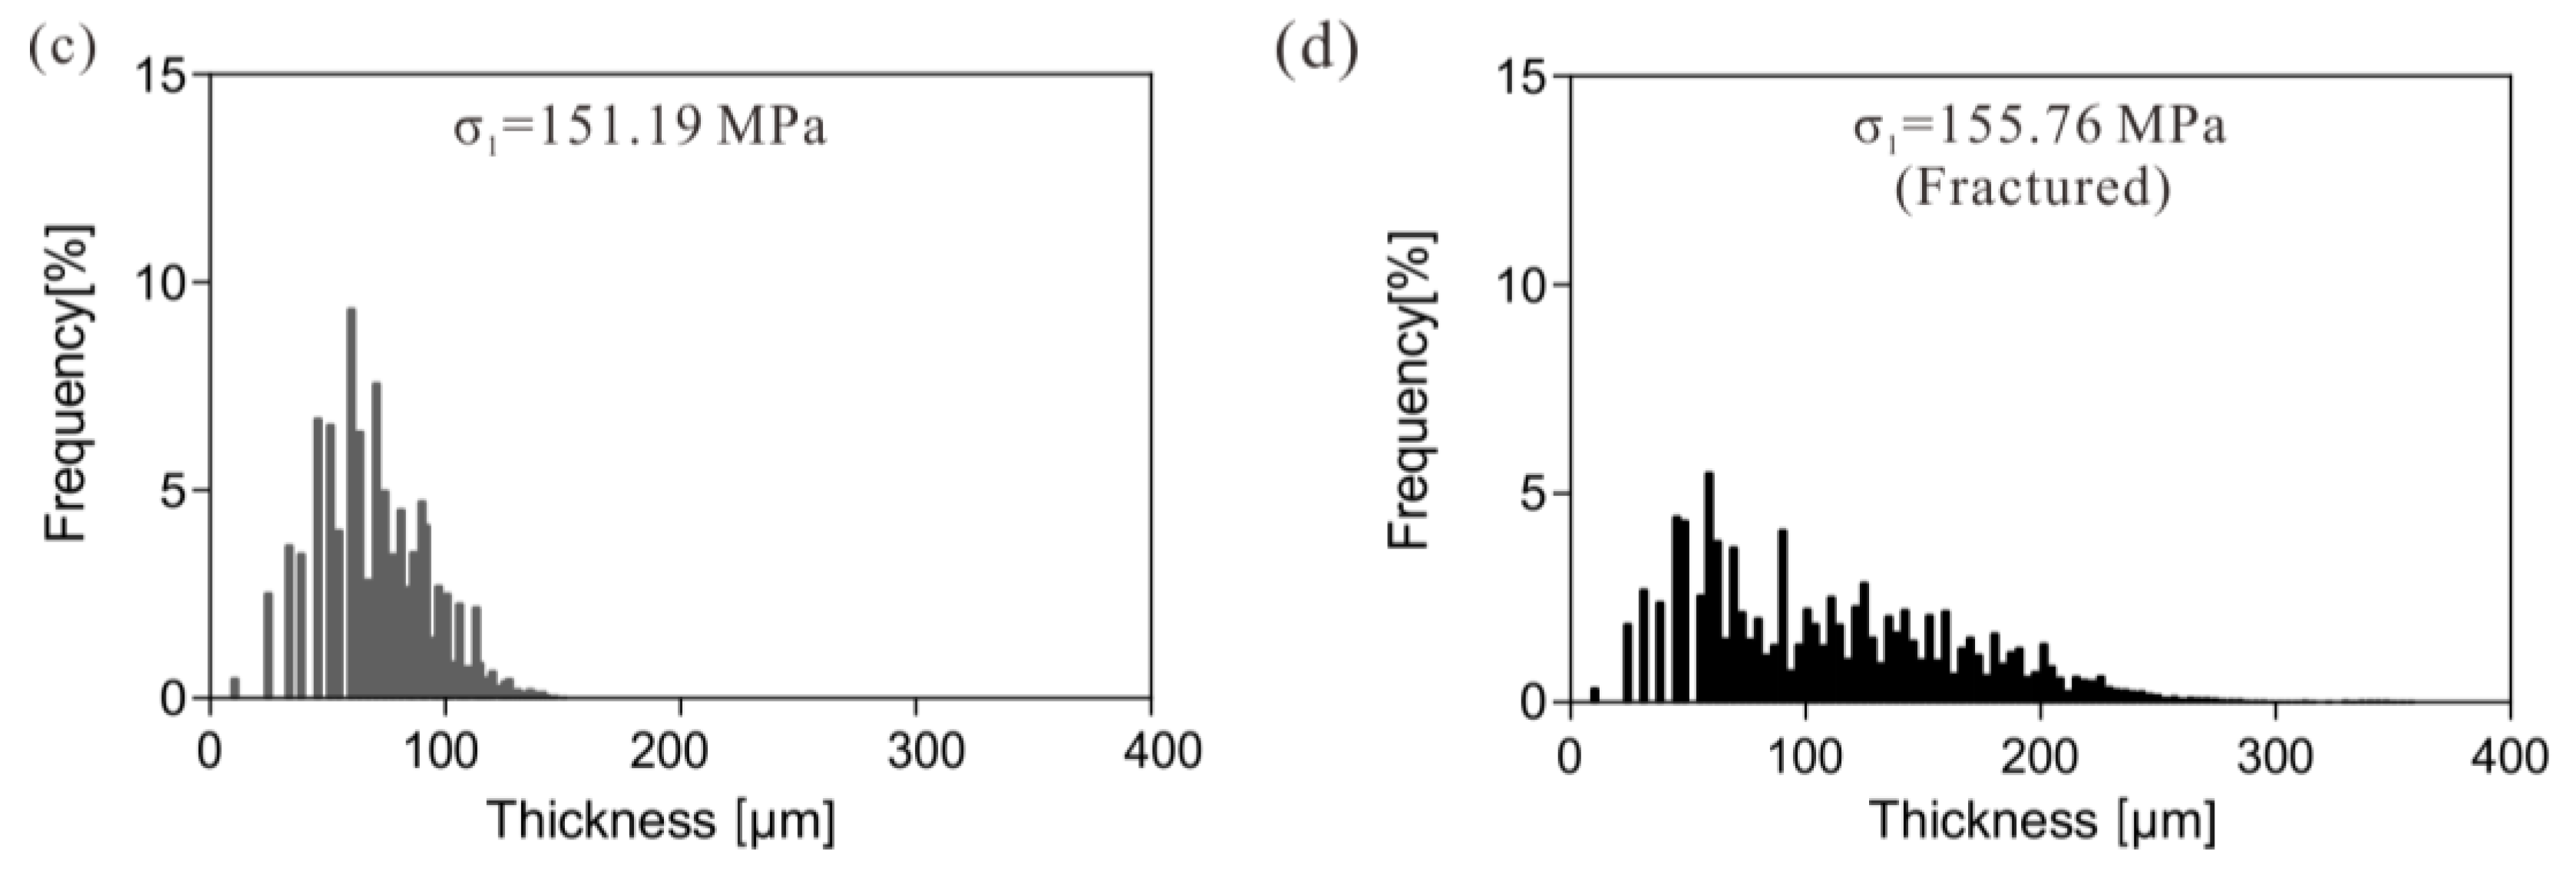
The micro-CT images during loading can reflect the evolution of the micro-/meso-cracks in the shale specimens. At 0° orientation, the fracture begins with a single crack, which then expands and bifurcates into many secondary cracks. As loading stress increases, more micro cracks develop and gradually connect to the primary crack or form new cracks, some of which cut through the specimen, mainly as tension cracks. In the specimens at 90° orientation, the first crack appears throughout the specimen, though not vertically. More cracks cross or join during the loading process as tension-shear cracks oriented at an angle of about 70° to the horizontal direction, with a few parallel cracks occurring along the weak consolidated bedding planes. The average thickness of cracks at 90° orientation is higher than that of 0°.
(3)
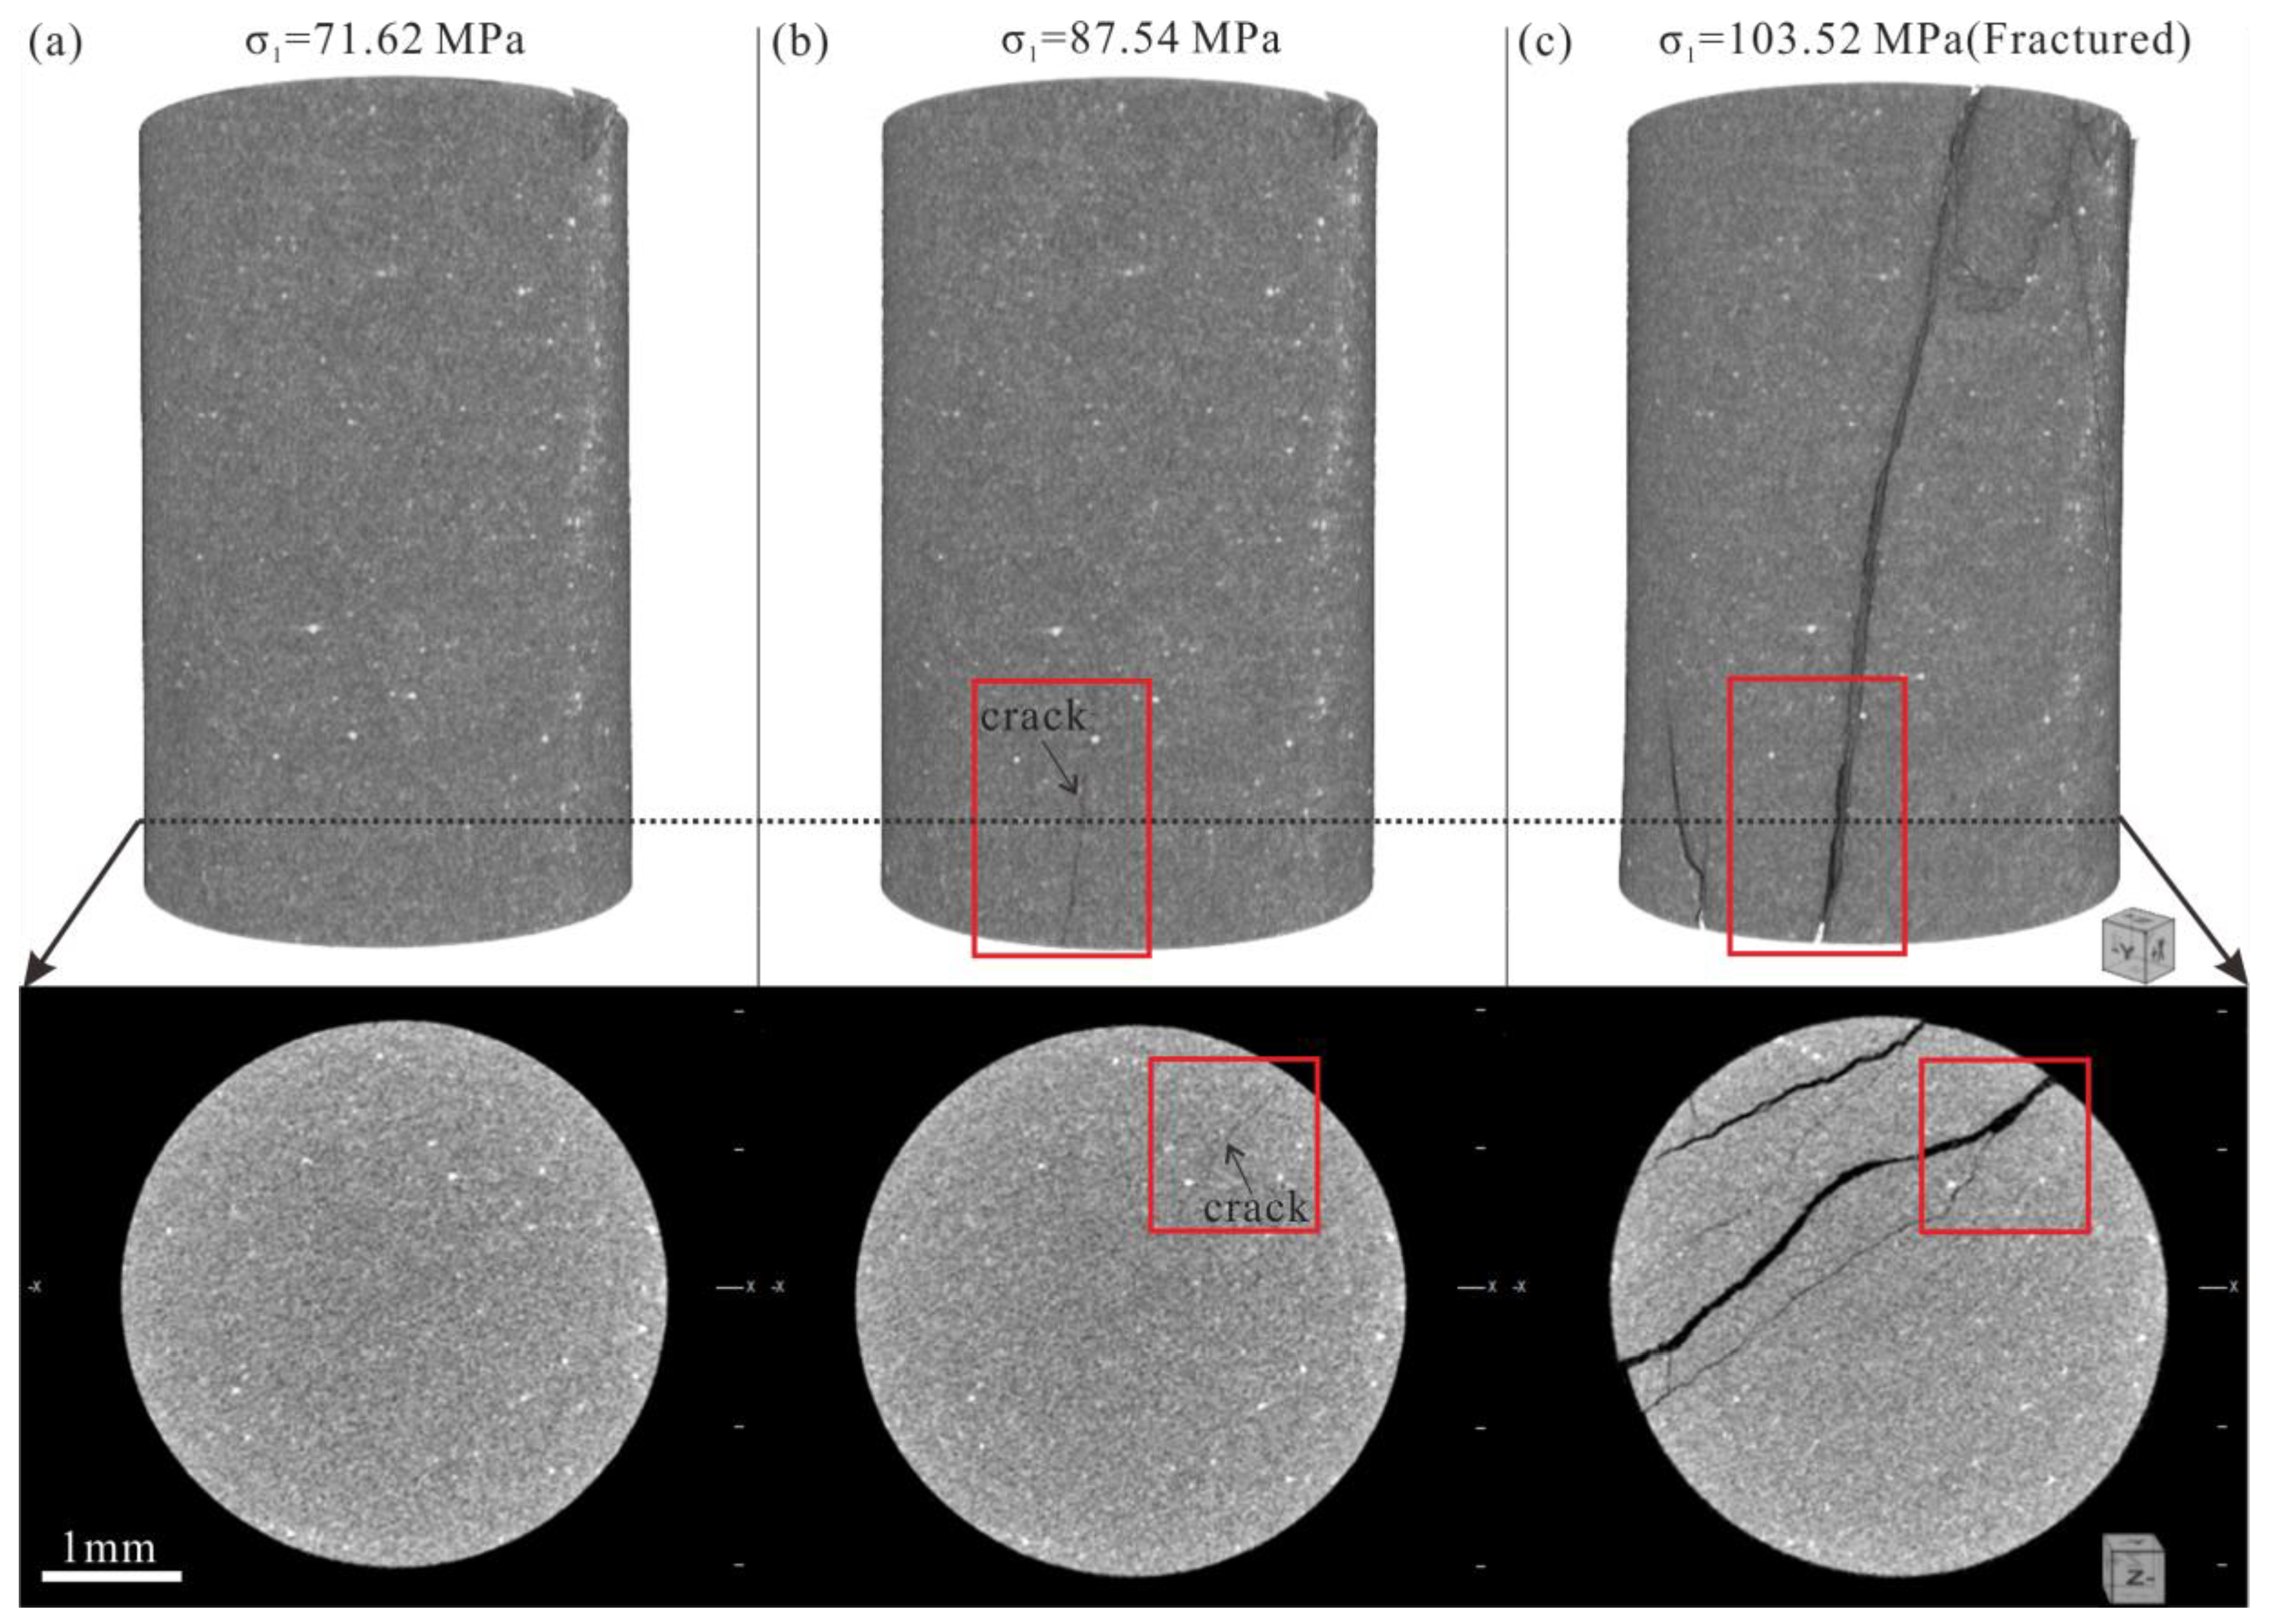
The loading force at which the initial crack occurred is dependent upon the orientation. The initial cracks at 90° orientation were observed to occur at higher loading forces, and later than that at 0° orientation, and most appeared close to peak strength.
(4)
The quantitative characterization of cracks was conducted on the segmented and binary CT scan images. The specific surface area per volume and tortuosity are positively correlated at different loading stages. The crack images from CT scan have obvious fractal characteristics. The 3-D BCD increased as crack propagation progressed, and can be used as a quantitative parameter of the crack evolution. Furthermore, the 3-D BCD for 0° bedding orientation is 2.44 and 2.38, lower than the 90° bedding orientations of 2.53 and 2.50. The results suggest that the cracks produced in the 90° bedding orientation specimen is more complex than that of 0° orientation, due to the crossed secondary cracks.

Author Contributions

Each author has made contribution to the present paper. M.Z. and Y.Z. conceived and designed the experiments; M.Z. processed the experimental data and completed the manuscript; R.Z. and J.H. performed the experiments. J.Y. provided general supervision and contributed to the review and proofreading of the manuscript. All authors have read and approved the final manuscript.

Acknowledgments

We thank Yuan Yuan, Zhongming Du, Guoliang Li and Shaoqing Tong (Key Laboratory of Shale Gas and Geoengineering, Institute of Geology and Geophysics, Chinese Academy of Sciences) for their assistance in the experiments. Liang Lü (Hebei Normal University) commented earlier version of this manuscript and gave a lot of constructive suggestions, for which we are very grateful. This study was co-sponsored by the Strategic Priority Research Program of the Chinese Academy of Sciences (Grant No. XDB10050100), Chinese National Science and Technology Major Project (Grant No. 2016ZX05034), Chinese National Natural Science Foundation (Grant No. 21661670) and The Recruitment Program of Global Experts.

Conflicts of Interest

The authors declare no conflict of interest.

References

  1. Rine, J.M.; Smart, E.; Dorsey, W.; Hooghan, K.; Dixon, M. Comparison of porosity distribution within selected North American shale units by SEM examination of Argon-ion-milled specimens. AAPG Mem. 2013, 102, 137–152. [Google Scholar]
  2. Yaritani, H.; Matsushima, J. Analysis of the energy balance of shale gas development. Energies 2014, 7, 2207–2227. [Google Scholar] [CrossRef]
  3. Aruga, K. The U.S. shale gas revolution and its effect on international gas markets. J. Unconv. Oil Gas Res. 2016, 14, 1–5. [Google Scholar] [CrossRef]
  4. Yang, Q.; Carlos, T.V. Joint interpretation and uncertainty analysis of petrophysical properties in unconventional shale reservoir. Interpretation 2014, 3, 33–49. [Google Scholar] [CrossRef]
  5. Wu, Y.; Li, X.; He, J.; Zheng, B.; Sciubba, E. Mechanical properties of Longmaxi black organic-rich shale samples from South China under uniaxial and triaxial compression states. Energies 2016, 9, 1088. [Google Scholar] [CrossRef]
  6. Cho, J.W.; Kim, H.; Jeon, S.; Min, K.B. Deformation and strength anisotropy of Asan gneiss, Boryeong shale, and Yeoncheon schist. Int. J. Rock Mech. Min. Sci. 2012, 50, 158–169. [Google Scholar] [CrossRef]
  7. Geng, Z.; Chen, M.; Yan, J.; Yang, S.; Yi, Z.C.; Fang, X.; Du, X.Y. Experimental study of brittleness anisotropy of shale in triaxial compression. J. Nat. Gas Sci. Eng. 2016, 36, 510–518. [Google Scholar] [CrossRef]
  8. He, S.; Wang, W.; Shen, H.; Tang, M.; Liang, H.J.; Lu, J.A. Factors influencing wellbore stability during underbalanced drilling of horizontal well: When fluid seepage is considered. J. Nat. Gas Sci. Eng. 2015, 23, 80–89. [Google Scholar] [CrossRef]
  9. Amann, F.; Kaiser, P.; Button, E.A. Experimental study of brittle behavior of clay shale in rapid triaxial compression. Rock Mech. Rock Eng. 2012, 45, 21–33. [Google Scholar] [CrossRef]
  10. Hanna, K.; Insun, S.; Ki-Bok, M. Anisotropy of elastic moduli, P-wave velocities, and thermal conductivities of Asan gneiss, Boryeong shale, and Yeoncheon schist in Korea. Eng. Geol. 2012, 147, 68–77. [Google Scholar]
  11. Kuila, U.; Dewhurst, D.N.; Siggins, A.F.; Raven, M.D. Stress anisotropy and velocity anisotropy in low porosity shale. Tectonophysics 2011, 503, 34–44. [Google Scholar] [CrossRef]
  12. Xue, L.; Qin, S.Q.; Sun, Q.; Wang, Y.Y.; Qian, H.T. A quantitative criterion to describe the deformation process of rock specimen subjected to uniaxial compression: From criticality to final failure. Physica A 2014, 410, 470–482. [Google Scholar] [CrossRef]
  13. Yan, C.L.; Deng, J.G.; Hu, L.B.; Chen, Z.J.; Yan, X.J.; Lin, H.; Tan, Q.; Yu, B.H. Brittle failure of shale under uniaxial compression. Arab. J. Geosci. 2015, 8, 2467–2475. [Google Scholar]
  14. Hou, P.; Gao, F.; Yang, Y.G.; Zhang, X.X.; Zhang, Z.Z. Effect of the layer orientation on mechanics and energy evolution characteristics of shales under uniaxial loading. Int. J. Min. Sci. Technol. 2016, 26, 857–862. [Google Scholar] [CrossRef]
  15. Janeiro, R.P.; Einstein, H.H. Experimental study of the cracking behavior of specimens containing inclusions (under uniaxial compression). Int. J. Fract. 2010, 164, 83–102. [Google Scholar] [CrossRef]
  16. Kong, B.; Wang, E.Y.; Li, Z.H.; Wang, X.R.; Liu, X.F.; Nan, L.; Yang, T.L. Electromagnetic radiation characteristics and mechanical properties of deformed and fractured sandstone after high temperature treatment. Eng. Geol. 2016, 209, 82–92. [Google Scholar] [CrossRef]
  17. Safari, R.; Ghassemi, A. 3-D thermo-poroelastic analysis of fracture network deformation and induced micro-seismicity in enhanced geothermal systems. Geothermics 2015, 58, 1–14. [Google Scholar] [CrossRef]
  18. Wu, L.X.; Geng, N.G.; Wang, J.H.; Cui, C.Y. Remote sensing rock mechanics (RSRM) and associated experimental studies. Int. J. Rock Mech. Min. Sci. 2000, 37, 879–888. [Google Scholar] [CrossRef]
  19. Wu, Z.H.; Zuo, Y.J.; Wang, S.Y. Numerical simulation and fractal analysis of mesoscopic scale failurein shale using digital images. J. Petrol. Sci. Eng. 2016, 145, 592–599. [Google Scholar] [CrossRef]
  20. Xie, H.P.; Liu, J.F.; Ju, Y.; Li, J.; Xie, L.Z. Fractal property of spatial distribution of acoustic emissions during the failure process of bedded rock salt. Int. J. Rock Mech. Min. Sci. 2011, 48, 1344–1351. [Google Scholar] [CrossRef]
  21. Zhang, X.; Lu, Y.; Tang, J.; Zhou, Z.; Liao, Y. Experimental study on fracture initiation and propagation in shale using supercritical carbon dioxide fracturing. Fuel 2017, 190, 370–378. [Google Scholar] [CrossRef]
  22. Ge, X.R.; Ren, J.X. Real-in time CT test of the rock meso-damage propagation law. Sci. China (Ser. E) 2000, 1, 104–111. [Google Scholar] [CrossRef]
  23. Kim, K.Y.; Zhuang, L.; Yang, H.; Kim, H.; Min, K.B. Strength anisotropy of Berea sandstone: Results of X-ray computed tomography, compression tests, and discrete modeling. Rock Mech. Rock Eng. 2016, 49, 1201–1210. [Google Scholar] [CrossRef]
  24. Liu, J.H.; Jiang, Y.D.; Zhao, Y.X.; Zhu, J. Uniaxial compression CT and acoustic emission test on the coal crack propagation destruction process. J. Coal. Sci. Eng. 2013, 19, 69–74. [Google Scholar] [CrossRef]
  25. Liu, J.H.; Jiang, Y.D.; Zhao, Y.X. Progress in the application of AE and CT in research of coal and rock fracture propagation. Met. Mine 2008, 10, 13–15. [Google Scholar]
  26. Ma, T.S.; Chen, P. Study of meso-damage characteristics of shale hydration based on CT scanning technology. Pet. Explor. Dev. 2014, 41, 249–256. [Google Scholar] [CrossRef]
  27. Ma, T.S.; Yang, C.H.; Chen, P.; Wang, X.D.; Guo, Y.T. On the damage constitutive model for hydrated shale using CT scanning technology. J. Nat. Gas Sci. Eng. 2016, 28, 204–214. [Google Scholar] [CrossRef]
  28. Yang, G.S.; Sun, J.; Xie, D.Y.; Zhang, C.Q.; Pu, Y.B. CT identification of the mechanic characteristics of damage propagation of rock. J. Coal Sci. Eng. 1997, 3, 21–25. [Google Scholar]
  29. Kawakata, H.; Cho, A.; Kiyama, T.; Yanagidani, T.; Kusunose, K.; Shimada, M. Three-dimensional observations of faulting process in Westerly granite under uniaxial and triaxial conditions by X-ray CT scan. Tectonophysics 1999, 313, 293–305. [Google Scholar] [CrossRef]
  30. Kawakata, H.; Cho, A.; Yanagidani, T.; Shimada, M. The observations of faulting in Westerly granite under triaxial compression by X-ray CT scan. Int. J. Rock Mech. Min. Sci. 1997, 34, 151–162. [Google Scholar] [CrossRef]
  31. Sun, W.; Wu, A.X.; Hou, K.P.; Yang, Y.; Liu, L.; Wen, Y.M. Real-time observation of meso-fracture process in backfill body during mine subsidence using X-ray CT under uniaxial compressive conditions. Constr. Build. Mater. 2016, 113, 153–162. [Google Scholar] [CrossRef]
  32. Li, X.; Duan, Y.T.; Li, S.D.; Zhou, R.Q. Study on the Progressive Failure Characteristics of Longmaxi Shale under Uniaxial Compression Conditions by X-ray Micro-Computed Tomography. Energies 2017, 10, 303. [Google Scholar] [CrossRef]
  33. Wang, Y.; Li, C.H.; Hao, J.; Zhou, R.Q. X-ray micro-tomography for investigation of meso-structural changes and crack evolution in Longmaxi formation shale during compressive deformation. J. Pet. Sci. Eng. 2018, 164, 278–288. [Google Scholar] [CrossRef]
  34. Zhou, M.; Yang, J. Effect of the layer orientation on fracture propagation of Longmaxi Shale under uniaxial compression using micro-CT scanning. SEG Tech. Prog. Exp. Abs. 2017, 3920–3924. [Google Scholar] [CrossRef]
  35. Heng, S.; Guo, Y.T.; Yang, C.H.; Daemen, J.J.K.; Li, Z. Experimental and theoretical study of the anisotropic properties of shale. Int. J. Rock. Mech. Min. Sci. 2015, 74, 58–68. [Google Scholar] [CrossRef]
  36. Nasseri, M.H.B.; Rao, K.S.; Ramamurthy, T. Failure mechanism in schistose rocks. Int. J. Rock Mech. Min. Sci. 1997, 34, 460. [Google Scholar] [CrossRef]
  37. Nasseri, M.H.B.; Rao, K.S.; Ramamurthy, T. Anisotropic strength and deformational behavior of Himalayan schists. Int. J. Rock Mech. Min. Sci. 2003, 40, 3–23. [Google Scholar] [CrossRef]
  38. Niandou, H.; Shao, J.F.; Henry, J.P.; Fourmaintraux, D. Laboratory investigation of the mechanical behaviour of Tournemire shale. Int. J. Rock Mech. Min. Sci. 1997, 34, 3–16. [Google Scholar] [CrossRef]
  39. Rawling, G.C.; Baud, P.; Wong, T.F. Dilatancy, brittle strength, and anisotropy of foliated rocks: Experimental deformation and micromechanical modeling. J. Geophys. Res. 2002, 107, 1–14. [Google Scholar] [CrossRef]
  40. Jarvie, D.M.; Hill, R.J.; Ruble, T.E.; Pollastro, R.M. Unconventional shale-gas systems: The Mississippian Barnett Shale of north-central Texas as one model for thermogenic shale-gas assessment. AAPG Bull. 2007, 91, 475–499. [Google Scholar] [CrossRef]
  41. Gao, C.; Xie, L.Z.; Xie, H.P.; He, B.; Jin, W.C.; Yang, Z.P.; Su, Y.Z. Estimation of the equivalent elastic modulus in shale formation: Theoretical model and experiment. J. Pet. Sci. Eng. 2017, 151, 468–479. [Google Scholar] [CrossRef]
  42. Wang, Y.; Li, C.H. Investigation of the P- and S-wave velocity anisotropy of a Longmaxi formation shale by real-time ultrasonic and mechanical experiments under uniaxial deformation. J. Pet. Sci. Eng. 2017, 158, 253–267. [Google Scholar] [CrossRef]
  43. Bazant, Z.P.; Kazemi, M.T.; Hasegawa, T.; Mazars, J. Scale effect in Brazilian split-cylinder test: Measurements and fracture analysis. ACI Mater. J. 1991, 88, 325–332. [Google Scholar]
  44. Bieniawski, Z.T. The effect of specimen size on compressive strength of coal. Int. J. Rock Mech. Min. Sci. 1968, 5, 325–335. [Google Scholar] [CrossRef]
  45. Gonzatti, C.; Zorzi, L.; Agostini, I.M.; Fiorentini, J.A.; Viero, A.P.; Philipp, R.P. In situ strength of coal bed based on the size effect study on the uniaxial compressive strength. Int. J. Min. Sci. Technol. 2014, 24, 747–754. [Google Scholar] [CrossRef]
  46. Li, M.; Mao, X.B.; Lu, A.H.; Tao, J.; Zhang, G.H.; Zhang, L.Y.; Lie, C. Effect of specimen size on energy dissipation characteristics of red sandstone under high strain rate. Int. J. Min. Sci. Technol. 2014, 24, 151–156. [Google Scholar] [CrossRef]
  47. Medhurst, T.P.; Brown, E.T. A study of the mechanical behavior of coal for pillar design. Int. J. Rock Mech. Min. Sci. 1998, 35, 1087–1105. [Google Scholar] [CrossRef]
  48. Tiggelaar, R.M.; Verdoold, V.; Eghbali, H.; Desmet, G.; Gardeniers, J.G. Characterization of porous silicon integrated in liquid chromatography chips. Lab Chip 2009, 9, 456–463. [Google Scholar] [CrossRef] [PubMed]
  49. Heidig, T.; Zeiser, T.; Freund, H. Influence of resolution of rasterized geometries on porosity and specific surface area exemplified for model geometries of porous media. Transp. Porous Media 2017, 120, 1–19. [Google Scholar] [CrossRef]
  50. Kou, R.; Alafnan, S.F.K.; Akkutlu, I.Y. Multi-scale analysis of gas transport mechanisms in kerogen. Transp. Porous Media 2017, 116, 493–519. [Google Scholar] [CrossRef]
  51. Qu, G.Z.; Qu, Z.Q.; Hazlett, R.D.; Freed, D.; Mustafayev, R. Geometrical description and permeability calculation about shale tensile micro-fractures. Pet. Explor. Dev. 2016, 43, 124–130. [Google Scholar] [CrossRef]
  52. Tong, S.Q.; Dong, Y.H.; Zhang, Q.; Elsworth, D.; Liu, S.M. Quantitative analysis of nanopore structural characteristics of lower Paleozoic Shale, Chongqing (Southwestern China): Combining FIB-SEM and NMR Cryoporometry. Energy Fuels 2017, 31, 13317–13328. [Google Scholar] [CrossRef]
  53. Sarkar, N.; Chaudhuri, B.B. An efficient differential box-counting approach to compute fractal dimension of image. IEEE Trans. Syst. Man Cybern. 1994, 24, 115–120. [Google Scholar] [CrossRef]
  54. Bouboulis, P.; Dalla, L.; Drakopoulos, V. Construction of recurrent bivariate fractal interpolation surfaces and computation of their box-counting dimension. J. Approx. Theory 2006, 141, 99–117. [Google Scholar]
  55. Li, J.; Du, Q.; Sun, C. An improved box-counting method for image fractal dimension estimation. Pattern Recognit. 2009, 42, 2460–2469. [Google Scholar]
Figure 1. X-ray CT and compression stage.
Energies 11 01409 g001
Figure 2. (a) Outcrop image of the sampling profile; (b) Hand specimen with inconspicuous bedding; (c) Loading schematic.
Energies 11 01409 g002
Figure 3. (a) Backscattered electron (BSE) image; (b) Mineral composition analysis; (c) Segmented organic matter and pores; (d) Mineral composition.
Energies 11 01409 g003
Figure 4. Three dimensional (columns 1–2) and two dimensional (columns 3–5) micro-CT images of specimens SZA3, SZA4 and SZB3, SZB4 before uniaxial compression (X: x-axis, Y: y-axis, Z: z-axis). Bright area denotes high-density substance, and dark area denotes low-density substance. Pyrite is segmented individually in yellow area. The cross-sectional view shows the center slice of the specimen.
Energies 11 01409 g004
Figure 5. Stress-stain curves of Longmaxi shale specimens SZA1-4 and SZB1-4.
Energies 11 01409 g005
Figure 6. Crack propagation patterns at different load stage in SZA3. (a) Specimen at σ1 = 79.58 MPa; (b) Crack at σ1 = 79.58 MPa; (c) Specimen at σ1 = 103.45 MPa; (d) Crack at σ1 = 103.45 MPa; (e) Fractured specimen; (f) Crack of the fractured specimen (after σ1 = 119.72 MPa). In (a,c,e), dark area represents cracks. In (b,d,f), rainbow colors represent the thickness value ranges from low to high, and red means highest. All crack images are in the same orientation.
Energies 11 01409 g006
Figure 7. The thickness of crack in different load stages in SZA3. (a) σ1 = 79.58 MPa; (b) σ1 = 103.45 MPa; (c) Fractured (after σ1 = 119.72 MPa); (d) The frequency of all stages at the interval of 20 μm.
Energies 11 01409 g007
Figure 8. Specimen SZA4 at different load stages. (a) σ1 = 71.62 MPa; (b) σ1 = 87.54 MPa; (c) Fractured specimen (after σ1 = 103.52 MPa).
Energies 11 01409 g008
Figure 9. The fracture image and thickness of SZA4. (a) 3-D image of fracture (after σ1 = 103.52 MPa); (b) thickness distribution pattern.
Energies 11 01409 g009
Figure 10. Crack propagation patterns of different load stages in SZB3. (a) Crack at σ1 = 103.45 MPa; (b) Crack of the fractured specimen (after σ1 = 107.16 MPa); (c) crack thickness at σ1 = 103.45 MPa; (d) crack thickness (after σ1 = 107.16 MPa). Rainbow colors represent the thickness value ranges from low to high, and red means highest. The cross-sectional views show the center slice of the specimen.
Energies 11 01409 g010
Figure 11. Specimen SZB4 at different load stages. (a) σ1 = 127.32 MPa; (b) σ1 = 151.19 MPa; (c) Fractured specimen (after σ1 = 155.76 MPa).
Energies 11 01409 g011
Figure 12. Crack propagation pattern of different load stages in SZB4. (a) σ1 = 151.19 MPa; (b) Fractured specimen (after σ1 = 155.76 MPa); (c) crack thickness at σ1 = 151.19 MPa; (d) crack thickness (after σ1 = 155.76 MPa). Rainbow colors represent the thickness value ranges from low to high, and red means highest. The cross-sectional views show the center slice of the specimen.
Energies 11 01409 g012aEnergies 11 01409 g012b
Figure 13. Quantitative characterization of cracks in shale specimens. (a) The fracture volume and fracture area at different specimens; (b) SSA and tortuosity at different load stages of each specimen.
Energies 11 01409 g013
Figure 14. Centroid path of tortuosity module. The illustration of Avizo Tortuosity Module: first it computes c(i) of each slices z(i) of the image, then it computes the path length through l = ∑d(i) and eventually divides it by the number of slices H = z ( n ) z ( 0 ) along z-axis.
Energies 11 01409 g014
Figure 15. The lgN-lgr scatter plot at different load stages of each specimen (A3-1: SZA3 at σ1 = 79.58 MPa, A3-2: SZA3 at σ1 = 103.45 MPa, A3-3: SZA3 at fractured; B3-1: SZB3 at σ1 = 103.45 MPa, B3-2: SZB3 at fractured).
Energies 11 01409 g015
Figure 16. Crack BCD in different load stages of each specimen (A3-1: SZA3 at σ1 = 79.58 MPa, A3-2: SZA3 at σ1 = 103.45 MPa, A3-3: SZA3 at fractured; A4: SZA4 at fractured; B3-1: SZB3 at σ1 = 103.45 MPa, B3-2: SZB3 at fractured; B4: SZB4 at fractured).
Energies 11 01409 g016
Table 1. Uniaxial compression of Longmaxi shale specimens SZA and SZB.
OrientationSampleHeight/mmDiameter/mmUCS/MPaE/GPa
Axis parallel to the layerSZA18.434.01145.1112.93
SZA28.094.00174.6312.29
SZA38.564.05119.7210.09
SZA48.524.02103.5212.31
mean8.404.02135.7511.91
Axis perpendicular to the layerSZB18.194.01128.4111.91
SZB28.464.02147.3510.53
SZB38.504.02107.168.77
SZB48.144.04155.7611.01
mean8.324.02134.6710.56
Table 2. Quantitative characterization of cracks in shale specimens.
Specimen NumberLoad StressQuantitative Characterization of Cracks
Volume Percentage/%Surface Area/µm2Volume/µm3Specific Surface/1/µmTortuosityFractal Dimension
SZA379.58 MPa1.14%9.25 × 1078.91 × 1080.1041.6372.123
103.45 MPa1.60%1.27 × 1081.16 × 1090.1091.6792.208
119.72 MPa6.70%3.51 × 1084.96 × 1090.0711.2282.442
SZA487.54 MPa//////
103.52 MPa4.95%2.37 × 1083.49 × 1090.0681.4592.383
SZB3103.45MPa6.02%1.63 × 1084.65 × 1090.0351.2102.345
107.16 MPa14.40%4.61 × 1081.07 × 10100.0431.2402.537
SZB4151.19 MPa0.25%3.04 × 1072.63 × 1080.1153.336/
155.76 MPa6.72%2.91 × 1085.01 × 1090.0581.4712.510

