Article

Influence of Grain Size Heterogeneity and In-Situ Stress on the Hydraulic Fracturing Process by PFC2D Modeling

1
Key Laboratory of Shale Gas and Geoengineering, Institute of Geology and Geophysics, Chinese Academy of Science, Beijing 100029, China
2
Institutions of Earth Science, Chinese Academy of Sciences, Beijing 100029, China
3
College of Earth Science, University of Chinese Academy of Sciences, Beijing 100049, China
*
Author to whom correspondence should be addressed.
Energies 2018, 11(6), 1413; https://doi.org/10.3390/en11061413
Submission received: 16 April 2018 / Revised: 23 May 2018 / Accepted: 28 May 2018 / Published: 1 June 2018
(This article belongs to the Special Issue Unconventional Natural Gas (UNG) Recoveries 2018)

Abstract

:
A modified fluid-mechanically coupled algorithm in PFC2D was adopted in this article to study the influence of grain size heterogeneity and in-situ stress on hydraulic fracturing behavior. Simulated results showed that the in-situ stress and grain size heterogeneity significantly affect the initiation, growth, and spatial distribution of the hydraulic fractures: (1) the initiation and breakdown pressure are gradually reduced with the increase of the grain size heterogeneity; (2) with increased in-situ stress, the initiation and breakdown pressure increase, and the reduction effect of grain size heterogeneity on the breakdown pressure becomes more obvious; (3) in grain size homogeneous rock, the initiation pressure decreases with increasing in-situ stress ratio, however, the initiation pressure of grain size heterogeneous rock is almost unaffected by the in-situ stress ratio; (4) The in-situ stress ratio and grain size heterogeneity affect the spatial distribution of hydraulic fractures simultaneously. When the in-situ stress ratio is larger than 1, the hydraulic fractures propagate substantially along the direction of the maximum principal stress. When the in-situ stress ratio is 1, the initiation position and extension direction of hydraulic fractures are random and complex fracture networks can easily develop in a grain size homogeneous model.

1. Introduction

Hydraulic fracturing is a process by which fractures initiate, propagate, and penetrate due to fluid injection in rock. It was first adopted in the energy industry for increasing oil production from tight reservoirs [1]. Since then, this technology has also been applied in different fields: in-situ stress measurement, shale gas stimulation, and geothermal energy resources extraction, for example [2,3,4]. For engineers, it is important to estimate the hydraulic fracturing feasibility of the working area and the fracturing effect before carrying out the hydrofracturing work. Hence, a large amount of research has been carried out to figure out the mechanism of hydraulic fracturing by means of experiments, simulations, and theoretical analysis. Various studies have shown that the main factors influencing hydraulic fracturing include external factors [5,6,7,8], such as in-situ stress, fluid viscosity and injection rate, and wellbore geometry, and internal factors [9,10,11,12,13], such as rock strength, natural fracture features, and rock anisotropy and heterogeneity.
Rock is a naturally heterogeneous material [14]. The initiation, propagation, and spatial distribution of hydraulic fractures are closely related to rock heterogeneity. The heterogeneity of the rock can be defined as the uneven changes of mineral composition and microstructure in the spatial distribution influenced by diagenesis and tectonics. Compared with the homogeneous rocks, the propagation characteristics of hydraulic fractures in heterogeneous rock are more complex and the propagation paths are more tortuous [15]. It is well known that [16] the initiation and growth of microcracks are difficult to predict in heterogeneous materials by just using basic theories of fracture mechanics. When rock materials are under fluid pressure, the propagation of microcracks are more complicated. Because it is difficult to obtain a complete analytical solution for heterogeneous rock under fluid pressure, experiments and numerical simulations are widely used to study the effect of rock heterogeneity on hydraulic fracturing behaviors. Vaselli [17] used high resolution X-ray tomography to obtain 3D images of hydraulic fracture propagation in limestone core samples. The 3D data showed that the initial heterogeneities of limestone have a strong effect on the extension and final roughness of the hydraulic fractures. Based on PFC2D, Al-Busaidi et al. [9] found that homogeneous rock sample tend to form 3 tensile fractures with equal space approximately 120° to each other. However, in the heterogeneous rock sample, the fractures are isolated and distributed until rock failure. Yang et al. [16] investigated the influence of rock heterogeneity on hydraulic fracturing behaviors by F-RFPA2D and found that the initiation and breakdown pressures in homogeneous rocks are much higher than those in the heterogeneous rocks. In the above numerical simulation of Al-Busaidi [9] and Yang [16], rock materials are discretized into numerous elements with similar size and different mechanical parameters in order to represent the heterogeneity of rock. Actually, rock is composed of a large number of mineral grains at the grain-scale and the mineral grain size also significantly influences the hydraulic fracturing behavior. By a series of hydraulic fracturing experiments of different rocks and acrylic resin, Matsunaga et al. [18] found that the microstructure of rock, such as the grain size, affects the hydraulic fracturing mechanism. To further analyze the effects of mineral grain size on the hydraulic fracturing mechanism, Chen and Ishida et al. [19,20,21] used granite samples with four different grain sizes to conduct hydraulic fracturing experiments and discovered that decreasing the grain size increased the breakdown pressure and tensile hydraulic cracks become dominant. In addition, crack geometry is quite different depending on the grain size; a horizontal crack is created in rock samples with larger grain, whereas vertical cracks are formed in specimens with very small grain size.
Previous studies have revealed the influences of mineral grain size on hydraulic fracturing to a certain extent, however, there are few studies on the influence of mineral grain size heterogeneity. As aggregates of mineral grains, rock is also heterogeneous in its grain size. For example, the grain size of K-feldspar and plagioclase in granite can reach more than 5 mm, while the grain size of mica is less than 1 mm. In conglomerate, the grain size of gravel is larger than 2 mm, while the interstitial materials such as sand and clay have very small grain size. Based on PFC2D, Shimizu et al. [15] investigated the effects of grain size distribution on hydrofracturing. The results showed that hydraulic cracks propagate along the direction of maximum in-situ stress. In the particle size heterogeneous rock model, shear cracks propagate diagonally along the grain boundaries. However, in the particle size homogeneous rock model, the hydraulic fractures propagate straightly and shear cracks are less developed. This study indicates that uneven grain size distribution significantly affects the micromorphology and microcracking mechanism of the hydraulic fractures. Therefore, it is necessary to further study the influence of grain size heterogeneity on hydraulic fracturing behavior.
Many researchers [22,23,24] have demonstrated that the in-situ stress ratio controls the direction of hydraulic fracture propagation, which is generally along the maximum in-situ stress. Meanwhile, the heterogeneity of rock is the other factor affecting the initiation and propagation of hydraulic fractures. Hence, the internal factor of grain size heterogeneity and external factor of in-situ stress were taken into consideration in the present work. Our goal has been to study the hydraulic fracturing behaviors of rock under the combined influences of heterogeneous grain size and in-situ stress by using a modified PFC2D model. A series of hydrofracturing simulations of granite were conducted to discuss the influences of grain size heterogeneity under different in-situ stress and in-situ stress ratios on the initiation, propagation, micromorphology, and spatial distribution of hydraulic fractures.

2. Modeling Methodology

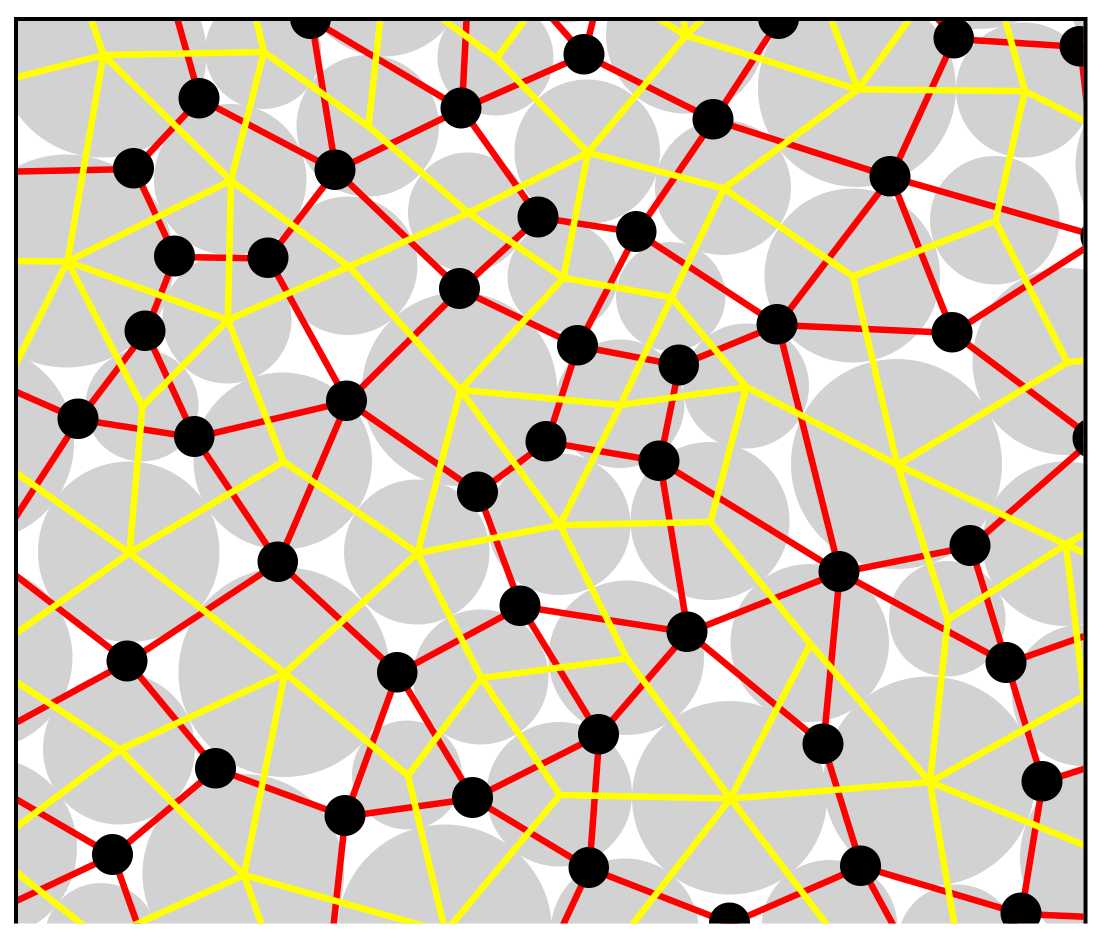
2.1. Fluid-Mechanical Coupling in PFC2D

In PFC2D, the material is represented as an aggregate of numerous rigid circular particles [25,26]. To simulate the fluid flow, Cundall’s algorithms [27] were adopted. As illustrated in Figure 1, the centers of particles are connected by yellow lines which represent the fluid network topology and then a series of enclosed domains (yellow polygons) are created. The centers of those enclosed domains are regarded as “reservoirs” (Figure 1, black circles) which can store some fluid pressure. The reservoirs are connected by pipes (Figure 1, red lines).
Figure 2 shows the basic mechanism of the fluid-mechanical coupling [28]. The left side of Figure 2 shows the deformation mechanism of the solid particles, where the motion of the particles and the contact force between particles are calculated by the Newton’s second law and the force–displacement law, respectively. For more details, refer to Potyondy and Cundall [25]. The right side of Figure 2 shows the simulation of fluid migration. The fluid flow is calculated by the cubic law (Equation (1)) [27].
q = e 3 Δ P 12 μ L
where e is the hydraulic aperture, Δ P is the fluid pressure change between the two adjacent reservoirs, μ is the fluid viscosity, and L is the channel length. The hydraulic aperture e changes as a function of normal force σn (Equation (2)) [25,28,29,30].
e = e inf +   ( e 0 e inf ) exp ( 0.15 σ n )
where, e0 is the hydraulic aperture at zero normal force, also known as residual aperture, einf is the hydraulic aperture at infinite normal force. The fluid pressure change Δ P in one time step Δ t is calculated from the fluid bulk modulus Kf, the flow from the surrounding pipes and the volume of the reservoir Vd according to Equation (3).
Δ P = K f V d ( q Δ t Δ V d )
Within each calculation step, the particles around the reservoir will move and deform due to the fluid pressure. Subsequently, the domain volume and the hydraulic aperture of the flow channel change, so the flow and fluid pressure need to be updated. A new fluid pressure exerts on the particles after the fluid calculation step.

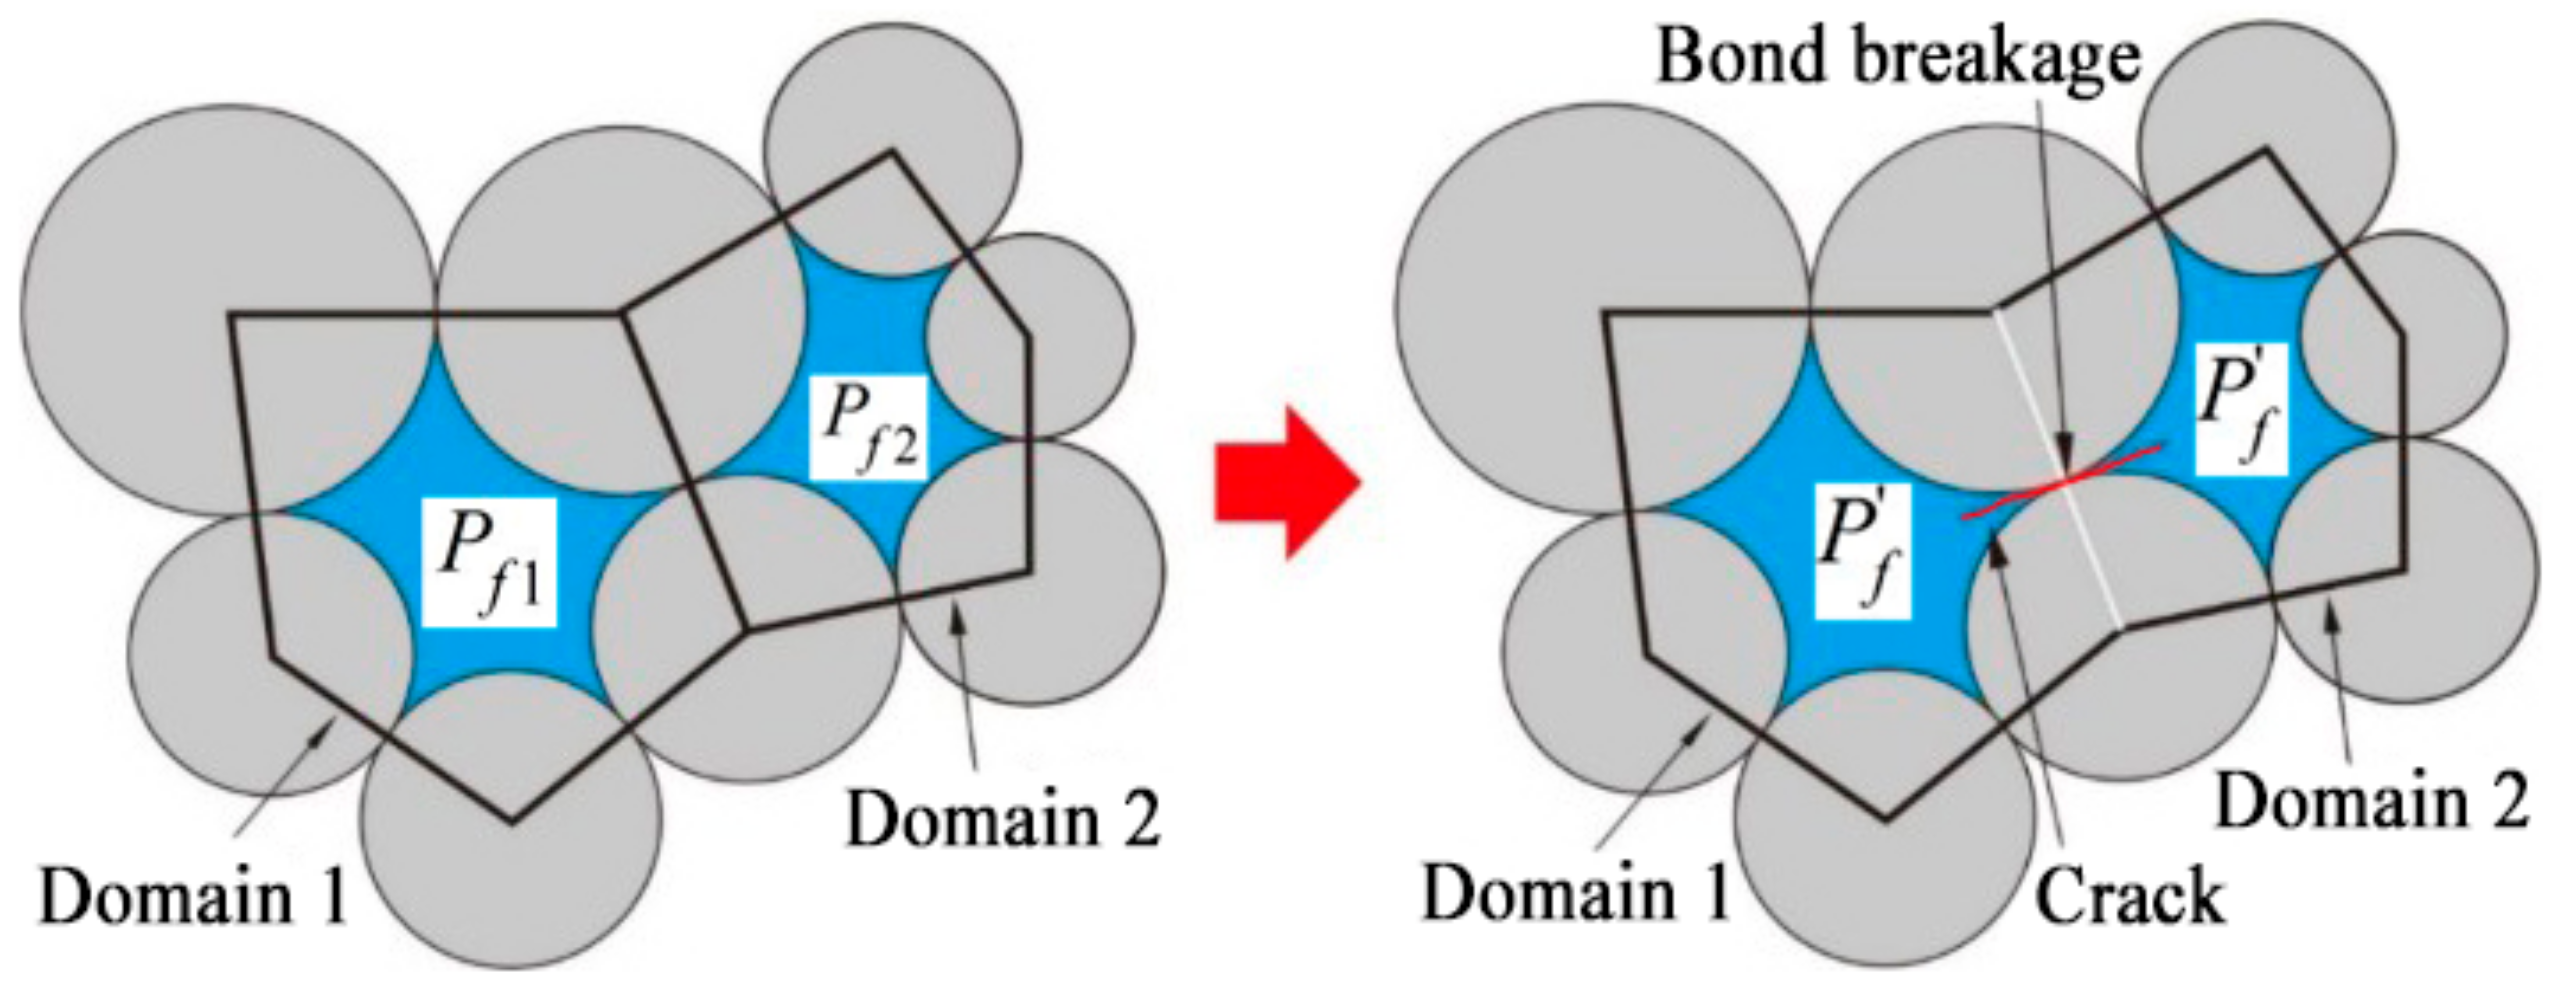
2.2. Optimization of Fluid Pressure Calculation after Bond Failure

In this study, the parallel bond model was used to simulate rock material. When external force acting on each parallel bond exceeds its limit strength, the bond will be damaged and a crack develops at the corresponding position. As a result, the hydraulic aperture of the flow channel becomes infinite, then the following calculation will become unstable. Therefore, it is important to properly simulate the fluid flow after bond breakage in PFC hydraulic fracturing. Al-Busaidi et al. [9], Zhao and Young [31], and Hazzard et al. [32] assumed that the new fluid pressure is the average value of fluid pressures in the two domains before bond breakage. The new fluid pressure is calculated by the following equation:
P f = P f 1 + P f 2 2
where Pf1 and Pf2 represent fluid pressure of Domain 1 and Domain 2 before bond failure (Figure 3), respectively. However, Zhou et al. [28] thought that when there is a well in the rock model, Equation (4) is not suitable, because the volumes of some fluid domains are not approximately equal to each other. Thus, Zhou’s [28] modified fluid-mechanically coupled algorithm was adopted in this study. In the modified algorithm, the new fluid pressure of two domains after bond breakage is calculated by Equation (5):
P f = [ ( V f 1 + V f 2 ) ( V r 1 + V r 2 ) φ 1 ] K f
where Vf1 and Vf2 are the fluid volumes of Domain 1 and Domain 2 in Figure 3, respectively. Vr1 and Vr2 are the volumes of Domain 1 and Domain 2 under 0 MPa fluid pressure, respectively. Kf is the fluid bulk modulus and φ is the porosity of the model.

3. Hydraulic Fracturing Modeling and Scenarios

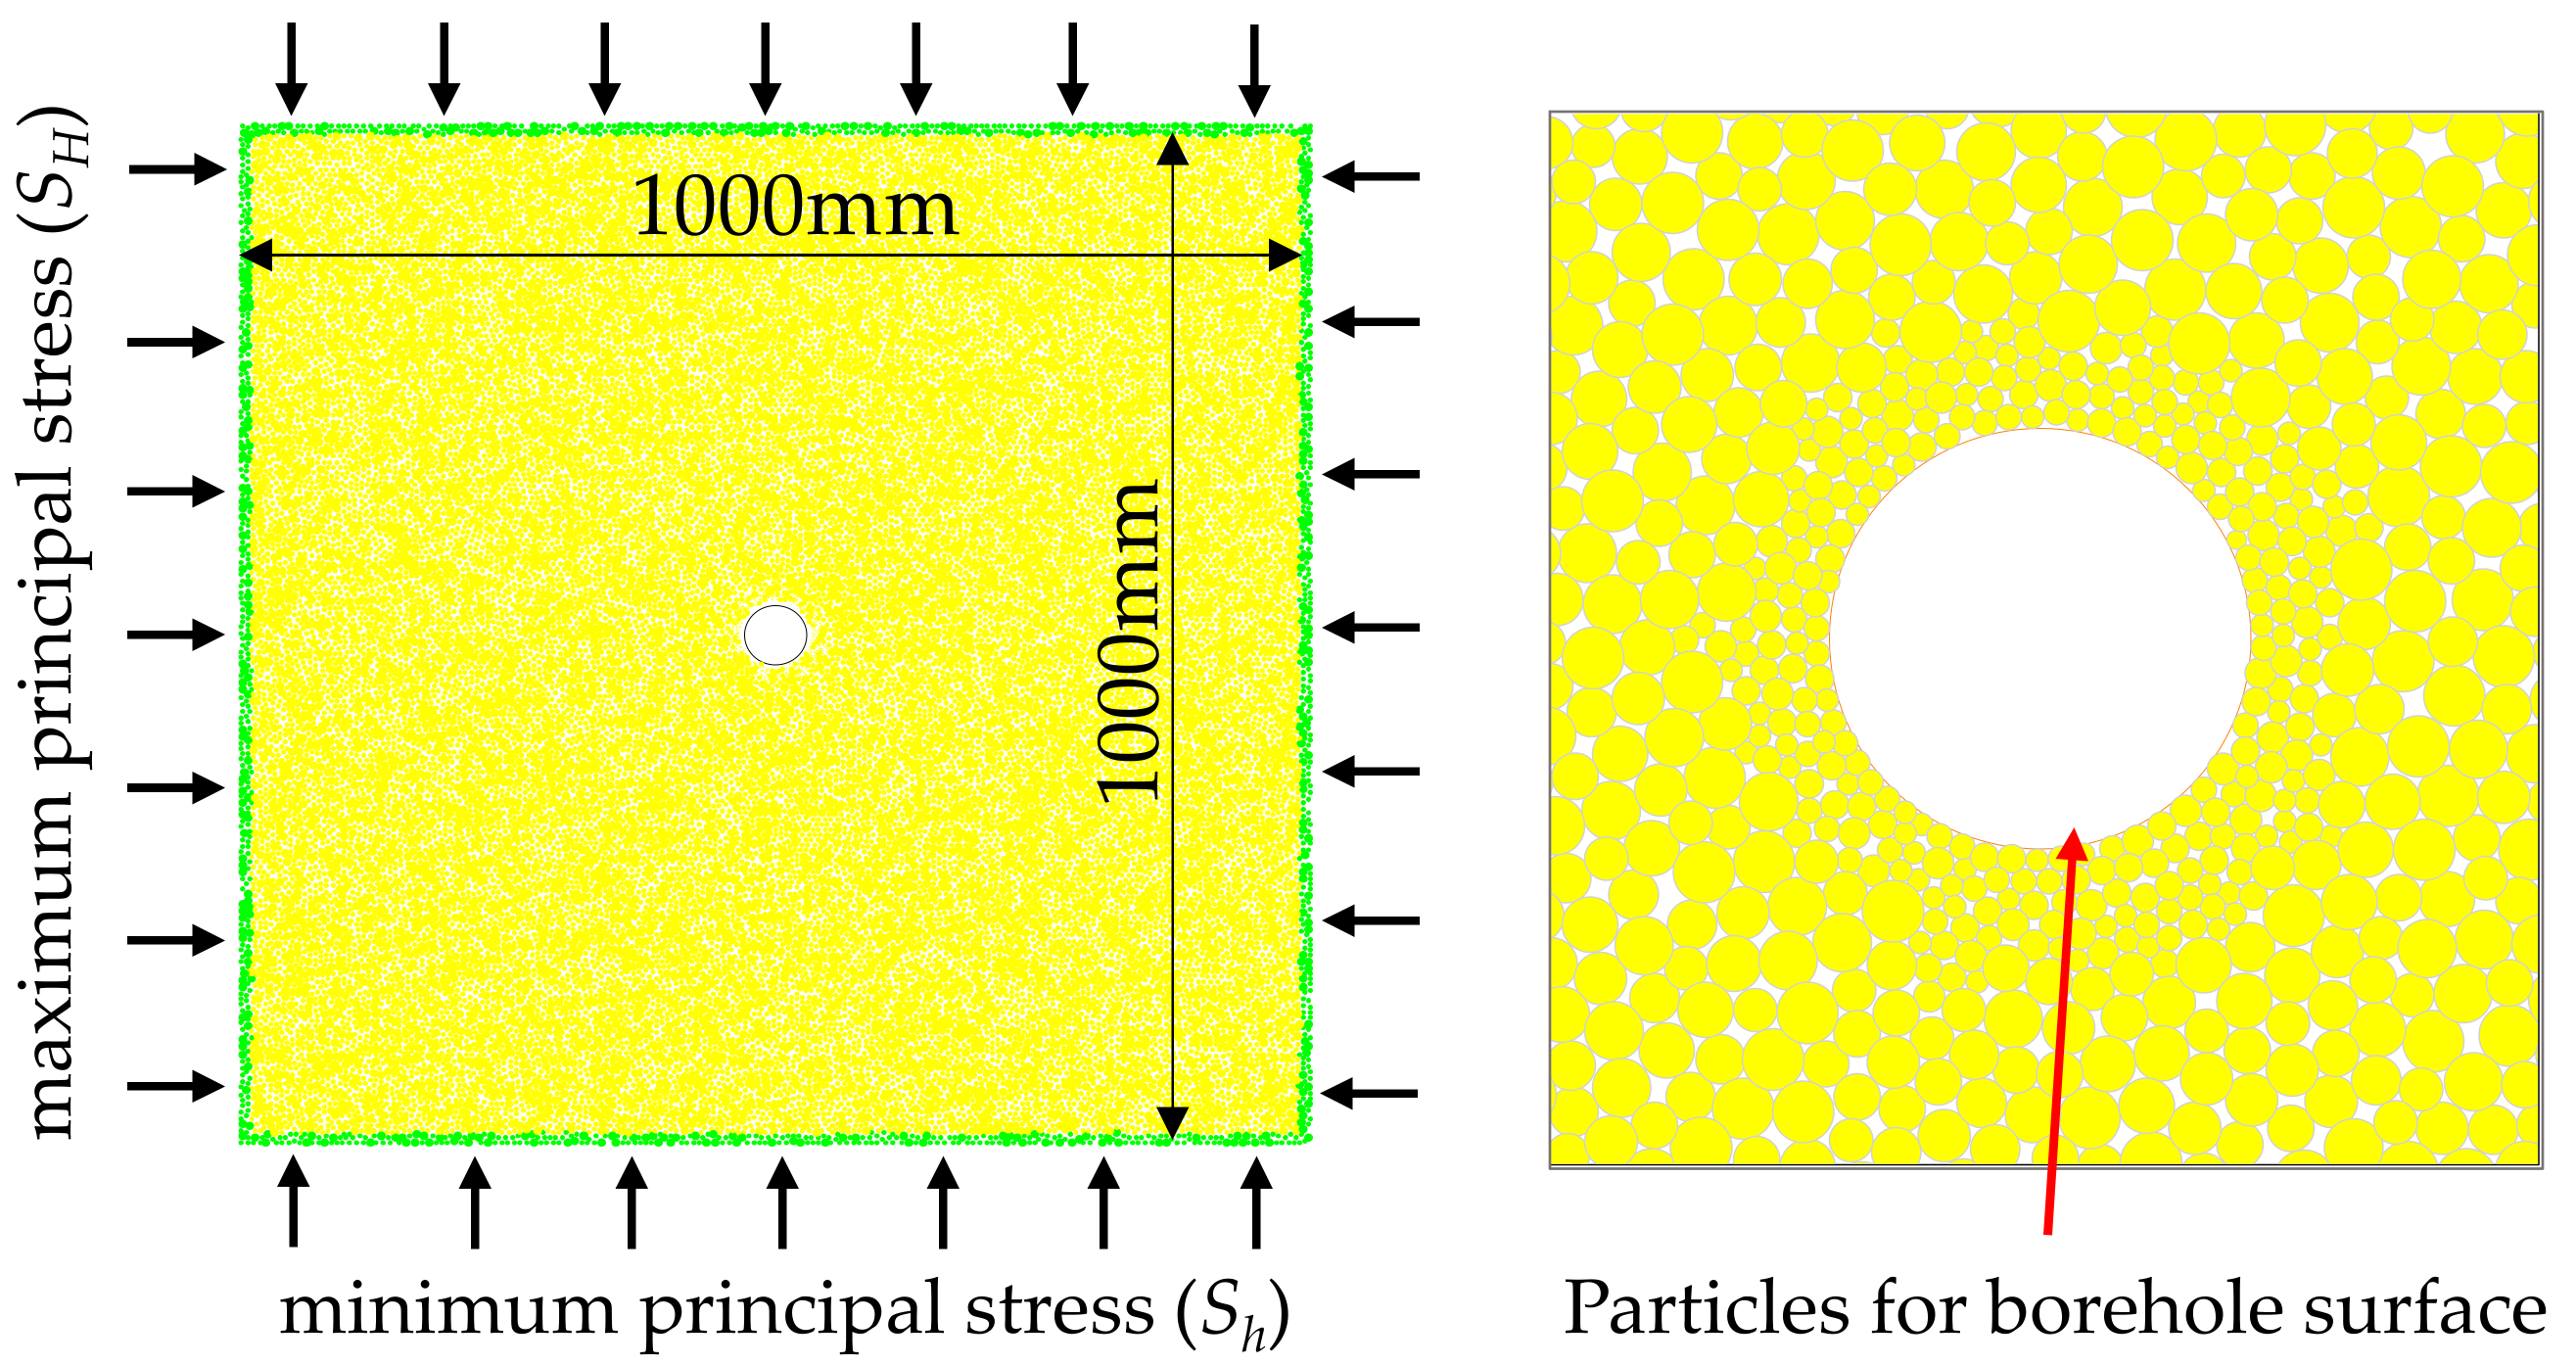
3.1. Model Description and Parameters

In this study, the model used for hydraulic fracturing simulation is 1000 mm in width and 1000 mm in height. As shown in Figure 4, there are four walls around the model which are represented by green particles. The motion of the walls can be controlled by a servo-adjustment method to apply a constant confining pressure, SH in the x-direction, and Sh in the y-direction. In the center of the model, a circular hole with a diameter of 60 mm is set as the fluid injection well. In order to make the borehole wall smoother to avoid stress concentration, the radius of particles around the borehole wall is half of the model mean particle radius.
The microparameters used in PFC2D need to be calibrated based on the experimental results which is mainly a trial-and-error procedure. In this study, the microparameters were calibrated to match the macroproperties of the UCS test of Alxa granite, including elastic modulus, peak strength, and Poisson’s ratio. Alxa is located in western Inner Mongolia, China, which is covered by a large area of granitic rock. After a trial-and-error process, the elastic modulus, peak strength, and Poisson’s ratio of the calibration model were determined to be 50 GPa, 164 MPa, and 0.21, respectively, which are consistent with the corresponding experiment results. The mesoscopic physical and mechanical parameters of the model and the fluid parameters used for hydraulic fracturing are shown in Table 1.

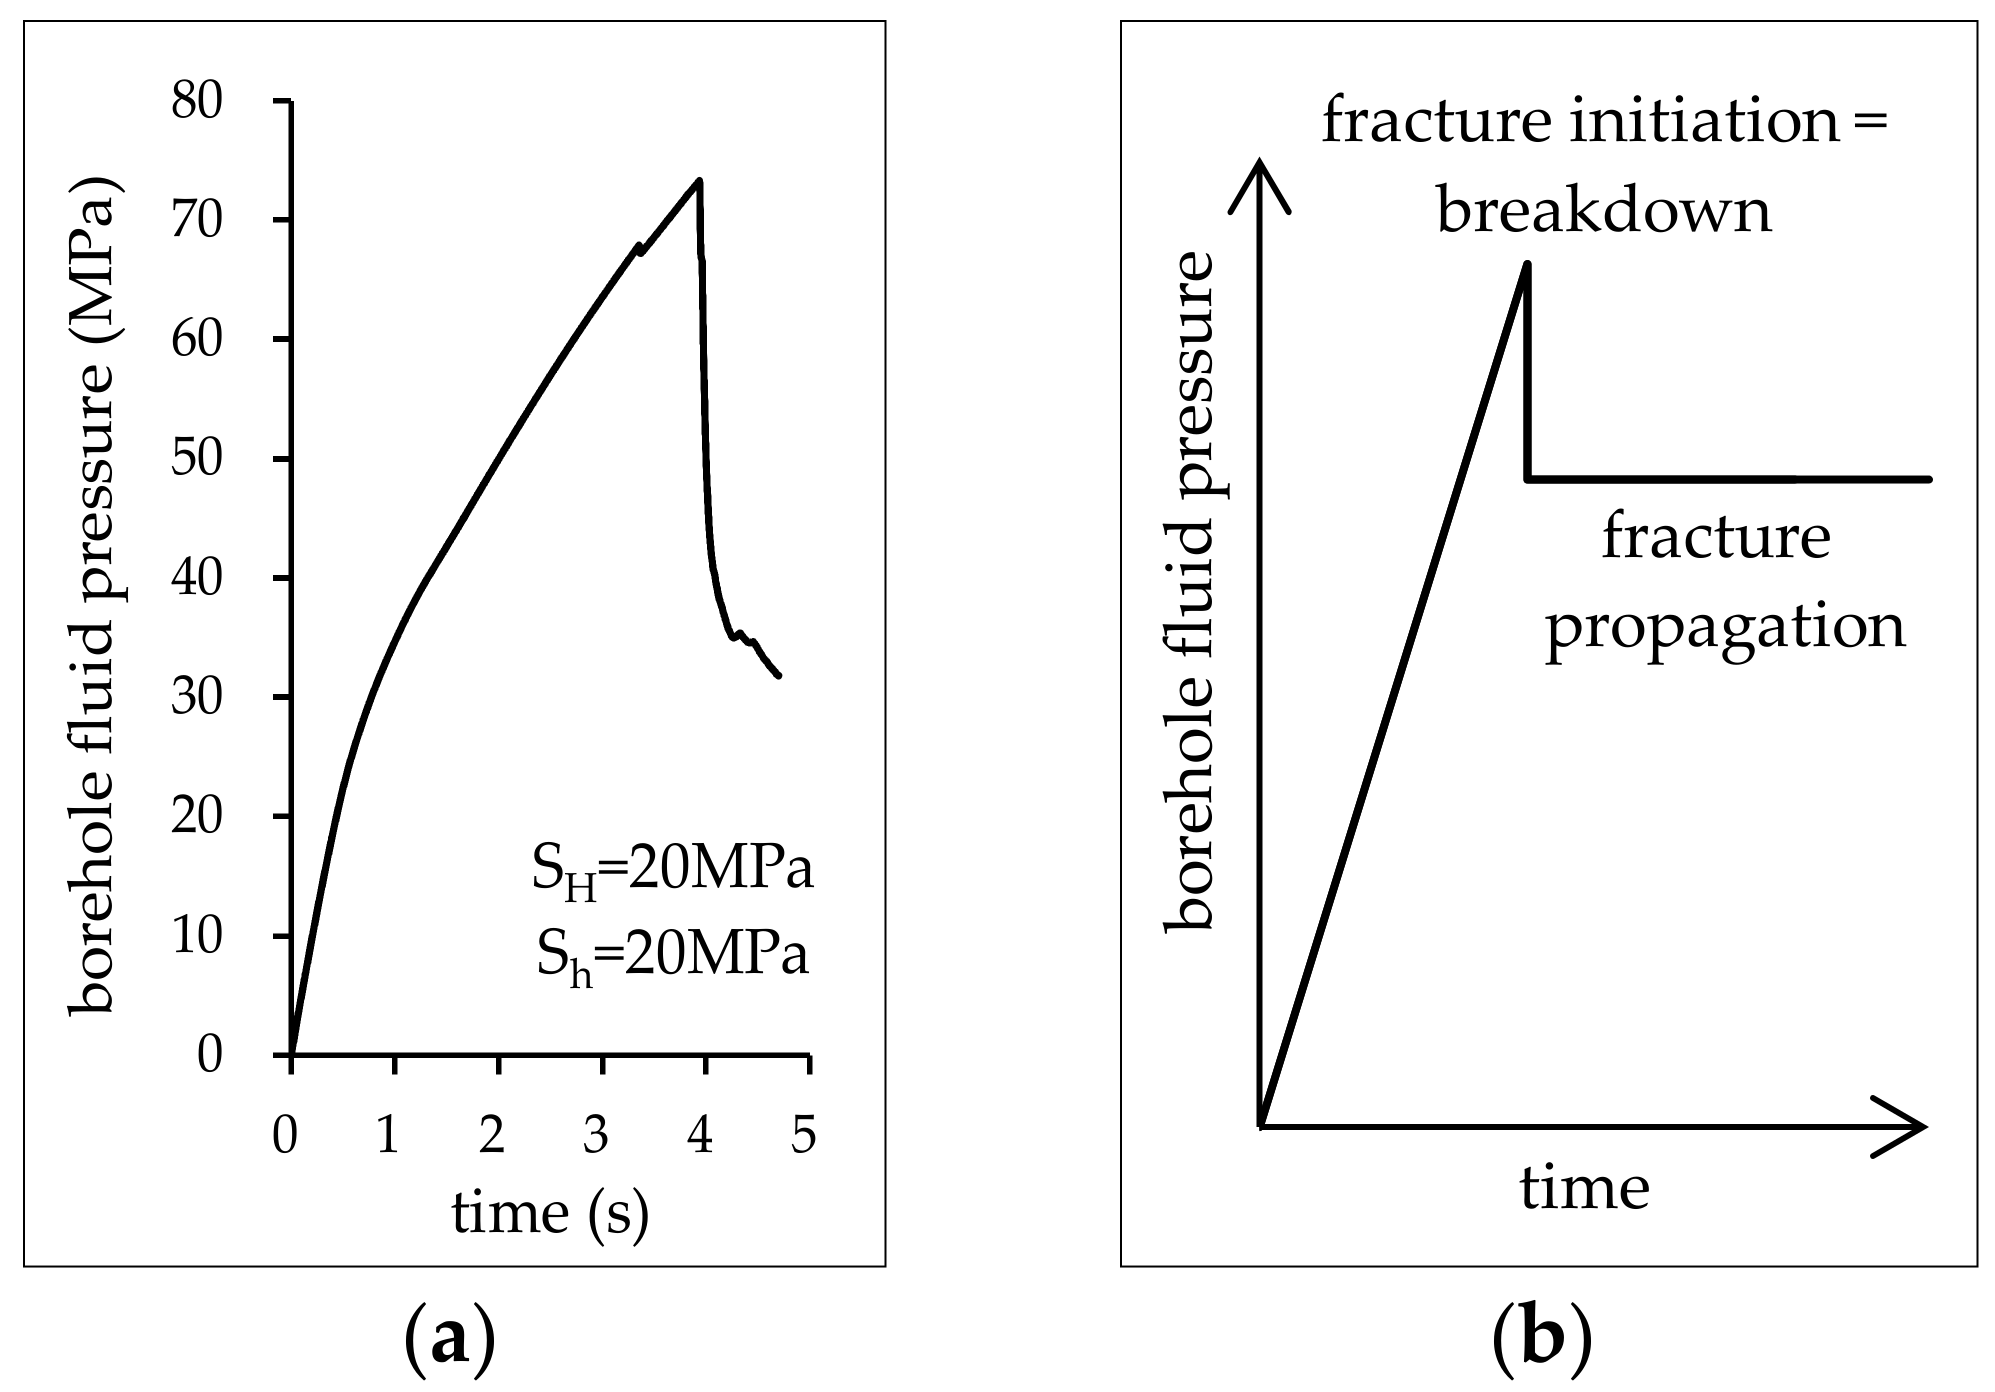
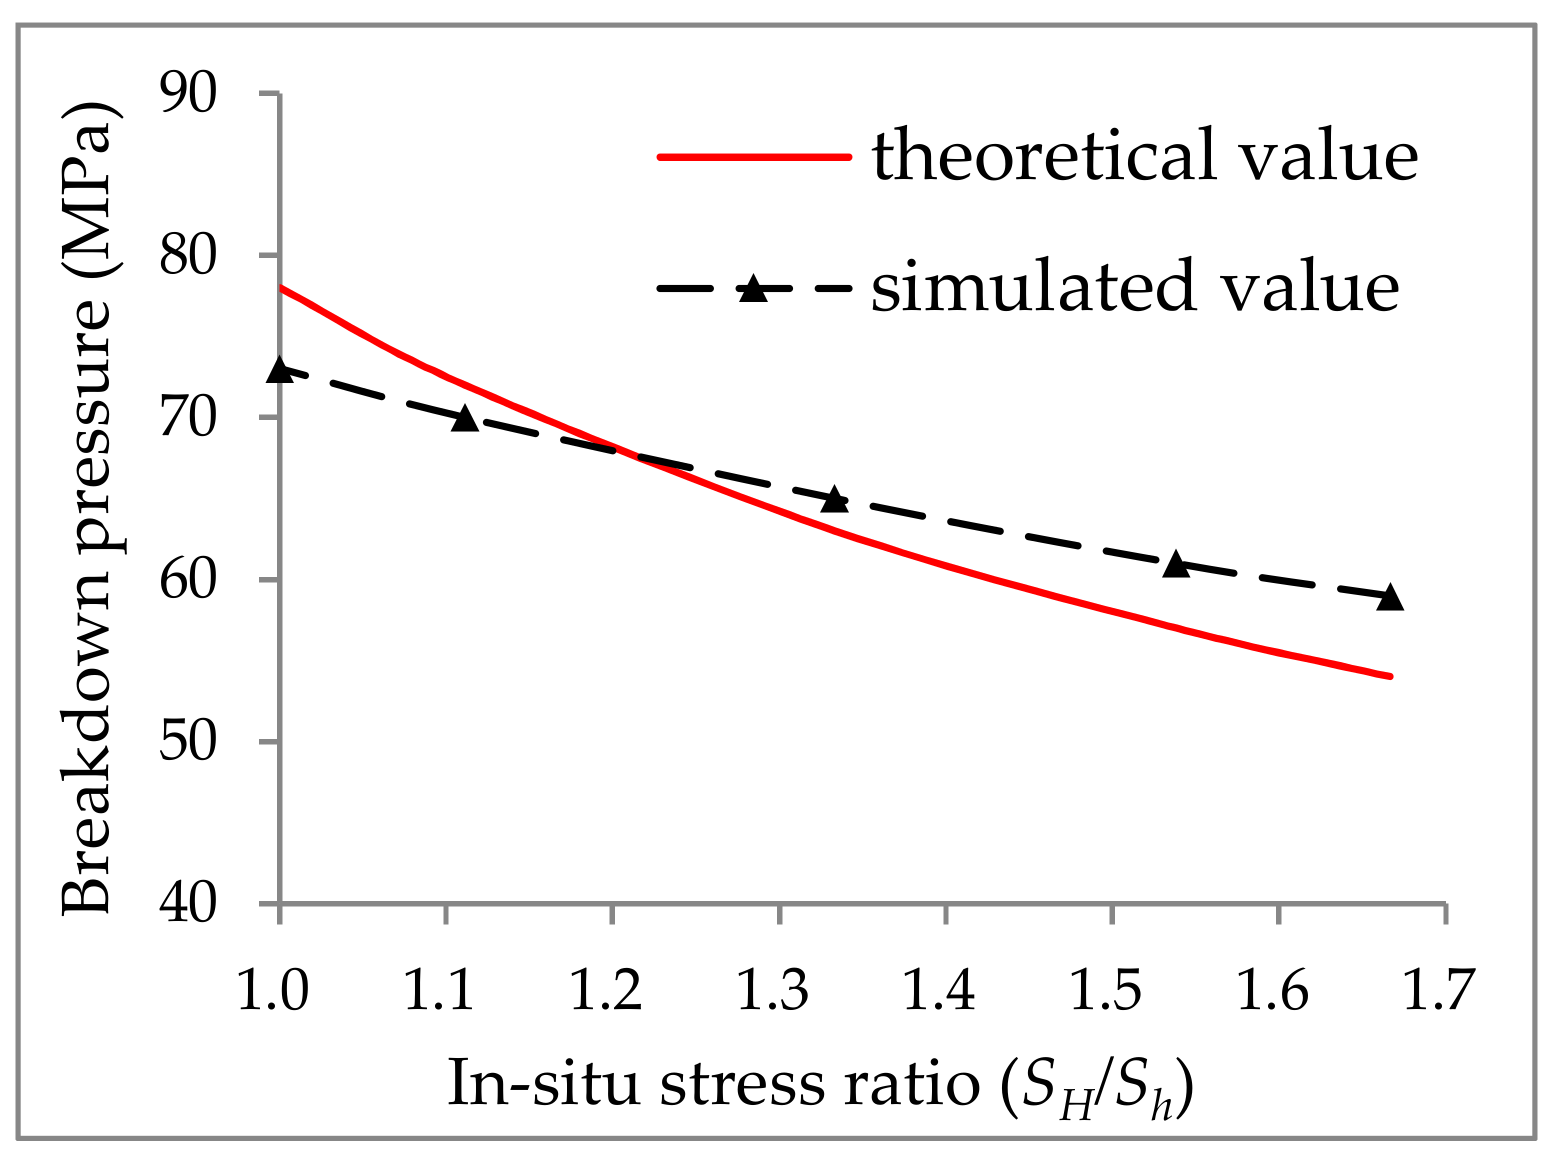
3.2. Modeling Validation

The possibility of simulating fluid flow based on the bonded particle model has been verified by many studies [9,28,31]. However, the reliability of hydraulic fracturing simulation using the bonded particle model has been neglected in previous research. A reasonable hydraulic fracturing model should not only correctly reflect the fluid flow mechanism, but also take the crack initiation and breakdown into consideration. However, few studies have compared the breakdown pressure of the model with the theoretical value. According to the Haimson’s studies [23], the breakdown pressure Pwf for hydraulic fractures can be determined according to Equation (6).
P w f = 3 S h S H P 0 + σ t
For validating the reliability of our modified fluid-mechanically coupled model, a sequence of simulations for hydraulic fracturing were conducted under different in-situ stress ratio using the model shown in Figure 4. The simulated borehole fluid pressure curves and breakdown pressure were compared with theoretical values to verify the rationality of the model. In the validation models, the number of particles is about 15,000, with particle radii ranging from 3.50 mm to 5.25 mm following a normal distribution. The fluid injection rate was fixed at 2.0 × 10⁻⁶ m3/s. The maximum principal stress (SH) was set to 20 MPa, and the minimum principal stress (Sh) was changed from 20 MPa to 10 MPa.
Figure 5a shows the borehole fluid pressure curve during hydraulic fracturing simulation (taking the model with in situ stress ratio of 1.0 as example). Figure 5b shows the theoretical curve of borehole pressure during the hydraulic fracturing process. The curve can be divided into three parts. The first part is the elastic deformation of the fluid and surrounding rock, which is mainly because the fluid is in a compressed state. When the fluid pressure reaches the peak value, the cracks initiate then the fluid pressure drops rapidly which indicates the unstable situation of crack development. By continued pumping, the constant borehole fluid pressure level is finally maintained. There are two typical critical pressures in rock hydraulic fracturing: crack initiation pressure and breakdown pressure, which can be determined according to the borehole pressure curve. In the theoretical curve, the crack initiation pressure and breakdown pressure are equal, and the peak point corresponds to the breakdown pressure. Compared with the idealized curve of borehole fluid pressure (Figure 5b), the fluid pressure curve in Figure 5a is nonlinear before arriving at the breakdown pressure. This is mainly because in the idealized hydraulic fracturing process, the material is assumed to be impermeable, so the theories cannot explain the fluid seepage effect during the hydraulic fracturing process [16]. However, in our modeling, the algorithm design takes the leakage into consideration. When fluid is pumped into the borehole, it can enter the neighbor domains instantaneously through the fluid pipes according to the cubic law [28].
Figure 6 shows the breakdown pressure values under different in-situ stress ratios respectively obtained from the simulated values and the theoretical values calculated according to Equation (6). The tensile strength of the model is 37 MPa which was obtained by the simulation of Brazilian test. It can be seen from Figure 6 that there is a certain deviation between the simulation values and theoretical values and the error is less than 15%. This is mainly because the theoretical formula only considers the influence of the in-situ stress and the rock tensile strength. The material in the theoretical model is uniform and impermeable in addition. However, the numerical simulation not only considers the leakage effect, but the breakdown pressure is also affected by many factors such as grain size, heterogeneity, and fluid velocity and viscosity. Since the error between the simulated values and the theoretical values is less than 15%, the hydraulic fracturing model used in this study is considered reasonable. Besides, based on this model, Zhou et al. [12,28] investigated the effects of fluid injection rate, in-situ stress ratio, and fluid viscosity on the hydraulic fracturing behaviors of homogeneous rock and laminated rock. The results showed good agreement with previous simulation and experimental results. These also validate the reliability of this optimized model.

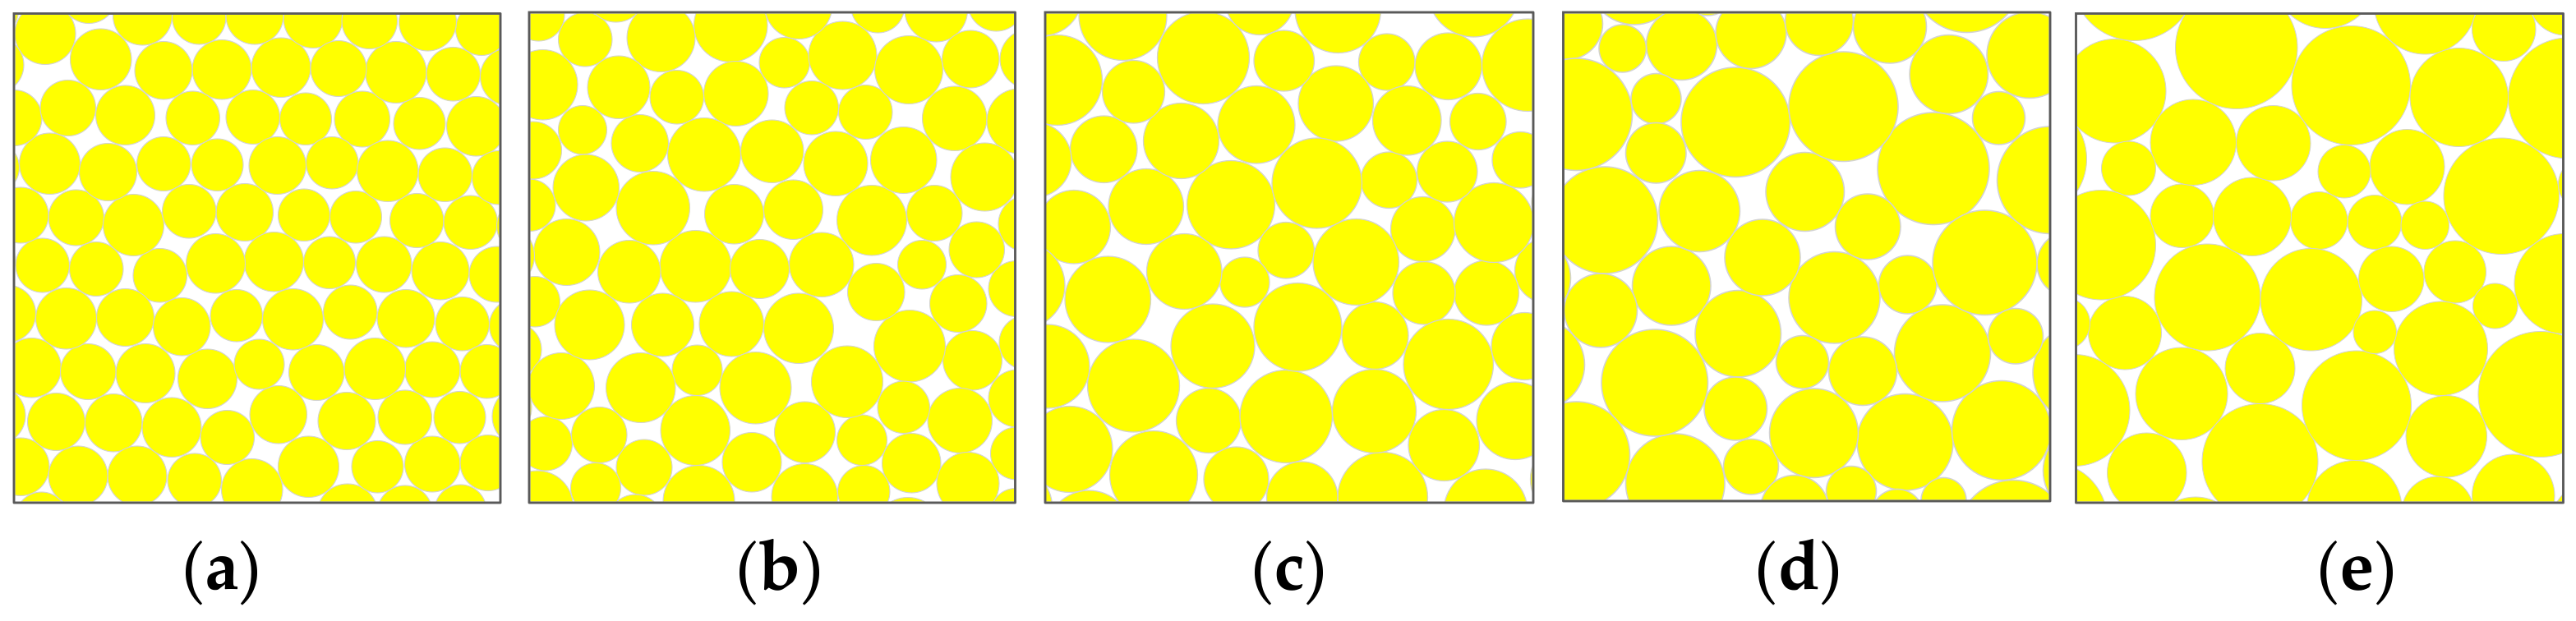
3.3. Modeling Scenarios

As shown in Table 2, two scenarios were set to investigate the influence of the grain size heterogeneity and in-situ stress on the hydraulic fracturing behaviors. The ratio of the maximum grain size to the minimum grain size (Rmax/Rmin) was used to describe the grain size heterogeneity quantitatively. The confining boundary conditions were controlled by changing the in-situ stress and stress ratio. The fluid injection rate was fixed at 1.0 × 10⁻⁴ m3/s and the other parameters were adopted from Table 1.
Scheme 1: This scheme was used to analyze the effects of grain size heterogeneity on hydraulic fracturing under different in-situ stress. The minimum grain size was kept at 2.5 mm and the influence of grain size heterogeneity was studied by changing the grain size ratio (Rmax/Rmin) from 1.2 to 3.0 (1.2, 1.5, 2.0, 2.5 and 3.0). The local view of models with five different grain size ratios are shown in Figure 7. Meanwhile, for evaluating the influences of in-situ stress, the maximum and minimum principal stresses were set equal, respectively 5 MPa, 10 MPa, 15 MPa and 20 MPa.
Scheme 2: This scheme was used to analyze the effects of grain size heterogeneity on hydraulic fracturing under different in-situ stress ratio. The grain size parameters were consistent with that of scenarios 1. The average in-situ stress was kept at 10 MPa and the in-situ stress ratios were changed from 1.0 to 4.0 (1.0, 2.0, 3.0 and 4.0), respectively 10.0:10.0, 13.3:6.7, 15.0:5.0 and 16.0:4.0.

4. Modeling Results and Discussions

Based on the optimized fluid-mechanically coupled model, the hydraulic fracturing processes of the above two scenarios were simulated. The influence of grain size heterogeneity under different in-situ stress conditions on the initiation, growth, and spatial distribution of the hydraulic fractures were analyzed.

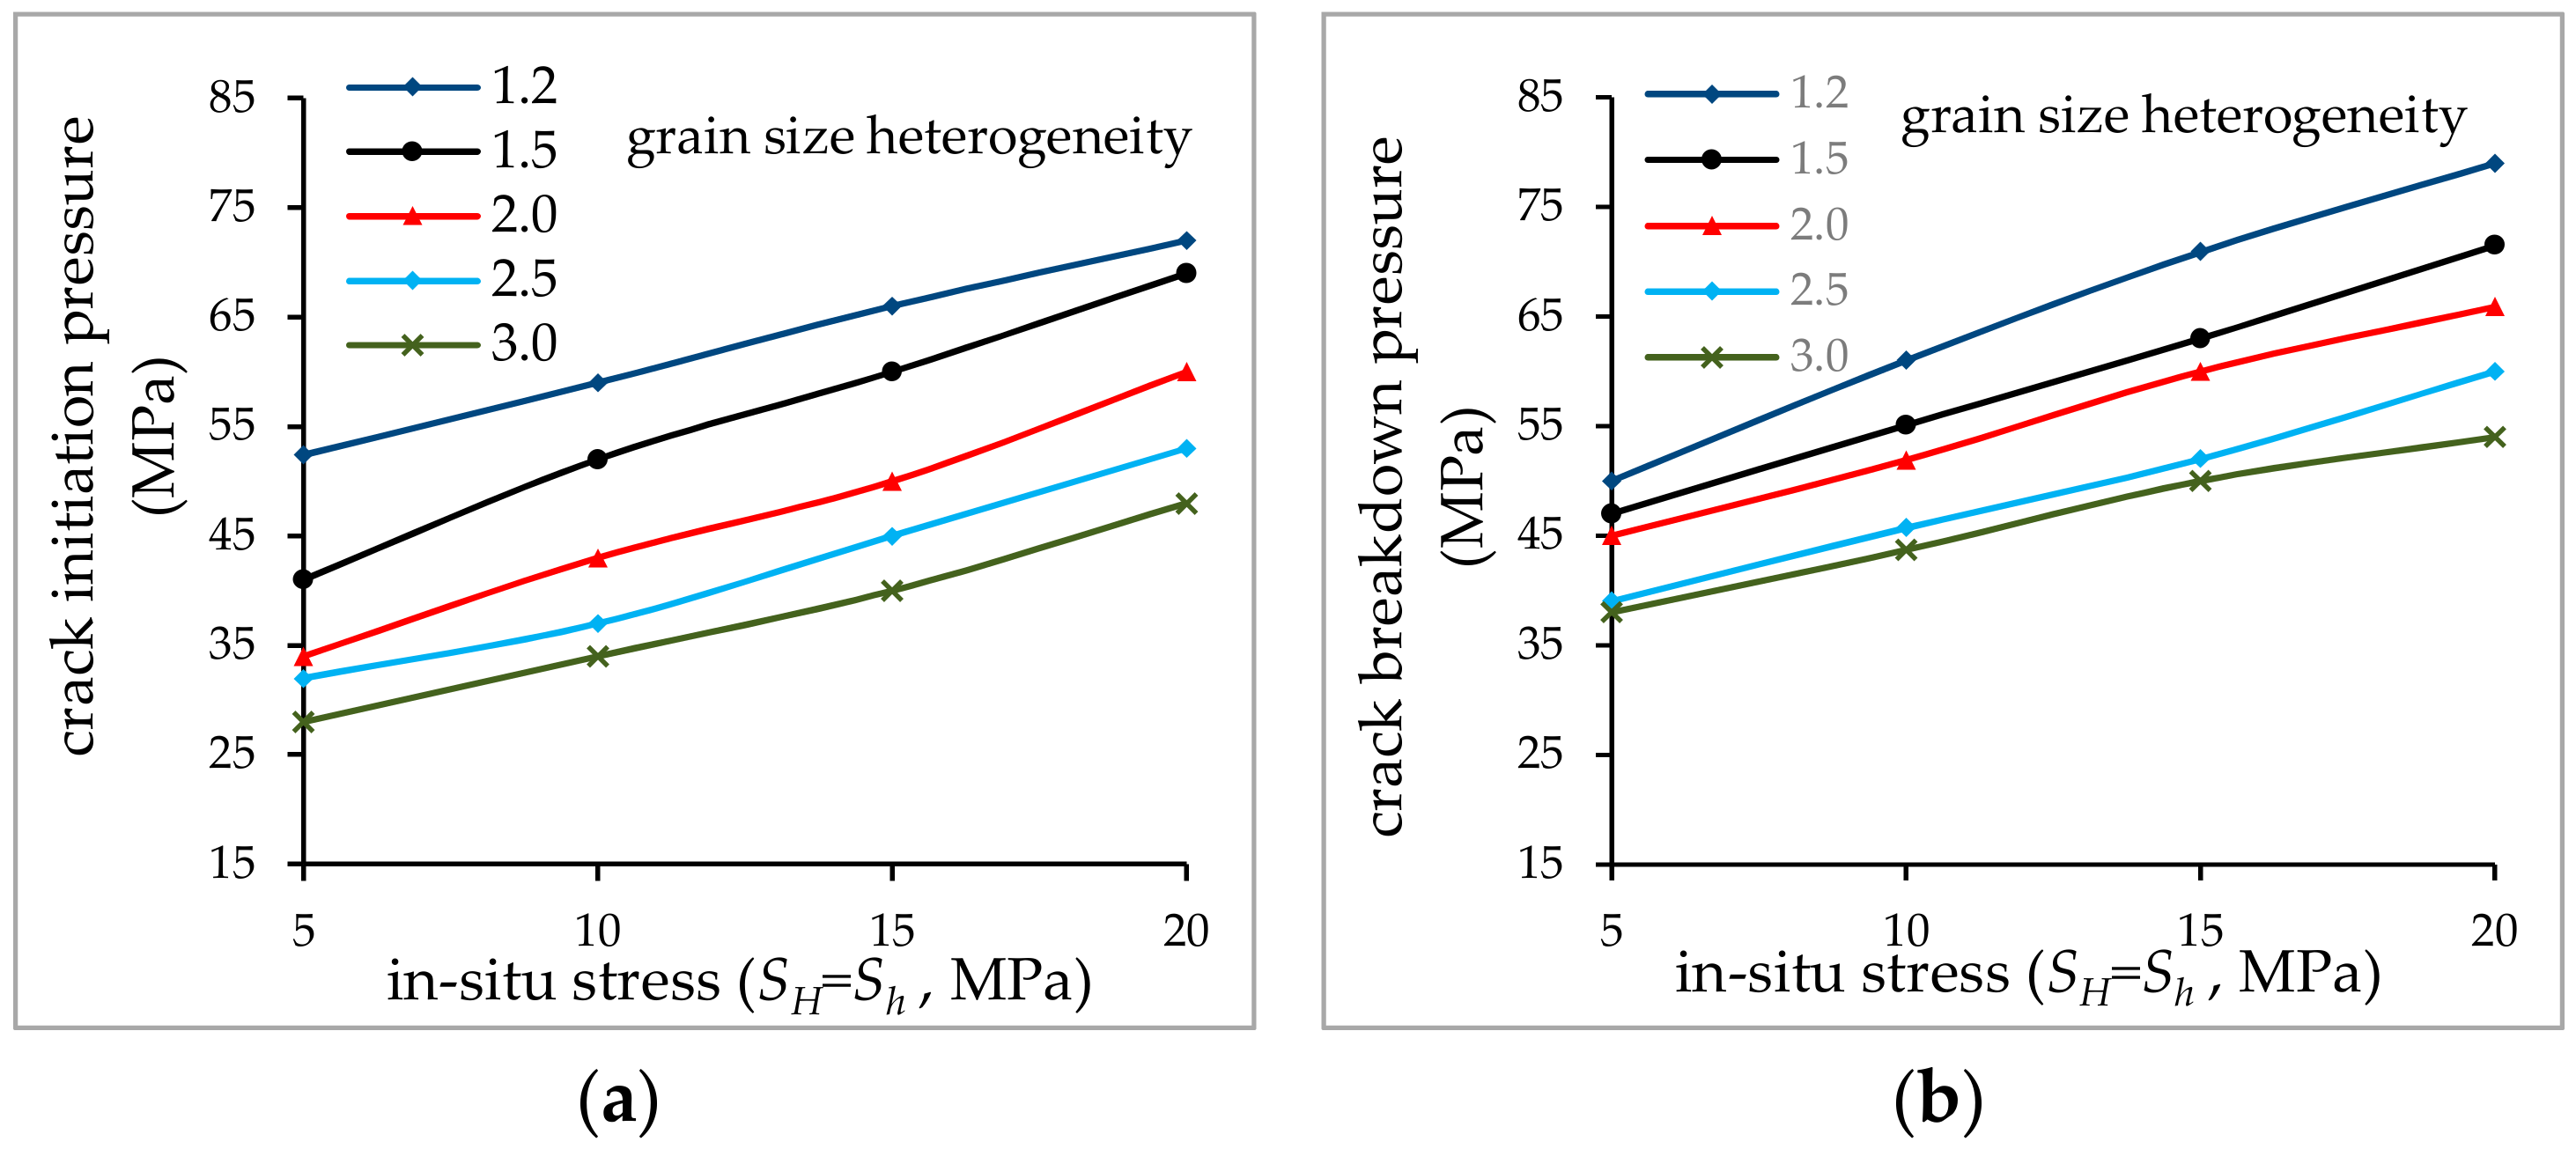
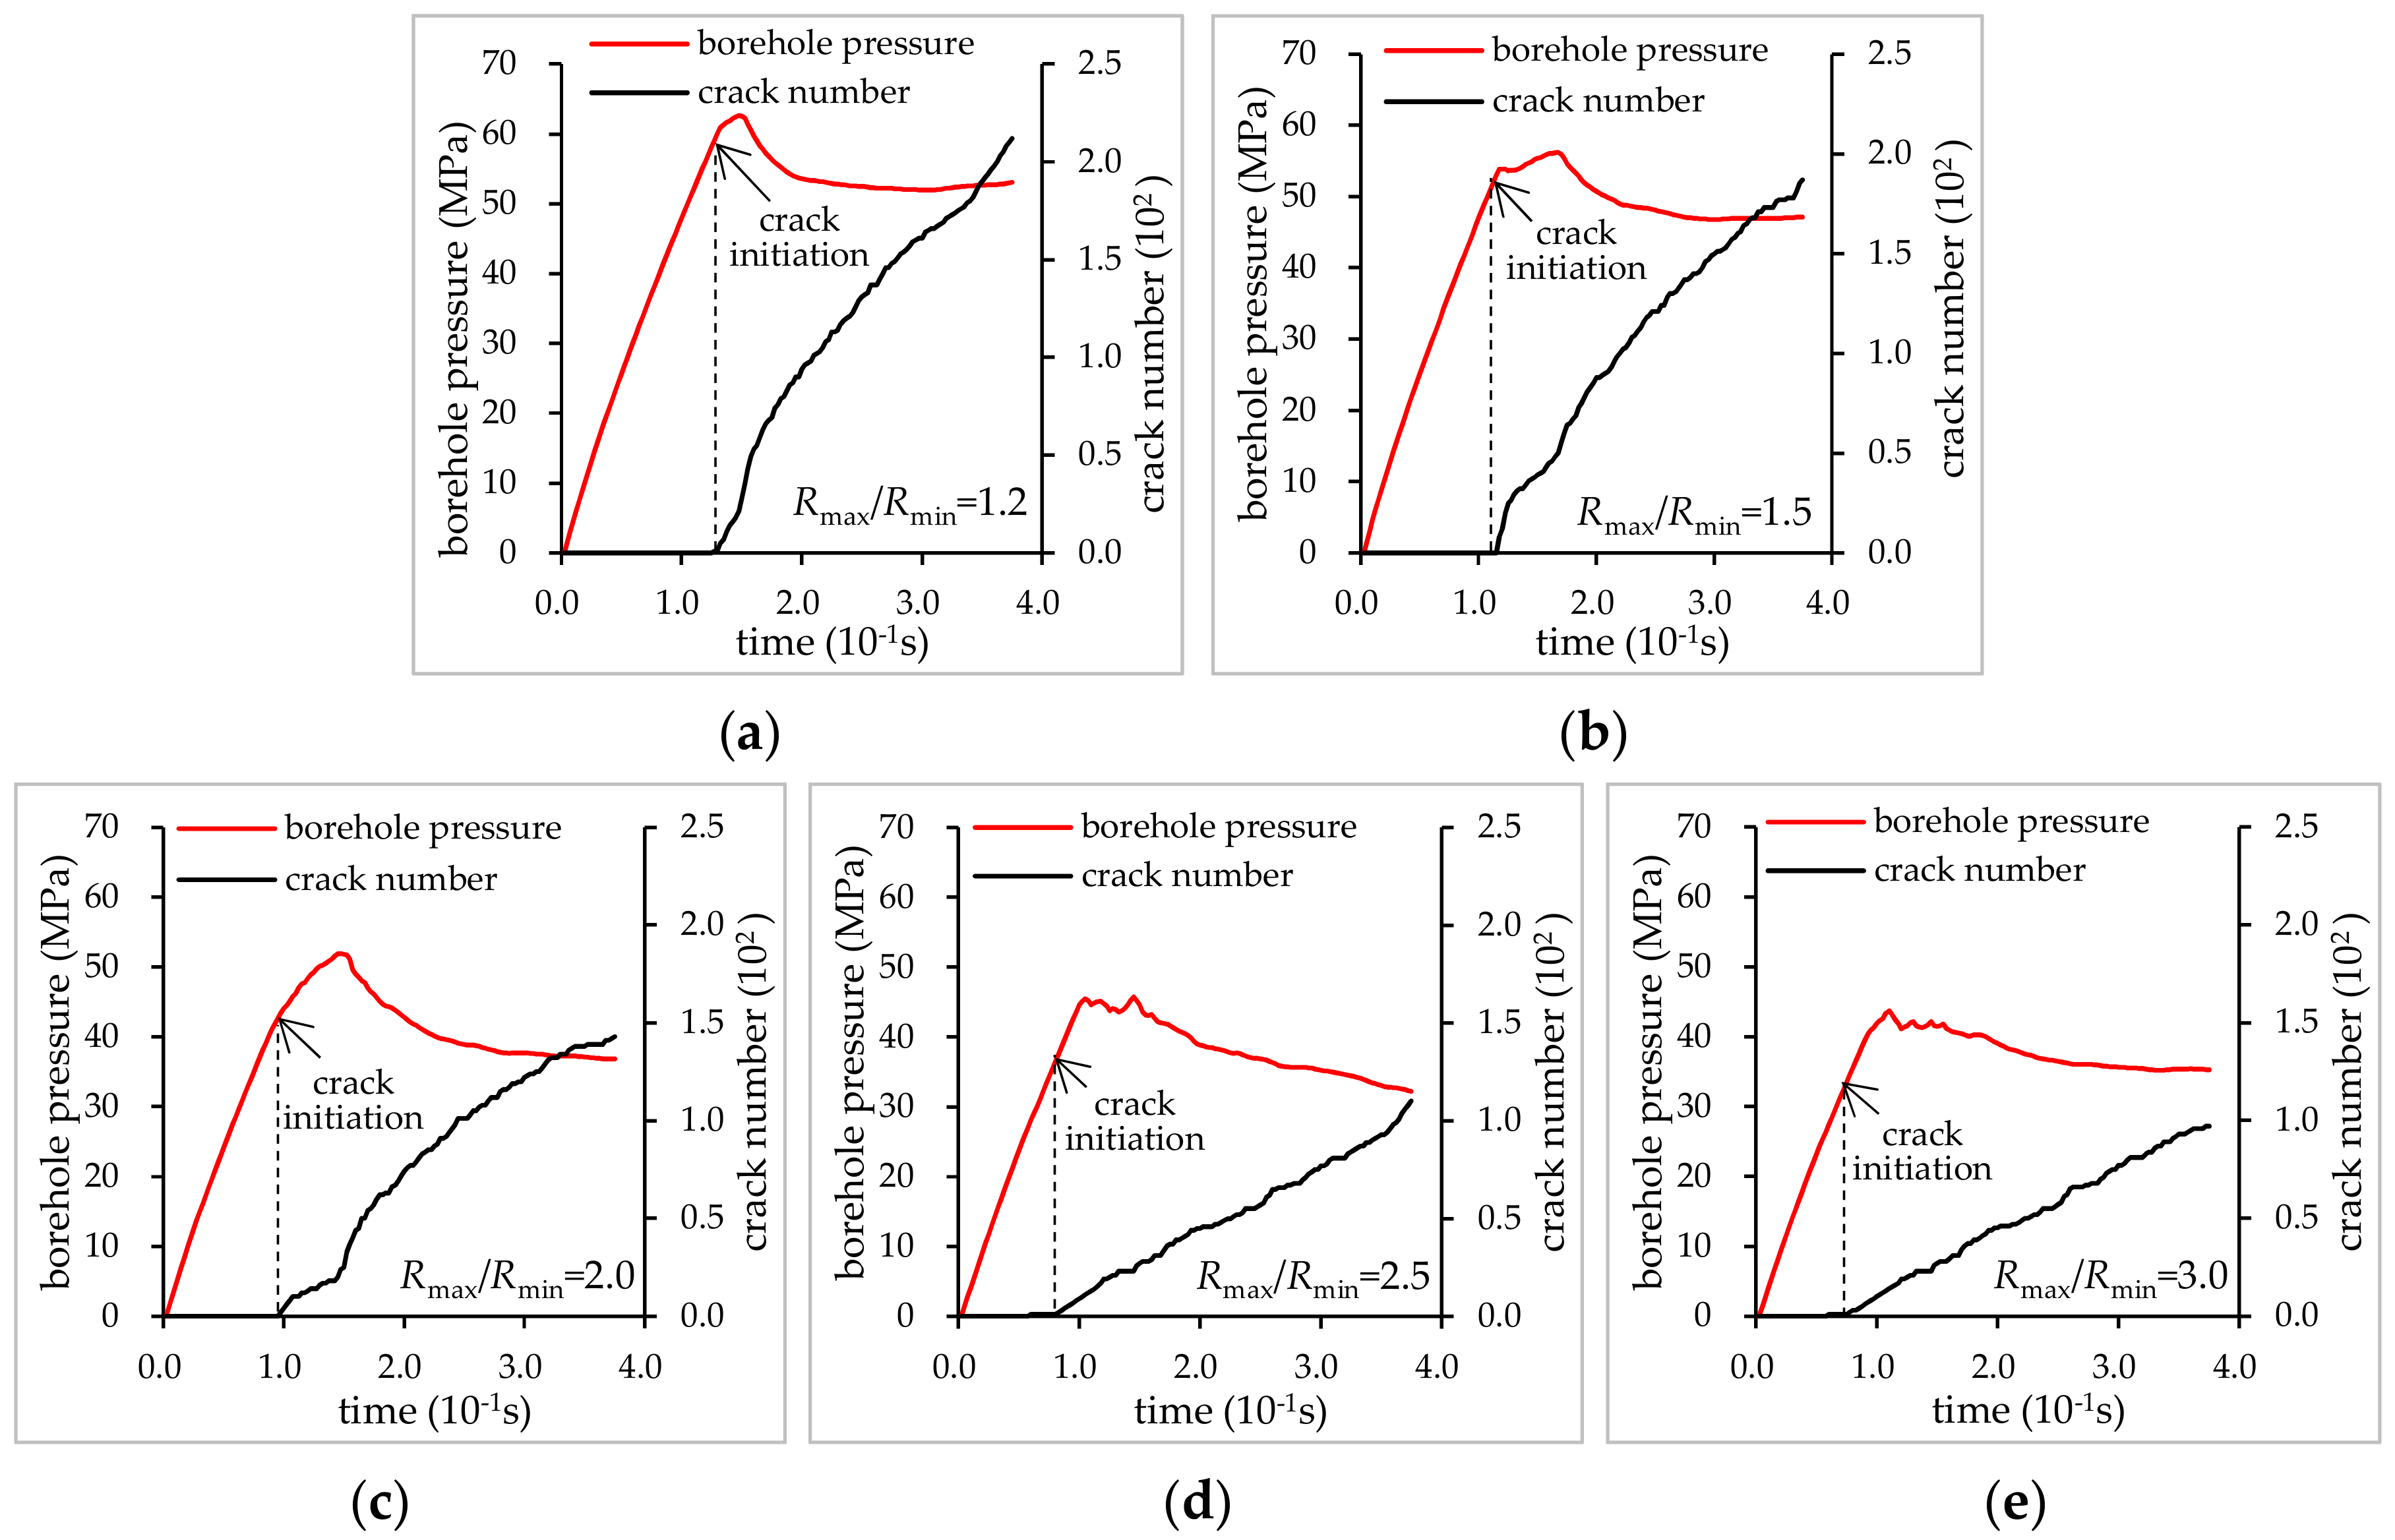
4.1. Effects of Grain Size Heterogeneity under Different In-Situ Stress

In Scheme 1, the maximum and minimum principal stresses are equal. When the in-situ stress changes from 5 MPa to 20 MPa, the results of simulated crack initiation and breakdown pressure under different grain size heterogeneity are as shown in Figure 8. It can be seen that when the grain size heterogeneity remains unchanged, the initiation and breakdown pressures increase with increasing in-situ stress. However, the initiation and breakdown pressures are gradually reduced with the increase of grain size heterogeneity under the same in-situ stress level and the reduced degree of breakdown pressure is closely related to the stress level. When the in-situ stress changes from 5 MPa to 20 MPa, the reductions of breakdown pressure are respectively 12 MPa, 17 MPa, 21 MPa, and 25 MPa with the grain size heterogeneity increasing from 1.2 to 3.0. This indicates that the reduction effect of grain size heterogeneity on the breakdown pressure becomes more obvious at higher in-situ stress.
Figure 9 shows the borehole pressure variation of numerical models with different grain size heterogeneity (taking the models with in-situ stress of 10 MPa as examples). As can be seen, the crack initiation and breakdown pressures decrease with increasing grain size heterogeneity. Besides, the times required to reach the crack initiation and breakdown pressures also decrease with the increase of the grain size heterogeneity. Many studies [33,34] have proved that local stress concentration caused by microscale heterogeneity may have significant effects on the growth of the microcracks. According to Lan et al. [14], the stress concentration of heterogeneous rock is earlier and more obvious under the same loading condition. Therefore, the initiation and breakdown of hydraulic cracks in the grain size heterogeneous model are earlier in the present simulations. As can also been seen in Figure 9, the pressure drops after reaching the breakdown pressure is different in the 5 models. When the borehole pressure drops to about 90% of the breakdown pressure, the time required for the grain size homogeneous model (Rmax/Rmin = 1.2) is 0.025 s, however, the time required for the model with grain size ratio of 3.0 is 0.09 s. Hence, compared with the grain size homogeneous models, the borehole pressure drops slowly after reaching the breakdown pressure and the borehole pressure–time curve fluctuates obviously in the models with higher grain size heterogeneity (2.5 and 3.0). During the process of hydraulic fracturing simulation, most fluid energy is stored in the borehole before crack propagation, and the energy accumulation at the inner borehole increases with fluid injection. Because the initiation and propagation of hydraulic fractures are earlier in the grain size heterogeneous model, the energy accumulation of fluid inner borehole is lower. After reaching the breakdown pressure, the fractures begin to propagate under the fluid pressure, meaning that the energy of the fluid inner borehole begins to release, so the borehole pressure begins to drop. Because the grain size homogeneous model (Rmax/Rmin = 1.2) has more branches of hydraulic fracture (Figure 10b), the fluid energy releases rapidly, so the borehole pressure drops rapidly. However, there are only two branches of hydraulic fracture in the grain size heterogeneous models (Figure 10b), hence, the borehole pressure drops slowly in models with grain size ratios of 2.5 and 3.0.
In addition, the simulation results show that the grain size heterogeneity also has a great impact on the spatial distribution of hydraulic fractures. The distributions of hydraulic fractures under different grain size heterogeneity and in-situ stress are shown in Figure 10. The cycle step and calculation time of all cases in Figure 10 are the same, since the fluid injection rate is fixed, so the injection volumes are also the same. As can be seen, with the increase of grain size heterogeneity, the branch number of hydraulic fractures decreases, indicating that hydraulic fracturing is easily initiated and tends to propagate in one direction in grain size heterogeneous models. Besides, the initiation position and the propagation direction of hydraulic fractures are random in the grain size homogeneous model (Rmax/Rmin = 1.2 and 1.5) due to the equal maximum and minimum principal stresses. However, the spatial distributions are almost the same in the models with higher grain size heterogeneity under different in-situ stress. Therefore, the uneven distribution of grain size plays a role in controlling the propagation path of hydraulic fractures when SH = Sh. It can also be seen from Figure 10 that with the increase of in-situ stress, the number of microcracks or the length of fractures is decreased in the models with same grain size heterogeneity. This means the rock is more difficult to fracture when the in-situ stress is higher, hence, the initiation and breakdown pressure increase with the increase of in-situ stress (Figure 8).
Figure 11 illustrates the close-up view of the hydraulic fractures. In the PFC model, hydraulic fractures propagate along the grain boundary. In the model with homogeneous grain size, due to the smaller grain size, the micro-cracks can easily spread forward along the grain interface, so the micro-cracks in the grain size homogeneous model (Rmax/Rmin = 1.2) tend to be flat (Figure 11a). With the increase of grain size heterogeneity, the number of large grains increases and it is easy to deflect when micro-cracks propagate along a large grain boundary, so the micro-cracks in the grain size heterogeneous model (Rmax/Rmin = 3.0) are more distorted (Figure 11b).

4.2. Effects of Grian Size Heterogeneity under Different In-Situ Stress Ratios

In Scheme 2, the average of the maximum and minimum principal stresses remains unchanged at 10 MPa and the influences of grain size heterogeneity on hydraulic fracturing behavior under different in-situ stress ratios are analyzed. Figure 12 illustrates the effects of in-situ stress ratio and grain size heterogeneity on the crack initiation and breakdown pressures. It can be seen that under the same in-situ stress ratio conditions, the crack initiation and breakdown pressures decrease with the increase of grain size heterogeneity. As shown in Figure 12a, when the grain size heterogeneity is 2.0, 2.5 and 3.0, the crack initiation pressure seems to not be affected by the in-situ stress ratio. However, when the grain size heterogeneity is 1.2 and 1.5, the crack initiation pressure decreases with the increasing in-situ stress ratio. This indicates that the in-situ stress ratio has little effect on crack initiation pressure in the grain size heterogeneous model, but it does have a significant effect in the grain size homogeneous model. As shown in Figure 12b, with the in-situ stress ratio increasing, the crack breakdown pressure decreases slightly.
The simulation results of Scheme 2 also show that the in-situ stress ratio greatly affects the extension direction of hydraulic fractures. According to the simulation results of Scheme 1, when the maximum and minimum principal stresses are equal (SH/Sh = 1), the initiation position and the propagation direction of hydraulic fractures are random and the number of hydraulic fracture branches is affected by grain size heterogeneity (Figure 10). However, when the in-situ stress ratio is larger than 1, as shown in Figure 13, the hydraulic fractures basically expand along the direction of the maximum principal stress. As previous research illustrated [22], the direction of maximum in-situ stress is the preferred direction for fracture propagation during deep hydraulic fracturing. Therefore, the number of hydraulic fracture branches is almost unaffected by grain size heterogeneity, however, grain size heterogeneity does have a significant effect on the initiation positions and the micro morphology of the fractures. In the grain size homogeneous model (Rmax/Rmin = 1.2), the hydraulic fractures are symmetrically distributed on both sides of the borehole and the fractures are relatively flat. In the grain size heterogeneous models, the fractures on both sides of the borehole are asymmetric and distorted. During the expansion process, the hydraulic fractures will deflect locally but the macroscopic expansion direction will not change.

5. Conclusions

Based on the modified fluid-mechanically coupled algorithm in PFC2D, the influences of grain size heterogeneity and in-situ stress on the initiation, growth, and spatial distribution of hydraulic fractures were discussed in this study. Two schemes totaling 36 cases of hydraulic fracturing simulations with different grain size heterogeneity and in-situ stress were performed. The main conclusions are as follows:
(1)
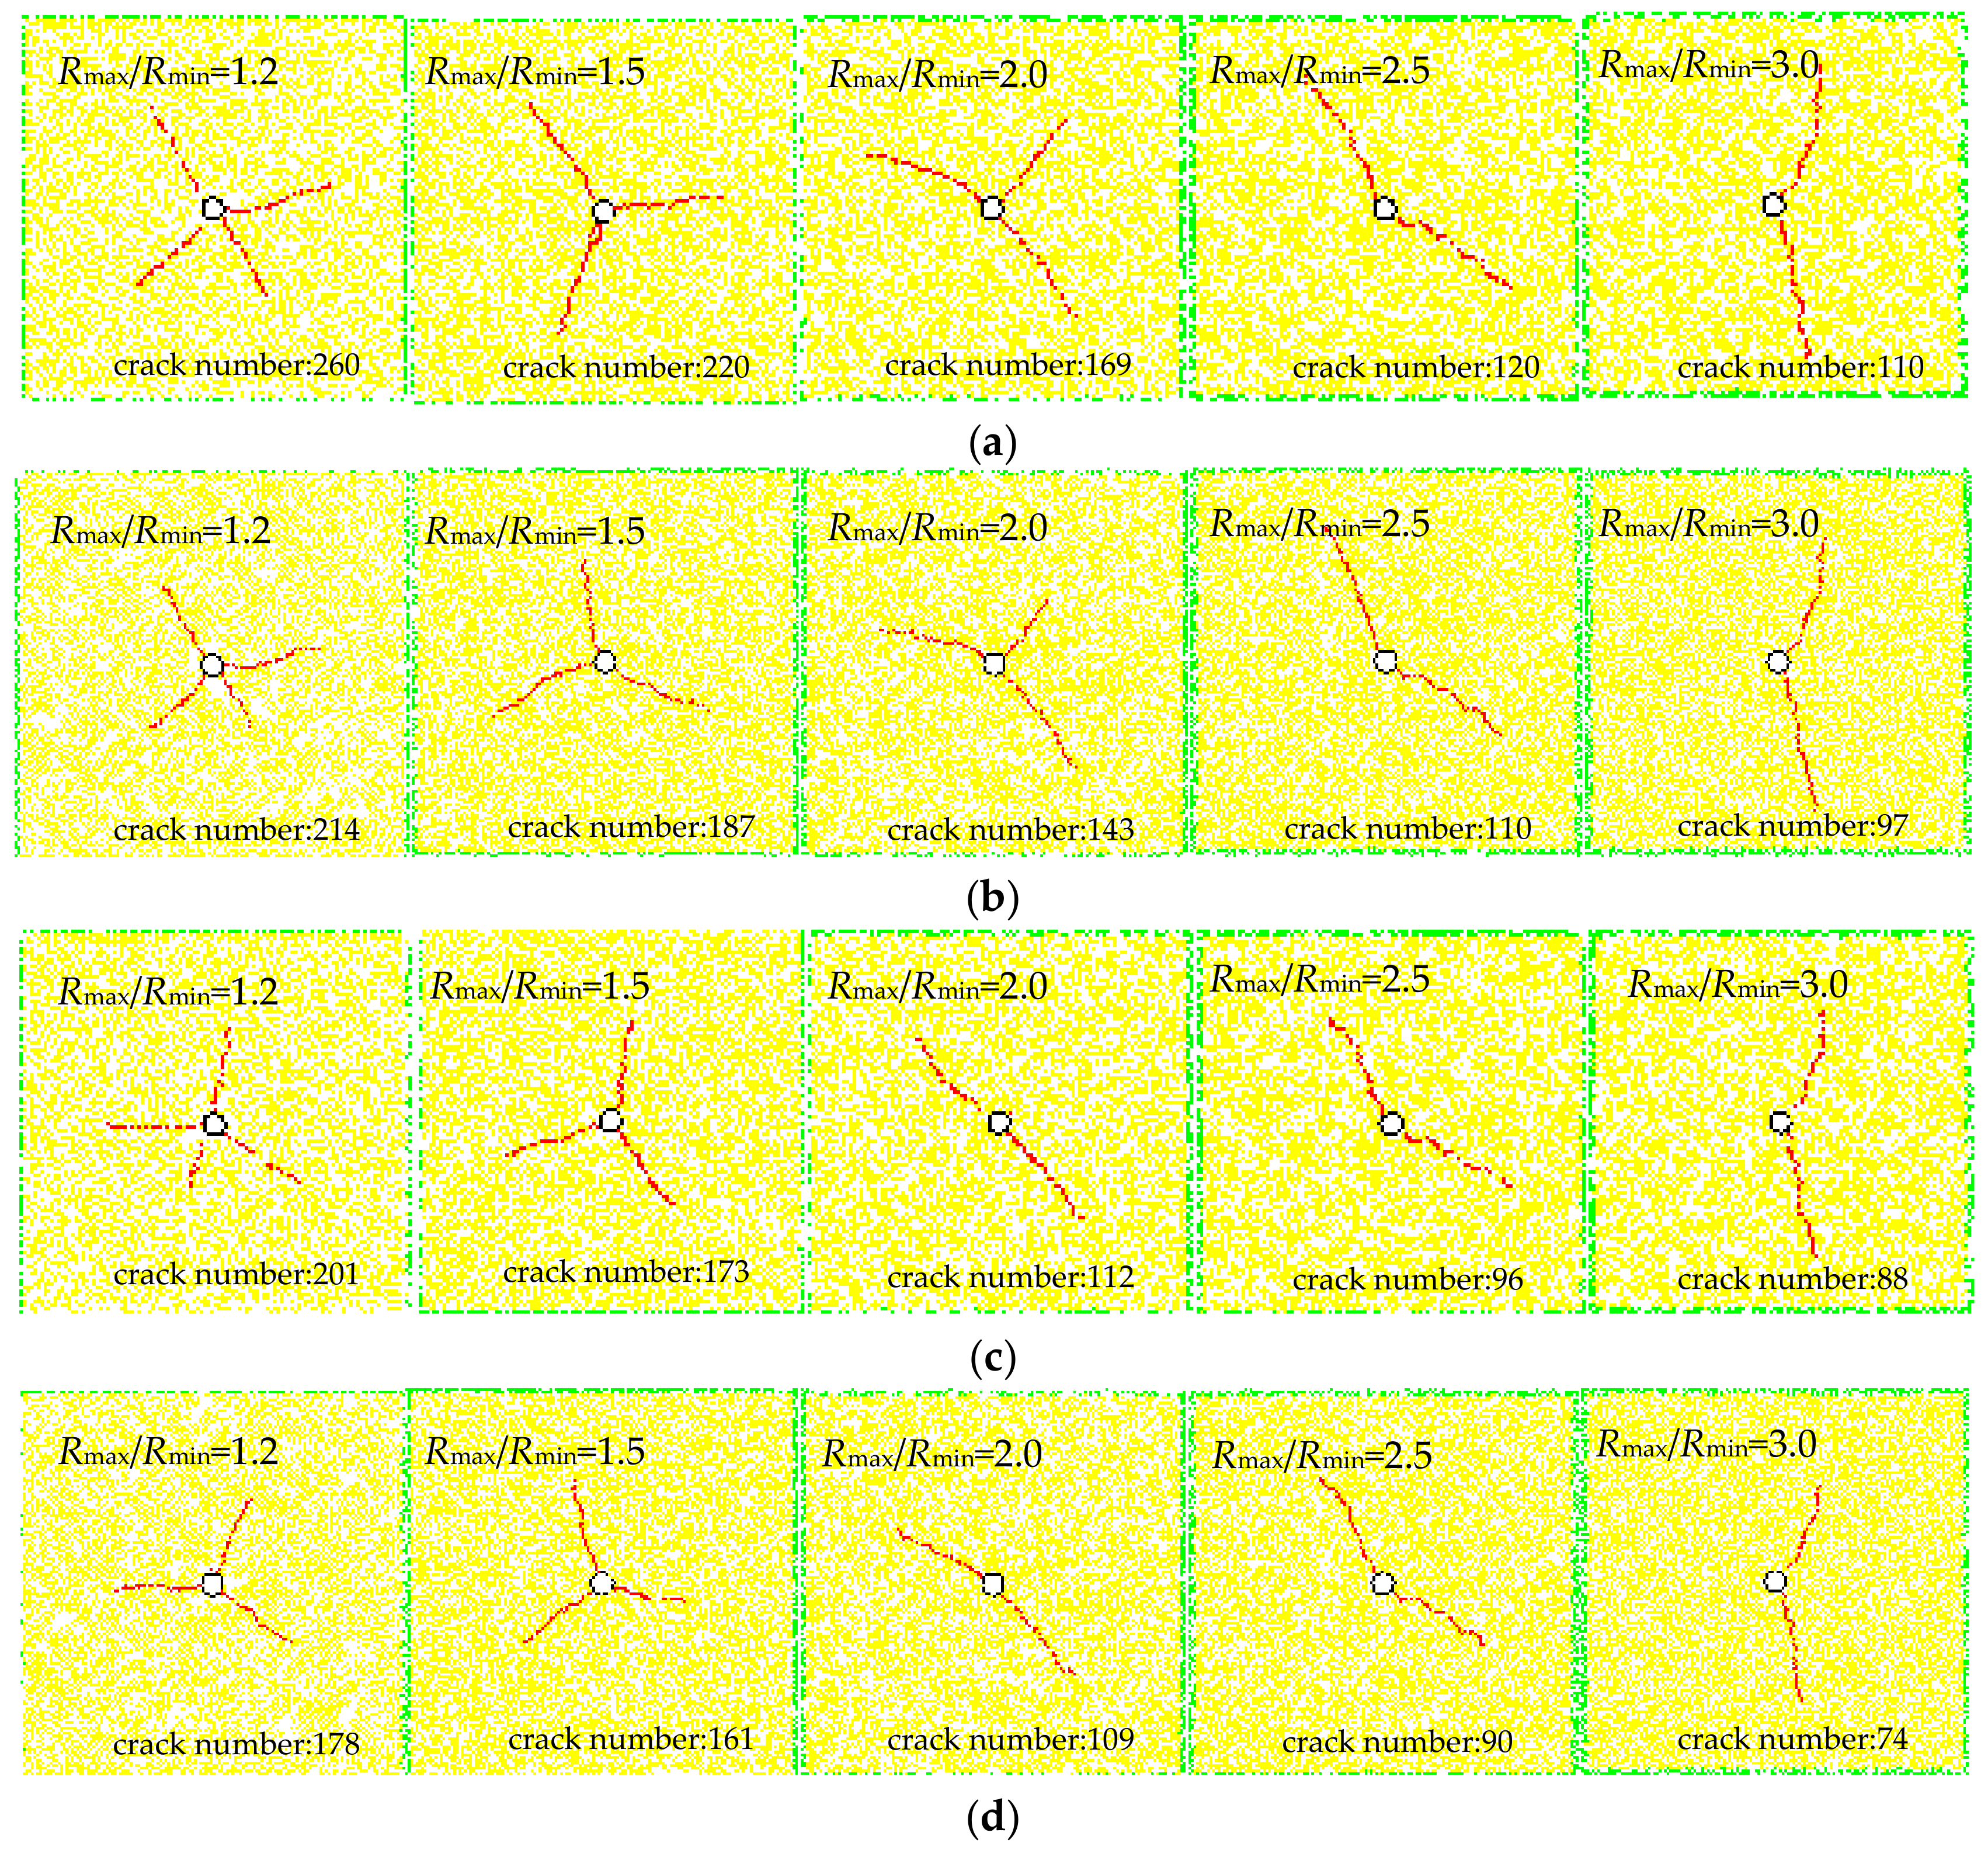
Grain size heterogeneity significantly affects the behavior of rock hydraulic fracturing. Under the same in-situ stress conditions, the initiation and breakdown pressures decrease with increasing grain size heterogeneity. In the models with higher grain size heterogeneity, the borehole pressure decreases slowly and fluctuates after reaching the breakdown pressure.
(2)
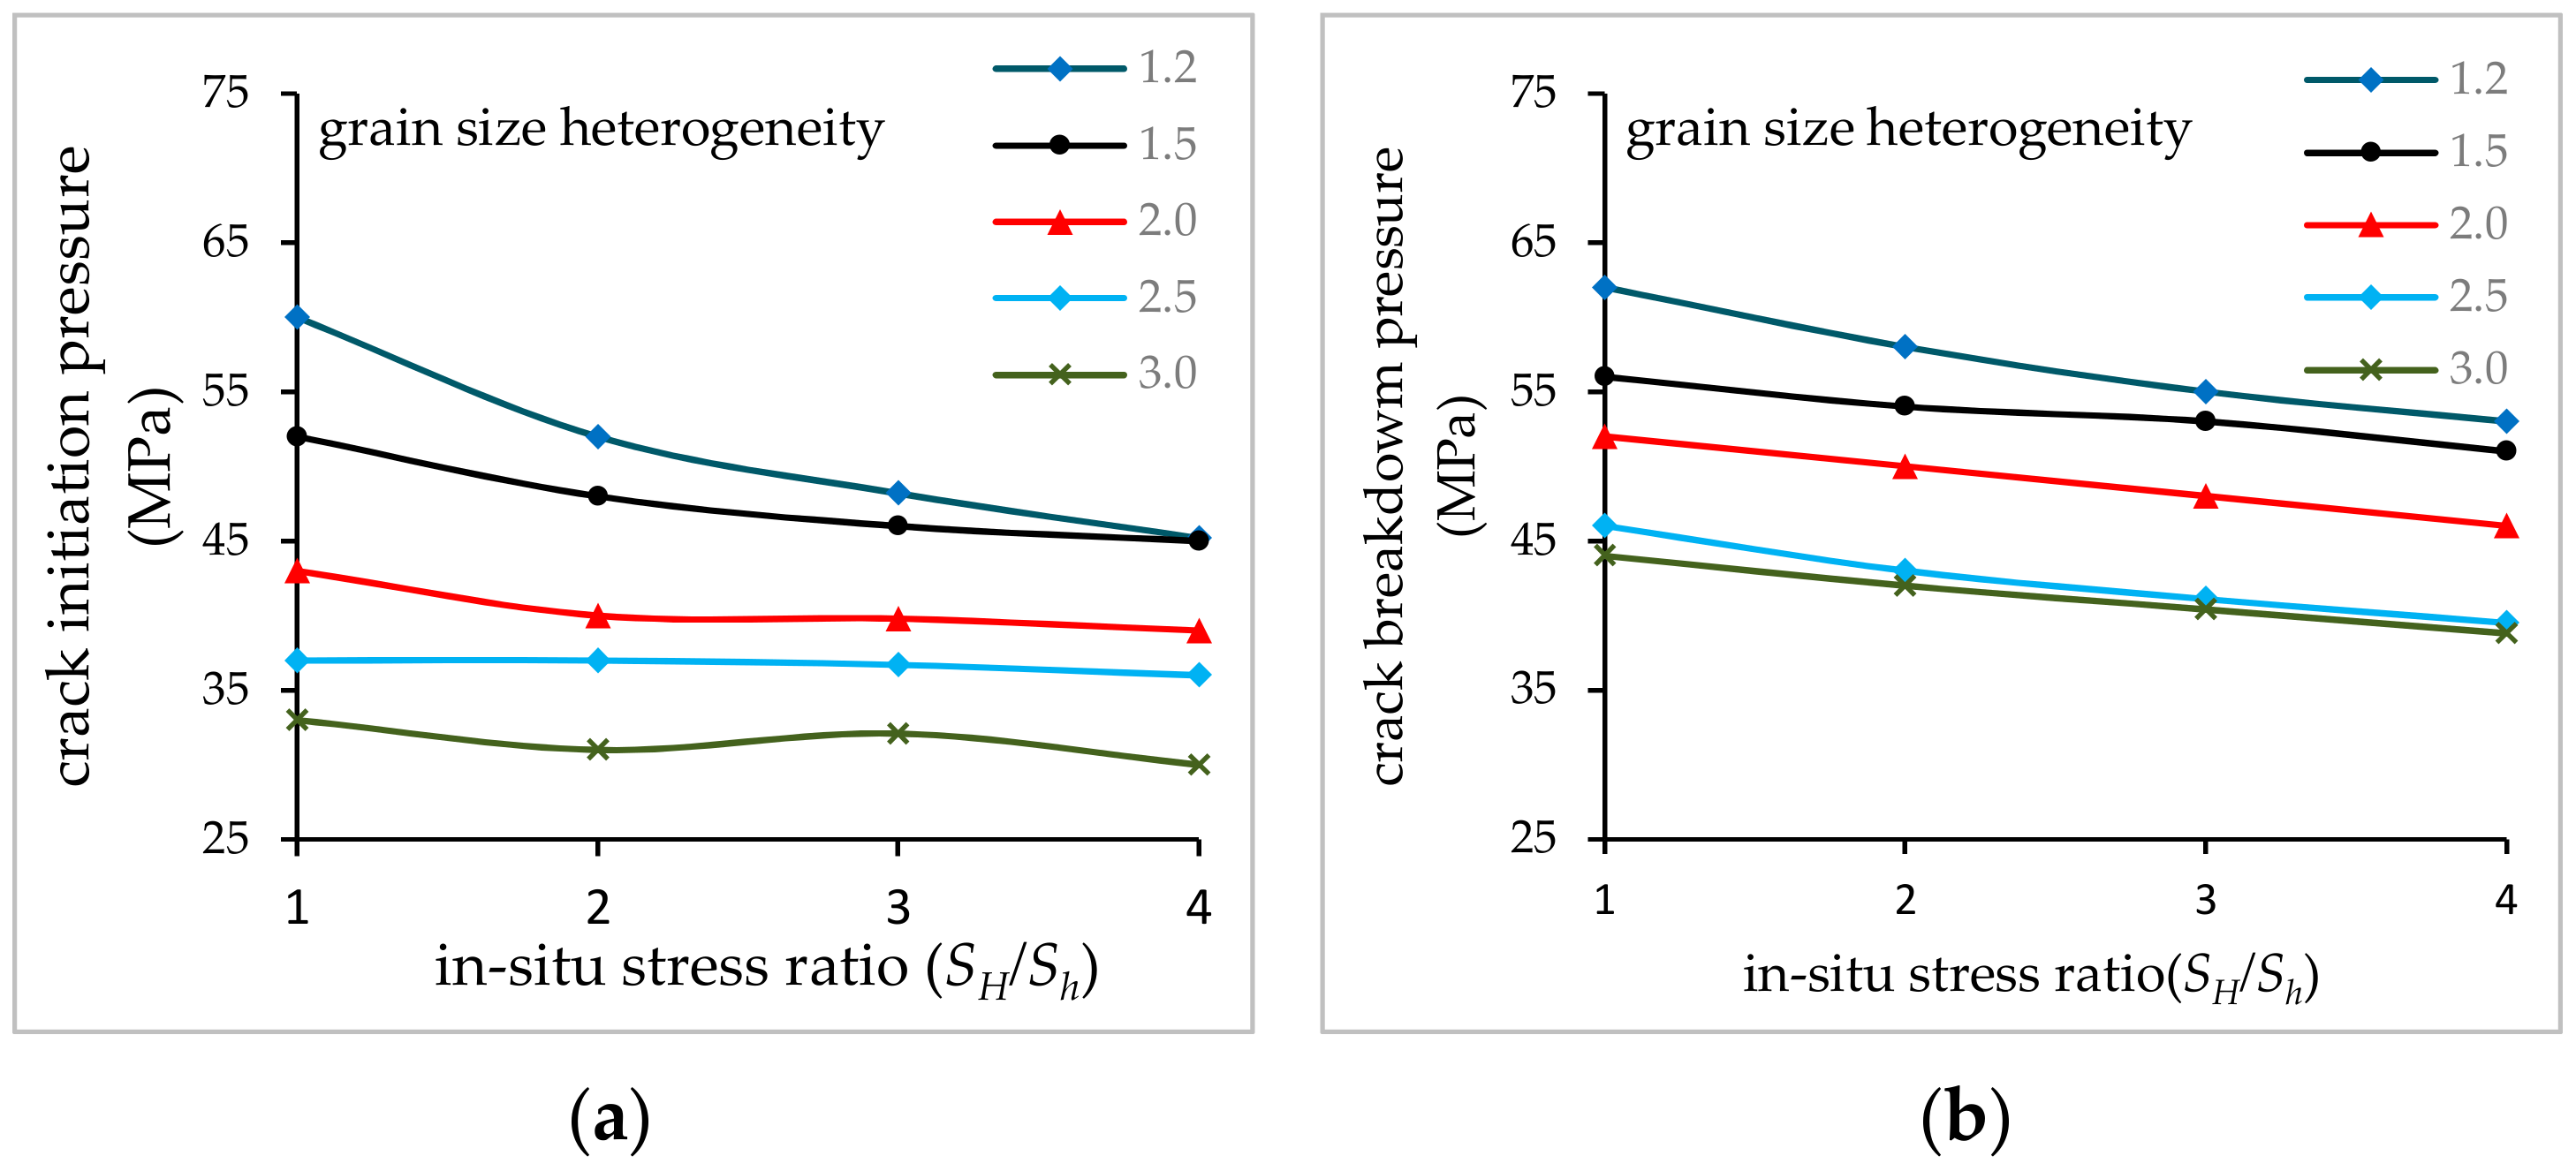
The in-situ stress also has a great effect on the critical pressures of hydraulic fracturing. With increasing in-situ stress, the initiation and breakdown pressures increase, and the reduction effect of grain size heterogeneity on the breakdown pressure becomes more obvious.
(3)
Under the condition that the average value of the maximum and minimum principal stresses are constant, the breakdown pressure decreases with the increase of in-situ stress ratio, however, the variation of crack initiation pressure with in-situ stress ratio is related to the grain size heterogeneity. For models with homogeneous grain size, the crack initiation pressure decreases with increasing in-situ stress ratio, but in grain size heterogeneous models, the crack initiation pressure is almost unaffected by the in-situ stress ratio.
(4)
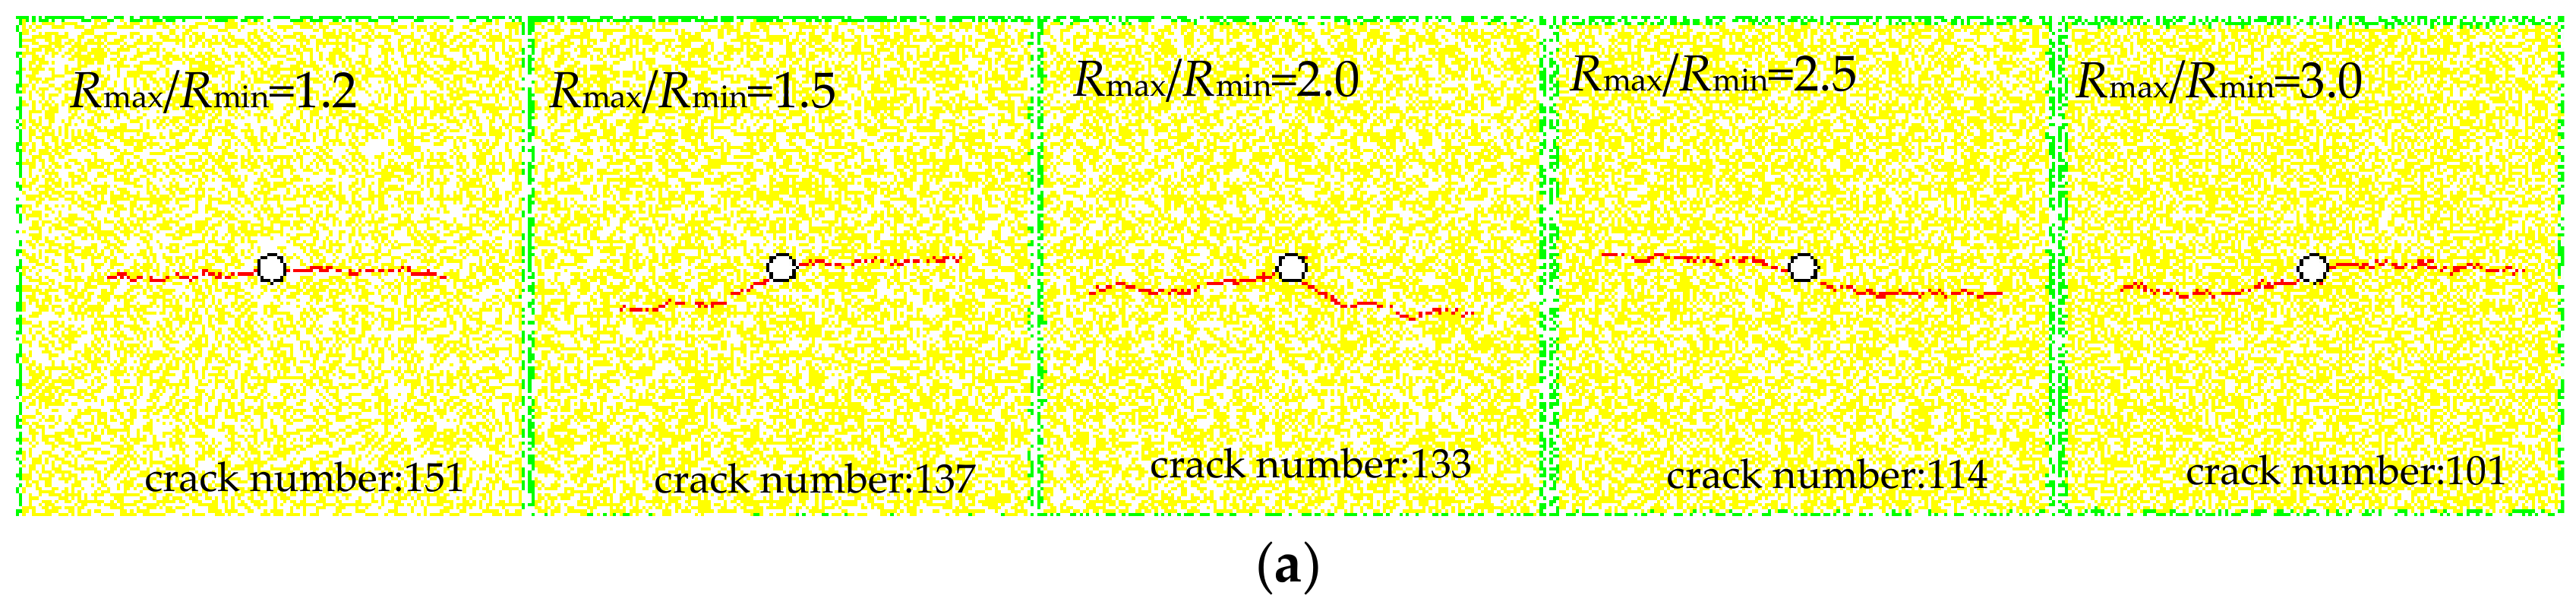
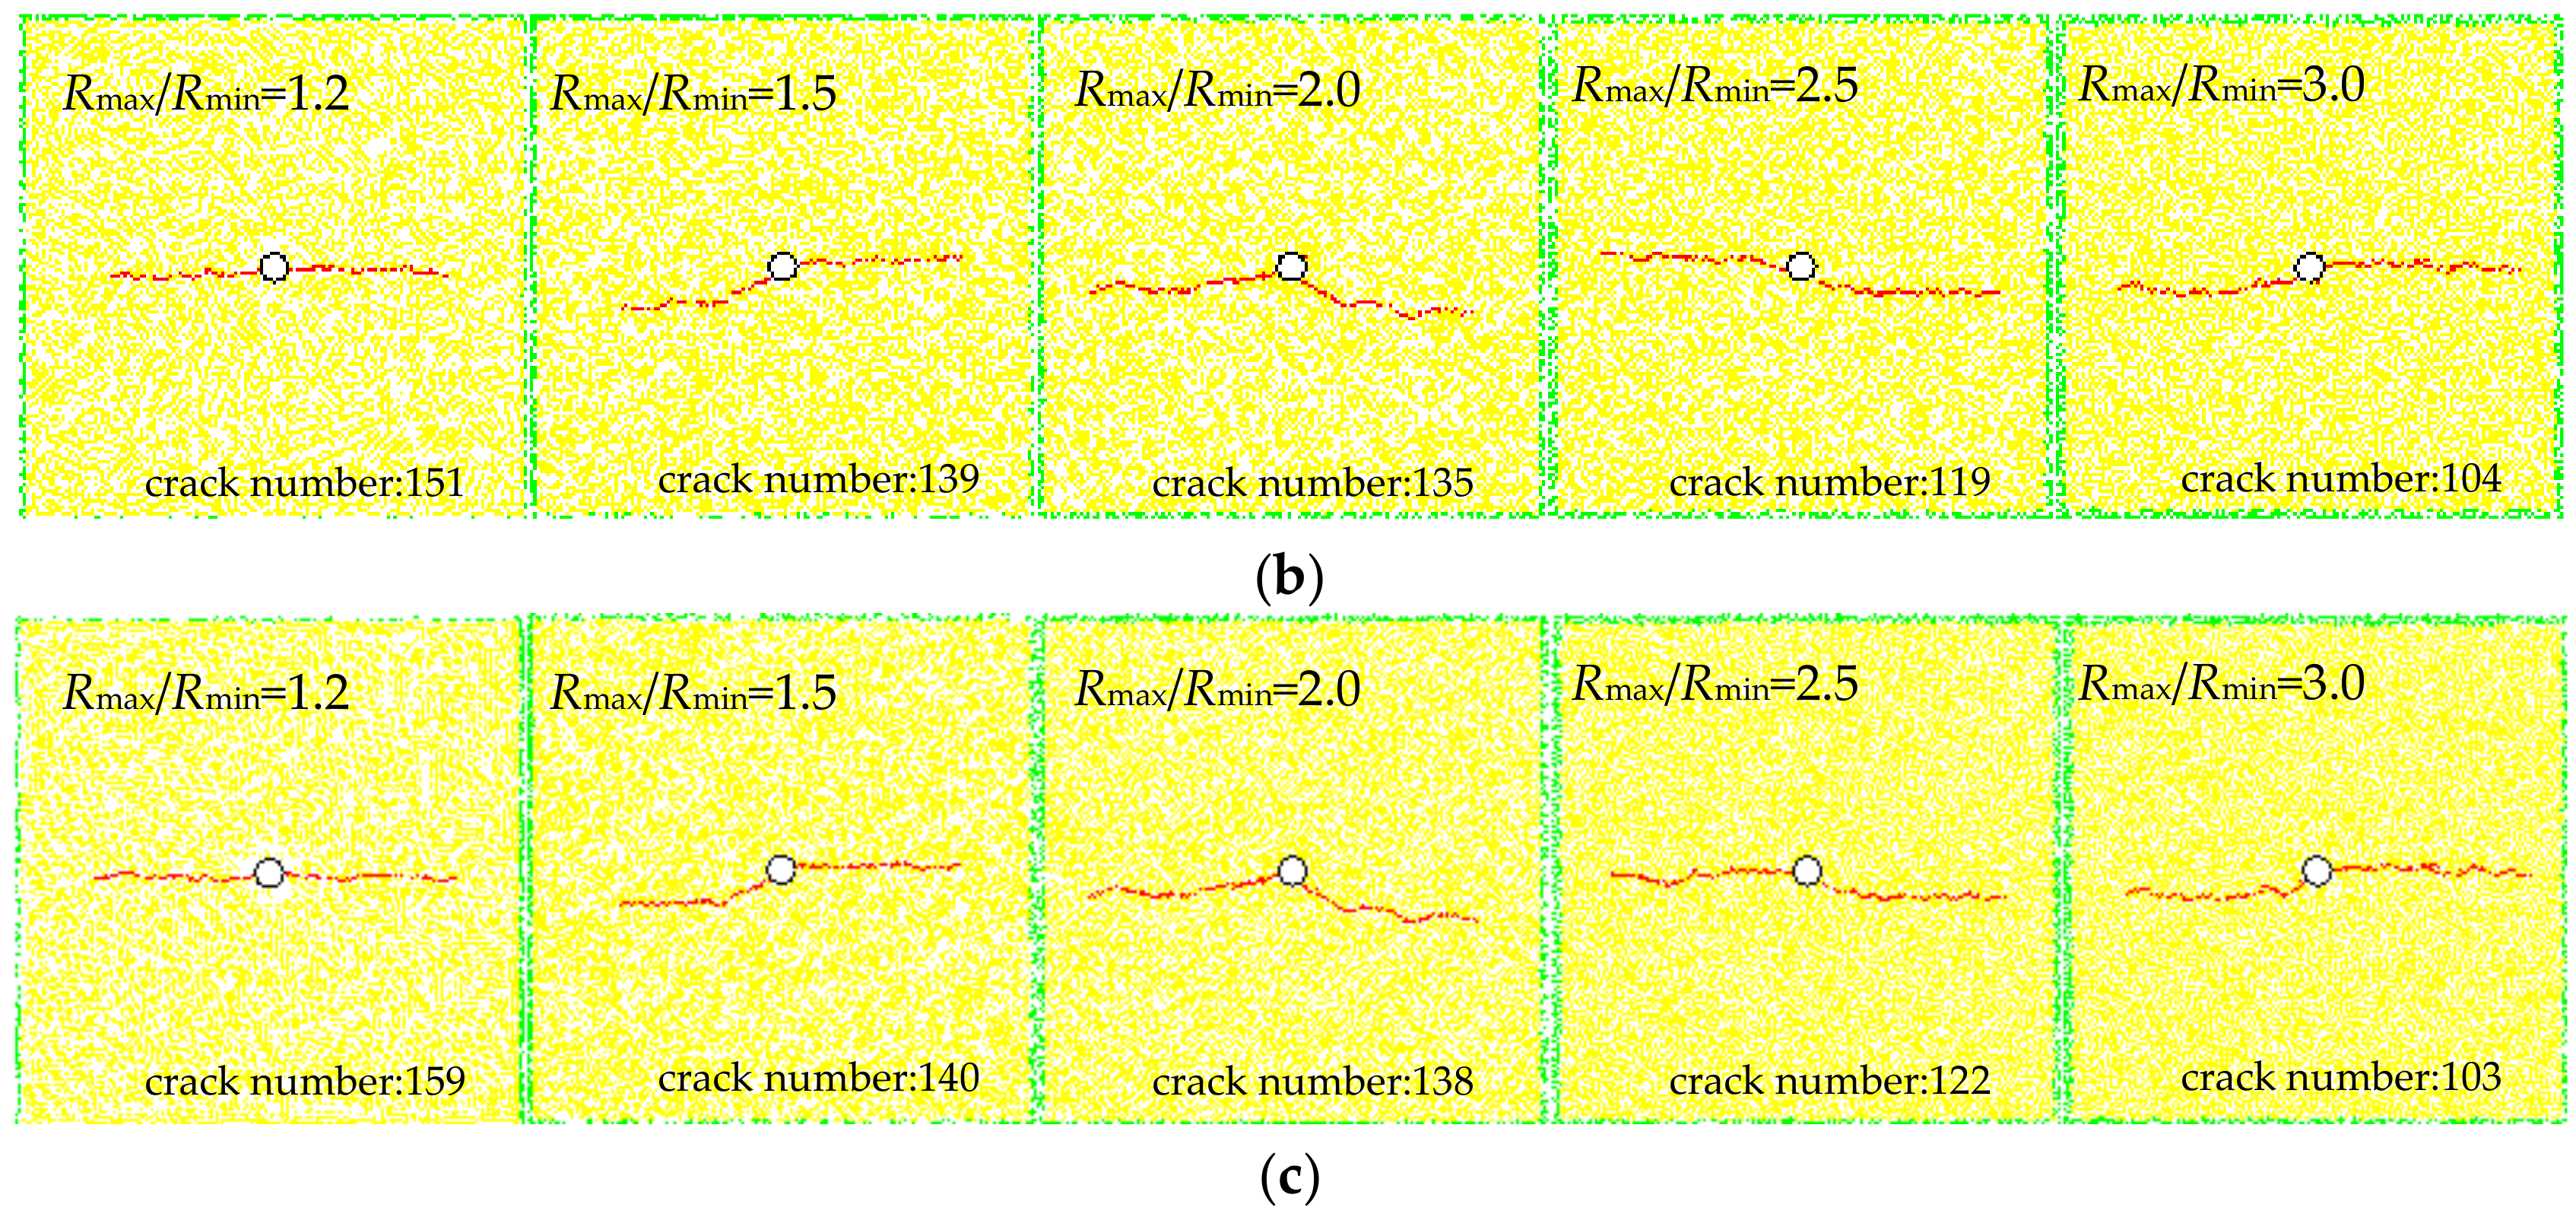
The in-situ stress and the grain size heterogeneity have a great influence on the spatial distribution and micromorphology of hydraulic fractures. When the stress ratio is greater than 1, the hydraulic fractures propagate basically along the direction of maximum principal stress. With the decrease of grain size heterogeneity, the hydraulic fractures on both sides of the borehole become more symmetrical and straight. When the stress ratio is 1, the initiation position and extension direction of hydraulic fractures are random. The grain size homogeneous models have more branches of hydraulic fractures.

Author Contributions

Z.H. and L.Z. designed the theoretical framework; J.Z. wrote the basic code of the program; Z.H. designed the numerical simulation and wrote the paper.

Acknowledgments

This research is supported by funding from the National Natural Science Foundation of China (Grant Nos. 41572312, 41672321 and 41502307) and the Strategic Priority Research Program of the Chinese Academy of Sciences (Grant No. XDB10050202) and the China Postdoctoral Science Foundation (Grants 2018M630204).

Conflicts of Interest

The authors declare no conflict of interest.

References

  1. Montgomery, C.T.; Smith, M.B. Hydraulic Fracturing: History of an Enduring Technology. J. Pet. Technol. 2010, 62, 26–40. [Google Scholar] [CrossRef]
  2. Yokoyama, T.; Sano, O.; Hirata, A.; Ogawa, K.; Nakayama, Y.; Ishida, T.; Mizuta, Y. Development of borehole-jack fracturing technique for in situ stress measurement. Int. J. Rock Mech. Min. 2014, 67, 9–19. [Google Scholar] [CrossRef]
  3. Osborn, S.G.; Vengosh, A.; Warner, N.R.; Jackson, R.B. Methane contamination of drinking water accompanying gas-well drilling and hydraulic fracturing. In Proceedings of the National Academy of Sciences of the Unite States of America, Washington, DC, USA, 17 May 2011. [Google Scholar]
  4. Hossain, M.M.; Rahman, M.K. Numerical simulation of complex fracture growth during tight reservoir stimulation by hydraulic fracturing. J. Pet. Sci. Eng. 2008, 60, 86–104. [Google Scholar] [CrossRef]
  5. Ishida, T.; Chen, Q.; Mizuta, Y.; Roegiers, J.C. Influence of Fluid Viscosity on the Hydraulic Fracturing Mechanism. J. Energy Resour. Technol. 2004, 126, 190–200. [Google Scholar] [CrossRef]
  6. Zhou, J.; Chen, M.; Jin, Y.; Zhang, G.Q. Analysis of fracture propagation behavior and fracture geometry using a tri-axial fracturing system in naturally fractured reservoirs. Int. J. Rock Mech. Min. 2008, 45, 1143–1152. [Google Scholar] [CrossRef]
  7. Eshiet, K.I.; Sheng, Y.; Ye, J. Microscopic modelling of the hydraulic fracturing process. Environ. Earth Sci. 2013, 68, 1169–1186. [Google Scholar] [CrossRef]
  8. Zhang, L.; Zhou, J.; Han, Z. Hydraulic fracturing process by using a modified two-dimensional particle flow code-case study. Prog. Comput. Fluid Dyn. Int. J. 2017, 17, 13. [Google Scholar] [CrossRef]
  9. Al-Busaidi, A.; Hazzard, J.F.; Young, R.P. Distinct element modeling of hydraulically fractured Lac du Bonnet granite. J. Geophys. Res. Solid Earth 2005, 110. [Google Scholar] [CrossRef] [Green Version]
  10. Warpinski, N.R.; Teufel, L.W. Influence of geologic discontinuities on hydraulic fracture propagation. J. Pet. Technol. 1984, 39, 209–220. [Google Scholar] [CrossRef]
  11. Gale, J.F.W.; Reed, R.M.; Holder, J. Natural fractures in the Barnett Shale and their importance for hydraulic fracture treatments. AAPG Bull. 2007, 91, 603–622. [Google Scholar] [CrossRef]
  12. Zhou, J.; Zhang, L.Q.; Pan, Z.J.; Han, Z.H. Numerical investigation of fluid-driven near-borehole fracture propagation in laminated reservoir rock using PFC 2D. J. Nat. Gas Sci. Eng. 2016, 36, 719–733. [Google Scholar] [CrossRef]
  13. He, J.M.; Lin, C.; Li, X.; Wan, X.L. Experimental Investigation of Crack Extension Patterns in Hydraulic Fracturing with Shale, Sandstone and Granite Cores. Energies 2016, 9, 1018. [Google Scholar] [CrossRef]
  14. Lan, H.X.; Martin, C.D.; Hu, B. Effect of heterogeneity of brittle rock on micromechanical extensile behavior during compression loading. J. Geophys. Res. Sol. Earth 2010, 115, B01202. [Google Scholar] [CrossRef]
  15. Shimizu, H.; Murata, S.; Ishida, T. The distinct element analysis for hydraulic fracturing in hard rock considering fluid viscosity and particle size distribution. Int. J. Rock Mech. Min. Sci. 2011, 48, 712–727. [Google Scholar] [CrossRef]
  16. Yang, T.H.; Tham, L.G.; Tang, C.A.; Liang, Z.Z.; Tsui, Y. Influence of Heterogeneity of Mechanical Properties on Hydraulic Fracturing in Permeable Rocks. Rock Mech. Rock Eng. 2004, 37, 251–275. [Google Scholar] [CrossRef]
  17. Vaselli, M. 3D imaging of fracture propagation using synchrotron X-ray microtomography. Earth Planet. Sci. Lett. 2009, 286, 285–291. [Google Scholar] [CrossRef]
  18. Matsunaga, I.; Kobayashi, H.; Sasaki, S.; Ishida, T. Studying hydraulic fracturing mechanism by laboratory experiments with acoustic emission monitoring. Int. J. Rock Mech. Min. Sci. Geomech. Abstr. 1993, 30, 909–912. [Google Scholar] [CrossRef]
  19. Chen, Q.; Ishida, T.; Sasaki, S.; Matsunaga, I.; Mizuta, Y. Influence of Grain Size of Granite on Hydraulic Fracturing Mechanism. Doboku Gakkai Ronbunshu 1998, 589, 179–194. [Google Scholar] [CrossRef]
  20. Ishida, T.; Mizuta, Y.; Matsunaga, I.; Sasaki, S.; Chen, Q. Effect of grain size in granitic rock on crack extension in hydraulic fracturing. In Proceedings of the 4th North American Rock Mechanics Symposium, Seattle, Washington, DC, USA, 31 July–3 August 2000. [Google Scholar]
  21. Ishida, T.; Sasaki, S.; Matsunaga, I.; Chen, Q.; Mizuta, Y. Effect of grain size in granitic rocks on hydraulic fracturing mechanism. In Proceedings of the Trends in Rock Mechanics, Geotechnical Special Publications, Denver, CO, USA, 5–8 August 2000. [Google Scholar]
  22. Hubbert, M.K.; Willis, D.G. Mechanics of hydraulic fracturing. Petr. Trans. AIME 1957, 210, 153–168. [Google Scholar]
  23. Haimson, B.; Fairhurst, C. Initiation and extension of hydraulic fractures in rocks. Soc. Pet. Eng. J. 1967, 7, 310–318. [Google Scholar] [CrossRef]
  24. Nasehi, M.J.; Mortazavi, A. Effects of in-situ stress regime and intact rock strength parameters on the hydraulic fracturing. J. Petrol. Sci. Eng. 2013, 108, 211–221. [Google Scholar] [CrossRef]
  25. Potyondy, D.O.; Cundall, P.A. A Bonded-Particle Model for Rock. Int. J. Rock Mech. Min. Sci. 2004, 41, 1329–1364. [Google Scholar] [CrossRef]
  26. Cundall, P.A. Computer Simulations of Dense Sphere Assemblies. Stud. Appl. Mech. 1988, 20, 113–123. [Google Scholar] [CrossRef]
  27. Cundall, P. Fluid Formulation for PFC2D; Itasca Consulting Group: Minneapolis, MN, USA, 2000. [Google Scholar]
  28. Zhou, J.; Zhang, L.Q.; Braun, A.; Han, Z.H. Numerical Modeling and Investigation of Fluid-Driven Fracture Propagation in Reservoirs Based on a Modified Fluid-Mechanically Coupled Model in Two-Dimensional Particle Flow Code. Energies 2016, 9, 699. [Google Scholar] [CrossRef]
  29. Hökmark, H.; Lönnqvist, M.; Fälth, B. THM-Issues in Repository Rock; Svensk Kärnbränslehantering AB: Stockholm, Sweden, 2010. [Google Scholar]
  30. Yoon, J.S.; Zang, A.; Stephansson, O. Numerical investigation on optimized stimulation of intact and naturally fractured deep geothermal reservoirs using hydro-mechanical coupled discrete particles joints model. Geothermics 2014, 52, 165–184. [Google Scholar] [CrossRef] [Green Version]
  31. Zhao, X.; Young, P.R. Numerical modeling of seismicity induced by fluid injection in naturally fractured reservoirs. Geophysics 2011, 76, WC167–WC180. [Google Scholar] [CrossRef]
  32. Hazzard, J.F.; Young, R.P.; Oates, S.J. Numerical modeling of seismicity induced by fluid injection in a fractured reservoir. In Proceedings of the 5th North American Rock Mechanics Symposium Mining and Tunnel Innovation and Opportunity, Toronto, ON, Canada, 7–10 July 2002; pp. 1023–1030. [Google Scholar]
  33. Blair, S.C.; Cook, N.G.W. Analysis of compressive fracture in rock using statistical techniques: Part I, A non-linear rule-based model. Int. J. Rock Mech. Min. Sci. 1998, 35, 837–848. [Google Scholar] [CrossRef]
  34. Blair, S.C.; Cook, N.G.W. Analysis of compressive fracture in rock using statistical techniques: Part II. Effect of microscale heterogeneity on macroscopic deformation. Int. J. Rock Mech. Min. Sci. 1998, 35, 849–861. [Google Scholar] [CrossRef]
Figure 1. The fluid network used for fluid-mechanical simulation in PFC2D model (gray circles: solid particles, red lines: flow channels, black circles: reservoirs).
Energies 11 01413 g001
Figure 2. The basic mechanism of fluid-mechanical coupling [28].
Energies 11 01413 g002
Figure 3. The balance of fluid pressure in two related domains after bond breakage (modified from Zhou et al. [28]).
Energies 11 01413 g003
Figure 4. Numerical model for hydraulic fracturing and particle packing method near borehole.
Energies 11 01413 g004
Figure 5. Borehole fluid pressure curves: (a) simulated curve and (b) idealized curve [23].
Energies 11 01413 g005
Figure 6. Breakdown pressures obtained from simulated values and the theoretical values calculated according to Equation (6).
Energies 11 01413 g006
Figure 7. The local view of models with different grain size heterogeneity (a) Rmax/Rmin = 1.2; (b) Rmax/Rmin = 1.5; (c) Rmax/Rmin = 2.0; (d) Rmax/Rmin = 2.5; (e) Rmax/Rmin = 3.0.
Energies 11 01413 g007
Figure 8. Effect of grain size heterogeneity on (a) initiation and (b) breakdown pressure under different in-situ stress.
Energies 11 01413 g008
Figure 9. Borehole pressure curves under different size ratios and the determination of crack initiation (SH = Sh = 10 MPa) (a) Rmax/Rmin = 1.2; (b) Rmax/Rmin = 1.5; (c) Rmax/Rmin = 2.0; (d) Rmax/Rmin = 2.5; (e) Rmax/Rmin = 3.0.
Energies 11 01413 g009
Figure 10. Distributions of hydraulic fractures under different grain size heterogeneity and in-situ stress (a) SH = Sh = 5 MPa; (b) SH = Sh = 10 MPa; (c) SH = Sh = 15 MPa; (d) SH = Sh = 20 MPa.
Energies 11 01413 g010
Figure 11. Effect of grain size heterogeneity on microcracks: (a) grain size homogeneous model (Rmax/Rmin = 1.2) and (b) grain size heterogeneous model (Rmax/Rmin = 3.0).
Energies 11 01413 g011
Figure 12. Effect of in-situ stress ratio on (a) initiation and (b) breakdown pressure under different grain size heterogeneity.
Energies 11 01413 g012
Figure 13. Distributions of hydraulic fractures under different grain size heterogeneity and in-situ stress ratios (a) SH/Sh = 2; (b) SH/Sh = 3; (c) SH/Sh = 4.
Energies 11 01413 g013aEnergies 11 01413 g013b
Table 1. Micro physico-mechanical parameters of hydraulic fracturing model.
MicroparametersNotationsValues
ParticleDensity (kg/m3)ρ2680
Contact modulus (GPa)E35
Ratio of normal to shear stiffnesskn/ks1.5
Friction coefficientf0.4
Parallel bondTensile strength (MPa)σc60
Normal to shear stiffness ratio k n ¯ / k s ¯ 1.5
Shear strength (MPa)τc110
Modulus (GPa)Ec35
Radius multiplierλ1
FluidBulk modulus (GPa) K f 2
Viscosity (Pa·s) μ 1.0 × 10⁻³
Initial hydraulic aperture (m)e01.0 × 10−6
Infinite hydraulic aperture (m)einf1.0 × 10−8
Permeability (m2) k 1.0 × 10⁻¹⁷
Table 2. Scenarios with heterogeneous grain sizes and different in-situ stress conditions.
ParametersMinimum Grain Size (mm)Grain Size Ratio (Rmax/Rmin)In-Situ Stress (MPa) and Stress Ratio
Scheme 12.51.2, 1.5, 2.0, 2.5, 3.0SH = ShSH = 5, 10, 15, 20
Scheme 22.51.2, 1.5, 2.0, 2.5, 3.0(SH + Sh)/2 = 10SH/Sh = 1.0, 2.0, 3.0, 4.0

