Article

ICT Based Performance Evaluation of Primary Frequency Control Support from Renewable Power Plants in Smart Grids

1
Department of Electronic Systems, Aalborg University, 9220 Aalborg, Denmark
2
DTU Wind Energy, 4000 Roskilde, Denmark
3
Department of Energy Technology, Aalborg University, 9220 Aalborg, Denmark
*
Author to whom correspondence should be addressed.
Energies 2018, 11(6), 1329; https://doi.org/10.3390/en11061329
Submission received: 20 April 2018 / Revised: 11 May 2018 / Accepted: 19 May 2018 / Published: 23 May 2018
(This article belongs to the Special Issue Electric Power Systems Research 2018)

Abstract

:
The increased penetration of Renewable Energy Generation (ReGen) plants in future power systems poses several challenges to the stability of the entire system. In future green energy rich power systems, the responsibility for providing ancillary services will be shifted from conventional power plants towards ReGen plants, such as wind and photovoltaic power plants. Frequency control support from the Wind Power Plants (WPPs) is one of the crucial ancillary services in order to preserve operational stability in case of grid disturbances. Among other requirements, the ability to provide fast frequency control support from ReGen plants will highly depend on the underlying communication infrastructure that allows an exchange of information between different ReGen plants and the control centers. This paper, therefore, focuses on the evaluation of the impact of communication and the related aspects to provide online frequency control support from ReGen (with special focus on WPP). The performance evaluation is based on an aggregated WPP model that is integrated into a generic power system model. This generic power system model is specifically designed to assess the ancillary services in a relatively simple yet relevant environment. Several case studies with different wind speeds at a particular wind-power penetration level and communication scenarios are considered to evaluate the performance of power system frequency response. The article provides the Transmission System Operator (TSO) and other communication engineers insights into the importance and various aspects of communication infrastructure for general service coordination between WPPs and specifically primary frequency control coordination from WPPs in future power systems.

1. Introduction

The trend in power systems all over the world is changing and expanding through new interconnections with large penetration of ReGen plants, such as WPP and photovoltaic power plants (PVP). This trend in future power systems not only adds to their complexity but also make these systems more vulnerable and dependent on production from Renewable Energy Sources (RES). Conventional power plants are also expected to be replaced by ReGen plants. For instance, at national level, Denmark has set goals to reach 100% renewable energy by 2050 [1]. Other countries like USA, China, Norway, Iceland, etc. are heavily investing on RES [2]. In addition to the several economic and environmental related benefits, the huge penetration of RES raises concerns regarding operational stability and security of the future power systems [3] due to the fluctuating nature of these energy sources. According to [3,4,5], one way to ensure that these ReGen plants will not be detrimental to the stability and security of power systems is to require control functionalities (such as, reactive/reactive power support, etc.) from ReGen plants. These control functionalities, also called Ancillary Services (AS), should resemble to those traditionally offered by conventional power plants. Therefore, in the last one decade, this concern has led the industry as well as academia to an intensified research for developing control algorithms and defining requirements for the provision of AS from ReGen plants (see [6,7,8,9,10,11,12,13,14,15,16,17,18,19,20,21], etc.).
The authors in [4,5,22] have identified voltage stability challenges related to the huge penetration of ReGen plants into MV distribution systems. Further, controllers have also been developed with the specific aim of regulating the voltage/reactive power and analyze the suitability for a coordinated voltage stability support AS from WPPs and PVPs in distribution levels. However, this paper focuses on the provision of frequency stability support AS from ReGen (especially WPPs). According to [3,23], the capabilities (technical as well as operational) of WPPs to provide frequency control support can be confirmed from most of the available research in this area. For instance, the provision of frequency stability support with regards to inertia and primary frequency control has been investigated in [6,7,8,9,10,11,12,13], while [14,15,16,17,18] focus on the small-signal stability support as the damping of power oscillations. Regarding the provision of AS from WPP, initially individual wind turbines remained in focus to investigate their capabilities to provide a required AS (see [6,7,8,9,24,25,26,27]), however now in the recent years, the focus of research has shifted towards investigating provision of AS at “plant” level (see for instance [11,14,15,16,17,18,28,29,30,31,32,33]).
It should be noted that despite of a lot of work (as cited above) on the provision of AS from ReGen plants, an essential aspect scarcely addressed in recent years is related to the role of Information and Communication Technologies (ICT) in the provision of online AS. The provision of online ASs (such as voltage/frequency control support, etc.) highly depends on the underlying communication network infrastructure. Therefore, the performance and characteristics of ICT related issues have to be considered appropriately during the design and assessment any AS from ReGen plants, as this might affect the provision of AS from ReGen plants and ultimately to the overall power system.
In [34,35], the authors have investigated the impact providing online voltage/reactive-power support from ReGen plants using cellular-based public networks. It has also been identified how higher delays, failure in communication and cyberattacks can deteriorate the performance of a power system. Regarding communication impact and its requirements for frequency control, most of the work has been done in relation to the load frequency control (LFC) from the conventional power plants. Such as, the authors in [36,37,38,39,40] have addressed the issue of delays in communication for LFC using linear matrix inequality technique, the robust decentralized method and PI type controller. Reference [37] shows how communication delay effects LFC in a deregulated environment. Furthermore, Shayeghi et al. [41] reported time delay in design of LFC in deregulated environment. The authors in [42] have explored the effects of including communication delays on the small signal stability of power systems. Whereas, in [43,44], the authors proposed methods to remove oscillations that occur as a result of time-delayed feedback control in power systems. The estimation of communication delay for LFC in two-area power system is described in [45], yet, without considering the RES integration into the power system. Similarly, Sargolzaei et al. [45] propose a method to thwart time-delay switch attacks on LFC in distributed power systems without taking into account the power production from RES.
Therefore, in this paper we assess the impact of ICT on the frequency control support (Fast Frequency Response (FFR)) from ReGen plants, with special focus on WPPs. It is pertinent to mention here that instead of relying on assumptions regarding delays or packet loss rates, considerations on delays in communication network models are based on real measurements. A coordination scheme for FFR including parameters as proposed in [46] is considered for analysis. Further, two operating conditions of WPPs are taken into consideration namely partial and full load, respectively.
The scope of this article is not to study control coordination, design FFR controller or make a perfect match between control response and communication delay to find optimum parameters. However, the main goal and scope of this article is to demonstrate the ICT related aspects, challenges and requirements associated to a given frequency control support scheme from WPPs. The design of FFR controller and its parameter tuning has already been addressed in [46] and adopted as such in this paper. While, for the ICT part, cellular communication networks are considered for their ubiquitous coverage around the globe. Further, it could be a remarkable achievement to assess the entire European grid through simulation studies. Nevertheless, the necessary level of information related to the entire EU grid system is not available for the academia. Therefore, by studying a small but representative power system, having the same characteristics and properties as that of the continental European system, will be more practicable given that the proposed solutions are scalable and replicable. For this, a generic island power system model developed and used in [46] has been used to generate relevant case studies. Although this generic power system model has been designed to be used with various wind power penetration scenarios [46], this paper only considers a penetration level of 50% (to comply with Denmark’s intermediate goal for 2020 [1]). Moreover, a perfect knowledge of instantaneous available wind power has also been assumed for the test cases. The work presented in this article is believed to provide the TSOs with new insights into the role, need and importance of communication networks for the provision of AS from WPPs in power systems where conventional power plants are being largely displaced by WPPs.
The paper is organized as follows: Section 2 elaborates on the various aspects and challenges associated to ICT in providing online frequency support and coordination from ReGen. Section 3 defines the use case and test scenarios, while the evaluation criteria for assess system frequency is stated in Section 4. The evaluation setup including the description of the power system model and test cases are discussed in Section 5. Section 6 presents the results related to the impact of communication properties on online frequency control coordination and finally the conclusive remarks are reported in Section 7.

2. Online Frequency Support and Need for Communication

According to [47], “Frequency stability refers to the ability of a power system to maintain steady frequency following a severe disturbance between generation and load”. Frequency instability can result in continuous frequency swings that leads to the tripping of generating units or loads. During the changes in system frequency, characteristic times of the actuated processes and devices range from milliseconds (like under frequency control) to several minutes, corresponding to the response of devices.
Frequency control support and coordination from ReGen plants is reported in [46], including the related models, methodologies, development of controls and study cases considered for both primary and secondary frequency control. The focus in [46] was to improve the frequency control support from ReGen plants (with special focus on wind power plants) by optimizing and coordinating the total support from ReGen plants. In traditional power system operation, primary frequency control has been performed in the conventional power plants at the plant level. Moreover, in the literature, the WPPs that are employed with inertial response, fast frequency control, or enhanced frequency response, are investigated similar to the traditional approach. In this paper, possible aggregator level is proposed for frequency support mechanism in the future power system systems with high wind power penetration and fast communication networks. A similar concept has been investigated and some implementation was done in [48]. According to [
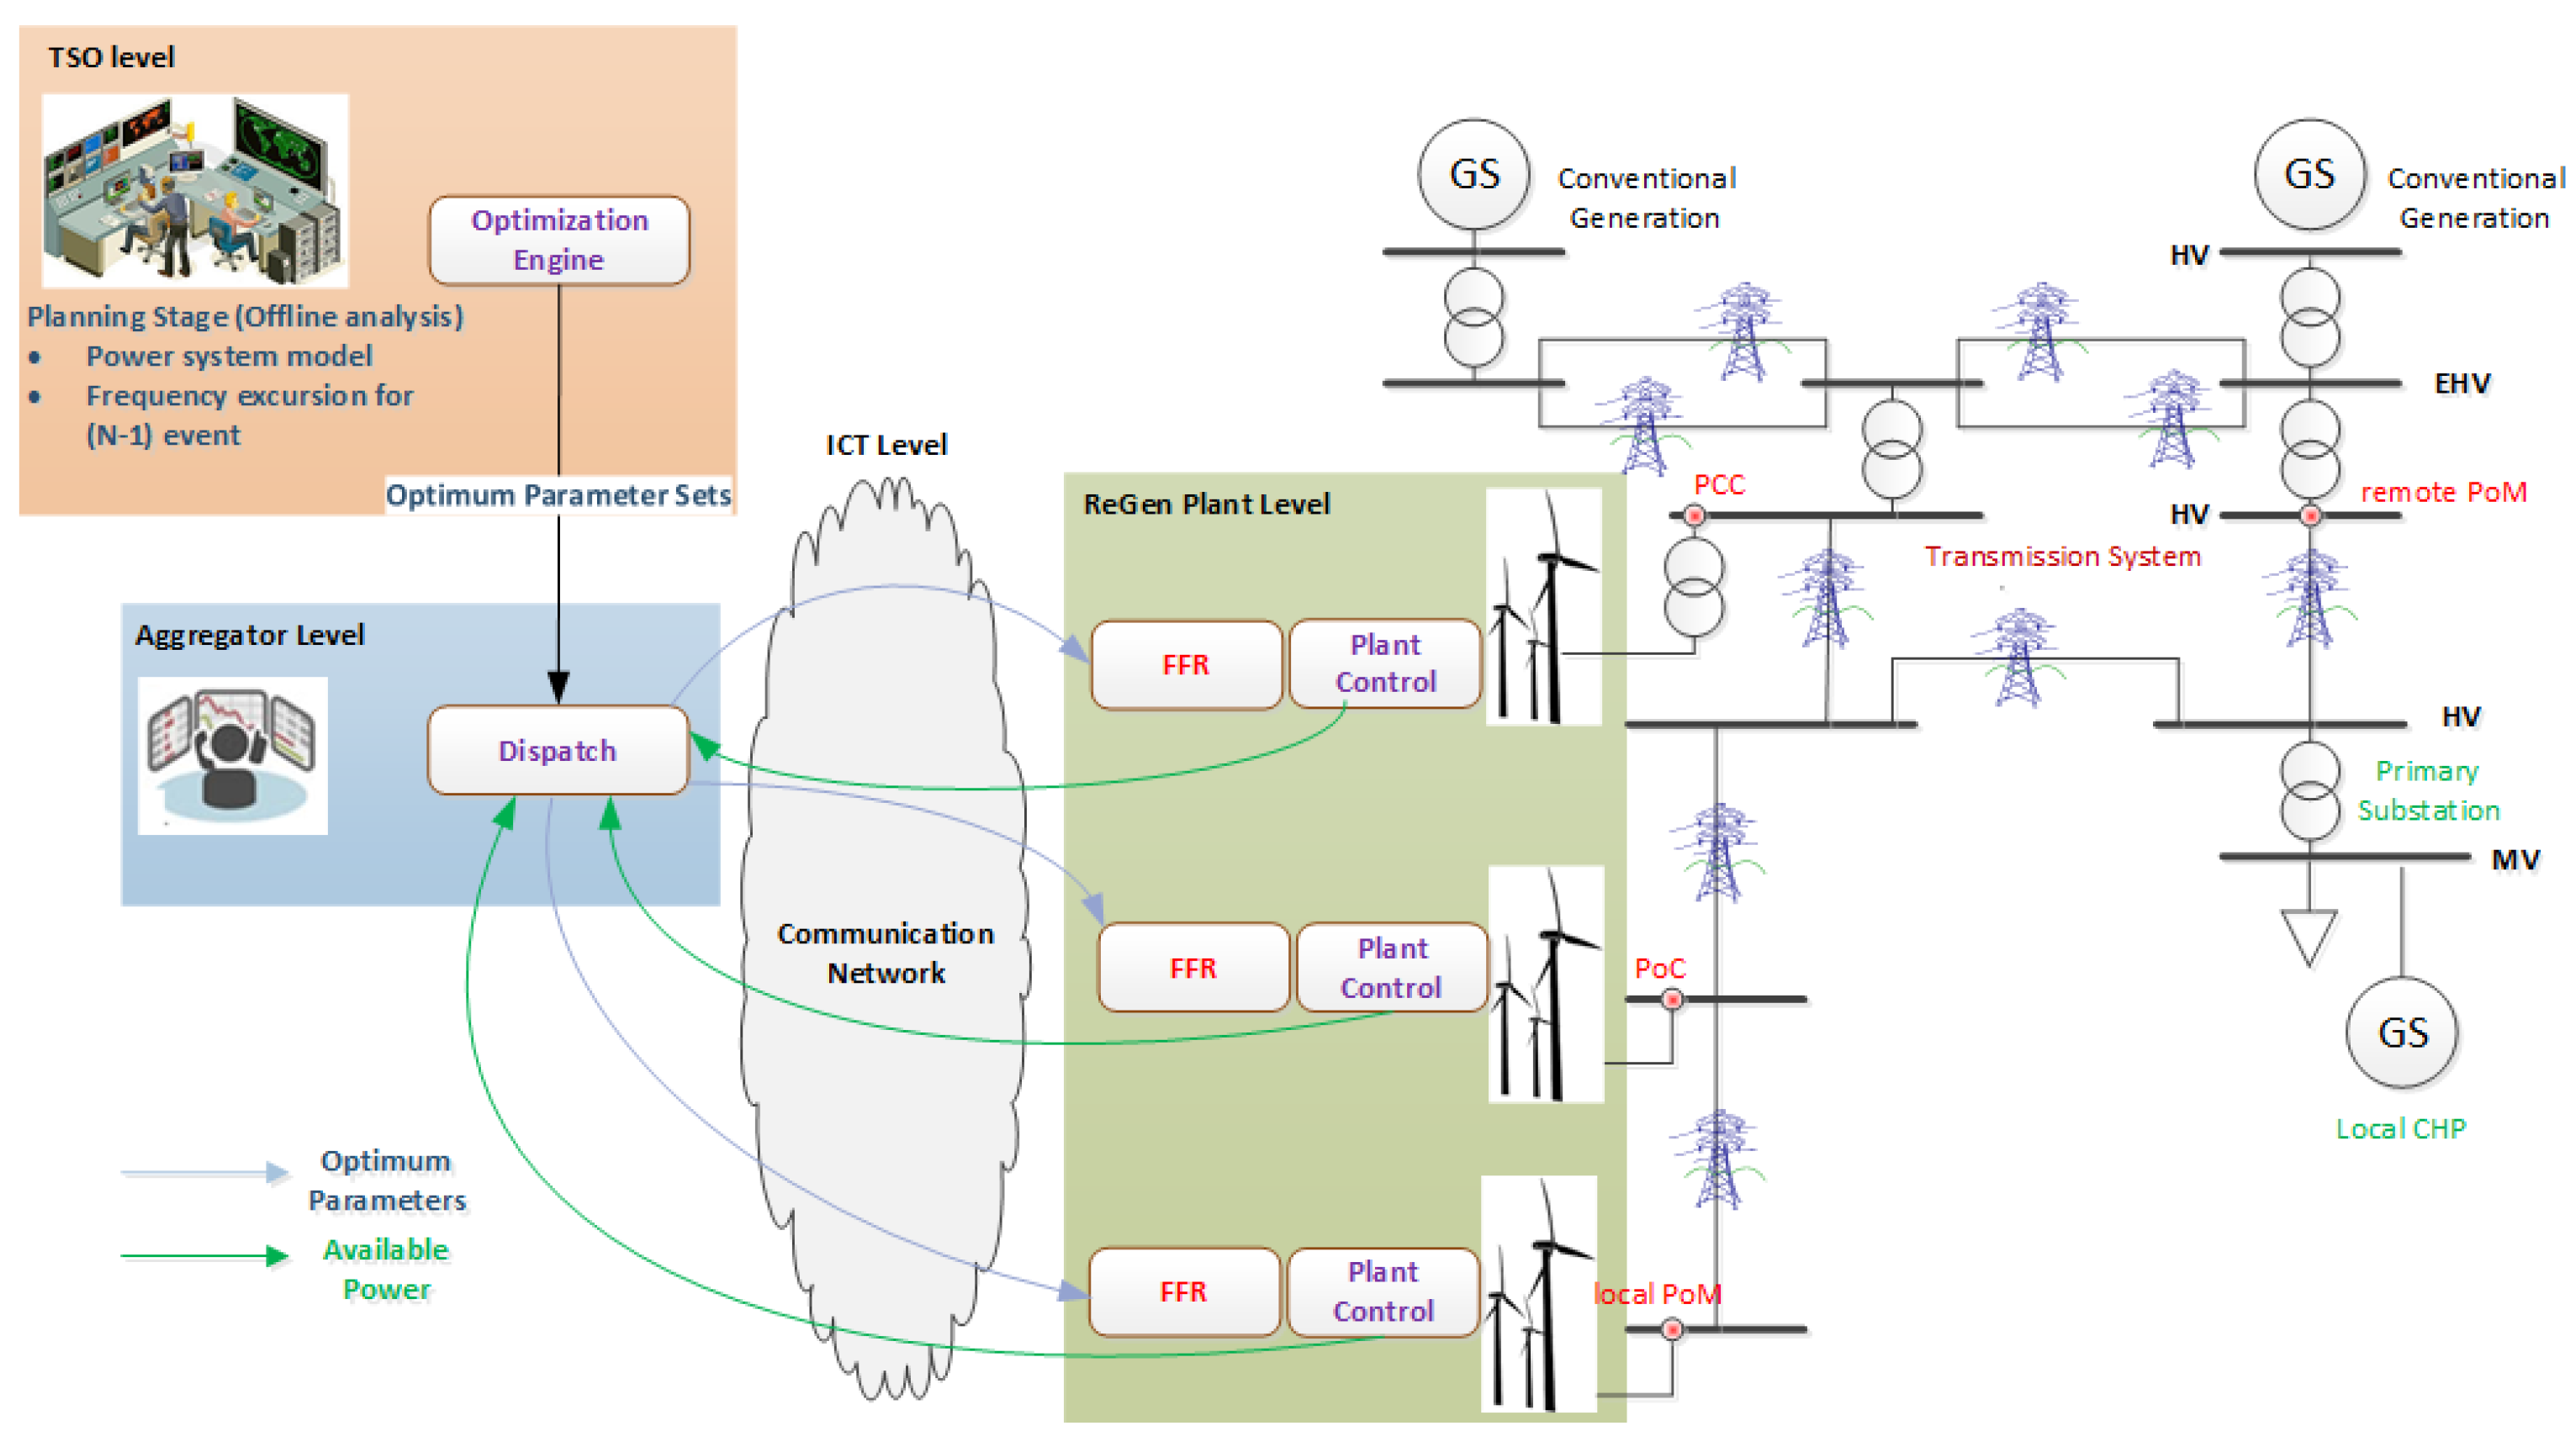
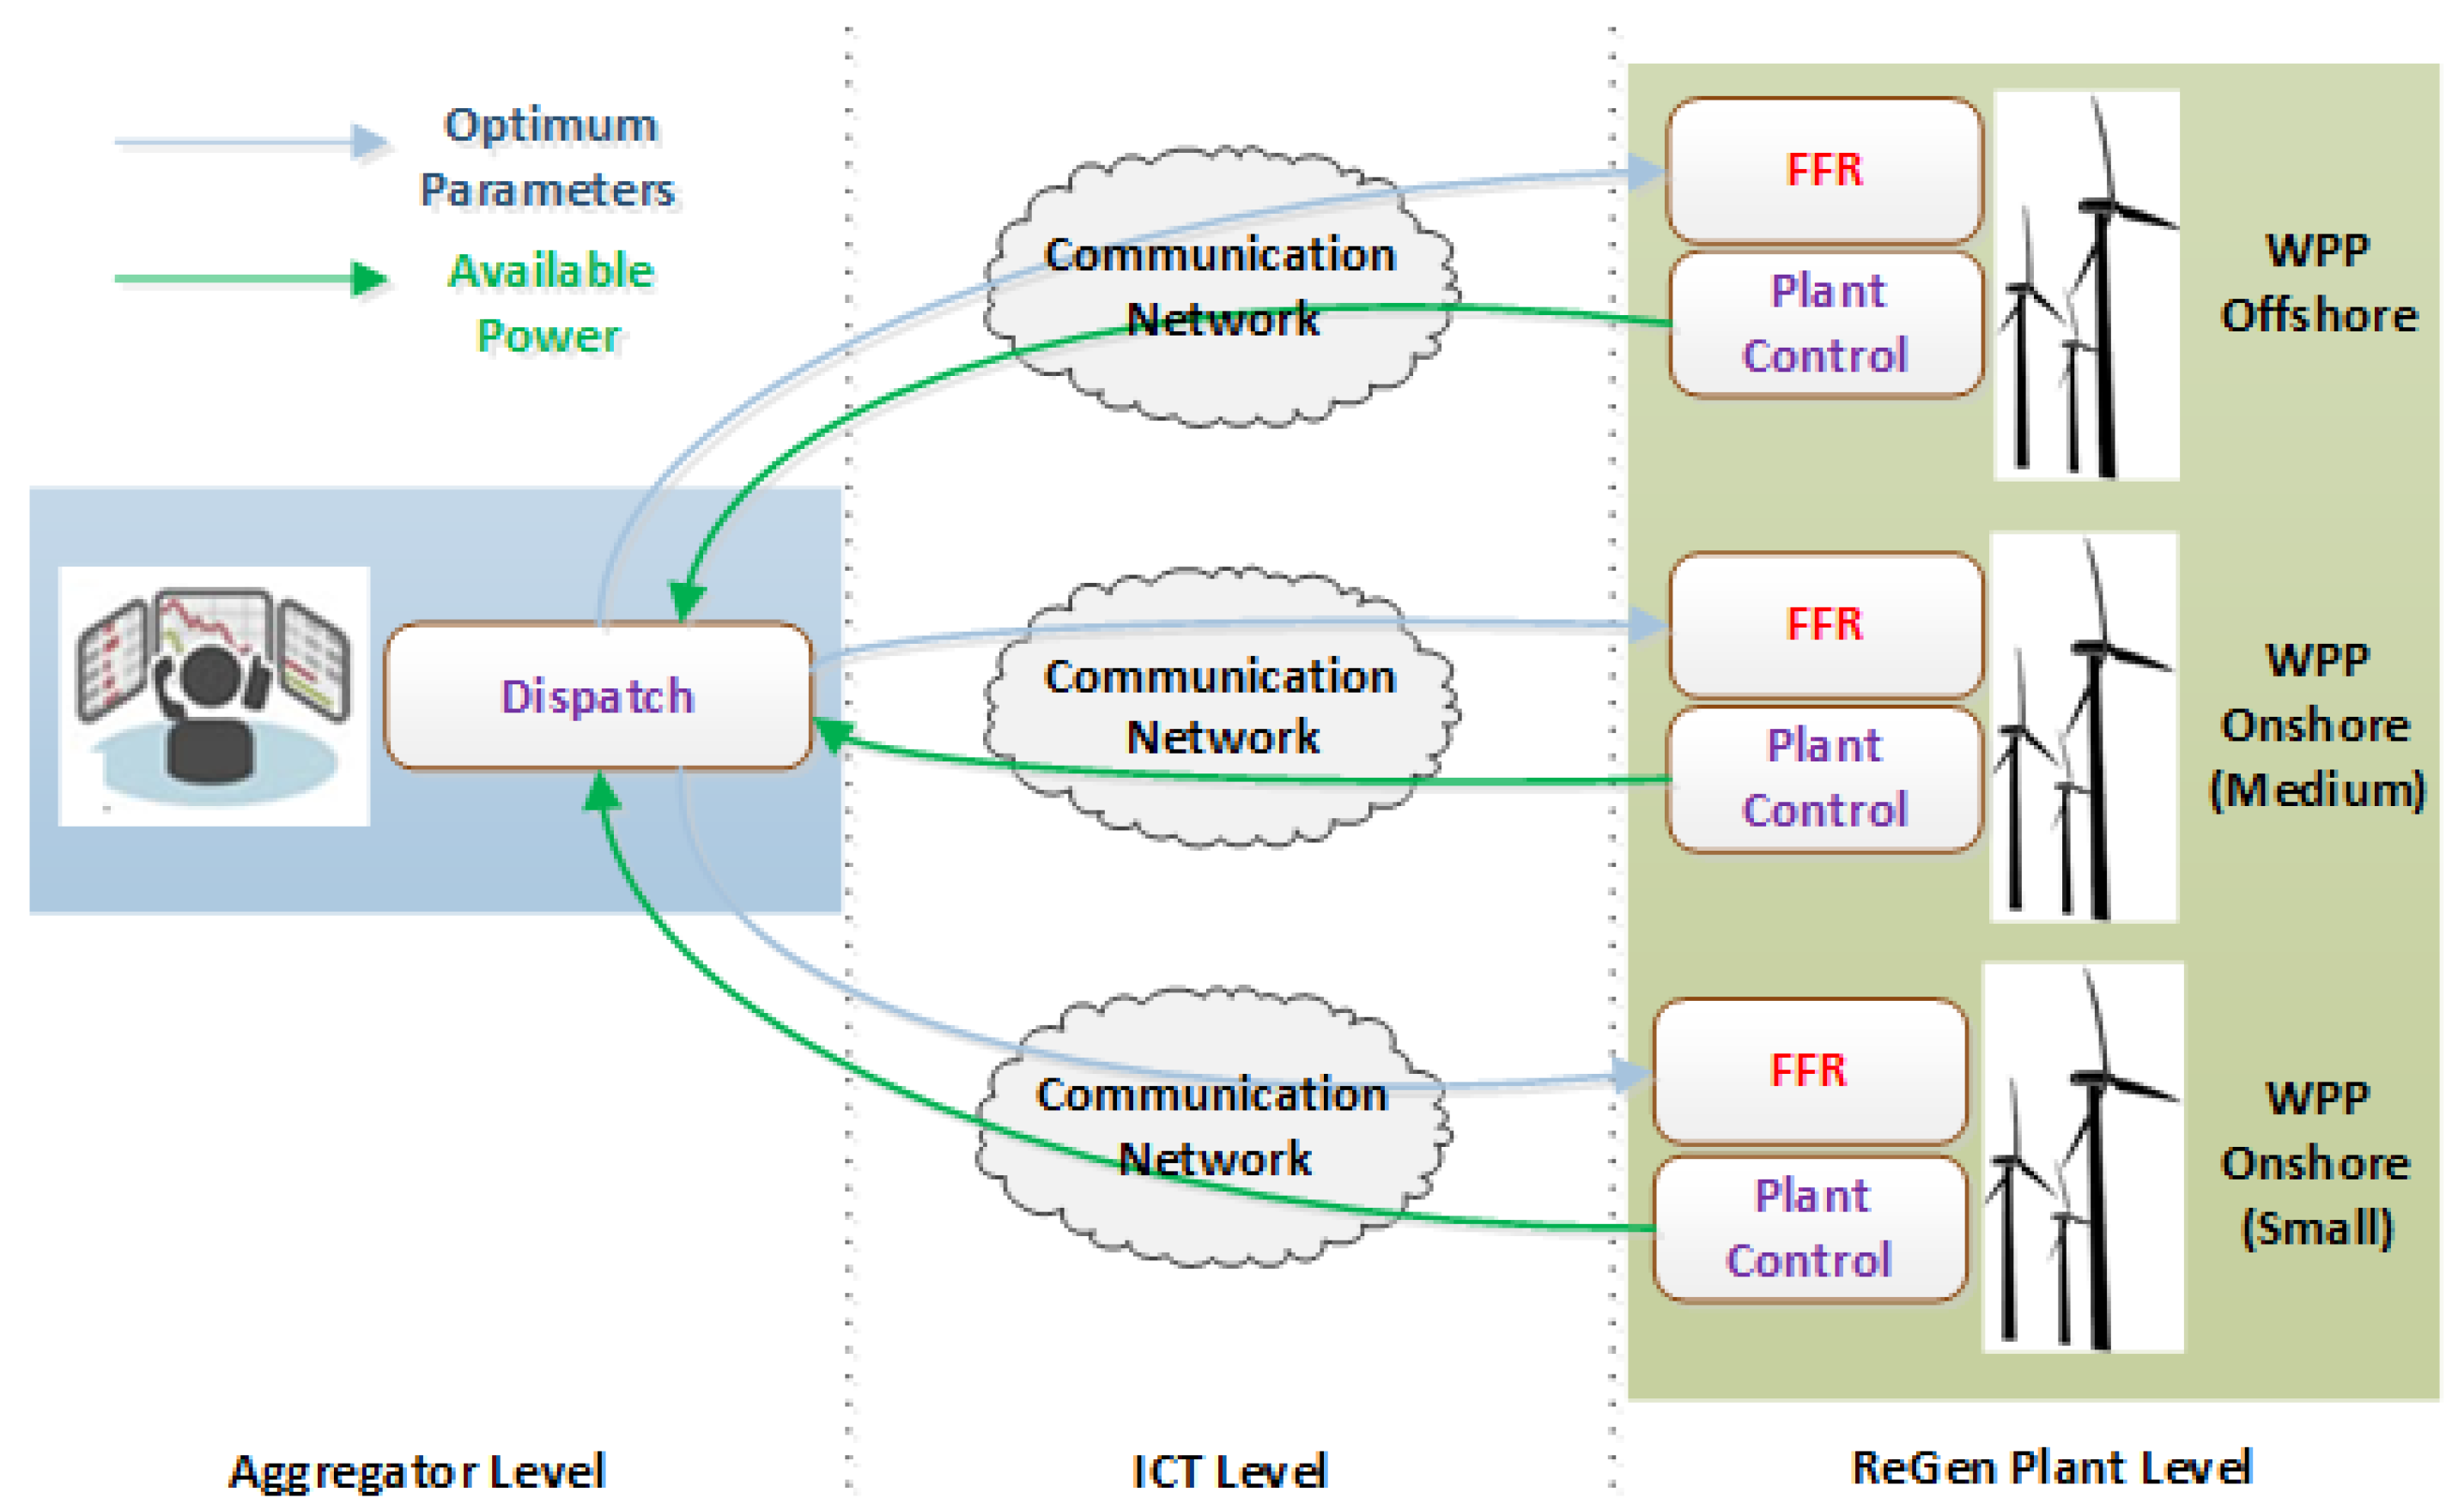
46], the provision of frequency support in power systems is usually based on the measurements of frequency deviation and rate of change of frequency. The measurements of frequency deviation are quick and reliable, however measuring the rate of change of frequency is done over sliding windows of several hundred milliseconds and is thus always afflicted with a delay. For the online coordination, ReGen plants should send status updates at regular intervals to the system operator, based on which set-points are calculated and sent back to the ReGen plants (see Figure 1). Since, the ReGen plants will be dispersed geographically throughout the system, and being far apart from the control centers, a time delay is expected in receiving the set-points. As a result, the contribution of a ReGen plant to the system frequency support will be also be delayed. The delay as well as other properties of communication (such as packet loss, throughput, etc.) associated to any communication network depend on the underlying network communication infrastructure. Thus, the optimized FFR support discussed in [46] will likely be non-optimum, if not deteriorating to the system response.
Therefore, in the following subsections, this paper highlights: (1) the different communication network options that can be used in the future to support communication between ReGen plants and the control centers, and (2) the extent to which the delays associated to these networks can impact frequency support coordination from ReGen plants. The optimization process employed in [46] is used as such including the various delays in measurement and communication.

2.1. ICT Challenges in Online Frequency Support

Compared to voltage/reactive-power, which is more of a local phenomenon [49], the LFC is a global phenomenon that has been implemented in a centralized scheme since the start of the interconnected power system [49]. Therefore, when it comes to provide frequency support and coordination from power generation plants, the TSO directly takes the charge [46]. However, it is also foreseen that aggregators of these ReGen units may take the responsibility, in close cooperation with system operators (TSO/DSO), for hosting ancillary services, such as voltage/frequency control capabilities, besides trading energy [50]. Nevertheless, in any case, it will be essential to add Supervisory Control and Data Acquisition (SCADA) with an appropriate communication network infrastructure to connect ReGen plants to system operator.
Nowadays, since fiberoptics, cable Internet, and cellular networks are already widely deployed by the telecom operators and have high geographical coverage [51,52], these technologies could be used to connect ReGen plants to the control centers using SCADA. Communication via fiberoptics offers several advantages over copper as well as other modes of communication, such as: super low latency, prevents electrical noise induction, and eliminates signal ground loops [53,54], etc. However, for wide-area SCADA network, installing fiber optic cables requires huge initial investment and thus, highly expensive. In this regards, wireless networks prove to be a cost-effective substitute to the use of fiber optic-based communication. Wireless networks, specifically cellular networks, can provide up to 90% savings [55] compared to installing fiber optic cables, with significantly accelerated implementation. Today, cellular networks have turned out to be a dominant means of communication for Machine-to-Machine (M2M) communication in not only smart grids but also other control systems. For instance, according to [56], “Victoria’s South East Water replaced its digital radio system with a high-speed IP-based communications hub with 3G and 4G cellular modems, as well as DSL direct links”. Therefore, in this paper we focus mainly on using the cellular networks for communication between the ReGen plants and the control center to demonstrate the impact on the provision of frequency control support from, specifically, WPP.

2.2. Role of Communication Networks in SCADA

As the name implies, SCADA system provides the control and monitoring of remote devices (called Remote Terminal Units (RTUs)) through an appropriate communication infrastructure. It uses communication protocols such as Modbus or DNP3 that are based on polling schemes for collecting information from all end devices and reporting the data back to a central SCADA master [57]. Based on the received data, the system can then send set-points or control decisions accordingly. Since, SCADA was initially designed for industrial processes using proprietary serial protocols; it was usually kept isolated from not only other networks but also the computer systems [57]. However, in order to merge many different network types (such as data, control signals, etc.) in a single network as well as to present significant cost savings to a business, SCADA industrial control systems are now being connected with cooperate networks on the Internet. With this, the traditional SCADA has shifted from the proprietary serial protocols to the world of Internet Protocol (IP). Today, many industries have increased connectivity between corporate network and SCADA to allow more informed decisions to be made and thus improving businesses. It is important to mention here that moving from proprietary networks to IP-based networks increases the level of risk [57] in terms of cyber-security, etc. Therefore, with increasing interest in the security of Networked Control Systems (NCS) such as smart grids, it becomes vital for the asset owners to understand the various available IP-based solutions and make an effective security-based risk management decision [57].
DNP3 and Modbus were originally designed and aimed for use in communication links supporting serial data communications with low-bandwidth requirements. Therefore, these data collection applications in SCADA were tolerant of long communication latencies with most likely deterministic delays due to direct link between application layer and MAC layer. On the other hand, since IP-based data links (wireless as well as wired Ethernet bases networks) offer higher data rates, the IP-based SCADA allows for lower communications latency, with naturally stochastic delay types. It is worth mentioning here that the latency related requirements for each SCADA scheme are determined by not only the number of devices being polled, but also the rate at which these devices are required to be polled relative to control system response time requirements [57]. While, high throughput wireless networks are more flexible in terms of network size as well as polling rates. Thus, based on the available throughput, trade-off in the network size can be made during the design phase to attain a desired response time based on the given data rate.
Today, the cellular technologies (such as, 3G, 4G, LTE) provide throughput on the order of millions of bits per second. Additionally, cellular communications network and base station infrastructure being ubiquitous, allows greater system access and easy scalability. This means that a large number of end devices can be polled with unbounded network size. Further, in cellular networks, a given area is divided into distinct cells, where each cell is connected to the wireless transceiver. All cells in the given area are interconnected to cover long distances, providing high data speeds, low initial costs and several other significant benefits over other forms of wireless communication. However, the technology used in any considered network scenario, will have an important impact on the costs of the actions in the operational processes and thus, also on the overall Operational Expenditure (OPEX) cost for the considered scenario. From the perspective of a system operator (i.e., TSO), to employ cellular networks, an exhaustive techno-economic model for these networks (as well as individual technologies) with inherent coupling of Capital Expenditure (CAPEX) and OPEX cost elements is required. Such a model for LTE networks is provided in [58], while [59] describes a general model for OPEX of a telecom operator.
From the perspective of reliable and fast delivery of any ancillary service from ReGen, it is important also to analyze the performance of these cellular networks based on the critical communication properties. Therefore, in the following, coverage and performance of cellular networks in Denmark is briefly described.

2.3. Cellular Network Performance in Denmark

Although many communication properties, as detailed in [53,60,61], can be linked, but two properties are considered here, i.e., delay and information loss rate (also termed as packet loss rate). Because, delay in transmission can cause the operator to make decision based on old data, or a ReGen to change behavior based on old control messages. While, information loss in communication might mean that operator/ReGen tries to make decision based on incomplete data. Since the delay and packet loss in cellular networks are non-deterministic, it is worth exploring the exact range of these properties for analyzing the impact of using these networks to support frequency control and coordination from ReGen. In the following, the range of delays and packet loss probabilities is discussed, specifically for Denmark.

2.3.1. Information Collection and Description

NetMap [62,63] is used to obtain information about cellular technologies and their performance in terms of Round Trip-Times (RTTs) and measured signal strength [64]. NetMap is a crowd sourcing-based system for performing and collecting measurements of cellular network connection performance. NetMap is exploiting the ubiquity of smartphones by having them perform and collect measurements of network performance using the cellular connection. This is done by having users install an app on their smartphones, acting as front-end client software, which handles the measurements and scheduling. The collected measurements are then submitted to the back end system, where measurements are collected and processed. NetMap is currently only deployed and measuring cellular networks in Denmark [63].

2.3.2. Measurement Scenario

To understand the measurement results it is important to understand what is being measured. The NetMap setup consists of a front-end component and a back end component where the connection between is measured. The front-end component is an app on a smartphone with a cellular connection, and the back end component is a fixed measurement server, connected to the research network in Denmark. This means that the connection covers two types of connections: (1) the wireless cellular connection to the radio access network, and (2) the connection between radio access network and measurement server. The assumption is that the main influence to the network performance origins from the cellular connection in terms of delay and variance.
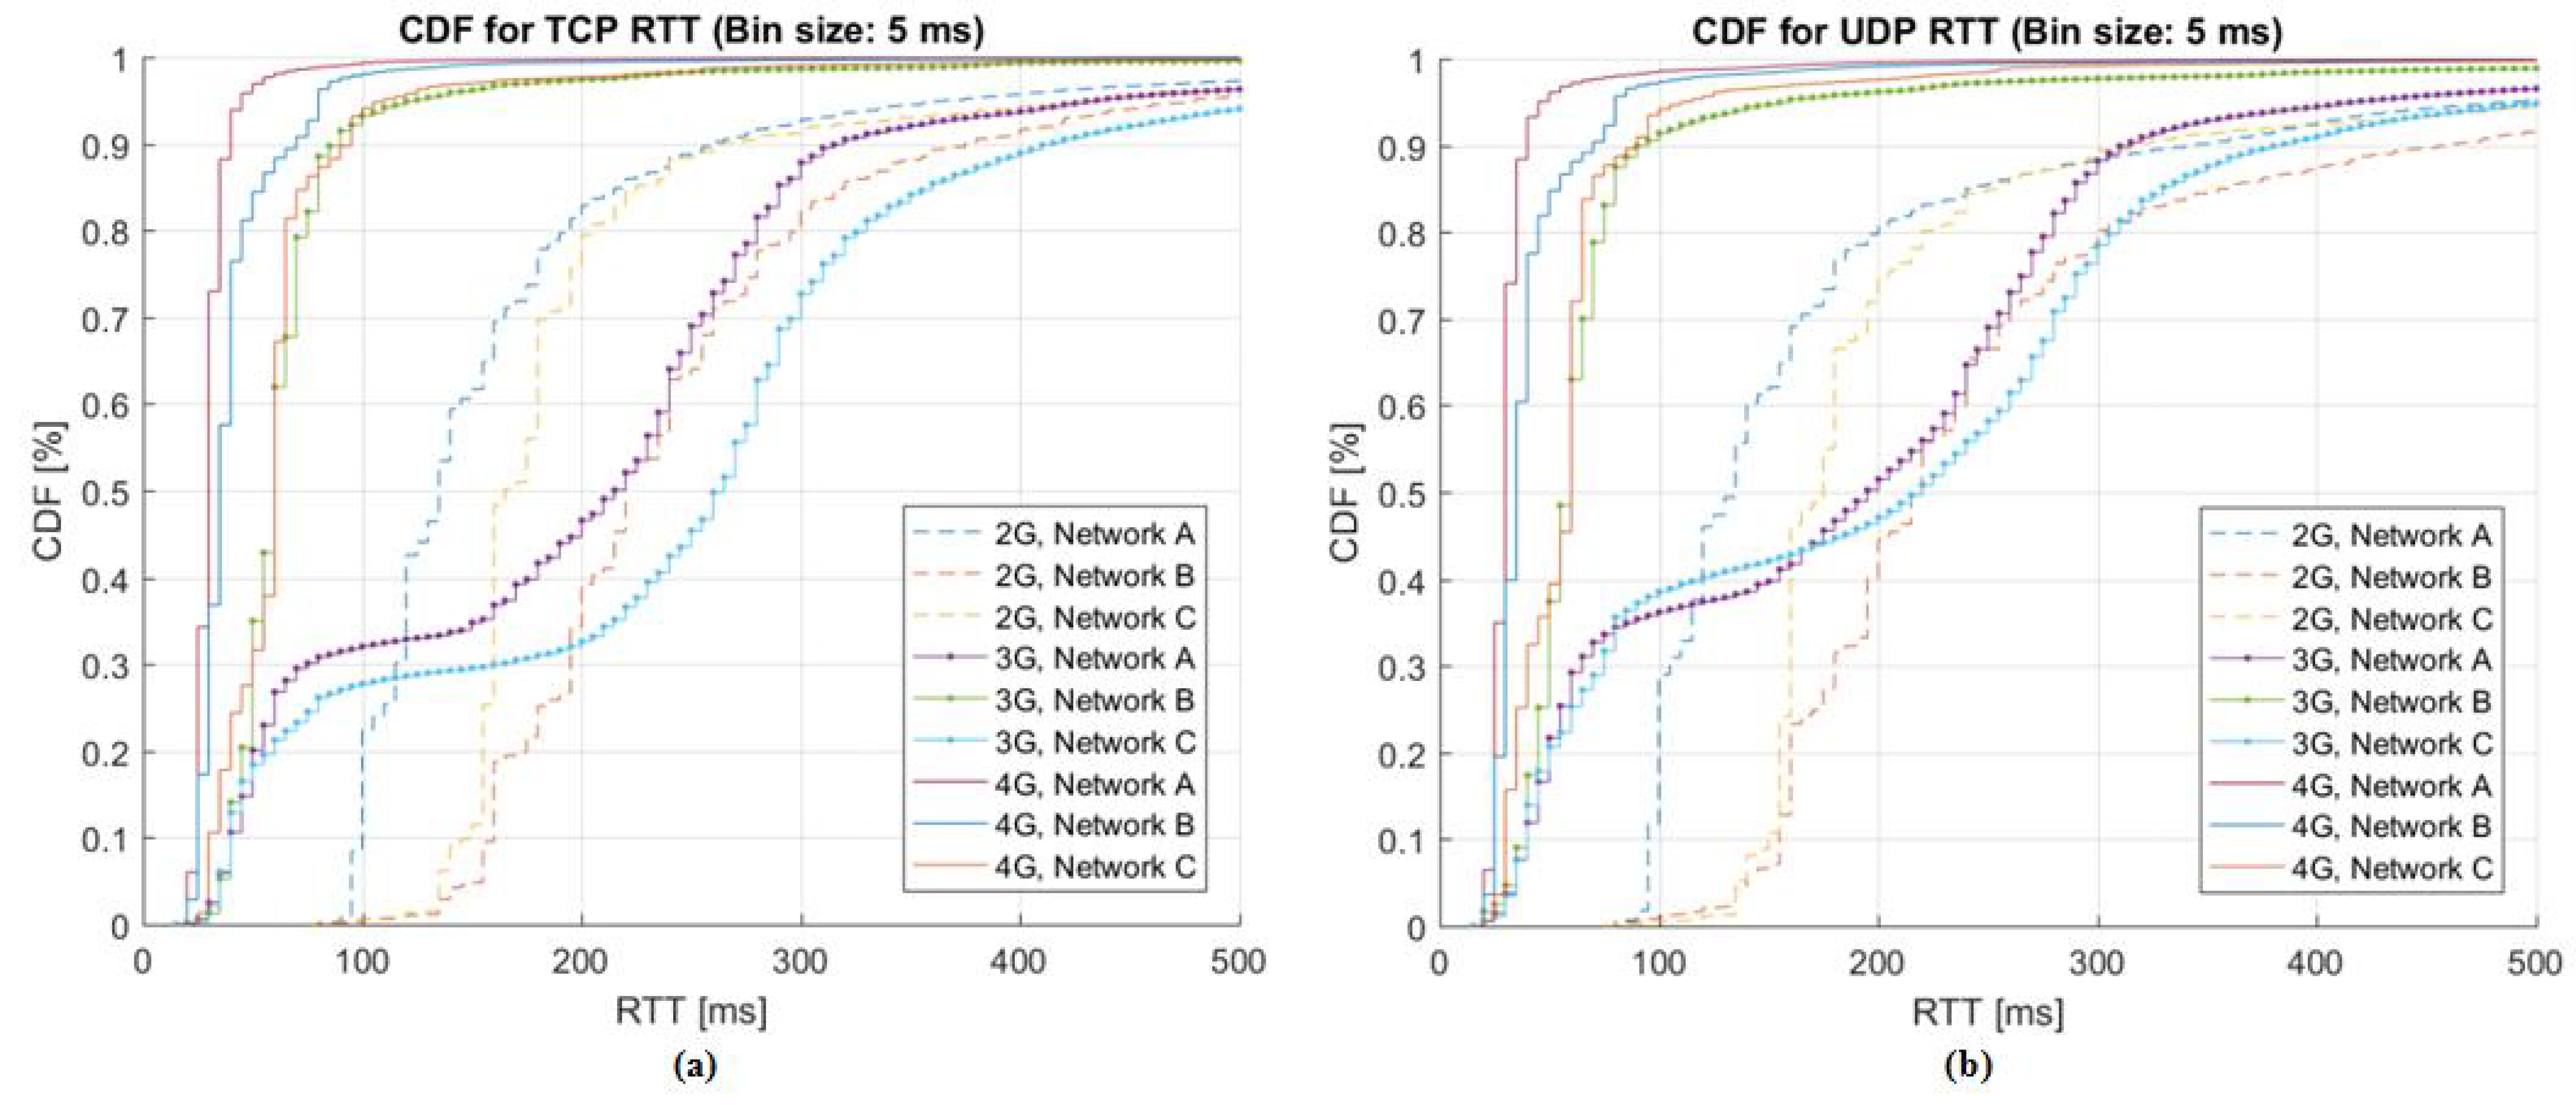
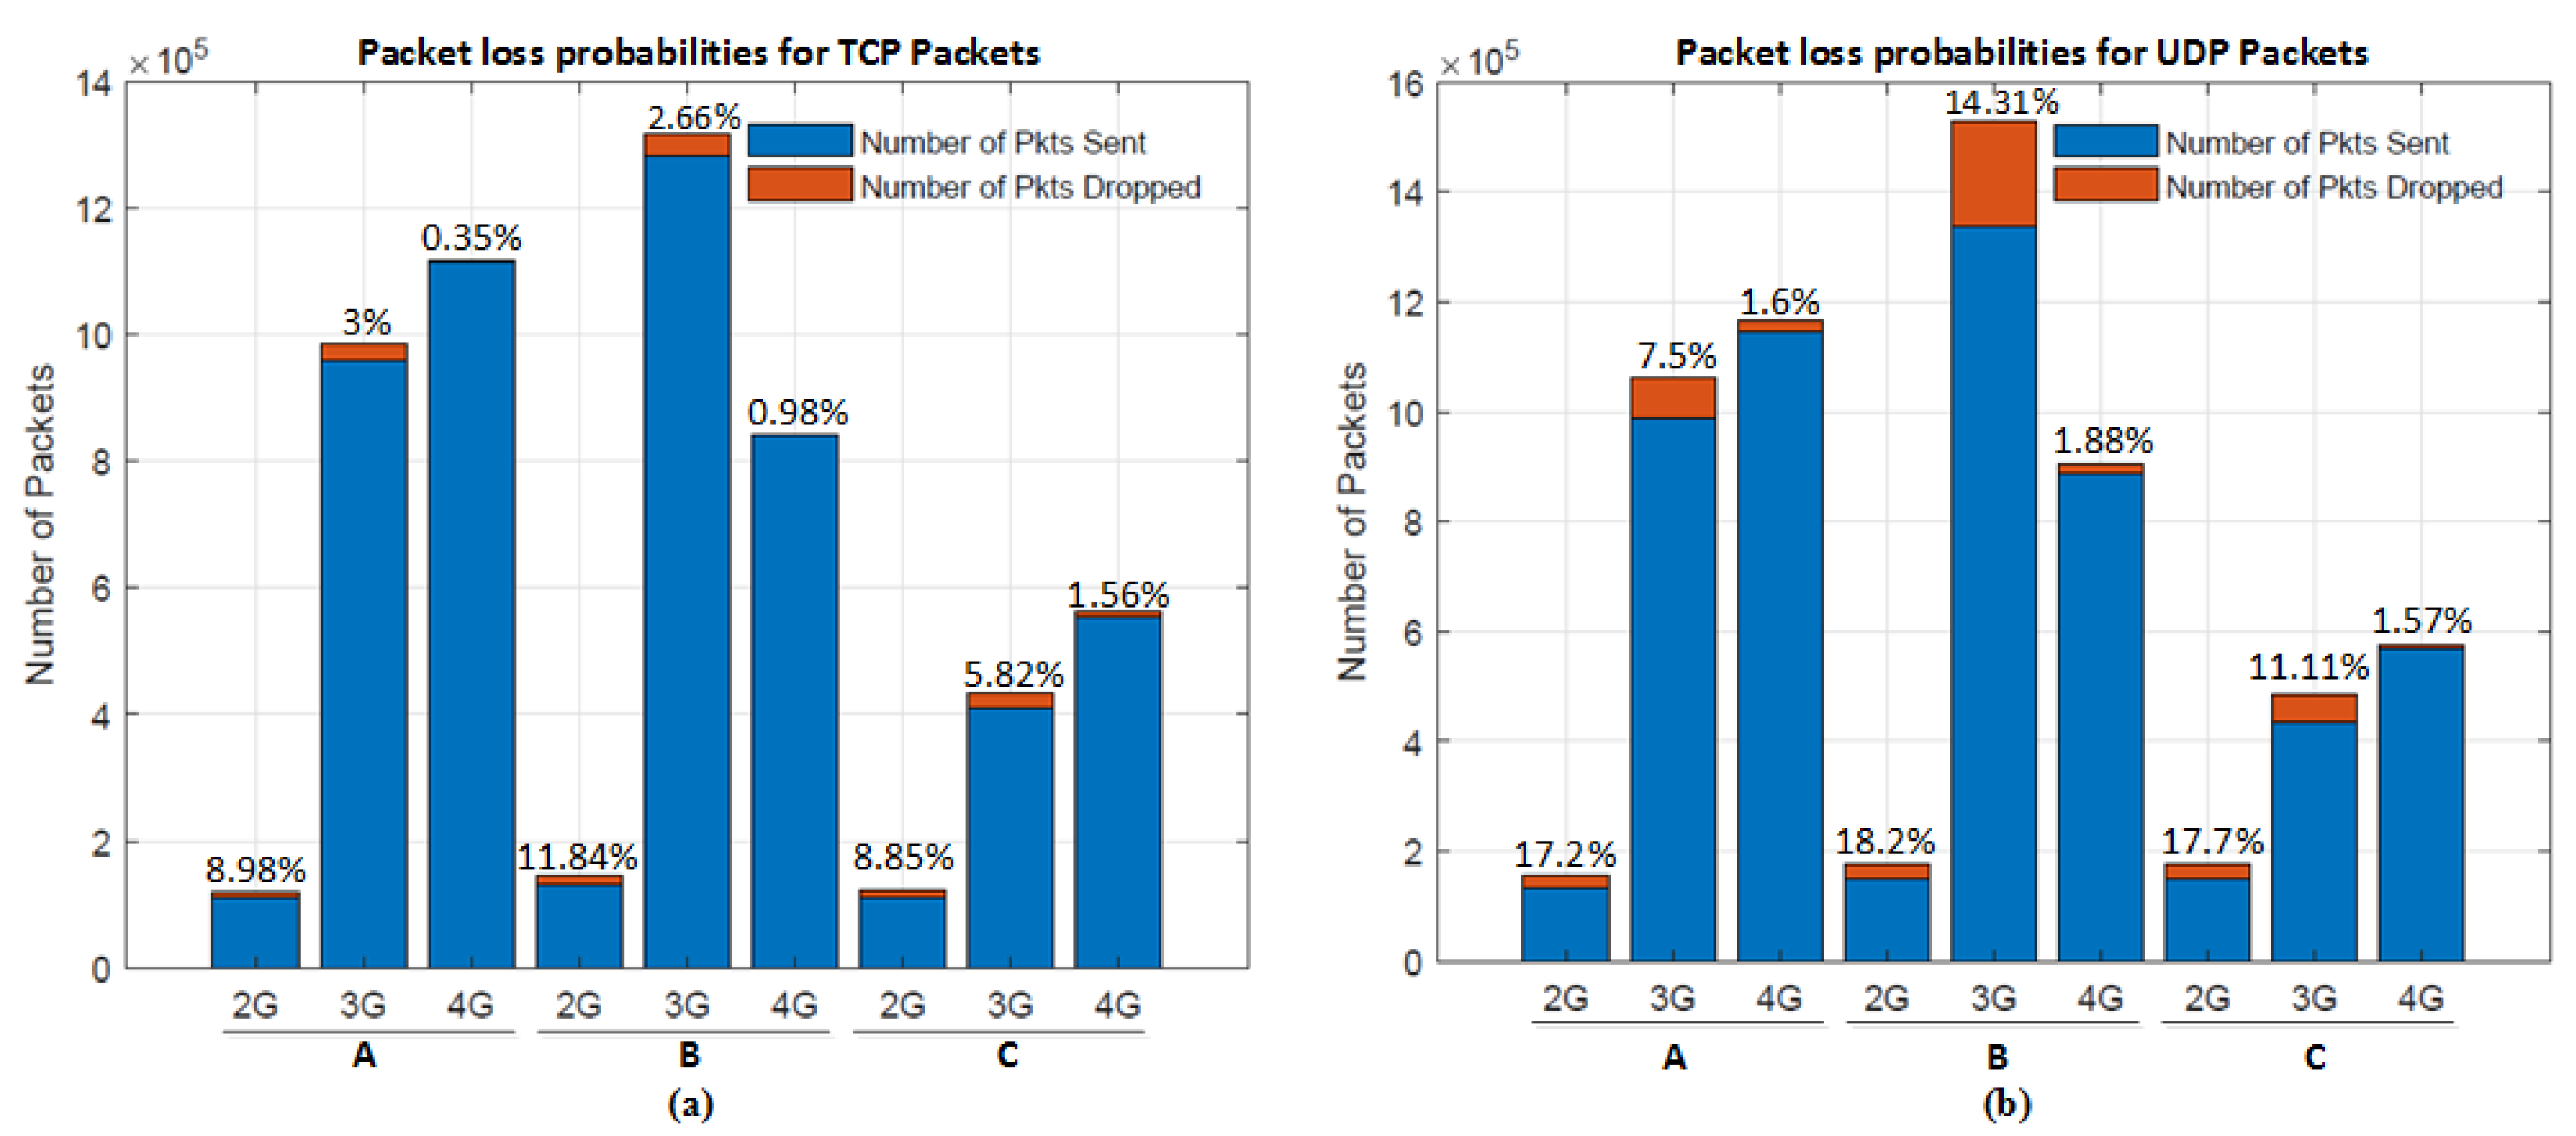
In Denmark there are three cellular networks (in reality four but two of them share cellular network resources) [65]. The three networks (referred to as A, B and C in Figure 2 and Figure 3) are connected to the same internet exchange point, Danish Internet Exchange (DIX) [65]. The measurement server is connected to the Danish research network, which also is connected DIX. This means that the performance of the different ISP networks can be compared because the measurements only differ in which ISP wireless and internal network they are performed on. The devices that perform the measurements are regular consumer smart-phones, which means that there are many factors that influence measurements. For instance, different applications on the devices consuming resources and utilizing the connection, as well as the mobility of measuring devices.
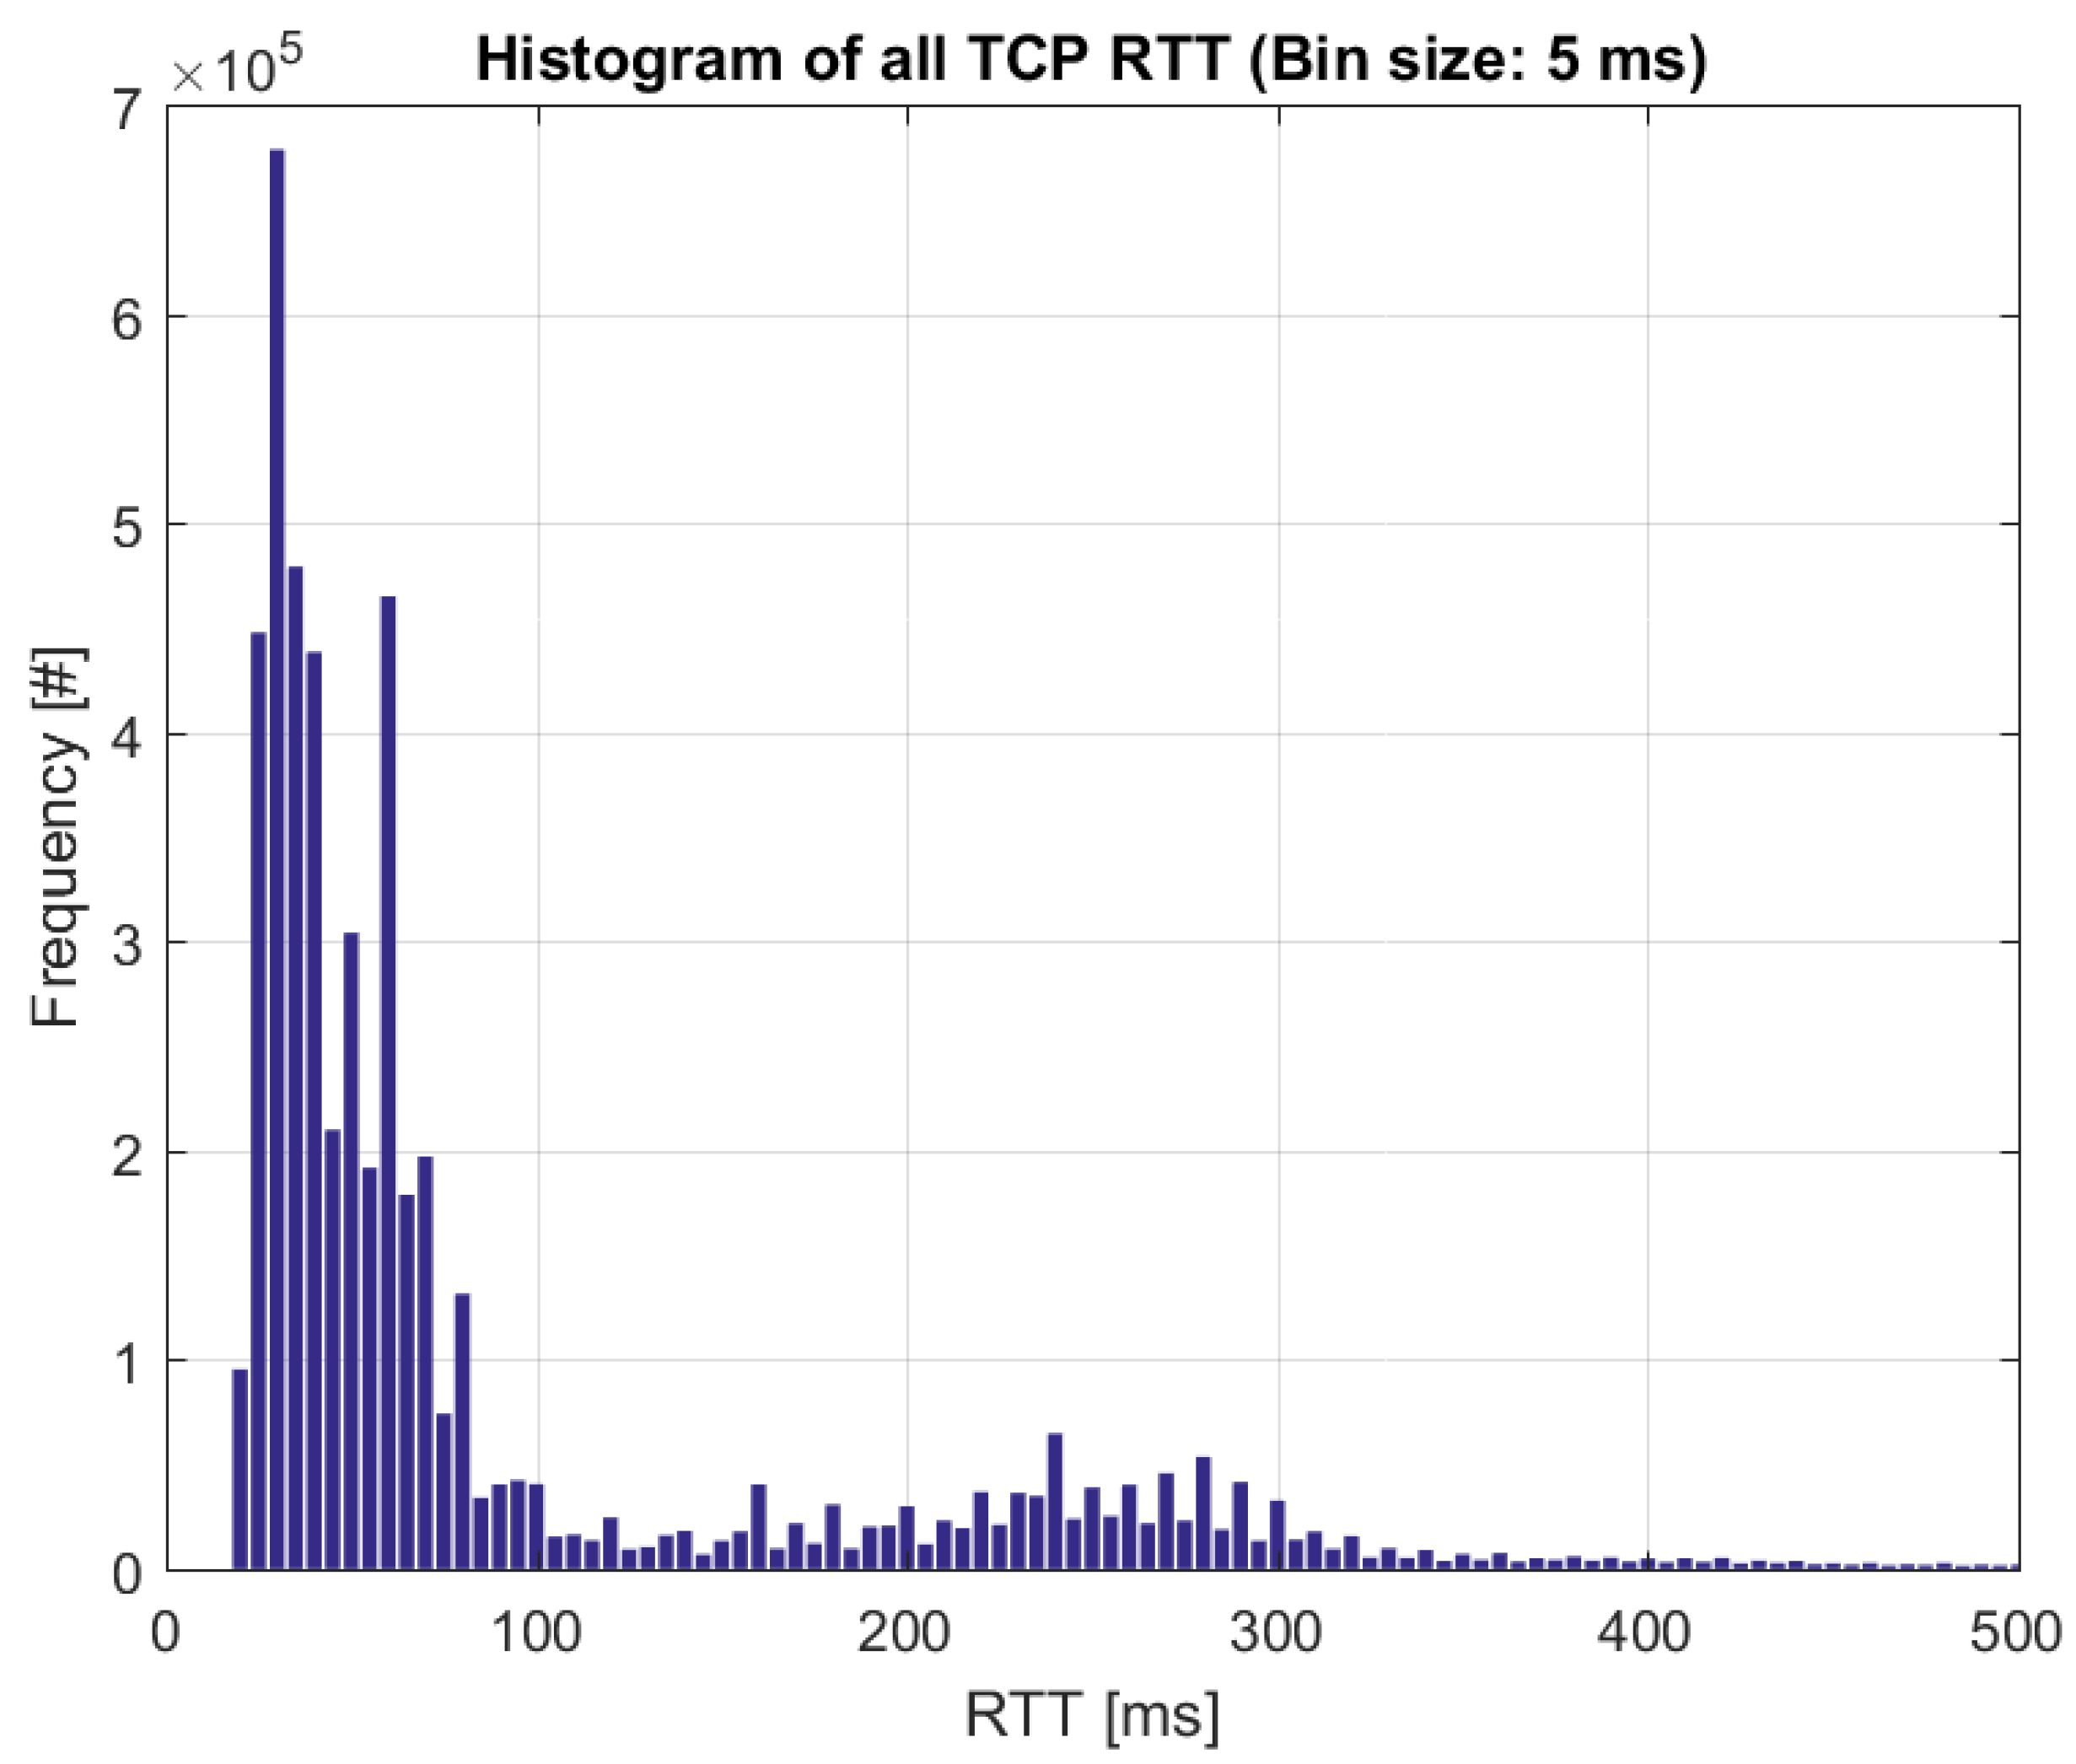
The measurements that are used in this context are RTT and signal strength measurements. RTT is measured using both UDP and TCP. A request packet is sent to the server that replies as fast as possible. The time between the request and the reply packets is logged as the RTT. Request/reply sequences are not overlapping and for TCP the connection handshake is done before the measurement is initiated. NetMap performs a set of measurements periodically, and for each period 20 RTT request/reply sequences are performed. The signal strength is logged for the currently active connection after the RTT measurement is done.
In the following, measurements from the three different ISP networks are presented, based on 2G, 3G and 4G technologies. These measurements are based on packet loss and RTT measured using several devices. The measurements are based on around 683000 RTT measurement sequences at different distances/locations of the end devices from the communication masts of different ISPs, capturing almost entire Denmark (for details, see [63]). These measurements have been obtained over a period of one and a half year with varying number of end devices. Figure 2 summarizes the results of RTT measurements from the three ISPs (based on 2G, 3G and 4G technologies) in terms of Cumulative Distribution Function (CDF) i.e., probability that RTT takes a value less than or equal to a certain range of time in milliseconds. While Figure 3 shows the number of packets sent using three ISPs along with the packet drop probabilities in each case.
These NetMap-based measurements are highly useful as they provide realistic performance under realistic conditions from networks that are normally hard to obtain information from/about, and are relevant for e.g., operators (such as TSO) to assess their possibility to provide connectivity service to control systems. These measurements patterns have been used in testing the provision of online frequency control support service from WPPs (See Section 5.3).

3. Use Case and Test Scenarios

This section presents the considerations and assumptions made related to the use case and test scenarios in this paper.
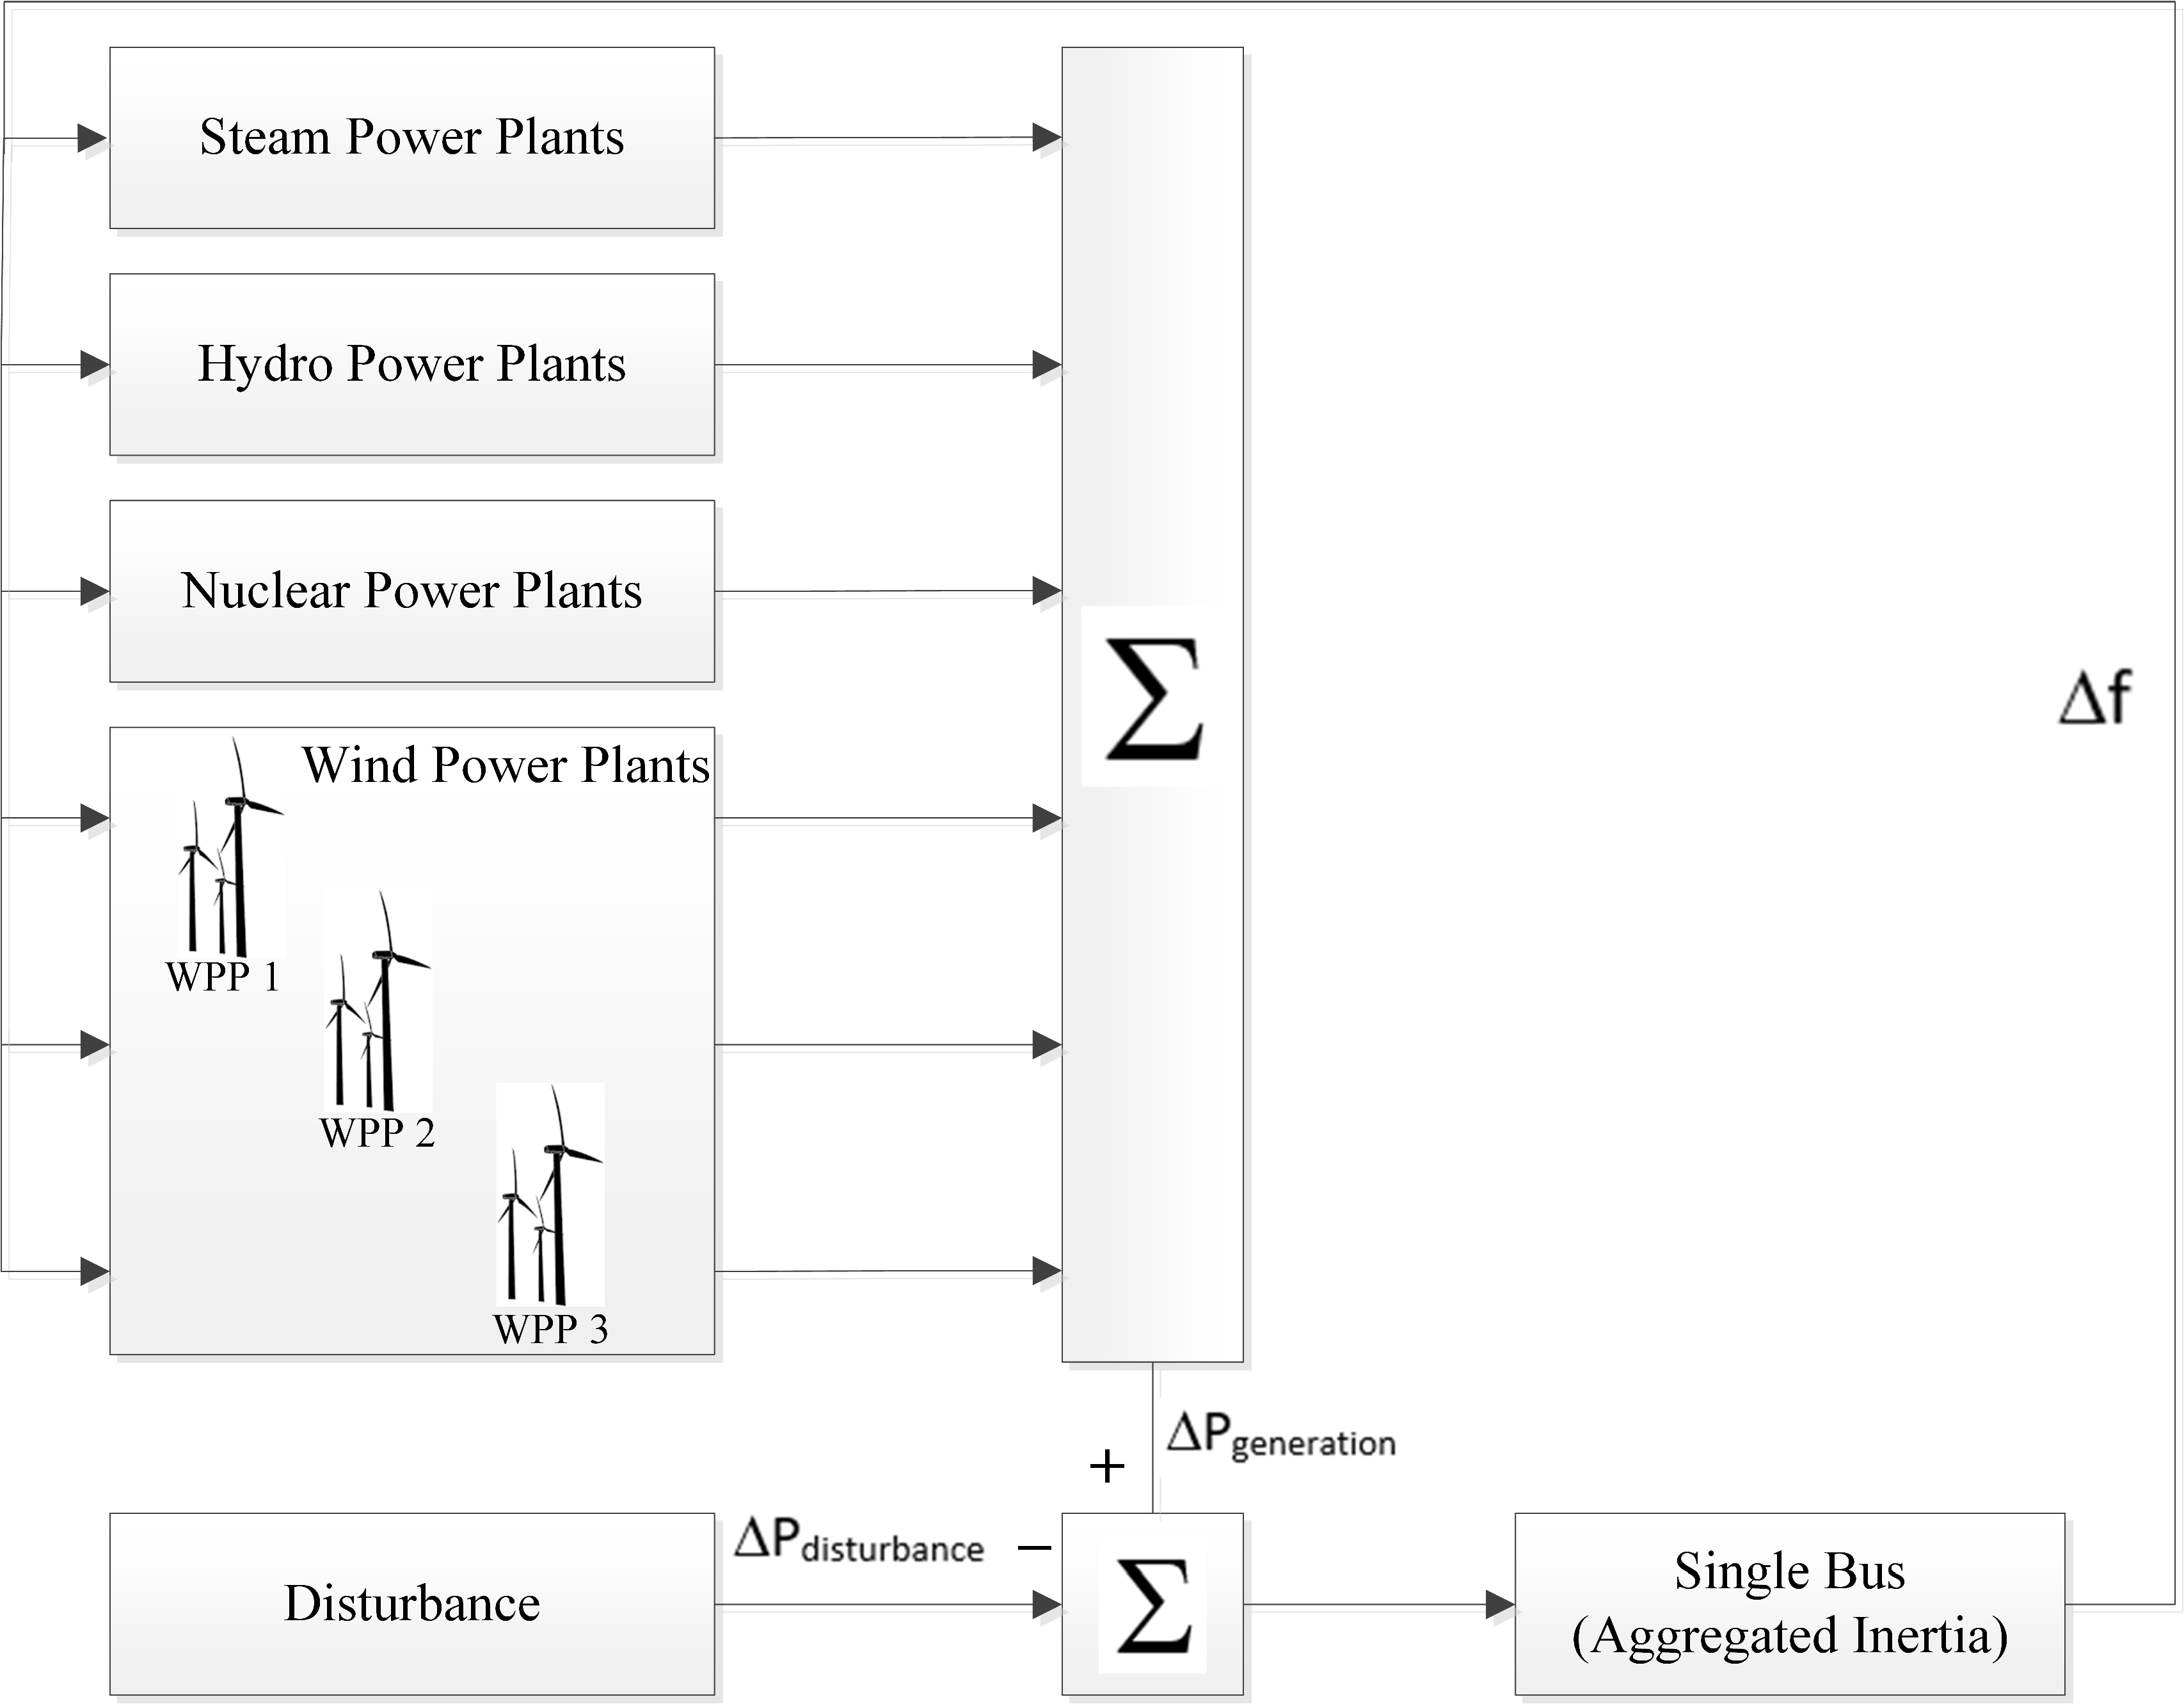
As a part of power production from ReGen plants, only WPP generation is considered. The contribution from other renewable sources (such as PVP) is also important; however, it is left for future research. (Note: In Denmark, out of the total generation capacity, wind energy is around 43%, while that from PVP is around 3% (to date) [66]. The rest of power generation is contributed from steam, hydro and nuclear power plants, respectively.). For this paper, the wind power penetration is set to contribute 50% of the total generation. Although the power system model used in this paper can be evaluated for various wind power penetration levels, but this assumption is specifically made to comply with Denmark’s mid-term goal to achieve 50% power production from RES [1]. (For more details of 50% wind power penetration level, see Section 5.1).
The real power system in Denmark does not consist of a single WPP [66]. Similarly, around the globe, depending on the system size, there are several WPPs connected to the grid and operate at different operating conditions as the prevailing wind speed varies geographically. It is, therefore, valuable to investigate how combined frequency support from multiple WPPs performs under varying network conditions. For this reason, there are three WPPs connected to the power system. These WPPs are divided into offshore and onshore WPPs. Based on the size of a WPP, the onshore WPPs are further subdivided into two groups. These groups depict the future Danish power system with major contribution from wind power plants of different sizes. The three WPP groups are assumed to have equal share of power generation, see Table 1:
When kinetic energy of a wind turbine is used, there can be a reduced active power output at the recovery period depending on the wind speed [21]. According to [67], Denmark is one of the major areas in European communities that have a high wind energy resource. However, in a small country like Denmark, the wind speeds tend to be almost the same throughout its territory, while in larger interconnected systems varying wind speeds can occur in different parts [67,68]. Therefore, from the range of wind speed distribution found in Denmark [69], two instantaneous wind speeds (7 and 14 m/s) are selected to test the impact of communication on frequency control support from WPPs. Choosing these wind speeds will cover a large part of a typical wind speed distribution found in Denmark [69]. Here, 7 m/s is the wind speed corresponding to partial loads in the WT, while 14 m/s wind speed corresponds to full loading (full power production). Hence, the results of this paper will be applicable over a wide range of operating points encountered during the normal operation of WPPs in Northern Europe.
It is also pertinent to mention here that the tests cases in this paper are based on the assumption that all WPPs are operating under the same wind regimes (i.e., all WPPs are experiencing the same wind speed at a time). However, as a part of future research, the impact of ICT on frequency control coordination from WPP with non-uniform wind speeds will be explored. Table 2 shows the two wind speeds-based test cases for both onshore and offshore WPPs.
While connecting the WPP to a control center, a network can either be private or public. Private networks are fully owned and the cross traffic can be easily managed. In fact, if the only entities allowed on the network are those with time critical data, then in most cases (i.e., cables are not physical cut, the wireless frequency is not directly jammed by external sources, etc.) data will be reliably transported fast and efficient with most modern communication technology. However, this is an extremely expensive and inefficient solution. Additional traffic can obviously be put on the network, but the routers in between that take care of the traffic ending at the right address must be able to differentiate between packets, i.e., provide Quality of Service (QoS), which requires configuration and management. Owning the network enables full control of QoS settings but is costly and requires proper manning and expertise to operate and maintain the network. Further, private networks are for security reasons more likely to be standalone, disabling communication and data exchange beyond certain boundaries, which for some applications is a degradation. For instance, remote monitoring or control of systems are often not possible outside control rooms due to physical separations of external networks.
On the other hand, public networks refer to the networks that are operated by e.g., tele-operators or any other third party company or service provider, which has the expertise and manning to operate the network, routers, etc. In such networks, internals of the network are not to be taken care of by the end user, thus, can enjoy data being transported from source to destination in most cases at best effort. Only limited possibility to control QoS settings are given if additional money is paid. Tele-operators work with the concept of M2M communication, which allows certain timely and reliability requirements to be satisfied since traffic is internally prioritized effectively for transportation. It is worth noting that it is only the case as long the data traffic stays within boundaries of the given tele-operator. If data goes outside the domain of the tele-operator, then QoS is most likely to be lost, thus, time and packet loss rates cannot be guaranteed. However, public networks are cheap and flexible, but suffer to the extend that these have to be shared among millions of other customers, hence exposes data exchange to stochastic non-controllable delays and packet drops.
Since the size of offshore WPPs in this paper is considered to be above 100 MW i.e., large wind power plants, the network connection is set to be private, so that high QoS in terms of fixed deterministic delay as well as other communication properties can be guaranteed. While for the onshore WPPs, both private as well as public network connections are considered in the test cases. Furthermore, as an ideal case, a test scenario with all private connections is considered to guarantee high QoS in communication. (see Table 3).

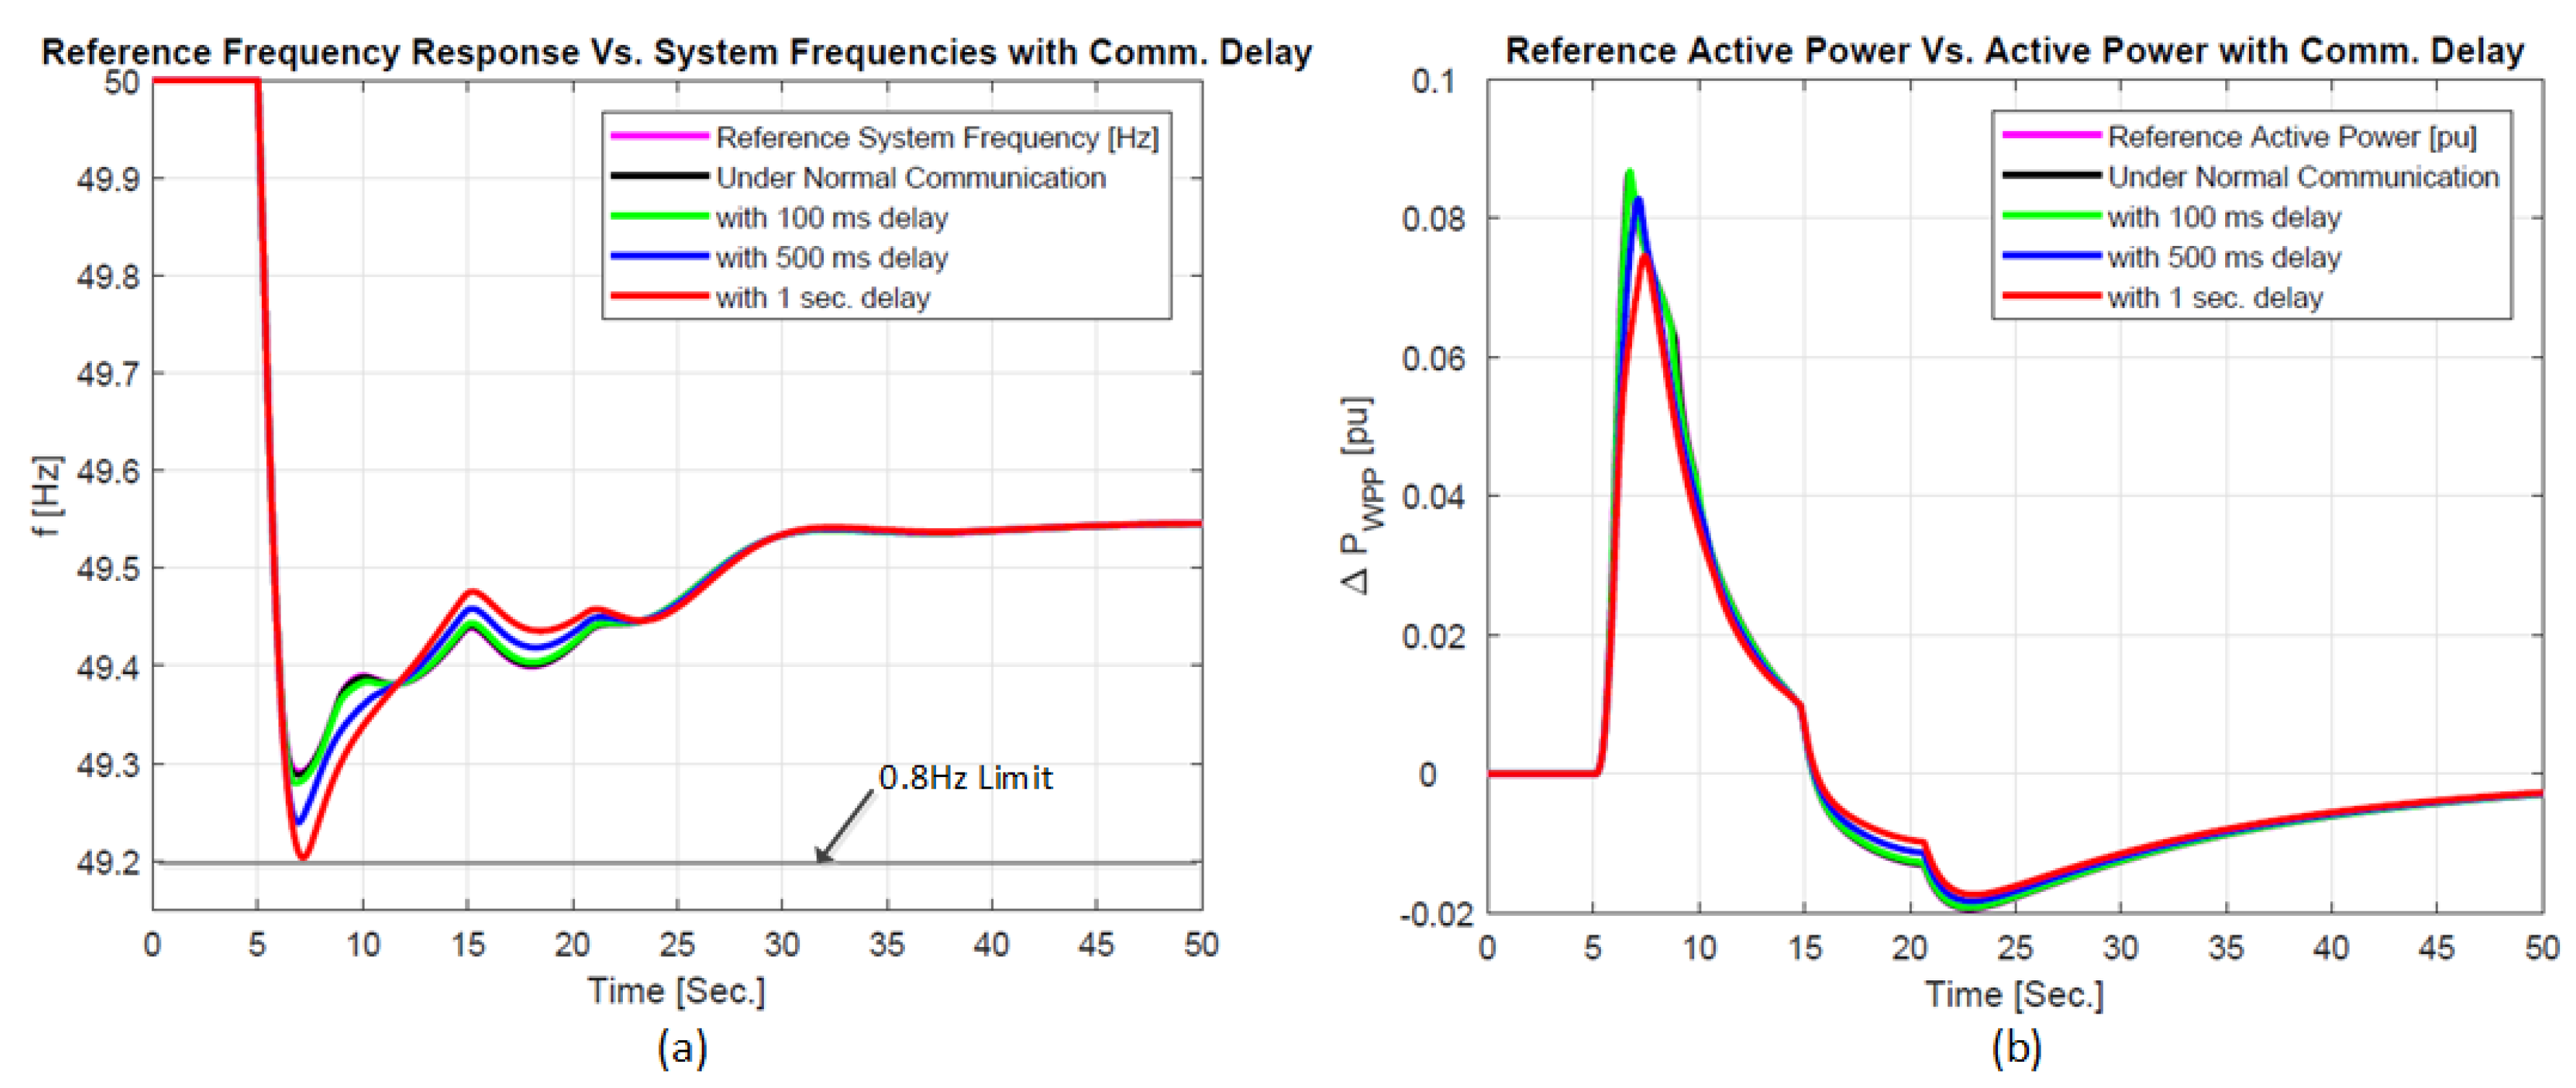
4. Evaluation Criteria—Key Performance Parameter (KPI)

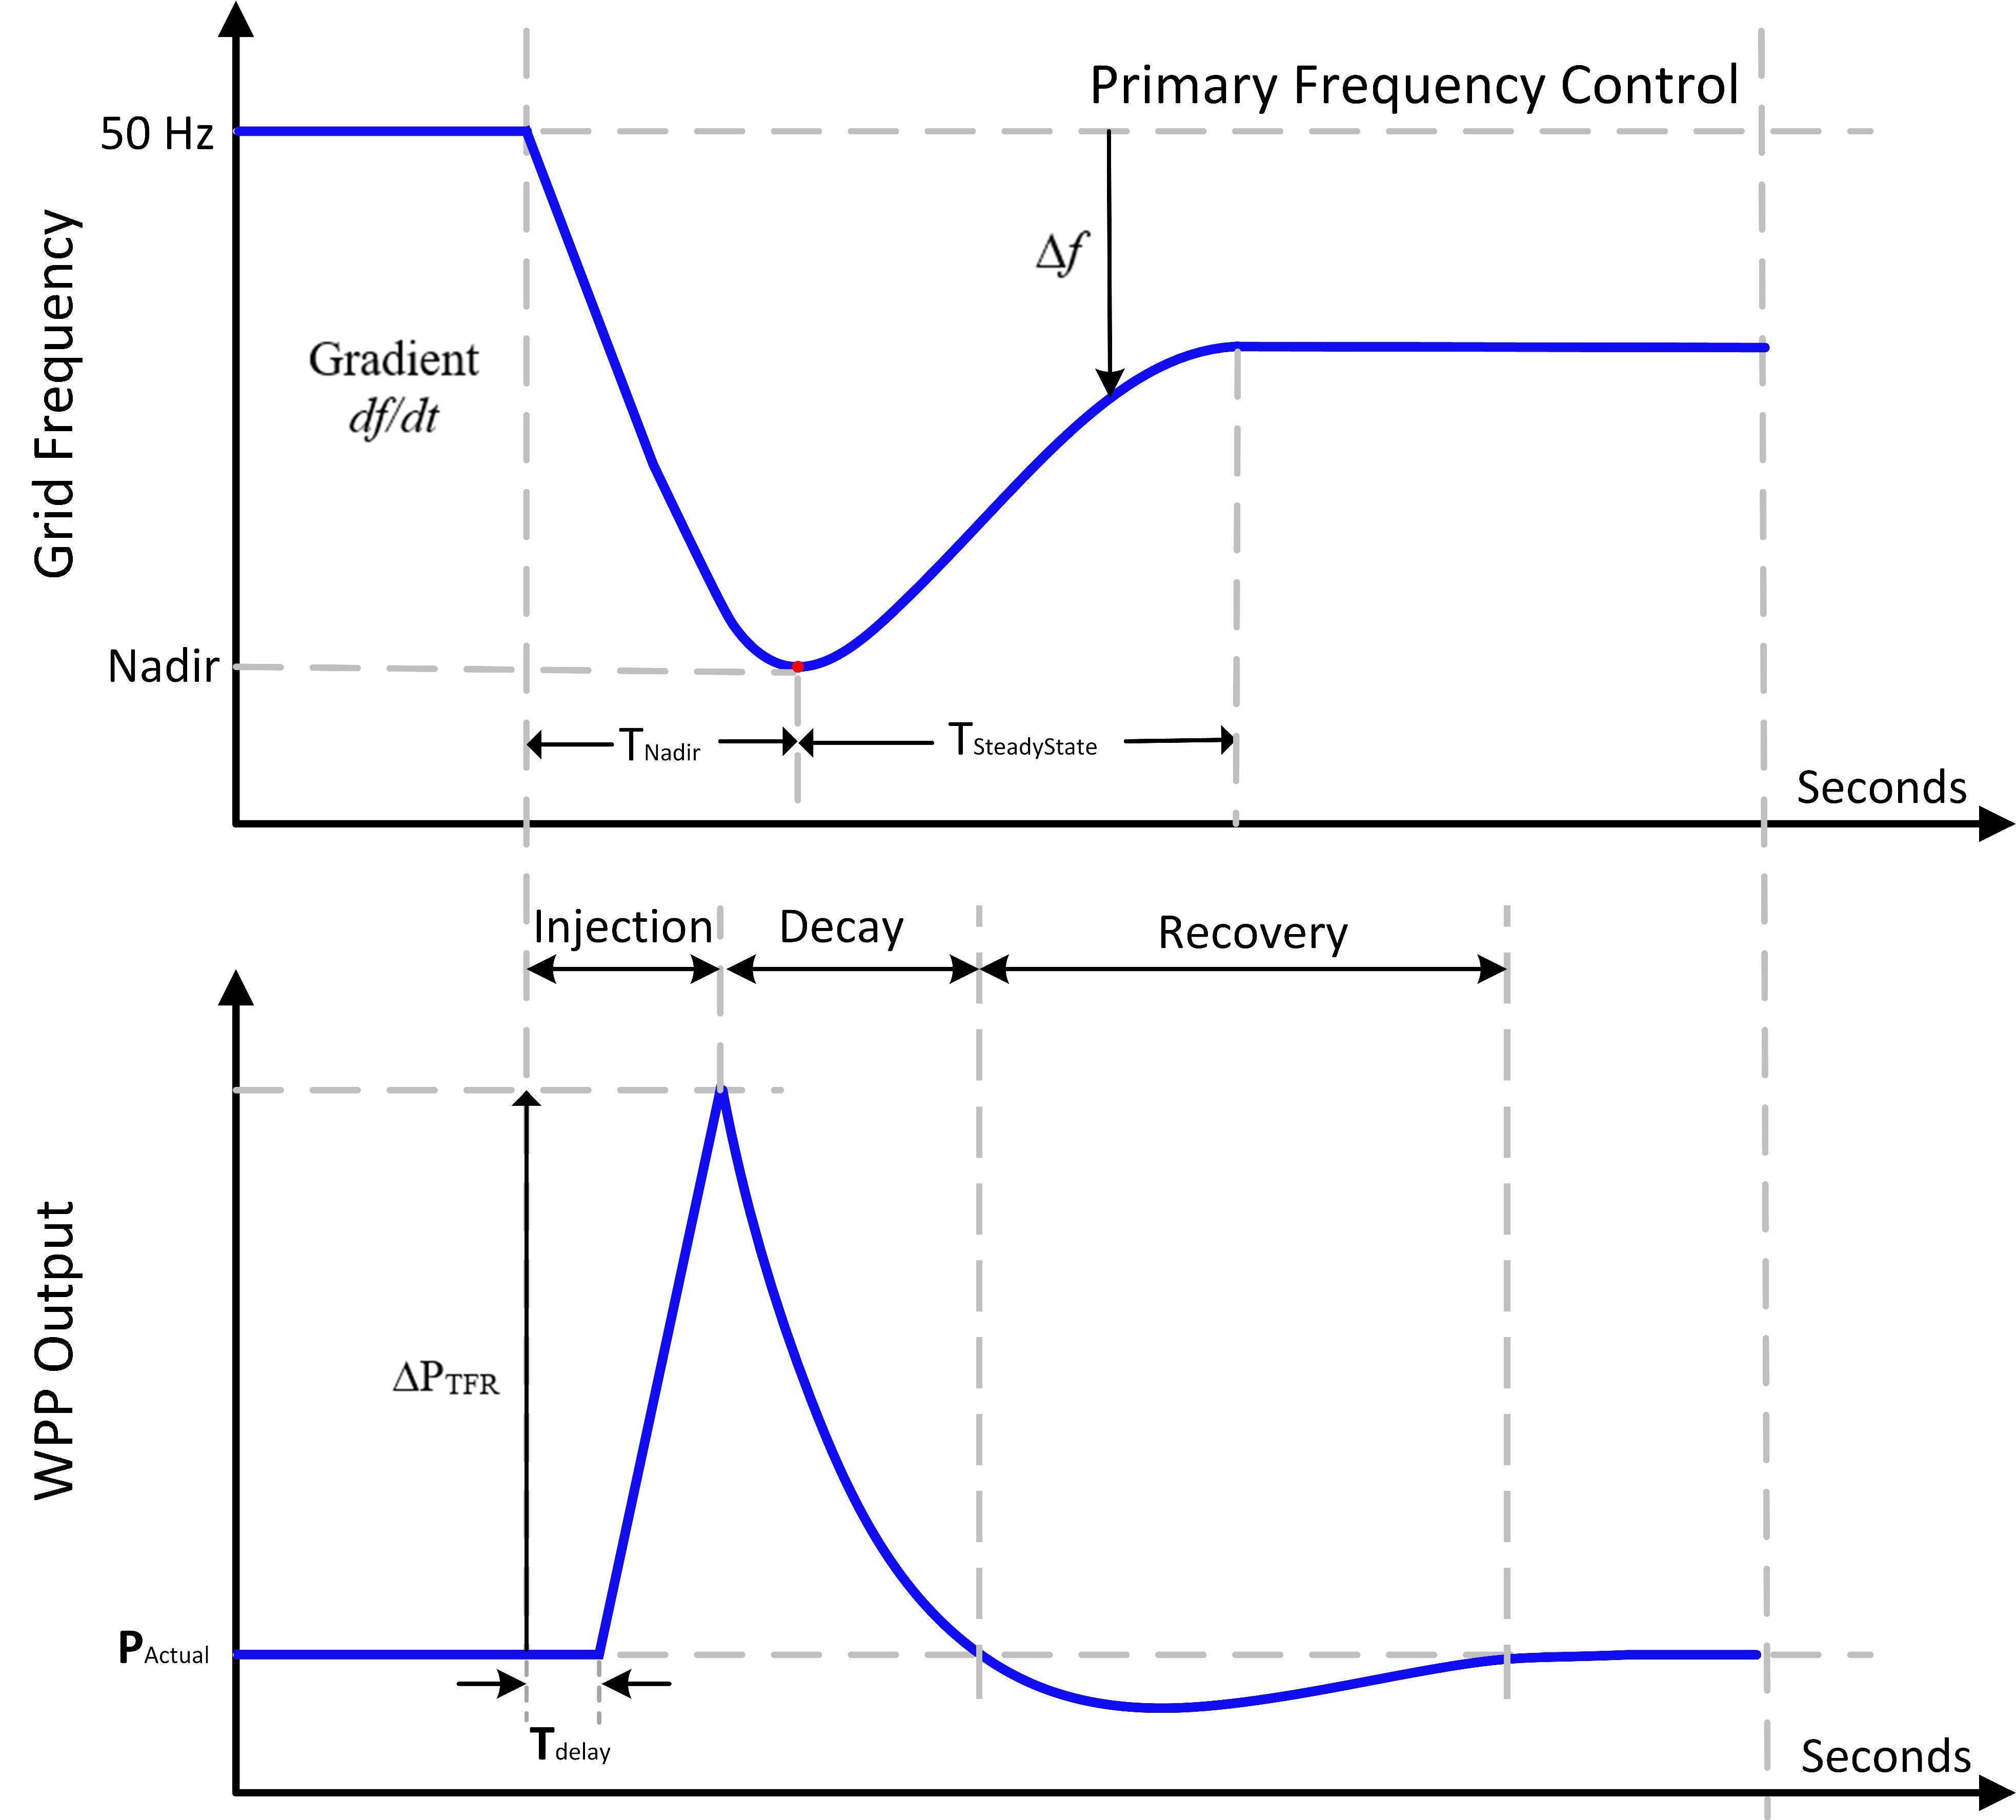
The results of each test scenario will be discussed and evaluated with regards to the following three important frequency metrics for the operation of a power system (see Figure 4) [46]:
Frequency Nadir ( f N a d i r )
It describes the minimum point reached by the frequency after a disturbance (see Figure 4). This metric is important as too low values might trigger protection devices. An improved frequency response should therefore increase the frequency nadir, i.e., reduce the maximum frequency deviation. Due to the under-frequency load shedding limits, the value of f N a d i r is fixed around 0.8 Hz in systems with 50 Hz operational frequency [20], while it is 0.9 Hz in systems with 60 Hz operational frequency [20].
Time to reach frequency nadir ( T N a d i r )
It is related to the system inertia. The earlier the nadir is reached, the more energy is released directly after the disturbance. It is, therefore, preferable to reduce T N a d i r (see Figure 4), as it can also have an impact on primary and secondary control.
Time to reach steady state frequency ( T S t e a d y S t a t e )
Since the goal of primary frequency control is to contain the frequency to a new steady state after the disturbance and thereby reduce the dynamic part of the response, a quicker return to steady state is favourable. Therefore, an improvement in the frequency support is indicated by a smaller value of T S t e a d y S t a t e (see Figure 4).

5. Evaluation Setup and Test Cases

5.1. Power System Simulation Model

A generic large-scale power system model described in [46] is used as such to analyze the ICT impact on a coordinated frequency support from WPPs. The frequency control dynamics of a generic large-scale power system are represented as a single-bus model with three WPPs and different types of other conventional power plants, such as steam, hydropower, and nuclear power plants (see Figure 5). The models of conventional power plants are based on the general purpose governor model, adapted from [70]. The power system is designed to be in balance initially for all test cases, while for testing purposes, a disturbance is introduced at t = 5 s in each case. The disturbance is actually introduced by simulating the incidence of power system disturbance on 4 November 2006—ENTSO-E for iTesla project [71]. According to [71], on 4 November 2006, the Union for the Coordination of Transmission of Electricity (UCTE) interconnected European grid was affected by a serious incident originating from the North German transmission grid during night at around 22:10. This incident led to power supply disruptions for more than 15 million European households and a splitting of the UCTE synchronously interconnected network into three areas. This disturbance could have turned into a European-wide blackout but immediate action were taken by all TSOs. However, since this event ranks among the most severe and largest disturbances in Europe [71], it has been considered in this work.
In the given system, since the power system is a combination of WPP as well as other types of power plants, the amount of power shared by WPPs will be important factor that has a large impact on the severity of a given load step. The higher the share of wind power, the more synchronous inertia is displaced and the more unstable the system becomes if no further measures are taken [46]. As described in Section 3, for this paper the share from WPPs is set to be 50% to account for Denmark’s mid-term goal regarding renewable energy. In this paper, the wind power share is calculated as follows [46]:
W i n d P o w e r S h a r e = W i n d P o w e r G e n e r a t i o n P e a k L o a d
Here, reference load is the peak load of a given power system, while wind power generation corresponds to 50% of the total load. The various loads adopted in [46] and in this paper for each power generation plant are shown in Table 4. It is important to note that 50% wind power penetration level is assumed constant for the total wind power in the present study, and only wind speed variations are considered for each wind power plant. This is a conservative assumption; however it can represent the boundaries of the power system operation scenarios such as high load-high wind, low load-low wind, etc. If the wind power penetration depends on the wind speed in the simulations, the wind power penetration will vary for each scenario, which will change the power system frequency profile (i.e., different base cases). Since the aforementioned power system model represents the average frequency and active power deviations, this assumption is reasonable in order to assess the frequency support capability of wind power plants in the presence of the communication infrastructure. It should be noticed that the models and analysis aim the high level performance and investigations for a given power system.

5.2. Communication Network Model

A Communication Network Model (CNM) is added between each WPP and the aggregator control (see Figure 1), where the aggregator control unit is responsible of calculating and sending the optimal set-point values. The aggregator, CNM and WPP models are shown as three distinct levels in Figure 6.
Typically, while testing power system models with a communication setup, a fixed transport delay is used to understand network behavior or the impact of delay on information. However, in reality there is much more on top of a simple delay by which a signal might be effected. For instance, as discussed in Section 2, while considering public networks as a means of coordination between ReGen plants and the system operators, a constant delay or packet loss cannot be guaranteed. It is, therefore, necessary to see how different network conditions (in terms of higher delays or packet drops) affect the performance of a signal. Thus, the communication network(s) shown in Figure 6 is a network emulator that has been developed in Matlab/Simulink to provide pattern-based network emulation. Figure 7 shows the CNM used for evaluation of online frequency support from WPPs (for details of this model, see [72]). The patterns that describe the desired changes in the traffic can be created from analytical expressions or traces collected through a real network and are matched with traffic packets to required behavior in time driven mode. As a result, it provides a user with a reasonable estimate of what end-to-end performance can be expected from a communication network. As described in Section 2.3, the patterns (based on end-to-end delays and packet loss) in this work are based on real measurements obtained using NetMap [62,73]. It is pertinent to note that since the data was collected via cell phones, it is not what a non-mobile electrical unit would accurately achieve in terms of network performance. However, it gives a reasonable estimate of what an asset can expect in terms of end-to-end performance from a communication network.
Figure 8 shows a combined histogram of RT-RTT measurements captured from all over Denmark using several devices (see Section 2.3). Although the measurements were captured for both TCP as well as UDP protocol, but only TCP-based measurements are utilized because TCP is used as a standard transport protocol in almost all industrial applications especially IEC 61850. From Figure 8, it can be observed that for the maximum cases, RTT lies within the range of 30 ms approximately. This means that a 15 ms delay (half of RTT—assuming the same route for request and reply to/from the server) in the transfer of information update can be expected for the maximum times in daily operations. However, this network being heterogeneous (and shared by a large number of users), the delay continuously varies depending on the network conditions and number of users using the network. For the worst case, the delay is observed as high as 500 ms (RTT).

5.3. Reference Scenario for Frequency Response Evaluation

In [46], results related to frequency response and power output of WPPs were obtained through optimized parameters without any communication model. Those results were based on uniform as well as non-uniform wind speeds. However, for this paper, the tests cases are only based on uniform wind speeds (i.e., 7 and 14 m/s, see Section 3). Therefore, the results based on uniform wind speeds in [46] are considered as reference and used to evaluate the deviation from optimum frequency control coordination due to added latencies.
Figure 9a shows the system frequency and total active power from WPPs for partial loads which corresponds to an average wind speed of 7 m/s, while Figure 9b shows the the system frequency and total active power from WPPs for full loads which corresponds to an average wind speed of 14 m/s.

5.4. Test Cases

For each test scenario described in Table 3, two tests are considered based on the inclusion of a communication network i.e., (a) with standard communication parameters (specifically delay), and (b) with higher delays in case of public networks due to cross traffic and/or network congestion, etc.
Test Case 1—Standard Communication
As in a private network, there is a full control over the network traffic and a constant delay can be guaranteed, therefore, a fixed standard delay of 10 ms is considered. However, in case of public networks, a constant delay cannot be guaranteed (as seen in Section 2), thus the delay traces from a real network are used instead. Combining the results of delay traces obtained from NetMap (see Figure 8), it can be concluded that the information packet is delayed around 15 ms (30 ms TCP RTT) for the maximum times.
Test Case 2—Higher delays
For higher delays in communication, three different delays are considered on top of standard communication delays, i.e., 100 ms, 500 ms and 1 s to observe the deviation of frequency response from the one obtained from optimum parameters. The one second delay in communication is considered to be the minimum delay that incurs in case of a failure at a communication mast level, etc.

6. Test Results—Impact of Communication Properties on Online Frequency Control Coordination

In the following, reference system frequency (in Section 5.3) is compared with those obtained under different delay conditions. This will give an understanding of the extent to which a network delay may affect the system’s ability to support frequency control coordination from WPPs.

6.1. Test Scenario 1

As in Section 3, Test Scenario 1 accounts for private connections for all WPPs and evaluated under partial as well as full load (see Table 5).
Figure 10 shows the system frequency (blue) at partial as well as full load after inserting the communication link between the aggregator and WPPs. This current system frequency is compared to the reference system frequency (red) in Section 5.3.

Results Discussion and Summary

Table 6 provides, for partial load and full load, a comparison of the different values of f N a d i r , T N a d i r and T S t e a d y S t a t e with the ones obtained from reference frequency response in Section 5.3. The comparison shown in Table 6 is further presented in a graphical form in Figure 11.
It can be noted that with private network connections between WPPs and control center (aggregator/TSO), all performance metrics match with that of the reference metrics. This implies that private communication networks can prove to be the best source of obtaining optimized/required frequency control coordination from WPPs.

6.2. Test Scenario 2

Test scenario 2 accounts for a public network connection for small size onshore WPP, while private connections for the other two WPPs and evaluated under partial as well as full load (see Table 7).
Figure 12a and Figure 13a show different system frequency responses at partial and full load, respectively, after inserting the communication link between the aggregator and a small share from WPPs (i.e., one-third of the total wind power production). The system frequencies obtained with different network delays are compared with the reference system frequency in Section 5.3. While, Figure 12b and Figure 13b show the total active power of the system at partial and full load, respectively, with different network delays compared with the reference active power in Section 5.3.
Based on the results shown in Figure 12a and Figure 13a, it can be concluded that f N a d i r decreases with an increase in communication delays, even if a small share of WPPs is connected to the public networks. In case of partial load (Figure 12a), the frequency limit of 0.8 Hz is reached for delays of around 1 s. While in case of full load (Figure 13a), although f N a d i r is decreased by increasing communication delays, however the load shedding limit of 0.8 Hz has not reached for the current setup.

Results Discussion and Summary

Table 8 provides, for partial load and full load, a comparison of f N a d i r as well as T N a d i r with the ones obtained from reference frequency response in Section 5.3 in terms of Δ f N a d i r and Δ T N a d i r , respectively. Where, Δ f N a d i r and Δ T N a d i r are given as:
Δ f N a d i r [ H z ] = f N a d i r , R e f e r e n c e f N a d i r , W i t h D e l a y
In addition,
Δ T N a d i r [ H z ] = T N a d i r , R e f e r e n c e T N a d i r , W i t h D e l a y
The comparison shown in Table 8 is further presented graphically in Figure 14.
The increasing values of Δ f N a d i r in Figure 14a also indicate that f N a d i r continuously decreases with the increase in communication delay for partial as well as full load. However, in Figure 14b, Δ T N a d i r for partial load is observed to be less than the reference T N a d i r , as indicated with the positive values. While, a negative value of T N a d i r is observed at a communication delay of 1 second, which indicates an increasing T N a d i r with increasing communication delays. It is also pertinent to mention here that T S t e a d y S t a t e remains the same for all cases, as clear from Figure 12a and Figure 13a, therefore, not included in Figure 14 for comparison.

6.3. Test Scenario 3

Test scenario 3 accounts for a private network connection for offshore WPP, while public network connections for the other two onshore WPPs and evaluated under partial as well as full load (see Table 9). Figure 15a and Figure 16a show different system frequency responses at partial and full load, respectively, after inserting the communication link between the aggregator and a large share from WPPs (i.e., two-third of the total wind power production). The system frequencies obtained with different network delays are compared with the reference system frequency in Section 5.3. While, Figure 15b and Figure 16b show the total active power of the system at partial and full load, respectively, with different network delays compared with the reference active power in Section 5.3.
According to Figure 15a and Figure 16a, the affect on f N a d i r with an increasing communication delays become even more intense when a large share of WPPs is connected to the public networks. In case of partial load (Figure 15a), the frequency limit of 0.8 Hz has even reached for delays of around 500 ms. While in case of full load (Figure 16a), the load shedding limit reaches for delays up to 1 s in the current setup.

Results Discussion and Summary

Table 10 provides, for partial load and full load, a comparison of each f N a d i r and T N a d i r obtained in T e s t S c e n a r i o 3 with the ones obtained from reference frequency response in Section 5.3 in terms of Δ f N a d i r and Δ T N a d i r , respectively. The comparison shown in Table 10 is further presented graphically in Figure 17.
As in Test Scenario 2, the increasing values of Δ f N a d i r in Figure 17a also indicate that f N a d i r continuously decreases with the increase in communication delay for partial as well as full load. While, in Figure 17b, the same trend (as Test Scenario 2) for T N a d i r in case of partial loads can be observed in this scenario. In order to confirm this trend, the authors have plotted Δ f N a d i r and Δ T N a d i r for a series of varying delays, provided in Appendix A. Furthermore, Test Scenario 3 reveals that having a large share of ReGen plants on public communication networks may make the power system more prone to degrading the overall optimum frequency response in case the delays are increased from certain limit indicated in the test results. f N a d i r for partial and full loads is observed to be decreasing with increasing delays and the load shedding limit of 49.2 Hz is even exceeded for (absolute maximum) delays of 1 s. However, as in Test Scenario 2, T S t e a d y S t a t e remains the same for all cases in Test Scenario 3, (see Figure 15a and Figure 16a), therefore not included in Figure 17 for comparison.

7. Conclusion and Recommendations

This paper assesses the impact of ICT on the frequency control support (FFR) from ReGen plants, with special focus on WPPs. Considerations on main characteristics of delays in public and private networks are shown using real measurements. Various delays according to statistical measurements on traffic are also considered. A coordination scheme for FFR including parameters as proposed in [46] is considered for analysis. Two operating conditions of wind power plants are taken into consideration namely partial and full load respectively.
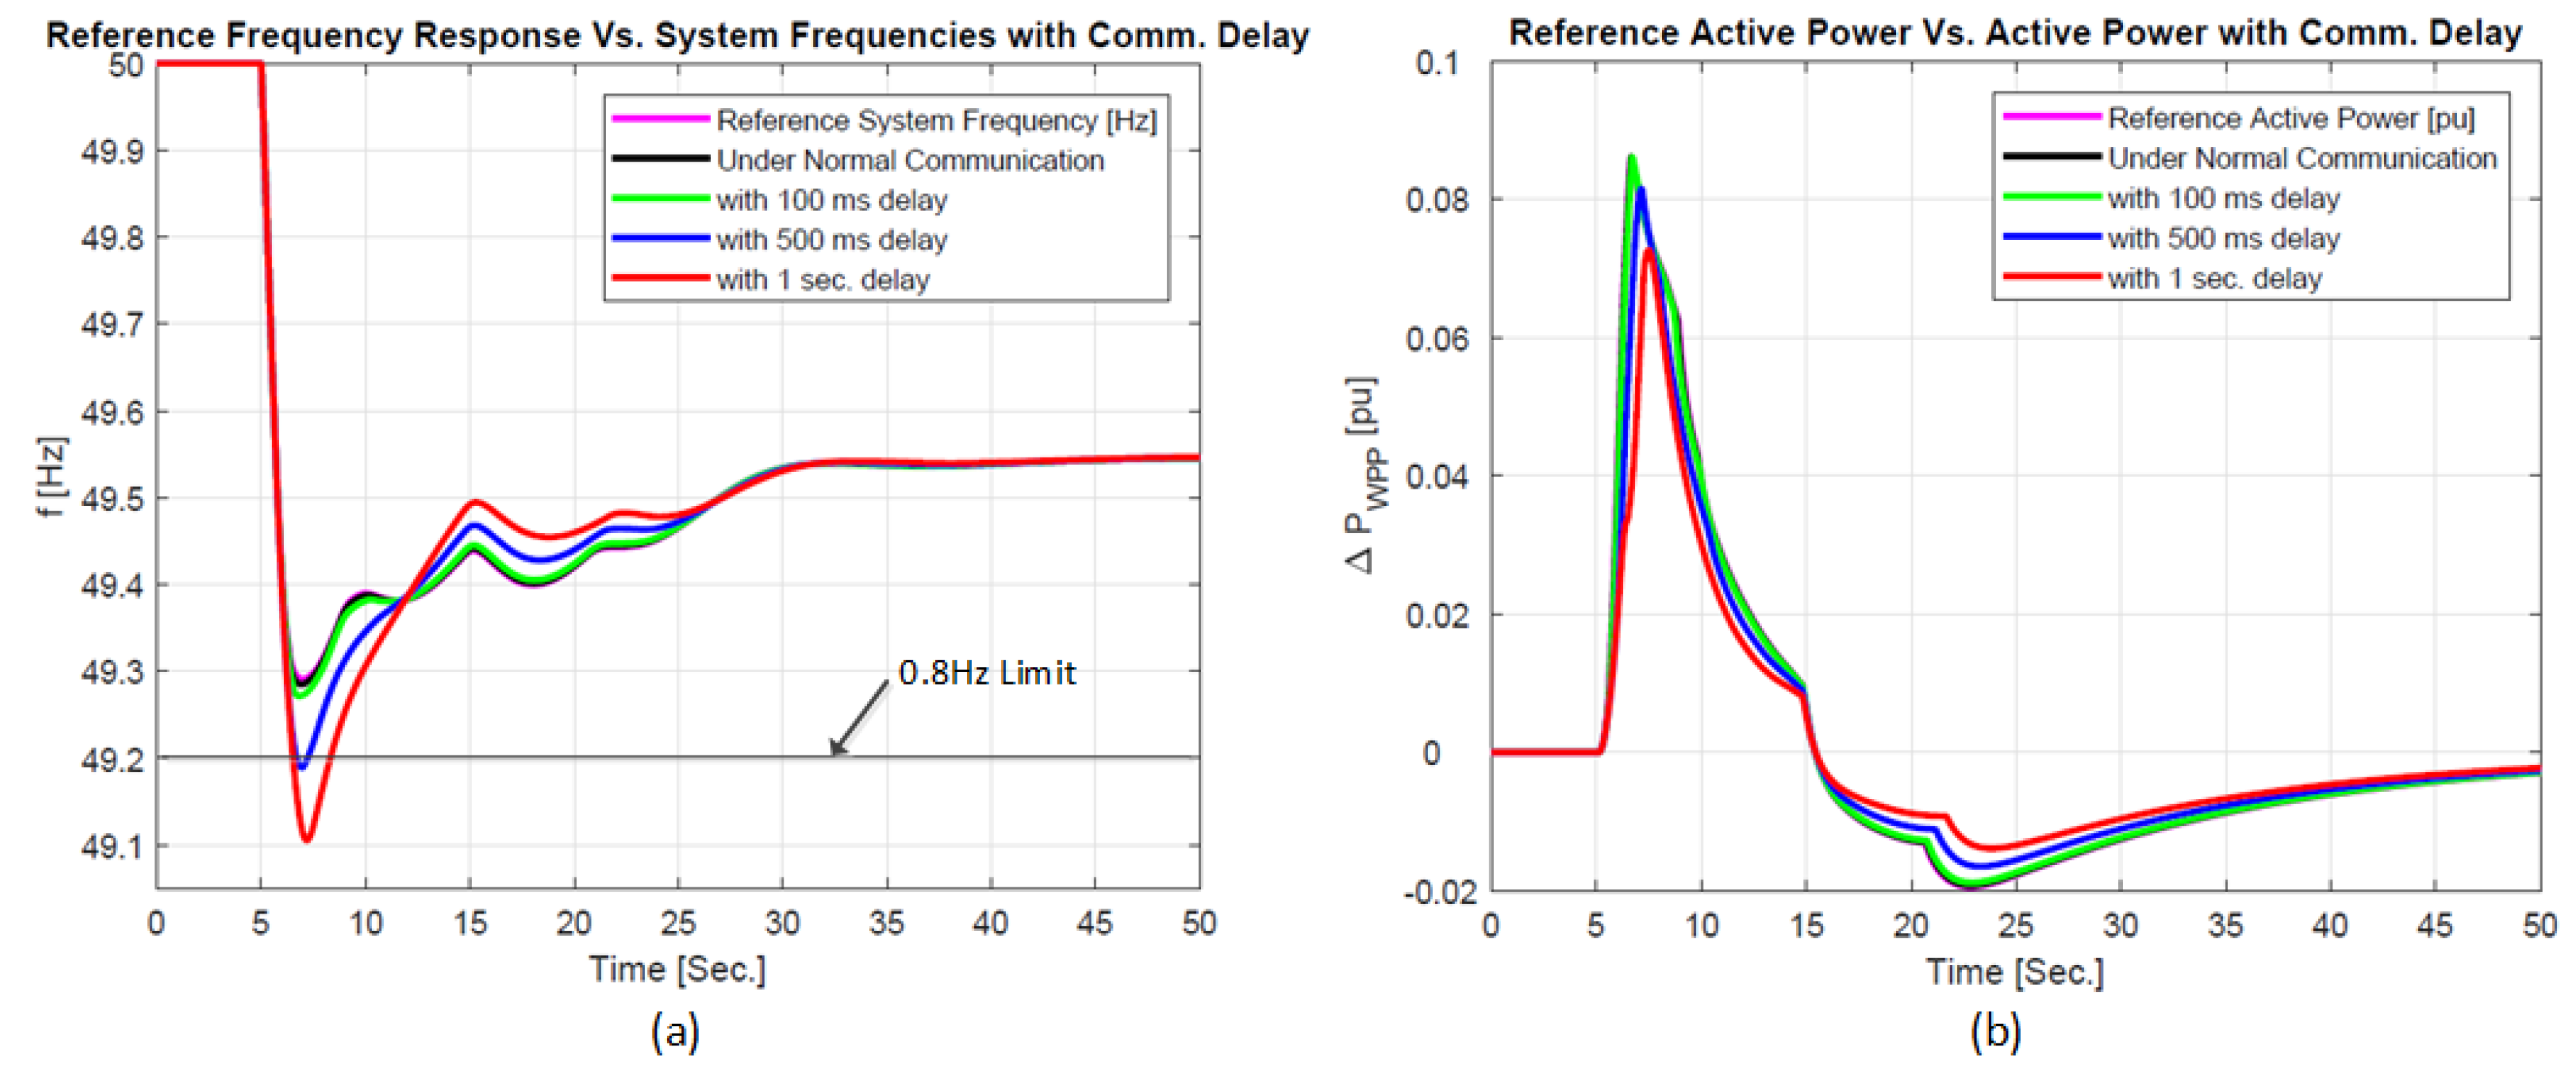
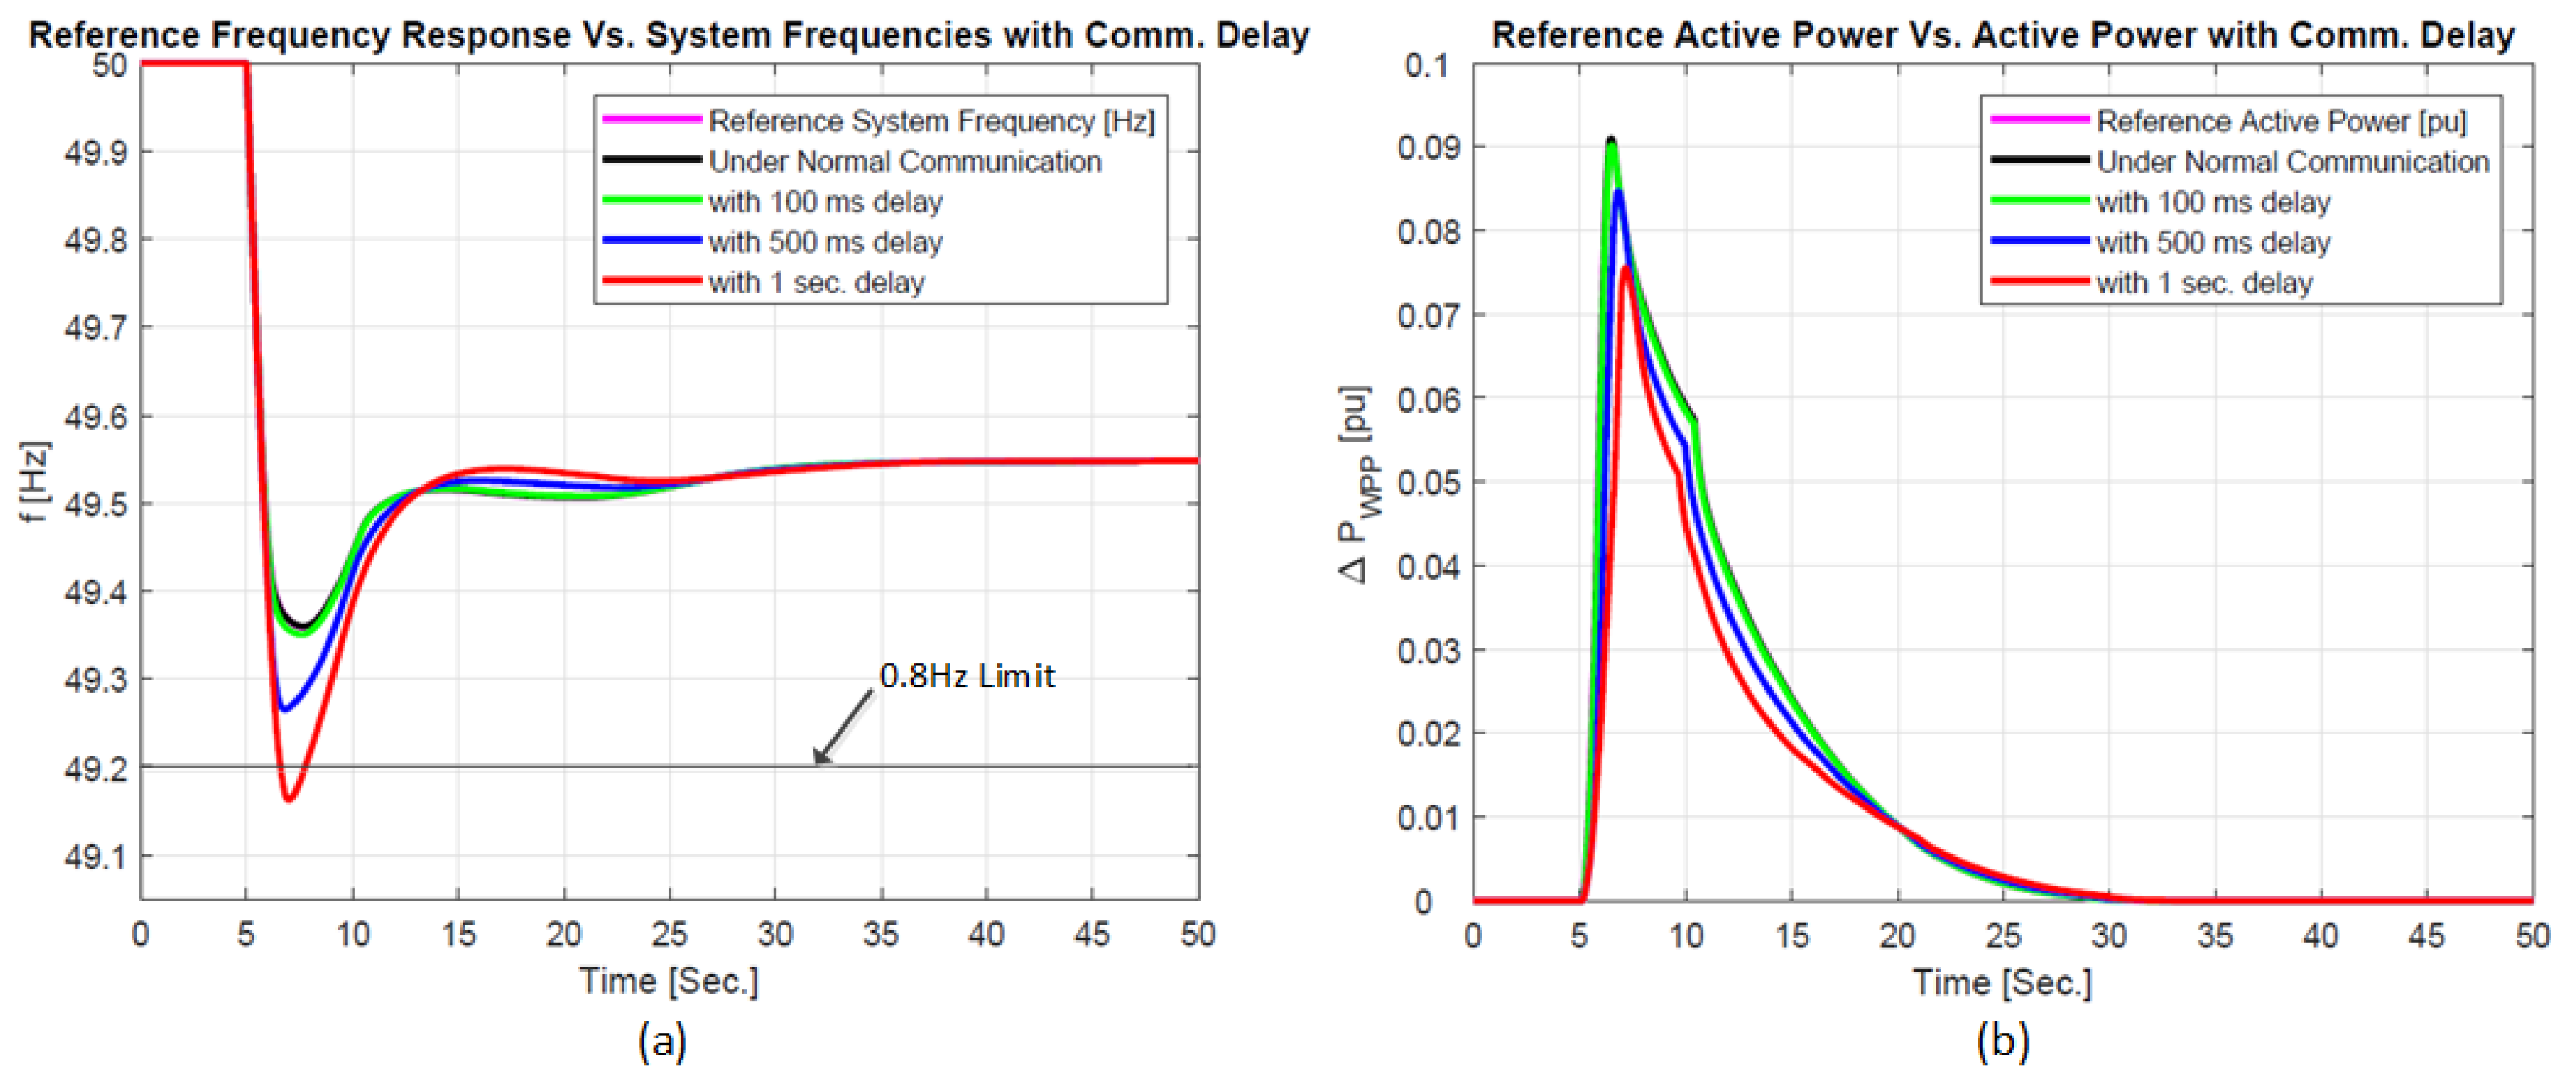
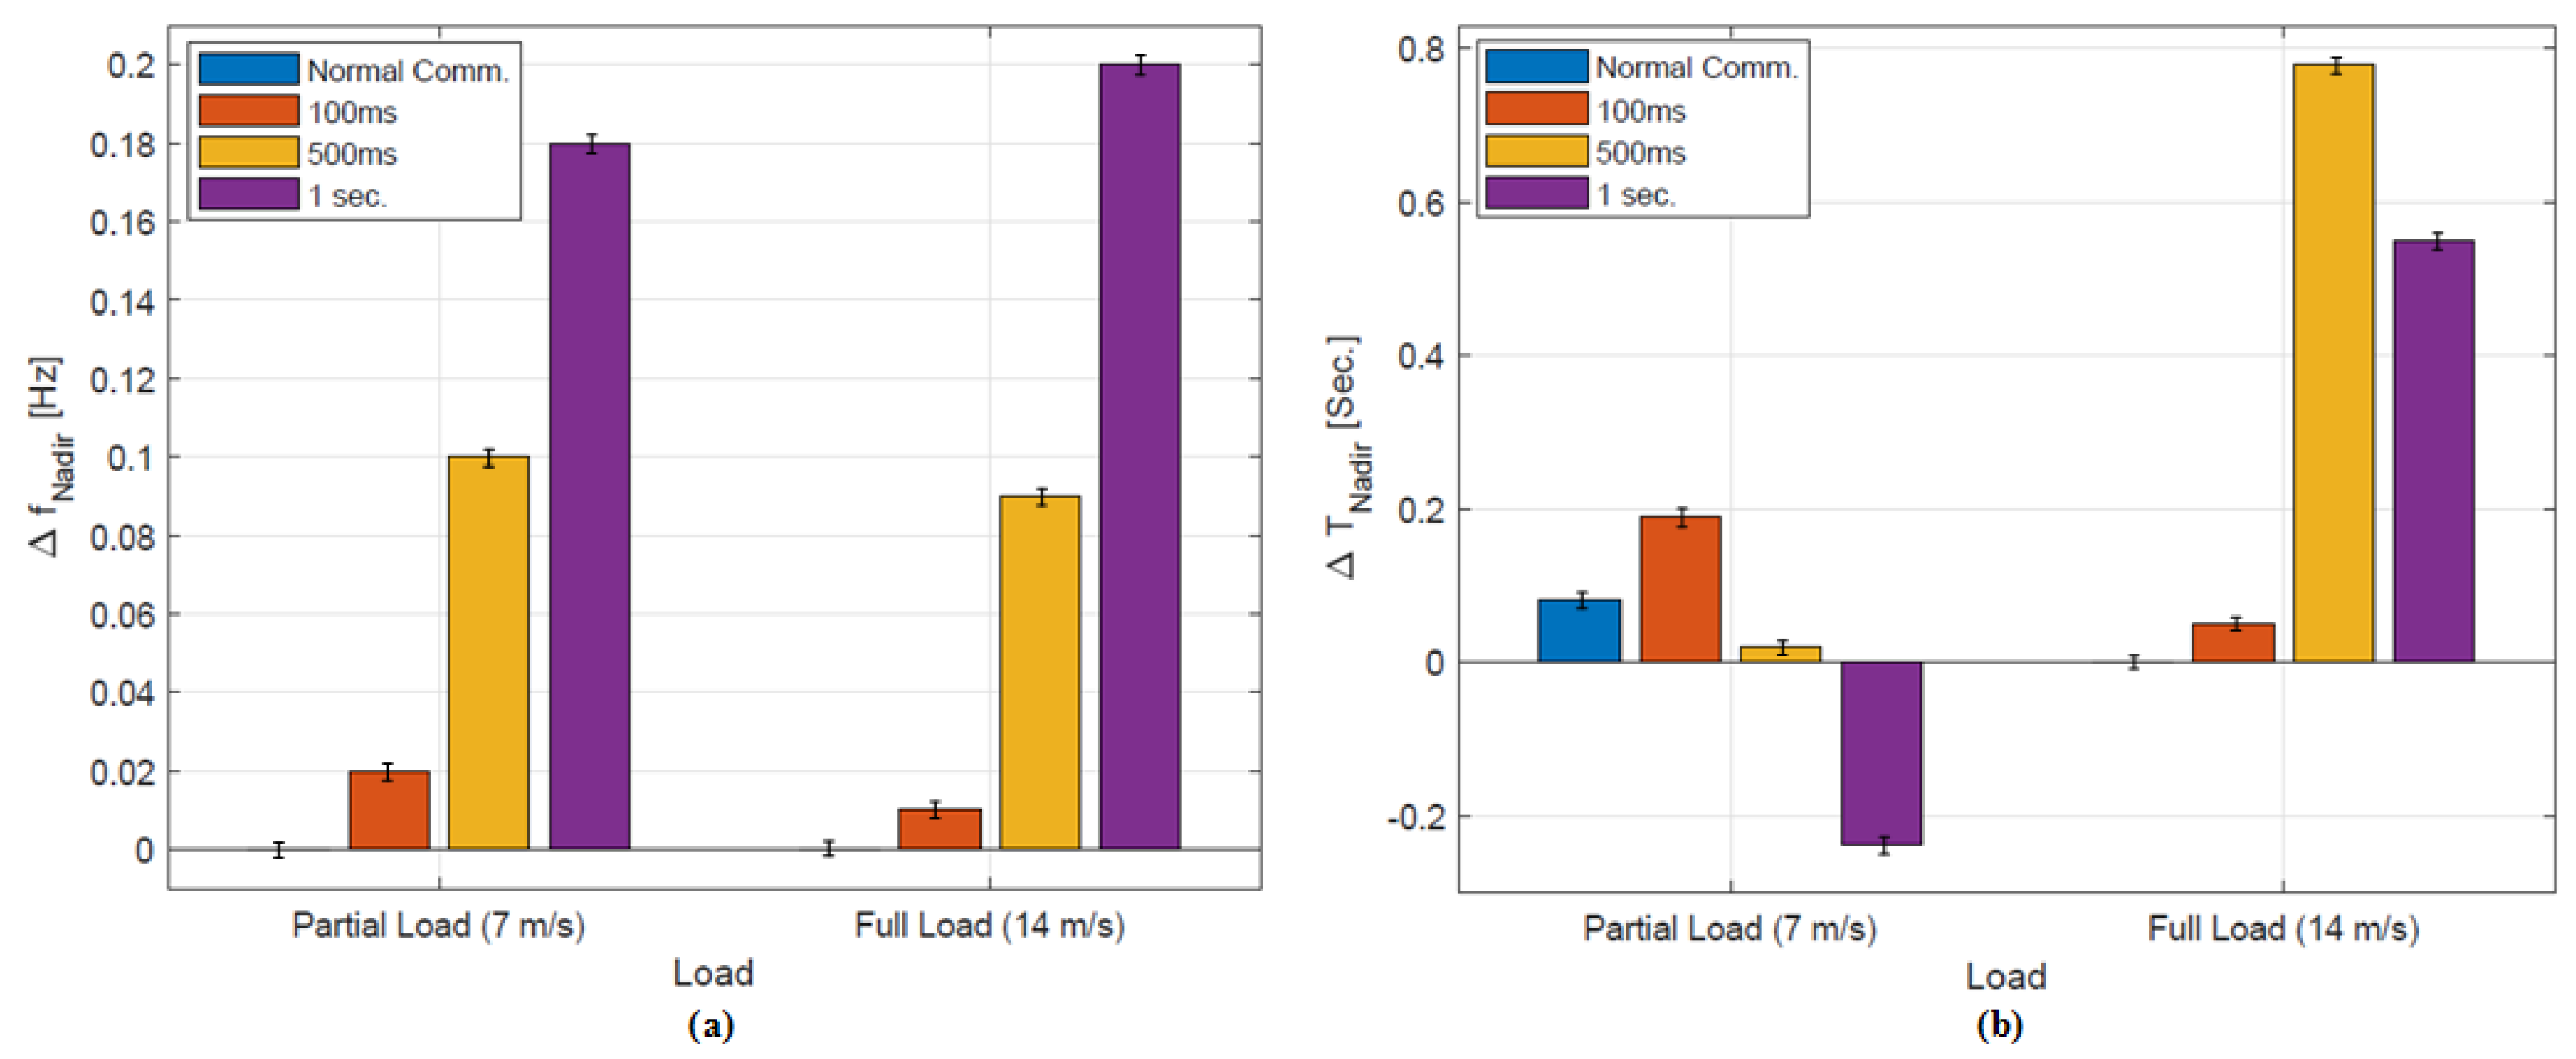
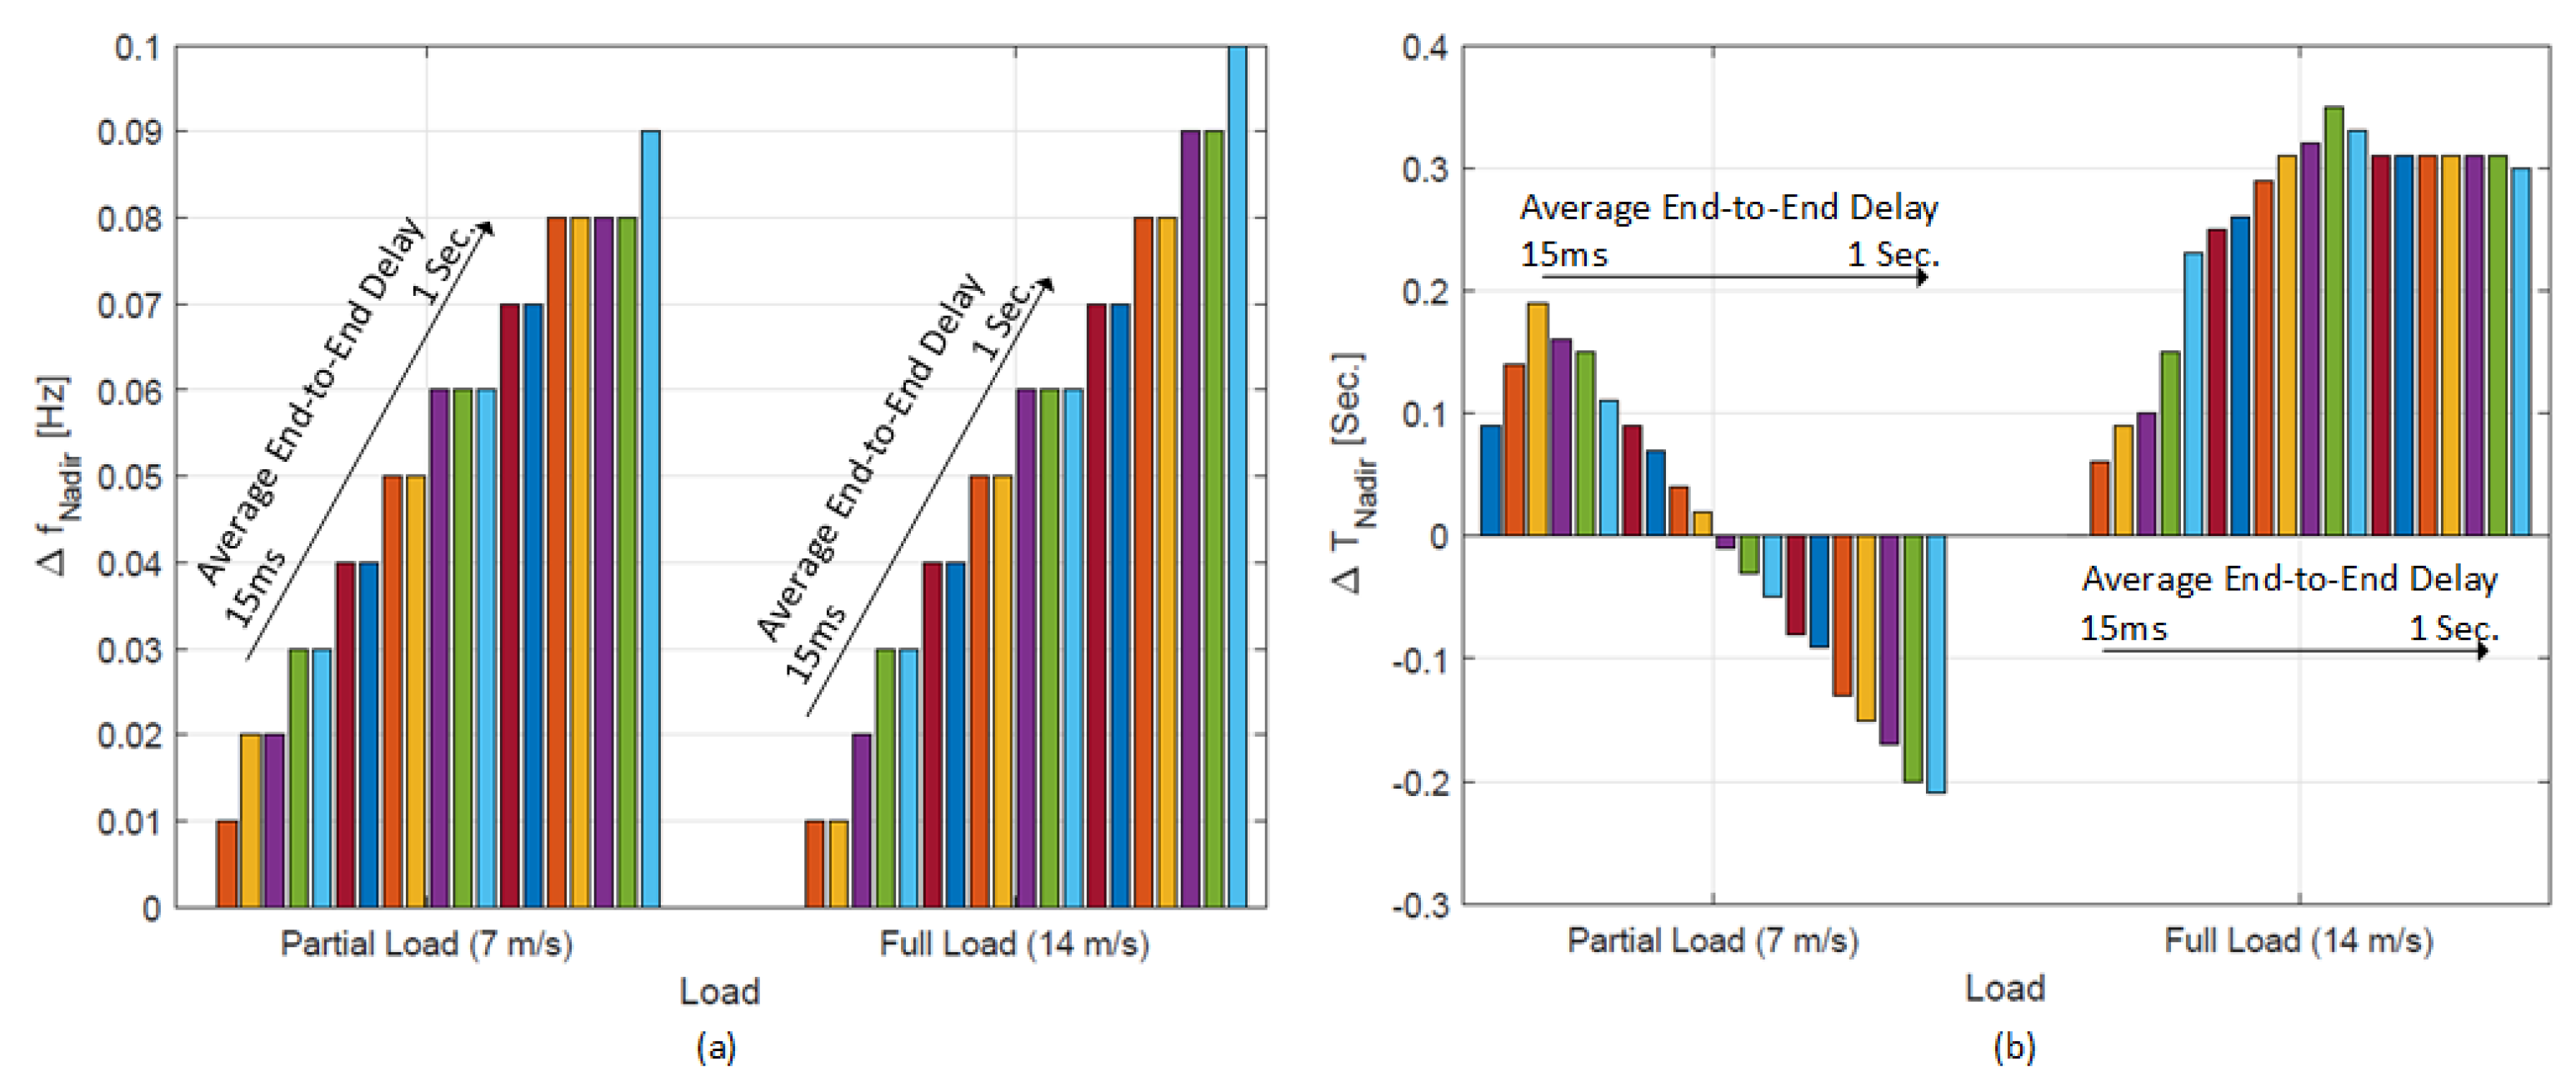
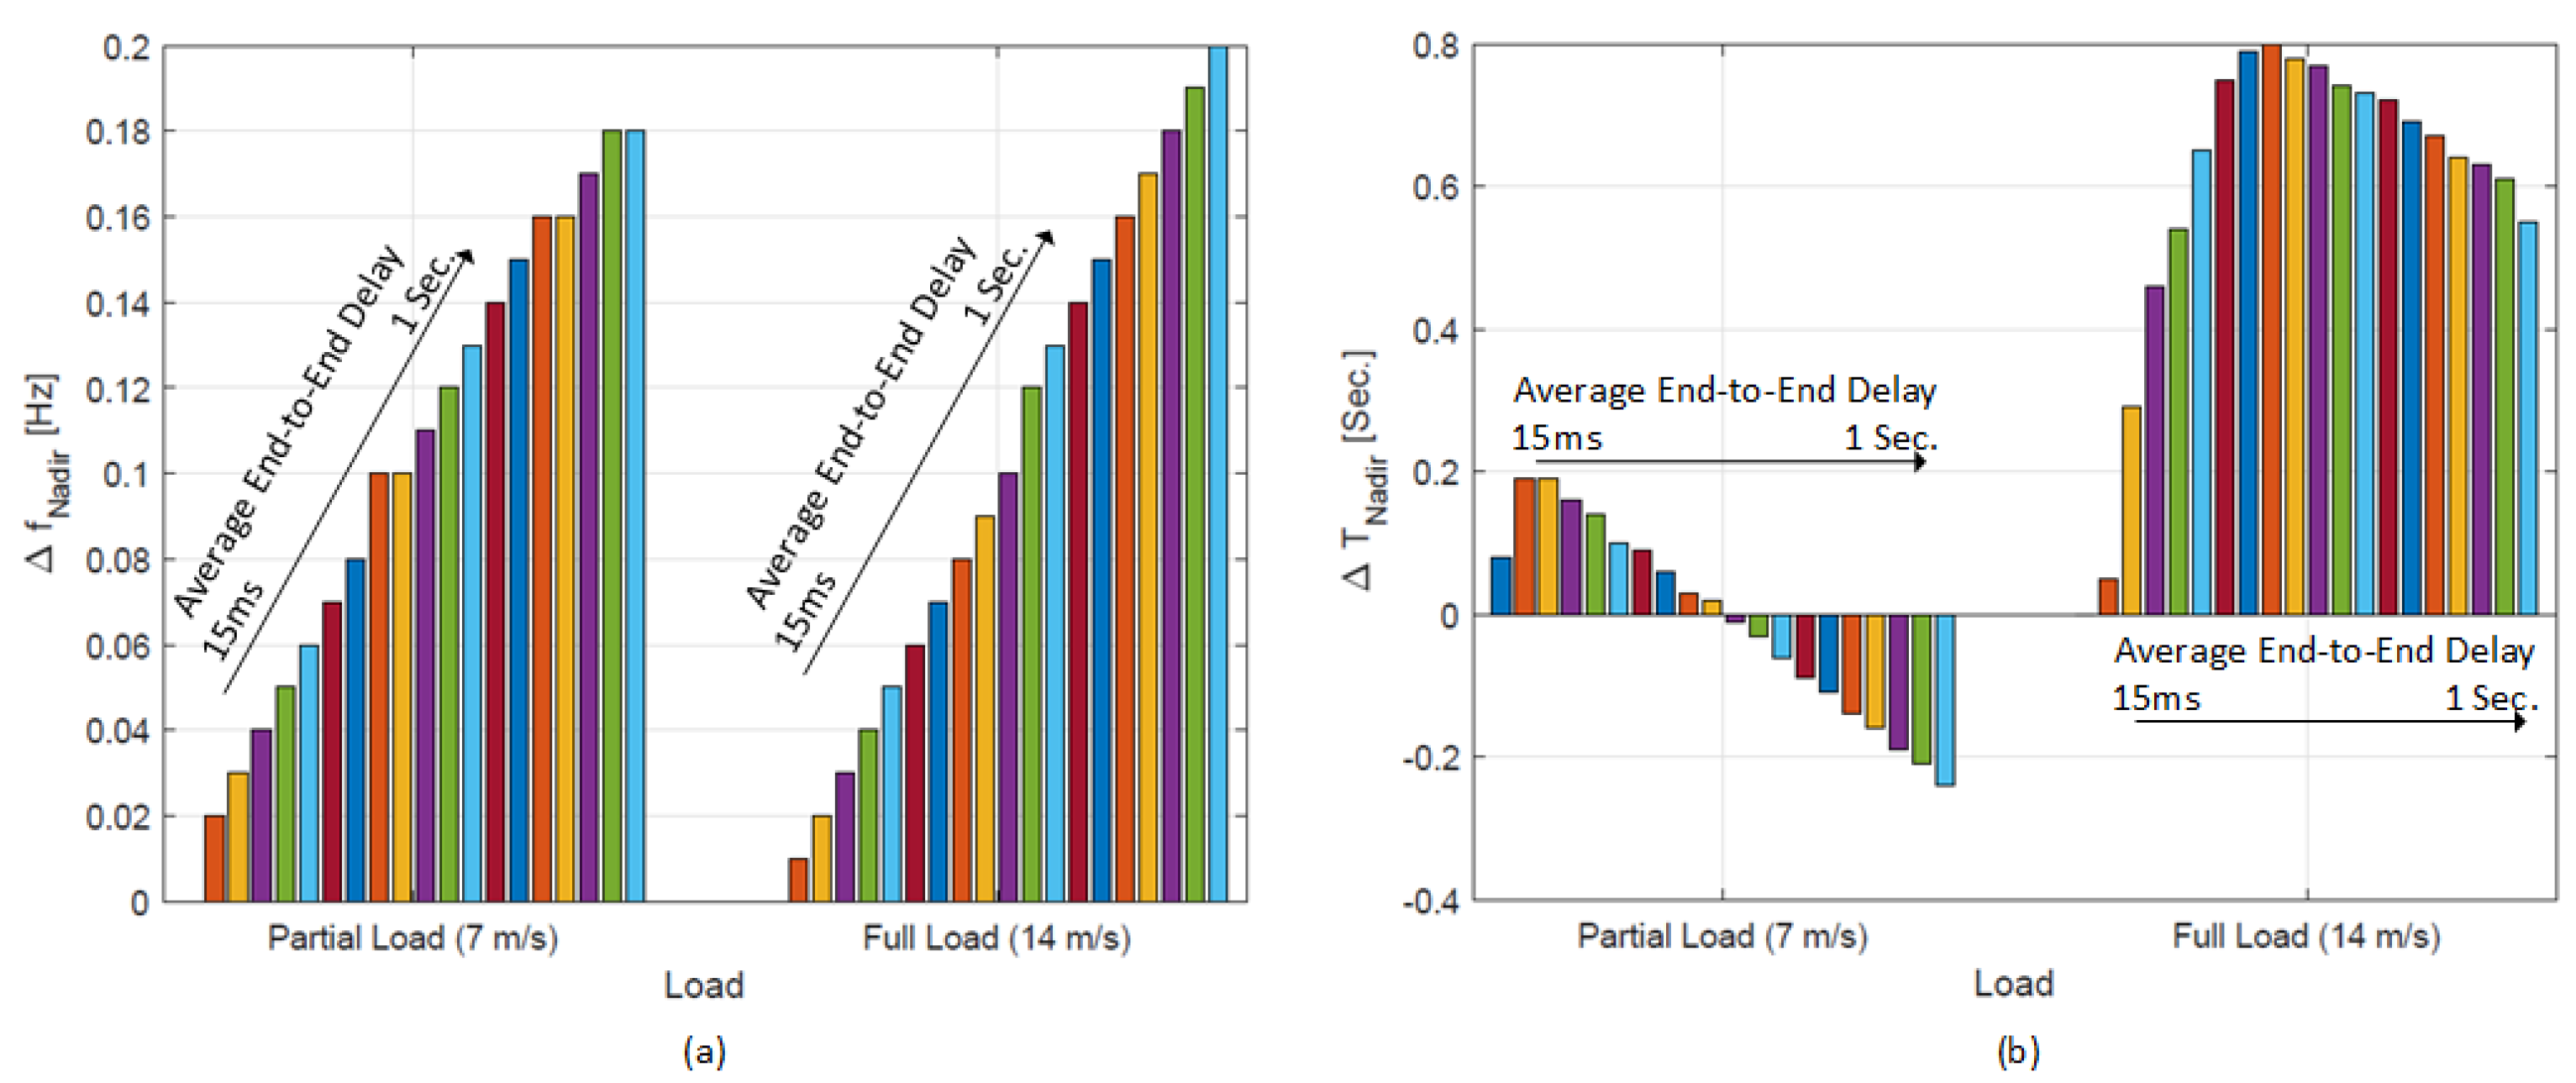
The study reveals that in normal circumstances, private as well as public cellular-based networks can support the provision of primary frequency control from WPP. However, in case of a disturbance, communication delays have a large impact on the overall response of ReGen plants on system frequency response as frequency nadir and time to reach it decrease with increasing network delays. Therefore, communication delays and their mechanisms must be considered in the design process of the proposed coordinated frequency control in [46]. Further, it has been ascertained that public networks are more prone to affect the overall frequency response due to stochastic nature of the delays compared to private ones where the delays are fixed and have low values. Based on the findings of this study, it is recommended that the design and tuning methodology for frequency control must account for the communication properties, such as delays in ICT especially when using public networks. Similarly, coordination and activation of ReGen plants for provision of frequency control must account for the ICT delays.
Additional work is required in order to get more insight on the impact of ICT on fast frequency response, such as: (a) account for a realistic power system model that takes into account transmission lines and ReGen plants location and thus a realistic mapping of ICT layer, (b) consider other control schemes and coordination methods in-line with the new ENTSO-E recommendations given in [74]. The current preliminary studies were done without employing control Hardware-In-the-Loop (HIL) framework where dedicated network emulators are used to capture performance and characteristics of a selected communication network technology. However, as a natural future step of the present investigation, these aspects will be addressed by implementing the described scenario in a dedicated HIL framework with the validation of two ancillary services from ReGen i.e., frequency restoration reserve (FRR, also known as secondary control) using a detailed model of the power grid e.g., modified 12-bus systems, and frequency containment reserve (FCR, also known as primary control).

Author Contributions

K.S. and F.I. conceived, designed and performed the experiments; L.M.M. provided NetMap related description and data; R.L.O. and M.A. helped in analyzing the data; K.S. and M.A. contributed to the analysis tools; K.S. wrote the paper.

Acknowledgments

Energinet.dk is acknowledged for funding the project “Ancillary Services from Renewable Power Plants (RePlan)”, www.replanproject.dk in contract number: PSO project 2015 no. 12347. University of the Punjab, Pakistan is acknowledged for funding the PhD of Author 1 (Kamal Shahid).

Conflicts of Interest

The authors declare no conflict of interests.

Appendix A

Figure A1 and Figure A2 show a trend in (a) f N a d i r and (b) T N a d i r in comparison with that of reference frequency response under a sequence of increasing end-to-end network delay for Test Scenario 2 and Test Scenario 3, respectively. It is worth noting that a positive Delta ( Δ ) value means “smaller than the reference value”, while a negative value indicates “larger than the reference value”.
Figure A1. For Test Scenario 2, figure showing a trend in (a) f N a d i r and (b) T N a d i r in comparison with that of reference frequency response under a sequence of increasing end-to-end network delay.
Energies 11 01329 g0a1
Figure A2. For Test Scenario 3, figure showing a trend in (a) f N a d i r and (b) T N a d i r in comparison with that of reference frequency response under a sequence of increasing end-to-end network delay.
Energies 11 01329 g0a2

References

  1. The Danish Government. Our Future Energy; Technical Report; The Government of Denmark: Copenhagen, Denmark, 2011. Available online: https://stateofgreen.com/files/download/387 (accessed on 19 April 2018).
  2. Zervos, A.; Eckhart, M.; El-Ashry, M.; Hales, D.; Hamilton, K.; Rae, P. Renewables 2017—Global Status Report; Technical report; REN21 Secretariat: Paris, France, 2017. [Google Scholar]
  3. Hansen, A.D.; Altin, M.; Iov, F. Provision of enhanced ancillary services from wind power plants—Examples and challenges. Renew. Energy 2016, 97, 8–18. [Google Scholar] [CrossRef] [Green Version]
  4. Petersen, L.; Iov, F.; Hansen, A.D.; Altin, M. Voltage Control Support and Coordination between Renewable Generation Plants in MV Distribution Systems. In Proceedings of the 15th Wind Integration Workshop, Vienna, Austria, 15–17 November 2016. [Google Scholar]
  5. Petersen, L.; Shahid, K.; Altin, M.; Olsen, R.L.; Iov, F.; Hansen, A.D.; Han, X. Delivarable D 2—Voltage Control Support and Coordination between ReGen Plants in Distribution Systems; Technical Report; AAU: Aalborg, Denmark; DTU Wind Energy: Roskilde, Denmark, 2016. [Google Scholar]
  6. Ekanayake, J.; Jenkins, N. Comparison of the response of doubly fed and fixed-speed induction generator wind turbines to changes in network frequency. IEEE Trans. Energy Convers. 2004, 19, 800–802. [Google Scholar] [CrossRef]
  7. Lalor, G.; Mullane, A.; O’Malley, M. Frequency control and wind turbine technologies. IEEE Trans. Power Syst. 2005, 20, 1905–1913. [Google Scholar] [CrossRef]
  8. Morren, J.; Pierik, J.; de Haan, S.W. Inertial response of variable speed wind turbines. Electr. Power Syst. Res. 2006, 76, 980–987. [Google Scholar] [CrossRef]
  9. Tarnowski, G.C.; Kjar, P.C.; Sorensen, P.E.; Ostergaard, J. Variable speed wind turbines capability for temporary over-production. In Proceedings of the 2009 IEEE Power Energy Society General Meeting, Calgary, AB, Canada, 26–30 July 2009; pp. 1–7. [Google Scholar]
  10. Sharma, S.; Huang, S.H.; Sarma, N. System Inertial Frequency Response estimation and impact of renewable resources in ERCOT interconnection. In Proceedings of the 2011 IEEE Power and Energy Society General Meeting, Detroit, MI, USA, 24–29 July 2011; pp. 1–6. [Google Scholar]
  11. Gowaid, I.A.; El-Zawawi, A.; El-Gammal, M. Improved inertia and frequency support from grid-connected DFIG wind farms. In Proceedings of the 2011 IEEE/PES Power Systems Conference and Exposition, Phoenix, AZ, USA, 20–23 March 2011; pp. 1–9. [Google Scholar]
  12. Knuppel, T.; Nielsen, J.N.; Jensen, K.H.; Dixon, A.; Otergaard, J. Power oscillation damping controller for wind power plant utilizing wind turbine inertia as energy storage. In Proceedings of the 2011 IEEE Power and Energy Society General Meeting, San Diego, CA, USA, 24–29 July 2011; pp. 1–8. [Google Scholar]
  13. Delille, G.; Francois, B.; Malarange, G. Dynamic Frequency Control Support by Energy Storage to Reduce the Impact of Wind and Solar Generation on Isolated Power System’s Inertia. IEEE Trans. Sustain. Energy 2012, 3, 931–939. [Google Scholar] [CrossRef]
  14. Fernandez, R.; Mantz, R.; Battaiotto, P. Potential contribution of wind farms to damp oscillations in weak grids with high wind penetration. Renew. Sustain. Energy Rev. 2008, 12, 1692–1711. [Google Scholar] [CrossRef]
  15. Dominguez-Garcia, J.L.; Gomis-Bellmunt, O.; Bianchi, F.D.; Sumper, A. Power oscillation damping supported by wind power: A review. Renew. Sustain. Energy Rev. 2012, 16, 4994–5006. [Google Scholar] [CrossRef]
  16. Adamczyk, A. Damping of Low Frequency Power System Oscillations with Wind Power Plants. Ph.D. Thesis, Department of Energy Technology, Aalborg University, Aalborg, Denmark, 2012. [Google Scholar]
  17. DominguezGarcia, J.; Bianchi, F.; Gomis-Bellmunt, O. Analysis of the damping contribution of power system stabilizers driving wind power plants. Wind Energy 2014, 17, 267–278. [Google Scholar] [CrossRef]
  18. Dominguez-Garcia, J.L.; Bianchi, F.D.; Gomis-Bellmunt, O. Control Signal Selection for Damping Oscillations With Wind Power Plants Based on Fundamental Limitations. IEEE Trans. Power Syst. 2013, 28, 4274–4281. [Google Scholar] [CrossRef]
  19. Hansen, A.D.; Michalke, G.; Sorensen, P.; Lund, T.; Iov, F. Co-ordinated voltage control of DFIG wind turbines in uninterrupted operation during grid faults. Wind Energy 2007, 10, 51–68. [Google Scholar] [CrossRef]
  20. Altin, M. Dynamic Frequency Response of Wind Power Plants. Ph.D. Thesis, Department of Energy Technology, AAU, Aalborg, Denmark, 2012. [Google Scholar]
  21. Tarnowski, G.C. Coordinated Frequency Control of Wind Turbines in Power Systems with High Wind Power Penetration. Ph.D Thesis, DTU, Wind Energy, Kgs. Lyngby, Denmark, 2011. [Google Scholar]
  22. Petersen, L.; Iov, F. Distributed voltage control coordination between renewable generation plants in MV distribution grids. CIRED Open Access Proc. J. 2017, 2017, 1038–1042. [Google Scholar] [CrossRef]
  23. Hulle, F.V.; Holttinen, H.; Kiviluoma, J.; Faiella, M.; Kreutzkamp, P.; Cutululis, N.; Rekinger, M.; Gubina, A.; Chapalain, F.; Ernst, B.; et al. Grid Support Services by Wind and Solar PV: A Review of System Needs, Technology Options, Economic Benefits and Suitable Market Mechanisms Synthesis Report (WP7); Technical report; Intelligent Energy Europe, 2014; Available online: https://www.researchgate.net/profile/Juha_Kiviluoma/publication/291116136_Grid_support_services_by_wind_and_solar_PV_a_review_of_system_needs_technology_options_economic_benefits_and_suitable_market_mechanisms/links/569e1acf08ae00e5c991186b/Grid-support-services-by-wind-and-solar-PV-a-review-of-system-needs-technology-options-economic-benefits-and-suitable-market-mechanisms.pdf (accessed on 1 January 2018).
  24. Akhmatov, V. Analysis of Dynamic Behaviour of Electric Power Systems with Large Amount of Wind Power. Ph.D. Thesis, Department of Electrical Engineering, Technical University of Denmark, Kgs. Lyngby, Denmark, 2003. [Google Scholar]
  25. Holdsworth, L.; Charalambous, I.; Ekanayake, J.B.; Jenkins, N. Power System Fault Ride through Capabilities of Induction Generator Based Wind Turbines. Wind Eng. 2004, 28, 399–409. [Google Scholar] [CrossRef]
  26. Hansen, A.D.; Michalke, G. Multi-pole permanent magnet synchronous generator wind turbines’ grid support capability in uninterrupted operation during grid faults. IET Renew. Power Gener. 2009, 3, 333–348. [Google Scholar] [CrossRef]
  27. Margaris, I.D.; Hansen, A.D.; Sørensen, P.; Hatziargyriou, N.D. Illustration of Modern Wind Turbine Ancillary Services. Energies 2010, 3, 1290–1302. [Google Scholar] [CrossRef] [Green Version]
  28. Bousseau, P.; Belhomme, R.; Monnot, E.; Laverdure, N.; Boëda, D.; Roye, D.; Seddik, B. Contribution of Wind Farms to Ancillary Services. Cigre 2006, 21, 1–11. [Google Scholar]
  29. Miller, N.W.; Clark, K. Advanced controls enable wind plants to provide ancillary services. In Proceedings of the IEEE PES General Meeting, Minneapolis, MN, USA, 25–29 July 2010; pp. 1–6. [Google Scholar]
  30. Brisebois, J.; Aubut, N. Wind farm inertia emulation to fulfill Hydro-Quebec’s specific need. In Proceedings of the 2011 IEEE Power and Energy Society General Meeting, Detroit, MI, USA, 24–29 July 2011; pp. 1–7. [Google Scholar]
  31. Singh, M.; Gevorgian, V.; Muljadi, E.; Ela, E. Variable-speed wind power plant operating with reserve power capability. In Proceedings of the 2013 IEEE Energy Conversion Congress and Exposition, Denver, CO, USA, 15–19 September 2013; pp. 3305–3310. [Google Scholar]
  32. Diaz-Gonzalez, F.; Hau, M.; Sumper, A.; Gomis-Bellmunt, O. Participation of wind power plants in system frequency control: Review of grid code requirements and control methods. Renew. Sustain. Energy Rev. 2014, 34, 551–564. [Google Scholar] [CrossRef]
  33. Hansen, A.D.; Altin, M.; Margaris, I.D.; Iov, F.; Tarnowski, G.C. Analysis of the short-term overproduction capability of variable speed wind turbines. Renew. Energy 2014, 68, 326–336. [Google Scholar] [CrossRef] [Green Version]
  34. Shahid, K.; Petersen, L.; Iov, F.; Olsen, R.L. On the Impact of using Public Network Communication Infrastructure for Voltage Control Coordination in Smart Grid Scenario. In Proceedings of the 2nd EAI International Conference on Smart Grid Inspired Future Technologies, London, UK, 27–28 March 2017; Springer: Cham, Switzerland, 2017. [Google Scholar]
  35. Shahid, K.; Kidmose, E.; Petersen, L.; Iov, F.; Olsen, R.L. On the Impact of Cyberattacks on Voltage Control Coordination by ReGen Plants in Smart Grids. In Proceedings of the 2017 IEEE International Conference on Smart Grid Communications, Dresden, Germany, 23–26 October 2017. [Google Scholar]
  36. Khalil, A.; Wang, J.H.; Mohamed, O. Robust stabilization of load frequency control system under networked environment. Int. J. Autom. Comput. 2017, 14, 93–105. [Google Scholar] [CrossRef]
  37. Bhowmik, S.; Tomsovic, K.; Bose, A. Communication models for third party load frequency control. IEEE Trans. Power Syst. 2004, 19, 543–548. [Google Scholar] [CrossRef]
  38. Yu, X.; Tomsovic, K. Application of linear matrix inequalities for load frequency control with communication delays. IEEE Trans. Power Syst. 2004, 19, 1508–1515. [Google Scholar] [CrossRef]
  39. Xu, S.; Lam, J. On Equivalence and Efficiency of Certain Stability Criteria for Time-Delay Systems. IEEE Trans. Autom. Control 2007, 52, 95–101. [Google Scholar] [CrossRef]
  40. Bhatt, P.; Ghoshal, S.P.; Roy, R.; Ghosal, S. Load frequency control of interconnected restructured power system along with DFIG and coordinated operation of TCPS-SMES. In Proceedings of the 2010 Joint International Conference on Power Electronics, Drives and Energy Systems 2010 Power India, New Delhi, India, 20–23 December 2010; pp. 1–6. [Google Scholar]
  41. Shayeghi, H.; Shayanfar, H.; Jalili, A. Multi-stage fuzzy PID power system automatic generation controller in deregulated environments. Energy Convers. Manag. 2006, 47, 2829–2845. [Google Scholar] [CrossRef]
  42. Milano, F.; Anghel, M. Impact of Time Delays on Power System Stability. IEEE Trans. Circuits Syst. I Regul. Pap. 2012, 59, 889–900. [Google Scholar] [CrossRef]
  43. Kamwa, I.; Grondin, R.; Hebert, Y. Wide-area measurement based stabilizing control of large power systems—A decentralized/hierarchical approach. IEEE Trans. Power Syst. 2001, 16, 136–153. [Google Scholar] [CrossRef]
  44. Wu, H.; Tsakalis, K.S.; Heydt, G.T. Evaluation of time delay effects to wide-area power system stabilizer design. IEEE Trans. Power Syst. 2004, 19, 1935–1941. [Google Scholar] [CrossRef]
  45. Sargolzaei, A.; Yen, K.K.; Abdelghani, M.N. Preventing Time-Delay Switch Attack on Load Frequency Control in Distributed Power Systems. IEEE Trans. Smart Grid 2016, 7, 1176–1185. [Google Scholar] [CrossRef]
  46. Altin, M.; Hu, J.; Hansen, A.D. Frequency Stability Control Support from ReGen Plants—Deliverable D3; Technical Report; DTU, Wind Energy: Roskilde, Denmark, 2017. [Google Scholar]
  47. Kumar, D.B.K. Power System Stability and Control; National Programme on Technology Enhanced Learning; Indian Institute of Technology Madras: Chennai, India, 2012. [Google Scholar]
  48. Enhanced Frequency Control Capability (EFCC) Project—National Grid UK. Available online: https://www.nationalgrid.com/uk/investment-and-innovation/innovation/system-operator-innovation/enhanced-frequency-control (accessed on 19 April 2018).
  49. Fardanesh, B. Future trends in power system control. IEEE Comput. Appl. Power 2002, 15, 24–31. [Google Scholar] [CrossRef]
  50. Hulle, F.V.; Pineda, I. Economic Grid Support Services by Wind and Solar PV; Technical Report; Intelligent Energy Europe Programme of the European Union, 2014; Available online: https://windeurope.org/fileadmin/files/library/publications/reports/REserviceS.pdf (accessed on 19 April 2018).
  51. Study on Broadband Coverage in Europe (as of 2014) | Digital Single Market. Available online: https://ec.europa.eu/digital-single-market/en/news/study-broadband-coverage-europe-2014/ (accessed on 11 March 2018).
  52. Findrik, M.; Pedersen, R.; Sloth, C.; Schwefel, H.P. Evaluation of communication network state estimators for adaptive power-balancing. Comput. Sci. Res. Dev. 2017, 32, 247–254. [Google Scholar] [CrossRef]
  53. Petersen, L.; Altin, M.; Shahid, K.; Olsen, R.L.; Iov, F.; Hansen, A.D.; Han, X. Delivarable D1.1—Specifications for ReGen Plant Model and Control Architecture; Technical Report; AAU: Aalborg, Denmark; DTU Wind Energy: Roskilde, Denmark, 2015. [Google Scholar]
  54. Altin, M.; Han, X.; Hansen, A.D.; Olsen, R.L.; Cutululis, N.A.; Iov, F. Delivarable D1.2—Technical Feasibility of Ancillary Services Provided by ReGen Plants; Technical Report; AAU: Aalborg, Denmark; DTU Wind Energy: Roskilde, Denmark, 2015. [Google Scholar]
  55. Watt, S.T.; Loehner, H.; Achanta, S.V.; Kivi, A.; Rowland, B. Extending SCADA Networks Using Wireless Communications. In Proceedings of the 2nd Annual PAC World Americas Conference, Raleigh, NC, USA, 1–3 September 2015. [Google Scholar]
  56. Trends in SCADA: New Technologies and Adaptive Processes. Available online: https://www.processonline.com.au/content/process-control-systems/article/trends-in-scada-new-technologies-and-adaptive-processes-867485507 (accessed on 20 April 2018).
  57. CPNI. Securing the Move to IP-Based SCADA/PLC Networks. 2011. Available online: https://www.ncsc.gov.uk/content/files/protected_files/document_files/The%20Move%20to%20IP%20Based%20SCADA%20Networks%20151111.pdf (accessed on 10 April 2018).
  58. Knoll, T.M. A combined CAPEX and OPEX cost model for LTE networks. In Proceedings of the 2014 16th International Telecommunications Network Strategy and Planning Symposium (Networks), Funchal, Portugal, 17–19 September 2014; pp. 1–6. [Google Scholar]
  59. Verbrugge, S.; Pasqualini, S.; Westphal, F.J.; Jäger, M.; Iselt, A.; Kirstädter, A.; Chahine, R.; Colle, D.; Pickavet, M.; Demeester, P. Modeling operational expenditures for telecom operators. In Proceedings of the 2005 Conference on Optical Network Design and Modelling, Milan, Italy, 7–9 February 2005; pp. 455–466. [Google Scholar]
  60. Kuzlu, M.; Pipattanasomporn, M.; Rahman, S. Communication network requirements for major smart grid applications in HAN, NAN and WAN. Comput. Netw. 2014, 67, 74–88. [Google Scholar] [CrossRef]
  61. Kalalas, C.; Thrybom, L.; Alonso-Zarate, J. Cellular Communications for Smart Grid Neighborhood Area Networks: A Survey. IEEE Access 2016, 4, 1469–1493. [Google Scholar] [CrossRef]
  62. Mikkelsen, L.M.; Thomsen, S.R.; Pedersen, M.S.; Madsen, T.K. NetMap—Creating a Map of Application Layer QoS Metrics of Mobile Networks Using Crowd Sourcing. In Proceedings of the Internet of Things, Smart Spaces, and Next Generation Networks and Systems, St. Petersburg, Russia, 27–29 August 2014; Balandin, S., Andreev, S., Koucheryavy, Y., Eds.; Springer: Cham, Germany, 2014; pp. 544–555. [Google Scholar]
  63. NetMap Website. Available online: http://netmap.aau.dk/ (accessed on 20 April 2018).
  64. Lauridsen, M.; Rodriguez, I.; Mikkelsen, L.M.; Gimenez, L.C.; Mogensen, P. Verification of 3G and 4G received power measurements in a crowdsourcing Android app. In Proceedings of the 2016 IEEE Wireless Communications and Networking Conference, Doha, Qatar, 3–6 April 2016; pp. 1–6. [Google Scholar]
  65. DIX—Danish Internet Exchange Point. Available online: http://www.dix.dk/ (accessed on 20 April 2018).
  66. Forside | Energinet. Available online: https://energinet.dk/ (accessed on 20 April 2018).
  67. Troen, I.; Lundtang Petersen, E. European Wind Atlas; Risø National Laboratory: Roskilde, Denmark, 1989.
  68. Danmarks Statistik. Available online: https://www.dst.dk/da/ (accessed on 20 April 2018).
  69. Hansen, K.; Barthelmie, R.; Jensen, L.; Sommer, A. The impact of turbulence intensity and atmospheric stability on power deficits due to wind turbine wakes at Horns Rev wind farm. Wind Energy 2012, 15, 183–196. [Google Scholar] [CrossRef] [Green Version]
  70. Das, K.; Sorensen, P.E.; Hansen, A.D.; Abildgaard, H. Integration of Renewable Generation in Power System Defence Plans. Ph.D. Thesis, DTU Wind Energy, Roskilde, Denmark, 2016. [Google Scholar]
  71. UCTE. Final Report—System Disturbance on 4 November 2006; Technical Report; UCTE: Brussels, Belgium, 2006; Available online: https://www.entsoe.eu/fileadmin/user_upload/_library/publications/ce/otherreports/Final-Report-20070130.pdf (accessed on 19 February 2018).
  72. Iov, F.; Shahid, K.; Petersen, L.; Olsen, R.L. Verification of Ancillary Services in Large Scale Power System—Deliverable D5.1; Technical Report; AAU: Aalborg, Denmark, 2018. [Google Scholar]
  73. Mikkelsen, L.M.; Højholt, N.B.; Madsen, T.K. Performance Evaluation of Methods for Estimating Achievable Throughput on Cellular Connections. In Proceedings of the Internet of Things, Smart Spaces, and Next Generation Networks and Systems, St. Petersburg, Russia, 26–28 August 2015; Balandin, S., Andreev, S., Koucheryavy, Y., Eds.; Springer: Cham, Germany, 2015; pp. 422–435. [Google Scholar]
  74. ENTSO-E. Rate of Change of Frequency (RoCoF) Withstand Capability—ENTSO-E Guidance Document for National Implementation for Network Codes on Grid Connection; Technical Report; European Network of Transmission System Operators for Electricity (ENTSOE): Bruxelles, Belgium, 2018. [Google Scholar]
Figure 1. Implementation of Offline Optimization Approach with Control Levels.
Energies 11 01329 g001
Figure 2. RTTs measured for (a) TCP and (b) UDP-based packets using three cellular networks in Denmark.
Energies 11 01329 g002
Figure 3. Packet loss probabilities measured for (a) TCP and (b) UDP-based packets using three cellular networks in Denmark.
Energies 11 01329 g003
Figure 4. Reference frequency and output power shapes of WPP [46].
Energies 11 01329 g004
Figure 5. Single bus model of large-scale power system model with three aggregated WPPs and other conventional power plants.
Energies 11 01329 g005
Figure 6. Simulation model with ReGen, ICT and aggregator control levels.
Energies 11 01329 g006
Figure 7. CNM used for evaluation of Online Frequency Support from WPPs.
Energies 11 01329 g007
Figure 8. Distribution of TCP-RTT traces based on real measurements via NetMap [73].
Energies 11 01329 g008
Figure 9. Reference System Frequency and Total Active Power from WPPs for (a) Partial Load (i.e., 7 m/s average wind speed) and (b) Full Load (i.e., 14 m/s average wind speed).
Energies 11 01329 g009
Figure 10. System Frequency Compared to the Reference Frequency at (a) Partial and (b) Full load.
Energies 11 01329 g010
Figure 11. Comparison of (a) f N a d i r , (b) T N a d i r and T S t e a d y S t a t e obtained in Test Case -1 with that of Reference Frequency Response.
Energies 11 01329 g011
Figure 12. Figure showing at Partial Load (a) System Frequency Response and (b) Total Active Power under different delay conditions compared to the Reference Frequency Response and Reference Active Power, respectively.
Energies 11 01329 g012
Figure 13. Figure showing at Full Load (a) System Frequency Response and (b) Total Active Power under different delay conditions compared to the Reference Frequency Response and Reference Active Power, respectively.
Energies 11 01329 g013
Figure 14. Comparison of (a) f N a d i r and (b) T N a d i r obtained in Test Scenario -2 with that of Reference Frequency Response at 95% Confidence Interval.
Energies 11 01329 g014
Figure 15. Figure showing at Partial Load (a) System Frequency Response and (b) Total Active Power under different delay conditions compared to the Reference Frequency Response and Reference Active Power, respectively.
Energies 11 01329 g015
Figure 16. Figure showing at Full Load (a) System Frequency Response and (b) Total Active Power under different delay conditions compared to the Reference Frequency Response and Reference Active Power, respectively.
Energies 11 01329 g016
Figure 17. Comparison of (a) f N a d i r and (b) T N a d i r obtained in Test Scenario -3 with that of Reference Frequency Response at 95% Confidence Interval.
Energies 11 01329 g017
Table 1. Size and Share of three WPPs connected to the Power System.
WPP TypeSizeSize in MWContribution [%]
OffshoreLargeAbove 10033
OnshoreMedium50–10033
OnshoreSmall<25–<5033
Table 2. Wind Speeds for Test Cases.
Wind Speed [m/s]Wind Power Plants
OffshoreOnshore (Medium)Onshore (Small)
Test Case 1777
Test Case 2141414
Table 3. Test Scenarios based on Network Connections.
Network ConnectionWind Power Plants
OffshoreOnshore (Medium)Onshore (Small)
Test Scenario 1PrivatePrivatePrivate
Test Scenario 2PrivatePrivatePublic
Test Scenario 3PrivatePublicPublic
Table 4. Generation distribution for 50% wind power penetration level.
Total Generation [GW]Steam [GW]Hydro [GW]Nuclear [GW]Wind [GW]
68256334
Table 5. Test Scenario 1—with all Private Network Connections—Ideal Case.
Network Connection/Wind SpeedWind Power Plants
OffshoreOnshore (Medium)Onshore (Small)
Test Scenario 1PrivatePrivatePrivate
Test Case 1777
Test Case 2141414
Table 6. Comparison of System Frequency KPIs obtained in Test Case -1 with that of Reference Frequency.
KPICaseTest Scenario 1
Partial LoadFull Load
Frequency Nadir [Hz]Reference49.3149.35
Normal Comm.49.3149.35
T N a d i r [Sec.]Reference6.957.618
Normal Comm.6.957.618
T S t e a d y S t a t e [Sec.]Reference4040
Normal Comm.4040
Table 7. Test Scenario 2—with Public Network Connection for Small Onshore WPPs.
Network Connection/Wind SpeedWind Power Plants
OffshoreOnshore (Medium)Onshore (Small)
Test Scenario 2PrivatePrivatePublic
Test Case 1777
Test Case 2141414
Table 8. Comparison of (a) f N a d i r and (b) T N a d i r obtained in Test Scenario -2 with that of Reference Frequency Response.
KPITest Scenario 2
Partial LoadFull Load
Reference f N a d i r [Hz]49.2949.36
Δ f N a d i r [Hz]Normal Comm.00
With 100 ms delay0.010.01
With 500 ms delay0.050.05
With 1 s delay0.090.1
Reference T N a d i r [Sec.]6.957.5
Δ T N a d i r [Sec.]Normal Comm.0.090
With 100 ms delay0.140.06
With 500 ms delay0.020.31
With 1 s delay−0.210.3
Table 9. Test Scenario 3—with Public Network Connections for both Onshore WPPs.
Network Connection/Wind SpeedWind Power Plants
OffshoreOnshore (Medium)Onshore (Small)
Test Scenario 3PrivatePublicPublic
Test Case 1777
Test Case 2141414
Table 10. Comparison of (a) f N a d i r and (b) T N a d i r obtained in Test Scenario -3 with that of Reference Frequency Response.
KPITest Scenario 3
Partial LoadFull Load
Reference f N a d i r [Hz]49.2949.36
Δ f N a d i r [Hz]Normal Comm.00
With 100 ms delay0.020.01
With 500 ms delay0.10.09
With 1 s delay0.180.2
Reference T N a d i r [Sec.]6.957.5
Δ T N a d i r [Sec.]Normal Comm.0.080
With 100 ms delay0.190.05
With 500 ms delay0.020.78
With 1 s delay−0.240.55

