Article

Degradation of Low Concentrated Perfluorinated Compounds (PFCs) from Water Samples Using Non-Thermal Atmospheric Plasma (NTAP)

by
Vojislav Jovicic
1,2,*,
Muhammad Jehanzaib Khan
1,2,
Ana Zbogar-Rasic
1,
Nataliia Fedorova
1,2,
Alexander Poser
3,
Peter Swoboda
3 and
Antonio Delgado
1,2
1
Institute of Fluid Mechanics (LSTM), Friedrich-Alexander University (FAU), 91058 Erlangen, Germany
2
Erlangen Graduate School in Advanced Optical Technologies (SAOT), 91054 Erlangen, Germany
3
R&H Umwelt GmbH, 90471 Nuremberg, Germany
*
Author to whom correspondence should be addressed.
Energies 2018, 11(5), 1290; https://doi.org/10.3390/en11051290
Submission received: 10 April 2018 / Revised: 4 May 2018 / Accepted: 14 May 2018 / Published: 18 May 2018
(This article belongs to the Special Issue Electric Fields in Energy & Process Engineering)

Abstract

:
Perfluorinated compounds (PFCs) are manmade chemicals, containing the covalent C-F bond, which is among the strongest chemical bonds known to organic chemistry. Abundant use of these chemicals contaminates air, water, and soil around the world. Despite recent initiatives and legal regulations set to reduce their omnipresence, conventional water purification processes are either inefficient or very expensive, especially for low PFC contamination levels. This research is focused on the non-thermal atmospheric plasma (NTAP) decomposition of very low concentrations (<1 µg/L) of PFCs (especially perfluorooctanoic acid (PFOA) and perfluorooctanesulfonate (PFOS)), present in the wastewater produced during the process of PFCs removal from contaminated soil. The efficiency of the decomposition process was investigated for air, oxygen, and nitrogen plasma, with exposure times of 1–10 min and different plasma nozzle- and reactor sizes. Experiments demonstrated that the NTAP treatment is an efficient alternative method for degradation of more than 50% of the initial PFC concentration in the water samples, in less than 200 s. The final concentration of PFC showed strong dependency on the tested parameters. The treatment effect showed to be strongly non-linear with time, followed by the reduction of the pH-value of the treated sample, which might present a limiting factor for further PFC decomposition.

1. Introduction

Perfluorinated compounds (PFCs) are widespread, manmade, organofluorine chemicals, which cause concern due to their bioaccumulation and low degradability in the environment [1,2,3,4]. Besides the C-C bond, these long-chained compounds with a general formula F(CF2)n-R include a carbon–fluorine (C-F) bond, which is one of the strongest covalent bonds in organic chemistry, with the dissociation energy of ΔH = 450 kJ/mol [5]. Abundant use of these chemicals in a wide variety of products caused their presence in air, fresh water supplies, and soil around the globe, with the potential to severely affect our ecosystem [6,7]. Especially sensitive are the rivers and aquifers—which supply millions of people worldwide with drinking water—where these chemicals can be dissolved [8]. A number of studies [9,10,11,12,13,14] overviewed the potential PFC sources, their occurrence in water, their toxicology, and their potential effect on human health.
Nowadays addressed as global contaminants [15], PFCs are present in the world’s market since the 1940s [16]. They have a number of applications, due to their unique physicochemical properties, such as chemical stability, non-wettability, high fire- and weather resistance, hydrophobic, and oleophobic nature, etc. [17,18,19]. They are applied in different products; e.g., fire extinguishing foams, lubricants, coatings (textile, leather, carpets, cookware, food packaging), mining and oil well surfactants, floor polishes, and insecticides [20,21,22]. The most extensively produced and the most environmentally prevalent PFC-chemicals are perfluorooctanoic acid (PFOA, molecular formula C7F15COOH) and perfluorooctanesulfonate (PFOS, molecular formula C8F17SO3), with an estimated global manufacture of ca. 69–320 t/year and 74–175 t/year, respectively [17,23,24].
Due to their high thermal and chemical stability, PFCs can resist degradation by acids, bases, oxidants, reductants, and photolytic processes. Because of their strong C–F bonds, they do not undergo biodegradation by microbes and metabolic processes, but remain in the environment [5,18,19]. Half-lives of PFOA and PFOS in surface waters under ambient conditions are 41 and 92 years respectively, while the estimated half-life in a human body is 2–8 years [25,26]. Exactly due to their long-term persistence in the environment, these chemicals now attract increased scientific and regulatory attention.
PFCs are widely distributed in the environment and highly soluble in water. The concentration of PFCs in surface and ground waters is usually at the level of ng/L [22,27,28,29]. Some PFCs were found in drinking water in extremely low quantities, ranging from pg/L to µg/L [9], making it a potential PFC exposure route for humans. On the other hand, wastewaters from special manufacturing industries usually contain high concentrations of PFOA.
Through their presence in waters, they are also present in crops, fruit, and vegetables around the world. Further, their negative effect is connected to their bioaccumulation and biomagnifications within wildlife [1,9,30]. Regarding human health, PFCs have potential or confirmed negative impact connected to increased cancer risk, thyroid diseases, and weakened immune system, etc. [31,32]. The Stockholm Convention on persistent organic pollutants [33,34] lists PFOS in Annex B, and PFOA is recommended for listing in Annex A. EU legislation placed restrictions on the production and use of these chemicals. The PFOA production in the US and Europe drastically decreased, since the main producing companies agreed to phase out its production [35].
A number of national and international health and environmental standards define (in μg/L or μg/kg) permissible concentration levels for PFOS and PFOA; e.g., for the EU, Australia, and Canada [36,37]. The European environment quality standard (EQS) of PFOS in surface waters is expressed as an annual average value, which is intended to ensure the long-term quality of the aquatic environment. For inland surface waters, the EU prescribes this value to be 0.00065 μg/L for PFOS, which is to be met by the end of 2027 [37,38]. This value is based on secondary poisoning (humans eating fish), due to the potential for PFOS to bio accumulate in the food chain. The EU is still considering the implementation of strict regulations regarding PFOA. The Maximum Acceptable Concentration EQS for inland surface waters is defined by the EU and the National Institute for Public Health and the Environment (RIVM) in the Netherlands to be 36 μg/L for PFOS [37,39].
In the case of the USA, in 2016 the EPA issued Lifetime Health Advisories for exposure from drinking water of 0.070 μg/L for PFOA and PFOS (individually or combined). Some US states developed their own guidelines for PFC presence in ground waters; e.g., Maine set concentration guidelines to 0.060 μg/L for PFOA and 0.100 μg/L for PFOS [40].
The worldwide distribution, bioaccumulation, and toxicity of PFCs urgently call for the development of treatment methods for the removal of PFCs from aqueous solutions. Despite recent initiatives and legal regulations set to reduce their presence in drinking water, a number of purification methods are either inefficient (e.g., Redox reactions [41,42,43], including the Ultra violet induced photochemical reaction [13,44,45], sonochemical reaction [46,47,48,49], Vacuum Ultraviolet irradiation [50,51] and sulfate radicals degradation [13]) or expensive, especially for very low PFC contamination levels (reducing treatment technologies, such as active carbon, reverses osmosis, nano-filtration [52]). On the industrial scale, it is possible to remove PFCs from water efficiently by physical adsorption on the active carbon, due to its high surface area. On the other hand, for a complete destruction of PFC, it must be incinerated at high temperatures above 1000 K [51], resulting in high operating costs. Some small-scale studies showed that electrochemical oxidation (EO) is a promising technique for the treatment of wastewaters contaminated with PFCs [22,53], possessing advantages such as relatively low energy consumption, mild conditions, and high removal efficiency. Another promising technique for effective and yet inexpensive PFC removal from contaminated waters is treatment with non-thermal atmospheric plasma (NTAP) [36,54,55,56,57,58,59]. A study by Niu et al. [22] showed that in this way PFC can be partially dissociated to form CxFy fragments. As indicated by the measurement of liquid chromatography–mass spectrometry (LC–MS), the main byproducts generated during the plasma treatment turned out to be perfluorocarboxylic acids [60].
The drawback of the previously mentioned studies on the removal of PFCs from water is that they were focused on concentration levels above 1 μg/L. On the other hand, the main method for the removal of the PFCs from the contaminated soil [61,62] produces huge amounts of wastewater in the flashing process, which are contaminated with PFCs at low concentrations below 1 μg/L. At these concentrations and wastewater quantities, conventional treatments become extremely expensive, urging an investigation of alternative methods.
Plasma, the fourth state of matter [63], first discovered in 1928 by Langmuir, is a fully or partially ionized gas consisting of electrons, ions, free radicals, and neutral species [41,64]. It is usually categorized in thermal (high temperature- or fusion-) plasma and non-thermal (low temperature or cold) plasma or gas discharges. In case of thermal plasma (e.g., arc discharges, torches), in order to reach thermal equilibrium of plasma constituents, high temperatures in the range 4000–20,000 K are required, which enables metal melting and the cutting or processing of very persistent wastes [41,65]. The non-thermal plasma can be generated using significantly less power (corona-, dielectric barrier-, gliding arc-, glow- and spark discharge), but demonstrate high selectivity and energy efficiency. In this case, the energetic electron temperature is much higher compared to that of the bulk gas molecules. Due to this, high-energy electrons can collide with bulk gas molecules (nitrogen, oxygen, water, etc.), producing secondary electrons, photons, ions, and radicals [41,65].
Different aspects of application of NTAP (in the form of a plasma jet) were in the past experimentally investigated by the authors: (a) Dry gasification: in the case of biomass, more than 85% of the initial sample mass was gasified using a nitrogen plasma jet, producing propane-equivalent in the outlet gas stream; similar effects were observed in experiments with oil shale [66,67]; (b) Cleaning and the sterilization of surfaces: cleaning of surfaces, contaminated with E. coli bacteria showed the great potential of NTAP for sterilization, while surfaces covered by eatable (olive) oil were effectively cleaned [68]; (c) Reduction of biotic and abiotic matter in water samples: after treatment, water samples contaminated by methylamine showed a reduction of the total organic carbon of 42%, with a simultaneous reduction of the chemical oxygen demand of 70% [69].
The goal of the present work was to investigate the potential of the NTAP for degrading very low concentrations (below 1 μg/L) of PFCs (with the emphasis on PFOA and PFOS) from contaminated water samples (batch treatment) originating from the soil cleaning process.

2. Materials and Methods

The NTAP-treatment efficiency for the degradation of PFC in water samples was tested as a function of different plasma gases (air, oxygen, and nitrogen), treatment times (1 to 10 min), plasma nozzle-, and reactor sizes.

2.1. Experimental Set-up

The experimental setup for batch treatment of water samples using NTAP (Figure 1) consists of: an atmospheric plasma generator (PlasmaBeam® [70]), a mass flow controller for the dosage of the plasma gas [71], a reactor with the water sample on which a plasma nozzle holder is fixed, and an in-house designed water-jacket cooling system (including a condenser), which keeps the reactor at the constant temperature (25–30 °C).
The atmospheric plasma generator is of the active gas jet type, where plasma is produced using a plasma generator (power 300 W, frequency 20 kHz) [70]. Plasma is formed when activated particles (ions, electrons, excited gas atoms, and molecules), which have been excited in the stream of gas flowing through the pulsed electrical arc, are transported away from the formation zone in the form of the plasma jet, exiting through the air cooled plasma nozzle.
Depending on temperature and species characteristics, different plasma types are present in different zones. Energy rich, hot plasma, so called active plasma, is located in the close vicinity of the electrode. The second plasma zone is located on the nozzle outlet, which interacts physically and chemically with the environment. Plasma in this zone, with the temperature ranging from 200–500 °C, so called non-thermal plasma, possess lower energy compared to the active plasma [64,66,72]. By interaction between the plasma species at the nozzle outlet and the environment air, a strong oxidizing medium, ozone, is formed.
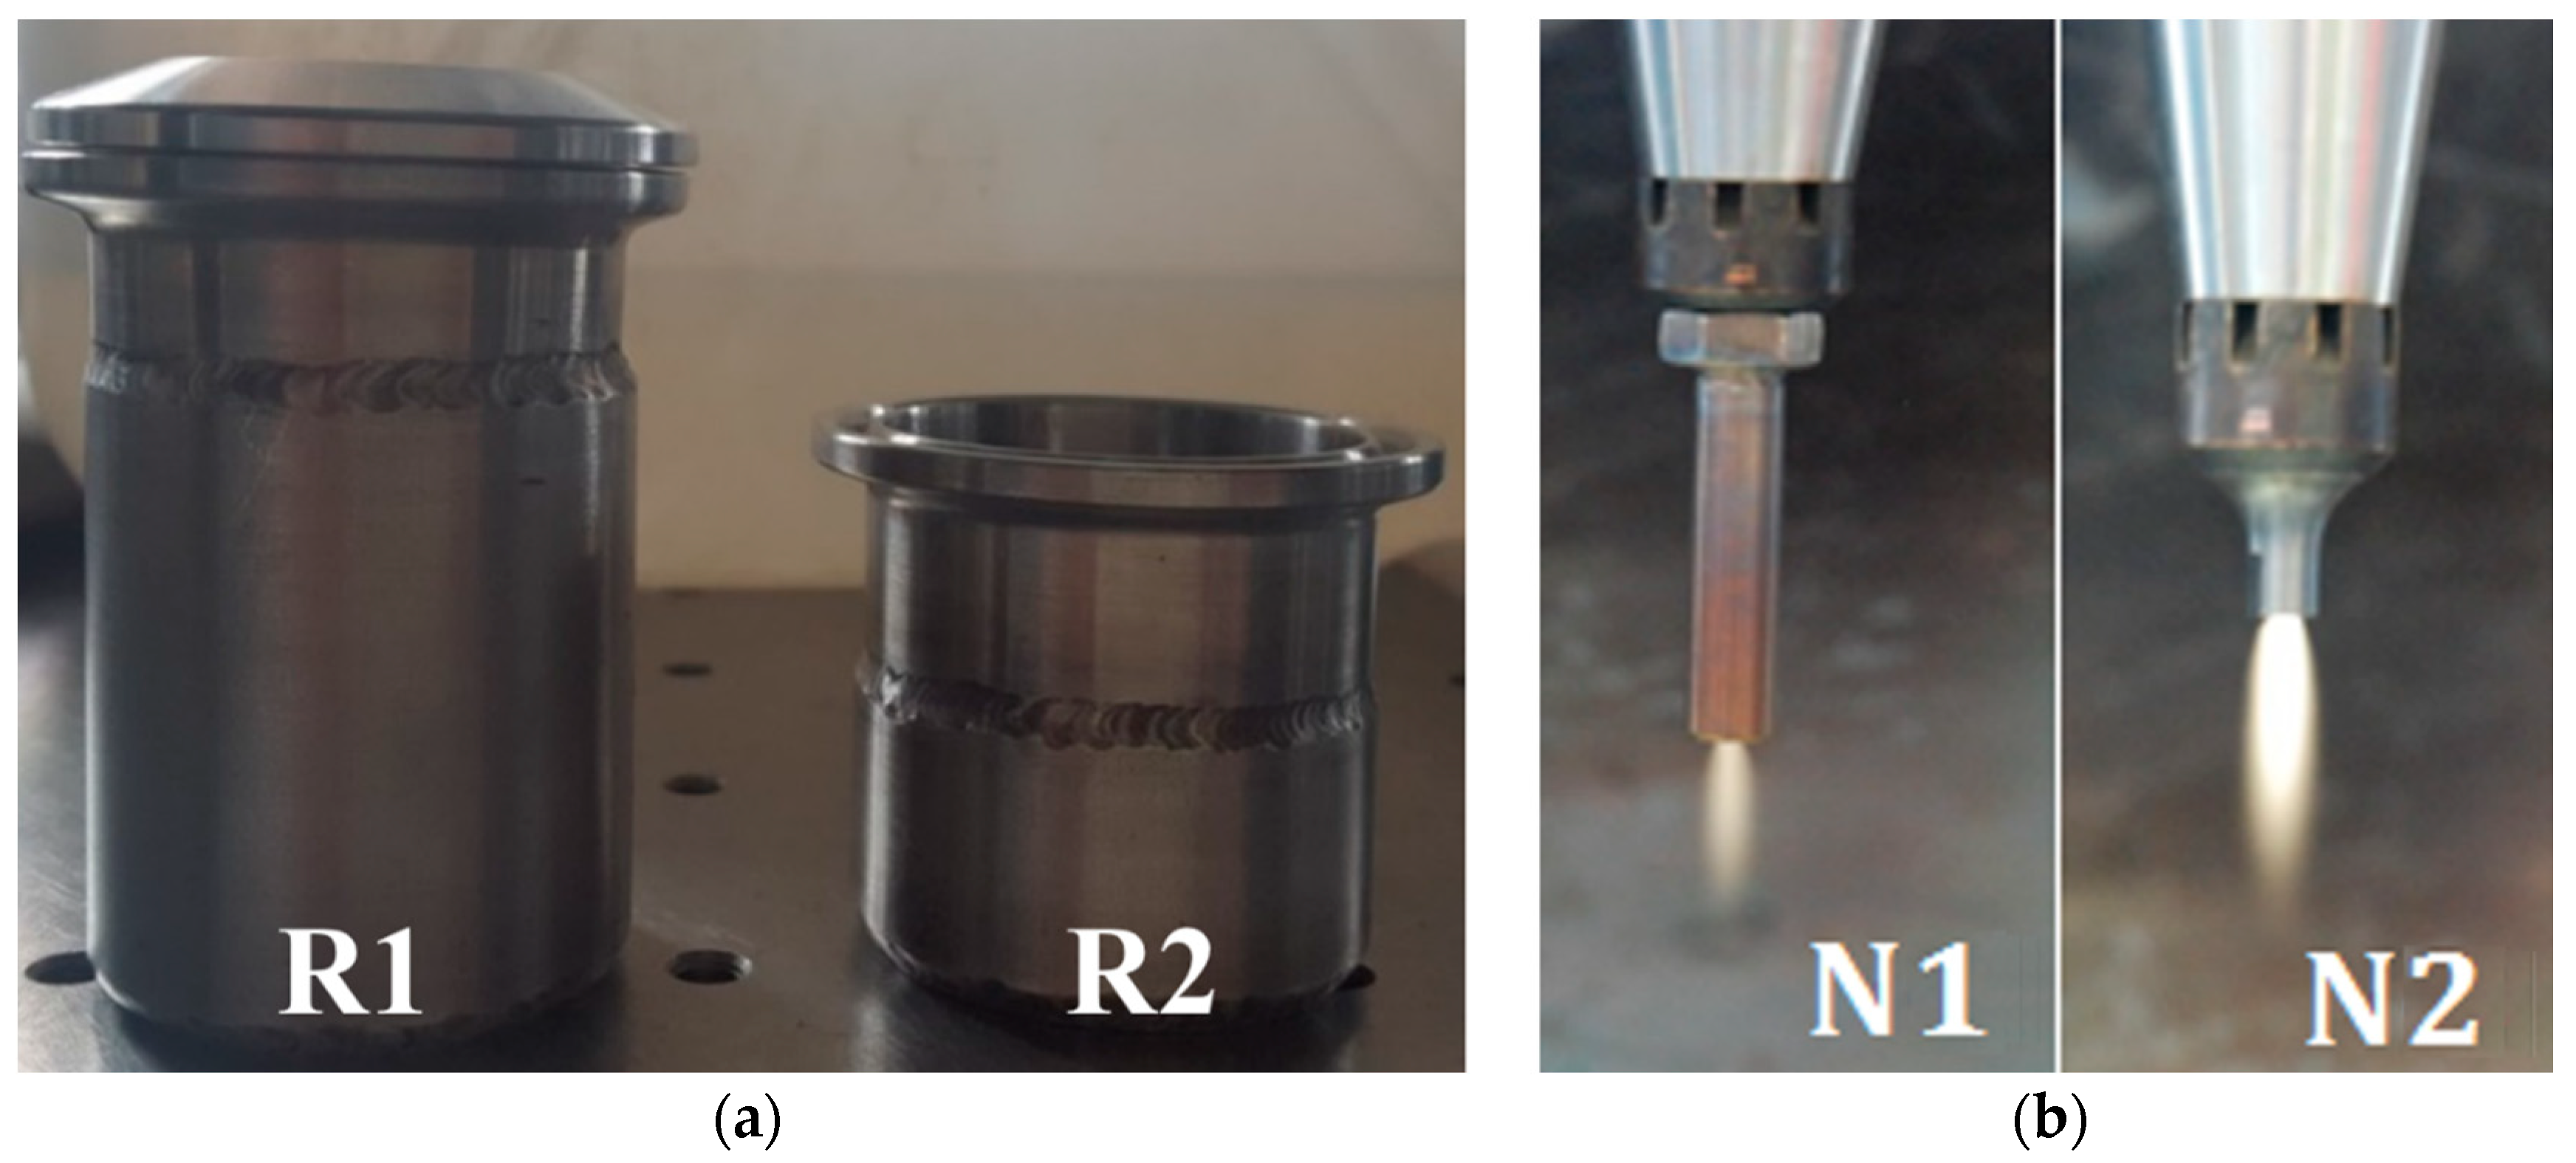
To investigate the influence of the reactor geometry (i.e., reaction zone size) on the NTAP-treatment process, two plasma reactors (R1 and R2) with the outer diameter do = 4 cm, the wall thickness 3 mm, and heights L1 = 56 mm and L2 = 36 mm, respectively, were applied (Figure 2, left). Initial water sample volumes were V1 = 45 ml within the reactor R1 and V2 = 35 ml within the reactor R2. In order to eliminate the influence of water sample temperature on the measurement results, both reactors were constantly cooled using an in-house designed water cooling system to keep the temperature inside the reactors at the constant level of 25–30 °C. The temperature of the water samples inside the reactors was measured using a K-type thermocouple.
The interaction between the plasma jet and a sample was investigated using two nozzles (N1 and N2), with inner diameter din = 2 mm and lengths of Ln1 = 34 mm and Ln2 = 24 mm, respectively (Figure 2, right). Before the treatment started, nozzles were dipped inside the water samples. Due to the difference in the nozzle lengths, the tip of the nozzle N1 is always placed deeper inside the sample, compared to nozzle N2.
When air and nitrogen are used as a plasma gas, the mass flowrate was set to ṁpl = 15 L/min, which is the minimum flowrate for plasma generation. In the case of oxygen, the mass flowrate was set to ṁpl = 20 L/min due to stability problems. In all test cases, the minimal plasma gas flow rate was chosen in order to reduce the blow-out of the contaminated water from the reactor by the plasma jet. Assumption is that the higher plasma gas flowrates would increase reaction surface between gas and liquid phase in the reactor. It would, however, also reduce the electron temperature of the ionized gas due to the constant plasma generator power output. Therefore, the influence of the gas flow rate, but also the power of the plasma generator, requires further investigation.
Tested wastewater samples, originating from the soil cleaning site, were prepared and later analyzed in the laboratories of the company RH-Umwelt [73]. They had an initial PFC concentration of c = 0.932 μg/L (averaged value), with initial sum PFOA and PFOS concentrations of c = 0.579 µg/L (averaged value).

2.2. Experimental Procedure

The repeatability of measurement results was analyzed in two separate sets of measurements, with five tested samples in each set (treated under the same test conditions). PFC and PFOA-and-PFOS concentrations were separately measured for each tested sample. In the first set of measurements, water was treated within the reactor R1 with the plasma nozzle N1, and in the second set within the reactor R2 with the plasma nozzle N2. Standard deviation of the measured concentrations was found to be below 5%. Low standard deviation enables further data analysis based on a single measurement per reactor-nozzle and size-treatment time combination. Beside the evaluation of the repeatability, these experiments were used as reference measurements to be later compared with the results obtained with other operating parameters. Maximal treatment time in the reactor R1 was tt1 = 10 min, and in the reactor R2 was tt2 = 5 min.
The influence of NTAP-treatment time was investigated in both reactors. In the reactor R1 tested treatment times were 1, 3, 5, 7, and 10 min, and in the reactor R2 tested treatment times were 1, 3 and 5 min. In addition, tests were conducted for each combinations of reactor (R) and the nozzle (N); i.e., R1-N1, R2-N2, R1-N2 and R2-N1.
Treated samples were analyzed for the concentration of PFC, PFOA, and PFOS. The perfluorinated hydrocarbons were analyzed by liquid chromatography–mass spectrometry (LC–MS), following the German Norm DIN 38407 F42. The expanded measurement uncertainty of the laboratory measurements is in the range of ±5.505% for the PFOA and ±7.740% for PFOS values. The decomposition rate was evaluated by comparing the starting and ending concentration of PFC (in total, and as a sum of PFOA and PFOS).

3. Results and Discussion

3.1. Repeatability

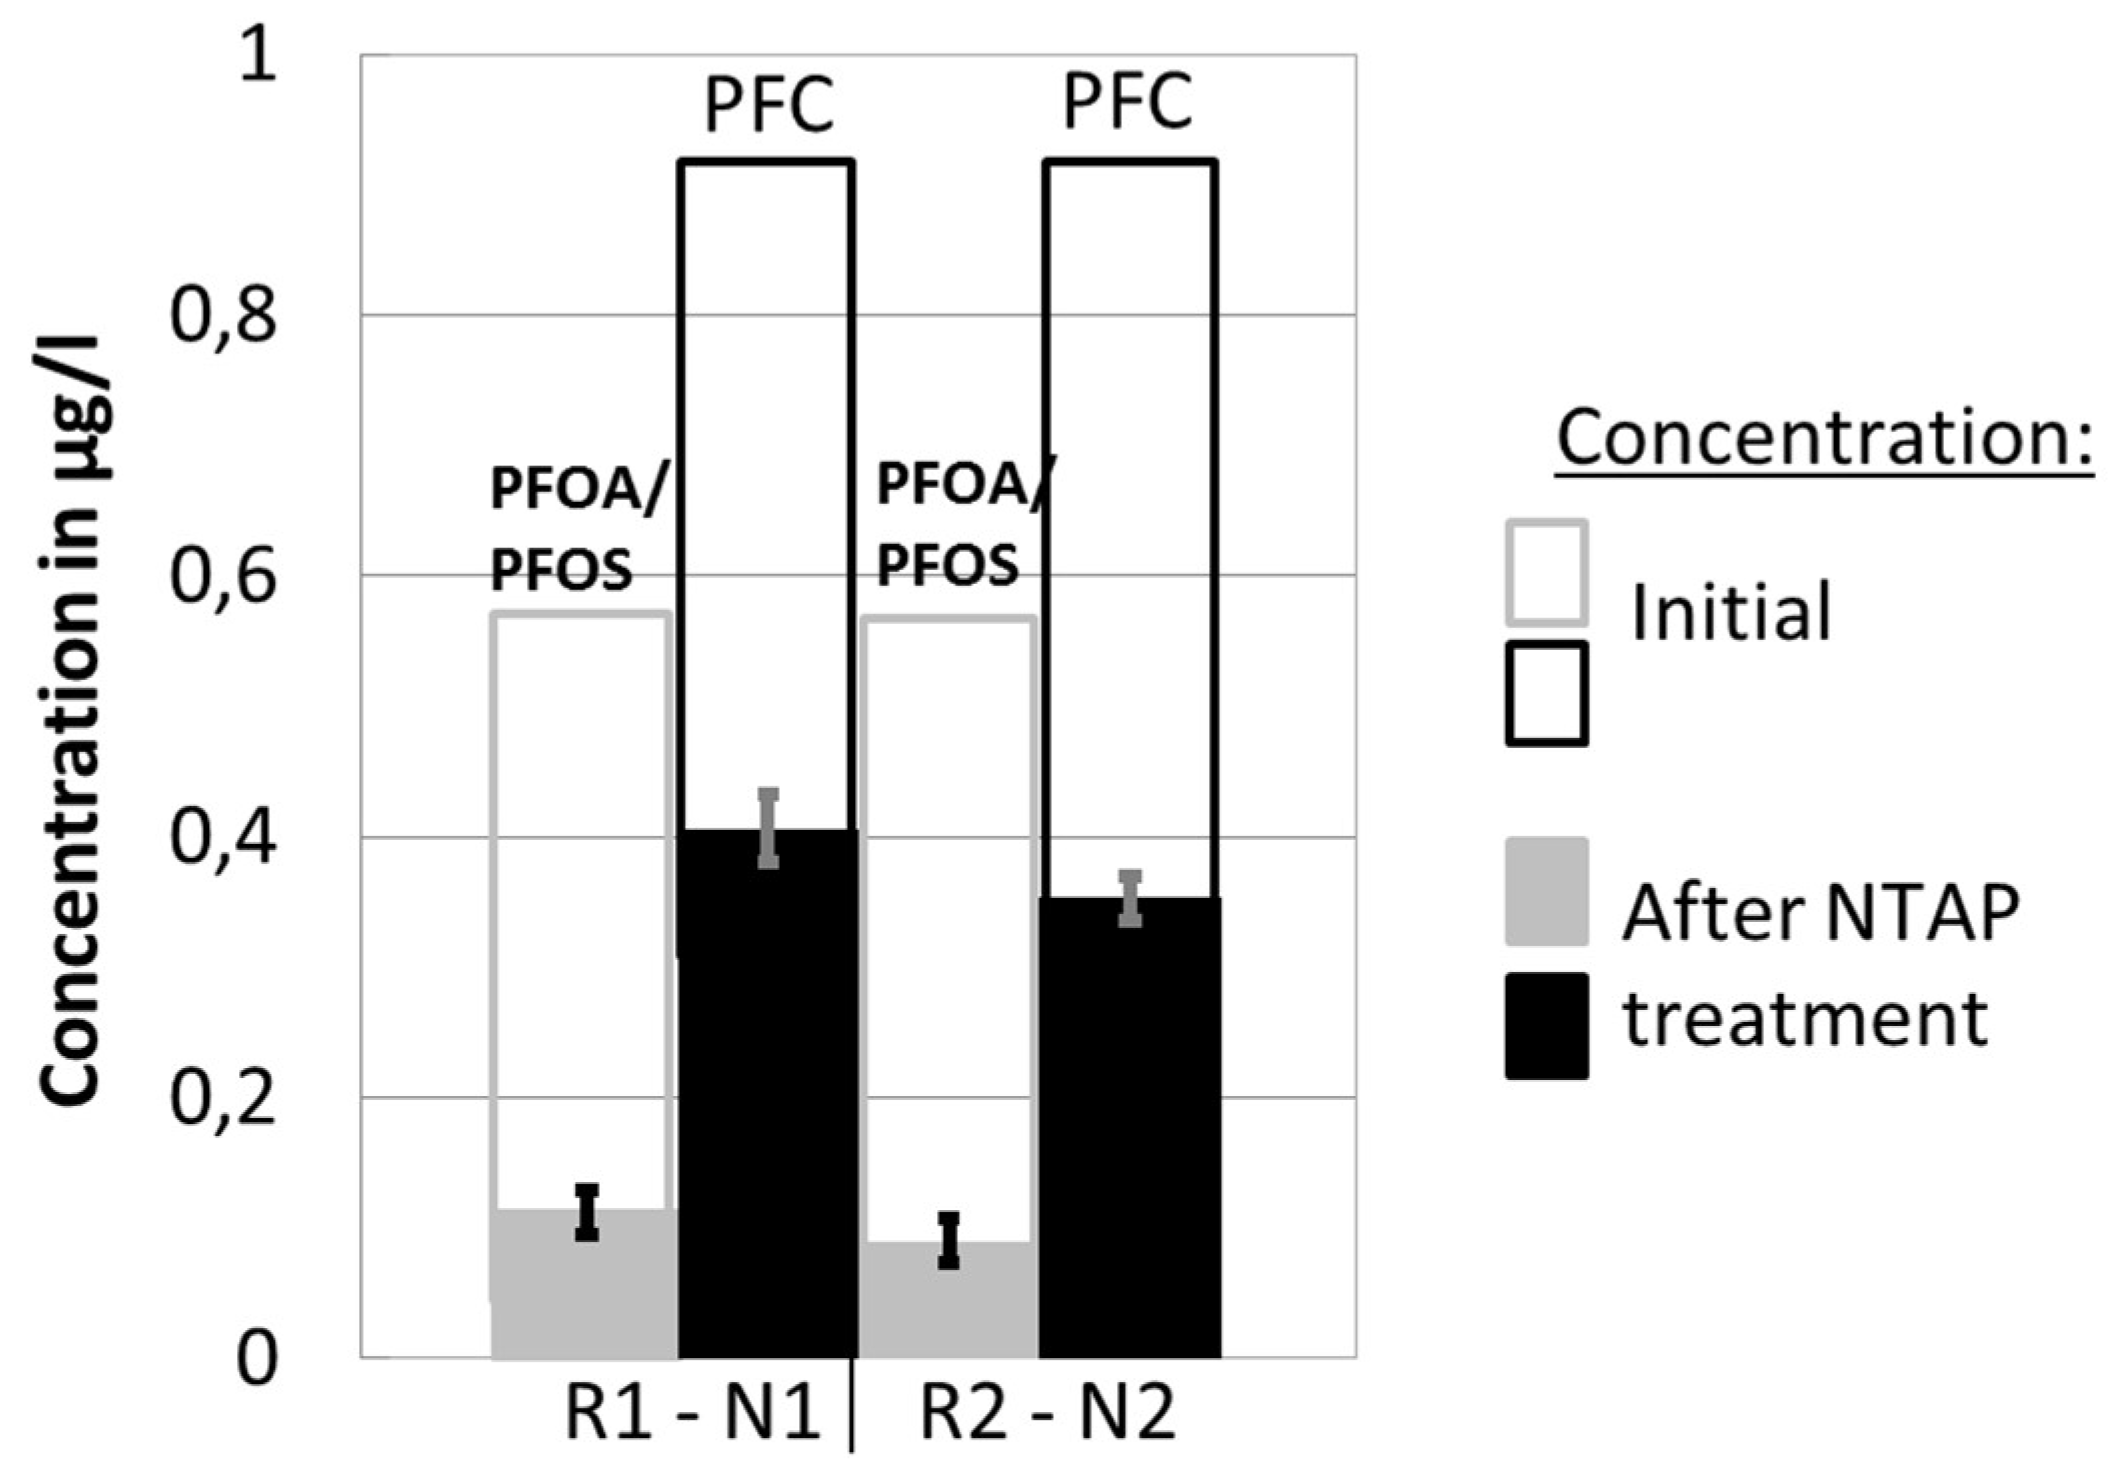
The repeatability of conducted measurements was analyzed based on two separate sets of five measurements, for two reactor-nozzle combinations (R1-N1, R2-N2), where PFC and PFOA-and-PFOS concentrations were determined. For these two sets of measurements, the plasma gas (air) flow rate and the treatment time within the reactor were kept constant. Results are shown in Figure 3.
The first two columns represent the results of the experiments with R1-N1, and the second two with R2-N2. The change of the PFOA-and-PFOS concentration before and after the NTAP treatment is shown in the 1st and the 3rd column, while the 2nd and the 4th column show the reduction of the total PFC concentration. The total column height corresponds to the initial concentration of the observed components in the water solution. The solid part of the column denotes concentration after the NTAP treatment.
The calculated standard deviation of under 5% indicates the good repeatability of the conducted measurements.

3.2. Perfluorinated Compound (PFC) Concentration and Influence of Non-Thermal Atmospheric Plasma (NTAP) Treatment

The change of concentration of the PFC and PFOA-and-PFOS obtained by the two sets of experiments for the two reactor-nozzle combinations (R1-N1, R2-N2) are presented in Figure 3. Experimental results demonstrate that the NTAP-treatment caused a sharp decline of both PFC and PFOA-and-PFOS concentrations in the water samples. The average PFC and PFOA-and-PFOS end-concentrations after the NTAP treatment were 0.406 µg/L and 0.112 µg/L, respectively (R1-N1), and 0.353 µg/L and 0.090 µg/L, respectively (R2-N2). The reduction efficiency was higher in the case of R2-N2; i.e., 62.1% (PFC) and 84.5% (PFOA-and-PFOS), compared to R1-N1; i.e., 56.4% (PFC) and 80.7% (PFOA-and-PFOS). The reduction is more pronounced for the R2-N2 combination, possibly because the plasma jet, produced by the small nozzle N2, had a good contact with the water sample within the small reaction zone of R2. As a result, the concentration of the reaction initiating plasma radicals in the reaction zone is potentially higher. Although not completely conclusive, results regarding the influence of the reactor-nozzle geometry on the degradation of PFCs indicate potential and require further research and process optimization.
Finally, it is noticeable that the concentration reduction was more pronounced for PFOA-and-PFOS compared to PFC, which further indicates that among a range of different PFCs, a component group exists that is less affected by the NTAP treatment compared to PFOA and PFOS.

3.3. Influence of Treatment Time/Reactor Size/Nozzle Size

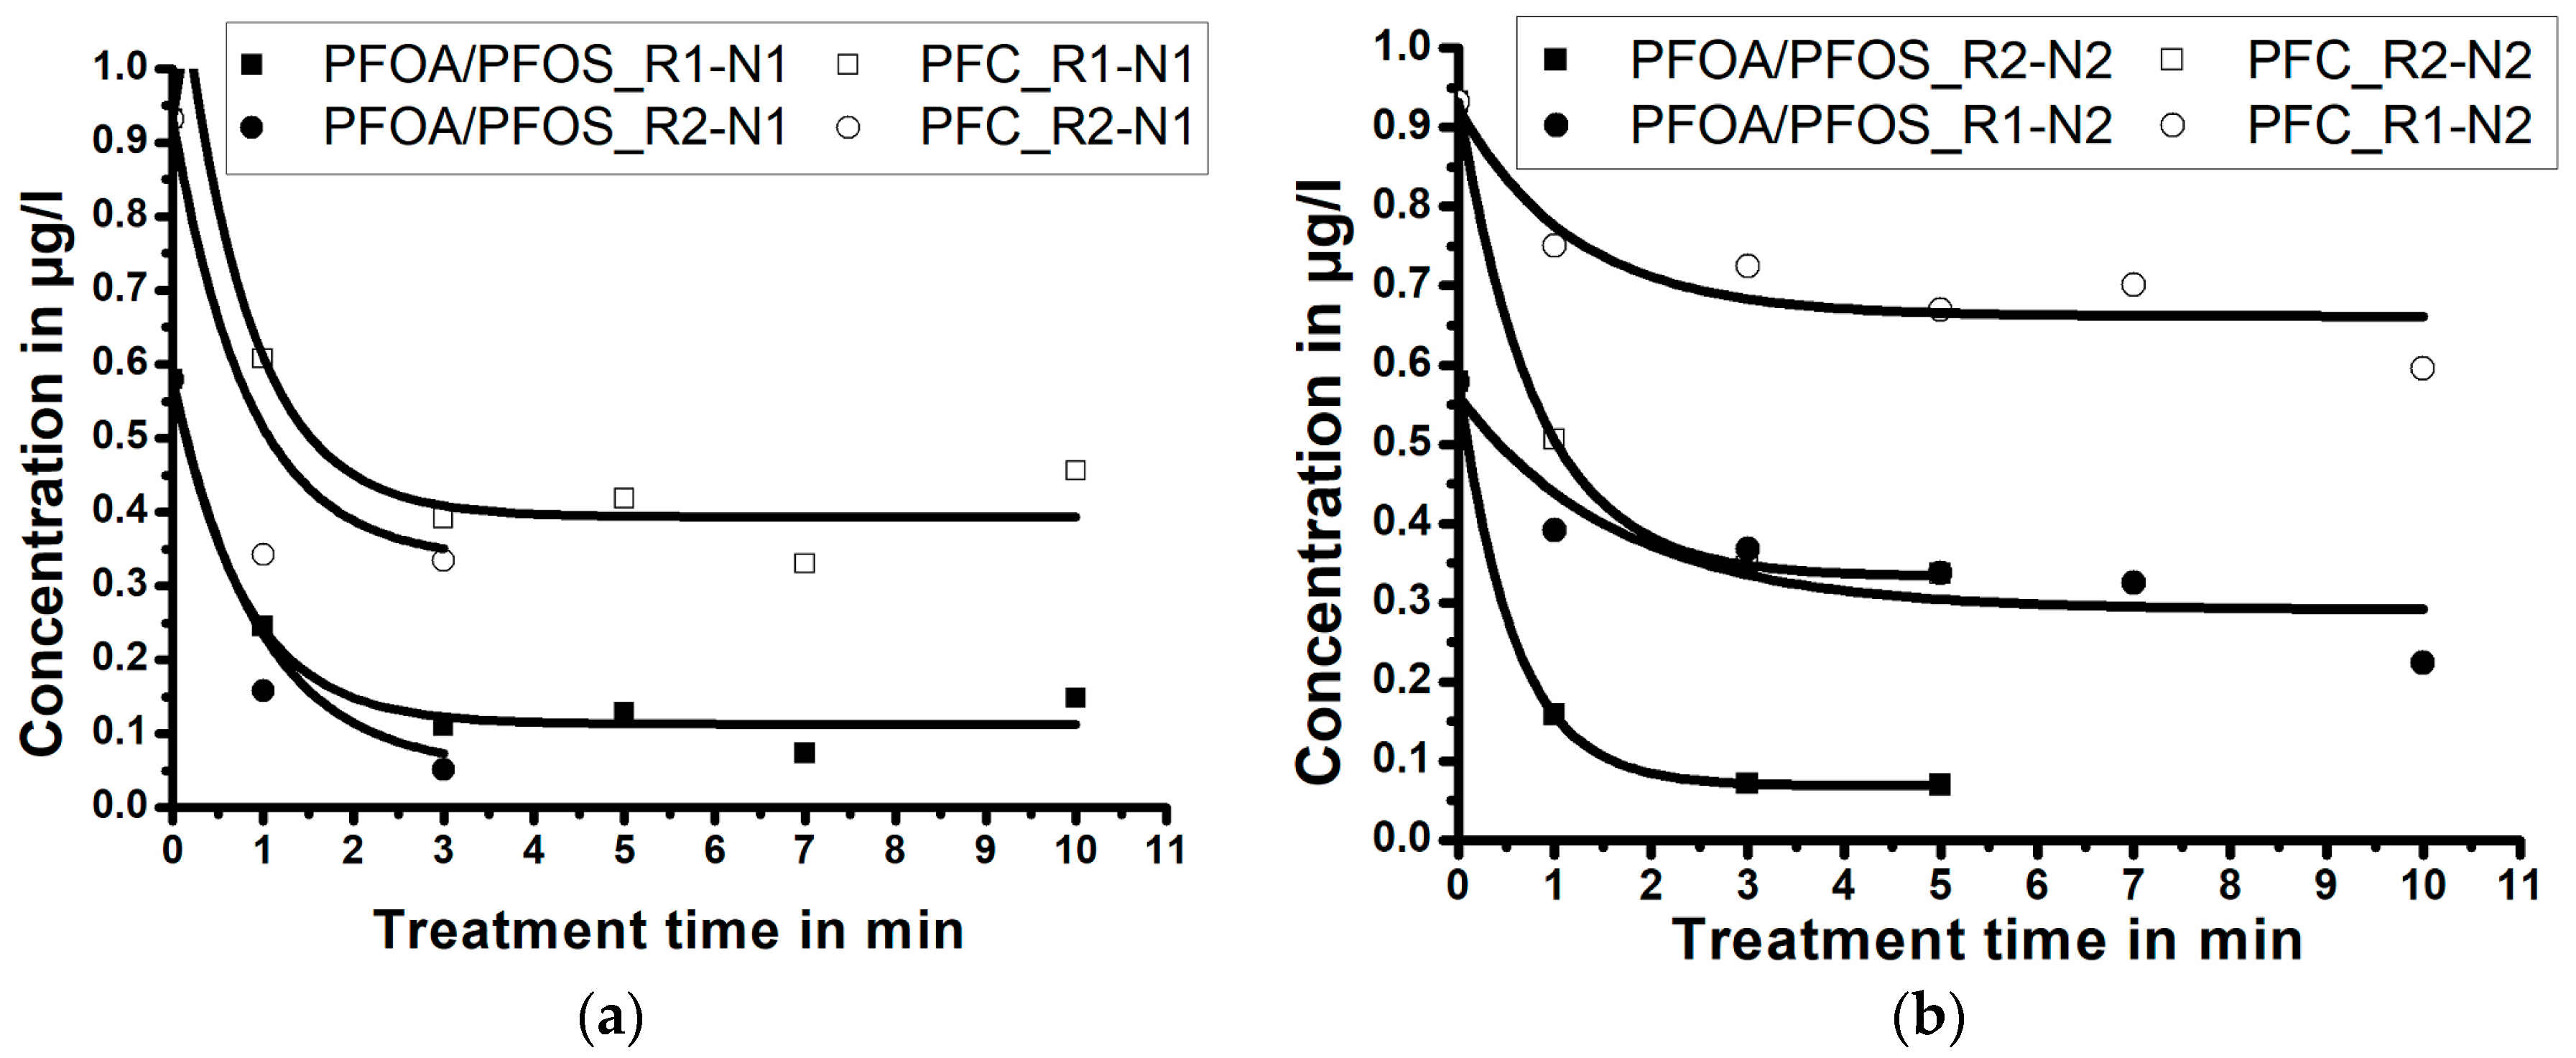
Experimental results, presented in the Figure 4a,b, demonstrate the influence of the NTAP treatment time and of the reactor size; i.e., the size of the reaction zone, on PFC and PFOA-and-PFOS concentrations in water samples (for the fixed nozzle size). Results demonstrate that, independent of the reactor size, the maximum reduction of PFC and PFOA-and-PFOS occurs during the first minutes of the NTAP treatment. Independent of the reactor size, the treatment of water samples using the nozzle N1 for longer than 3 min (5 min for the nozzle N2) does not further decrease the PFC and PFOA-and-PFOS concentrations.
Figure 4a (treatment with the nozzle N1) demonstrates that when the sample is treated for three minutes by NTAP, the PFC concentration reduces from 0.932 µg/L to 0.391 µg/L (reduction of 58.0%) within the reactor R1, and to 0.336 µg/L (reduction of 63.9%) within the reactor R2. The PFOA-and-PFOS concentration reduces from 0.579 µg/L to 0.110 µg/L (reduction of 81.0%) within the reactor R1, and to 0.051 µg/L (reduction of 91.2%) in the reactor R2. When only the nozzle N1 is considered, the treatment within a small reaction zone (reactor R2) resulted in a more efficient PFC and PFOA-and-PFOS reduction, compared to the bigger reaction zone within the reactor R1.
Figure 4b (treatment with the nozzle N2) reveals that when the sample is treated by NTAP for five minutes, the PFC concentration reduces from 0.932 µg/L to 0.669 µg/L (reduction of 28.2%) within the reactor R1, and to 0.345 µg/L (reduction of 63.0%) in the reactor R2. PFOA-and-PFOS concentration reduces from 0.579 µg/L to 0.337 µg/L (reduction of 41.8%) within the reactor R1, and to 0.069 µg/L (reduction of 88.1%) in the reactor R2. When only the nozzle N2 is considered, the treatment within a small reaction zone (R2) again resulted in a more efficient PFC and PFOA-and-PFOS reduction, compared to the big reaction zone (R1).
When the results presented in Figure 4a,b are compared (Table 1), the influence of the nozzle size on the degradation of PFC and PFOA-and-PFOS in water samples can be better evaluated.
In general, the results imply that experiments with the longer nozzle (N1) result in a higher degradation rate of PFC and PFOA-and-PFOS compared to the experiments with a shorter nozzle (N2), despite longer exposure time.
Experimental results (Figure 4a,b), also indicate that the contact quality between the plasma jet and the sample volume (i.e., size of the reaction zone) is an important parameter for PFC degradation by NTAP treatment. The reduction efficiency is very similar for reactor size-nozzle combinations R2-N1 (highest efficiency), R2-N2 and R1-N1, while the combination R1-N2 is the least efficient. The sample treatment in the larger reactor (R1) using the shorter nozzle (N2) was the least efficient, probably due to a lowest concentration of radicals in the reaction zone and poor contact between the plasma jet and the sample.
It can be concluded that the reactor and the plasma jet size must be carefully paired in order to provide the optimal contact between the active radicals (from plasma jet) and the treated water sample in order to provide an efficient wastewater treatment; i.e., breaking of the strong C-F bonds. The nozzle length influences the length of the plasma jet, which is connected to mixing within the sample; i.e., the contact surface between the plasma gas and the liquid sample. Although study of this influence and the influence of the distance between the plasma nozzle and water surface, is out of the scope of this work, it should be a further pursuit due to the potential importance for the optimization of large-scale systems.

3.4. Influence of the pH-Value

The sample analysis exhibited that the concentration of PFC and PFOA-and-PFOS did not decrease further after the treatment time of three minutes (nozzle N1); i.e., five minutes (nozzle N2) (Figure 4a,b). Further analysis revealed that the pH-value of samples after the mentioned treatment time was reduced, from the starting value between pH = 6.8 and 7.1 to the end value between pH = 2.3 and 2.6. Thus, it was assumed that the acidity of the samples negatively influenced the further PFC degradation process by NTAP. Hayashi et al. [60], who treated PFC contaminated water samples (in mL range) by DC plasma within oxygen bubbles, reported that the main byproducts they obtained during the treatment were perfluorocarboxylic acids (PFCAs), which would explain the increased acidity in the present work. Still, these authors did not report any connection between the acidity and the plasma treatment efficiency, although they treated samples for considerably longer time periods (up to 8 h), during which the concentration of PFCAs varied.
The influence of the pH-value of the sample on the PFC degradation rate was tested using newly prepared water samples, obtained by diluting (with deionized water) the reference samples (PFC concentration 0.932 µg/L) to the PFC concentration level that corresponded to the end-concentration of the treated samples in the previous set of experiments (shown in Table 2 as the initial concentration for the new set of measurements). When these diluted samples, having a pH value in the range 6.8–7.1, were treated by NTAP, the concentration of PFC decreased further (end concentration of PFC), as shown in Table 2.
Analysis of the treated diluted samples confirmed the further reduction of the PFC concentration: in case of reactor R1 up to 19%, and in case of reactor R2 up to 43%. The further decrease of PFC concentration was again ended when the pH-Value reached the threshold value of pH in the range 2.3 to 2.6. The performed tests demonstrated that the acidic nature of the samples was acting as a barrier for degradation of the PFC. This set of measurements lead to the conclusion that for an efficient NTAP-treatment of PFCs the pH value of the treated sample should be regulated during the treatment process.

3.5. Influence of the Plasma Gas

In order to investigate the influence of used plasma gas on the PFC reduction in water samples by NTAP, three different plasma gases—air, oxygen, and nitrogen—were tested. A previously described experimental set-up and the testing procedure used for the experiments with air was kept unchanged in additional tests with oxygen and nitrogen.
Oxygen. Contrary to the set of experiments when air was used as a plasma gas (plasma gas flow rate of 15 L/min), the flow rate of oxygen was set to 20 L/min, since at lower flow rates the plasma generator was unstable. It was observed that with oxygen as a plasma gas, the formed plasma jet was not in the visible range. The presence of plasma was confirmed by measuring the temperature at the plasma nozzle outlet, which was in the range of 250 °C to 300 °C.
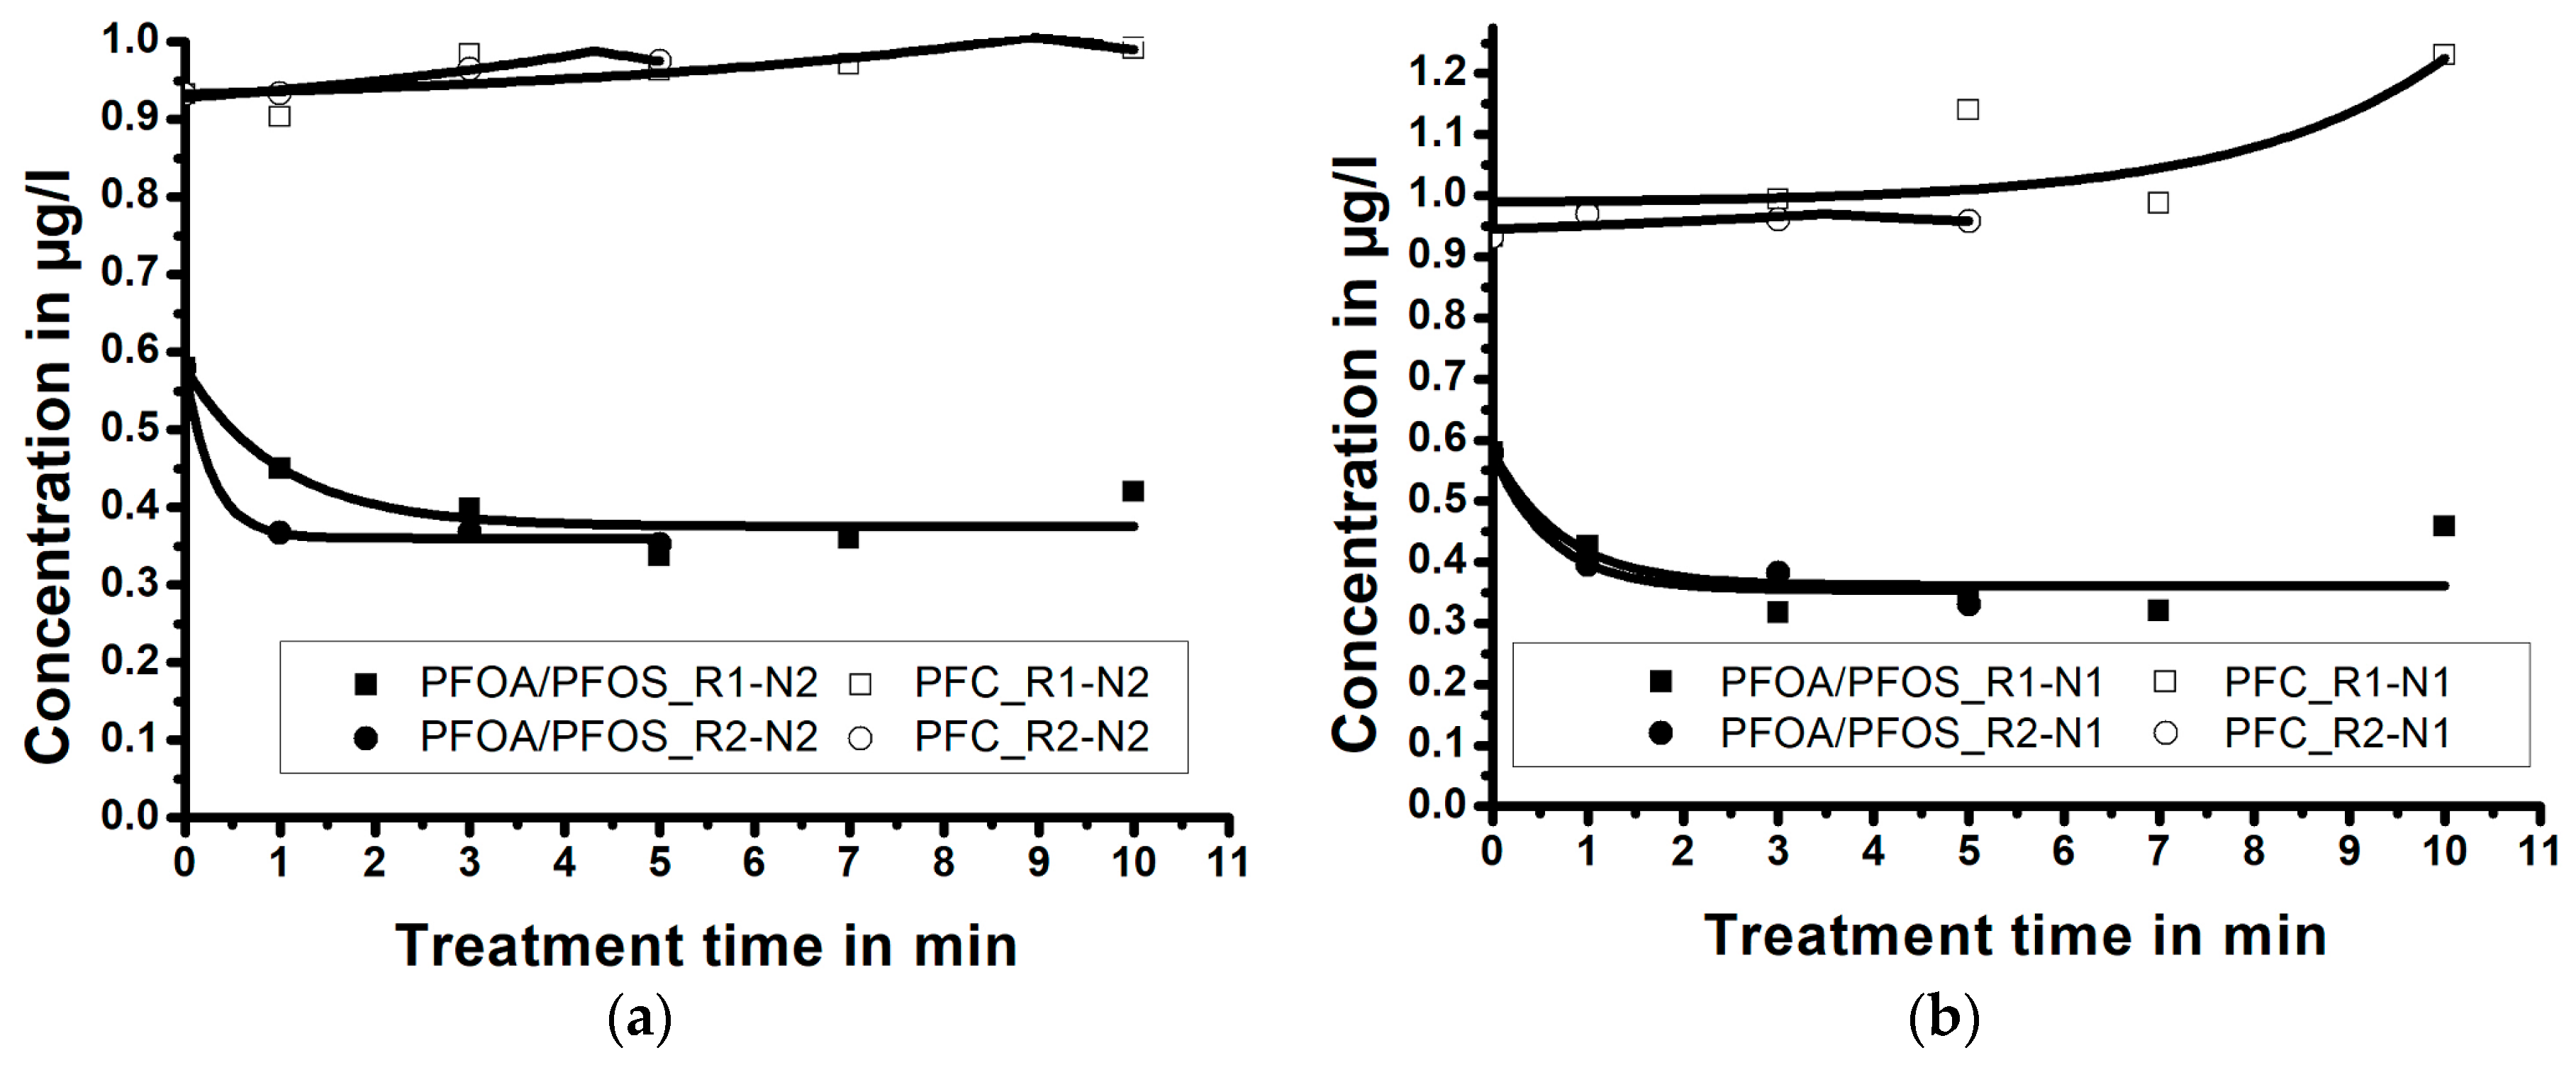
Figure 5 shows the PFC and PFOA-and-PFOS concentrations during the sample exposure to the oxygen plasma gas. It can be observed that the concentration of PFOA-and-PFOS generally decreases from its initial value of c = 0.579 µg/L to the end concentration of c = 0.348 µg/L (treatment time 7 min in R1-N1); i.e., c = 0.353 µg/L (treatment time 5 min in R2-N2). On the other hand, the concentration of PFC increases with the treatment time.
A chemical analysis of the samples showed that the concentration of H4PFOS increased from <0.01 µg/L to >0.7 µg/L, hence increasing the overall PFC concentration in the treated samples. A possible route to this compound starts from highly reactive oxygen radicals (e.g., ozone), which can initiate a breaking up of the C-F bond in a PFC chain, while the fluorine atoms can be replaced by hydrogen atoms from water.
Nitrogen. Dominant radicals produced by nitrogen plasma are excited nitrogen molecules in the metastable state. After being injected into the water sample, these radicals disappear instantaneously (within tens of nm), producing hydroxyl (OH-) based molecules; e.g., hydrogen peroxide and hydrogen dioxide. Together with nitrogen monoxide they can diffuse deeper into the water, implying that a chemical reaction can be initiated in the sample bulk [74].
On the other hand, their reduction potential is much lower compared to ozone radicals; i.e., they cannot significantly degrade PFC. The influence of nitrogen as the plasma gas (mass flow rate 15 L/min) on the PFC concentration reduction demonstrated the lower reduction potential of nitrogen as a plasma gas for the reduction of PFC from water samples in comparison to the air as plasma gas.

4. Conclusions

In the present paper, the potential of non-thermal atmospheric plasma (NTAP) in the treatment of water samples contaminated with low concentrations of PFC (below 1 μg/L) was experimentally investigated. This PFC concentration range is relevant and common in the treatment of huge amounts of waste water used to wash PFC contaminated soil; e.g., industrial facilities or areas close to airport runaways (due to the use of emergency landing foams that contain high concentrations of PFC). The tested parameters were the treatment time, the plasma gas, the reactor size (size of the reaction zone) and the nozzle length.
Experimental investigation demonstrated that a 3–5 min treatment causes a significant decrease of PFC and PFOA-and-PFOS concentration in water samples of up to ca. 64% and 90%, respectively, indicating that NTAP is a promising technique for the degradation of the strong C-F bonds present in PFCs. Experiments demonstrated a strong dependency of the end PFCs concentration level on the reactor-nozzle geometry; i.e., a proper pairing of the reactor zone size and the size of the plasma jet. The best results, showing the strongest reduction levels of PFC concentration, were observed when the small reactor (R2) was paired with the big nozzle (N1), indicating the conditions under which a high concentration of plasma radicals can be reached, which have a positive effect on C-F bond degradation.
Depending on the reactor size, the discontinuation of the PFC degradation was reached after a certain treatment period. This correlated to the reduction of the pH-value of the treated sample, which was reduced from approximately pH = 7.0 to approximately pH = 2.5; i.e., the decrease of the PFC concentration stopped due to an increased sample acidity. When the sample was diluted to concentration values reached in the first treatment set, the PFC concentration continued to decline; i.e., the pH-restriction barrier for PFC degradation was confirmed.
Among the tested plasma gases, the best results were achieved with air as the plasma gas. Due to some side reactions, the oxygen increases the PFC concentration, while the effect of nitrogen is less pronounced compared to air.
Regarding a biological relevancy, it was demonstrated that the novel water treatment using NTAP technology is a promising technique that is able to significantly decrease PFC and PFOA-and-PFOS concentrations, occurring in g/L range in surface and waste water samples without the need for the incineration of active coal from the filters and the chemical treatment of the exhaust gases from the incineration facilities (as it is commonly the case in current process of PFC removal from contaminated soil). Nevertheless, in order to promote NTAP technology to the level of practical application in wastewater treatment for the degradation of PFC, further tests are required to define the influence of different non-thermal plasma types and to investigate different plasma gas/water contact surfaces building.

Author Contributions

Conceptualization, V.J. and A.D.; Methodology, V.J. and M.J.K; Validation, A.P. and P.S.; Investigation, M.J.K.; Resources, A.D. and P.S.; Data Curation, M.J.K., V.J. A.Z.-R. and N.F.; Writing-Original Draft Preparation, A.Z.-R., N.F. M.J.K. and V.J.; Writing-Review & Editing A.Z.-R., N.F. M.J.K. and V.J.; Visualization, M.J.K.; Supervision, A.Z.-R. and N.F.

Funding

This research received no external funding.

Acknowledgments

We acknowledge support by Deutsche Forschungsgemeinschaft and Friedrich-Alexander-Universität Erlangen-Nürnberg (FAU) within the funding programme Open Access Publishing. The authors also gratefully acknowledge funding of the Erlangen Graduate School in Advanced Optical Technologies (SAOT) by the German Research Foundation (DFG) in the framework of the German excellence initiative.

Conflicts of Interest

The authors declare no conflict of interest. The founding sponsors had no role in the design of the study; in the collection, analyses, or interpretation of data; in the writing of the manuscript, and in the decision to publish the results.

References

  1. Key, B.D.; Howell, R.D.; Criddle, C.S. Fluorinated organics in the biosphere. Environ. Sci. Technol. 1997, 31, 2445–2454. [Google Scholar] [CrossRef]
  2. Liou, J.S.-C.; Szostek, B.; DeRito, C.M.; Madsen, E.L. Investigating the biodegradability of perfluorooctanoic acid. Chemosphere 2010, 80, 176–183. [Google Scholar] [CrossRef] [PubMed]
  3. Zareitalabad, P.; Siemens, J.; Hamer, M.; Amelung, W. Perfluorooctanoic acid (PFOA) and perfluorooctanesulfonic acid (PFOS) in surface waters, sediments, soils and wastewater—A review on concentrations and distribution coefficients. Chemosphere 2013, 91, 725–732. [Google Scholar] [CrossRef] [PubMed]
  4. Morrison, J. Perfluorinated chemicals taint drinking water. Chem. Eng. News 2016, 94, 20–22. [Google Scholar]
  5. Parsons, J.R.; Saez, M.; Dolfing, J.; de Voogt, P. Biodegradation of perfluorinated compounds. Rev. Environ. Contam. Toxicol. 2008, 196, 53–71. [Google Scholar] [CrossRef] [PubMed]
  6. Butt, C.M.; Berger, U.; Bossi, R.; Tomy, G.T. Levels and trends of poly- and perfluorinated compounds in the arctic environment. Sci. Total Environ. 2010, 408, 2936–2965. [Google Scholar] [CrossRef] [PubMed]
  7. Kwadijk, C.J.; Korytár, P.; Koelmans, A.A. Distribution of Perfluorinated Compounds in Aquatic Systems in The Netherlands. Environ. Sci. Technol. 2010, 44, 3746–3751. [Google Scholar] [CrossRef] [PubMed]
  8. Fujii, S.; Polprasert, C.; Tanaka, S.; Lien, N.P.H.; Qiu, Y. New POPs in the water environment: Distribution, bioaccumulation and treatment of perfluorinated compounds: A review paper. J. Water Supp. Res. Technol. AQUA 2007, 56, 313–326. [Google Scholar] [CrossRef]
  9. Post, G.B.; Cohn, P.D.; Cooper, K.R. Perfluorooctanoic acid (PFOA), an emerging drinking water contaminant: A critical review of recent literature. Environ. Res. 2012, 116, 93–117. [Google Scholar] [CrossRef] [PubMed]
  10. Arvaniti, O.S.; Stasinakis, A.S. Review on the occurrence, fate and removal of perfluorinated compounds during wastewater treatment. Sci. Total Environ. 2015, 524, 81–92. [Google Scholar] [CrossRef] [PubMed]
  11. Lehmler, H.J. Synthesis of environmentally relevant fluorinated surfactants—A review. Chemosphere 2005, 58, 1471–1496. [Google Scholar] [CrossRef] [PubMed]
  12. Mhadhbi, L.; Rial, D.; Pérez, S.; Beiras, R. Ecological risk assessment of perfluorooctanoic acid (PFOA) and perfluorooctanesulfonic acid (PFOS) in marine environment using Isochrysis galbana, Paracentrotus lividus, Siriella armata and Psetta maxima. J. Environ. Monit. 2012, 14, 1375–1382. [Google Scholar] [CrossRef] [PubMed] [Green Version]
  13. Lutze, H.V.; Brekenfeld, J.; Naumov, S.; von Sonntag, C.; Schmidt, T.C. Degradation of perfluorinated compounds by sulfate radicals—New mechanistic aspects and economical considerations. Water Res. 2018, 129, 509–519. [Google Scholar] [CrossRef] [PubMed]
  14. Ludwicki, J.K.; Goralczyk, K.; Strucinski, P.; Wojtyniak, B.; Rabczenko, D.; Loft, G.; Lindh, C.H.; Jonsson, B.A.G.; Lenters, V.; Heederik, D.; et al. Hazard quotient profiles used as a risk assessment tool for PFOS and PFOA serum levels in three distinctive European populations. Environ. Int. 2015, 74, 112–118. [Google Scholar] [CrossRef] [PubMed]
  15. Jin, Y.H.; Liu, W.; Sato, I.; Nakayama, S.F.; Sasaki, K.; Saito, N.; Tsuda, S. PFOS and PFOA in environmental and tap water in China. Chemosphere 2009, 77, 605–611. [Google Scholar] [CrossRef] [PubMed]
  16. Codling, G.; Vogt, A.; Jones, P.D.; Wang, T.; Wang, P.; Lu, Y.L.; Corcoran, M.; Bonina, S.; Li, A.; Sturchio, N.C.; et al. Historical trends of inorganic and organic fluorine in sediments of Lake Michigan. Chemosphere 2014, 114, 203–209. [Google Scholar] [CrossRef] [PubMed]
  17. Buser, A.; Morf, L. Substance Flow Analysis for Switzerland: Perfluorinated Surfactants Perfluorooctanesulfonate (PFOS) and Perfluorooctanoic Acid (PFOA); Environmental Studies No. 0922; Federal Office for the Environment: Bern, Switzerland, 2009; p. 144. [Google Scholar]
  18. Stahl, T.; Mattern, D.; Brunn, H. Toxicology of perfluorinated compounds. Environ. Sci. Eur. 2011, 23, 38–52. [Google Scholar] [CrossRef]
  19. Bliss, J. Removal of PFOA from Water Using UV Treatment, Chemical Oxidation and Adsorption by Activated Carbon and Zeolites; Major Qualify Project, Worcester Polytechnic Institute: Worceste, MA, USA, 2012. [Google Scholar]
  20. Renner, R. Growing concern over perfluorinated chemicals. Environ. Sci. Technol. 2001, 35, 154A–160A. [Google Scholar] [CrossRef] [PubMed]
  21. Prevedouros, K.; Cousins, I.T.; Buck, R.C.; Korzeniowski, S.H. Sources, fate and transport of perfluorocarboxylates. Environ. Sci. Technol. 2006, 40, 32–44. [Google Scholar] [CrossRef] [PubMed]
  22. Niu, J.; Li, Y.; Shang, E.; Xu, Z.; Liu, J. Electrochemical oxidation of perfluorinated compounds in water. Chemosphere 2016, 146, 526–538. [Google Scholar] [CrossRef] [PubMed]
  23. OECD. Results of Survey on Production and Use of PFOS, PFAS and PFOA, Related Substances and Products/Mixtures Containing These Substances; Health and Safety Publications Series on Risk Management No. 22; OECD Environment: Paris, France, 2006. [Google Scholar]
  24. US Environmental Protection Agency (US EPA): Basic Information about Per- and Polyfluoroalkyl Substances (PFASs). Available online: www.epa.gov (accessed on 1 April 2018).
  25. Steenland, K.; Fletcher, T.; Savitz, D.A. Epidemiologic evidence on the health effects of perfluorooctanoic acid (PFOA). Environ. Health Perspect. 2010, 118, 1100–1108. [Google Scholar] [CrossRef] [PubMed]
  26. US EPA, 2014: Emerging Contaminants—Perfluorooctane sulfonate (PFOS) and Perfluorooctanoic Acid (PFOA). Available online: https://nepis.epa.gov (accessed on 1 April 2018).
  27. Lu, Z.; Song, L.; Zhao, Z.; Ma, Y.; Wang, J.; Yang, H.; Ma, H.; Cai, M.; Codling, G.; Ebinghaus, R.; et al. Occurrence and trends in concentrations of perfluoroalkyl substances (PFASs) in surface waters of eastern China. Chemosphere 2015, 119, 820–827. [Google Scholar] [CrossRef] [PubMed]
  28. Lam, N.-H.; Cho, C.-R.; Lee, J.-S.; Soh, H.-Y.; Lee, B.-C.; Lee, J.-A.; Tatarozako, N.; Sasaki, K.; Saito, N.; Iwabuchi, K.; et al. Perfluorinated alkyl substances in water, sediment, plankton and fish from Korean rivers and lakes: A nationwide survey. Sci. Total Environ. 2014, 491, 154–162. [Google Scholar] [CrossRef] [PubMed]
  29. Konwick, B.J.; Tomy, G.T.; Ismail, N.; Peterson, J.T.; Fauver, R.J.; Higginbotham, D.; Fisk, A.T. Concentrations and patterns of perfluoroalkyl acids in Georgia, USA surface waters near and distant to a major use source. Environ. Toxicol. Chem. 2008, 27, 2011–2018. [Google Scholar] [CrossRef] [PubMed]
  30. Giesy, J.P.; Kannan, K. Global distribution of perfluorooctane sulfonate in wildlife. Environ. Sci. Technol. 2001, 35, 1339–1342. [Google Scholar] [CrossRef] [PubMed]
  31. Webster, G. Potential Human Health Effects of Perfluorinated Chemicals (PFCs). Available online: www.ncceh.ca/sites/default/files/Health_effects_PFCs_Oct_2010.pdf (accessed on 1 April 2018).
  32. Gorrochategui, E.; Perez-Albaladejo, E.; Casas, J.; Lacorte, S.; Porte, C. Perfluorinated chemicals: Differential toxicity, inhibition of aromatase activity and alteration of cellular lipids in human placental cells. Toxicol. Appl. Pharmacol. 2014, 277, 124–130. [Google Scholar] [CrossRef] [PubMed]
  33. Wang, T.; Wang, Y.; Liao, C.; Cai, Y.; Jiang, G. Perspectives on the inclusion of perfluorooctane sulfonate into the Stockholm convention on persistent organic pollutants. Environ. Sci. Technol. 2009, 43, 5171–5175. [Google Scholar] [CrossRef] [PubMed]
  34. COPs: Synergies among the Basel, Rotterdam and Stockholm Conventions. Available online: www.brsmeas.org (accessed on 1 April 2018).
  35. EPA Stewardship. Available online: www.epa.gov/assessing-and-managing-chemicals-under-tsca/fact-sheet-20102015-pfoa-stewardship-program (accessed on 1 April 2018).
  36. Commonwealth Environmental Management Guidance on Perfluorooctane Sulfonic Acid (PFOS) and Perfluorooctanoic Acid (PFOA). October 2016. Available online: www.environment.gov.au/system/files/pages/dfb876c5-581e-48b7-868c-242fe69dad68/files/draft-environmental-mgt-guidance-pfos-pfoa.pdf (accessed on 5 April 2018).
  37. EU Directive 2013/39/EU. The European Parliament and the Council of the European Union, 2013. Available online: http://eurlex.europa.eu/LexUriServ/LexUriServ.do?uri=OJ:L:2013:226:0001:0017:EN:PDF (accessed on 5 April 2018).
  38. Network for Industrially Co-Ordinated Sustainable Land Management in Europe (NICOLE). PFASs Summary. Emerging Contaminants Working Group. Available online: www.nicole.org/uploadedfiles/2017%20PFAS%20Summary,%20Report%20NICOLE%20Working%20Group%20PFAS.pdf (accessed on 5 April 2018).
  39. Moermond, C.T.A.; Verbruggen, E.M.J.; Smit, C.E. Environmental Risk Limits for PFOS: A Proposal for Water Quality Standards in Accordance with the Water Framework Directive. RIVM Report 601714013/2010. Available online: www.rivm.nl/bibliotheek/rapporten/601714013.pdf (accessed on 5 April 2018).
  40. Perfluorinated Compounds. Treatment and Removal. American Water Works Association (AWWA). Available online: www.awwa.org/Portals/0/files/resources/water%20knowledge/rc%20healtheffects/AWWAPFCFactSheetTreatmentandRemoval.pdf (accessed on 5 April 2018).
  41. Jiang, B.; Zheng, J.; Qiu, S.; Wu, M.; Zhang, Q.; Yan, Z.; Xue, Q. Review on electrical discharge plasma technology for wastewater remediation. Chem. Eng. J. 2014, 236, 348–368. [Google Scholar] [CrossRef]
  42. Arvaniti, O.S.; Symsaris, E.C.; Andersen, H.R.; Antoniou, M.G.; Nikolaos, T.S.; Athanasios, S.S. Removal of perfluorinated compounds from water with activated carbon and advanced oxidation processes (AOPs). In Micropol & Ecohazard, Proceedings of the 8th IWA Specialist Conference on Assessment and Control of Micropollutants/Hazardous Substances in Water, Zurich, Switzerland, 16–20 June 2013; IWA Publishing: London, UK, 2013. [Google Scholar]
  43. Lutze, H.; Panglisch, S.; Bergmann, A.; Schmidt, T. Treatment Options for the Removal and Degradation of Polyfluorinated Chemicals. In Polyfluorinated Chemicals and Transformation Products; Springer: Berlin/Heidelberg, Germany, 2011; Volume 17, pp. 103–125. [Google Scholar] [CrossRef]
  44. Yasuoka, K.; Sasaki, K.; Hayashi, R.; Kosugi, A.; Takeuchi, N. Degradation of Perfluoro Compounds and —Recovery in Water Using Discharge Plasmas Generated within Gas Bubbles. Int. J. Plasma Environ. Sci. Technol. 2010, 4, 113–117. [Google Scholar]
  45. Zhang, T.; Pan, G.; Zhou, Q. Temperature effect on photolysis decomposing of perfluorooctanoic acid. J. Environ. Sci. 2016, 42, 126–133. [Google Scholar] [CrossRef] [PubMed]
  46. Moriwaki, H.; Takagi, Y.; Tanaka, M.; Tsuruho, K.; Okitsu, K.; Maeda, Y. Sonochemical decomposition of perfluorooctane sulfonate and perfluorooctanoic acid. Environ. Sci. Technol. 2005, 39, 3388–3392. [Google Scholar] [CrossRef] [PubMed]
  47. Cheng, J.; Vecitis, C.D.; Park, H.; Mader, B.T.; Hoffmann, M.R. Sonochemical degradation of perfluorooctane sulfonate (PFOS) and perfluorooctanoate (PFOA) in landfill groundwater: Environmental matrix effects. Environ. Sci. Technol. 2008, 42, 8057–8063. [Google Scholar] [CrossRef] [PubMed]
  48. Campbell, T.; Hoffmann, M.R. Sonochemical degradation of perfluorinated surfactants: Power and multiple frequency effects. Sep. Purif. Technol. 2015, 156, 1019–1027. [Google Scholar] [CrossRef]
  49. Sekiguchi, K.; Kudo, T.; Sankoda, K. Combined sonochemical and short-wavelength UV degradation of hydrophobic perfluorinated compounds. Ultrason. Sonochem. 2017, 39, 87–92. [Google Scholar] [CrossRef] [PubMed]
  50. Cao, M.H.; Wang, B.B.; Yu, H.S.; Wang, L.L.; Yuan, S.H.; Chen, J. Photochemical decomposition of perfluorooctanoic acid in aqueous periodate with VUV and UV light irradiation. J. Hazard. Mater. 2010, 179, 1143–1146. [Google Scholar] [CrossRef] [PubMed]
  51. Tsang, W.; Burgess, D.R.; Babushok, V. On the incinerability of highly fluorinated organic compounds. Combust. Sci. Technol. 1998, 139, 385–402. [Google Scholar] [CrossRef]
  52. Vecitis, C.D.; Park, H.; Cheng, J.; Mader, B.T.; Hoffmann, M.R. Treatment technologies for aqueous perfluorooctanesulfonate (PFOS) and perfluorooctanoate (PFOA). Front. Environ. Sci. Eng. 2009, 3, 129–151. [Google Scholar] [CrossRef]
  53. Niu, J.; Lin, H.; Gong, C.; Sun, X. Theoretical and experimental insights into the electrochemical mineralization mechanism of perfluorooctanoic acid. Environ. Sci. Technol. 2013, 47, 14341–14349. [Google Scholar] [CrossRef] [PubMed]
  54. Chang, J. Thermal Plasma Solid Waste and Water Treatments: A Critical Review What Is Plasmas Solid Liquid Gas. Int. J. Plasma Environ. Sci. Technol. 2009, 3, 67–84. [Google Scholar]
  55. Cheng, H.; Chen, S. Non-thermal plasma technology for degradation of organic compounds in wastewater control: A critical review. J. Environ. 2007, 17, 427–433. [Google Scholar]
  56. Foster, J.; Sommers, B.S.; Gucker, S.N.; Blankson, I.M.; Adamovsky, G. Prespectives on the Interaction of Plasmas With Liquid Water for Water Purification. IEEE Trans. Plasma Sci. 2012, 40, 1311–1323. [Google Scholar] [CrossRef]
  57. Choi, S.; Hong, S.H.; Lee, H.S.; Watanabe, T. A comparative study of air and nitrogen thermal plasmas for PFCs decomposition. Chem. Eng. J. 2012, 185, 193–200. [Google Scholar] [CrossRef]
  58. Holzer, F.; Kopinke, F.D.; Roland, U. Influence of ferroelectric materials and catalysts on the performance of Non-Thermal Plasma (NTP) for the removal of air pollutants. Plasma Chem. Plasma Process. 2005, 25, 595–611. [Google Scholar] [CrossRef]
  59. Hao, H.L.; Zhang, X.W.; Lei, L.C. Degradation characteristics of toxic contaminant with modified activated carbons in aqueous pulsed discharge plasma process. Carbon 2009, 47, 153–161. [Google Scholar] [CrossRef]
  60. Hayashi, R.; Obo, H.; Takeuchi, N.; Yasuoka, K. Decomposition of Perfluorinated Compounds in Water by DC Plasma within Oxygen Bubbles. Electr. Eng. Jpn. 2015, 190, 767–772. [Google Scholar] [CrossRef]
  61. Martinsen, K. Polyfluorinated compounds at fire training facilities. In Proceedings of the Section for Waste Treatment and Contaminated Ground Common Forum Meeting, Bilbao, Spain, 23–24 October 2012. [Google Scholar]
  62. Seow, J. Firefighting Foams with Perfluororchemicals—Environmental Review; Department of Environment and Conservation Western Australia, Hemming Information Services: Sandgate, Australia, 2013. [Google Scholar]
  63. Frank-Kamenezki, D.A. Plasma—Der Vierte Aggregatzustand; Progress Verlag: Moskow, Russia, 1963. [Google Scholar]
  64. Piel, A. Plasma Physics; Springer: Berlin/Heidelberg, Germany, 2010. [Google Scholar]
  65. Bogaerts, A.; Neyts, E.; Gijbels, R.; van der Mullen, J. Gas discharge plasmas and their applications. Spectrochim. Acta B 2002, 57, 609–658. [Google Scholar] [CrossRef]
  66. Kempe, V.; Jovicic, V.; Almeida Ribeiro, M.; Delgado, A. Untersuchungen zur Vergasung von Biomasse mit nicht-thermischem Stickstoff Plasma. In Proceedings of the Deutscher Flammentag Vrebrennung und Feuerung, Duisburg, Germany, 3–5 September 2013; Volume 2161, pp. 353–363. [Google Scholar]
  67. Al-Amayreh, M.; Al-Salaymeh, A.; Kovicic, V.; Delgado, A. Gasification of Jordanian oil shale using a nitrogen non-thermal plasma. In Proceedings of the 31st Oil shale symposium, Colorado School of Mines, Golden, CO, USA, 17–19 October 2011. [Google Scholar]
  68. Jovicic, V.; Jung, I.; Zbogar-Rasic, A.; Khan, M.J.; Delgado, A. Cleaning of the surfaces in the food industry using cold plasma. In Experimentelle Strömungsmesstechnik, Proceedings of the GALA Conference, Karlsruhe, Germany, 5–7 September 2017; German Association for Laser Anemometry: Karlsruhe, Germany, 2017. [Google Scholar]
  69. Jovicic, V.; Zbogar-Rasic, A.; Groß, F.; Jung, I.; Seok, J.; Kim, Y.; Delgado, A. Overview of experimental evaluation of innovative non-thermal plasma treatment of biotic and abiotic matter. In Proceedings of the International Nonthermal Processing Workshop, Athens, Greece, 12–13 November 2015. [Google Scholar]
  70. Company Diener Electronic GmbH und Co.KG (Ebhausen, Germany). Available online: www.plasma.com/plasmatechnik/ (accessed on 1 April 2018).
  71. Company Bronkhorst High-Tech, B.V. (AK Ruurlo, The Netherlands). Available online: www.bronkhorst.com/ (accessed on 1 April 2018).
  72. Thomas, M.; Mittal, K.L. (Eds.) Atmospheric Pressure Plasma Treatment of Polymers: Relevance to Adhesion; Scrivener Publishing LLC: Beverly, MA, USA, 2013. [Google Scholar]
  73. Company R&H Umwelt (Nuremberg, Germany). Available online: www.rh-umwelt.de/de/ (accessed on 1 April 2018).
  74. Uhm, H.S. Generation of various radicals in nitrogen plasma and their behavior in media. Phys. Plasmas 2015, 22, 123506. [Google Scholar] [CrossRef]
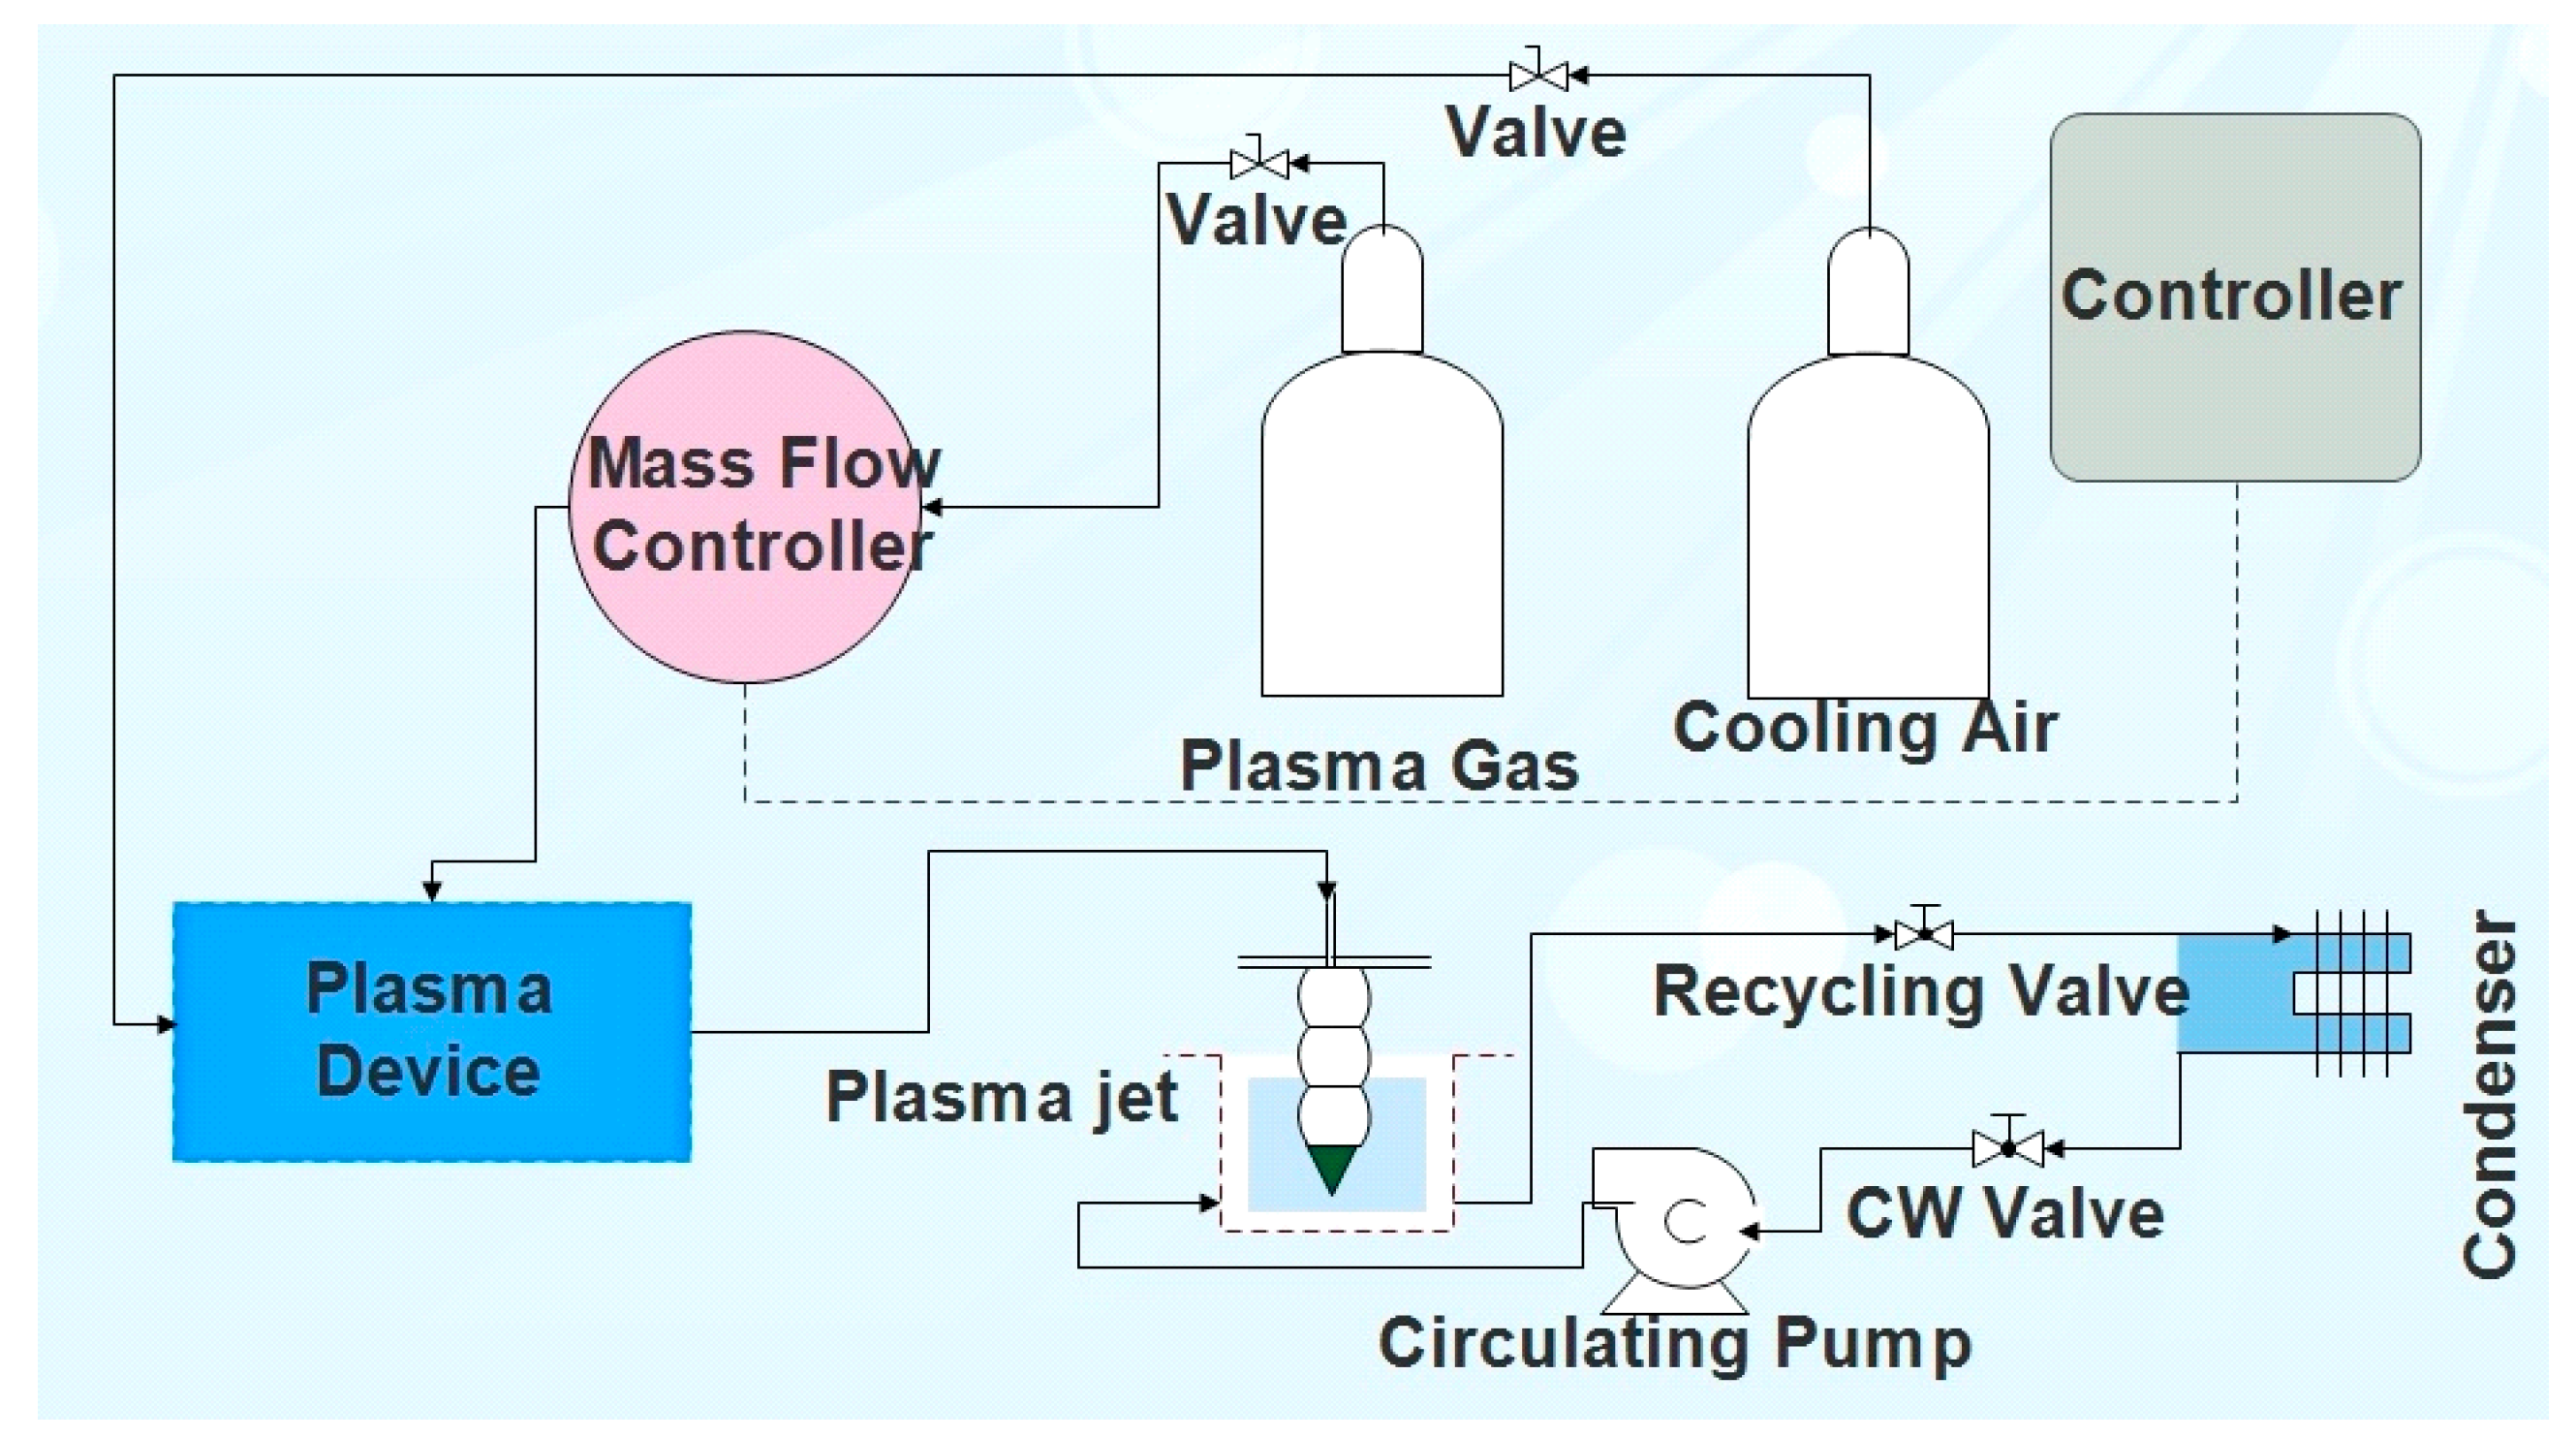
Figure 1. Process flow diagram for non-thermal atmospheric plasma (NTAP)-treatment (Legend: CW—cooling water).
Energies 11 01290 g001
Figure 2. Test reactors R1 and R2 (a), and nozzles N1 and N2 (b).
Energies 11 01290 g002
Figure 3. Results of the two sets of experiments (R1-N1, R2-N2), indicating the repeatability of experiments.
Energies 11 01290 g003
Figure 4. The effect of the reactor size and the treatment time on the perfluorinated compounds (PFC) and perfluorooctanoic acid (PFOA)-and-perfluorooctanesulfonate (PFOS) concentrations for: (a) longer nozzle N1 and (b) shorter nozzle N2 (correlation lines obtained by Laplace fit).
Energies 11 01290 g004
Figure 5. Results of the NTAP wastewater treatment using oxygen as plasma gas. (a) Results of experiments with shorter nozzle N2 and (b) longer nozzle N1 (correlation lines obtained by Laplace fit).
Energies 11 01290 g005
Table 1. Comparison of the Perfluorinated compound (PFC) concentration reduction for different reactor-nozzle configurations.
ReactorNozzleInitial PFC ConcentrationFinal PFC ConcentrationTest TimePFC Conc. Reduction
R1N10.932 μg/L0.391 μg/L3 min.58.0%
N20.669 μg/L5 min.28.2%
R2N10.336 μg/L3 min.63.9%
N20.346 μg/L5 min.63.0%
Table 2. Reduction of the PFC concentration due to non-thermal atmospheric plasma (NTAP)-treatment after the sample dilution.
R1-N1R2-N1R1-N2R2-N2
Initial concentration of PFC (μg/L)0.4430.3030.5130.277
End concentration of PFC (μg/L)0.3800.1730.4180.265
PFC conc. reduction rate (%)1443194