Article

Gasification of Agroresidues for Syngas Production

ENEA, Energy Technologies Department, ss Jonica 106, 75026 Rotondella, Italy
*
Author to whom correspondence should be addressed.
Energies 2018, 11(5), 1280; https://doi.org/10.3390/en11051280
Submission received: 13 April 2018 / Revised: 14 May 2018 / Accepted: 14 May 2018 / Published: 17 May 2018

Abstract

:
Biomass residues from agriculture and agroindustry are suitable sources for the production of energy because they don’t compete with the food chain and they are produced cheaply. Their transformation into heat and power or energy vectors depends on morphology and composition. Shells of almonds and hazelnuts can be easily gasified in fixed beds because of their low fines content and high gas permeation. In this work we investigated the overall process performances and syngas composition, especially the H2/CO ratio, by changing the air and steam supply. The tests were carried out in a pilot updraft gasifier having a capacity of treating up to 20–30 kg/h of biomass. Experimental data were worked out by surface response analysis as function of the equivalence ratios (ER) in relation to the complete combustion and water reaction. By using only air at ER(O2) 0.24 the ratio H2/CO in the syngas was 0.33 while adding steam at ER(H2O) 0.28 the ratio reached a value of 1.0. The energy conversion efficiency from solid to gas and oils reached maximum values of 76% and 28%, respectively. As anticipated by TGA, hazelnut shells produced less organic volatiles and gas efficiency was generally higher than for almond shells.

1. Introduction

Syngas, or synthetic gas, is a flexible feedstock for the chemical and energy industry. Syngas is a mixture of carbon monoxide, hydrogen, carbon dioxide and lower percentages of incondensable hydrocarbons, like methane. Liquid fuels can be produced from syngas trough the Fischer–Tropsch synthesis (FT) a catalytic reaction discovered over ninety years ago but still very relevant because of the demand for clean fuels and the emerging affordability of converting on-site natural gas [1]. The high content of hydrogen and carbon monoxide makes syngas suitable for feeding fuel cells and Integrated Gasification Combined Cycles (IGCCs) that efficiently generate power [2]. Not only is syngas a flexible energetic and chemical vector, but also the process that generates it, called gasification, is flexible regarding the type of feedstock. Virtually any kind of material containing carbon can be gasified: coal, biomass, urban wastes. The search for renewable and sustainable sources has made lignocellulosics from forestry, agriculture and waste, an interesting source of bioenergy. According to the International Energy Association (IEA) in 2015 bioenergy accounted for 11.2% of the world’s total fuel consumption, i.e., 1051 Mtoe, which corresponds to an absolute increase of 72% compared to the 1975 data [3]. Several processes for thermal conversion of biomass, which provide directly heat, power or even energy vectors, like pyrolytic oil, torrefied biomass, and syngas, are available. Also, in the process of biorefining to produce liquid fuels or other chemicals with the fermentation route, the residual stream of lignin and other unconverted fibers is thermally converted [4,5]. Coal gasification technologies cannot be simply adapted to biomass gasification because of the different characteristic of the feedstocks, such as particle density and pyrolysis behavior [6,7]. Moreover, the business model is quite different because biomass resources are territorially diffused, seasonal, and available from fragmented ownership [8,9]. Fixed bed gasification is one of the most suitable process to exploit lignocellulosics because it can be carried out at small scale (<1 MWth) with a relatively simple and robust technology; for this reason plants based on this technology can either be included in smart energy networks or be utilized by isolated small communities [10]. In fixed bed gasifiers, the syngas can be draft from the bottom (downdraft type) or from the top (updraft type). The latter process is characterized by higher energy efficiency conversion and enhanced flexibility of feedstock, in terms of moisture content, size, composition [11,12]. Recent advancements in feeding low bulk density biomass, tar reduction and tar reforming, provide even more chances for updraft gasifiers to be used with larger pool of residual feedstock and to achieve higher conversion in syngas [13,14,15,16]. One of the most important characteristics that defines the quality of the syngas is the ratio H2/CO, which largely affects its further use in FT processes. Moreover, in the early 90s it was discovered that syngas could be used to obtain ethanol by fermentation. Recently, this combined thermochemical-biochemical route gained new interest because of innovative processes developed to obtain biofuels such as ethanol or butanol at a commercial scale [17]. The mechanisms of such bioreactions are still under investigation; however, initial observations suggest that the use of microorganisms allow some flexibility of gas composition without influencing the final product [18]. Nevertheless, the optimal syngas composition is not clear as the process requires transfer of soluble gas into the liquid phase. Tuning syngas composition is a desirable feature of biomass gasification; it can be achieved in several ways, including by introducing steam in the system, by using oxygen or enriched air, by a special reactor design (indirect gasification), by adding a catalytic step of Water Gas Shift (WGS) or a CO2 adsorption step. The introduction of steam is the simplest way of tuning syngas composition, in particular the H2/CO ratio. Moreover, the use of steam improves the thermal stability of the fixed bed and contributes to avoiding ash melting [4,19]. The effect of steam addition in the fixed bed gasifier has not been systematically investigated. Generally, in reporting steam gasification experiments the ratio steam/biomass is provided; this method does not take into account the difference in chemical composition of different feedstocks that require specific amount of water for a stoichiometric conversion. Indeed, while the effect of oxygen is generally discussed in terms of Equivalence Ratio, ER(O2) i.e., the ratio of used oxygen in relation to the stoichiometric for full combustion of the biomass, the analogous parameter ER(H2O) (i.e., the ratio of used water in relation to the stoichiometric value for full conversion of biomass into H2 and CO2) has only recently been introduced [19]. Nut shells are a residue of particular economic interest for small scale gasification because it they are produced at agro industries in high amounts; for example, the average shell:kernel weight yield is 1:2 for almond shells and 1:0.8 for hazelnut shells (referred to in this paper as M and N, respectively) [20,21]. Though with low bulk density, these shells are stiff and when broken to extract the kernels the resulting pieces still have the size and shape to allow good gas permeation through the fixed bed. For this reason, M and N are suitable for testing and modeling fixed bed and fluidized bed gasifiers. Gasification of N with air was successfully carried out in downdraft mode, without sign of bridging or ash fusion in the bed; moreover, the quality of syngas was good in terms of calorific value [22]. Fluidized bed reactors were used to gasify crumbled M; these experiments highlighted the importance of particle size in this kind of gasifier because of thermal resistance [23] and showed that with the same substrate naturally occurred catalytic substances enhanced the yield of syngas and reduced its tar content by reforming and cracking reactions [24].The aim of this paper is to investigate the gasification of M and N, which have optimal gas permeation but different chemical compositions, in order to highlight the effects of both the ERs on process yields, energy efficiency and syngas quality. In particular, from a literature survey, the updraft gasification of these residues has not been previously reported in detail and at pilot scale.

2. Materials and Methods

2.1. Feedstock

The feedstock M and N were purchased by local agroindustry. The average size of the M was 2.5–3.0 cm in length, 2 cm in width and 2–3 mm in thickness. The N shells showed a more homogeneous size than the almond shells and retained the initial shape after the particle size reduction process. The average dimensions were 1.5 cm in length, 1.5 cm in width with a thickness of 1 mm. The chemical and physical characterization is reported in Table 1, along with the methods used.

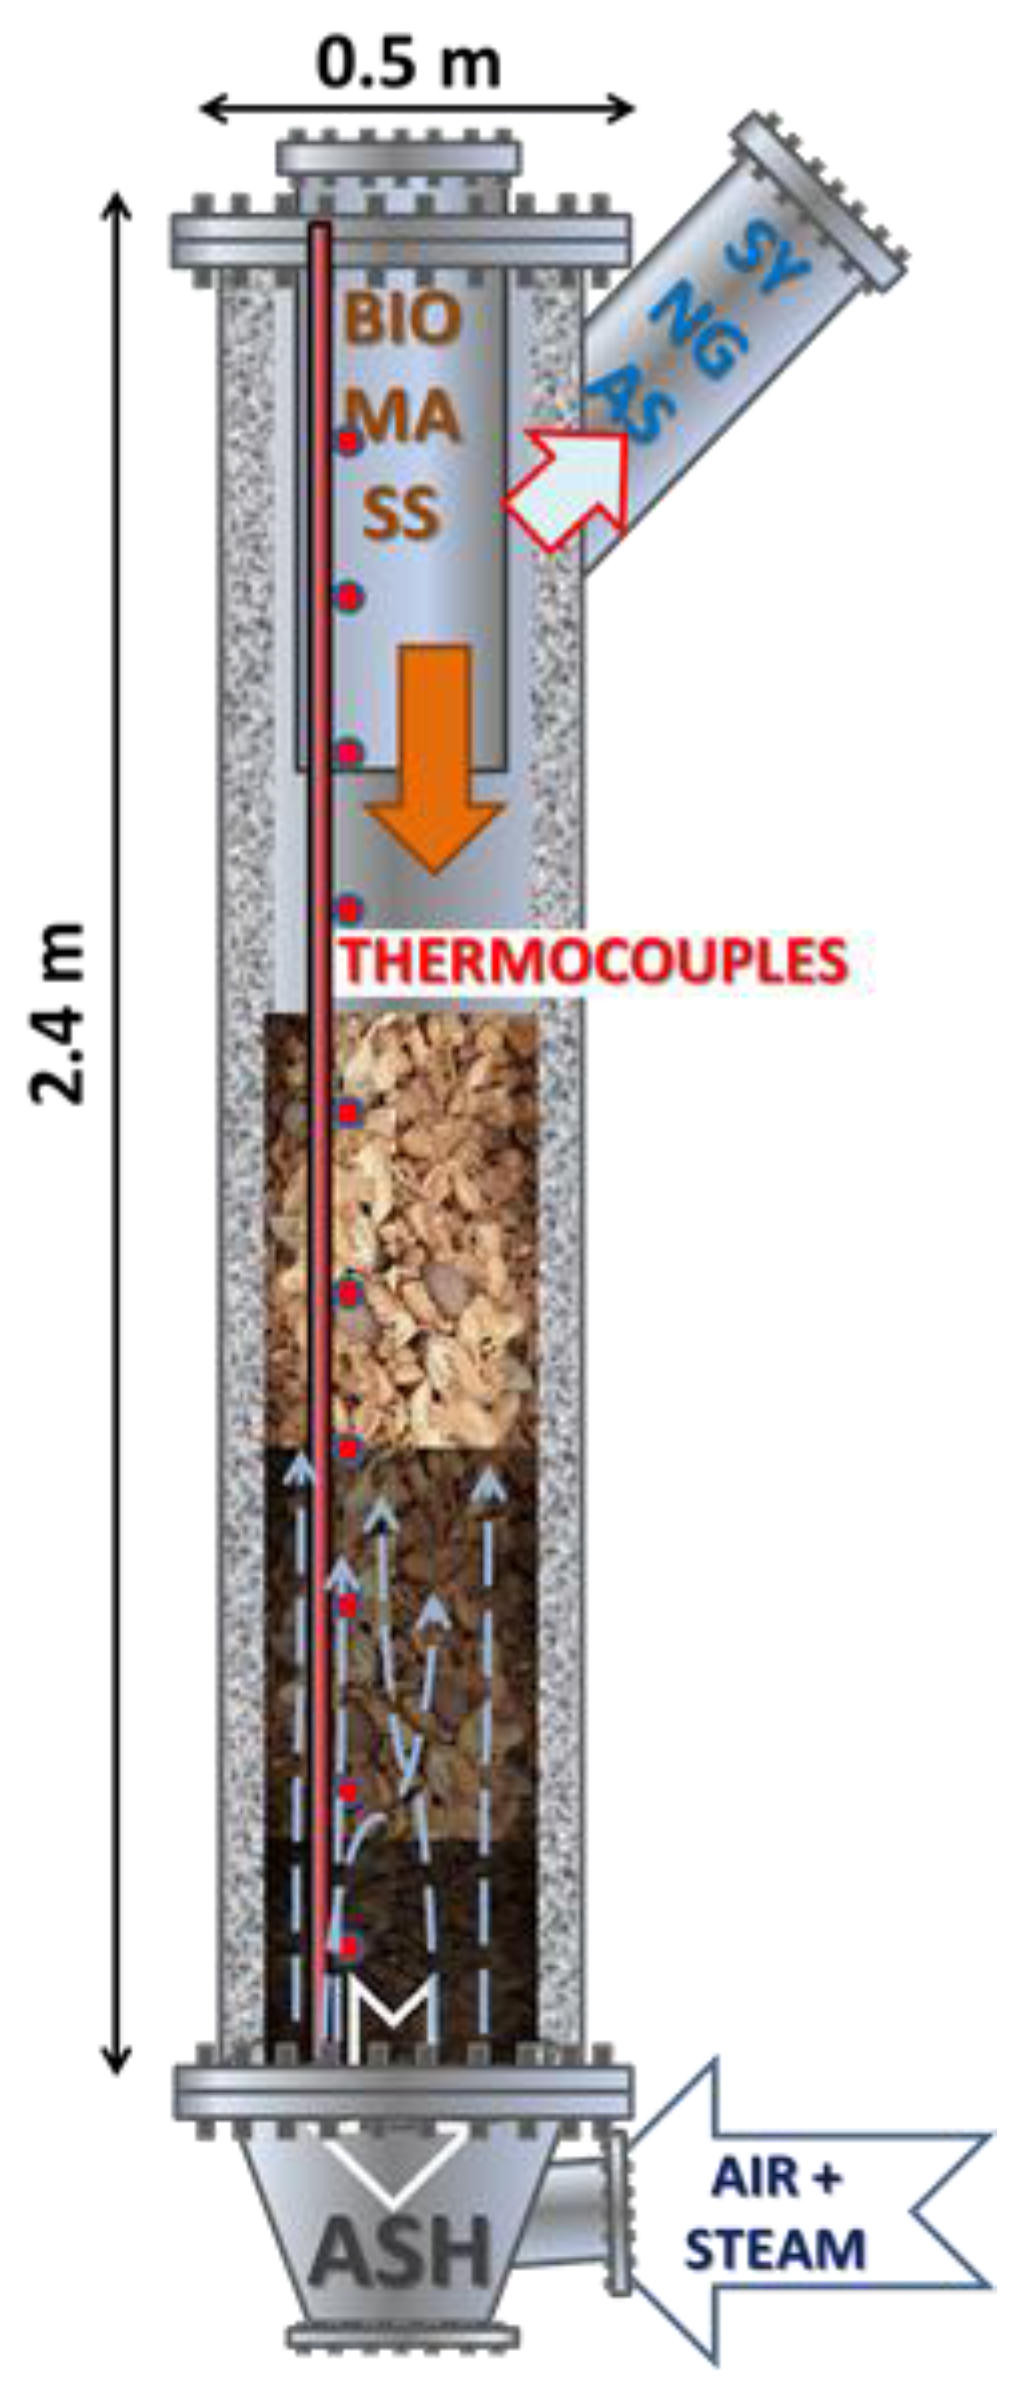
2.2. The Updraf Gasifier

Gasification tests were carried out in a pilot plant called PRAGA (for uP dRAft GAsification) designed and built at the ENEA Research Center of Trisaia (Rotondella, MT, Italy). The heart of the plant is the autothermic reactor operating slightly above atmospheric pressure (Figure 1). The typical gasification capacity is 20–30 kg/h of lignocellulosic biomass.
The gasifier is made of a 2.4 m cylindrical steel tube having external diameter of 0.5 m. The inner wall of the reactor is coated with a layer of insulating material of 0.1 m, the internal diameter of the reactor is 0.3 m. The lower part is shaped like a cone to collect and discharge the ash through a steel grid fixed at 0.70 m from the bottom.
Air, oxygen or mixtures of these with steam are introduced from the lower part of the reactor, under the steel grid that supports the biomass bed. Three infrared lamps right above the grid are used to ignite the biomass during the start up of the process. The steam is supplied by an external boiler that produces superheated steam at 160 °C and 1.2 bar.
The temperature profile along the reactor axis is measured by 11 thermocouples positioned in a steel probe at 147 and 303, 459, 615, 771, 979, 1187, 1395, 1603, 1759 and 1815 mm from the grid. Average temperature in the bed and freeboard were calculated from the corresponding values given by the first seven and last four thermocouples respectively.
Through an active/passive control and supervision system (DCS) it is possible to remotely monitor the entire process by continuously recording the instrumental output (temperatures, pressures, mass flows) that can then be analyzed offline.
The gas leaves the reactor at the top and is conveyed to a cleaning and cooling section consisting of a scrubber containing biodiesel and two coalescing filters which remove the drops of liquid. The plant is equipped with sampling lines to convey a small flow of gaseous streams to the chromatograph (GC) for on-line analysis of non-condensable gases.
In addition to the gasification section and the purification section, the plant includes the upgrading section and the hydrogen separation section [4].

2.3. TGA of Feedstock and Data Processing

The thermal analysis of the M and N was carried out using an apparatus for the TGA micro (model TGA7, Perkin Elmer, Waltham, MA, USA) loading in each test 2–5 mg of ground sample. As a standard procedure, the heating rate was 10 °C/min from 60 °C to 900 °C, in 20 mL/min of gas flow. The temperature calibration of the device is based on the Curie temperature of nickel (354 °C) and iron (970 °C) and was repeated when the ferromagnetic transition of the nickel was detected in a temperature range that deviated more than 1 °C from the expected (theoretical) value. Under valid test conditions, weight loss in two tests performed with the same temperature profile, gas flow and initial weight, was reproduced with an average displacement of 0.5% by weight. The data were worked out with calculation sheets [25]. The 3D plots were obtained with the free program Essential Regression and Experimental Design for Chemists and Engineers, which works as a macro in the Excel ver. 2010 (Microsoft Redmond, WA, USA. The reported surfaces were the quadratic curves interpolating experimental data.

2.4. Gasification Test Procedure

Prior to the execution of the gasification tests, the feeding system was calibrated to determine the feed ratio, kg/h of dry substance, at a fixed engine speed for each type of biomass tested. The start of each test took place with the biomass gasifier filled up to an internal height of 1.3 m from the grate. The biomass was ignited by infrared lamps. After about an hour and a half, the air flow is reduced to the desired value and the process reaches a steady state at the conditions set for the test.
During the experiments, the fuel is supplied to the gasifier by means of the augers in semi-continuous filling the intermediate stub pipe at regular intervals and completed in a few seconds (typically 4.2–4.5 kg/h are loaded every 12 min), in a nitrogen atmosphere to avoid gas leaks produced in the fuel system. This process caused a variation of 5% of the height of the biomass bed. About 24 h after the end of the test, the gasifier was discharged from the bottom, ash and char were collected, weighed, and analyzed separately. More details on the procedures are reported elsewhere [4,19,25].

2.5. Sampling and Chemical Analyses

During the gasificaton tests, the composition of the conditioned syngas was measured by sampling the gaseous stream at the scrubber outlet and analyzed onsite with GC apparatus; the standard deviation for the incondensable gas analyzed by GC on three measurements was 2%. The condensable volatile organic products and water, sampled at the outlet of the gasifier and scrubber, were absorbed in a series of bottles containing isopropanol at room temperature and at −20 °C, according to the method CEN/TS15439). The tar and the water were determined in a solution filtered with the gravimetric method and Karl Fisher titration, respectively; the standard deviation of these determinations was 5%.
The reported gas volume refers to the standard temperature and pressure conditions (STP, 273.15 K and 105 Pa). The flows of air, steam, oxygen and synthesis gas were measured with calibrated instruments accredited for a maximum error of 1% on the measured mass. More details about sampling and chemical analyses are reported elsewhere [4,19]

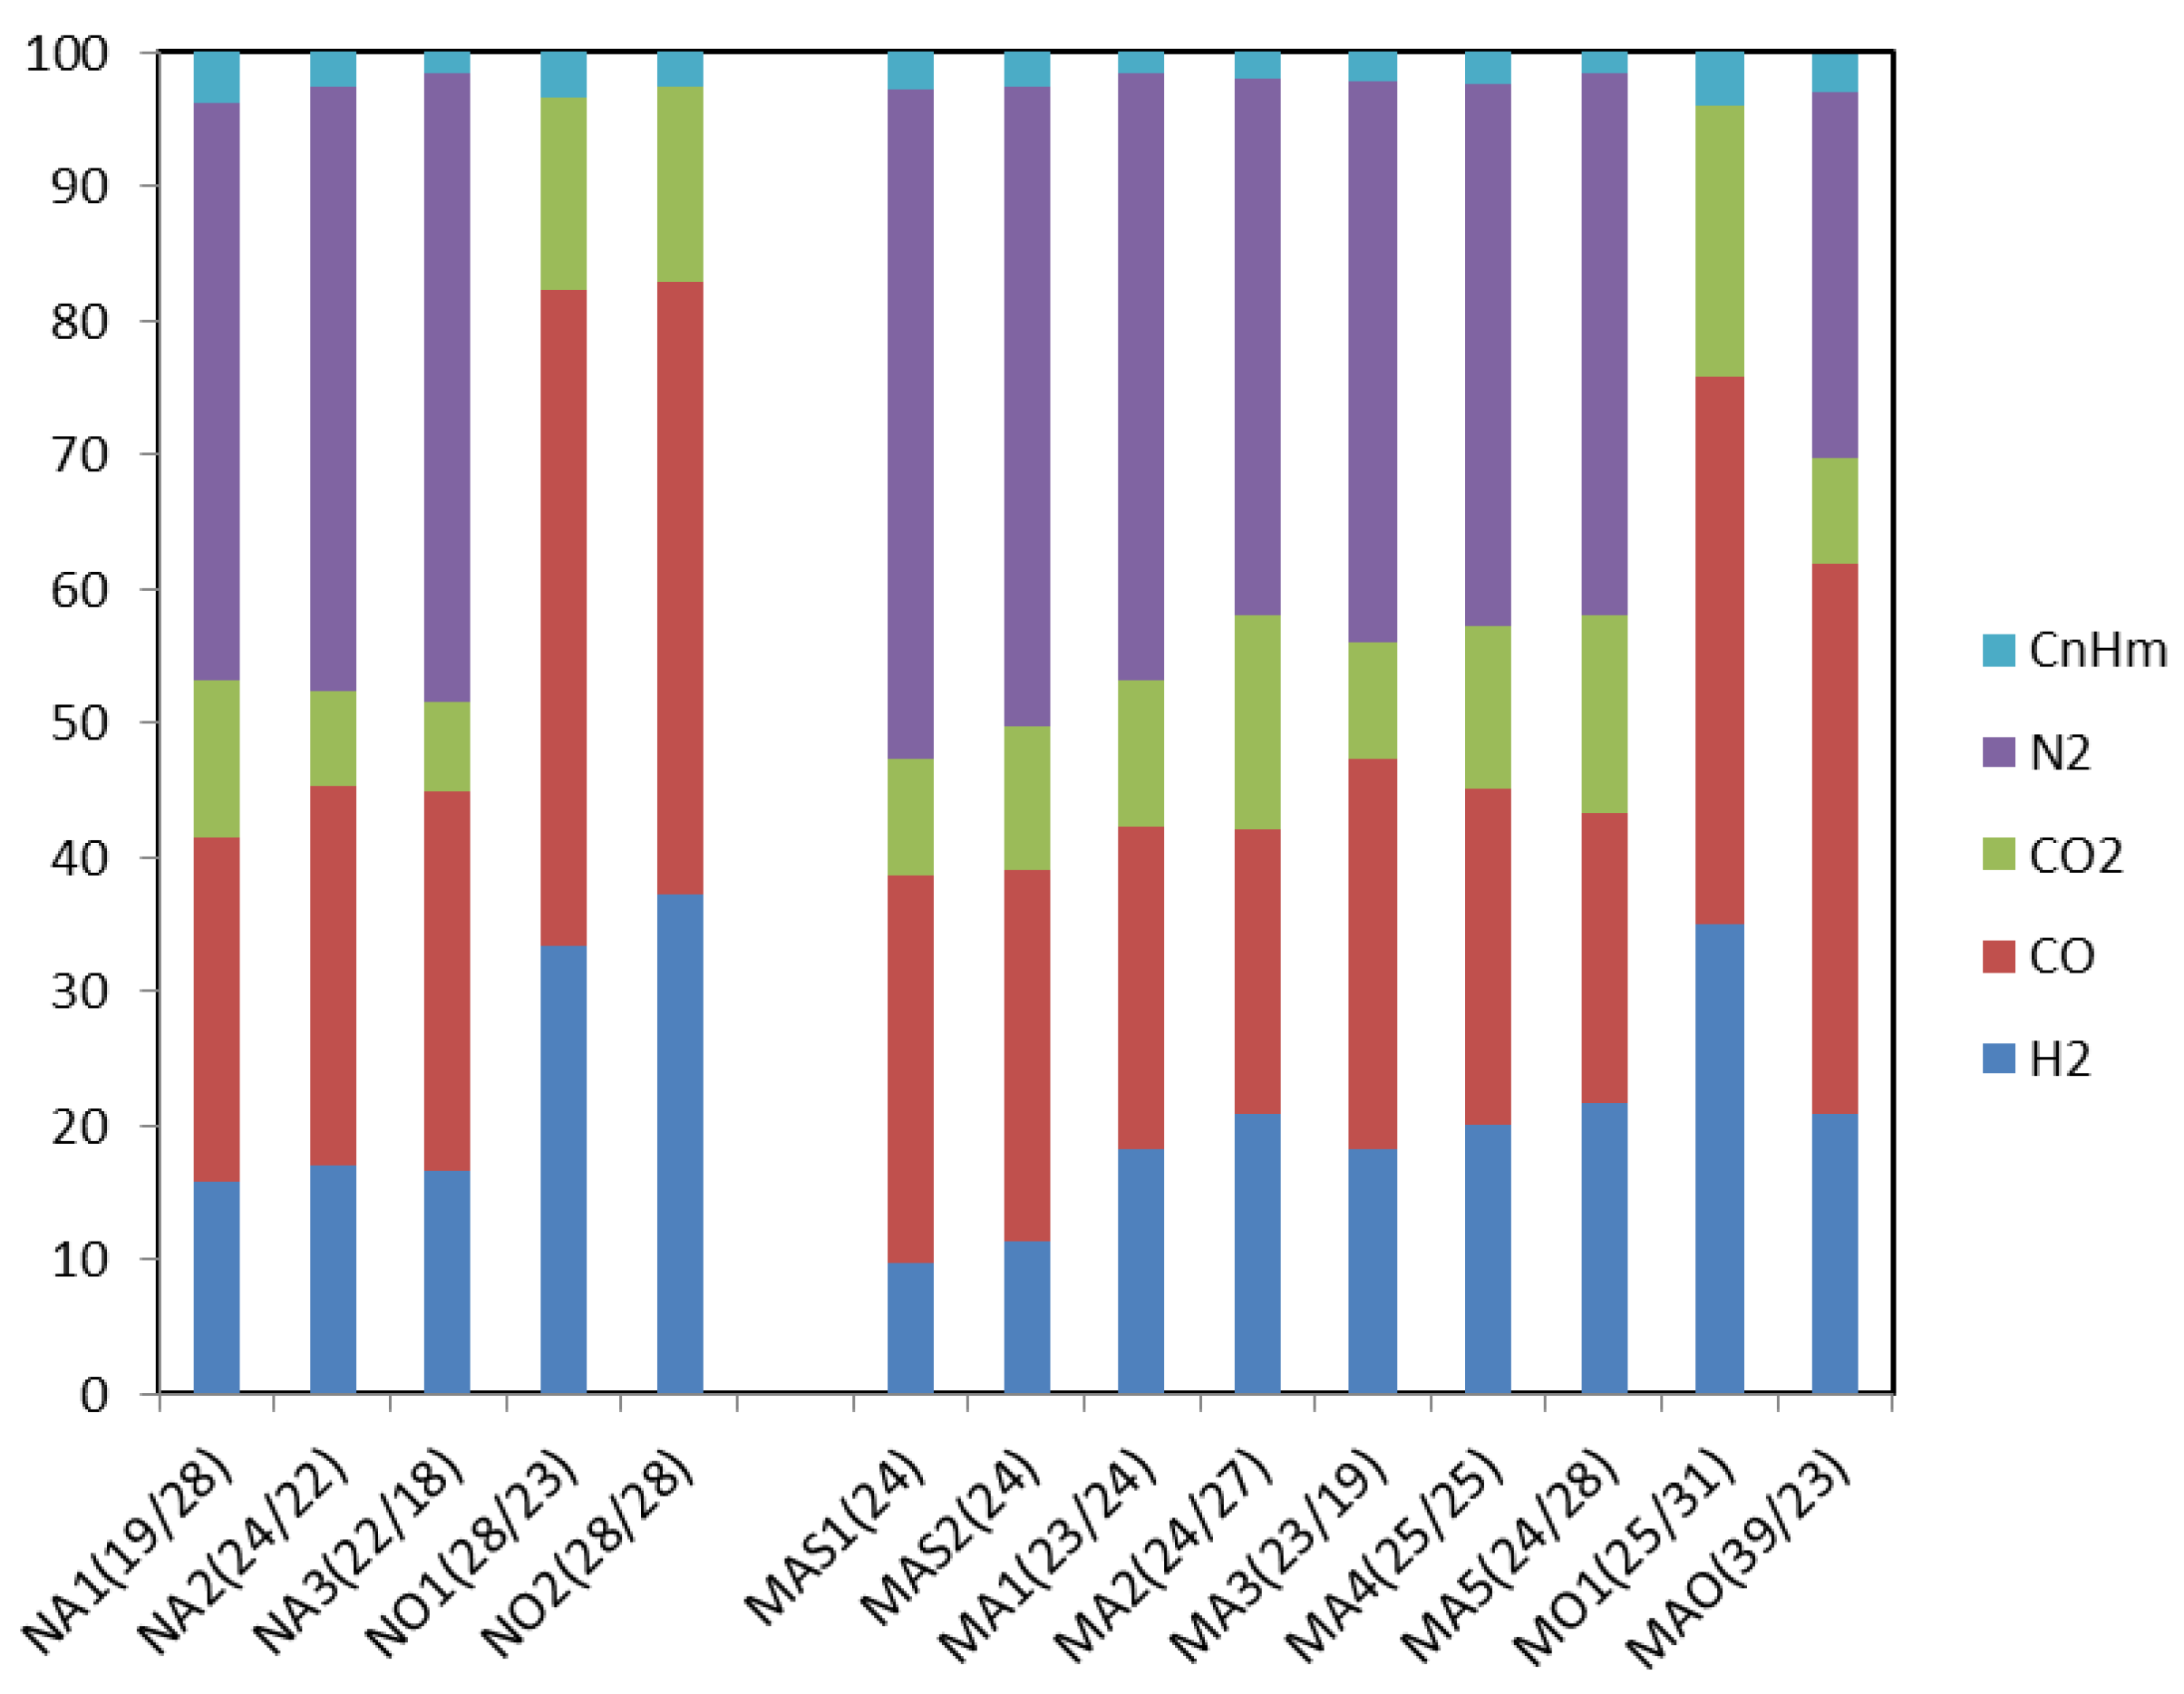
3. Results and Discussion

3.1. Thermogravimetric Analysis

Gasification is the result of several chemical reactions, some taking place in the solid phase, others in the gas and others at the interface. The reference reactions that are currently used to describe the process are shown in Table 2.
The list is based mostly on the carbon chemistry and does not include the fate of heteroatoms and minerals contained in the feedstock which can largely affect conversion rates and gas quality [26,27]. At the typical process conditions, i.e., without catalyst and with a gas residence time of few seconds, the system does not reach the thermodynamic equilibrium. Definitively, the yield of syngas compared to byproducts (pyrolytic oil and char) and its composition depends on the kinetics. Thermogravimetric analysis (TGA) is one of the most used techniques to characterize the reactivity of the biomass as function of the temperature in a given atmosphere. The sensitivity of modern instruments and their coupling with computers provide large data sets that can be used to obtain empirical relationships or to speculate on the molecular mechanisms. Weight loss as a function of T and oxidant (or inert) gas encompasses a number of factors, such as topology, chemical composition, heat and mass diffusion [28,29]. The TGA was used in this work to compare thermal behavior of milled M and N linking it to their composition and to the results obtained at macroscale level.
TGA tests were carried out in air, pure oxygen (99%) and pure nitrogen (99.999%) with a heating rate of 10 °C/min from 60 °C to 900 °C. The atmospheres reproduced the pyrolysis and oxidation steps. The heating rate was set to simulate the average thermal profile inside the gasifier through which biomass particles passed to achieve full conversion after a typical residence time of 1.5 h.
The data were used to obtain the shell degree of conversion, defined as:
X ,   % = W ash W 0 ash · 100
where W0 e W are the actual and starting weight and the specific conversion rate is given by:
r = dX X · dt   [ min 1 ]
From 60 °C to 150 °C, the mass loss was not significant and reached the maximum value of 2% in the case of N (Figure 2). This mass loss was due not only to the removal of moisture from the samples, but also to biomass decomposition processes. In fact, TGA-GCMS studies at low temperatures showed that starting from 60 °C various organic compounds can be released from lignocellulosic materials, including extractives and sugars degradation products. The bound water, on the other hand, cannot be completely removed even after 3 h at 120 °C. Thus, using TGA alone it is impossible to distinguish between the two contributions in this temperature range [30].
Between 150 °C and 210 °C there was practically no loss of mass; however, from this temperature onwards the loss became noticeable due to the decomposition of hemicellulose and cellulose. From 210 °C the differences between M and N became evident. Indeed, M are made up of 28% of hemicellulose and 30% of cellulose and therefore, between 210 °C and 350 °C lose more volatile substances than N, which contain 12% of hemicellulose and 22% of cellulose. Another observation was that up to about 350 °C, pyrolysis dominated on combustion. Indeed, in pure nitrogen at 300 °C N reached a conversion of 25%; in air and at the same temperature, the conversion was 30% and in pure oxygen it was 39% (Figure 2a,b).
The combined effect of pyrolysis and combustion caused the shift of the conversion rate to peak at lower temperature when the oxygen concentration was higher (Figure 2c). For the pyrolysis rate (in N2) a greater intensity and a shift at lower temperatures was observed for M compared to N (335 °C and 0.0546 min−1 versus 342 °C and 0.0508 min−1, Figure 2d). These findings could be explained by the higher content of carbohydrates and ash in M. A higher yield of char obtained from N compared to M at high temperatures, was likely due to the higher content of lignin [31] that in our cases was 42% versus 32%. In fact, lignin, in addition to being more resistant to thermal degradation, is transformed into char preserving part of the three-dimensional aromatic structure.

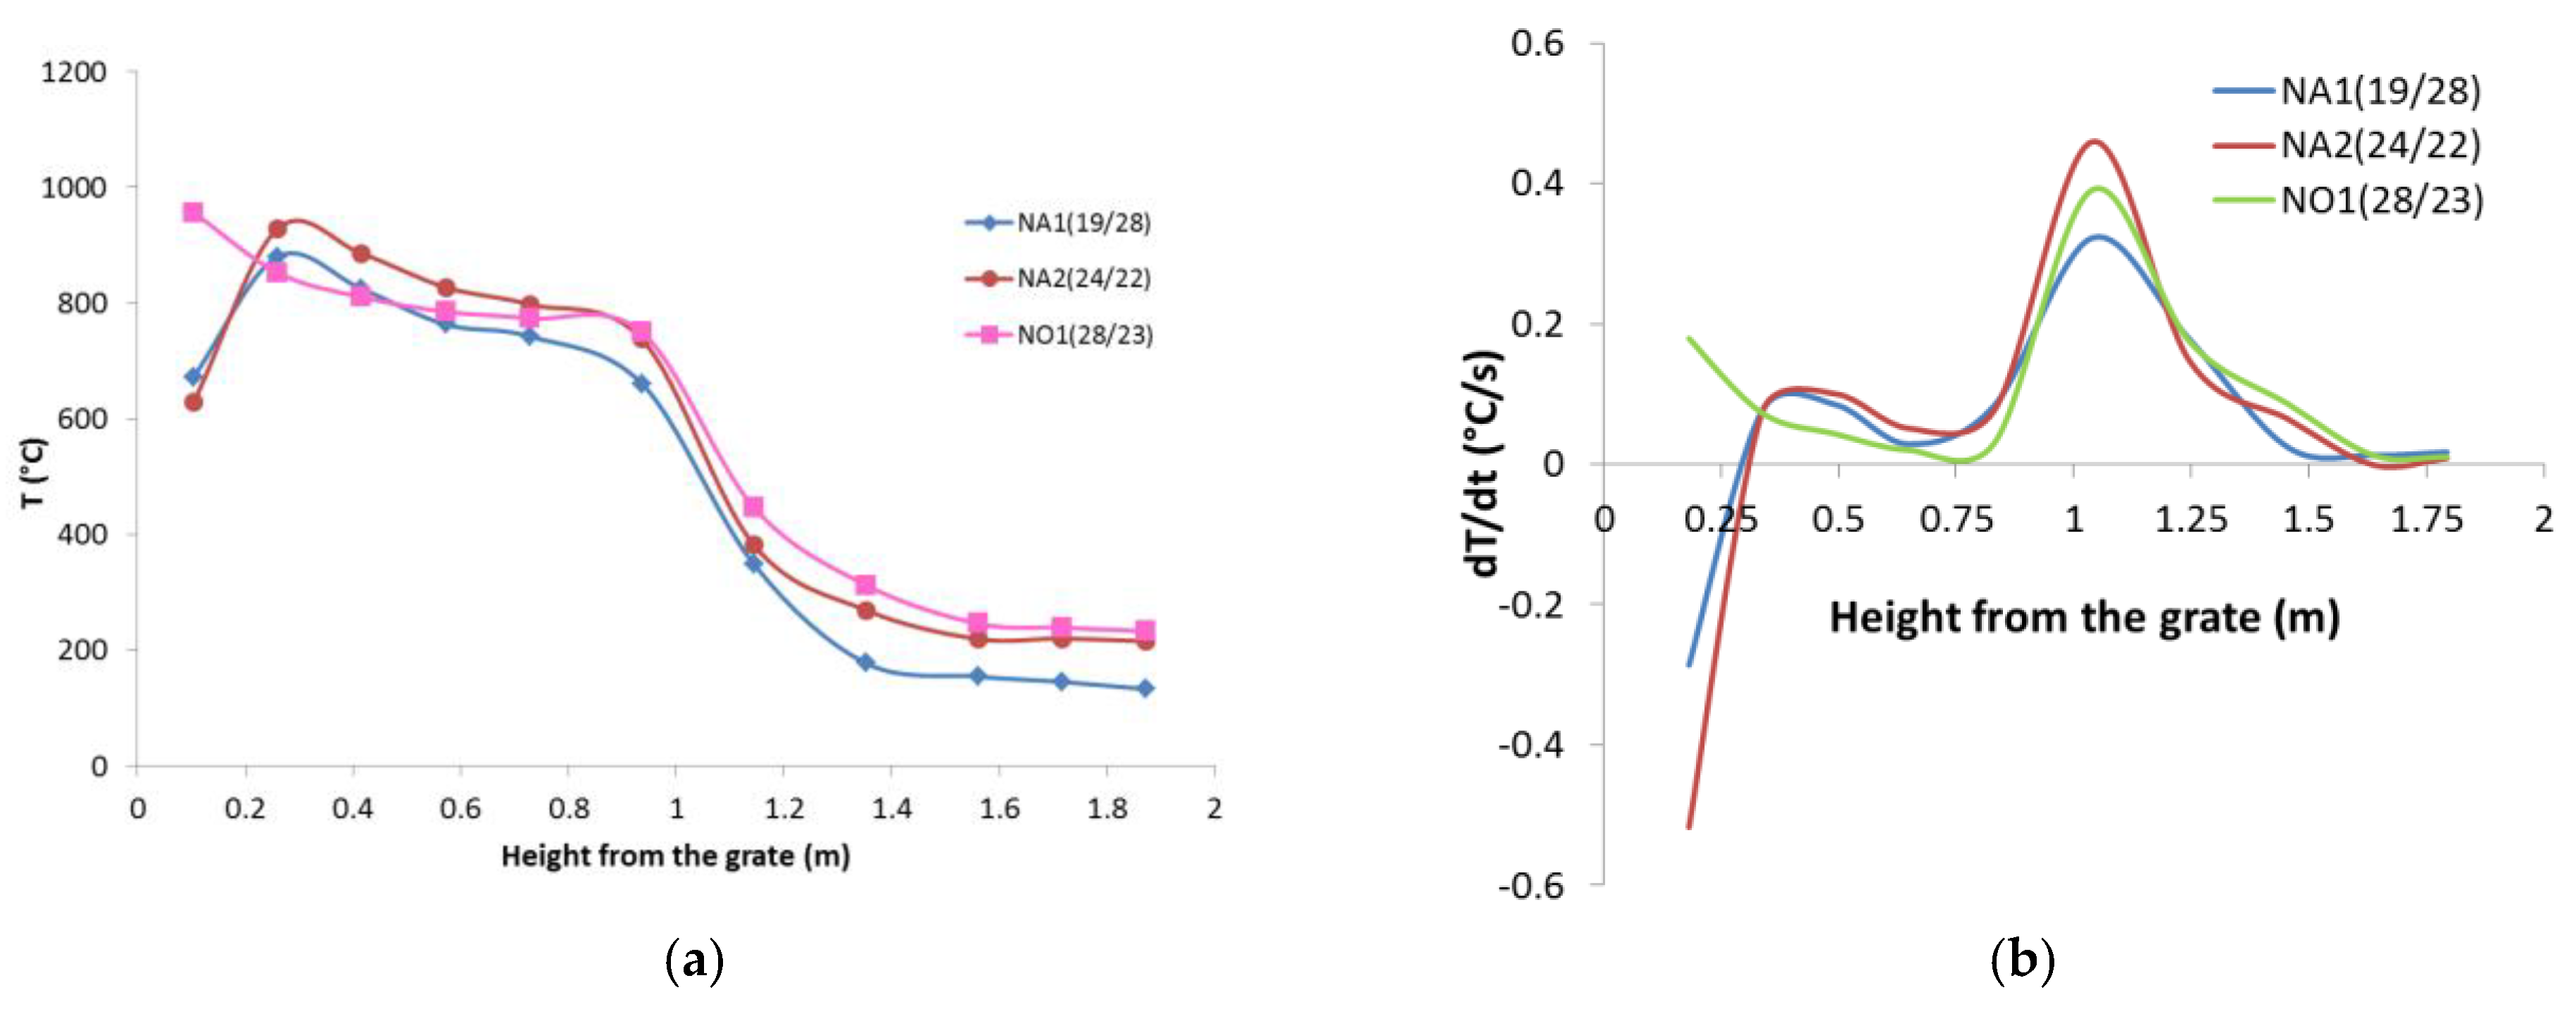
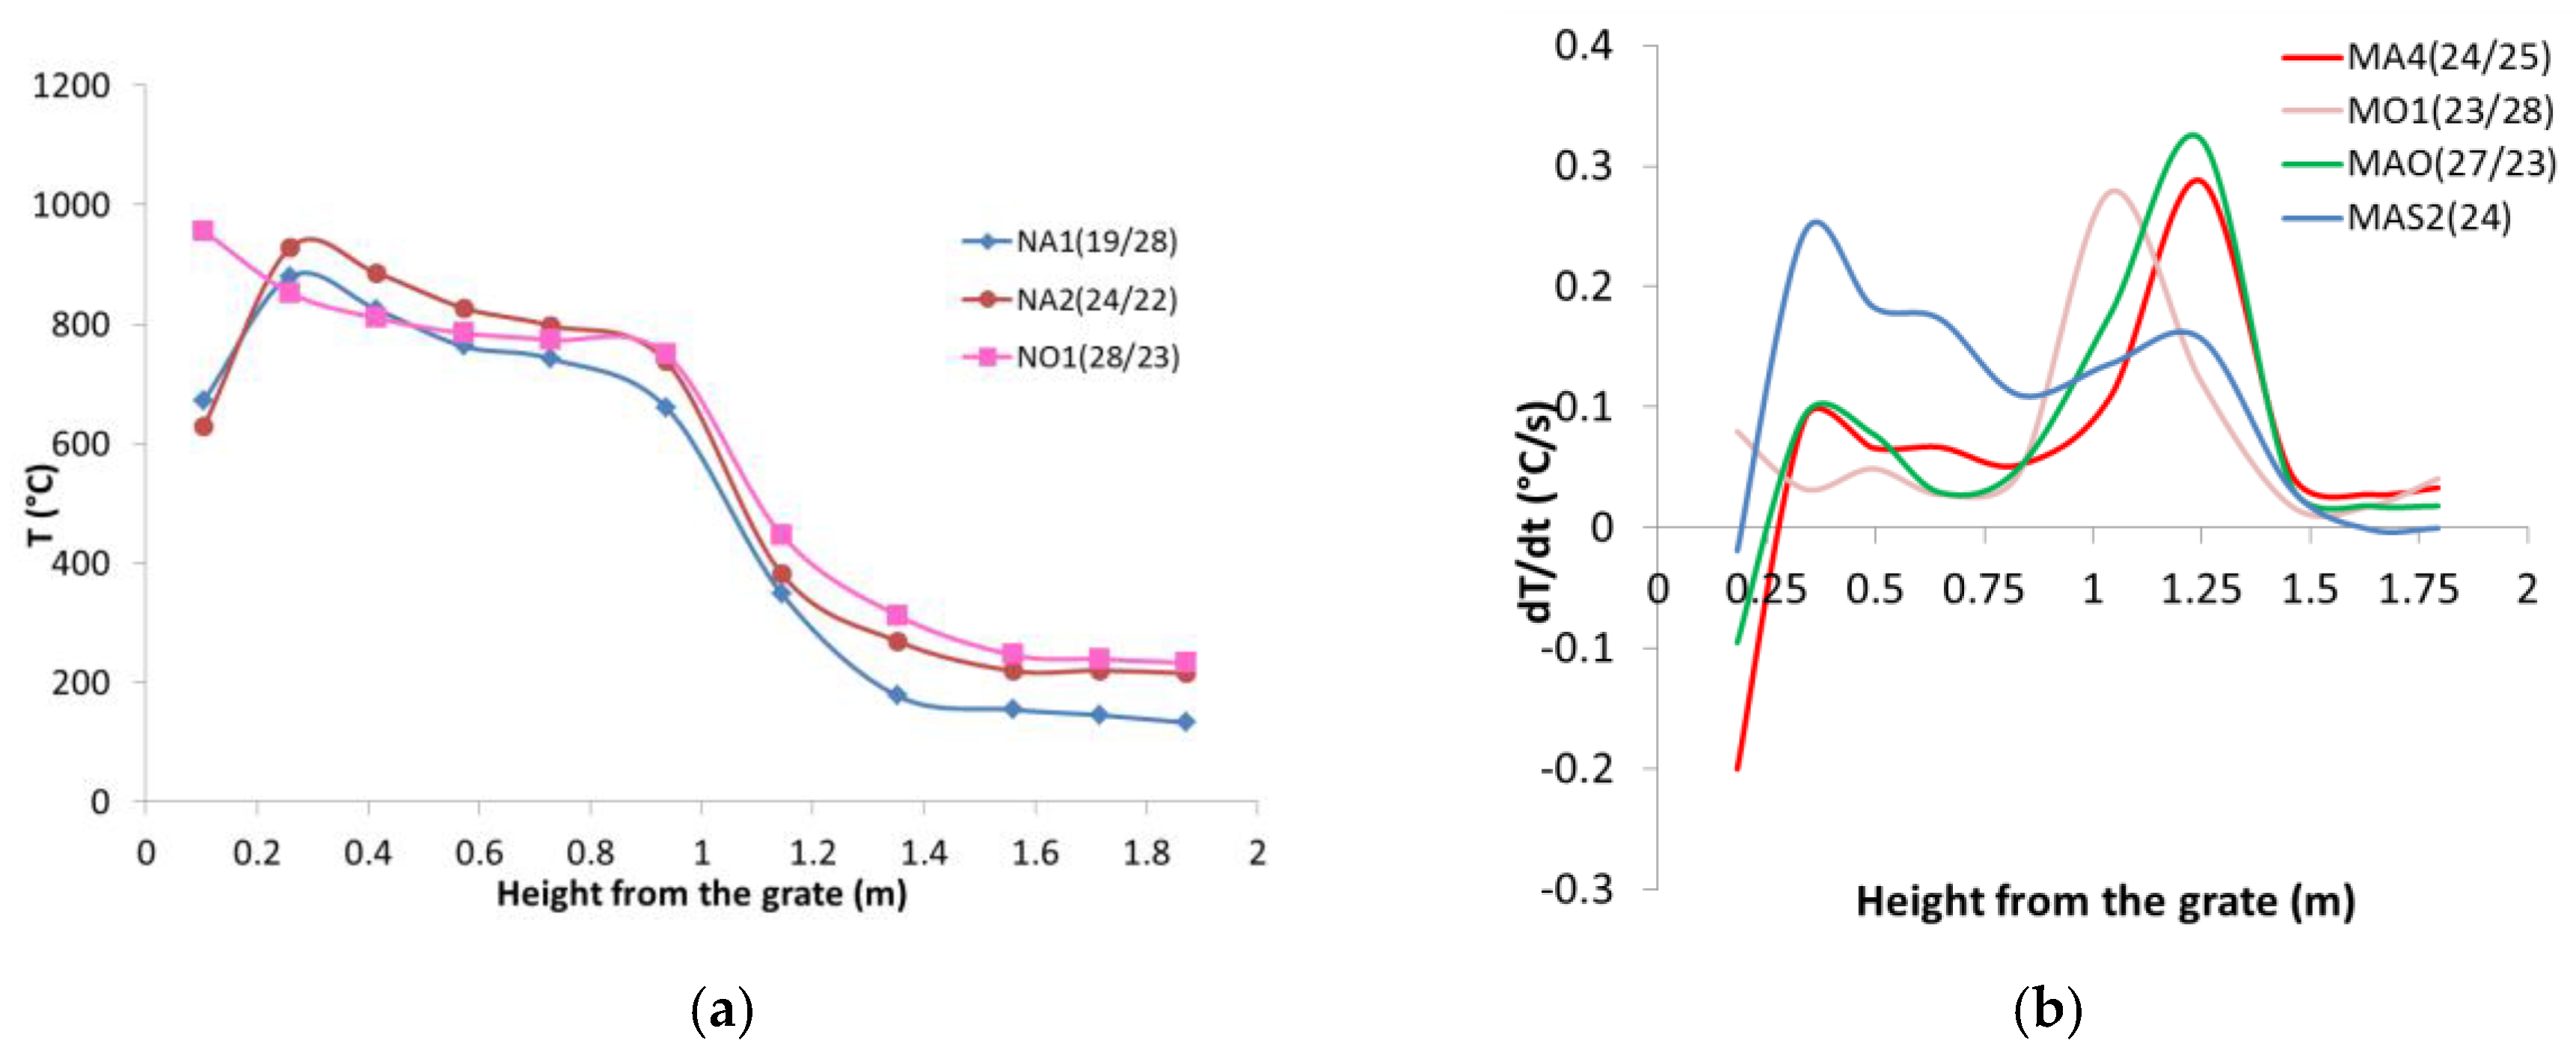
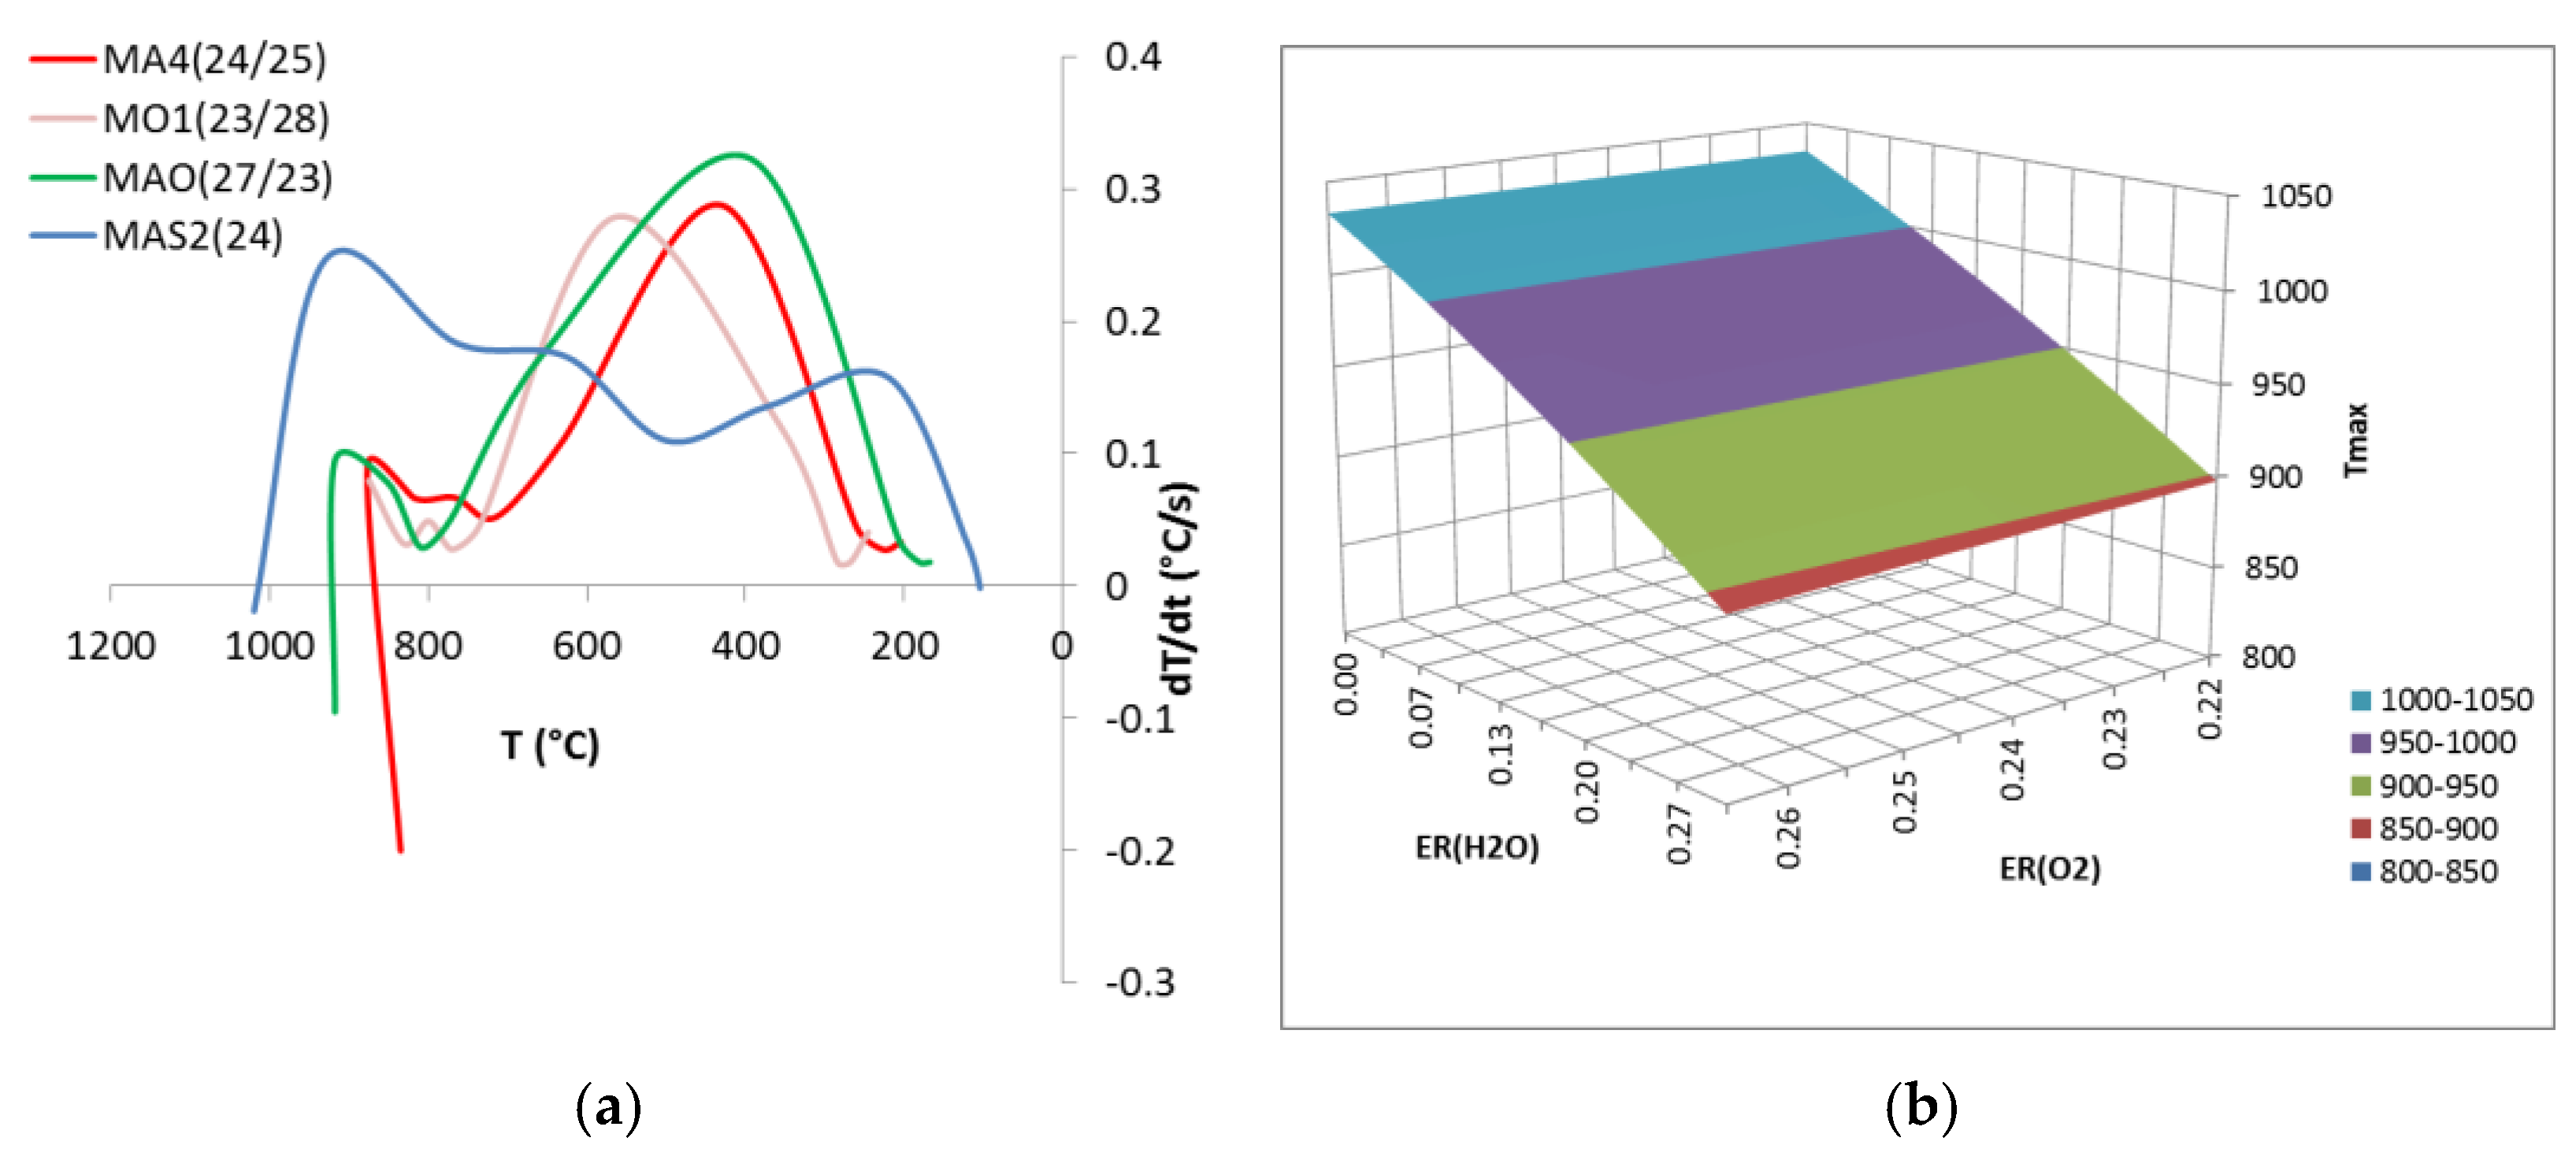
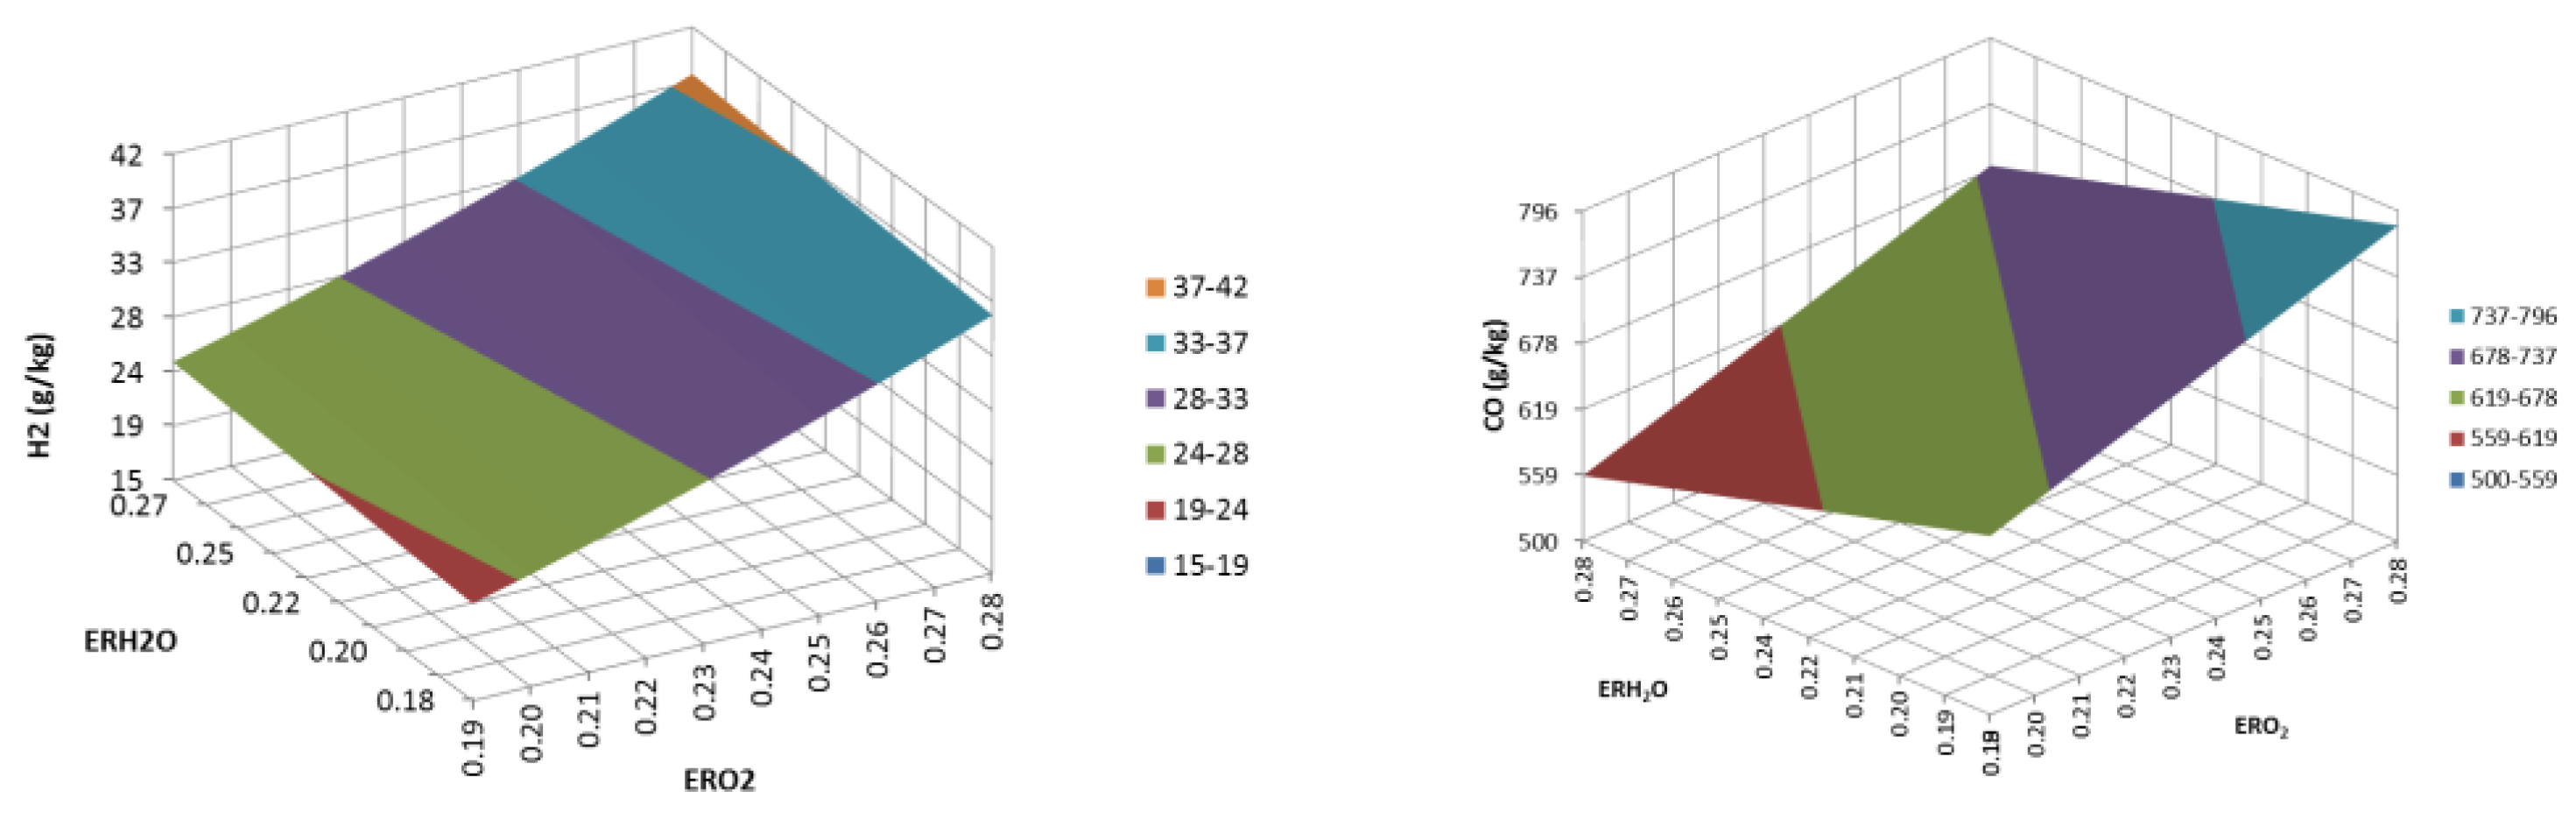
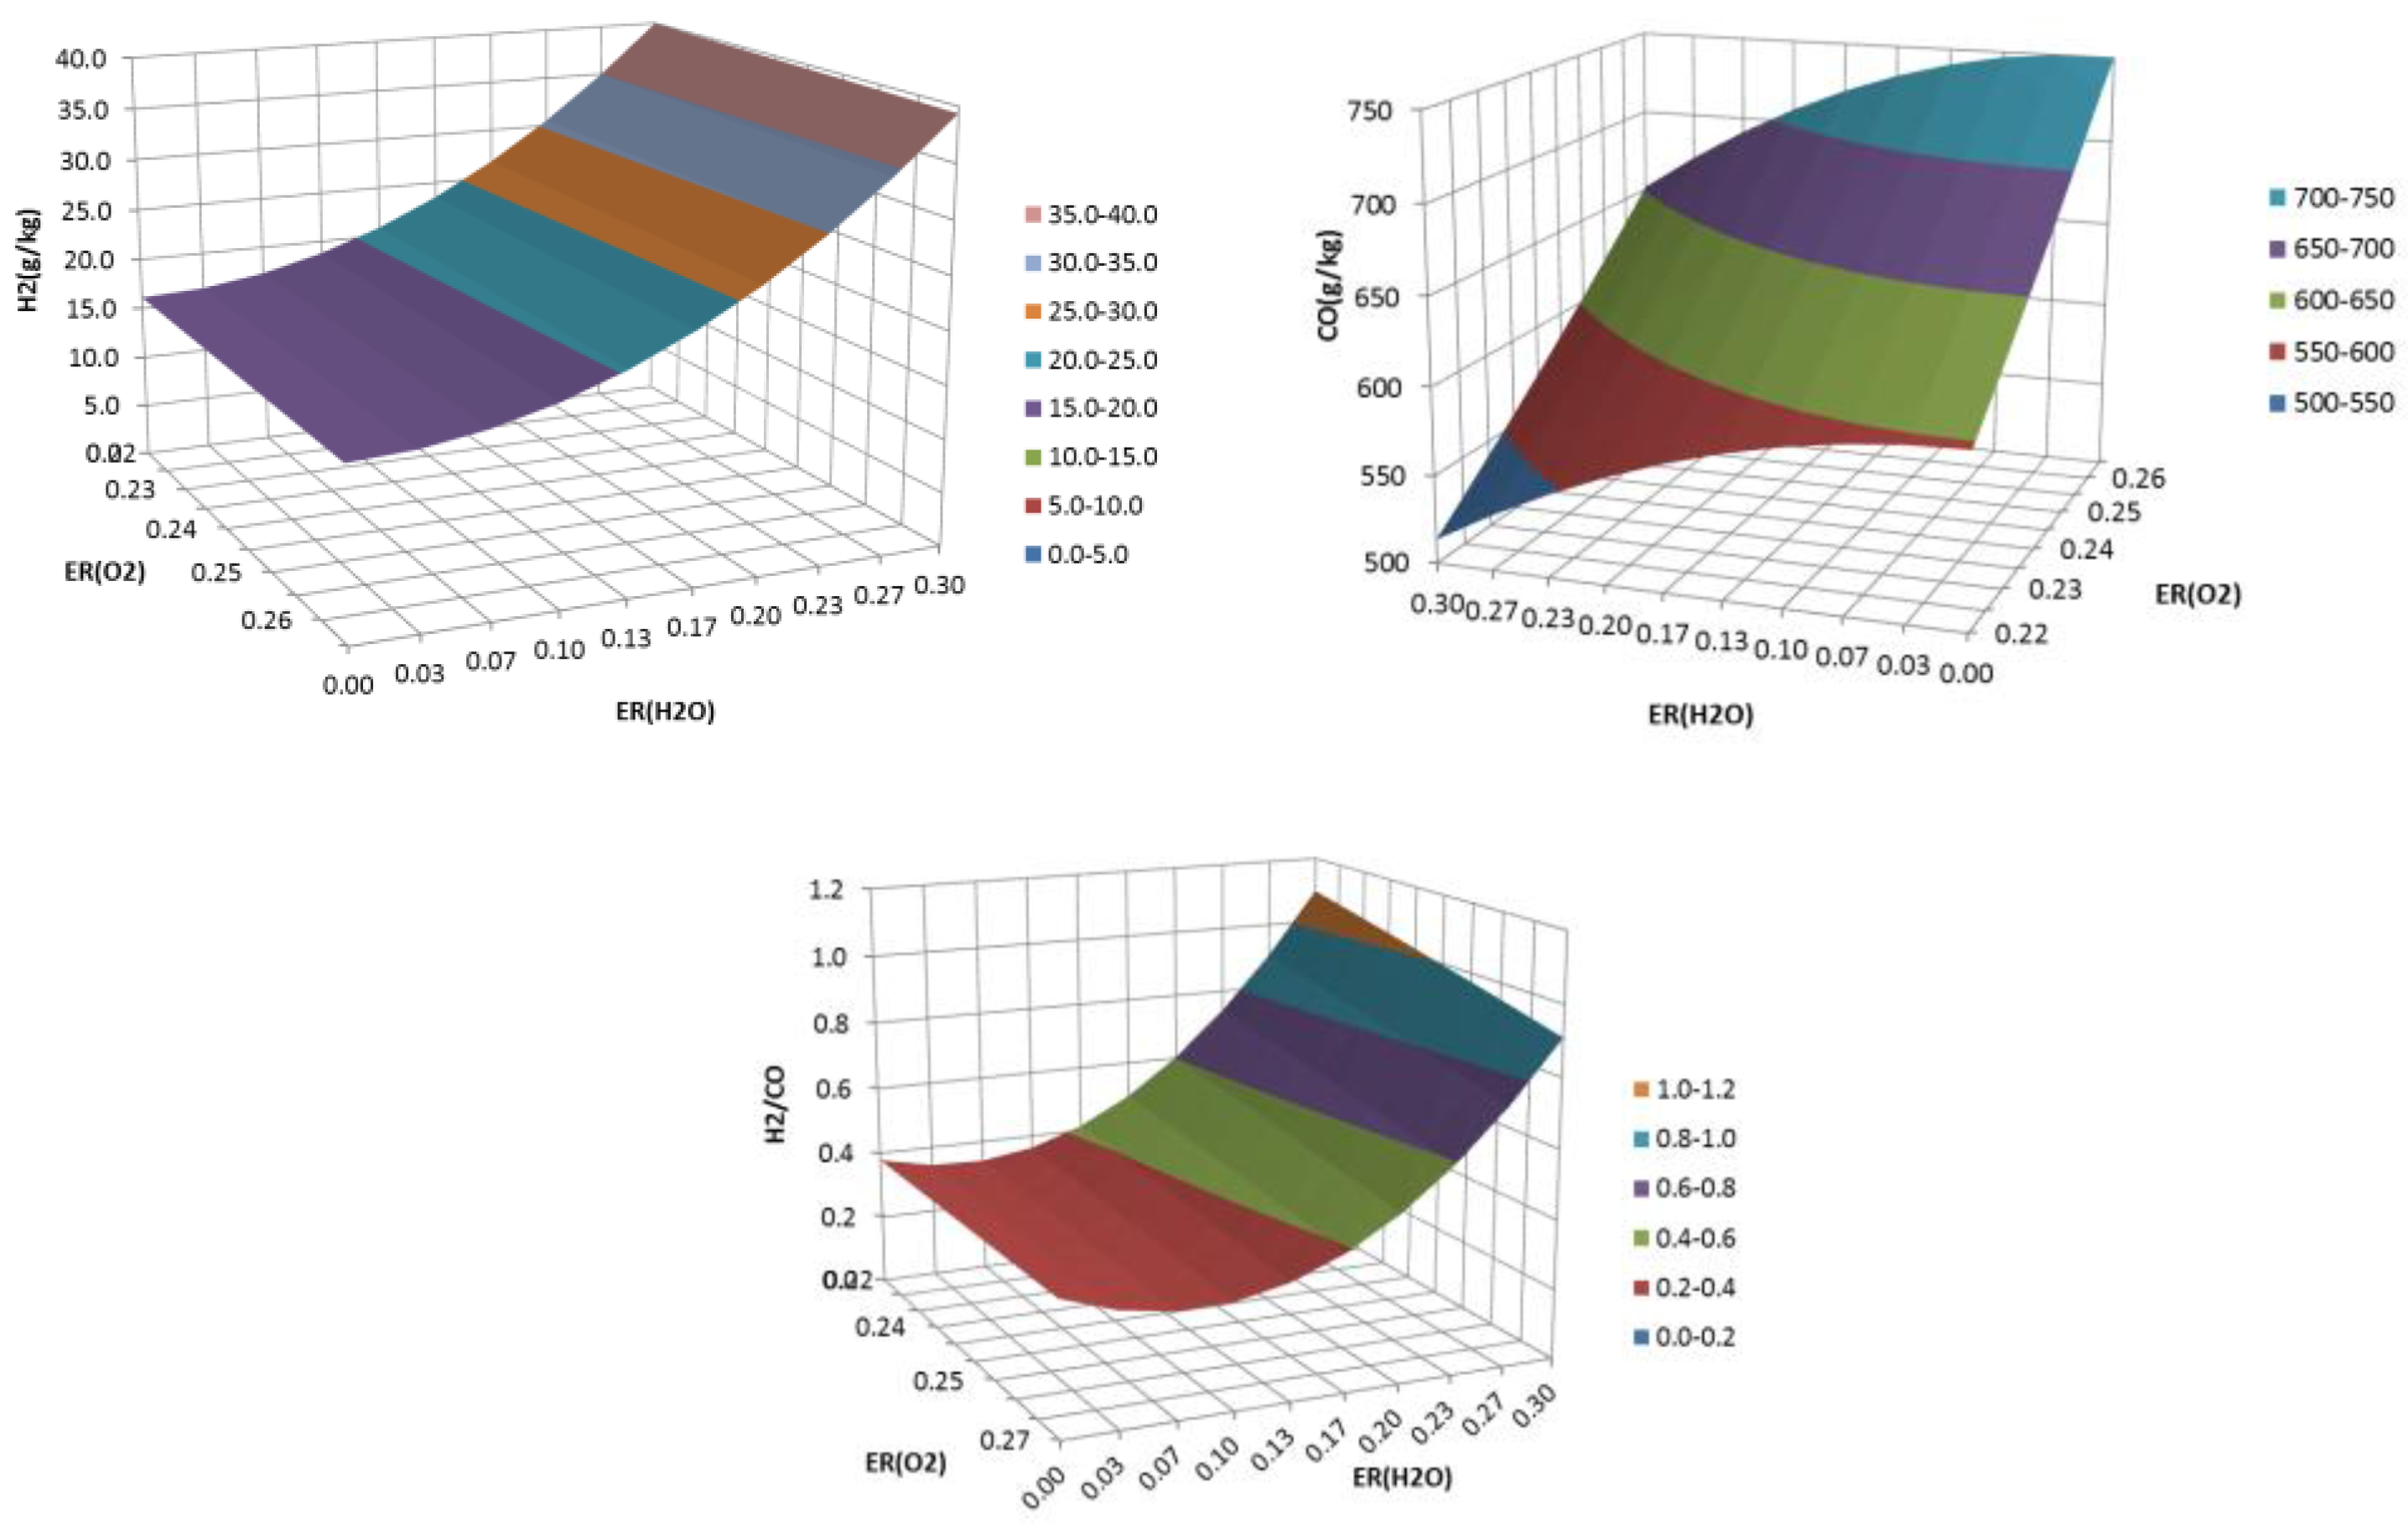
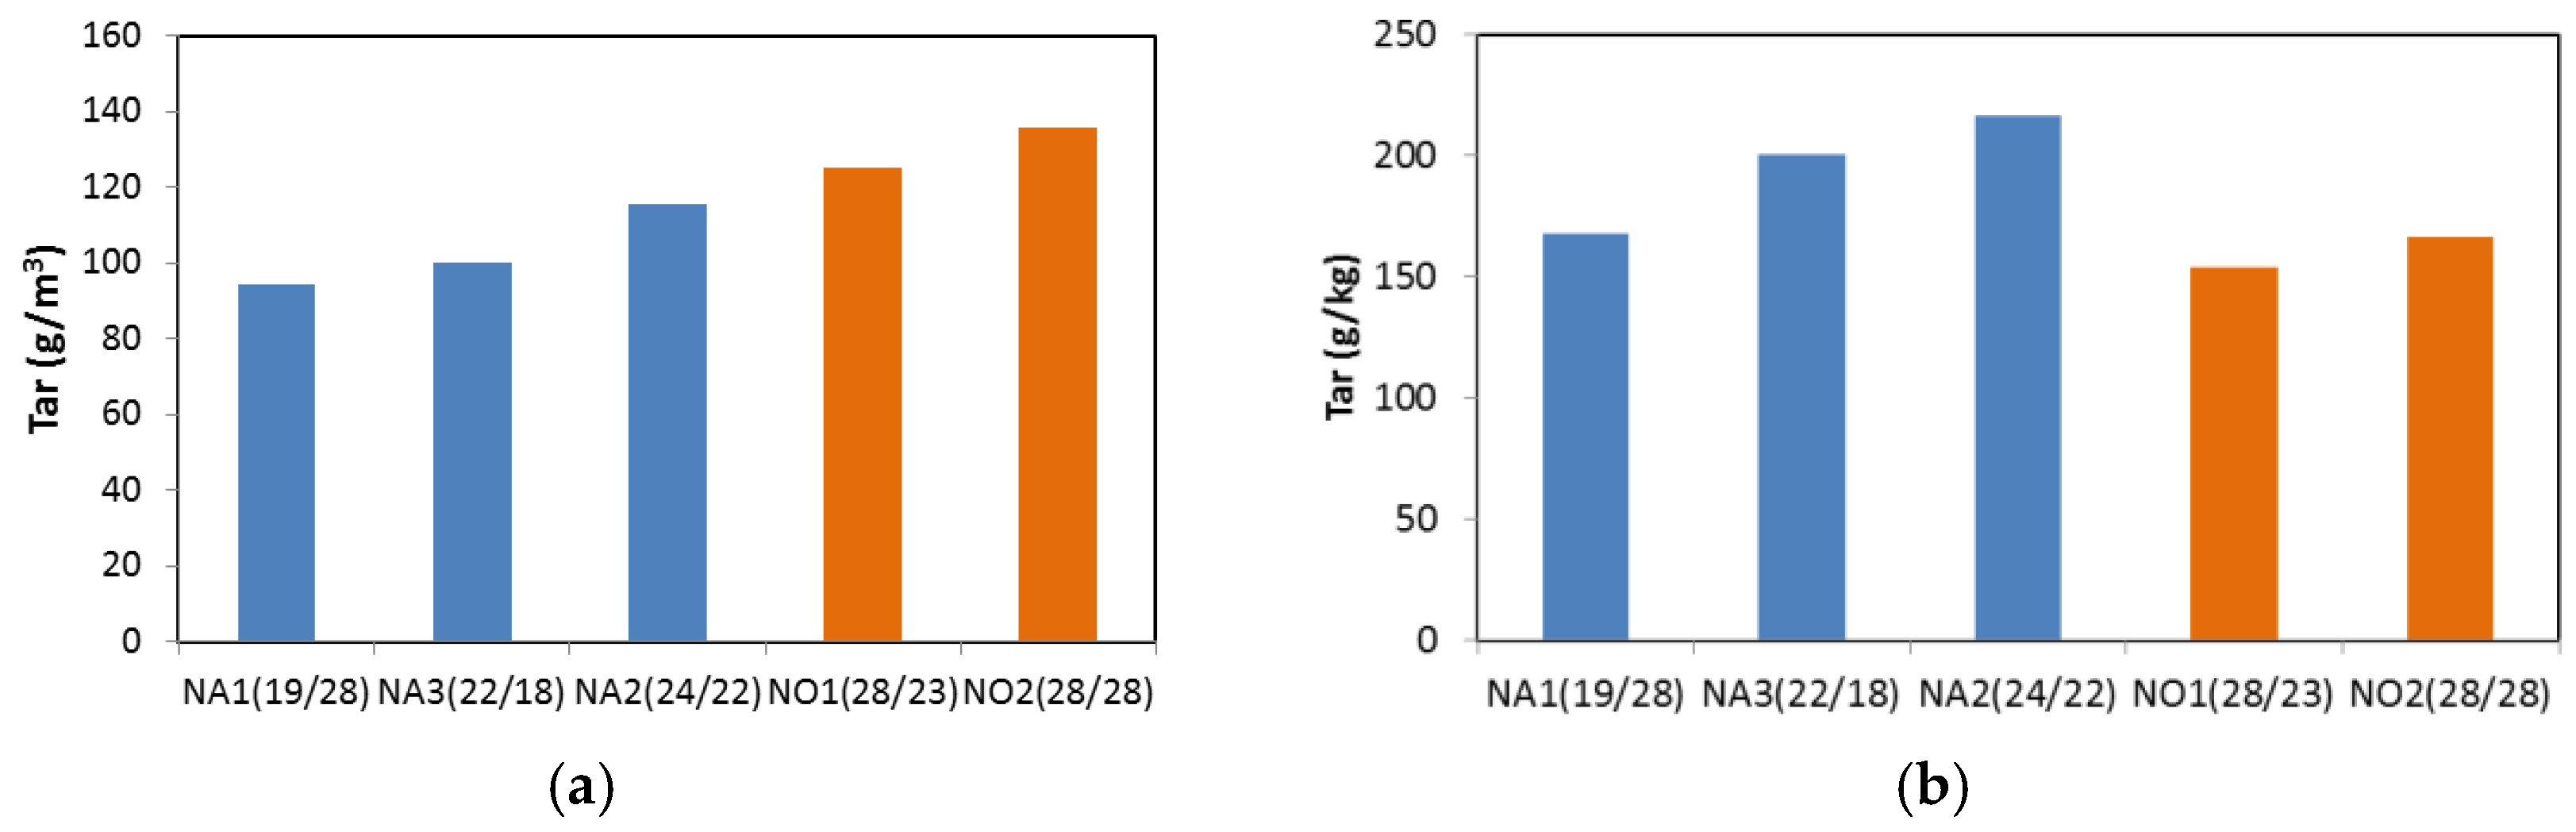
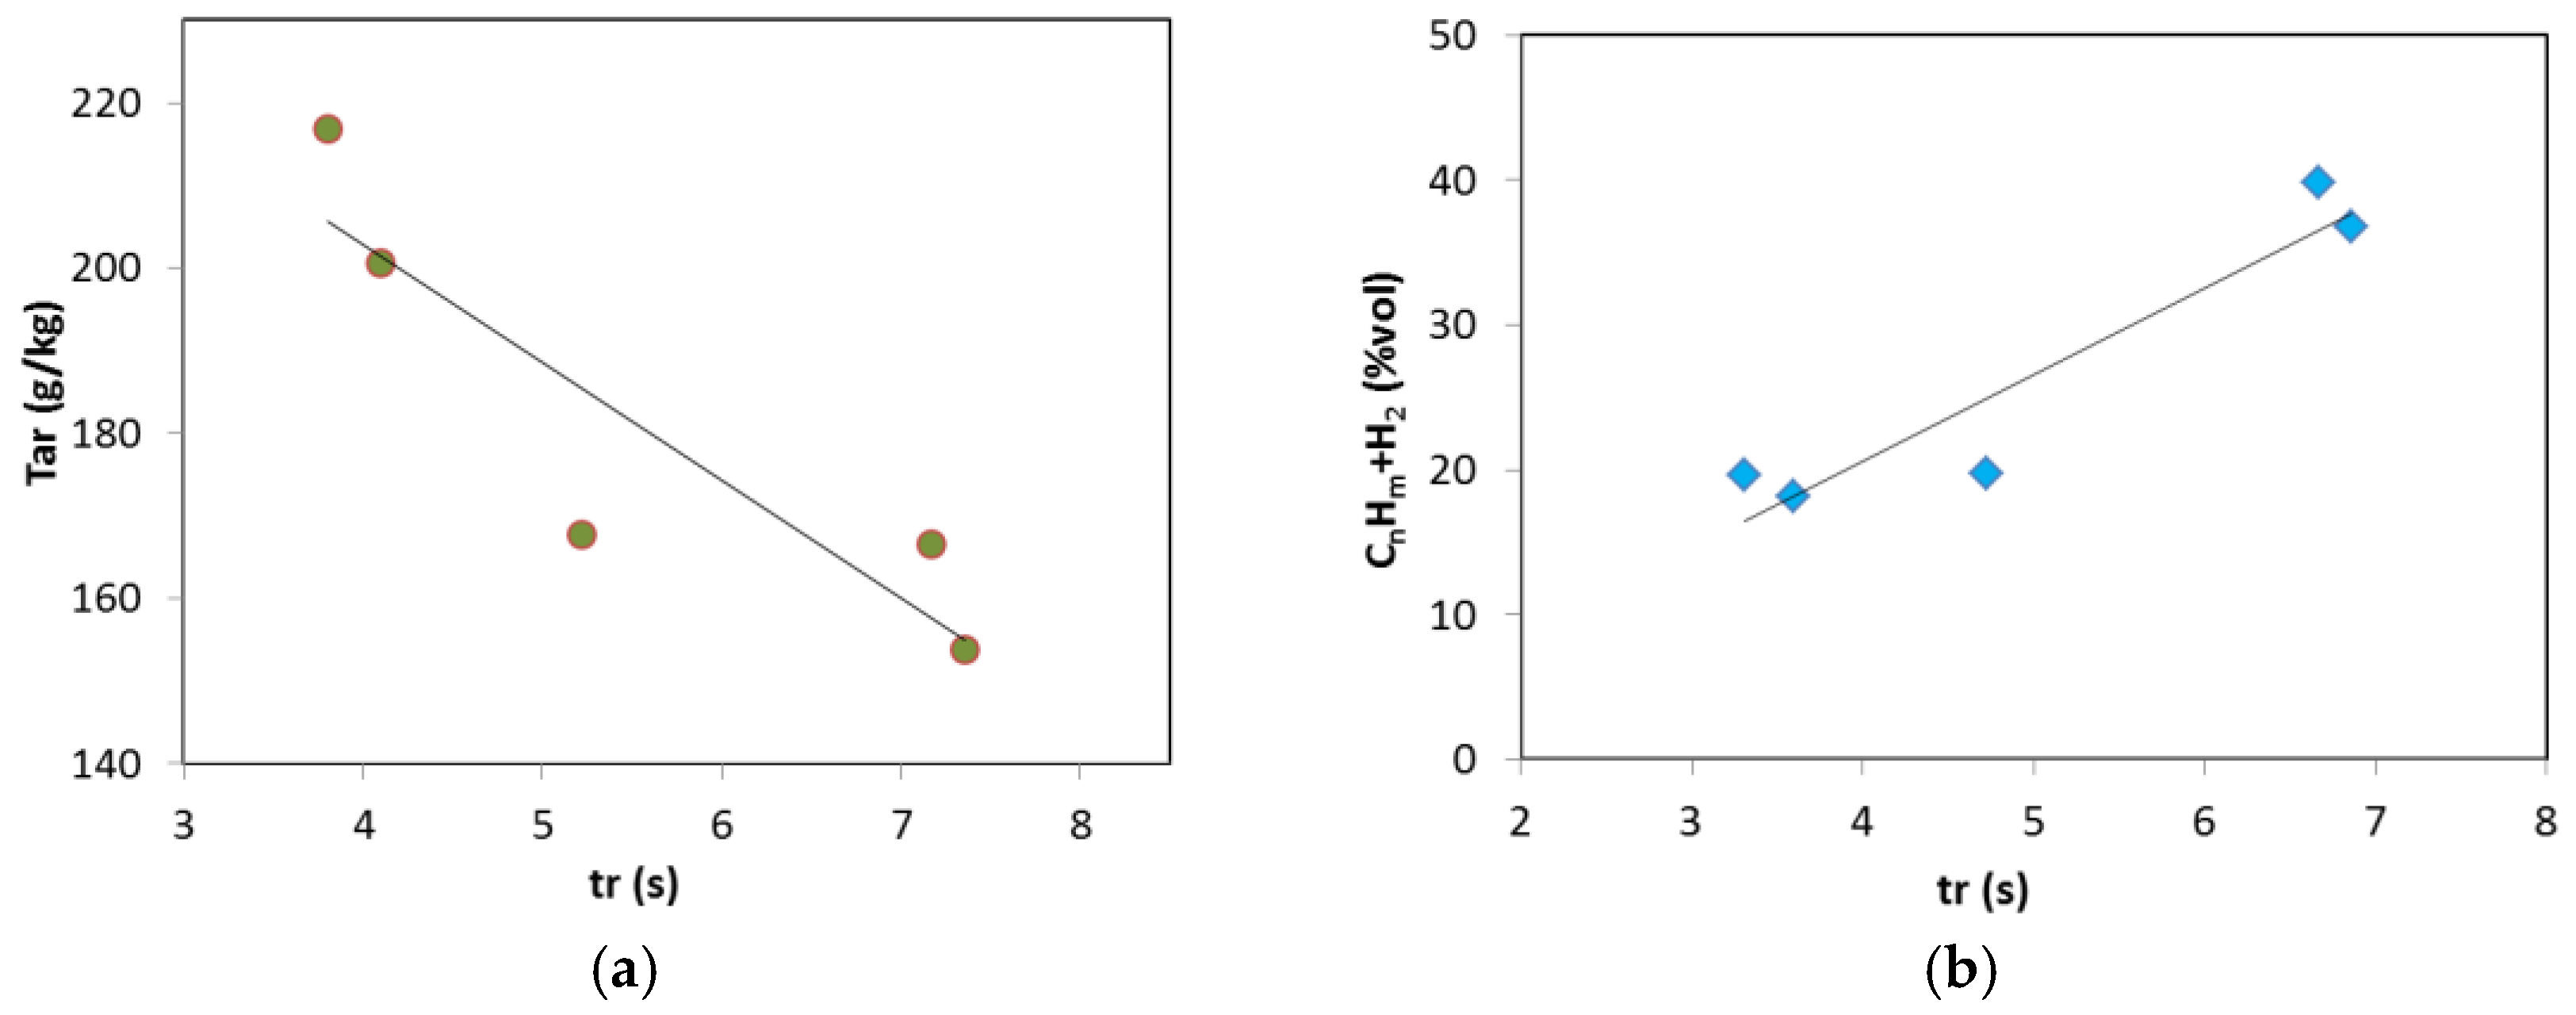
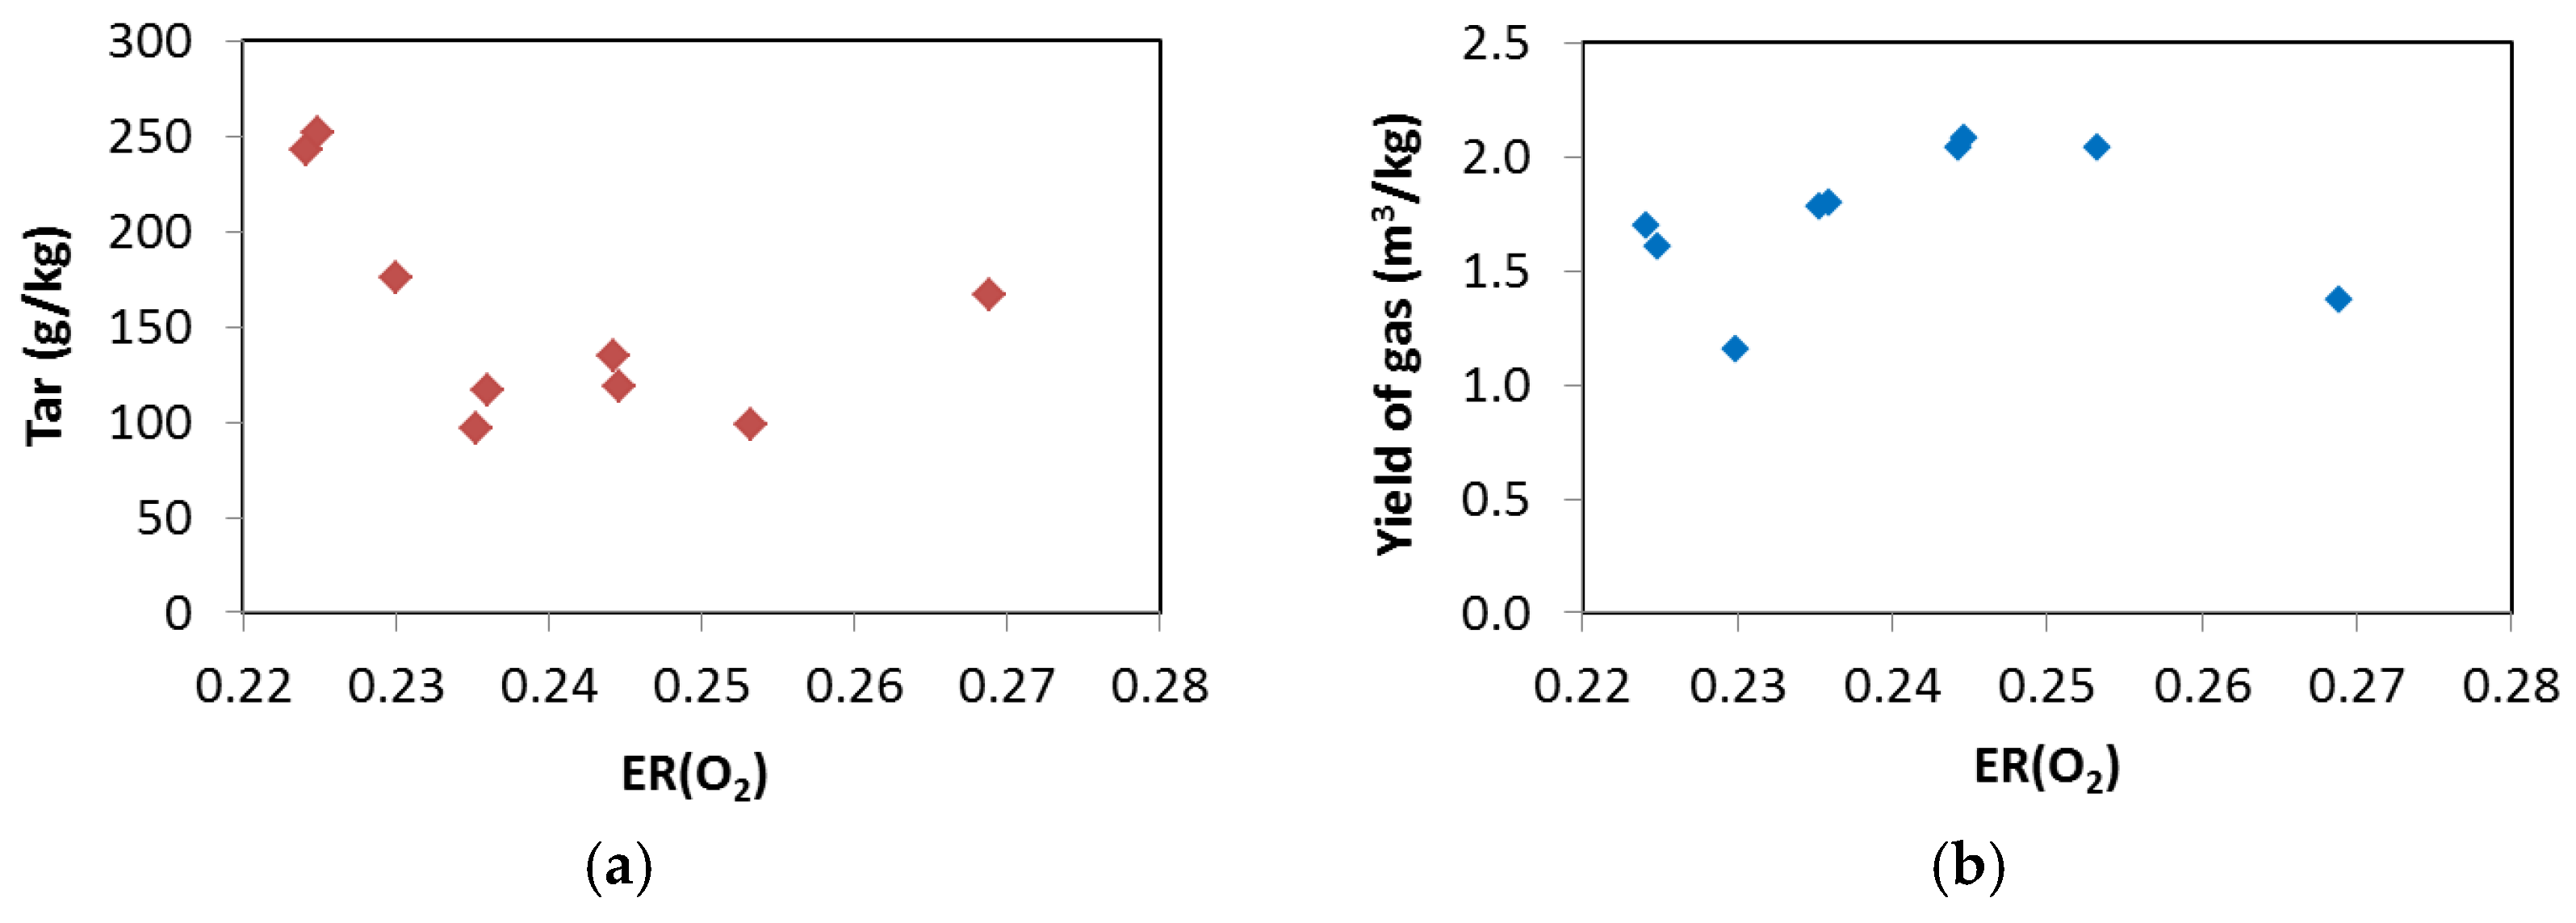
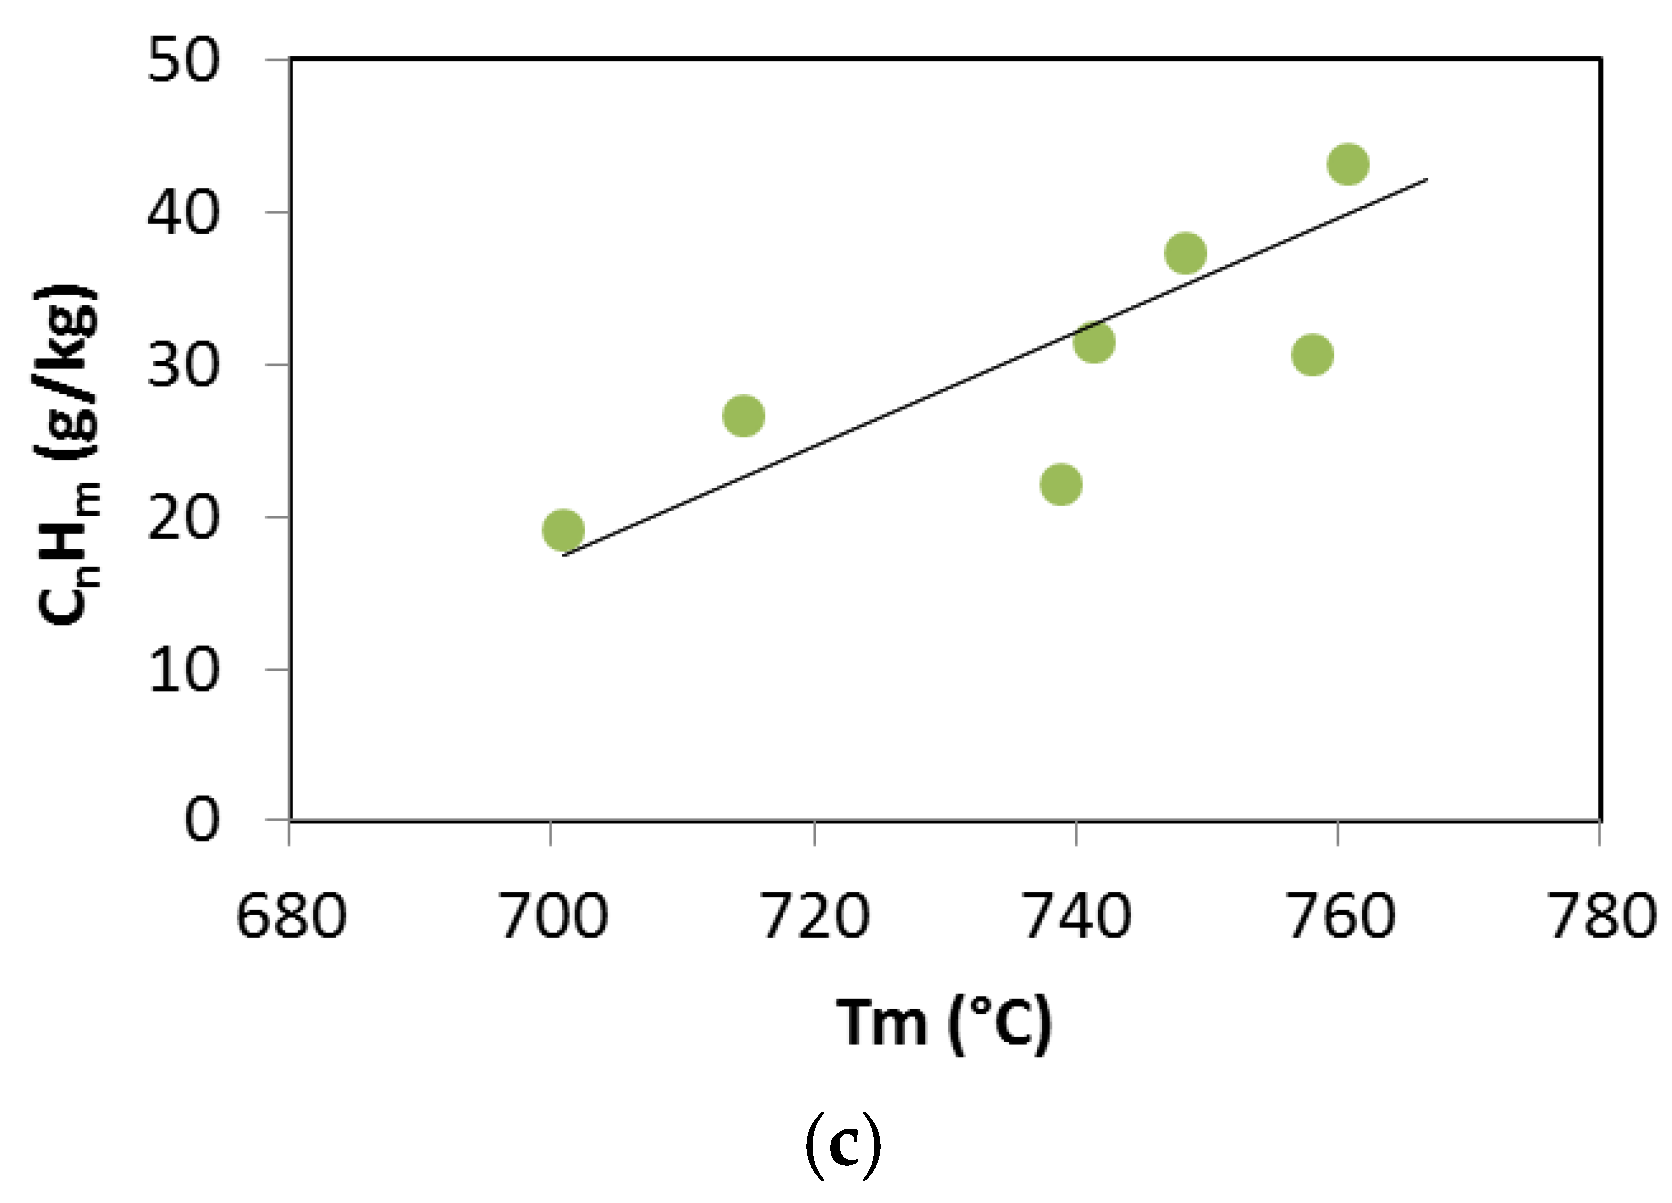
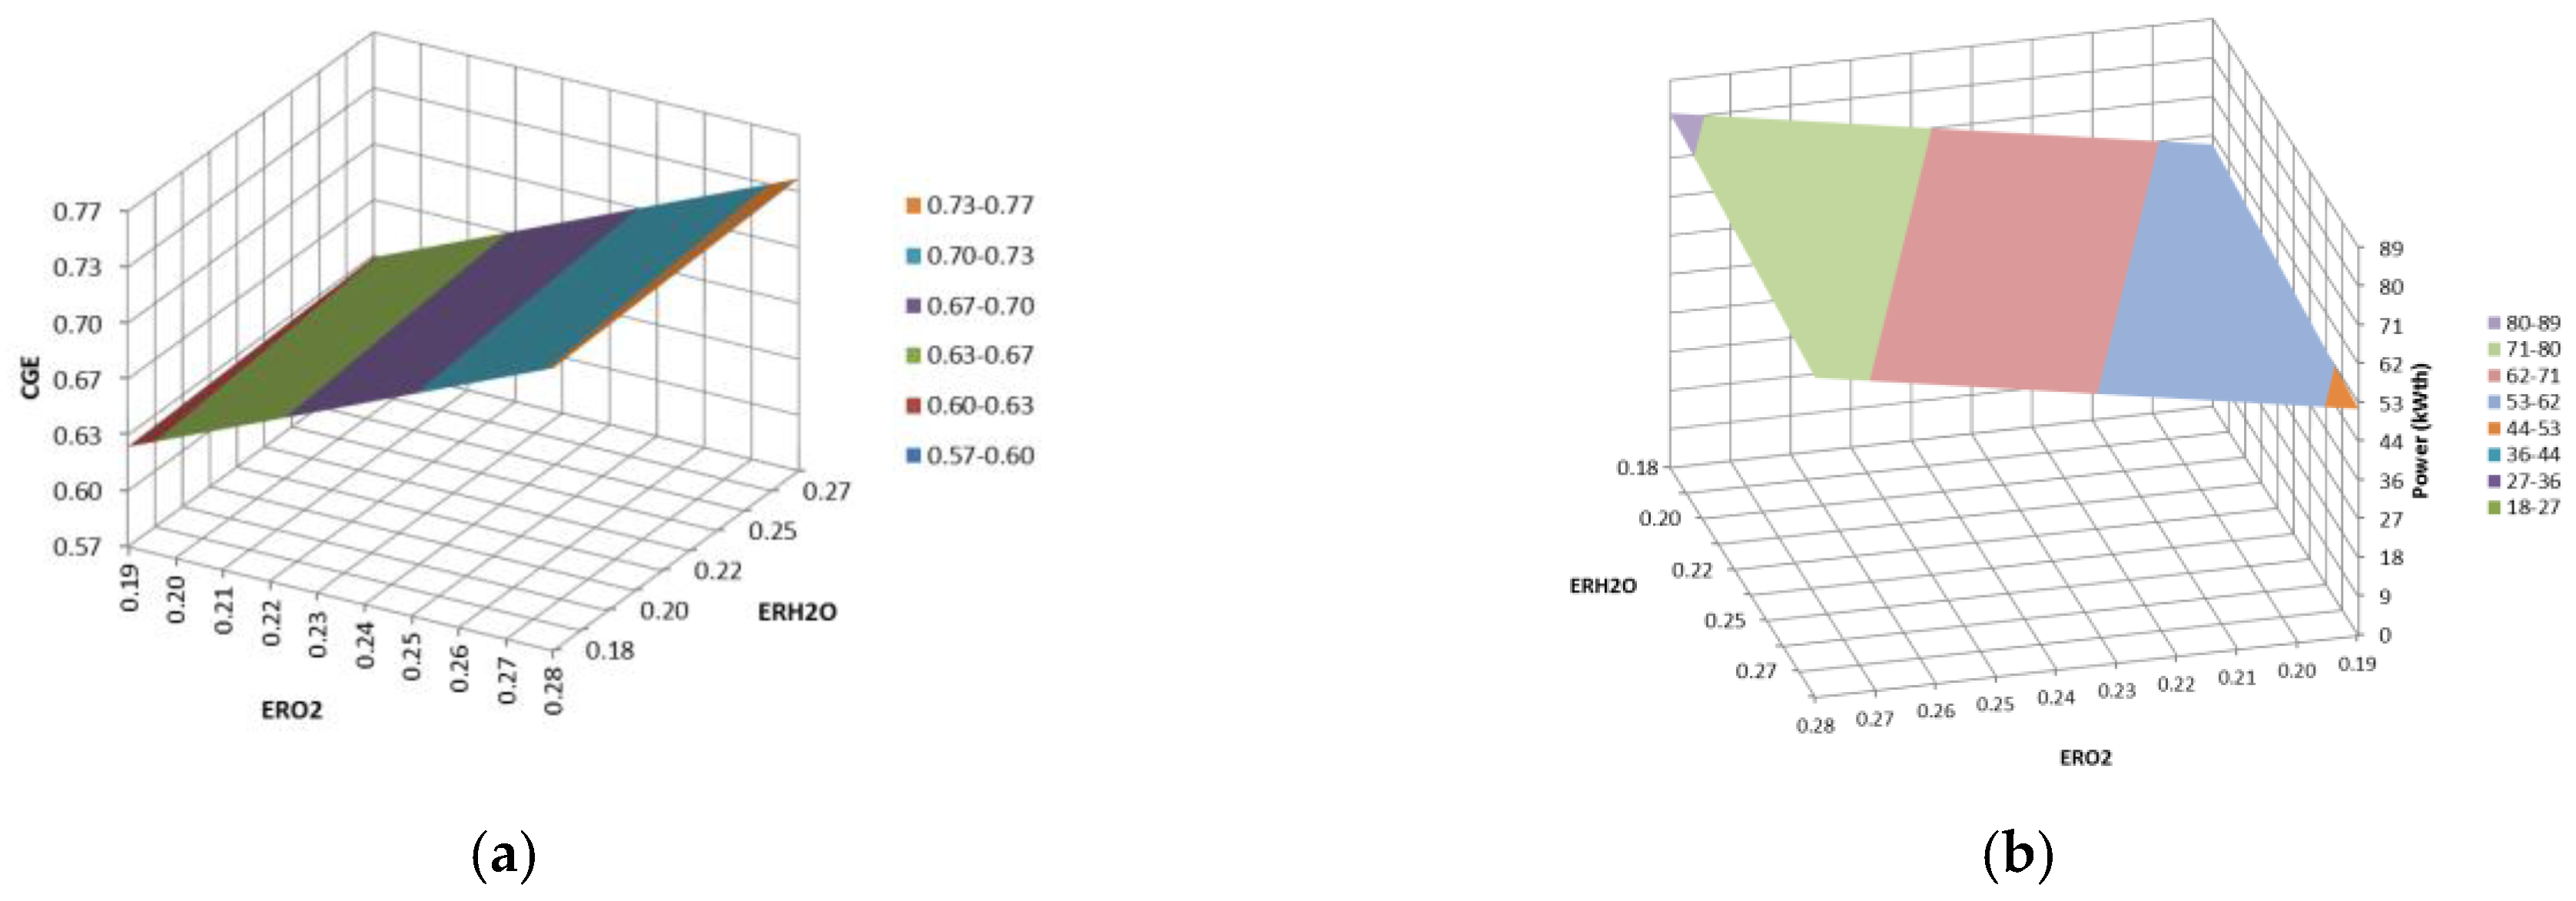
3.2. Updraft Gasification
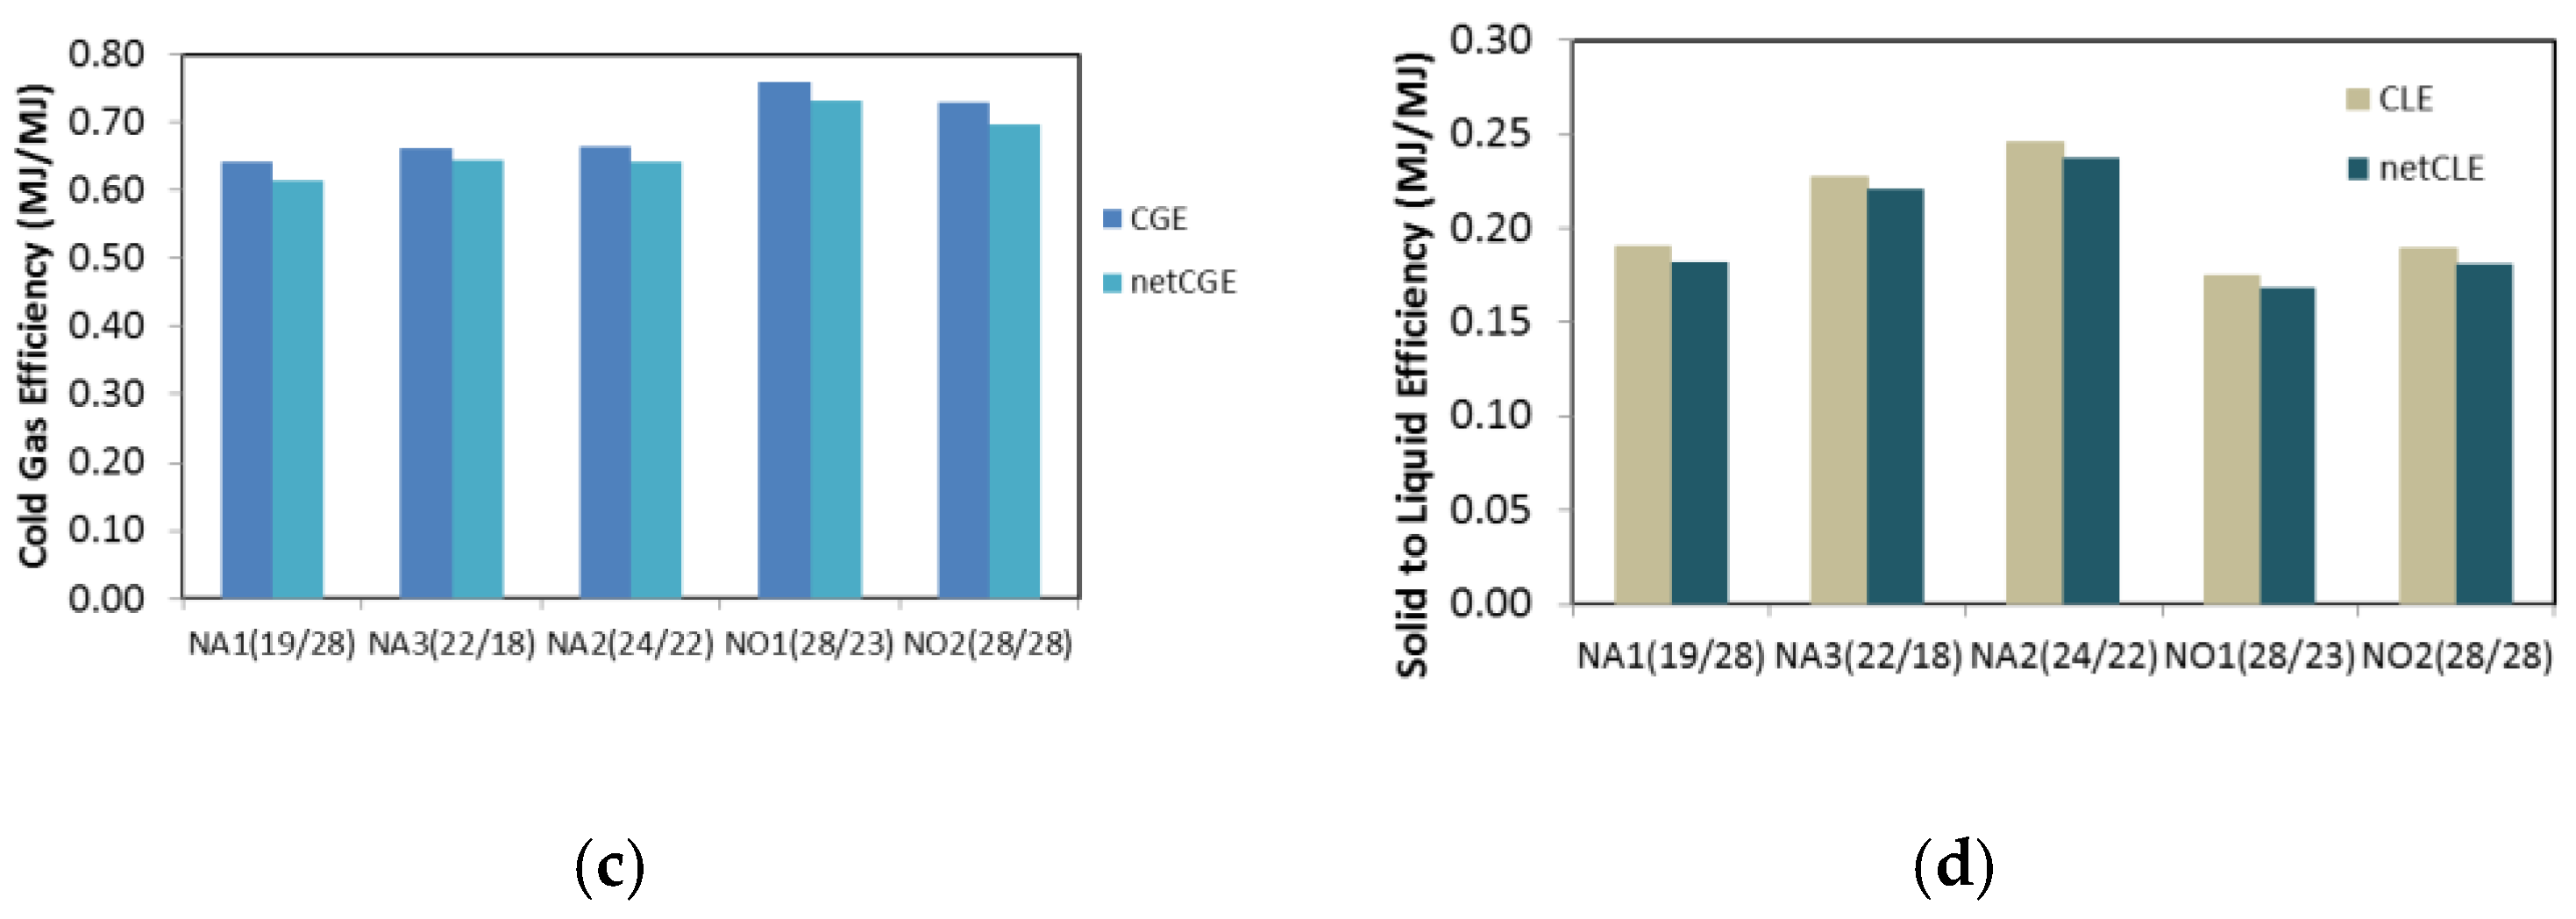
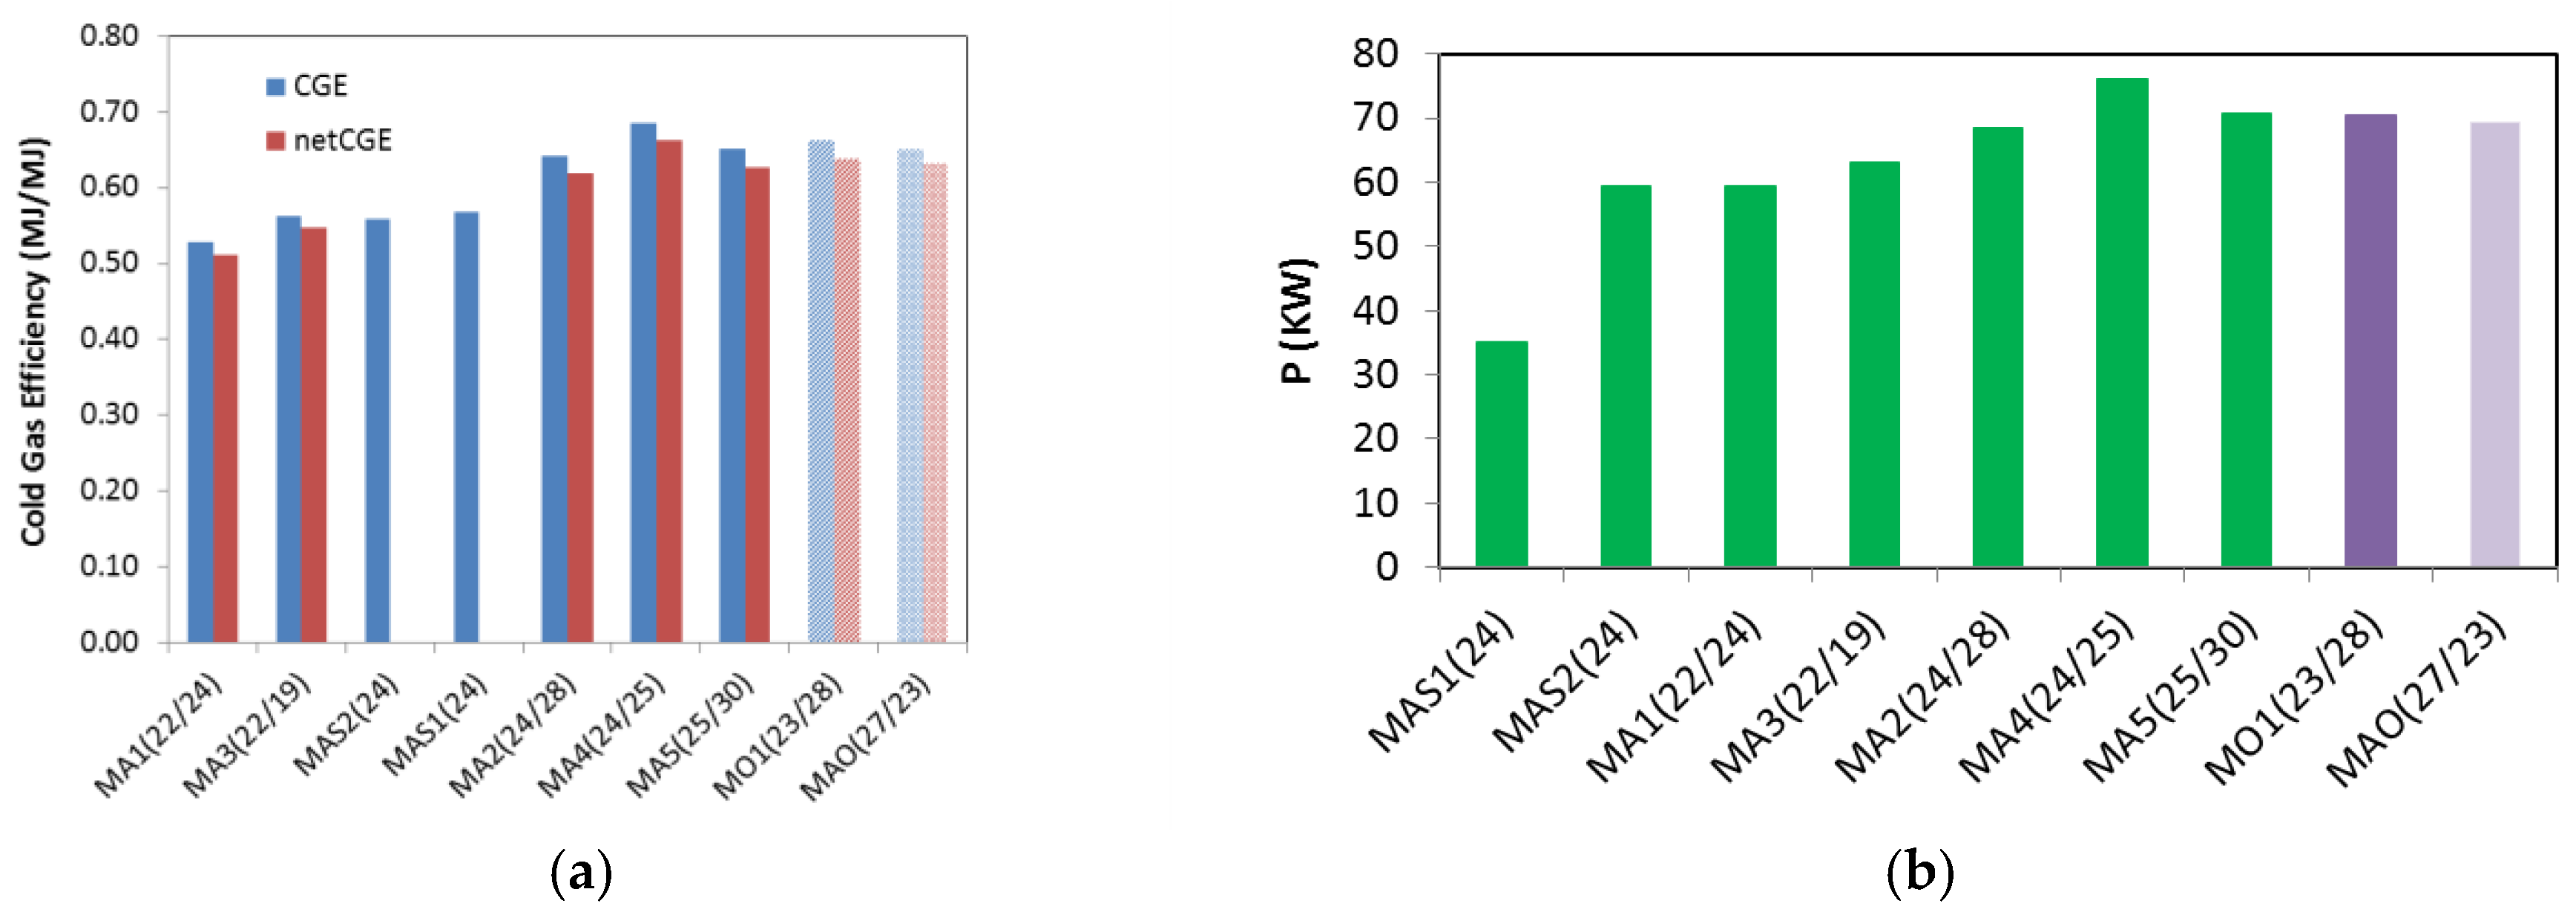
In this work the gasification process was investigated by varying the oxygen and steam flows, that affect the equivalence ratios ER(O2) and ER(H2O) as main operating parameters. The variation of flow rates affects a number of chemical and physical processes, such as the degree of combustion, the fluid dynamics, the thermal profile inside the gasifier, the syngas composition, and the production of condensable organic products. In the auto-thermal gasification mode these parameters are interlinked more than in the allothermal processes where the temperature is kept constant by external sources of power [32,33].
The equivalence ratio of combustion is the ratio between the available oxidant and the stoichiometric amount required for the complete reaction [34]. It would have a value of 1 for complete combustion and 0 for pyrolysis, while suitable values fall within the range 0.19–0.43 for gasification [35], up to 0.5 for fluid bed gasification of wet feedstock [36], resulting in a higher quality of the producer gas. It is defined as follows:
ER ( O 2 ) = feed   O 2   [ kg h ] flow   of   O 2   for   complete   combustion   [ kg h ]
The availability of oxygen, both as free molecule and as atom in the water molecule, is a key factor in gasification; so similarly an equivalence ratio of water-reactions can be introduced:
ER ( H 2 O ) = feed   H 2 O   as   steam   [ kg h ] flow   of   H 2 O   for   complete   gasification   [ kg h ]
These ER are respectively linked to the stoichiometry of biomass oxidation by oxygen and water:
C x H y O z + ( X + Y 4 Z 2 ) O 2 = XCO 2 + Y 2 H 2
C x H y O z + ( 2 X Z ) H 2 O = XCO 2 + ( Y 2 + 2 X Z ) H 2
Reaction (6) is obtained summing up the water gas reaction and WGS reaction of Table 2; it also takes into account that biomass itself contains H an O. In the tests presented here for gasification of M the ER(O2) fell in the range 0.22–0.25 and ER(H2O) from 0 to 0.30 while for gasification of N ER(O2) varied from 0.19 to 0.28 and the ER(H2O) from 0.18 to 0.28. In the auto-thermal process, the partial combustion reactions of the biomass generate the heat required to dry the feedstock, to conduct the endothermic reactions and to compensate for the heat loss through the reactor wall. Therefore, this kind of process can be tested in a narrower range of operating conditions than allothermal process.
The countercurrent gasification of M and N at pilot scale was carried out successfully without major problems and resulted in a very regular and reproducible process. All tests were carried out with an almost constant bed height, loading the biomass in a semi continuous mode, i.e., 4–5 kg of biomass were introduced into the gasification chamber at intervals of about 12 min and the process was completed in a few seconds. Air, oxygen and combinations of these with steam were used as oxidizing agents and introduced at the bottom of the grate that sustained the bed of biomass. The stabilization of the thermal profile inside the gasifier was used as indicator that steady conditions were achieved; while minor fluctuations in the freeboard reflected the cyclic feeding of the biomass. In Table 3 the experimental conditions and process parameters are reported as well the code assigned to each test: air and steam (A coded tests), oxygen and steam (O coded tests) and only air (AS coded tests). The numeric code of the test is referred to the corresponding percent value of ER(O2) and ER(H2O).
Figure 3 and Figure 4 report the temperature profile at steady operating conditions recorded along the vertical reactor axis by the set of 11 thermocouples. For greater clarity only a few thermal profiles are shown for M and N. From the thermal point of view, the behavior of the two residues was very similar. The temperature at each height of the bed depended on the equilibrium between several endothermic and exothermic reactions that occurred at the solid-gas interface and in the gas phase as well as on heat and mass transfer and interactions. When the ER(O2) increased, the temperatures increased above 1000 °C, but the introduction of the steam as co-gasification agent resulted in the temperature decreasing of about 200 °C in those bed regions (test MA4(24/25) versus test MAS(24)). The 3D plot of the maximum reactive bed temperatures for M gasification under the nine tested operating conditions (Figure 5) shows that with ER(H2O) > 0.2 the temperature was kept below 950 °C. This ensured a smooth operation of the process avoiding hot spots within the ash layer that formed at the bottom of the fixed bed gasifier. Indeed, one of the most common problems in thermal conversion of biomass at pilot scale is unwanted ash sintering caused by high temperatures in the reactor. When a mix of oxygen and steam was used as oxidizing agents, the hottest zone was located close to the grate, where oxygen was in contact with hot char (tests NO1 and MO1) [38]. Instead, the use of air with steam caused the highest temperature at about 26 cm from the bottom where the ash was still dispersed in the char and the risk of its melting was lower.
The flow of steam at 160 °C introduced in the hot zones contributed to the cooling of the reactor promoting also endothermic reactions of water gas which increased the production of H2 e CO.
In the updraft reactor, where the feed is introduced from the top and the particles of fuel move downwards, the heating rate was calculated from the space derivative of the temperature as follows:
dT dt ( ° C   s 1 ) = dT dz ( ° C   m 1 ) dz dt ( ms 1 )
At 1.5 m, near the top of the bed where fresh biomass arrived, the thermal gradient showed a peak due mainly to exothermic reactions of pyrolysis of hemicellulose (Figure 3b tests NO1 and NA2).
The extension of this region was larger at higher temperatures, as detected for NO1(28/23) and NA2(24/22) compared to NA1(19/28) whose average values were 220 °C, 250 °C and 160 °C respectively. A pronounced peak was found for all tests at 1 m and corresponded to the WGS reaction. This peak was lower for NA1(19/28) because of the longer residence time that improved heat transport between different regions reducing thermal gradients. The height where the heating rate approached its minimum was 0.7 m. It could be associated with gasification and cracking reactions which, due to their high endothermicity, used the enthalpy provided by the combustion in the zone below at about 0.5 m. The comparison between the gasification of M with absolute air and with the addition of steam pointed out the exothermic contribute of WGS reaction in the bed zone between 1.25 and 1.5 m corresponding to temperatures in the range of 400–600 °C (Figure 4b and Figure 5a). In these zones differences were evident in peaks when steam is introduced both with air and oxygen. In the gasification with air only the exothermic contribute of the pyrolysis was observed coincident as regard the height in the bed, but lower temperatures were measured (about 200 °C).
The composition of the conditioned gas at steady conditions is reported in Figure 6. Supplying steam as a gasifying agent increased the partial pressure of H2O inside the reactor promoting the endothermic water gas reactions in the regions with high temperatures. This led to increased H2 production in the syngas as in the test NO1(28/23) versus NO2(28/28) for N and in series MAS1(24) and MAS2(24) versus MA2(24/28) and MA4(24/25) for M. The H2/CO molar ratio significantly increased from 0.34 to 0.99 (MAS1(24) and MA5(25/30)) by injecting of steam which favored the WGS. The H2 and CO yields also showed the same trend (Table 4). However, it should be noted that there is a threshold of ER(H2O) above which any further effects on the syngas composition could not be observed as shown by the direct comparison between tests MA1(22/24) and MA3(22/19). This is due to the temperature of the steam supplied to the reactor being lower than the gasification temperature. Moreover, the increase in the molar flow resulted in a decreasing of residence time and these two factors highly affect the syngas quality and composition.
From a qualitative point of view, the effects of the ERs on the gasification process were the same for the two feedstocks. In the oxy-gasification the producer gas had a higher H2 content as shown in the series NO versus NA and MO1 versus MAS (see also Table 4). Moreover, higher corresponding gas heating values were obtained under these conditions than under those using air as gasification agent, because its nitrogen content dilute the products decreased proportionally the heating value of this stream. The gas heating value was comparable for M and N (Table 4) and reached the maximum value of 11.0 MJ/m3 using oxygen (test NO1(28/23); at these conditions the highest value of the plant thermal power output of 77 kW was achieved. In the case of M gasification with enriched air and steam, the gas heating values were between those obtained with air and with oxygen. The yields of the dry and clean gas (g per kg of dry feedstocks) as functions of ER(O2) and ER(H2O) are shown in the 3D plot of Figure 7 and Figure 8. The curves were drawn interpolating the data of Table 4 and were calculated starting from the gas composition of each component and the mass flow. The production of H2 showed a positive correlation with both parameters in the examined range and reached a maximum at ER(O2) and ER(H2O) of 0.28 (see Figure 7 for N). Similarly, the production of CO was linked to the ERs but in a more complex way: it increased with ER(O2) and decreased with ER(H2O), with a minimum value for ER(O2) of 0.19 and ER(H2O) of 0.28 and a maximum value at 0.28 and 0.23 respectively. It is worth to point out how the surfaces of CO and H2 appeared complementary to each other according to WGS reaction.
The equivalence ratio ER(H2O) had a strong influence on the H2 production as reported in Figure 8 for M gasification and reached a maximum at ER(H2O) 0.30. The CO yield showed a correlation with both ERs: it increased with ER(O2) while had a generally negative trend with ER(H2O). In the examined range, the highest values of molar ratio H2/CO corresponded to higher values of ER(H2O) parameter, while the dependence on ER(O2) appeared weak. This effect was observed comparing MAS1 and MA2 tests carried out keeping the same ER(O2) and tuning the ER(H2O) from 0 to 0.98. The ratio H2/CO increased from 0.34 in air gasification to 0.97 in air-steam gasification so demonstrating the effect of steam addiction.
For both residues, the tar content showed a strong correlation with ER(O2). As shown in Figure 9a, the tar content increased with ER(O2), while for ER(H2O) there was a weaker dependence even if, at the same ER(O2), the increase of steam caused a rapid raise of tar production (NO2(28/28) versus NO1(28/23)). The tar yields (Figure 9b) confirmed these trends in the air-steam gasification, although with a significant lower production of tar, at higher ER(O2) when oxygen and steam were used as gasification medium. To explain the behavior of organic condensable species, it was considered its correlation with the fluid dynamic of the system and more specifically with the residence time of the syngas in the bed as shown in Figure 10a. The use of air as gasification agent resulted in higher total syngas flow with a corresponding decrease in the residence time leading to larger tar content in the gas. In fact, tar decrease was linked to the longer residence time that allowed volatile organic molecules to undergo thermal cracking cycles into incondensable hydrocarbons and hydrogen according to consecutives reactions scheme in (8):
Tar C n H m H 2
Figure 10a,b show the opposite trends of tar and CnHm and H2 as a function of residence time for N. The addition of steam, which caused an increase of gas flow, produced the same effect on the residence time reduction (NO1(28/23) versus NO2(28/28)). Moreover, the use of steam led to a reduction of the temperature in the reactor and this condition increased tar production, as observed in tests NO1(28/23) and NO2(28/28) to which corresponded average bed temperatures of 768 °C and 714 °C respectively.
For M the tar content in the syngas decreased up to ER(O2) 0.25, then the trend reverses as shown in Figure 11a. The analysis of the gas yield with ER(O2) (Figure 11b) showed a positive correlation, with a maximum value for ER(O2) of 0.25. The complementary trends between syngas and tar yield were inherent in the chemistry of the process that provided only these two types of products and confirmed the correctness of the mass balance.
The increase of ER(O2) led to an increase of bed temperatures, (Table 3) thus favoring the attainment of higher syngas yields associated with progressively lower tar production. However, higher gas flow rate inside the reactor caused a decrease in the residence time and an increase in the risk of ash melting. The comparison of the graphs in Figure 11a,c shows the opposite correlation between the tar production and the production of incondensable hydrocarbons.

3.3. Process Yields

The thermal conversion of lignocellulosic residues involves the production of incondensable gases, liquid and solid (char or ash), their relative ratio depending on the technology used and the physical-chemical properties of the feedstock. Updraft gasification is characterized by high conversion into gas and liquid. The potential enthalpy of the feedstock is efficiently transferred to gaseous and liquid streams because of the relatively low temperature of the syngas at the exit of the gasifier. Moreover, the recovered ash contains very low residual carbon because of the long residence time of the particles in the gasifier and because the temperature is lower than 1000 °C and avoids the formation of graphitic residues which would be hard to convert. One of the most used parameters in the gasification is cold gas efficiency (CGE) which measures the fraction of energy transferred from the solid state (fed biomass) to the gaseous carrier (clean, dry and cold syngas); it is defined as follows:
CGE = LHV   of   clean   gas   [ MJ kg ] · Flow   of   clean   gas   [ kg h ] LHV   of   feedstock   [ MJ kg ] · Feeding   rate   [ kg h ]
Similarly, Cold Liquid Efficiency (CLE) measures the energy converted from the solid to the liquid and is related to the calorific value of condensable organic molecules recoverable from the raw the syngas:
CLE = LHV   of   condensed   organic   volatiles   [ MJ kg ] · Flow   of   condensed   organic   volatiles   [ kg h ] LHV   of   feedstock   [ MJ kg ] · Feeding   rate   [ kg h ]
In an ideal gasification process, the solid is fully converted into gas, therefore CGE would be 1 and CLE 0, while in ideal pyrolysis CLE would be 1 and GCE 0. As LHV of the condensed organics volatiles we used the value of 16 MJ/kg reported for the anhydrous part of the bio-oil obtained from slow pyrolysis [39].
In Figure 12 and Figure 13 and in Table 4 the CGE and CLE are reported together with the net values obtained taking into account the theoretical enthalpy required to produce overheated steam at 160 °C from water at 20 °C. In these cases the net values of CGE and CLE were calculated as follows:
net   CGE = LHV   of   clean   gas   [ MJ / kg ] ·   Flow   of   clean   gas   [ kg h ] LHV   of   feedstock   [ MJ / kg ] ·   Feeding   rate   [ kg h ] + Δ   entahlpy   water   to   steam   [ MJ / h ]
net   CLE = LHV   of   condensed   organic   volatiles   [ MJ / kg ] ·   Flow   of   condensed   organic   volatiles   [ kg h ] LHV   of   feedstock   [ MJ / kg ] ·   Feeding   rate   [ kg h ] + Δ   entahlpy   water   to   steam   [ MJ / h ] .
For gasification of N, the CGE showed a positive dependence with ER(O2) in the examined range and reached a maximum at ER(O2) of 0.28 (NO1(28/23)) and a minimum value for 0.19, while the dependence on ER(H2O) appeared weaker. The power of the plant, calculated from LHV and the yields of the produced syngas, showed the same trend reaching a maximum value of 0.77 kW for NO1(28/23). The change of oxidant from air to oxygen resulted in an increase of CGE and power, and in both cases the maximum value was obtained with ER(O2) 0.28 and ER(H2O) 0.23. At these values of ER corresponded the lowest tar production and the lowest heat loss in the gas flow at the exit of the gasifier. Moreover, the excess of steam depressed this performance as shown in test NO1(28/23) versus NO2(28/28). For gasification of M, the CGE showed a positive correlation with both ER. Figure 13a shows that the addition of steam improved the efficiency as it appeared from the direct comparison between MA4(24/25) and MAS2(24). Similarly, an excess of steam negatively affected CGE as shown in the tests MA4(24/25) vs. MA4(24/28) and MA3(22/19) vs. MA1(22/24). The use of oxygen and enriched air instead of air as gasifying medium resulted in higher values of efficiency, but the best output in term of efficiency was observed for MA4(24/28). The thermal power of the plant also followed the same trend (Figure 13b). The CLE was proportional to the tar yield and was higher in the tests of air gasification for N and in the tests with lower ER(O2) for M. This parameter is important when all gasification products are considered valuable and the liquid stream is exploited to produce liquid biofuels.
The overall energy conversion efficiency of solid biomass to gaseous and liquid carriers was obtained by summing CGE and CLE. The lowest conversion efficiency was observed for air gasification of almond shells, 0.68 at MAS1(24); while the oxy-steam gasification allowed to reach the highest values up to 0.86 (MO1(23/28)). The net efficiencies followed the same trends but with lower values of 3.7% when using 0.26 kg of steam/kg of biomass (MO1(23/28)) as the production of steam require 3.4% of the LHV available in M (or 3.8% in N). However, supplying steam as co-gasification agent significantly improved the H2 yield and the H2/CO ratio by direct gasification of char and the WGS (NO1(28/23) vs. NO2(28/28) and MA2(24/28) vs. MAS1(24)). Moreover, the addition of steam prevented local overheating mainly near the grate where there is high ash concentration; this avoided ash melting and allowed to tune the thermal profile along the reactor ensuring favorable kinetics and equilibria of the endothermic water gas and Boudouard reactions. Comparing the process yields between M and N at the closest gasification conditions some differences were pointed out. The production of CO2 as well as the CLE were higher for M than for N (test MAO(27/23) vs. NO1(28/23) and MA3(22/18) vs. NA3(22/18). These findings could be explained by the higher reactivity of M and higher pyrolysis yields that were already highlighted in TGA and explained in terms of different chemical composition. The content of potassium in M was higher than in N (0.35% vs. 0.26%, see Table 1); the catalytic effect of this alkaline metal on combustion and gasification by oxygen-transfer is well known. Biochemical composition revealed the higher content of hemicellulose and cellulose in M that was also envisaged from the ratio C/O calculated by elemental composition analysis.

4. Conclusions

Almond and hazelnuts shells were easily gasified in updraft mode up to the highest conversion degrees because of their low fines content and high permeation of the oxidant gases through the reactive bed. The composition of the obtained syngas could be varied by changing air and steam flows and response surface analysis was able to show functional dependences on ER(O2) and ER(H2O); in particular when steam was added in an optimized ER(H2O), the H2 content increased and the ratio H2/CO reached the significant value of 1.0. Steam also helped for the operational management of the plant by contributing to the temperature control in the lowest zones of the reactor where ash melting is a well-known problem. The cold gas efficiency ranged between 53% and 76% depending on the syngas output (CGE), while the content of condensable organics corresponded to an energy conversion of 11–25% (CLE). The higher content of carbohydrate in M compared to N caused a larger production of organic volatiles through pyrolysis reactions as showed in TGA and confirmed by the correspondent higher yield of tars resulting in the plant gasification tests. The tar yields for M and N were inversely correlated with the residence time of the syngas and explained with a sequence of condensation and cracking inside the reactive bed producing incondensable hydrocarbons and H2.

Author Contributions

The authors equally contributed to the work.

Funding

This research was funded by EU within the project Brisk and Brisk2, Grant 284498 and grant 731101.

Acknowledgments

The authors thank Colomba Di Blasi of the University of Naples for the useful discussion of the experimental data. Maria A. Cerone is gratefully acknowledged for the revision of the manuscript.

Conflicts of Interest

The authors declare no conflict of interest.

References

  1. Schulz, H. Short history and present trends of Fischer–Tropsch synthesis. Appl. Catal. A 1999, 186, 3–12. [Google Scholar] [CrossRef]
  2. Ke, L.; Song, C.; Subramani, V. Hydrogen and Syngas Production and Purification Technologies; John Wiley & Sons: Hoboken, NJ, USA, 2009; Volume 104, pp. 113–119. ISBN 978-0-471-71975-5. [Google Scholar]
  3. IEA. Key World Energy Statistics. 2017. Available online: https://www.iea.org/publications/freepublications/publication/KeyWorld2017.pdf (accessed on 4 April 2018).
  4. Cerone, N.; Zimbardi, F.; Contuzzi, L.; Prestipino, M.; Carnevale, O.; Valerio, V. Air-steam and oxy-steam gasification of hydrolytic residues from biorefinery. Fuel Process. Technol. 2017, 167, 451–461. [Google Scholar] [CrossRef]
  5. Elliott, D.C.; Neuenschwander, G.G.; Hart, T.R.; Rotness, L.J.; Zacher, A.H.; Santosa, D.M.; Valkenburt, C.; Jones, S.B.; Tjokro Rahardjo, S.A. Catalytic Hydrothermal Gasification of Lignin-Rich Biorefinery Residues and Algae Final Report; Pacific Northwest National Laboratory (PNNL): Richland, WA, USA, 2009.
  6. Prins, M.J.; Ptasinski, K.J.; Janssen, F.J. From coal to biomass gasification: Comparison of thermodynamic efficiency. Energy 2007, 32, 1248–1259. [Google Scholar] [CrossRef]
  7. Brage, C.; Yu, Q.; Chen, G.; Sjöström, K. Tar evolution profiles obtained from gasification of biomass and coal. Biomass Bioenergy 2000, 18, 87–91. [Google Scholar] [CrossRef]
  8. Galvagno, A.; Prestipino, M.; Zafarana, G.; Chiodo, V. Analysis of an integrated agro-waste gasification and 120 kw SOFC CHP system: Modeling and experimental investigation. Energy Procedia 2016, 101, 528–535. [Google Scholar] [CrossRef]
  9. Dimitriou, I.; Goldingay, H.; Bridgwater, A.V. Techno-economic and uncertainty analysis of Biomass to Liquid (BTL) systems for transport fuel production. Renew. Sustain. Energy Rev. 2018, 88, 160–175. [Google Scholar] [CrossRef]
  10. Vera, D.; Jurado, F.; Torreglosa, J.P.; Ortega, M. Biomass Gasification for Power Generation Applications: A Modeling, Economic, and Experimental Study. In Advances in Renewable Energies and Power Technologie; Elsevier: New York, NY, USA, 2018; pp. 87–121. [Google Scholar]
  11. Loha, C.; Karmakar, M.K.; De, S.; Chatterjee, P.K. Gasifiers: Types, Operational Principles, and Commercial Forms. In Coal and Biomass Gasificatio; Springer: Singapore, 2018; pp. 63–91. [Google Scholar] [CrossRef]
  12. Ding, L.; Yoshikawa, K.; Fukuhara, M.; Kowata, Y.; Nakamura, S.; Xin, D.; Muhan, L. Development of an ultra-small biomass gasification and power generation system: Part 2. Gasification characteristics of carbonized pellets/briquettes in a pilot-scale updraft fixed bed gasifier. Fuel 2018, 220, 210–219. [Google Scholar] [CrossRef]
  13. Kurkela, E.; Simell, P.; Stǻhlberg, P.; Berna, G.; Barbagli, F.; Haavisto, I. Development of Novel Fixed-Bed Gasification for Biomass Residues and Agrobiofuels; VTT Research Notes; VTT Technical Research Centre of Finland: Espoo, Finland, 2000; ISBN 951-38-5757-3. [Google Scholar]
  14. James, R.A.M.; Yuan, W.; Boyette, M.D. The Effect of Biomass Physical Properties on Top-Lit Updraft Gasification of Woodchips. Energies 2016, 9, 283. [Google Scholar] [CrossRef]
  15. Rios, M.L.V.; González, A.M.; Lora, E.E.S.; Del Olmo, O.A.A. Reduction of tar generated during biomass gasification: A review. Biomass Bioenergy 2018, 108, 345–370. [Google Scholar] [CrossRef]
  16. Narváez, C.R.A.; Blanchard, R.; Dixon, R.; Ramírez, V.; Chulde, D. Low-cost syngas shifting for remote gasifiers: Combination of CO2 adsorption and catalyst addition in a novel and simplified packed structure. Energies 2018, 11, 311. [Google Scholar] [CrossRef]
  17. Daniell, J.; Köpke, M.; Simpson, S.D. Commercial biomass syngas fermentation. Energies 2012, 5, 5372–5417. [Google Scholar] [CrossRef]
  18. Molitor, B.; Richter, H.; Martin, M.E.; Jensen, R.O.; Juminaga, A.; Mihalcea, C.; Angenent, L.T. Carbon recovery by fermentation of CO-rich off gases–turning steel mills into biorefineries. Bioresour. Technol. 2016, 215, 386–396. [Google Scholar] [CrossRef] [PubMed]
  19. Cerone, N.; Zimbardi, F.; Villone, A.; Strjiugas, N.; Kiyikci, E.G. Gasification of wood and torrefied wood with air, oxygen, and steam in a fixed-bed pilot plant. Energy Fuels 2016, 30, 4034–4043. [Google Scholar] [CrossRef]
  20. Sánchez-Pérez, R.; Ortega, E.; Duval, H.; Martínez-Gómez, P.; Dicenta, F. Inheritance and relationships of important agronomic traits in almond. Euphytica 2007, 155, 381–391. [Google Scholar] [CrossRef]
  21. Cristofori, V.; Ferramondo, S.; Bertazza, G.; Bignami, C. Nut and kernel traits and chemical composition of hazelnut (Corylus avellana L.) cultivars. J. Sci. Food Agric. 2008, 88, 1091–1098. [Google Scholar] [CrossRef]
  22. Dogru, M.; Howarth, C.R.; Akay, G.; Keskinler, B.; Malik, A.A. Gasification of hazelnut shells in a downdraft gasifier. Energy 2002, 27, 415–427. [Google Scholar] [CrossRef]
  23. Rapagna, S.; Latif, A. Steam gasification of almond shells in a fluidised bed reactor: The influence of temperature and particle size on product yield and distribution. Biomass Bioenergy 1997, 12, 281–288. [Google Scholar] [CrossRef]
  24. Rapagna, S.; Jand, N.; Kiennemann, A.; Foscolo, P.U. Steam-gasification of biomass in a fluidised-bed of olivine particles. Biomass Bioenergy 2000, 19, 187–197. [Google Scholar] [CrossRef]
  25. Zimbardi, F. Evaluation of Reaction Order and Activation Energy of Char Combustion by Shift Technique. Combust. Sci. Technol. 2000, 156, 251–269. [Google Scholar] [CrossRef]
  26. Zhang, Y.; Ashizawa, M.; Kajitani, S.; Miura, K. Proposal of a semi-empirical kinetic model to reconcile with gasification reactivity profiles of biomass chars. Fuel 2008, 87, 475–481. [Google Scholar] [CrossRef]
  27. Feng, D.; Zhao, Y.; Zhang, Y.; Sun, S.; Gao, J. Steam Gasification of Sawdust Biochar Influenced by Chemical Speciation of Alkali and Alkaline Earth Metallic Species. Energies 2018, 11, 205. [Google Scholar] [CrossRef]
  28. Saddawi, A.; Jones, J.M.; Williams, A.; Wojtowicz, M.A. Kinetics of the thermal decomposition of biomass. Energy Fuels 2009, 24, 1274–1282. [Google Scholar] [CrossRef]
  29. Cheng, K.; Winter, W.T.; Stipanovic, A.J. A modulated-TGA approach to the kinetics of lignocellulosic biomass pyrolysis/combustion. Polym. Degrad. Stab. 2012, 97, 1606–1615. [Google Scholar] [CrossRef]
  30. Rabinovich, M.L.; Fedoryak, O.; Dobele, G.; Andersone, A.; Gawdzik, B.; Lindström, M.E.; Sevastyanova, O. Carbon adsorbents from industrial hydrolysis lignin: The USSR/Eastern European experience and its importance for modern biorefineries. Renew. Sustain. Energy Rev. 2016, 57, 1008–1024. [Google Scholar] [CrossRef]
  31. Demirbas, A. Effects of temperature and particle size on bio-char yield from pyrolysis of agricultural residues. J. Anal. Appl. Pyrolysis 2004, 72, 243–248. [Google Scholar] [CrossRef]
  32. Taba, L.E.; Irfan, M.F.; Daud, W.A.M.W.; Chakrabarti, M.H. The effect of temperature on various parameters in coal, biomass and CO-gasification: A review. Renew. Sustain. Energy Rev. 2012, 16, 5584–5596. [Google Scholar] [CrossRef]
  33. Fermoso, J.; Arias, B.; Plaza, M.G.; Pevida, C.; Rubiera, F.; Pis, J.J.; García-Peña, F.; Casero, P. High-pressure CO-gasification of coal with biomass and petroleum coke. Fuel Process. Technol. 2009, 90, 926–932. [Google Scholar] [CrossRef]
  34. Jayathilake, R.; Rudra, S. Numerical and Experimental Investigation of Equivalence Ratio (ER) and Feedstock Particle Size on Birchwood Gasification. Energies 2017, 10, 1232. [Google Scholar] [CrossRef]
  35. Saravanakumar, A.; Haridasan, T.M.; Reed, T.B.; Kasturi Bai, R. Experimental investigations of long stick wood gasification in a bottom lit updraft fixed bed gasifier. Fuel 2007, 86, 2846–2856. [Google Scholar] [CrossRef]
  36. Arena, U. Process and technological aspects of municipal solid waste gasification. A review. Waste Manag. 2012, 32, 625–639. [Google Scholar] [CrossRef] [PubMed]
  37. Tsai, W.T.; Liu, S.C.; Hsieh, C.H. Preparation and fuel properties of biochars from the pyrolysis of exhausted coffee residue. J. Anal. Appl. Pyrolysis 2012, 93, 63–67. [Google Scholar] [CrossRef]
  38. Cerone, N.; Zimbardi, F.; Contuzzi, L.; Alvino, E.; Carnevale, O.; Valerio, V. Updraft Gasification at Pilot Scale of Hydrolytic Lignin Residue. Energy Fuels 2014, 28, 3948–3956. [Google Scholar] [CrossRef]
  39. Czernik, S.; Bridgwater, A.V. Overview of applications of biomass fast pyrolysis oil. Energy Fuels 2004, 18, 590–598. [Google Scholar] [CrossRef]
Figure 1. Updraft gasifier scheme.
Energies 11 01280 g001
Figure 2. Thermogravimetric analysis of almond shells (M) and hazelnut shells (N): (a) Degree of conversion (X) vs. Temperature in air and O2; (b) Degree of conversion (X) vs. Temperature in N2; (c) Specific conversion rate in air and O2; (d) Specific conversion (pyrolysis) rate in N2.
Energies 11 01280 g002
Figure 3. Thermal profile inside the gasifier in the gasification of hazelnut shells (N): (a) Temperatures measured in selected tests along the vertical axis (z); (b) Heating rate of the particles moving downward.
Energies 11 01280 g003
Figure 4. Thermal profile inside the gasifier in the gasification of almond shells (M): (a) Temperatures measured in selected tests along the vertical axis (z); (b) Heating rate of the particles moving downward.
Energies 11 01280 g004
Figure 5. Thermal profile inside the gasifier in the gasification of almond shells (M): (a) Thermal gradients; (b) 3D plot of the maximum temperature in the bed.
Energies 11 01280 g005
Figure 6. Composition of clean syngas (CnHm is the sum of CH4, C2H6, C3H8).
Energies 11 01280 g006
Figure 7. Yield of H2 and CO as function of the equivalence ratio ER(O2) and ER(H2O) for hazelnut shells.
Energies 11 01280 g007
Figure 8. Yield of H2, CO and H2/CO ratio as function of the equivalence ratio ER(O2) and ER(H2O) for almond shells.
Energies 11 01280 g008
Figure 9. Organic volatiles at the exit of the updraft reactor in the gasification of almond shells (M) and hazelnut shells (N) with air (blue bars) and oxygen (orange bars); (a) Gravimetric tar contents per unit of conditioned syngas volume (method CEN TS 15439); (b) Tar yields referred to the dry feedstock.
Energies 11 01280 g009
Figure 10. Gasification of hazelnut shells (N): (a) Yield of tar and (b) Incondensable hydrocarbons +H2 concentration as function of the residence time of the syngas in the bed.
Energies 11 01280 g010
Figure 11. Gasification of almond shells (M): (a) Yield of tar versus ER(O2); (b) Yield of syngas versus ER(O2); (c) Yield of incondensable hydrocarbons versus the average temperature of the bed.
Energies 11 01280 g011aEnergies 11 01280 g011b
Figure 12. Gasification of hazelnut shells (N): (a) 3D plot of efficiency of energy conversion in the gasification as function of the equivalence ratio ER(O2) and ER(H2O); (b) 3D plot of thermal power of the plant as function of the equivalence ratio ER(O2) and ER(H2O); (c) Cold Gas Efficiency (CGE) and the corresponding net values; (d) Cold Liquid Efficiency (CLE) and the corresponding net values.
Energies 11 01280 g012aEnergies 11 01280 g012b
Figure 13. Gasification of almond shells (M): (a) Efficiency of energy conversion in the gasification; (b) Thermal power of the plant.
Energies 11 01280 g013
Table 1. Characteristics and properties of the agroresidues.
Almond Shells (M)Standard DeviationHazelnut SHELLS (N)Standard DeviationMethod
Bulk density, kg/m3417299ASTM E873
HHV MJ/kg19.50.119.40.1ISO 1928
LHV a, MJ/kg18.10.117.80.1
Moisture b, %11.85
Fix carbon, %18.20.220.90.4ASTM D 3172
Volatile, %80.60.2780.4ASTM D 3175
Ash, %1.20.011.10.01ASTM D 1102 (600 °C)
Hexosans %31.20.822.20.7NREL/TP-510-42623
Pentosans %28.00.812.20.1NREL/TP-510-42623
Lignin (Klason)%30.20.340.90.5TAPPI 13M-54
Lignin (Klason) ac. sol. %1.980.11.30.1TAPPI T250
C %47.90.150.50.1UNI EN 15104
H %6.30.26.640.05UNI EN 15104
N %0.360.051.70.4UNI EN 15104
O c %45.440.0
Cl %nd0.0250.005UNI EN 15289
S (ppm)145425040UNI EN 15289
Si (ppm)484401066CEN/TC 343
Al (ppm)67.53.7544CEN/TC 343
Fe (ppm)11366038030CEN/TC 343
Ca (ppm)94126301995CEN/TC 343
K (ppm)35132002560120CEN/TC 343
Mg (ppm)1642422910CEN/TC 343
Na (ppm)nd<53CEN/TC 343
P (ppm)nd16210CEN/TC 343
Ni (ppm)63.30.7465CEN/TC 345
Cr (ppm)nd789CEN/TC 345
Mn (ppm)13.40.6232CEN/TC 345
Zn (ppm)26.10.64.50.3CEN/TC 345
Pb (ppm)nd<2.2CEN/TC 345
Cu (ppm)9.40.17.40.3CEN/TC 345
Mo (ppm)8.60.1ndCEN/TC 345
Co (ppm)nd<2.19CEN/TC 345
Cd (ppm)nd<2.19CEN/TC 345
H/C, mol/mol1.581.58
O/C, mol/mol0.710.59
H2O for oxidation, kg/kg0.931.06
O2 for combustion, kg/kg1.331.40
Air for combustion, kg/kg5.756.08
a Calculated from HHV and H content; b As arrived; c By difference: 100 − (ash + C% + H% + N%).
Table 2. Main reactions of gasification.
ReactionStoichiometryEnthalpy
CombustionC(grafite) + O2 ↔ CO2∆H = −393.5 kJ/mol
Partial combustionC(grafite) + ½ O2 ↔ CO∆H = −110.5 kJ/mol
Bouduard reactionC(graphite) + CO2 ↔ 2CO∆H = 172.6 kJ/mol
Water gas reactionC(grafite) + H2O ↔ CO + H2∆H = 131.4 kJ/mol
Thermal crackingCnHx ↔ nC + (x/2)H2for n = 1, ∆H = 74.9 kJ/mol
Steam reformingCH4 + H2O ↔ CO2 + 3H2∆H = 206 kJ/mol
Water Gas ShiftCO + H2O ↔ CO2 + H2∆H = −41.2 kJ/mol
C-MethanationC + 2H2 ↔ CH4∆H = −78.84 kJ/mol
CO-MethanationCO + 3 H2 ↔ CH4 + H2O∆H = −206 kJ/mol
CO2-MethanationCO2 + 4 H2 ↔ CH4 + 2 H2O∆H = −165 kJ/mol
ReformingCnHx + mH2O ↔ nCO +(m + x/2)H2
Table 3. Test coding of shells gasification: experimental parameters; calculated Equivalence Ratios, average temperature of the fixed bed, calculate residence time of the gas in the bed.
Experiment Code aOxidantFeeding Rate kg dry /hParticle Residence Time, hAir kg/hO2 kg/hER (O2) kg/kgSteam kg/hER (H2O) kg/kgAverage T in Bed, °CGas Residence Time b, s
MAS1(24)Air12.42.8116.700.2400.007676.2
MAS2(24)Air21.21.6428.800.2400.007613.6
MA1(22/24)Air and steam22.41.5528.900.2250.247013.1
MA2(24/28)Air and steam21.21.6429.800.245.50.287412.8
MA3(22/19)Air and steam22.41.5529.000.2240.197153.2
MA4(24/25)Air and steam22.11.5731.000.245.20.257582.7
MA5(25/30)Air and steam21.61.6031.500.2560.307392.7
MO1(23/28)Oxigen and steam21.21.640.06.50.235.50.287486.5
NA1(19/28)Air and steam16.31.5218.900.194.80.287034.7
NA2(24/22)Air and steam20.41.2229.300.244.80.227603.3
NA3(22/18)Air and steam20.41.2227.100.2240.187133.6
NO1(28/23)Oxigen and steam20.41.220.080.2850.237686.9
NO2(28/28)Oxigen and steam20.41.220.080.2860.287146.7
MAO(27/23)Enric. air and steam21.21.649.15.50.274.50.238064.6
a Example for reading of the Table 3: MA1(24/28) means that test 1 of almond shells gasification was carried out with air at ER(O2) 0.24 and steam at ER(H2O) 0.28; b The average residence time of the gas inside the bed was calculated considering the average temperature of the bed, its void fraction as calculated from the bulk density (Table 1), a true density of lignocellulosics of 1530 kg/m3 [37] and the average molar flow of reactants and syngas (Table 4).
Table 4. Process yields and plant performances.
Experiment CodeH2g/kgCOg/kgCO2 g/kgCnHm g/kgSyngas a STP m3/kgLHW MJ/m3Density kg/STPm3CGE %Net CGE %CLE %Net CLE %Plant Power b kW
MAS1(24)15635451401.785.760.985757111135
MAS2(24)18615360341.795.621.115656131359
MA1(22/24)28508306221.715.591.195351272759
MA2(24/28)39548213292.095.561.056462131368
MA3(22/19)26578371241.616.321.185655282763
MA4(24/25)36630643342.036.101.116966151476
MA5(25/30)40564273262.105.621.096563111171
MO1(23/28)35580479371.1510.41.106664201970
MAO(27/23)26704595311.398.461.106563191869
NA1(19/28)25564403551.776.431.146461191852
NA2(24/22)26673342391.886.370.956664252468
NA3(22/18)29699265242.015.901.096664232267
NO1(28/23)36744348331.2311.00.917673171777
NO2(28/28)40691259231.2210.61.107370191874
a Conditioned and dry; b As thermal output in clean syngas.

