Abstract
In our paper we examine the economics of a technological process which utilizes the separated biogas plant digestate as the primary material and, as auxiliary material, the waste heat produced by the cogeneration process, to produce a marketable pellet which can be used in two ways (to supply soil nutrients and heat energy). Using multivariate linear regression model we developed an equation for the biogas yield from the modelled production recipe and expected nutrient pellet prices, and sensitivity analysis were also performed for the substrate dry matter content. We found that pellets can be produced at a cost of 88–90 EUR/ton with a 6 to 10% dry matter substrate content and that, primarily, sales of pellets for heating justify pelleting; producer’s own use and use for nutrient purposes can only be justified in exceptional cases. In the case of dry solid content above 5%, the process does not require the total amount of waste heat; some of this can be used to cover other heat requirements.
1. Introduction
The planned targets of the European Union (EU) for 2020 are aimed at reducing emissions of harmful gases and, in addition to increasing efficiency, promoting the production of renewable energy sources. Among renewables, the number of biogas plants in the EU has already exceeded 17,000 and their number has grown dynamically over the past few years [1]. The longer-term goals of the EU are even more ambitious: by 2030, a 40% reduction of greenhouse gases (GHGs) is projected compared to 1990, and a 27% reduction compared to 2021 [2]. This objective is unattainable without a significant increase in renewable energy consumption, of which biomass accounts for 45% in the EU and almost 90% in Hungary [3]. The most dynamically growing segment of biomass-based heat (possibly electricity) production is the use of heating pellets.
At present, most biogas plants are equipped with combined heat and power (CHP), but the use of heat generated by gas engines (especially in the summer) is problematic, and its improvement is of decisive importance in environmental and economic terms. In addition, the 35–40% efficiency gains from the production of green electricity can be increased up to 40–50% with the use of waste heat, which can result in a 85% overall efficiency of CHP units [4,5]. This is more doubtful in larger plants, but if it is achieved, it will increase the corresponding plant size and is closely linked to the improvement of the break-even point [6]. Typical heat utilization areas in the biogas plant include: fermentation heating, hygiene, and biogas upgrading and, according to Lindkvist et al. (2017), the typical proportions for these areas are 62%, 37% and 1% respectively [7]. Upgrading biogas is the only technological option for eliminating waste heat generation which also helps to improve the calorific value and marketability of biogas [8].
In agricultural biogas plants, where much of the feedstock is derived from liquid manure from animal breeding (with typically less than 10% dry matter content), wet processes and mesophilic fermentation are used most often in Europe [9], while fermentation technology based on psychrophilic conditions has a decisive role among agricultural digesters globally, mainly in developing countries [10,11,12]. The latter (psychrophilic) technology typically operates without artificial heating and at a low cost level, but our present research focuses on those plants which are dominant in the developed countries under moderate climatic conditions, so we analyze later only these types of biogas factories. Hydraulic retention time (HRT) is typically less than 30 days in mesophilic conditions, when using a high proportion of manure and few energy crops [13,14].
This paper examines the economics of a technological process using the separated biogas plant digestate and as auxiliary material the waste heat from the cogeneration process to produce a marketable pellet, which can also be used in two ways (soil nutrient supply and thermal energy utilization). As a basic case, we consider the actual technological parameters of a biogas plant in Hungary, which can be considered typical in the literature, but our results can be used in other operating conditions with our sensitivity analyses.
2. Literature Review
2.1. The Characteristic Technological Parameters of Cogeneration Biogas Plants and the Resulting End Products
While the economical aspect of biogas production can be most easily improved by increasing the organic load [15] or by optimizing the recipe [16], the use of waste heat also significantly influences operational results.
Onthong–Juntarachat (2017) investigated the biogas yield of five different plant-derived by-products in mesophilic conditions with 15–35 days of hydraulic residual time, resulting in three of the five feedstocks having the highest biogas yield at a 25-day residual time, and two at a time of 15 and 30 days [17]. In Aramrueang et al.’s (2016) examination algae substrate (Spirulina (Arthrospira) platensis) received the highest yield of biogas and biomethane at 25 days of HRT and 1.0 (g VS) L−1 d−1 OLR (0.342 and 0.502 L (g VS)−1, respectively) [18]. At the same time, due to economic considerations it may be advisable to increase the organic loading rate (OLR), the economic optimums in the same experiments of 2.0 (g VS) L−1 d−1 OLR and 25 d HRT were recommended for achieving biogas and methane yields of 0.313 and 0.490 L (g VS)−1, respectively. It should be noted, however, that the heat demand and investment requirement of biogas production from algae is significantly higher than that of traditional biogas feedstocks [19] and can be limited by the low C/N ratio of high protein content algae species which may lead to ammonia inhibition [18].
Typically, 90% of the energy produced in CHP units can be utilized, 35–40% of which is electricity and 50–55% heat energy. On average, however, 25 to 30% of the total heat produced is used to heat fermenters in biogas plants which use mesophilic technology (37–43 °C fermentation temperature) [20,21,22]. It is advisable to divide the heating of the fermenters into summer and winter periods, as in the summer 25 kWh of heat is needed to heat up a ton of incoming substrate, while in winter this figure is 36 kWh. On the basis of other results, a 1 MW capacity biogas plant generates an average of 1000 kWh of heat per day, of which 250 kWh in winter and 100 kWh of heat in summer is needed to heat the fermenters at 38 °C, i.e., using 25% and 10% of the generated heat energy [23,24,25]. The seasonal fluctuations in its own heat consumption play a significant role in the fact that a total heat utilization solution is quite problematic, since in the case of heat utilization the heat generated during the summer period is lost, and so the technological (daily evenly uniform) use of waste heat available in different amounts in winter and summer makes the purchase of external heat energy necessary. In theory, the pelleting we examine can (with the right quantity of raw materials) be used to solve total heat utilization, because the raw material to be pelletized (the solid phase of the separated organic fertilizer) and the final product (the pellet) can both be stored well.
The use of waste heat is one of the most effective solutions for sustainable heat utilization. Among the many alternative uses for biogas plants—such as heating of buildings, greenhouses, aquaculture installations, absorption cooling or crop drying—separated fermentation drying is a process which can be carried out throughout the year, so that a substantial part of the generated waste heat can also be used for agricultural purposes [20].
Biochars (including digestate pellets) can be considered a promising material for the continuously developing biogas purification industry, especially when CO2 and H2S are successfully captured [26].
One of the major challenges for biogas plants is the utilization of circulated fermentation liquid for agricultural use, since nutrient supply in the EU is restricted to a limited amount (typically 170 kg N/ha/year) and can only be carried out over a specified period [27]. At the EU level the relevant regulatory framework is provided by the Nitrate Directive (91/676/EEC). In addition, transport to nutrient-poor areas and the typical half year storage period can have a very negative impact on the profitability of bio-fertilization [28,29].
The organic content of the organic matter introduced, however, is significantly reduced during anaerobic fermentation. Digestate can contain 50–80% less TS compared to the incoming substrate [30], and the organic part of the TS content of digestate can be up to 70%. Oenema and Tamminga (2005) found that 55–95% of N (nitrogen) and large proportions of phosphorus (P) and potassium (K) in animal diets were excreted [31]. Animal herbs and slurries are accordingly rich in plant nutrients.
2.2. Potential Markets for Pellet Production
For the production of a marketable product, biogas plants need to conduct further stages of processing (such as separation, drying, pelleting), following which fermentation sludge can be directly used for nutrient supply, bedding material or even burning [28,32].
All these workflows, combined with the costs of storage, shipping, or delivery, result in significant investment and operating costs due to the large amount of material and low nutrient content. A study conducted by the Association for Technology and Structures in Agriculture (KTBL) (Darmstadt, Germany) [33] considered a model biogas plant (50% manure and 50% corn silage) with an electrical capacity of 500 kWe and an annual digestate production of 30,000 m³ and investigated 6 differential digestate management models. The results showed that the specific net cost varied from 1.94 €/m3 (direct land application) to 6.80 €/m3 (separation using a screw press before dehydrating the solids with a belt dryer) [34]. Due to the multiple cost increases, further processing of organic fertilizer can be recommended mainly for sales purposes and when there is a significant quantity of the producer’s own waste heat.
2.2.1. A Possible Market for Heating Pellets
A heating pellet is pressed at high pressures, and mostly held together by its own material. Due to the strict standards, its heat value depends mainly on the raw material used: wood pellets average 18.5 MJ/kg, while agripellets typically have a calorific value of 16.5 MJ/kg. In terms of the ash content, the difference is even greater, with wood pellets having 0.5–1%, and agripellets 7.5–11% [35]. The bio-fertilizer pellet we tested was similar to the latter value.
In 2016, of all pellets worldwide, the EU produced half (14.8 MMT (million metric tons)), but used 75% (22.2 MMT), of which about one third (6.4 million tons) were imported [36]. Both home produced and imported pellets must comply with sustainability requirements [2]. The total utilization of production capacities is 76%, with Germany the largest producer accounting for 57% of the total. In Hungary, pellets are produced in a small quantity (about 5000 t/year). The largest consumers are the United Kingdom (2016: 7.3 MMT) and Italy (2016: 3.4 MMT). The latter country also has the highest proportion of imports.
Households and small public institutions (e.g., hospitals, swimming pools) currently dominant pellet use, but in the near future, with the tightening of environmental regulations, the role of heating pellets in power plant use will also increase in co-firing, mainly for coal substitution [37]. Power plant utilization is not expected to require new pellet plants, but can be achieved by better utilizing existing capacities.
By 2020, a further dynamic growth in use in the EU (mainly due to power plant use) is expected, with use predicted to reach up to 28 million tons. The widespread use of organic fertilizer pellets could also help reduce import expenditures, which in 2016 accounted for expenditure of 920 million euros just to the USA. Prices in 2015 in the EU are typically around 228–240 €/t, while the price of imported pellets is considerably lower (2016: 188 €/t, [38]). The most important competitor to the pellet is natural gas (12–20 €/GJ) in the domestic sector, wood waste in smaller public institutions (19 €/t) and wood pulp (25 €/t) in the power plant sector [35]. By 2020, the EU’s current 60 ML of cellulose-based bioethanol production capacity is expected to grow to 200 ML, which may also bring significant demand to the European pellet and wood chip markets [39].
In summary, the spread of fermentation sludge pelleting technology and the use of the end-product for heating fuels can, in the long run, contribute to meeting the renewable energy, environmental, or new generation fuel targets of the EU’s Renewable Energy Directive (2009/28/EC).
2.2.2. The Market for Upgraded Organic Manures
Managing the biogas origin of digestate products and especially their marketization is one of the major challenges for the biogas sector because of the large quantity involved and the variable fertilizer value.
Almost all (95%) of the digestate produced in the EU is used for soil management purposes, as an organic fertilizer on cropland [40]. Direct application on the producer’s own land is typically the best option [41], because of savings on nutrient purchases and improvements in soil quality [42]. Because of the upgrading technologies and the developing markets, less than 3% of the digestate is currently being upgraded to different products.
Solid digestate (compost and pellets) has wider possibilities for the non-agricultural market, unlike fluid digestate. 17 percent of the solid digestate was sold to private gardeners and soil manufacturers, while in the case of liquid digestate, the proportion sold to conventional and organic farmers was 99% [43].
However if the density of livestock farming and biogas plants is huge, this can result in a scarcity of land for digestate and lead to high land rental prices.
Currently pellet prices vary between 0–200 €/t, while digestate pellets are usually sold at an average price of 20 €/t, but can have a fertilizer value of 90 €/t. Prices depend mainly on the packaged amount, the content and the season. In the case of plant soil for domestic use, a 9 €/L shelf price can also be reached, but increasing prices do not automatically result in higher margins, due to other costs emerging related not only to manufacturing, but to packaging and marketization, too.
Digestate as raw material, with mid-level Nitrogen-Phosphorus-Potassium (NPK) values could be an optimal solution for most home gardeners who over-fertilize [44].
All in all, the factors which can be considered an advantage when selling organic fertilizer pellets are; bionutrients, upgradability (organic farming) and new applications. The disadvantages are, above all, marketing barriers including transport costs and negative perceptions by customers [32].
2.3. Technological Processes of Biogas Fuel Pellet Production
The first step in the processing of the fermentation sludge is separation, during which the solid and liquid fractions are separated. Various separation methods can be used with mechanical means such as decanting centrifuges or screw separators [45].
According to Bauer et al.’s (2009) data, the mass of the starting material after separation was 79.2% liquid and 20.8% solid, but the total dry matter was 61.8% in the solid fraction [46]. In addition, according to Möller et al. (2010), the amount of solid separated mass makes up 22.5% of the starting material after separation [47].
During the separating operation, a solid fraction of 0.5–2% liquid matter and 25–35% dry matter is formed [48]. Similar results have been presented by Möller et al. (2002) [49] and Tambone et al. (2017) [50], since after separating the 4–6% dry matter content fermentation liquid, a solid separation of 30–32% dry matter is produced, with a volume of 0.5 t/m3 [51].
Tambone et al. (2017) investigated pig and cow liquid manure and fermentation sludge using different separators, on the basis of which it can be stated that the dry matter content of the feedstocks was between 3.74% and 6.37%, and during separation the share of the dry matter of the solid fraction increased to between 24.97% and 36.47%, increasing by an average of 25.4% relative to the starting material when using a screw press separator [50].
After separation, the solid phase is typically dried on a belt dryer at 70–80 °C during which the heat energy from the CHP plant passes through the belt and the material on it from bottom to top in the form of hot air. During the drying, the specific heat energy required to extract one ton of water is 1–1.1 MWh [25,52].
2.4. Ingredients and Fertilization Effects of Separated Biodiesel
According to Awiszus et al. (2018) [53], after drying the separated fermentation liquid with its 24% dry matter content at 70–80 °C, it can provide as much as 91–93% dry matter content. However, during the process, total nitrogen content is reduced by 47–48%, ammonium nitrogen by 82–87%, phosphorus by 6–8%, and sulphur content by 6–12% in comparison with the separated material. After drying, the total nitrogen content in the dry matter is 1.5%, ammonium nitrogen is 0.2%, phosphorus is 1.0–1.1%, and potassium is 2.0–2.1%. Other results showed a higher value in the pelletized final product since the ratio of nitrogen in the dry matter was 1.5–2.9%, the phosphorus ratio was 1.1–1.3%, while the ratio of potassium was 1.4–1.6% [54].
Vanden Nest et al. (2015) [55] investigated the use of different fertilizer types in comparison with four different inorganic fertilizer cultures. Two dried fermentation residues were also used among the manure types, derived from organic waste, energy crops and fermented liquid animal manure. On the basis of the results, after drying the fermentation residue is suitable for use as nutrient replenishment, and without loss of yield to replace fertilizers and liquid cow manure.
Thomas et al. (2017) investigated not only organic fertilizer, matured fermentation liquid, and solid separated matter, but also supplemented this with the already pelletized fermentation residue, during which the effects of the individual fertilizer pulp on autumn barley were measured for four years. On the basis of their results, during the fermentation and processing, the material undergoes substantial internal changes in content until it becomes pellet. The dry matter content increased by an average of 50% in relation to the mature fermented liquid, and the total amount of carbon in the dry matter by 4%. By contrast, the total nitrogen content is reduced by 42%, the proportion of ammonium nitrogen by 90% and the total phosphorous content by 44%. Based on the yields of autumn barley, the yield of the plant treated with fermented liquid exceeded the yield of other barley treated with manure by 30–50%. In the case of pellets, the yield was only 4.5% lower than that of organic fertilizers. Nitrogen absorption was the lowest in the case of pellets, at only 2%, while it was highest in the matured fermentation liquid, at 41%. In addition, it was argued that pellet from fermented sludge could be an effective, but slow-release nutrient source, while also providing carbon replenishment [56].
According to Ross et al. (2018), the pellet or granule derived from fermented sludge can improve the transportability and storage of the fermented liquid. They found that products derived from fermented sludge treated in different ways (composted, pelletized and granulated) only slowly break down during nutrient supply and the release of nutrients is low, especially for nitrogen. The effect of fertilizer on plant growth was observed only after the first week after application. On this basis, the nutritional utility of the processed fermented sludge should be considered limited, irrespective of the actual nutrient content. However, the previously mentioned fertilizers, as a result of increasing carbon content, are well suited to improving the humus content of soil poor in organic matter [57].
Ball et al. (2004) also found that pelletizing is a useful method for preserving the nutrient content of organic materials and that nitrogen is slowly and permanently released during application of the organic fertilizer pellet [58].
In relation to the fattening of growing broiler chickens, Hammac et al. (2007) [59] formulated the problems of the disposal and utilization of manure, the solution to which could be pelleting, given that while the application of bedding fertilizer is economical only to a certain extent, pelleting increases bulk density, particle size uniformity and economical delivery distance. This can reduce pressure in areas where large amounts of fertilizer can cause nutrient and heavy metal contamination, similar to fermented sludge. In the investigation of pellets from poultry manure, it was found that the nitrogen and phosphorus uptake of different plants is lower than with inorganic nitrogen and phosphorus fertilizer. Dry biomass production from pellets was lower than from ammonium nitrate, but showed similarity to calcium phosphate. Finally, it can be stated that the pelletized broiler litter can serve primarily as nitrogen and phosphorus fertilizer, but its nutrient content and supply do not match that of inorganic fertilizers.
Table 1 shows pellets derived from different fermented organic fertilizers, which show that they typically have a lower proportion of dry matter, nitrogen and phosphorus content, and a higher proportion of ammonium-N than poultry fertilizers.

Table 1.
Characteristics of different types of digestate and poultry pellets.
2.5. Properties of Heating Pellets Made from Separated Organic Fertilizer
Shirani and Evans (2012) carried out studies on the drying and pelleting of the fermentation residue, which found that a combustible product from cattle liquid manure could be produced. The moisture content of the pellet produced was 9.9% and the amount of organic dry material was 74.6%. The ash content of the entire combustion process was 5.4%, while the gross calorific value was 17.6 MJ/kg. During the combustion, there was some smoke, unpleasant smell or slag, at different intensities of boiler operation. Their investigations were supplemented with others into additional fuels, in which the fermented separated solid matter was mixed into different biomass combinations, with the results for combustion of the solid separated matter, bovine liquid manure and sawdust shown in Table 2. It was found that the separated matter from anaerobic fermentation could serve as a raw material for high quality pellets. Their calorific values and mechanical durability are similar to softwood pellets [61].
Table 2.
Characteristics of different pellet types.
On the basis of Kratzeisen et al.’s (2010) [54] investigation, it can be said that pellets from biogas plant fermentation sludge can be used as heating fuel, as despite their high ash content, their physical and chemical properties were found to be adequate; these are also summarized in Table 2. In addition, the energy demand for pellet production (3.24 kWh/kg) did not exceed the value of the energy output (4.56–4.81 kWh/kg), so the pellet production energy balance is also positive.
3. Material and Methods
3.1. Introduction of the Model Biogas Plant and of the Utilized Feedstocks
The most important characteristic of the Hungarian cogeneration (637 kWe capacity) biogas plant we examined is that the majority of the substrate components are produced within the farm, thus ensuring continuous operation in the long run. Plant cultivation is currently carried out on 4000 hectares of arable land, and the basic objective of this activity is to provide the livestock and forage feed needs of the livestock sector, although it also participates in the fermentation process by providing a certain amount of maize silage and grass silage.
The livestock sector includes the dairy cattle sector with an average cow herd size of nearly 2000, while the pig breeding operation has 1200 breeding sows, and approximately 20,000 porkers are released annually. The types of fertilizer produced at the livestock farm provide more than 90% of the pellet ingredient, and there is also whey and dairy sludge from the nearby cheesery ready for disposal. The primary objective of the operation of the biogas plant is to manage these continuously generated, unmarketable and environmentally problematic by-products. In order to improve the fermentation processes, its own raw materials with a significant dry matter content (maize silage, grass silage, litter fertilizer) will also be used. The amount of raw materials used daily in the biogas plant recipe over the last 3 years is shown in Table 3. The HRT used corresponds to the 25 days considered typical of the mesophilic technique in the literature.
Table 3.
Daily feedstocks of biogas plant in different years.
Due to the available fermentation capacity and the applied organic matter load, the amount of substrate fed daily was relatively stable during the period examined (2015–2017), averaging between 174 and 183 m3. Its composition can be characterized by minor seasonal and annual changes (Table 3).
There is currently no built-in technology for the use of heat, which results in a low overall efficiency of the cogeneration unit. The utilization of the fermented liquid for agricultural purposes entails high costs (mainly during storage and transport), but further processing (separation, drying and pelleting) is also required for the production of a marketable product. The foregoing factors largely justify the introduction of pelleting for the efficient use of significant waste heat and the marketing of organic fertilizers.
3.2. Material Flow and Formulas Used in the Model
The process of treating the electricity and heat energy produced in the biogas plant and its related fermentation sludge is based on the quantities of the various substrate components (SQ1...n) and their specific dry matter (DM%1...n) and the organic content (OM%1...n), which are summarized in Table 4.
Table 4.
The quality of different raw materials.
The amount of daily substrate (SSd) and outflow fermented liquid (ADd), as well as the daily dry matter (DMd), the organic load (OMd), and the amount of organic matter contained in the raw material (SO1...n) used can be determined for all substrate components with the following formulas:
SSd = ∑SQ1 + SQ2, …, SQn and ADd = SSd
DMd = ∑(SQ1 × DM%1) + (SQ2 × DM%2), …, (SQn × DM%n)
OMd = ∑(SQ1 × DM%1 × OM%1) + (SQ2 × DM%2 × OM%2), …, (SQn × DM%2 × OM%n)
SO1 = SQ1 × DM%1 × OM%1
In the course of our analysis we used multi-variable linear regression calculations to determine the coefficients of the amount of raw material used in the various organic matter models. Using the database available, we investigated the most suitable model, based on the composition fed at different times (1–25 days). For this we applied R2 values of the functions and we examined the residue from the models. After comparing models with different dates, the 25-day feed model was selected (R2 = 0.412; F = 27.429; p < 0.001). For the parameters of this model, the absolute values of t-tests are 2.034–8.157; the p values are 0.001–0.043; the variance inflation factor values varied from 1.127 to 2.100. Residues showed a normal distribution, as the one-sample Kolmogorov-Smirnov test was not significant (p = 0.215). In our opinion, it was appropriate to use the values of this model in the simulation Excel model, and it suits the optimal HRT as measured by Onthong–Juntarachat (2017) [17] and Aramrueang et al. (2016) [18].
From the daily organic load, the biogas yield (BYd) can be determined and, using the two-variable regression equation (R2 = 0.938, F = 5257.247, p < 0.001), we estimated electricity production (EPd). The small difference between the biogas and the electricity volume may be due to the slight differences in biogas quality (methane content) at different periods.
The production of heat (WHd) was derived from all electricity used, which, on the basis of Rutz et al. (2015) [20], is 157% of the electricity produced (35% of the electricity produced, and 55%—the previous figure multiplied by 1.57—of the waste heat). The amount of waste heat available for pellet drying is calculated separately for winter and summer, as the amount of heat required to heat the fermenters is significantly different. In the winter (DHW) this was 36 kWh/tonne, and in the summer (DHS) 25 kWh/tonne, calculated with substrate specific values, according to Pullen’s (2015) data [24]. Based on the above, the equation used for the amount of biogas produced is:
BYd = 10879 − 1037 × SO1 − 1020 × SO2 + 135 × SO3 − 260 × SO4 − 168 × SO4 + 83 × SO5 + 1874 × SO6 − 3514 × SO7 − 718 × SO8
For the equation for the amount of green electricity produced, the t-values were 2.301 and 72.507 and the p values were <0.001 and 0.022. Residues showed a normal distribution, as the one-sample Kolmogorov-Smirnov test was not significant (p = 0.302):
EPd = 363 + 1.858 × BYd
The equation for the quantity of waste heat produced:
WHd = EPd × 1.57
Finally, the equation for waste heat that can be used for pelleting (drying) during winter and summer:
DHW = 36 × SSd and DHS = 25 × SSd
The dry matter content (ADDM%) of the matured fermentation liquid (ADd) can be determined as the ratio of dry matter load to daily substrate volume. After the separation, the amount of matured fermented liquid decreases by an average of 77.5% and the volume of the solid fraction is 0.5 t/m3, which can be used as a permanent value to determine the amount of daily solid fraction (SFd) expressed in kilograms [47,51].
According to Tambone et al.’s (2017) results, the dry matter content of the solid fraction (SFDM%) for screw press separators increased by an average of 25.4% compared to the starting material [50].
Based on the above,
- the dry matter content of the circulated fermentation liquid:DDM% = (DMd ÷ SSd)
- daily amount of solid fraction:SFd = ADd × 0.225 × 0.5 × 1000
- solid fraction of dry content:SFDM% = ADDM% + 0.254
Factors taken into account in the quantities of winter dried solid fraction (DDW) and the summer dried solid fraction (DDS):
- moisture which can be removed in addition to the heating performed by the fermenters (1.1 kWh/kg of water),
- the dry matter content of unit separation (SFDM%),
- the dry matter content (DDDM%) required for pelleting, which is in this case is constant at 90.0%.
To calculate, we applied the IF function of the Microsoft Excel program, which allowed us to ensure that the material flow rates cannot be negative. The IF function performs a certain logic test which, after the test is completed or not completed, solves the predetermined formulas, or even issues a fixed value. Based on the IF function, the partial results of the applied simulation method can modify the changes of the following other calculated model parameters. Accordingly, the calculations are as follows:
DDW = using the IF function, where:
- the logic test: (WHd-DHW) ÷ 1.1 ÷ (DDDM% − SFDM%) ≥ SFd; i.e., the quantity of available material dried by heat energy is greater than the amount of solid separated matter
- if true: DDW = SFd × (1 − (DDDM% − SFDM%)); i.e., the mass of the dried solid fraction is equal to the product of the weight of the solid separated matter and the percentage of the extracted moisture content,
- if false: DDW = (SFd − NDSFW) × (1 − (DDDM% − SFDM%)); the mass of the dried solid fraction is equal to the product of the entire available separated matter and the percentage of the extracted moisture content subtracted from the non-dryable separated matter.
Accordingly, the amount of DDS was calculated, during which the logical test is (WHd − DHS) ÷ 1.1 ÷ (DDDM% − SFDM%) ≥ SFd. If the logical test is true, it computes the value of SFd × (1 − (DDDM% − SFDM%)), otherwise the value of (SFd − NDSFS) × (1 − (DDDM% − SFDM%).
For the purpose of carrying out the logical tests, we determined the difference between the potentially dryable quantity of separated matter with waste heat and the actual (moist) separated matter, i.e., the non-dryable separated matter, which may differ in winter (NDSFW) and summer (NDSFS) periods depending on the thermal energy used for the fermenter heat exchanger.
NDSFW = using the IF function, where:
- the logic test: (WHd − DHW) ÷ 1.1 ÷ (DDDM% − SFDM%) ≥ SFd, i.e., the amount of decompressed separated matter is greater than or equal to the available quantity
- if true: NDSFW = 0, i.e., the total separated matter has been dried by the heat energy
- if false: NDSFW = SFd − ((WHd − DHW) ÷ 1.1 ÷ (DDDM% − SFDM%)), i.e., the amount of undried separated matter is equal to the difference between the available separated matter and the potentially dryable separated matter.
Accordingly, the amount of NDSFS was calculated, with the logical test (WHd − DHS) ÷ 1.1 ÷ (DDDM% − SFDM%) ≥ SFd. If the logical test is true, the NDSFS value is zero, and if false, then it calculates the value of SFd − ((WHd − DHs) ÷ 1.1 ÷ (DDDM% − SFDM%).
The amount of waste heat not used in winter (UWHW) and summer (UWHS) was also calculated using the IF function, whereby the function is as follows:
UWHW = using the IF function, where:
- logic test: (WHd − DHW) ÷ 1.1 ÷ (DDDM% − SFDM%) ≥ SFd
- if true: UWHW = ((WHd − DHW) ÷ 1.1 ÷ (DDDM% − SFDM%) − SFd) × 1.1, i.e., the difference between the potentially dryable and the actually available separated matter multiplied by the 1.1 kWh/kg constant value.
- if false: UWHW = 0, i.e., in this case the total waste heat is used.
Accordingly, the UWHS quantity was also calculated, with the logical test (WHd − DHS) ÷ 1.1 ÷ (DDDM% − SFDM%) ≥ SFd. If the logic test is true then the UWHS can be calculated using the ((WHd − DHS) ÷ 1.1 ÷ (DDDM% − SFDM%) − SFd) × 1.1 formula, while if the logical test is false, UWHS is zero.
The total amount of separated matter dried during the winter and summer months was calculated and expressed in pellets (DP) per tonne per year, calculated by using the formula (DDW × 182 + DDS × 183)/1000, where 182 days is the period between the first of October and the end of March (winter), and 183 days the period between the first of April and the end of September (summer).
The calculations were carried out for the year 2016 because we found the closest correlation relationship between the biogas yield calculated by our regression equation and the actual biogas yield (R2 2015 = 0.830; R2 2016 = 0.938; R2 2017 = 0.571).
Figure 1 shows the daily values of the material flow and energy demand of the biogas plant, from the arrival of the raw material to pelleting.
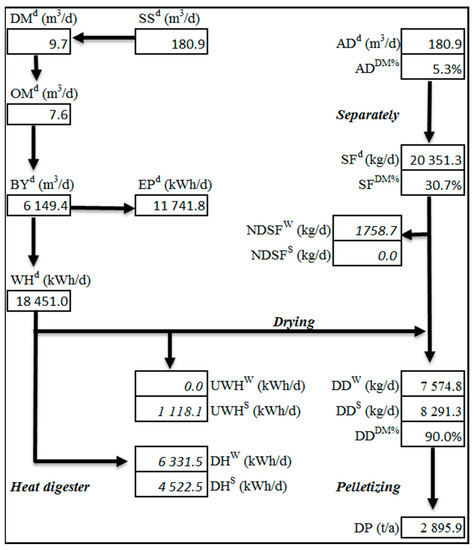
Figure 1.
Biogas plant material flow based on the average raw material consumption of the year 2016 (Source: authors’ own calculations).
3.3. Substrate Dry Matter Content Optimization
Using the material flow model, we investigated how the increase in the dry matter content of the substrate influences biogas yield and hence thermal energy production. It is expected that an increase in the dry matter content of the substrate will result in an increase in the dry matter and organic content of the separated solid fraction, thus increasing the amount of waste heat generated and at the same time reducing the amount of heat required for pellet drying.
To optimize the dry matter content of the substrate, a linear programming (LP) model was used, similarly to our previous study [16]. Additionally, LP has been used as a model by several authors in biogas plant testing [66,67].
The values of our target function in the LP model are fixed, i.e., sensitivity analysis of the amount of pellet produced from raw material with a 6%, 7%, 8%, 9% and 10% dry matter content. The range is justified by the 5.3% in our basic model and the 10% suggested as an ideal model in Stolze et al. (2015) [9]. The variable cell of the model is the quantity of feedstocks (SQ1...n) determined as a limiting condition so that the SSd value corresponds to the actual data of the plant (180.9 m3 substrate per day). In the composition of the feedstocks, we have further limitations in that the amount of liquid manure can be changed by ±50% and other feedstocks by −90% and +50% compared to the data from 2016. In the case of maize silage and grass silage which play a significant role in increasing dry matter content, the upper limit is 10 times the 2016 average. In establishing the values of the limiting factors, due to the constant livestock numbers, almost the same internal and highly variable external base raw material was taken into account, and as regards the growth of energy crops at the farm, the maximum coverage area of was also taken into account.
3.4. Methodology of Cost and Income Calculations of Pellet Production
The economic evaluation of the processes used in the material flow model was carried out using cost and income calculations based on our calculated and secondary basic data. Table 5 shows the special invested assets for the processing of mature fermented liquid and their investment costs, amortization (permanent) and operating costs for 3000 to 3500 t pellet production capacity per year. The total investment cost of the equipment is €381,380, the vast majority of which (79%) is the cost of the belt dryer. The amortization cost of the assets was calculated using a 10-year (10% annual) linear depreciation. Within the variable costs, the cost of personnel was 3.4 € per hour, as well as the associated costs which can be considered typical in the agricultural sector in Hungary.
Table 5.
Equipment in pellet production and their operating costs.
In the case of cost and income calculations, separate calculations were made for the mode of utilization (nutrient or heat energy target), marketability (own use or sales), and—for the purpose of demonstrating the significance of waste heat utilization—calculations were made relating to the use of waste heat or natural gas as auxiliary material during the drying.
The composition of organic fertilization pellet was calculated on the data of Thomas et al. (2017) [56], Ross et al. (2018) [57], Kratzeisen et al. (2010) [54] and Haggard et al. (2005) [60]. Since the nitrogen content significantly reduces during drying, we considered only its phosphorus- (0.8%) and potassium-content (1.5%) for pricing.
Regarding calculation of the value of heating pellet, we considered the prices of agripellets with similar composition. Heating value of digestate pellets: 15 MJ/kg, ash content: 17%, based on Kratzeisen et al. (2010) [54].
In the case of organic fertilizer pellets, two values were taken into account for economic evaluation:
- 22.4 €/t, calculated on the Hungarian and German market prices of different quality pellets, with multivariation linear regression, depending on PK content. (R2 = 0.870; F = 20.054; p = 0.02)Equation of the price:−9.54 + 43.345 × P – 12.08 × K
- We used 90 €/t as a proportional value for accounting the price, which, according to Dahlin et al. (2015) [32] reflects the true economic value when it is used by the producer. In this case, this value can be determined as the product of the nutrient content of the pellets (NPK) and the fertilizer prices.For heating pellets two prices were also considered:
- 143.8 €/t as the lowest and the most affordable domestic market price of Hungarian agri-food pellets.
- Although we did not take other market prices into account in our calculations, bearing the future in mind, we used a price comparison of 250–318 €/t as the comparison price for straw pellets prices in the UK, which is relevant for export sales.
4. Results and Discussion
Calculations made in this study were based on the results of the case study we discussed in Section 3.1; however, due to the sensitivity analysis, our results can be considered as typical for medium-sized cogeneration plants in general.
4.1. Cost and Income Calculation of Organic Fertilizer and Heating Pellets
Based on the actual data of the biogas plant under investigation (181 m3, 5.3% dry matter content of fermented liquid per day), according to our calculations, after separation and pelleting, 2896 tons of marketable final products can be produced annually. The sales price of the organic fertilizer pellet according to our statistical tests is based on the internal parameters of 22.4 €/t, which is close to Dahlin et al.’s (2015) [32] calculated market value (20 €/t), which can be expected to reflect the expected price well.
The annual turnover is very different in the case of use of pellets for nutrient or for burning for heat, as is the case with pellets produced for the producer’s own use or for sale. Since the annual cost of production and the cost of the final product are independent of the previous four cases, the expected income is also primarily a function of utilization and marketability. At the same time, it would significantly increase the final cost of the final product (by about 46%) if natural gas were used instead of waste heat in the technological process. According to Fürstaller et al. (2010), the use of natural gas can increase the cost of pellets by up to 25% compared to drying with free waste heat [28]. The difference is probably attributable to the price and technological changes which have occurred in the meantime, but we agree with the significance of the decisive importance of waste recovery.
The proportion of fixed costs is relatively modest (10–15% of the cost of production), therefore—while of course efforts should be made for continuous operation—pelleting is less sensitive to capacity utilization than the biogas plant (Table 6).
Table 6.
Cost and income calculation of waste heat and natural gas pellet production.
In the basic scenario presented, profitable operation is expected only in the case of heating pellet sales:
- using waste heat: 52.7 EUR/t income
- using natural gas: 10.1 EUR/t income
In the United Kingdom, the use of fire pellets for their producers’ own use is largely supported, and savings on natural gas, together with subsidies can reach a combined total of 621 €/t [61]. Within this, the natural gas savings from the burning of one ton of pellets are 167.5 €/t, which is lower than the sales prices (250–318 €/t) in the UK, but far exceeds the cost of pellet production (88–90 €/t), which means that thanks to the support available it is more economical when used by the producer. In Hungary, in the absence of a subsidy for the same purpose, use by the producer can only be recommended in the following cases:
- if the application of leftover fermented liquid to arable land presents problems (the biogas plant has little arable land) or
- if the winter energy demand of the agricultural enterprise exceeds the amount of waste heat available in this period, i.e., in this case the waste heat from the summer can be converted into winter fuel.
In the case of producers using their own pellets produced by waste heat, the producer’s cost (91.1 EUR/t) and the value-based price calculated in the literature (EUR 90/t) [32] are nearly the same. The production of nutrient pellets with natural gas and the sale of nutrient pellets will inevitably lead to a loss (-69 + 111 EUR/t).
Taking account of the use of waste heat, the sale of heating pellets can lead to a profit of €152,473 per annum for the biogas plant, and in addition to the sale of green electricity under guaranteed purchasing, the by-products (waste heat, bio-fertilizer) can further improve the profitability of the plant. In the case of nutrient pellets, however, the price differential of more than six times results in a loss of almost €200,000 per annum.
With respect to the organic fertilizer and heating pellets, it was found that 4550 MWh waste heat per year can be used to dry the solid fraction. In winter, waste heat consumption may reach 100%, while in summer the figure is 93.9%, which could be further increased by improving stock management (the undried amount during the winter period is 1.7 t/day). All in all, in a basic case pelleting is suitable for virtually all waste heat.
When comparing drying by waste heat and by natural gas, it can be stated that the use of natural gas is recommended in plants where:
- waste heat from the combustion of biogas is used throughout the whole year (e.g., as technological heat) or is fed to gas pipelines after purification (in these cases there is no usable heat energy generated), and
- when the product is intended to be sold on the fuel heating fuel market.
4.2. The Effect of the Dry Matter Content of the Substrate on Economic Indicators
Further calculations were made to determine the potential for increasing substrate dry matter content (using the LP programme), the results of which are shown in Table 7.
Table 7.
Revenue from pellet sales depending on the different sales directions and substrate dry matter content.
Based on our results, the increase in the dry matter content of the substrate by one percent (between the 6% and 10% interval) increases the amount of pellets which can be produced by 2.5% (74–75 t/year), i.e., the spread fertilizer is able to produce ever greater numbers of pellets.
The reduction in the producer’s own cost, although only in the case of a unit increase in dry matter content, is 0.4%, but due to the higher number of pellets, the annual income growth is higher.
Increasing dry matter production does not only affect the demand for drying energy, but also increases the production of heat and electricity in cogeneration units. Based on our calculations, the increase in unit solid content increases thermal energy production on average by 1.05% and reduces the specific heat consumption of pellet production by 0.1 MWh/t. With the reduction of the specific heat consumption, the winter and summer quantities of waste heat that can be used for other purposes also increase significantly. While in the basic case pelleting (or the drying which occurs beforehand) uses practically the total amount of generated waste heat, a one percent increase in dry matter content decreases the available amount of waste heat by 5.0–5.5% in both the winter and the summer. With 10% dry matter, half of the waste heat in the summer and one third in the winter is available for other heat energy utilization, which can increase the biogas plant’s profit (mainly in winter).
According to the results of Fürstaller et al. (2010) [28], the pellet production costs will typically be in the range of 70–90 €/t, which was also confirmed by Shirani-Evans’s (2012) [61] estimate of 89.9 €/t. The results of our calculations do not differ significantly from the aforementioned author, as the cost we calculate is between 88.4 and 90.1 €/t in the case of 6–10% substrate dry matter content.
5. Conclusions
The cost of pellet production can be reduced by approximately 46% through the use of waste heat, but even natural gas drying is profitable for heat-energy sales, which is why this is the primary reason for pelleting bio-fertilizer. It should be noted that Western European firewood prices (e.g., UK: 250–318 €/t) are considerably higher than in Hungary, so it is advisable for Hungarian producers to even consider sales in the EU. The economics of producer’s own use can be doubtful, since waste heat (without pelleting) is a much cheaper way to meet local heat demands.
The investment cost of about €381 thousand (Table 5) is expected to be recovered in the case of heating pellets produced by waste heat over a period of 3 years if the total quantity is sold on the market.
Pelleting is not only suitable for the full or near recovery of the waste heat in the winter period, but is also capable of utilizing the bulk of the waste heat in the summer period, and thus helps to produce marketable products from bio fertilizer that would otherwise only be used locally. 10% of the substrate dry matter content already delivers a significant amount of waste heat savings, which can be used for biogas and linked farm processes and can be a source of considerable savings.
In the case of sales for nutrition, the substitution value for the producer’s own use instead of sales is much higher (about 90 €/t) and is approximately the same as the producer’s own costs, but this does not justify its use compared to when it is used without pelleting (as spread fertilizer). In addition to pelleting it might be used for precision cultivation technology and for better storage. All in all, utilization for nutrition can only be considered as a kind of “necessary evil” in the absence of thermal energy utilization/sales or land available for fertilization.
Author Contributions
Dávid Nagy participated in data collection, in the literature review, in the economic model and in the economic calculations. Péter Balogh performed the statistical analyses. Zoltán Gabnai participated in literature review and formatted the manuscript. József Popp revised and finalized the manuscript and participated in the development of the research concept. Judit Oláh revised and finalized the manuscript. Attila Bai participated in economic calculations and analysis, in literature review, and performed the conclusions.
Acknowledgments
This work was supported by the ÚNKP-17-2 New National Excellence Program of the Ministry of Human Capacities (Hungary).
Conflicts of Interest
The authors declare no conflict of interest.
Abbreviations
| ADd | daily quantity of anaerobic digestate (m3/day) |
| ADDM% | dry matter of anaerobic digestate (%) |
| BYd | daily biogas yield (m3/day) |
| CHP | combined heat and power |
| DDDM% | dry matter of dried digestate (constant value: 90%) |
| DDS | quantity of dried digestate per day in summer period (kg/day) |
| DDW | quantity of dried digestate per day in winter period (kg/day) |
| DHS | daily heating demand of digester in summer period (kWh/day) |
| DHW | daily heating demand of digester in winter period (kWh/day) |
| DM% | dry matter (%) |
| DMd | daily quantity of dry matter loaded into the digester (m3/day) |
| DP | quantity of digestate pellet per year (tons/year) |
| EPd | daily electricity production (kWh/day) |
| GHG | greenhouse gases |
| HRT | hydraulic retention time (day) |
| MMT | million metric tons |
| NDSFS | quantity of non-dried solid digestate per day in summer period (kg/day) |
| NDSFW | quantity of non-dried solid digestate per day in winter period (kg/day) |
| NPK | Nitrogen-Phosphorus-Potassium |
| OLR | organic loading rate |
| OM% | organic matter (%) |
| OMd | daily quantity of organic matter loaded into the digester (m3/day) |
| SFd | quantity of solid fraction of digestate per day (kg/day) |
| SFDM% | dry matter of solid separated digestate (%) |
| SQ | daily quantity of substrate component (m3/day) |
| SSd | substrate fed into the digester (m3/day) |
| UWHS | quantity of unused waste heat per day in summer period (kWh/day) |
| UWHW | quantity of unused waste heat per day in winter period (kWh/day) |
| WHd | daily thermal energy production (kWh/day) |
References
- Pflüger, S. European biogas industry now and beyond 2020. In Proceedings of the EBA Workshop: Contribution of Biogas towards European Renewable Energy Policy beyond 2020, Brussels, Belgium, 8 February 2017. [Google Scholar]
- European Commission (EC). Proposal for a DIRECTIVE OF THE EUROPEAN PARLIAMENT AND OF THE COUNCIL on the Promotion of the Use of Energy from Renewable Sources; Proposal, R.I., Ed.; European Commission: Brussels, Belgium; Luxembourg, 2016. [Google Scholar]
- Eurostat. Primary Production—All Products—Annual Date; Wood Pellets; Eurostat: Luxembourg, 2017. [Google Scholar]
- Mergner, R.; Rutz, D.; Wagner, I.; Amann, S.; Amann, C.; Kulišić, B.; Abramović, J.M.; Pozar, H.; Vorisek, T.; Bailón Allegue, I.; et al. European Strategy Paper on Heat Use from Biogas Plants; WIP Renewable Energies: Munich, Germany, 2013; p. 22. [Google Scholar]
- Ramanauskaite, R.; Rutz, D.; Amann, S.; Amann, C.; Abramovic, J.M.; Vorisek, T.; Bailón Allegue, L.; Hinge, J.; Dzene, I.; De Filippi, F. Biogas Markets and the Use of Heat of Biogas Plants in Austria, Croatia, Czech Republic, Denmark, Germany, Italy, Latvia, Poland and Romania; BiogasHeat WP; WIP Renewable Energies: Munich, Germany, 2012. [Google Scholar]
- Carlini, M.; Mosconi, E.M.; Castellucci, S.; Villarini, M.; Colantoni, A. An Economical Evaluation of Anaerobic Digestion Plants Fed with Organic Agro-Industrial Waste. Energies 2017, 10, 1165. [Google Scholar] [CrossRef]
- Lindkvist, E.; Johansson, M.T.; Rosenqvist, J. Methodology for Analysing Energy Demand in Biogas Production Plants—A Comparative Study of Two Biogas Plants. Energies 2017, 10, 1822. [Google Scholar] [CrossRef]
- Kokkoli, A.; Zhang, Y.; Angelidaki, I. Microbial electrochemical separation of CO2 for biogas upgrading. Bioresour. Technol. 2018, 247, 380–386. [Google Scholar] [CrossRef] [PubMed]
- Stolze, Y.; Zakrzewski, M.; Maus, I.; Eikmeyer, F.; Jaenicke, S.; Rottmann, N.; Siebner, C.; Pühler, A.; Schlüter, A. Comparative metagenomics of biogas-producing microbial communities from production-scale biogas plants operating under wet or dry fermentation conditions. Biotechnol. Biofuels 2015, 8, 14. [Google Scholar] [CrossRef] [PubMed]
- Ghimire, P.C. SNV supported domestic biogas programmes in Asia and Africa. Renew. Energy 2013, 49, 90–94. [Google Scholar] [CrossRef]
- Bond, T.; Templeton, M.R. History and future of domestic biogas plants in the developing world. Energy Sustain. Dev. 2011, 15, 347–354. [Google Scholar] [CrossRef]
- Martí-Herrero, J.; Chipana, M.; Cuevas, C.; Paco, G.; Serrano, V.; Zymla, B.; Heising, K.; Sologuren, J.; Gamarra, A. Low cost tubular digesters as appropriate technology for widespread application: Results and lessons learned from Bolivia. Renew. Energy 2014, 71, 156–165. [Google Scholar] [CrossRef]
- Bayerisches Landesamt für Umwelt. Biogashandbuch Bayern–Materialienband, Augsburg 2007. Available online: http://www.lfu.bayern.de/abfall/biogashandbuch (accessed on 11 December 2017).
- Weiland, P. Biomass digestion in agriculture: A successful pathway for the energy production and waste treatment in Germany. Eng. Life Sci. 2006, 6, 302–309. [Google Scholar] [CrossRef]
- Khanal, S.K. Bioenergy generation from residues of biofuel industries. In Anaerobic Biotechnology for Bioenergy Production: Principles and Applications; Wiley-Blackwell: Oxford, UK; John Wiley & Sons: New York, NY, USA, 2008; pp. 161–188. [Google Scholar]
- Mézes, L.; Bai, A.; Nagy, D.; Cinka, I.; Gabnai, Z. Optimization of Raw Material Composition in an Agricultural Biogas Plant. Trends Renew. Energy 2017, 3, 61–75. [Google Scholar] [CrossRef]
- Onthong, U.; Juntarachat, N. Evaluation of Biogas Production Potential from Raw and Processed Agricultural Wastes. Energy Procedia 2017, 138, 205–210. [Google Scholar] [CrossRef]
- Aramrueang, N.; Rapport, J.; Zhang, R. Effects of hydraulic retention time and organic loading rate on performance and stability of anaerobic digestion of Spirulina platensis. Biosyst. Eng. 2016, 147, 174–182. [Google Scholar] [CrossRef]
- Kumar, K.; Ghosh, S.; Angelidaki, I.; Holdt, S.L.; Karakashev, D.B.; Morales, M.A.; Das, D. Recent developments on biofuels production from microalgae and macroalgae. Renew. Sustain. Energy Rev. 2016, 65, 235–249. [Google Scholar] [CrossRef]
- Rutz, D.; Mergner, R.; Janssen, R. Sustainable Heat Use of Biogas Plants; Euroheat & Power: Brussels, Belgium, 2015; ISBN 978-3-936338-35-5. [Google Scholar]
- Elsenbruch, T. Jenbacher Gas Engines a Variety of Efficient Applications; GE Power: Atlanta, GA, USA, 2010; p. 73. [Google Scholar]
- Deutsches Biomasseforschungszentrum (DBFZ). Guide to Biogas from Production to Use; Deutsches Biomasse Forschungs Zentrum, Fachagentur Nachwachsende Rohstoffe e.V: Gülzow, Germany, 2012; p. 229. [Google Scholar]
- Kirchmeyr, F.; Anzengruber, G. Leitfaden zur Wärmenutzung bei Biogasanlagen. ARGE Kompost und Biogas Österreich. 2008. Available online: https://www.klimaaktiv.at/dam/jcr:75e19d28-6058-4d52-a4fe-4e9ef91ead7e/Leitfaden_Waermenutzung%20bei%20Biogasanlagen.pdf (accessed on 11 January 2018).
- Pullen, T. Anaerobic Digestion–Making Biogas–Making Energy: The Earthscan Expert Guide; Routledge: Abingdon, UK, 2015; ISBN 1317673409. [Google Scholar]
- Bolzonella, D.; Fatone, F.; Gottardo, M.; Frison, N. Nutrients recovery from anaerobic digestate of agro-waste: Techno-economic assessment of full scale applications. J. Environ. Manag. 2018, 216, 111–119. [Google Scholar] [CrossRef] [PubMed]
- Sethupathi, S.; Zhang, M.; Rajapaksha, A.U.; Lee, S.R.; Mohamad Nor, N.; Mohamed, A.R.; Al-Wabel, M.; Lee, S.S.; Ok, Y.S. Biochars as Potential Adsorbers of CH4, CO2 and H2S. Sustainability 2017, 9, 121. [Google Scholar]
- Huttunen, S.; Manninen, K.; Leskinen, P. Combining biogas LCA reviews with stakeholder interviews to analyse life cycle impacts at a practical level. J. Clean. Prod. 2014, 80, 5–16. [Google Scholar] [CrossRef]
- Fürstaller, A.; Huber, M.; Krueger, J.; Pfleger, M. Processing of digestate to pellets for usage as alternative solid fuel. In Proceedings of the 18th European Conference and Exhibition, Lyon, France, 3–7 May 2010; pp. 3–7. [Google Scholar]
- Lukehurst, C.T.; Frost, P.; Al Seadi, T. Utilisation of Digestate from Biogas Plants as Biofertiliser; IEA Bioenergy: Paris, France, 2010; pp. 1–36. [Google Scholar]
- ARBOR. Inventory: Techniques for Nutrient Recovery from Digestate. 2013. Available online: http://arbornwe.eu/downloads (accessed on 24 October 2017).
- Oenema, O.; Tamminga, S. Nitrogen in global animal production and management options for improving nitrogen use efficiency. Sci. China Ser. C Life Sci. 2005, 48, 871–887. [Google Scholar]
- Dahlin, J.; Herbes, C.; Nelles, M. Biogas digestate marketing: Qualitative insights into the supply side. Resour. Conserv. Recycl. 2015, 104, 152–161. [Google Scholar] [CrossRef]
- KTBL. Umweltgerechte, Innovative Verfahren zur Abtrennung von Nährstoffen aus Gülle und Gärrückständen—Technologischer Stand, Perspektiven und Entwicklungsmöglichkeiten; KTBL: Darmstadt, Germany, 2008. [Google Scholar]
- Drosg, B.; Fuchs, W.; Al Seadi, T.; Madsen, M.; Linke, B. Nutrient Recovery by Biogas Digestate Processing; IEA Bioenergy: Paris, France, 2015; pp. 7–11. [Google Scholar]
- Agrárgazdasági Kutató Intézet (AKI). Agrárpiaci Jelentések, Gabona és Ipari Növények (Agrarian Market Reports, Grain and Industrial Plants); AKI: Budapest, Hungary, 2015; p. 31. [Google Scholar]
- AEBIOM. Statistical Report 2017. European Bioenergy Outlook. 2017. Available online: http://www.aebiom.org/wp-content/uploads/2017/10/KF17-v2.pdf (accessed on 12 January 2018).
- Flach, B.; Lieberz, S.; Rossetti, A. EU Biofuels Annual 2017; GAIN Report; USDA Foreign Agricultural Service, Global Agricultural Information Network: Washington, DC, USA, 2017; p. 44. [Google Scholar]
- GTIS, World Trade Atlas Database. Global Trade International Service. 2017. Available online: http://www.worldtradestatistics.com/english/gtis.html (accessed on 21 February 2018).
- SFCCI. Sustainable Forest Management Criteria & Indicators; Standing Forestry Committee, 2015; Available online: https://ec.europa.eu/agriculture/sites/agriculture/files/forest/publications/pdf/sfcci-report_en.pdf (accessed on 10 February 2018).
- Saveyn, H.; Eder, P. End-of-Waste Criteria for Biodegradable Waste Subjected to Biological Treatment (Compost & Digestate): Technical Proposals; European Commission, Joint Research Centre, Institute for Prospective Technological Studies: Sevilla, Spain, 2014. [Google Scholar]
- Vaneeckhaute, C.; Meers, E.; Michels, E.; Buysse, J.; Tack, F. Ecological and economic benefits of the application of bio-based mineral fertilizers in modern agriculture. Biomass Bioenergy 2013, 49, 239–248. [Google Scholar] [CrossRef]
- Jones, P.; Salter, A. Modelling the economics of farm-based anaerobic digestion in a UK whole-farm context. Energy Policy 2013, 62, 215–225. [Google Scholar] [CrossRef]
- Luyten-Naujoks, K. BGK Rechtliche Aspekte des Inverkehrbringens von Gärprodukten zu Düngezwecken; Berlin, Germany, 2015. Available online: https://veranstaltungen.fnr.de/fileadmin/allgemein/pdf/veranstaltungen/gaerreste2015/16_Luyten-Naujoks.pdf (accessed on 3 February 2018).
- Dahlin, J.; Halbherr, V.; Kurz, P.; Nelles, M.; Herbes, C. Marketing green fertilizers: Insights into consumer preferences. Sustainability 2016, 8, 1169. [Google Scholar] [CrossRef]
- Al Seadi, T.; Lukehurst, C. Quality Management of Digestate from Biogas Plants Used as Fertiliser; IEA Bioenergy: Paris, France, 2012; Volume 37, p. 40. [Google Scholar]
- Bauer, A.; Mayr, H.; Hopfner-Sixt, K.; Amon, T. Detailed monitoring of two biogas plants and mechanical solid–liquid separation of fermentation residues. J. Biotechnol. 2009, 142, 56–63. [Google Scholar] [CrossRef] [PubMed]
- Möller, K.; Schulz, R.; Müller, T. Substrate inputs, nutrient flows and nitrogen loss of two centralized biogas plants in southern Germany. Nutr. Cycl. Agroecosystems 2010, 87, 307–325. [Google Scholar] [CrossRef]
- Fechter, M.; Kraume, M. Digestate Treatment Techniques. Technical Transactions Mechanics. 2016, Volume 1-M, pp. 95–106. Available online: http://www.ejournals.eu/pliki/art/7547/ (accessed on 12 February 2018).
- Møller, H.B.; Sommer, S.G.; Ahring, B.K. Separation efficiency and particle size distribution in relation to manure type and storage conditions. Bioresour. Technol. 2002, 85, 189–196. [Google Scholar] [CrossRef]
- Tambone, F.; Orzi, V.; D’Imporzano, G.; Adani, F. Solid and liquid fractionation of digestate: Mass balance, chemical characterization, and agronomic and environmental value. Bioresour. Technol. 2017, 243, 1251–1256. [Google Scholar] [CrossRef] [PubMed]
- Mézes, L. Mezőgazdasági és élelmiszeripari biogáz-termelés optimalizálása. (Optimizing the Agricultural and Food Industrial Biogas Production); University of Debrecen: Debrecen, Hungary, 2011. [Google Scholar]
- Turley, D.; Hopwood, L.; Burns, C.; Di Maio, D. Assessment of Digestate Drying as an Eligible Heat Use in the Renewable Heat Incentive; NNFCC: York, UK, 2016; p. 28. [Google Scholar]
- Awiszus, S.; Meissner, K.; Reyer, S.; Müller, J. Ammonia and methane emissions during drying of dewatered biogas digestate in a two-belt conveyor dryer. Bioresour. Technol. 2018, 247, 419–425. [Google Scholar] [CrossRef] [PubMed]
- Kratzeisen, M.; Starcevic, N.; Martinov, M.; Maurer, C.; Müller, J. Applicability of biogas digestate as solid fuel. Fuel 2010, 89, 2544–2548. [Google Scholar] [CrossRef]
- Nest, T.V.; Ruysschaert, G.; Vandecasteele, B.; Cougnon, M.; Merckx, R.; Reheul, D. P availability and P leaching after reducing the mineral P fertilization and the use of digestate products as new organic fertilizers in a 4-year field trial with high P status. Agric. Ecosyst. Environ. 2015, 202, 56–67. [Google Scholar] [CrossRef]
- Thomas, B.W.; Li, X.; Nelson, V.; Hao, X. Anaerobically digested cattle manure supplied more nitrogen with less phosphorus accumulation than undigested manure. Agron. J. 2017, 109, 836–844. [Google Scholar] [CrossRef]
- Ross, C.-L.; Mundschenk, E.; Wilken, V.; Sensel-Gunke, K.; Ellmer, F. Biowaste Digestates: Influence of Pelletization on Nutrient Release and Early Plant Development of Oats. Waste Biomass Valorization 2018, 9, 335–341. [Google Scholar] [CrossRef]
- Ball, B.; McTaggart, I.; Scott, A. Mitigation of greenhouse gas emissions from soil under silage production by use of organic manures or slow-release fertilizer. Soil Use Manag. 2004, 20, 287–295. [Google Scholar] [CrossRef]
- Hammac II, W.; Wood, C.; Wood, B.; Fasina, O.; Feng, Y.; Shaw, J. Determination of bioavailable nitrogen and phosphorus from pelletized broiler litter. Sci. Res. Essays 2007, 2, 89–94. [Google Scholar]
- Haggard, B.E.; DeLaune, P.B.; Smith, D.R.; Moore, P.A. Nutrient and β17-estradiol loss in runoff water from poultry litters. JAWRA J. Am. Water Resour. Assoc. 2005, 41, 245–256. [Google Scholar] [CrossRef]
- Shirani, A.; Evans, M. Driving Innovation in AD Optimisation—Uses for Digestates; WRAP: Banbury, UK, 2012. [Google Scholar]
- Verma, V.; Bram, S.; Delattin, F.; Laha, P.; Vandendael, I.; Hubin, A.; De Ruyck, J. Agro-pellets for domestic heating boilers: Standard laboratory and real life performance. Appl. Energy 2012, 90, 17–23. [Google Scholar] [CrossRef]
- Al Seadi, T. Good Practice in Quality Management of AD Residues from Biogas Production, Report Made for the International Energy Agency, Task 24-Energy from Biological Conversion of Organic Waste; IEA Bioenergy; AEA Technology Environment: Oxfordshire, UK, 2001. [Google Scholar]
- Møller, H.B.; Lund, I.; Sommer, S.G. Solid–liquid separation of livestock slurry: Efficiency and cost. Bioresour. Technol. 2000, 74, 223–229. [Google Scholar] [CrossRef]
- Sáez, J.A.; Clemente, R.; Bustamante, M.Á.; Yañez, D.; Bernal, M.P. Evaluation of the slurry management strategy and the integration of the composting technology in a pig farm–Agronomical and environmental implications. J. Environ. Manag. 2017, 192, 57–67. [Google Scholar] [CrossRef] [PubMed]
- García-Gen, S.; Rodríguez, J.; Lema, J.M. Optimisation of substrate blends in anaerobic co-digestion using adaptive linear programming. Bioresour. Technol. 2014, 173, 159–167. [Google Scholar] [CrossRef] [PubMed]
- Gebrezgabher, S.A.; Meuwissen, M.P.; Prins, B.A.; Lansink, A.G.O. Economic analysis of anaerobic digestion—A case of Green power biogas plant in The Netherlands. NJAS Wagening. J. Life Sci. 2010, 57, 109–115. [Google Scholar] [CrossRef]
- Kröger, R.; Reckermann, M.; Schaper, C.; Theuvsen, L. Gärreste als Gartendünger vermarkten? Berichte über Landwirtschaft-Zeitschrift für Agrarpolitik und Landwirtschaft 2016, 94. Available online: http://buel.bmel.de/index.php/buel/article/view/99/Kröger_Gärreste.html (accessed on 22 February 2018).
© 2018 by the authors. Licensee MDPI, Basel, Switzerland. This article is an open access article distributed under the terms and conditions of the Creative Commons Attribution (CC BY) license (http://creativecommons.org/licenses/by/4.0/).