Article

Investigation of Flow and Heat Transfer Characteristics in Fractured Granite

1
Faculty of Engineering, China University of Geosciences (Wuhan), Wuhan 430074, China
2
Geo-Center of Northern Bavaria, University of Erlangen-Nürnberg, Schlossgarten 5, 91054 Erlangen, Germany
3
Department of Civil and Environmental Engineering, Unversity of California, Berkeley, CA 94706, USA
4
School of Civil Engineering, Tianjin University, Tianjin 300072, China
*
Author to whom correspondence should be addressed.
Energies 2018, 11(5), 1228; https://doi.org/10.3390/en11051228
Submission received: 21 February 2018 / Revised: 9 April 2018 / Accepted: 19 April 2018 / Published: 11 May 2018
(This article belongs to the Special Issue Geothermal Energy: Utilization and Technology 2018)

Abstract

:
Hydraulic and heat transfer properties of artificially fractured rocks are the key issues for efficient exploitation of geothermal energy in fractured reservoirs and it has been studied by many previous researchers. However, the fluid temperature evolution along the flow path and rock temperature changes was rarely considered. This study investigated flow and heat transfer characteristics of two sets of fractured granite samples each with a single fissure. The samples were collected from a geothermal reservoir of Gonghe basin in Qinghai province in China. The results show that the larger area ratio, the higher hydraulic conductivity exhibited. Hydraulic conductivity of fractured rock masses is positively proportional to injection pressure, but inversely proportional with both confining pressure and temperature. In order to analyze heat transfer during the flow process, temperature distribution along the flow path in a fracture was monitored. The temperature of the fluid was determined to increase with distance from the flowing inlet. Increasing the temperature of the rock or decreasing the injection pressure will raise the temperature at the same location. Furthermore, in order to understand the heat transfer in rock mass, temperature distribution was observed by using an infrared thermal camera. Finally, the energy exchange efficiency during the flowing process was examined. The energy exchange rate increases continuously with the rock temperature, with an effective stress ratio of 1:2.

1. Introduction

Shortage of fossil fuel energy and air pollution problems have become more and more serious due to rapid development of the economy and industry in the past decades in China. Geothermal energy is one of the greatest potential alternatives for traditional fossil resources due to its attractive characteristics of cleanness, renewability, and environmental friendliness. Hot-dry-rock (HDR), as a kind of geothermal energy, seems to have a great potential for future use. HDR is a kind of rock mass, which is buried in a certain depth underground, with high temperature and extremely low permeability. Such a geothermal energy resource could potentially be widely exploited by an enhanced geothermal system [1] (EGS), which is a loop injection-production system where wells are drilled into the reservoir stratum and cold fluid is injected. The water is pumped into the injection wells and then is forced to flow through existing or created cracks in order to exchange thermal energy with the hot surrounding rocks. Finally, the water is pumped out from the production wells.
Hydraulic permeability of a natural HDR reservoir is generally very low, which means it has a low efficiency of productivity of heat energy. Hydraulic fracturing has been attempted within the stratum of a small number of experimental HDR projects to increase the permeability of the reservoir. Flow characteristics and heat transfer properties are the key prerequisites for the successful exploitation of geothermal energy in EGS. The flow properties of fractured rock have been studied for many relevant topics including water conservancy, slope engineering, mining, and underground engineering. Boлоцьkо [2], Lomize [3], Poмм [4], and Louis [5,6,7] began early studies into the characteristics of flow through a single fracture within a rock mass. In the 1940s, Boлоцьkо approximated a fissure within a rock mass as two smooth planes separated by a finite distance and investigated the flow characteristics of fracture by laboratory tests. Many theoretical approaches can be applied to investigate this approximation, including the cubic law for fluid flowing between two parallel plates. The rate of flow between the plates is a function of the cube of the perpendicular distance between the two parallel plates, the fluid density, the gravitational acceleration, the fluid viscosity, and the hydraulic gradient. In the 1950s, Lomize believed that the properties of fluid flowing in the rock fissure will be influenced by the characteristics of the fracture morphology. He thought laminar flow met the theory of Boлоцьkо and proposed the theoretical formula of the fractured seepage properties in turbulent flow. In the 1960s, Poмм proved Boлоцьkо’s model and summed it up as a cubic law. After the 1970s, Louis [7] studied the relationship between seepage and stress for single fractured samples and forwarded an empirical formula to describe the flow process. Liu [8] carried out seepage tests on single and orthogonal fractures under high temperature and pressure. Based on the test results, Liu developed a formula for the permeability, coupled with temperature and stress. Zheng [9] obtained the relation between permeability and thickness of the fracture based on seepage tests of fractured rock masses under three-dimensional stress. Based on these experimental studies, Wang [10] summarized the characteristics of seepage and stress coupling for samples with a single fracture. Jiang [11] promoted the research progress with experimental studies of the hydraulic properties of rock masses. Xiong [12] summarized the research progress of single fractured rock seepage properties, including a law of fluid movement and the numerical simulation method of hydraulic properties in fractures. Kuhlman [13] presented a multi-porosity extension for classical double- and triple-porosity fractured rock flow models for slightly compressible fluids. Dual or multiple porosity models are common simplified conceptualizations of the complex reality of interacting porosity types and the spatially heterogeneous nature of rocks. The multi-porosity approach is a generalization of the Warren and Root [14] double-porosity model and the pseudo-steady-state triple-porosity model of Clossman [15], which is more suitable for flow modeling in low-permeability fractured rocks. Chen [16] investigated the relationship between the fracture geometric characteristics (FGC) of a rough-walled fracture (RWF) and its hydraulic properties and constructed an improved mathematical model which can account for the effect of the evolution of FGC on fracture permeability of deformable RWF. Zhang [17] proposed a novel numerical method by coupling radial point interpolation method (RPIM) and finite element method (FEM) and found that the variation inequality theory can be extended to solve the free-surface seepage problem based on the FEM flow model.
On the other hand, analytical models have been developed to study heat transfer of fluid flow through fractured rocks. Zhang [18] studied the disposal of nuclear waste by using finite element software based on a double medium model of fractured rock mass in coupled thermal-hydraulic-mass-chemical (TMHC) fields. Xiang [19] proposed a simplified heat transfer model of single fracture seepage under a distributed heat source and the heat transfer process of the fractured flow was analyzed. Dong [20] established a transient mathematical heat transfer model for a single fracture of rock and studied factors influencing heat transfer. Zhao [21] studied the hydraulic and thermal aspects of granite samples with rough fractures and expressed a convective heat transfer coefficient. He [22] studied the mechanism of the effect of temperature and effective stress on the permeability of sandstone. The influence of effective stress on permeability lies in the pressure effect of effective stress on pores in the rock and that the temperature is aggravating a disaggregation of clay minerals. Huang [23] proposed an analytical method of the two-equation thermal model to determine the heat transfer rate between rock and fluid, in which variations of fluid and rock temperatures are adequately considered and made a model to be more applicable for EGS simulations at an industrial scale. Li [24] investigated convection heat transfer characteristics in a single rock fracture and analyzed the influence of fracture surface roughness on heat transfer intensity. Based on the experimental results, Li proposed heat transfer correlations. Luo et al. [25] tested the hydraulic properties of artificial fractured granite under different confining pressure and temperature, then further studied the heat transfer efficiency under coupled hydro-thermal-mechanical conditions. It was found that the hydraulic property depends largely on the surface area of the fractures.
However, few studies have been conducted to investigate temperature distribution along the flow path, and the thermal conduction in the rock mass during flow through fractured rocks is rarely mentioned. In this study, rock samples were collected from a geothermal reservoir located in Gonghe basin of Qinghai province, which has been first confirmed as an HDR geothermal reservoir in China (Guo et al., 2015). Two sets of samples with plane and rough fractures of rock samples were prepared. Laboratory tests were conducted to study the hydraulic properties of these samples under different injection pressures, confining pressures, and temperatures. Furthermore, temperature of fluid flow through these fractured samples was monitored.

2. Materials and Study Methodology

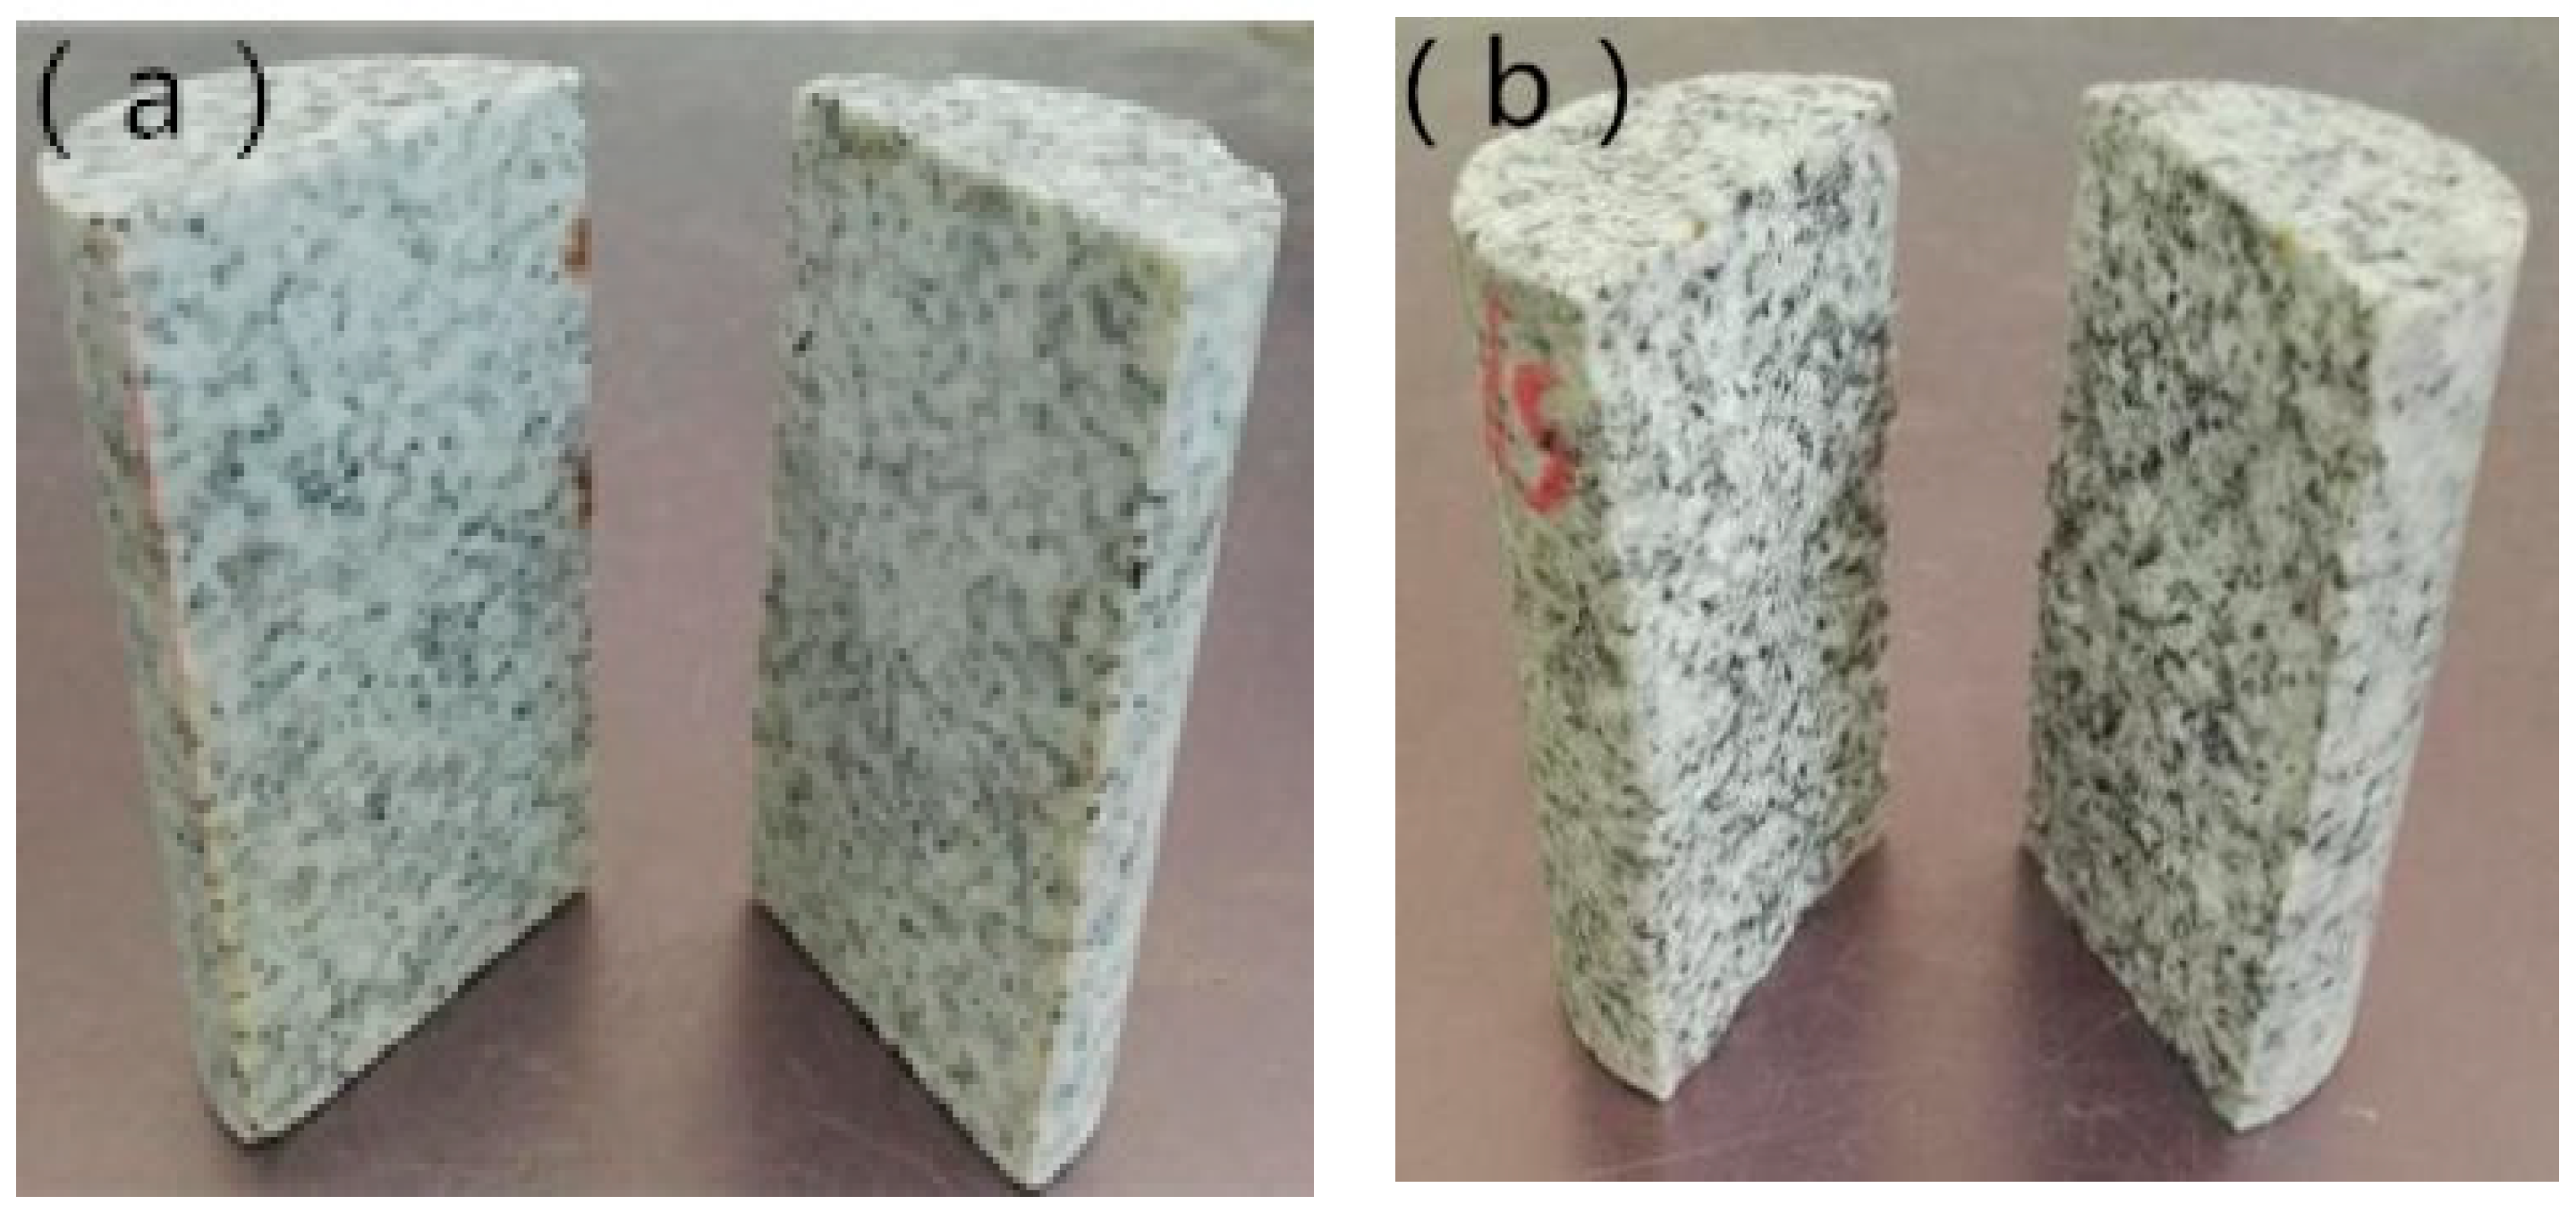
2.1. Description of the Samples

The study area is located in the Gonghe basin in Qinghai Province in China, where an HDR-type geothermal reservoir has been identified. All the rock samples in the present work were collected from the northern part of the study area. The geothermal reservoir is sited in granitic rock. The samples were cylindrically shaped with a diameter of 50 mm and a length of 100 mm. The main mineral compositions of the rock samples, measured by rock thin section analysis, were 40% quartz, 42% feldspar, 15% biotite, and 3% amphibole. Furthermore, the thermophysical properties were determined using the portable instrument ISOMET 2114 (Applied Precision Ltd., Stavitelska, Slovakia) which can directly measure the heat transfer properties of most isotropic materials. Some other laboratory devices, such as the electronic balance, were used to measure the densities of the samples, as shown in Table 1.
There two categories of samples investigated: one with a plane fracture and the other with a rough fracture, as shown in Figure 1. Two samples (P1 and P2) were cut axially by using a diamond cutting machine to create the plane surface of the fractures. To make a single fracture with a rough surface, the samples—marked as R1, R2, R3, R4—were prepared using a rock mechanics testing system (MTS) by following the improved Brazilian testing method [26].

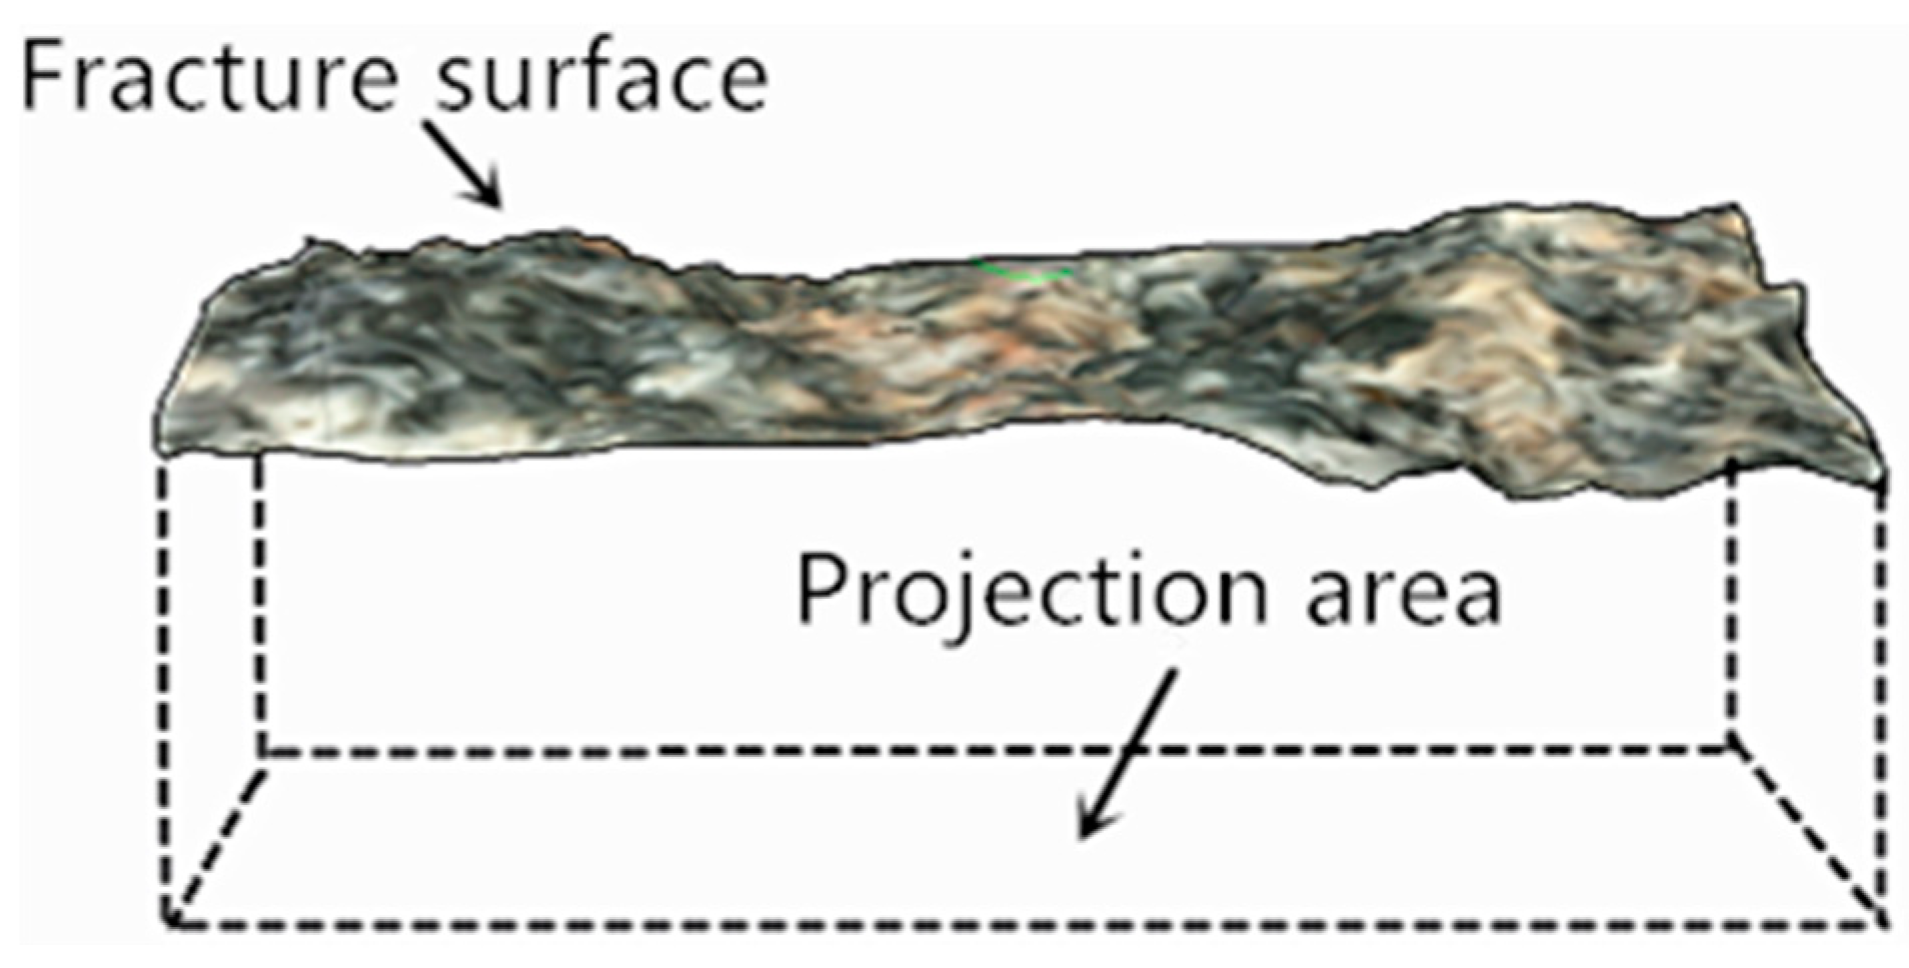
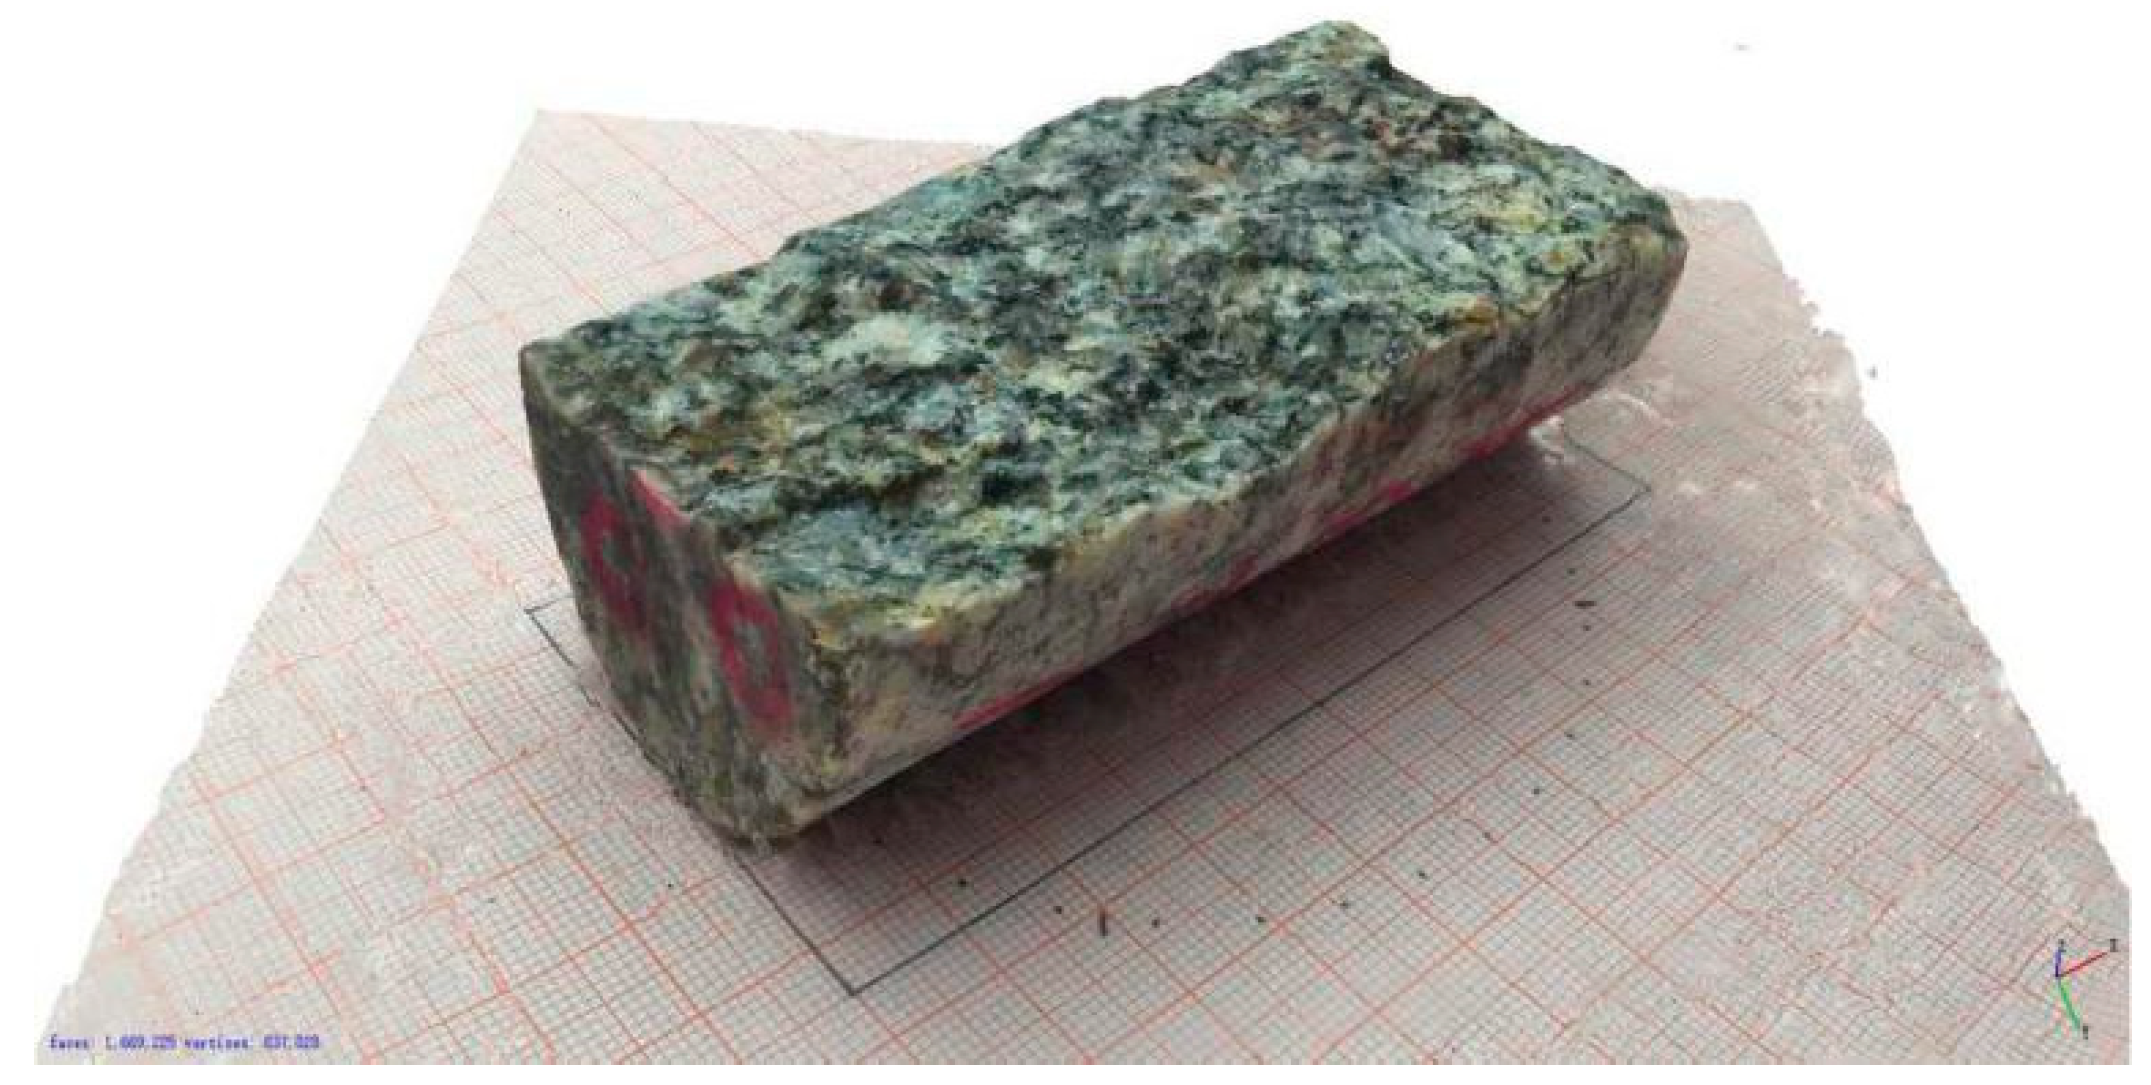
2.2. Morphological Information of the Fractures

In the present work, an index of area ratio was used to evaluate the roughness of the fracture surface, as shown in Figure 2. The area ratio refers to the specific value of the surface area to its projected area. Obviously, the rougher fracture surface produces a larger value of contact area ratio.
Spatial information of the samples was recorded by photographing the fracture’s surface. A 3D digital model was built in Agisoft PhotoScan software, based on the photos. Agisoft PhotoScan is a software developed by Agisoft Company (St. Petersburg, Russia) and is based on automatic generation imaging of 3D models. The process of modeling is to take photos of the rock sample from different angles and then import them into PhotoScan software, which will automatically locate all photos while matching feature points to create a digital model, as shown in Figure 3. The point cloud data of the rock sample were exported to the GOCAD software for analysis of surface roughness with an accuracy of ±0.01 mm. In the GOCAD software, the imported point cloud data generated point cloud. Other points beyond the fracture surface were removed and the coordinates were corrected. Then, the GOCAD software used point cloud to regenerate a 3D model of fracture surface; the surface area and projection area of the fracture surface were calculated directly using the Compute function in GOCAD [27]. Consequently, the area ratio was determined by knowing both surface and projection areas. The obtained area ratios are displayed in Table 2. One can see that the area ratio of fractures with plane surface is smaller than that of rough fractures.

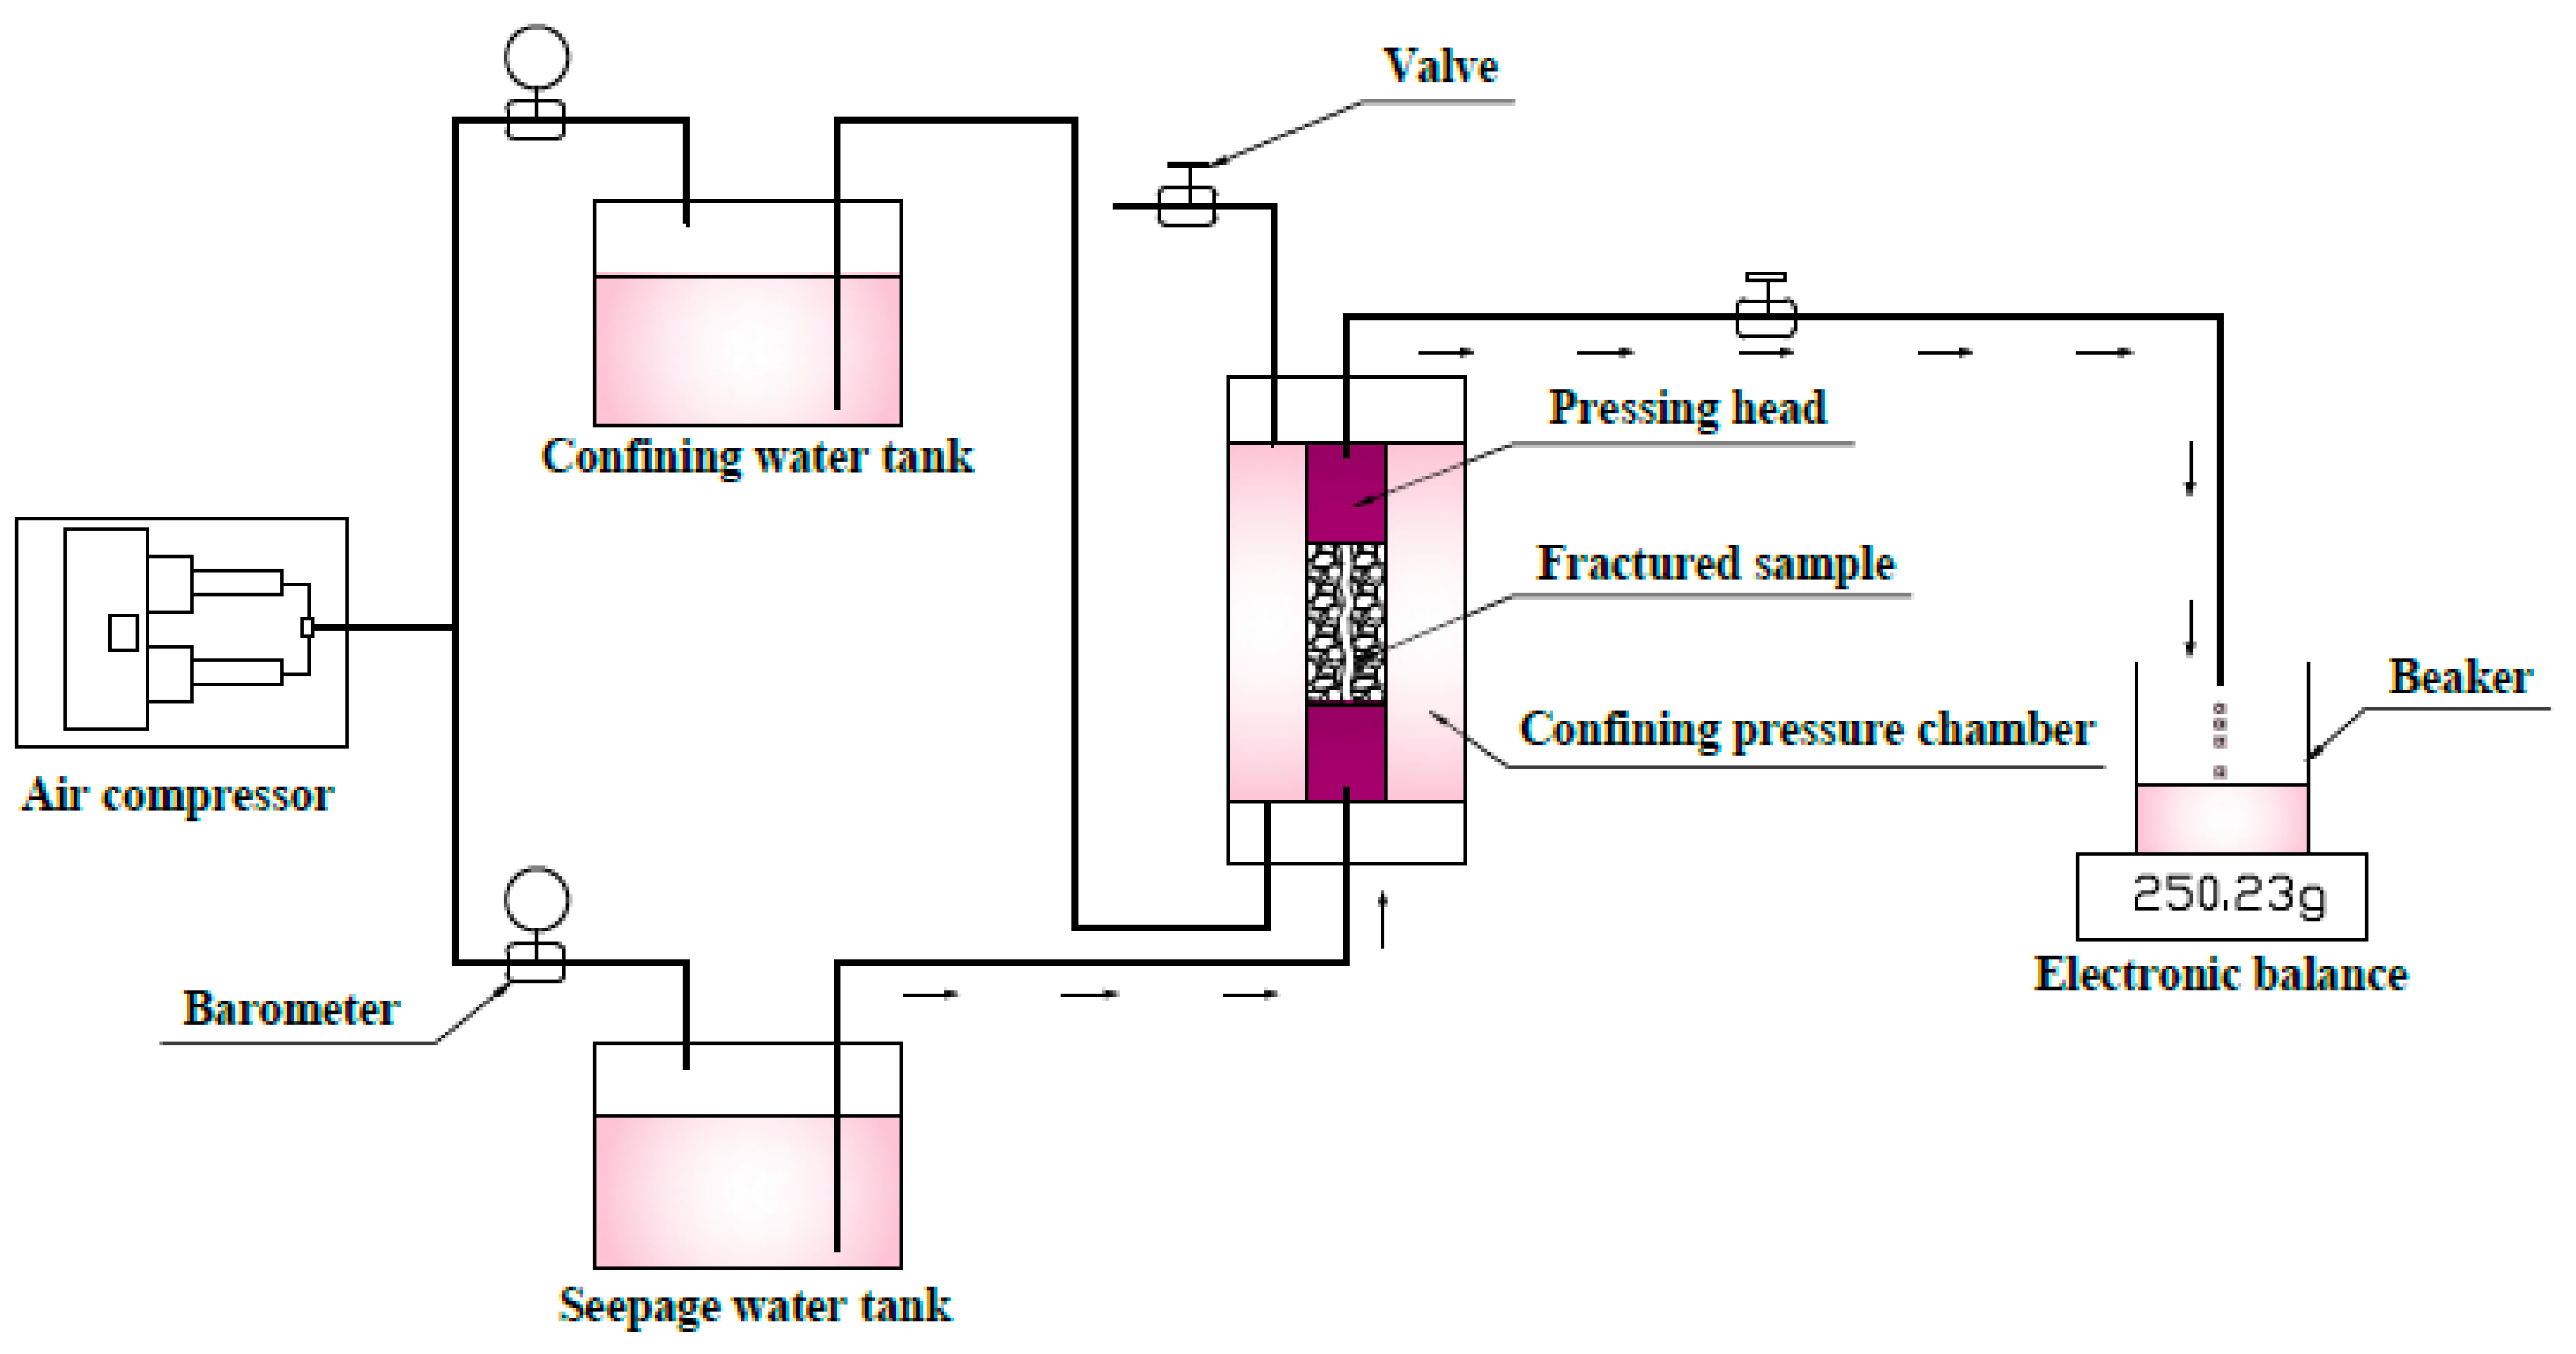
2.3. Experimental Setup

The device used for the flow-through tests is mainly composed of air compressor, confining water tank, water container, and sample-fixing chamber, as shown in Figure 4. The air compressor can deploy pressures from 0 to 500 kPa to provide the confining pressure and injection pressure for fluid flow through the fractures. The pressure in the water containers is controlled by a valve that can set an arbitrary pressure. To examine fluid flow through hot rock mass, the samples were heated using a plate heater, which clings to the surface of the confining water tank and can reach a temperature of up to 150 °C. The temperature monitors produced by RKC (Tokyo, Japan) are of REX-C700 (Tokyo, Japan) type and can be adjusted with different types of thermocoupling sensors including E-, K-, J-type galvanic sensors and CU50 (Shanghai, China), Pt100 (Shanghai, China) resistance sensors. The temperature along the flow path was monitored using K thermocoupling sensors, which have a diameter of 1.0 mm and can be placed in the slits of the fracture’s surface. The highest detection temperature was 500 °C and the measuring accuracy was ±1.0 °C. An infrared thermal imager was used to detect infrared radiation (heat) emitted by the object and convert the heat information into a visualized image.

2.4. Testing Process

Hydraulic properties of the fractured granite samples were first examined with varying injection flow pressures, confining pressures, and temperatures. The detailed setup of testing conditions for the flow-through tests is shown in Table 3. The water was pumped in order to flow from the bottom to the top of the samples and the flow rate was measured when it remained stable. The applied injection pressure was set lower than the confining pressure in order to ensure flow fully through the fracture. The hydraulic characteristics were then analyzed based on the measuring records.
The temperature distribution along the flow path in the fractures was also monitored during the flowing test. Five slits were created in the fracture’s surface with an equivalent distance of 24 mm, as shown in Figure 5. The temperature sensors were placed in the slits and fixed using heat-resistant glue. Two parts of the fractured rock masses were then closed and fastened with insulating tape. The tests were conducted with the experimental setup as it is described in Table 4. During the test, all the experimental outputs were acquired with a time interval of 15 min.
In order to observe the thermal evolution of the host rock during the percolation of the cold fluid through the fractures, an additional cube-shaped sample was prepared, as shown in Figure 6. Two heating plates were adopted to increase the temperature of the sample up to 90 °C. At the sample’s surface, the fractures were well covered to prevent a leakage of the fluid. During the test, a cold fluid was injected into the fracture of the sample while the rock temperature was kept stable. The heat transfer process was then monitored by using an infrared thermal camera with a testing range of −10 to +150 °C and an uncertainty of ±2.0% (type: FLIR C2, FLIR System, Inc. Wilsonville, OR, USA).
In this study, the flow characteristics of the fractured granite samples were evaluated by their hydraulic conductivity. The formula of hydraulic conductivity was derived according to Darcy’s law and cubic law [7], which can be formulated as:
K = g b 2 12 v
where K represents the hydraulic conductivity (m/s), g represents the acceleration of gravity (m/s2), b represents the size of the fracture aperture (m), v represents the kinematic viscosity coefficient of the fluid (m2/s).
To obtain the hydraulic conductivity, the aperture size should be first determined. By following the assumptions of the cubic law, the fracture’s aperture can be formulated as:
e = 12 q v g J 3
where e represents the equivalent hydraulic aperture (m), q represents the flow rate per unit width of the fracture (m2/s), J represents the hydraulic gradient in the fracture (-).
The hydraulic conductivity of fractured rock samples can be derived by substituting Equation (2) into Equation (1). The maximum Reynolds number for all the tests in the present work were calculated to be smaller than 301, which indicates a laminar flow in the fractures, thus the application of the cubic law is reasonable [28].
The specific heat exchange rate was assessed to describe the thermal exchange efficiency during the fluid flow through the fractured hot rock. With recording the parameters, including fluid temperature and flow rate, the specific heat exchange rate can be formulated as follows:
Q = q c ( T 2 T 1 )
where Q represents the specific heat exchange rate (J/s), q’ represents the volumetric flow rate of the heat carrier fluid (m3/s), c represents the volumetric heat capacity of the heat carrier fluid (J/m3·°C), T1 represents the inlet fluid temperature (°C), T2 represents the outlet fluid temperature (°C).

3. Results and Discussion

3.1. Hydraulic Properties

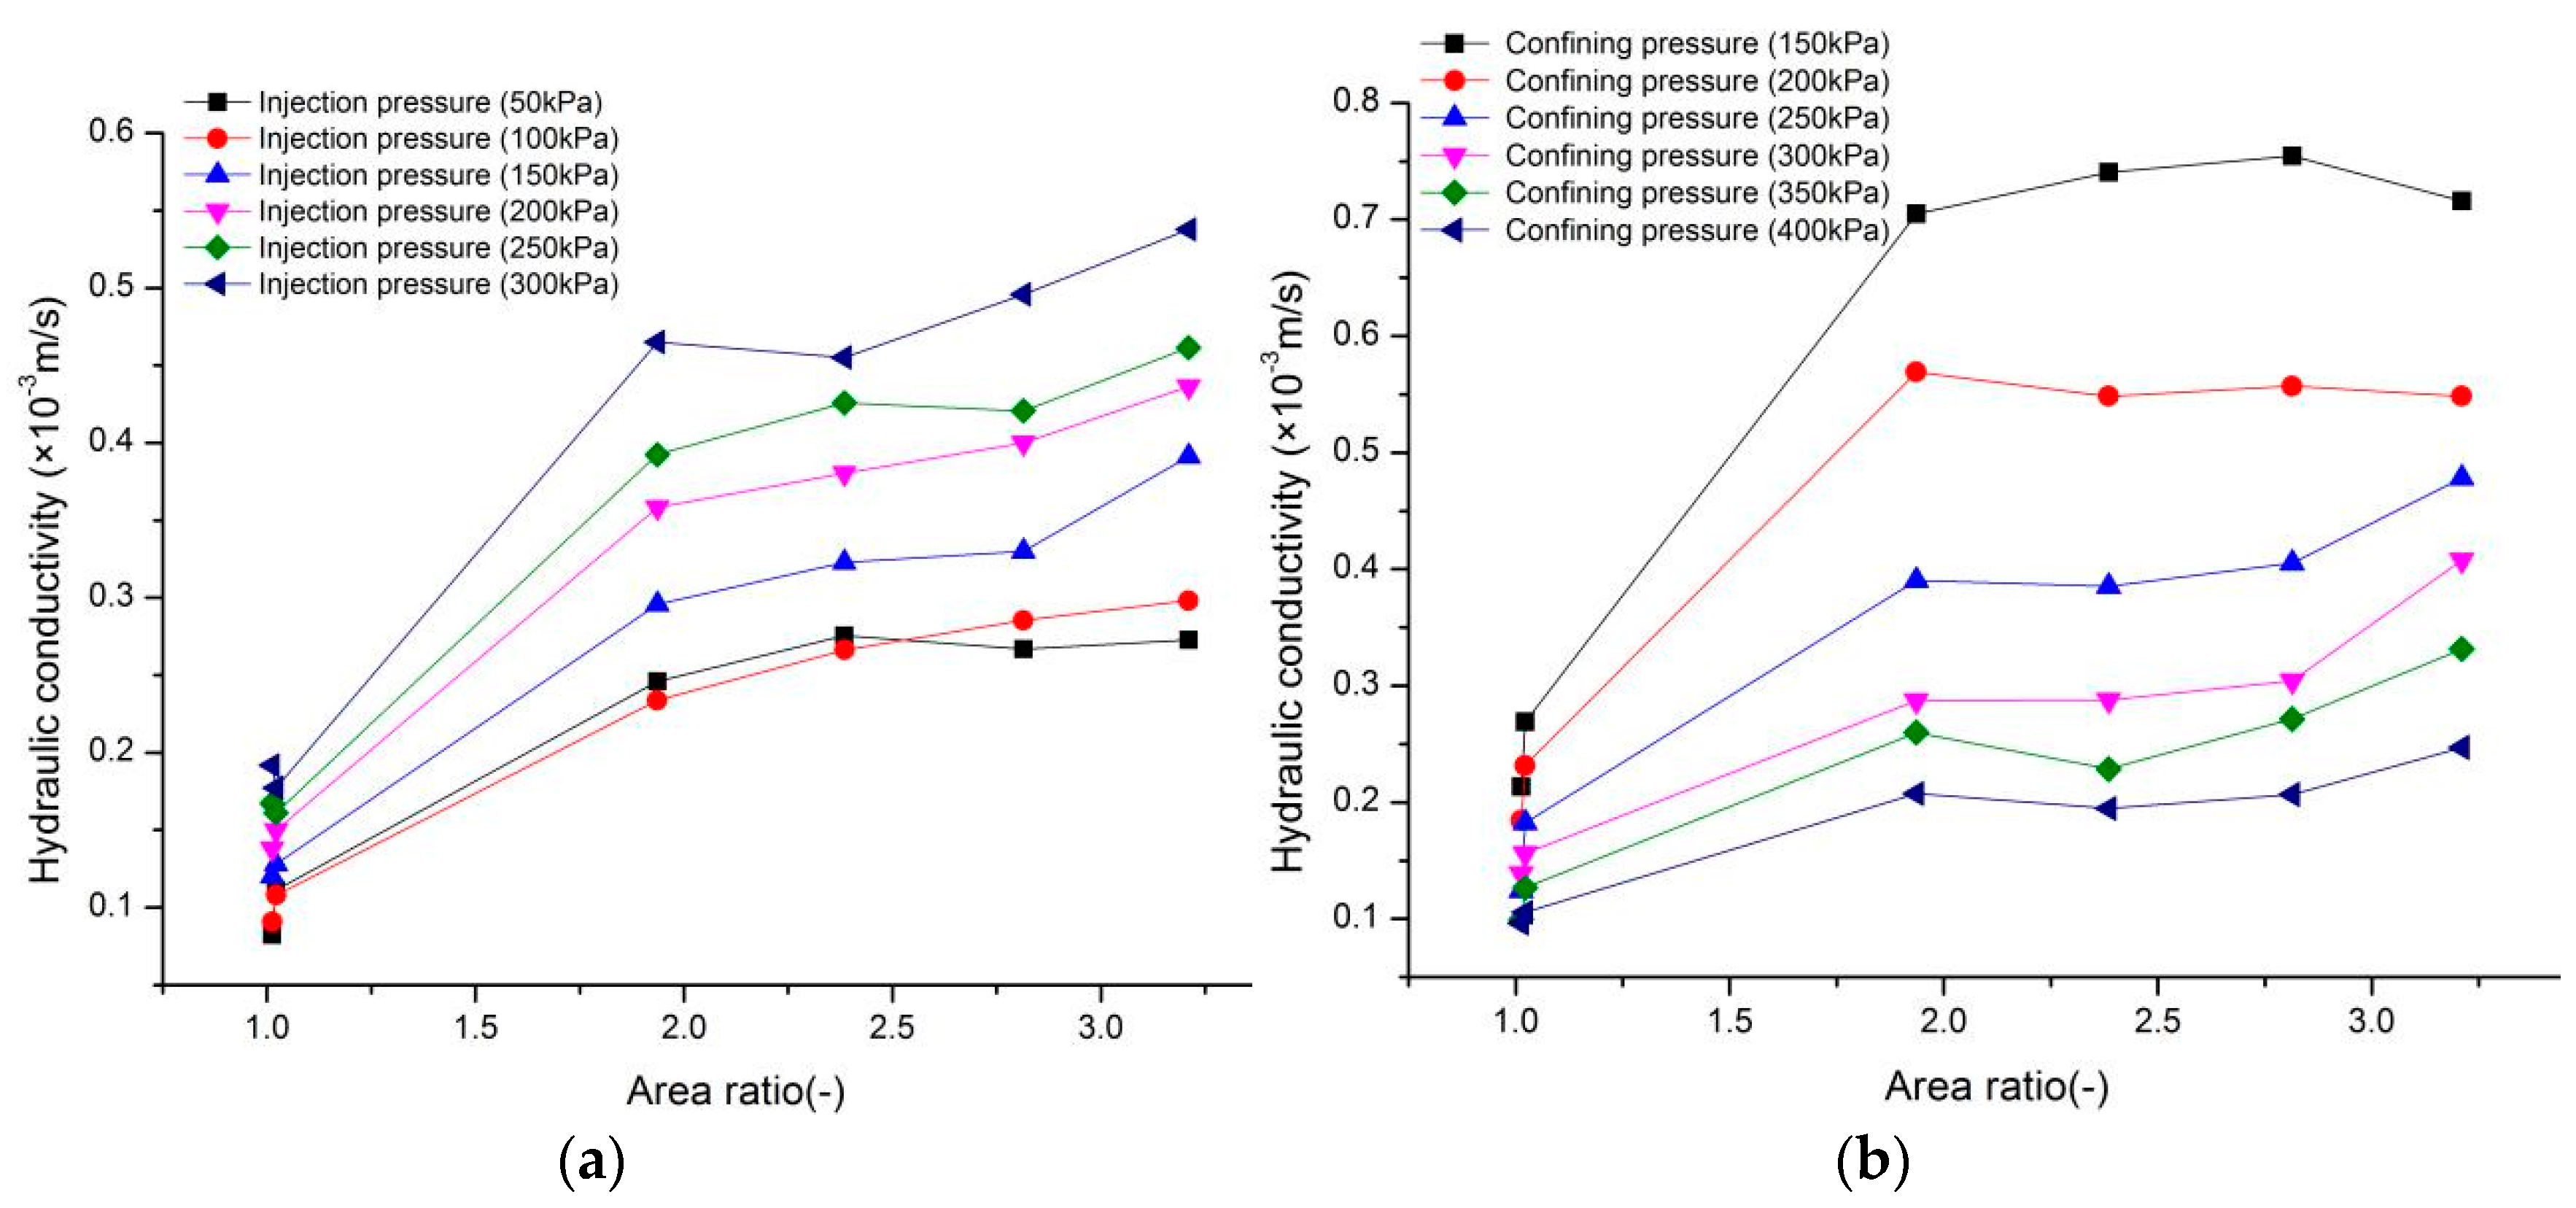
3.1.1. Effects of Injection Pressure

To exploit geothermal energy from hot fractured rock mass, cold water must be injected to circulate through the fractures. Injection pressure is one of the important factors for an efficient geothermal exploitation of an HDR geothermal reservoir. In order to understand the influences of hydraulic injection pressure on hydraulic permeability, the tests were carried out under a constant confining pressure of 400 kPa. The obtained results are plotted in Figure 7.
The fluid flow rate through the fracture generally increased with rising injection pressure, as shown in Figure 7a. The hydraulic conductivity increased with rising injection pressure, as displayed in Figure 7b. It can be considered that a higher injection pressure will produce a larger fracture aperture. On the other hand, the fluid flow through a rough fracture sample faster than that of the plane fractures with the same injection pressure. This can be attributed to the roughness of the fractures. The morphological characteristics of fractures are reported to have great influence on hydraulic conductivity [24]. The hydraulic conductivity of rough fractured samples is higher than that of plane fractured samples. The rougher the fracture the higher is the hydraulic conductivity, as it is verified by [24].

3.1.2. Influence of Confining Pressure

The change of geo-stress in the field has a great impact on the hydraulic conductivity of the fractured rocks. To quantitatively investigate the effects of pressure on hydraulic properties, different confining pressures were deployed on the fractured granite samples in the hydraulic tests, which were carried out under a constant injection pressure of 100 kPa. Flow rate and hydraulic conductivity under different confining pressures were then analyzed according to the experimental data. The hydraulic conductivity of the samples is shown to decrease with increasing confining pressure (Figure 8). This can be explained by the fact that the confining pressure causes a closure of the fractures, leading to a decrease of the fracture’s aperture. The results show that rock samples with a rough fracture act more sensitively to the confining pressure than samples with plane fractures.

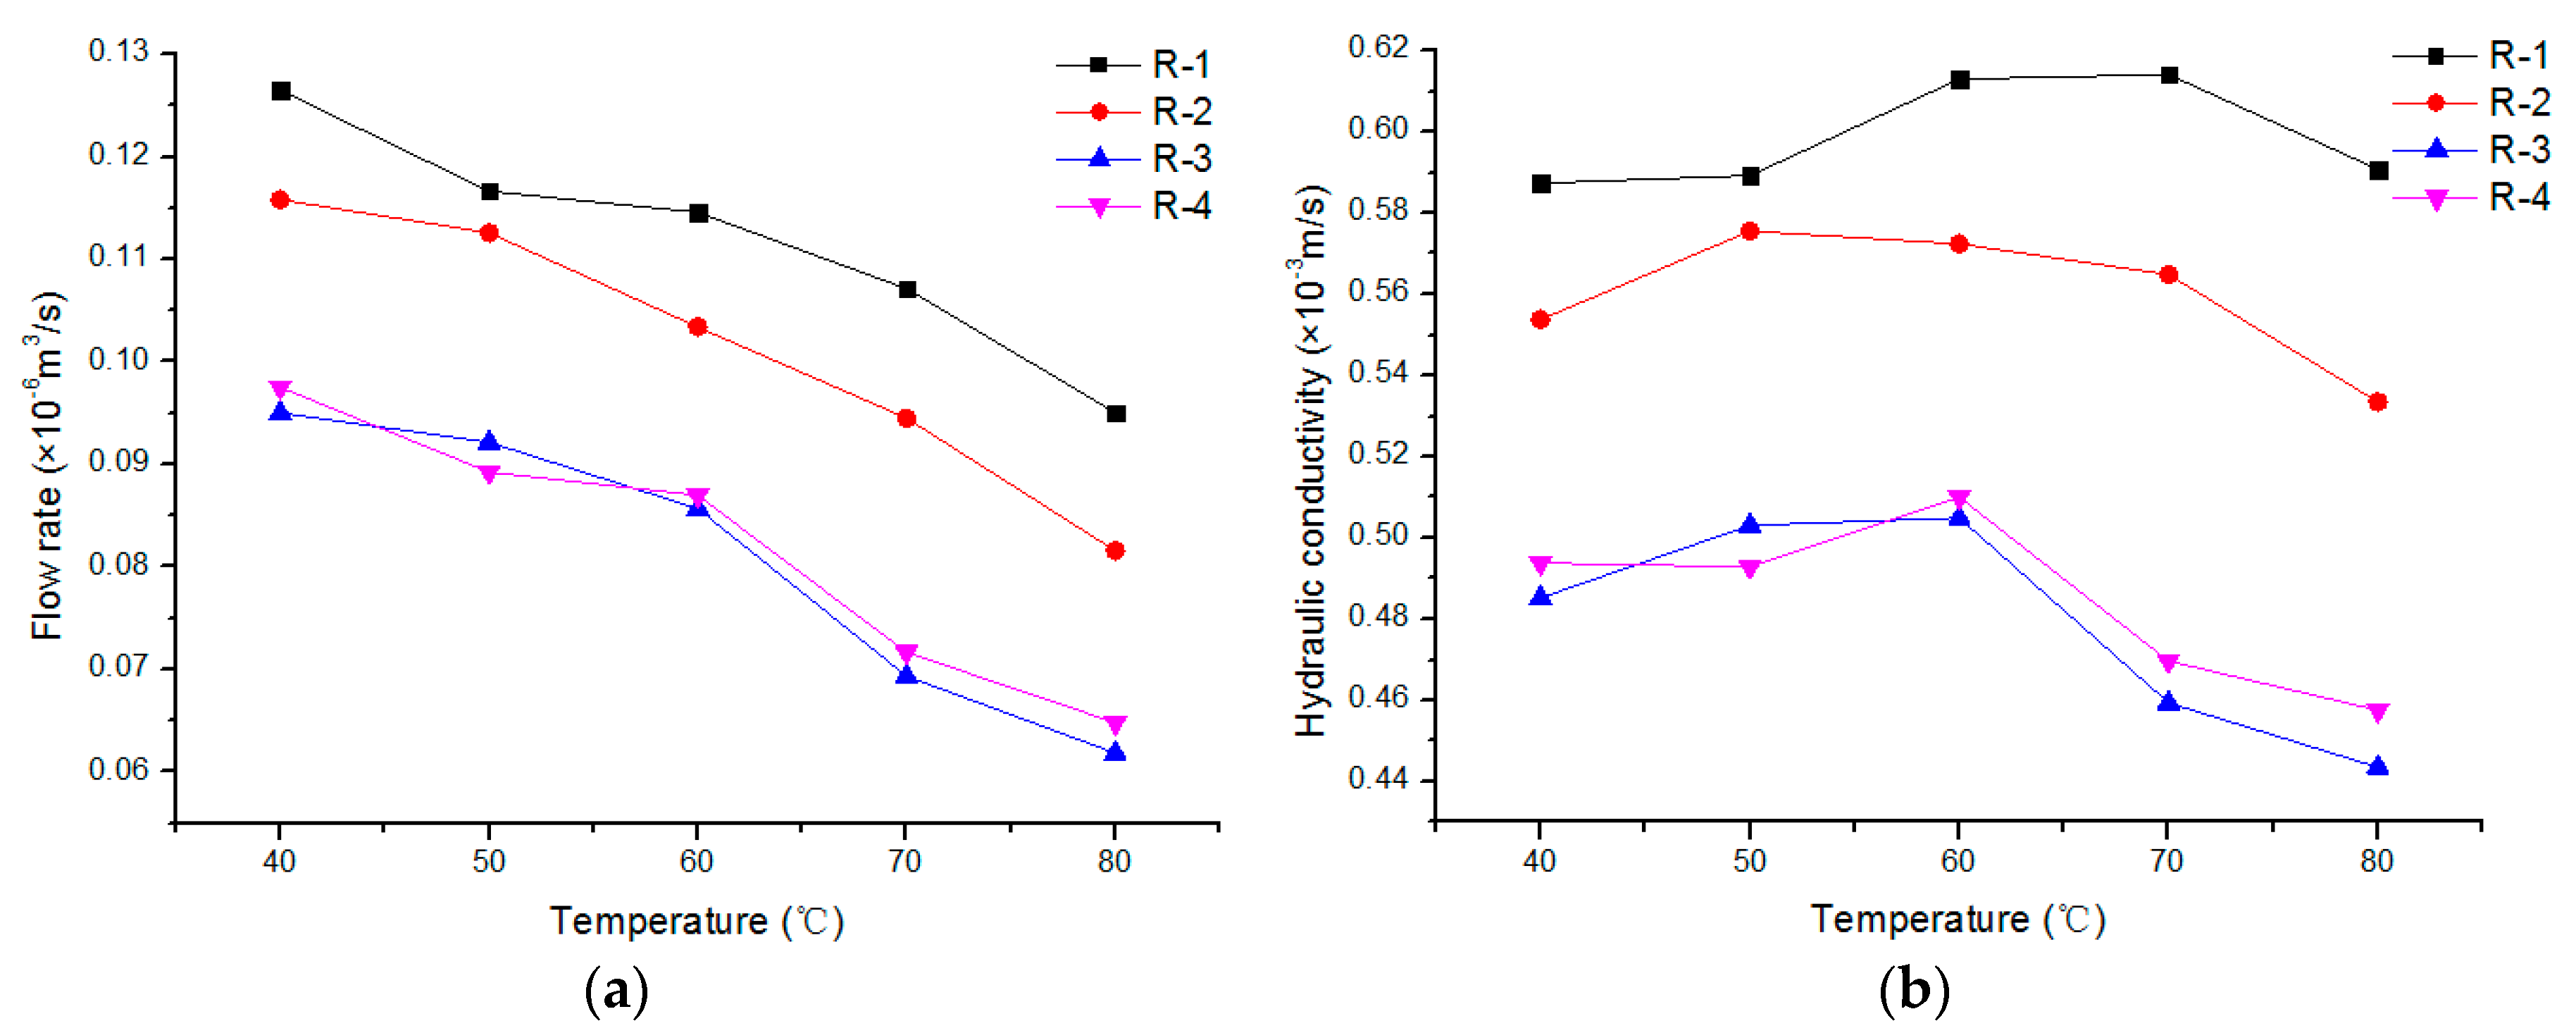
3.1.3. Influence of Temperature on Hydraulic Conductivity

Figure 9a shows that the flow rate decreases with increasing rock temperature, which could be caused by the thermal expansion of minerals, resulting in the reduction of the size of the aperture of the fracture.
On the other hand, the hydraulic conductivity increases first and then decreases with increasing temperature, as shown in Figure 9b. This can be attributed to the hydraulic conductivity depending on both the permeability of the fractures and the properties of the fluid. With increasing temperature, the hydraulic permeability of the fracture declines, and the kinematic viscosity of the fluid decreases as well. As it is shown in Equation (1), the hydraulic conductivity is proportional to the aperture and inversely proportional to the kinematic viscosity of fluid. It has been previously reported that water viscosity decreases from 100.5 × 10⁻⁵ to 28.38 × 10⁻⁵ Pa·s when the temperature increases from 20 to 100 °C (25). The viscosity of the water decreases relatively rapidly at a low temperature range, resulting in an increase of hydraulic conductivity. At high temperatures, the mineral expansion plays a bigger role for the decrease of hydraulic conductivity [26]. Thus, hydraulic conductivity increases first and then decreases with increasing rock temperature, as shown in Figure 9b.

3.1.4. Influence of Area Ratio

Hydraulic properties are determined mainly by the fracture aperture, which is related strongly to the morphology of fractures. Thus, studying the influence of the morphology of fracture’s surface on the flow properties will be helpful to understanding the flow-through process of the fluid through a fractured rock mass. By recording the measurement outputs, the hydraulic conductivity of each fracture under different injection pressures and confining pressures was determined. Figure 10 shows that the hydraulic conductivity is positively related to area ratio. A larger area ratio produces a higher hydraulic conductivity. Area ratio is a parameter used to describe the roughness of the fracture’s surface. The rougher fracture surface, the easier a flow channel can exist, leading to an increase of fracture aperture and hydraulic conductivity [29].

3.2. Heat Transfer Properties of the Fractured Granite

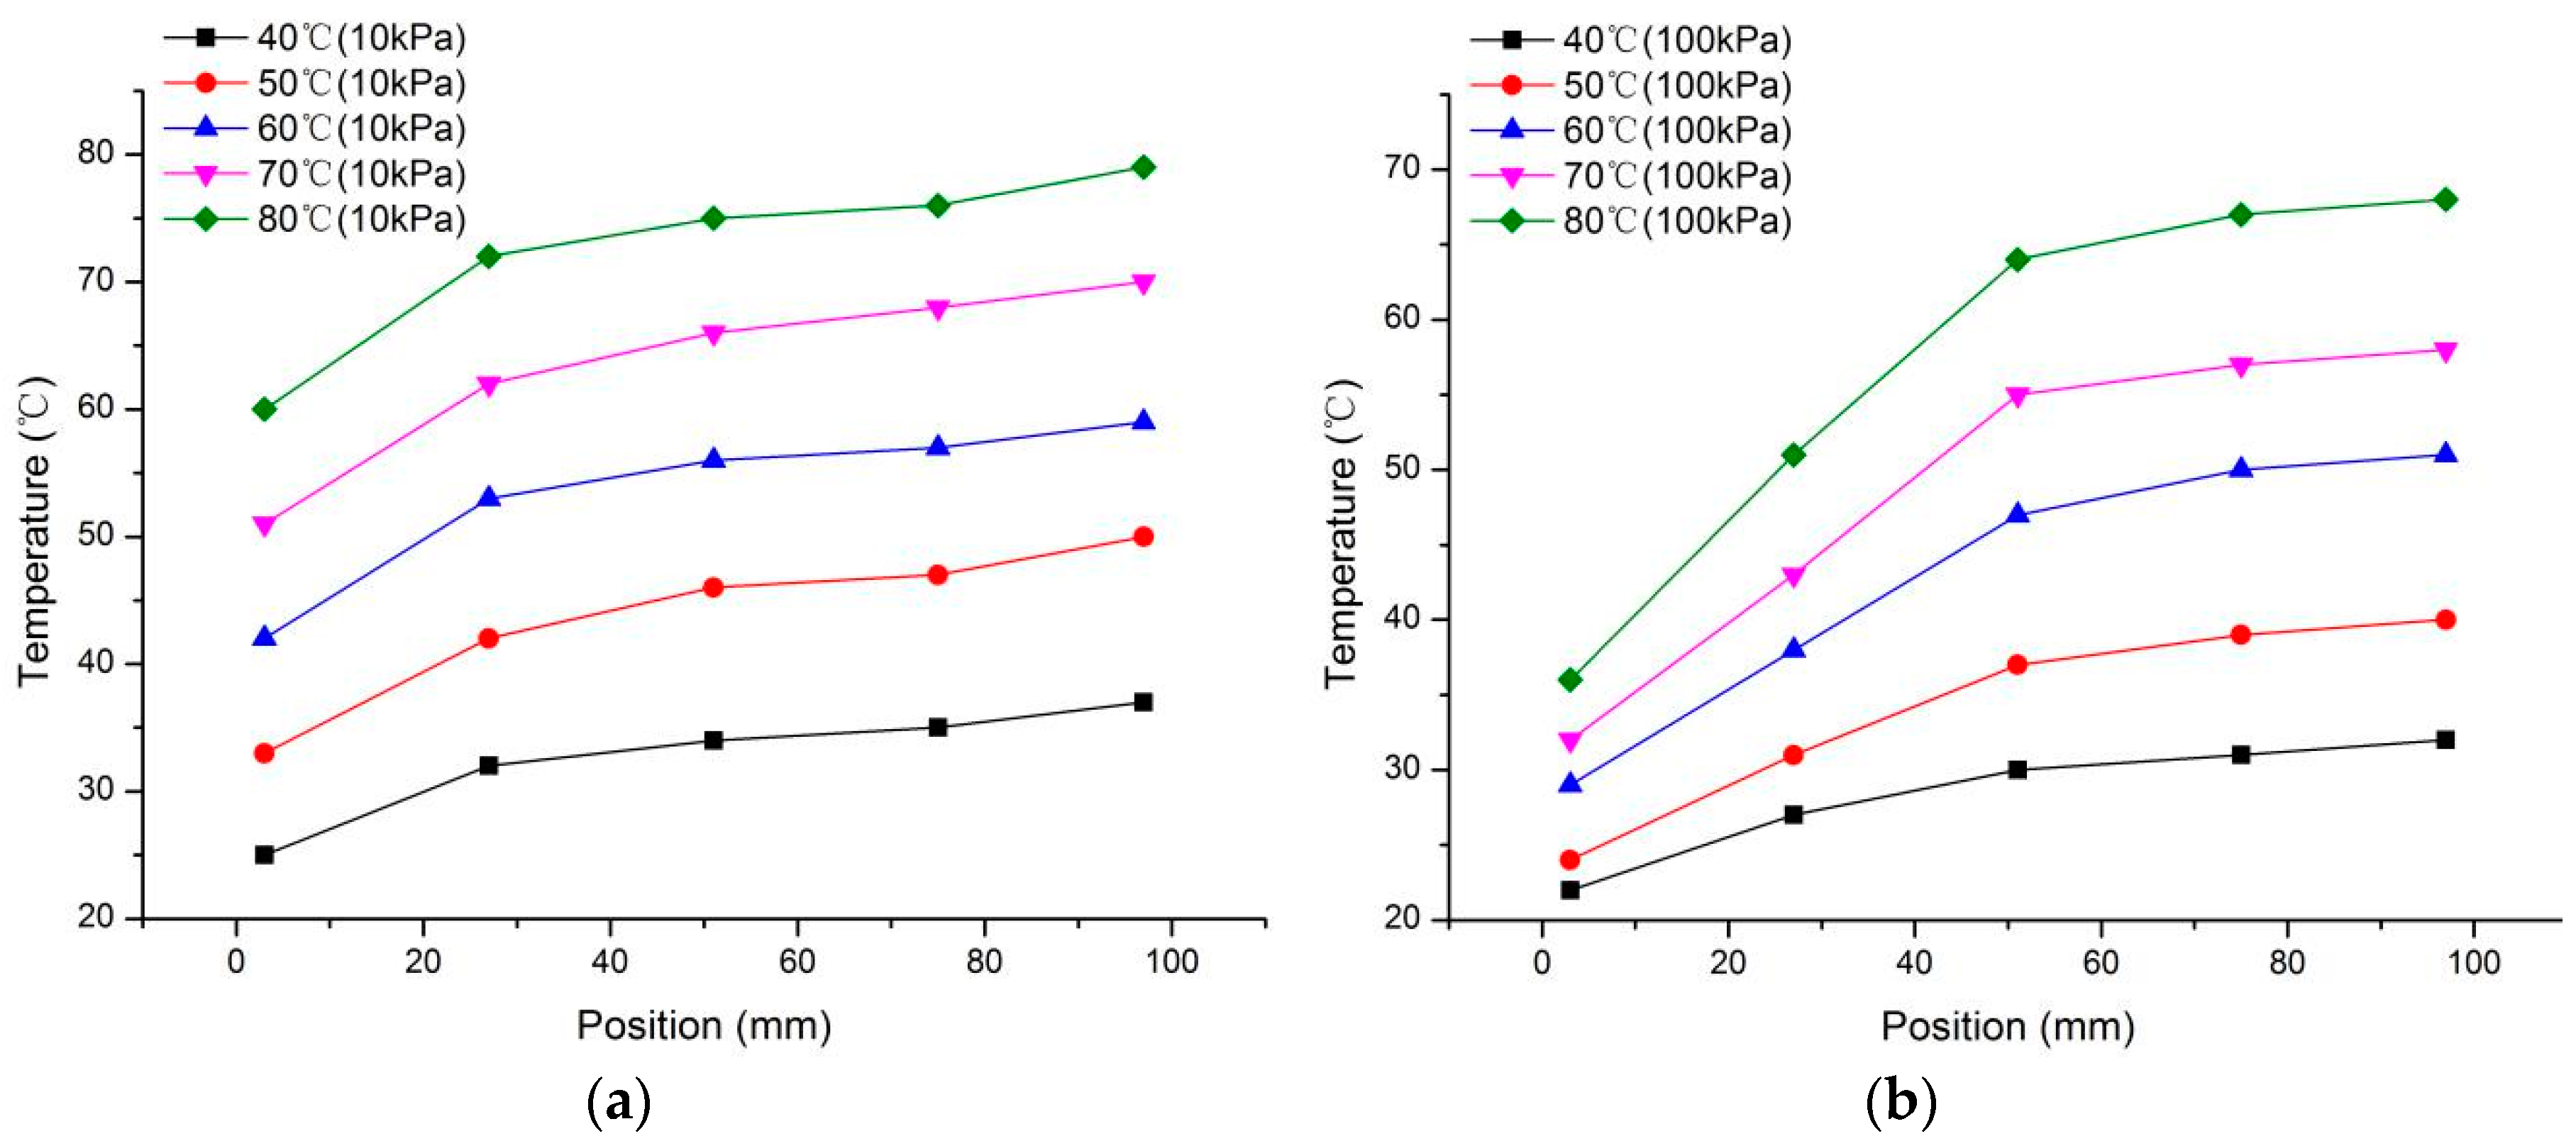
3.2.1. Analysis of Temperature Evolution

The temperature variation of the fracture surface of sample P1 was monitored by temperature sensors positioned along the flow path. Figure 11 shows that the temperature of the fracture surface increases with increasing distance to the fluid inlet. It can be observed that the flow temperature changes in two stages according to the pitch angle of the temperature increase. The first stage has a higher pitch angle, resulting in a drastic temperature change, and the second stage has a slower increasing trend. This phenomenon is caused by heat transfer between the fluid and the rock. At the fluid inlet, the drastic temperature change causes a high heat transfer rate due to the large temperature difference between the fluid and the rock. With heat exchange along the flow path, the fluid temperature increases as well. Thus, the temperature difference between rock and fluid becomes smaller and smaller with increasing flow path. The heat transfer rate is therefore becoming slower and temperature increase is also slower, as shown in Figure 10.
Compared with different injection pressures, the increase of injection pressure will reduce the fluid outlet temperature about 10 °C. By considering the constant heat flux at the fracture’s surface and a certain length of the flow path, the higher speed of the fluid perfusion a lower outlet temperature can be determined. Similarly, the temperature evolution has also two stages. For the tests using 100 kPa, the first stage is relatively two times longer than that of the tests under 10 kPa injection pressure, as shown in Figure 10b. The longer distance of the first stage is also caused by the higher flow velocity of the fluid. Considering that heat flux is similar for both scenarios, the scenarios with faster fluid flow rate need a longer flow distance to reach the same temperature.

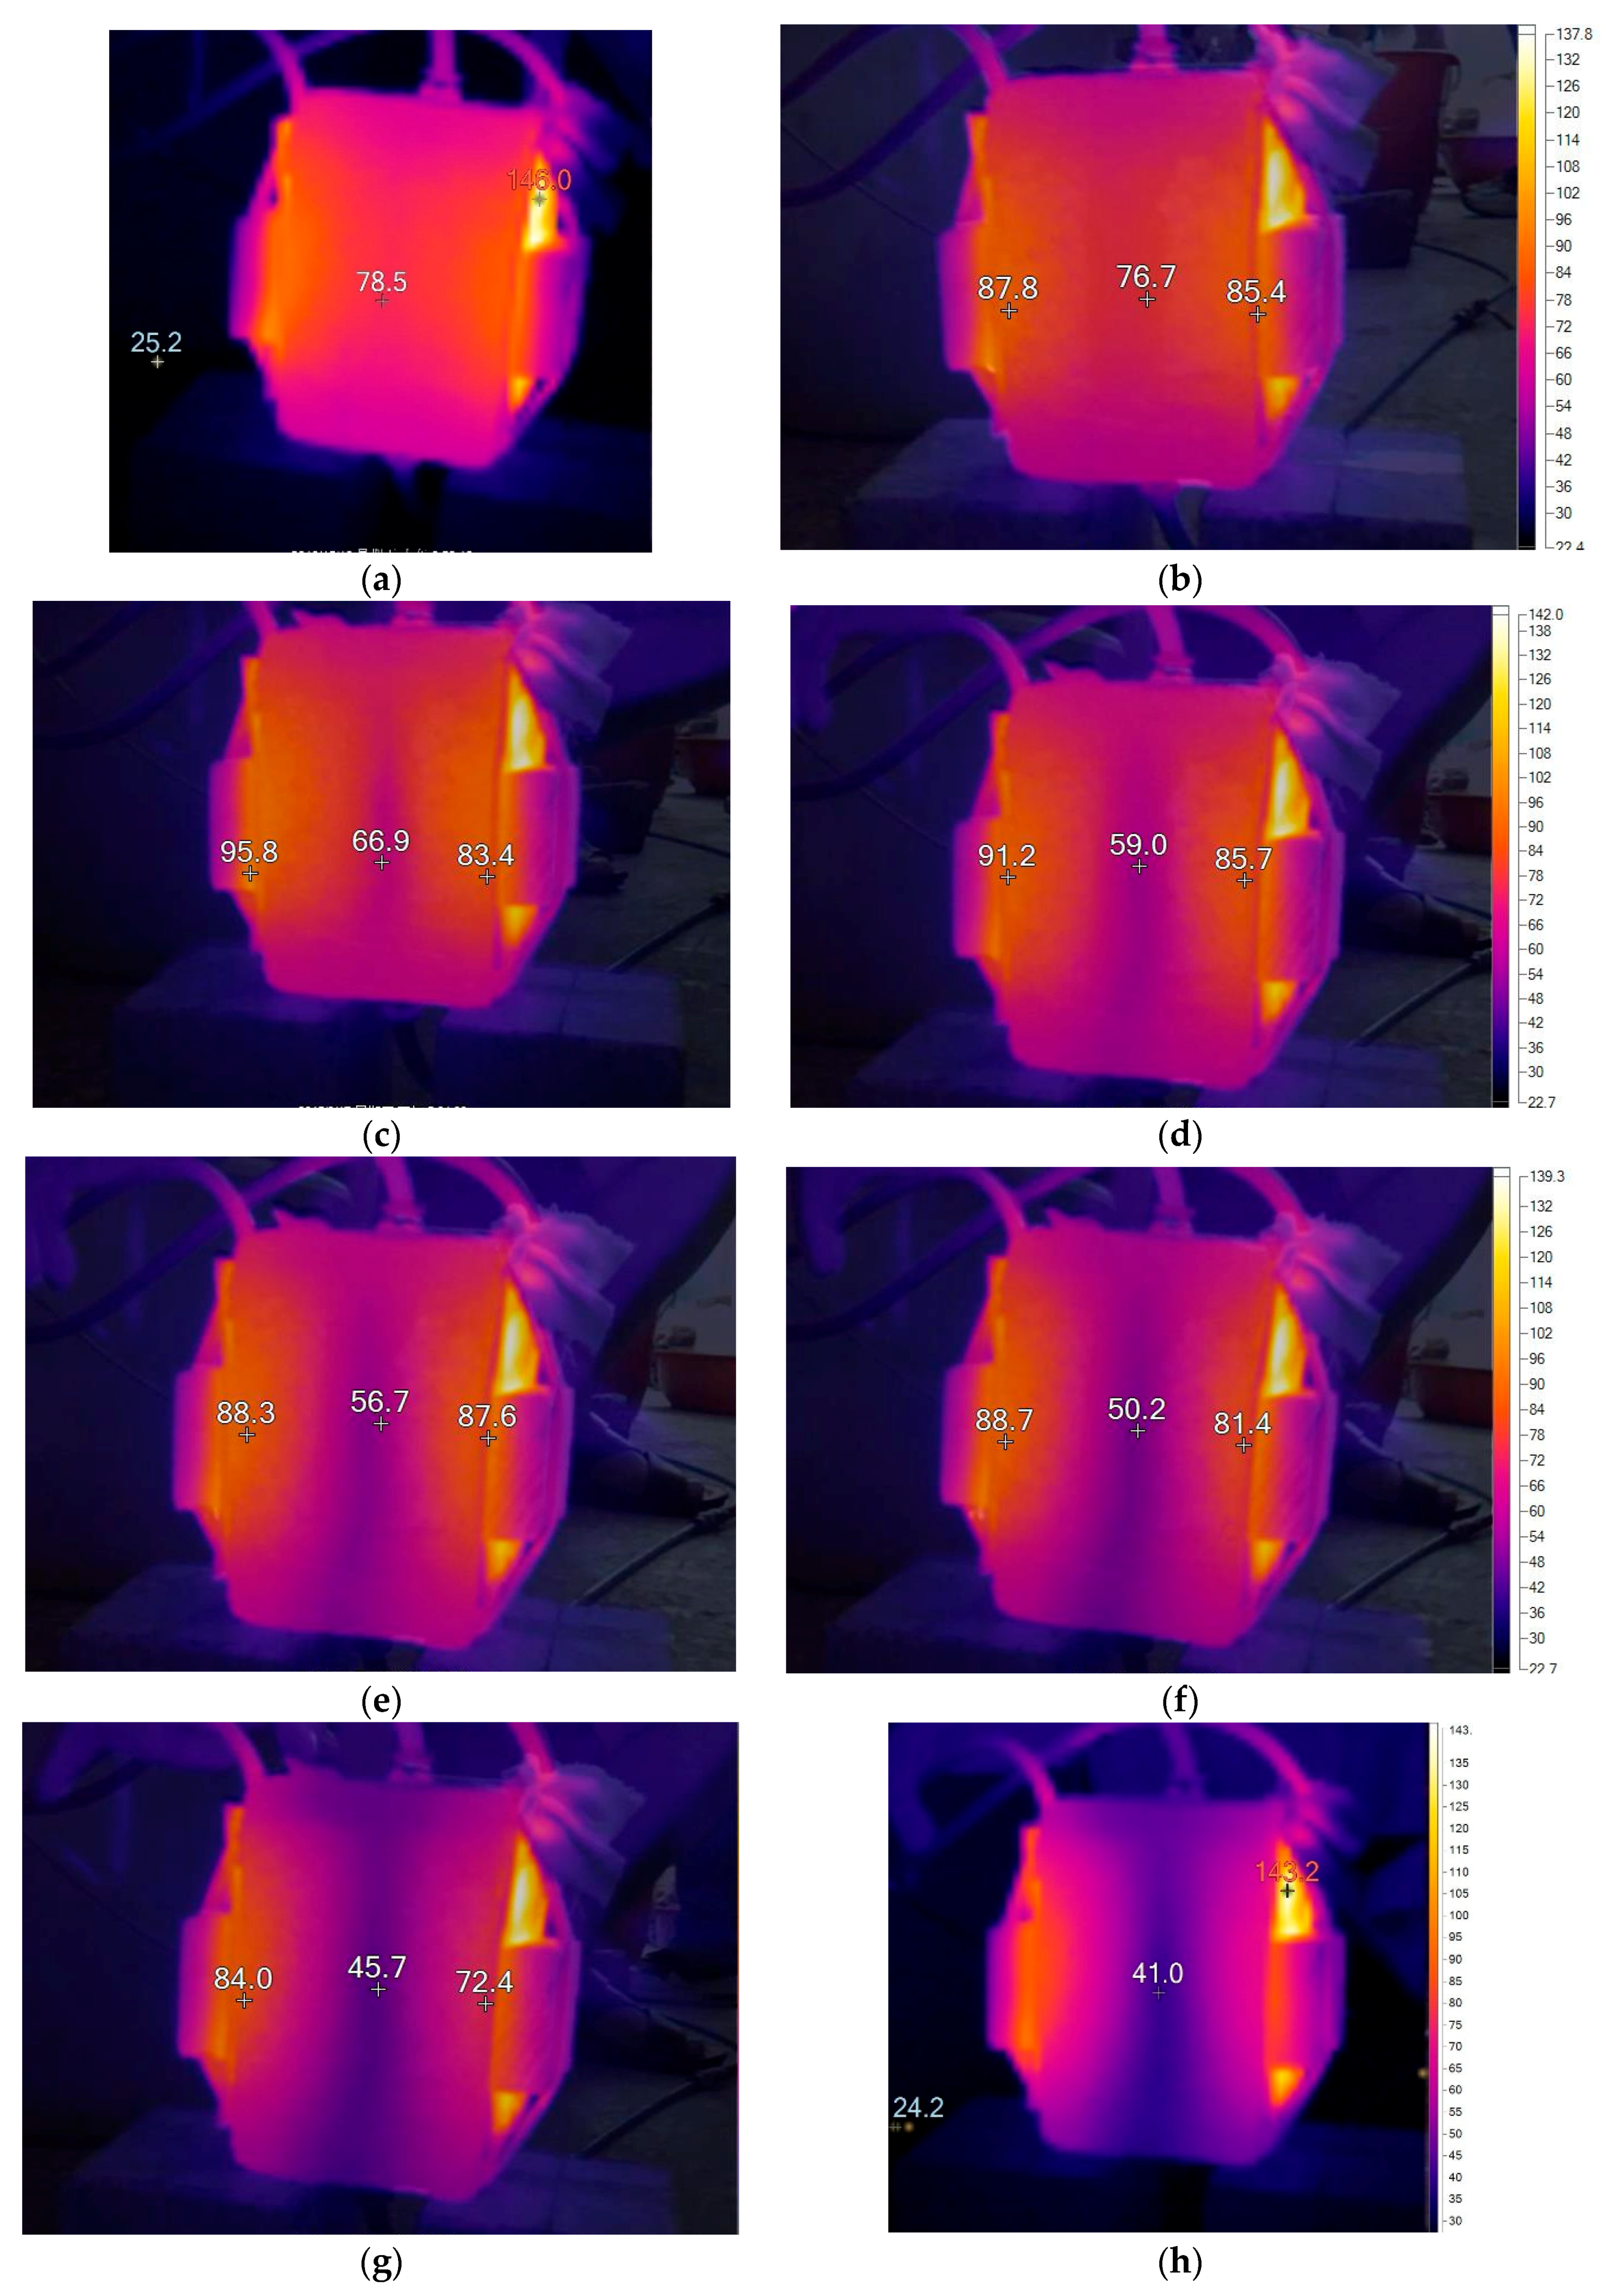
3.2.2. Heat Transport in the Rock Mass

The temperature migration in a rock mass cannot be observed in a traditional triaxial test chamber. In order to study the heat migration in a rock mass during the perfusion of a cold fluid flow through the fractures, an infrared thermal imager is used. In this experiment, the rock sample was heated to about 90 °C using a plane heater. The sample was heated up to a relatively steady state and then fluid with an injection pressure of 15 kPa was applied. During the testing process, an infrared thermal camera was used to detect the temperature variation at the rock surface.
Figure 12 displays the temperature evolution along the fracture and in the rock mass during the testing process. The orange color denotes higher temperature and the blue color depicts a lower temperature. Before the flowing test, the temperature of the heater was set to 146 °C and the rock temperature reached 90 °C. Cold fluid was injected into the fracture when the sample had reached a state of equilibrium. In the fracture, the temperature decreases gradually with increasing test duration (blue-colored line). Later, the blue-colored area propagates to both sides. This can be explained by the fact that the cold water absorbs heat from the rock during its flow through the fractures, resulting in a temperature drop at the sides of the rock mass.
Note that the fluid flows from the bottom to the top of the sample. It can be observed in the photos that the top temperature of the rock sample is higher than that of the bottom. The fluid temperature at the inlet point is relatively low and temperature will keep increasing along the flow path due to the heat exchange with the rock mass. The larger temperature difference between water and rock sample produces a higher heat transfer efficiency. Hence, the rock temperature at the bottom of the sample propagates faster than the top of the sample. The findings indicate that rock temperature varies along the flow path. At the injection point, the rock mass has generally the lowest temperature. A thermal balance will be finally achieved between the fluid and the rock. Thus, the injection rate should be optimized in order to achieve sustainable development of geothermal systems to avoid drastical temperature drops in rock mass.

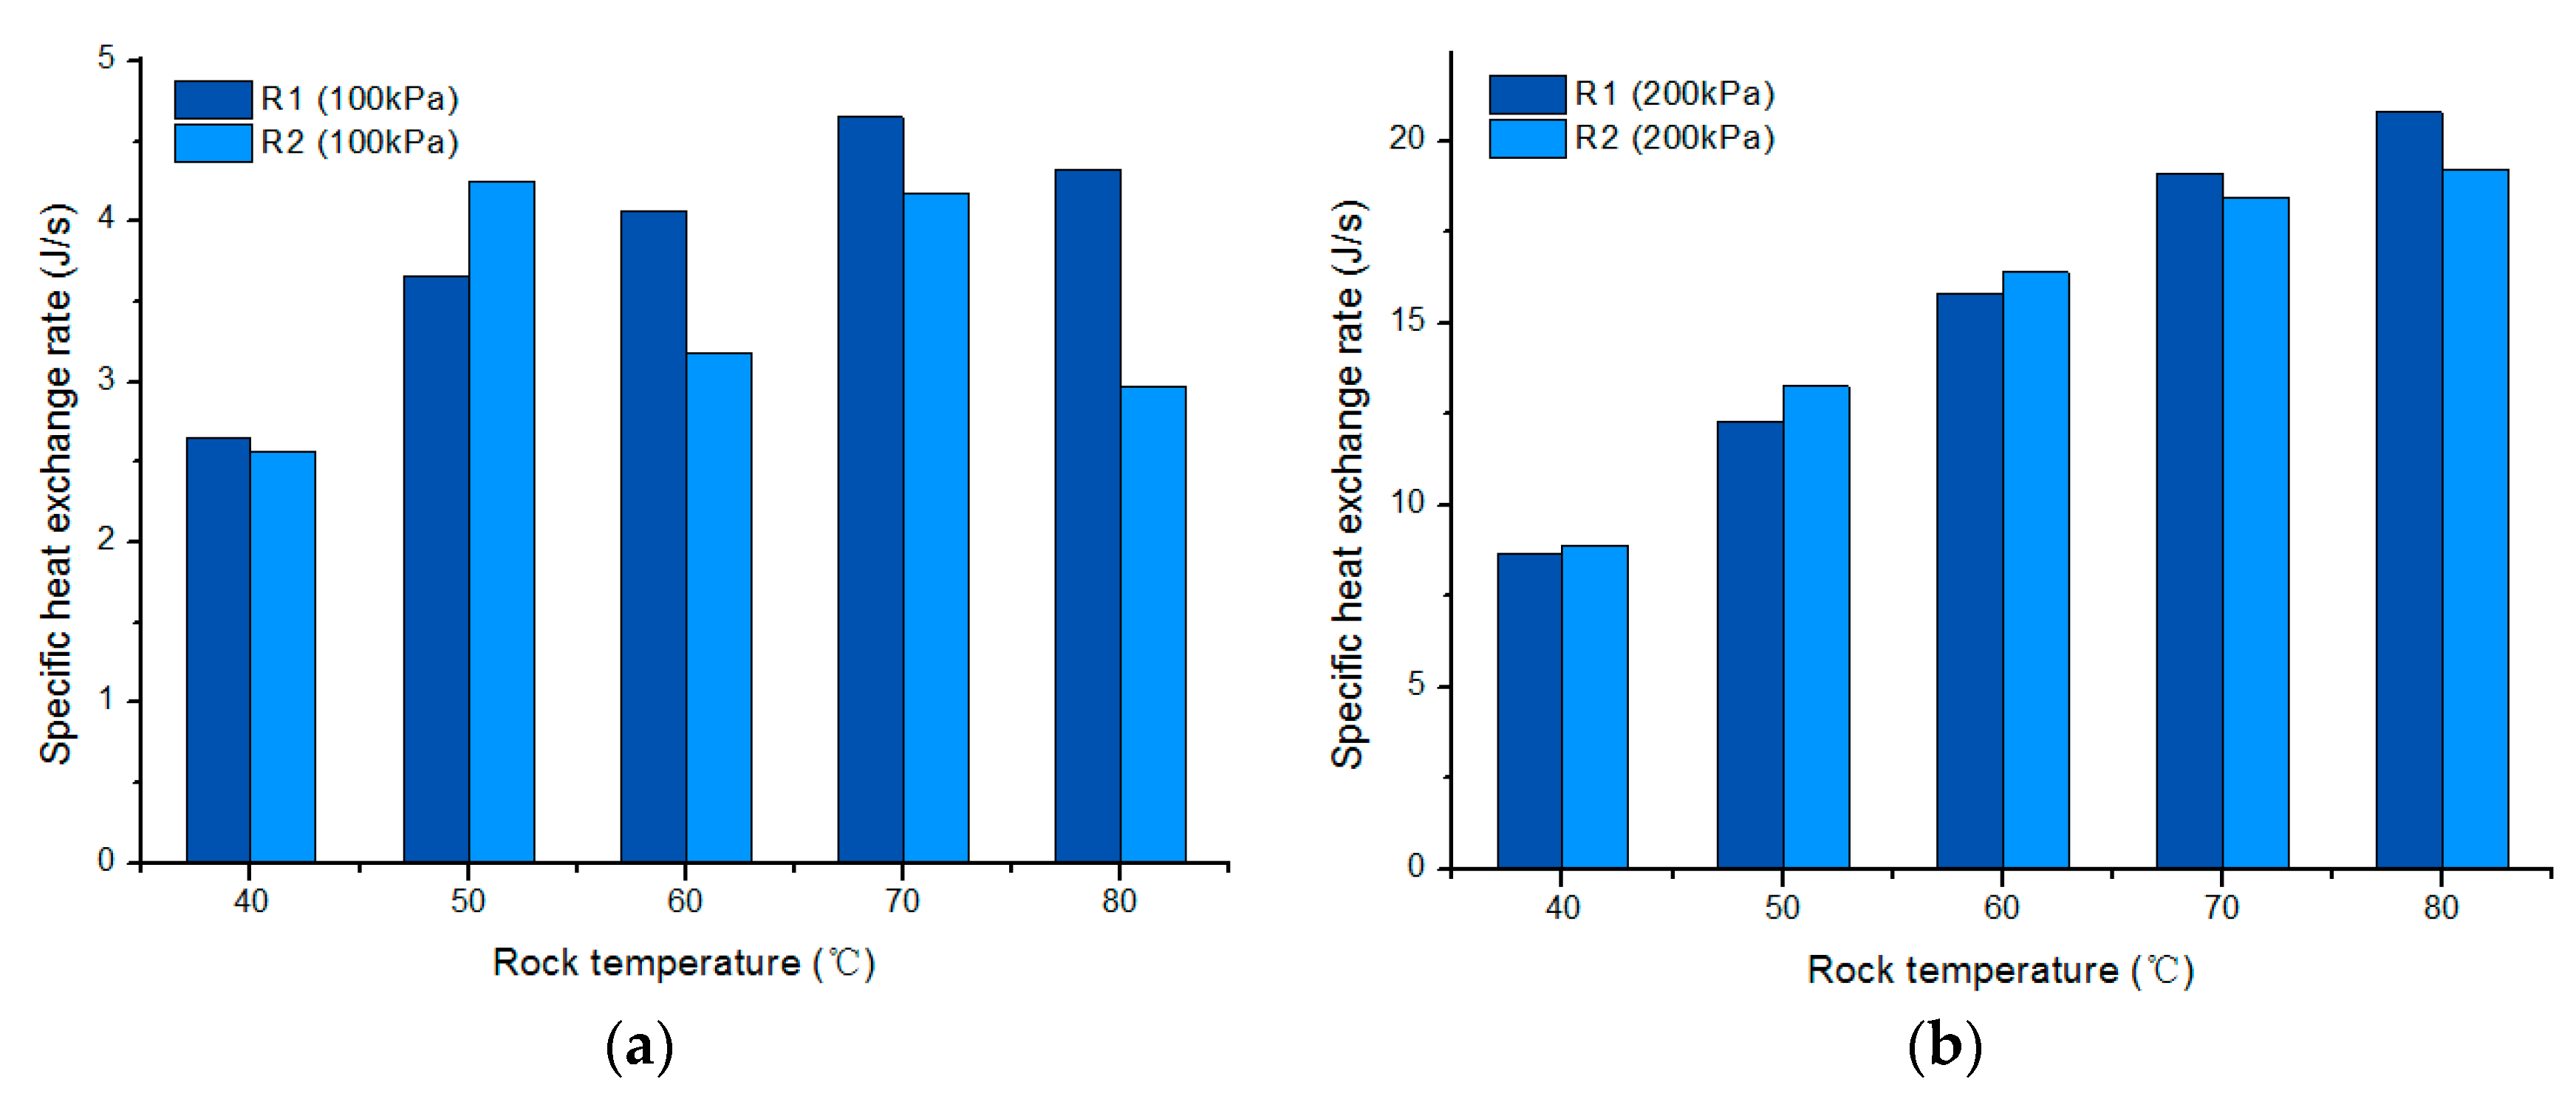
3.2.3. Specific Heat Exchange Rate

According to the study described above, the fluid flow rate was increased and the outlet fluid temperature was decreased when increasing the injection pressure. In order to clarify the effects for geothermal energy exploitation, the heat exchange rate needs to be determined. The heat exchange rate is essential for the evaluation of the total amount of heat that is carried by flow transport per unit time. In the present work, the influence of temperature and injection pressure on the specific heat transfer exchange rate was investigated by R1 and R2 under a confining pressure of 400 kPa and two different injection pressures.
Under the injection pressure of 100 kPa, the heat transfer exchange rate fluctuates with increasing rock temperature, as shown in Figure 13a. The effective stress ratio is defined by the quotient of minimum stress and maximum stress. In the present work, the effective stress ratio was determined as the injection pressure divided by the confining pressure. When the effective stress ratio is 1:4, the fluid flow rate is determined by many factors, including effective stress and temperature of the rock mass. Therefore, an unstable output of the heat exchange rate can be observed with increasing rock temperature. By increasing the effective stress ratio to 1:2, the heat transfer exchange rate is positively related to the rock temperature, as shown in Figure 13b. With increasing rock temperature, the energy exchange rate increases proportionally. It has to be considered that, under a larger effective stress the injection pressure plays a determinative role in heat exchange rate.
The specific heat transfer exchange rate of the rough fractured rock sample increases by a factor of 2.16–2.40 when the rock temperature increases from 40 to 80 °C with an injection pressure of 200 kPa and a confining pressure of 400 kPa. By comparison with two different injection pressures of 100 kPa and 200 kPa, the factor of the specific heat transfer exchange rate increases from 3.12 to 6.46. Thus, either increasing injection pressure or reaching a high temperature of rock at relatively high effective stress can effectively improve the productivity of a geothermal field. This study gives some implications to the practical exploitation of a fractured geothermal reservoir, in which the effective stress ratio should be well designed to optimize the production.

4. Conclusions

This study investigated hydraulic and heat transfer characteristics of the perfusion of a fluid through fractured rocks. Samples were collected from Gonghe basin of Qinghai province in China, which has a high potential for geothermal energy production. Two sets of rock samples—one with plane fracture surface and one with rough fracture surface—were prepared. Hydraulic properties were tested with varying injection pressures, confining pressures, and temperatures. In order to analyze the influence of morphological changes on the hydraulic properties, a 3D morphological numerical model of the fractures was developed and the parameter of area ratio was used. Furthermore, temperature developments along the flow path and energy exchange of the fractured samples were determined. The major conclusions derived from this study are:
  • A 3D digital model was built to analyze the morphological information of the fracture surface of the samples. The parameter of area ratio was used for the evaluation index of a fracture’s roughness. The results show that fractures with a larger value of area ratio have a higher hydraulic permeability. As revealed by the flowing tests, the hydraulic conductivity of rock mass increases with increasing injection pressure. Under constant injection pressure and temperature, the hydraulic conductivity of the rock mass decreases with the increase of confining pressure. Hydraulic conductivity increases first and then decreases with increasing rock temperature.
  • Temperature distribution along the flow path: Fluid temperature keeps increasing along the flow path with an increase of rock temperature. Increase of temperature or decrease of injection pressure will raise the temperature at the same location.
  • Heat transport of the rock samples: Temperature distribution at the fractured rock sample was imaged using an infrared camera. A temperature evolution process can be clearly observed during the injection of cold water into the fracture. The fluid temperature increases first along the fracture, then the rock temperature decreases from the fracture to the host rock. Therefore, the maximum temperature the fluid can reach decreases gradually with time and finally remains stable due to constant rock temperature. The findings indicate that the process of temperature evolution in a fractured rock system during the perfusion of a cold fluid can be revealed by the infrared imaging technique. Thermal gradient, thermal resistance, and even heat flux at the fracture surface can then be assessed quantitatively.
  • The energy exchange rate fluctuates with time due to an unstable flow rate when the effective stress ratio is 1:4. The fluid flow rate is determined by many factors, including effective stress and temperature of the rock mass. By increasing the effective stress ratio to 1:2, the heat transfer exchange rate is positively related to the rock temperature. The specific heat transfer exchange rate of the rough fractured rock sample increases 2.16–2.40 times when the rock temperature increases from 40 to 80 °C with an injection pressure of 200 kPa under a confining pressure 400 kPa. By comparison with two different injection pressures, the specific heat transfer exchange rate increases from 3.12 to 6.46 times. Thus, both an increase of injection pressure and reaching a high temperature of rock mass can effectively improve the productivity of a geothermal plant.

Author Contributions

Jin Luo and Wei Xiang conceived and designed the experiments; Qiang Zhao performed the experiments; Yumeng Qi and Jin Luo analyzed the data and prepared the manuscript; Joachim Rohn contributed to the experimental design and gave important suggestion about the entire content.

Acknowledgments

The authors would like thank the funding provided by National Natural Science Foundation of China (NSFC) (authorized No. 41502238). This work is also supported by the Fundamental Research Funds for the Central Universities, China University of Geosciences (Wuhan) No. CUGL150818. The financial support provided by China Scholarship Council during a visit at University of California, Berkeley is deeply appreciated.

Conflicts of Interest

The authors declare no conflict of interest.

References

  1. Xu, T.; Zhang, Y.; Zeng, Z.; Bao, X. Technology progress in an enhanced geothermal system (Hot Dry Rock). Sci. Technol. Rev. 2012, 30, 42–45. [Google Scholar]
  2. Bолоцъло, И. Ф Кметодике лабораториого изучния подземных вод. Гuброzеоzuя Инэюеерная Гuолozuя 1941, 30–38. [Google Scholar]
  3. Lomize, G.M. Flow in Fractured Rocks; Gosemergoizdat: Moscow, Russia, 1951. [Google Scholar]
  4. Poмм, E.C. Flow Characteristics in Fractured Rocks; Издательстьо: Moscow, Russia, 1966. [Google Scholar]
  5. Louis, C.; Maini, Y.N. Determination of in-situ hydraulic parameters in jointed rock. Int. Soc. Rock Mech. Proc. 1970, 1, 235–245. [Google Scholar]
  6. Louis, C. A Study of Groundwater Flow in Jointed Rock and Its Influence on the Stability of Rock Masses; Imperial College: London, UK, 1969. [Google Scholar]
  7. Louis, C. Rock Hydraulics in Rock Mechanics; Springer: New York, NY, USA, 1974. [Google Scholar]
  8. Liu, Y.C.; Cai, Y.Q.; Liu, Q.S.; Wu, Y.S. Thermal-hydraulic-mechanical coupling constitutive relation of rock mass fracture interconnectivity. Chin. J. Geotech. Eng. 2001, 23, 196–200. [Google Scholar] [CrossRef]
  9. Zheng, S.H.; Zhao, Y.S.; Duan, K.L. An experimental study on the permeability law of natural fracture under 3-D stresses. Chin. J. Rock Mech. Eng. 1999, 18, 133–136. [Google Scholar] [CrossRef]
  10. Wang, Y. Coupling characteristic of stress and fluid flow within a single fracture. Chin. J. Rock Mech. Eng. 2002, 21, 83–87. [Google Scholar] [CrossRef]
  11. Jiang, Y.J.; Li, B.; Wang, G.; Li, S. New advances in experimental study on seepage characteristics of rock fractures. Chin. J. Rock Mech. Eng. 2008, 27, 2377–2386. [Google Scholar] [CrossRef]
  12. Xiong, Y.B.; Zhang, C.H.; Wang, E.Z. A review of steady state seepage in a single fracture of rock. Chin. J. Rock Mech. Eng. 2009, 28, 1839–1847. [Google Scholar]
  13. Kuhlman, K.L.; Malama, B.; Heath, J.E. Multiporosity flow in fractured low-permeability rocks. Water Resour. Res. 2015, 51, 848–860. [Google Scholar] [CrossRef]
  14. Warren, J.E.; Root, P.J. The Behavior of Naturally Fractured Reservoirs. Soc. Petrol. Eng. J. 1963, 3, 245–255. [Google Scholar] [CrossRef]
  15. Clossman, P.J. An aquifer model for fissured reservoirs. Soc. Petrol. Eng. J. 1975, 15, 385–398. [Google Scholar] [CrossRef]
  16. Chen, Y.D.; Liang, W.G.; Lian, H.J.; Yang, J.F.; Nguyen, V.P. Experimental study on the effect of fracture geometric characteristics on the permeability in deformable rough-walled fractures. Int. J. Rock Mech. Min. Sci. 2017, 98, 121–140. [Google Scholar] [CrossRef]
  17. Zhang, W.; Dai, B.B.; Liu, Z.; Zhou, C.Y. Modeling free-surface seepage flow in complicated fractured rock mass using a coupled RPIM-FEM method. Transp. Porous Media 2017, 117, 443–463. [Google Scholar] [CrossRef]
  18. Zhang, Y.J. Coupled thermo-hydro-mechanical model and finite element analyses of dual-porosity fractured medium for ubiquitous-joint rock mass. Chin. J. Rock Mech. Eng. 2009, 28, 946–955. [Google Scholar] [CrossRef]
  19. Xiang, Y.Y.; Ren, P. A theoretical model and its calculation analysis of water flow and heat transfer in a fractured rock with local fracture wall asperity contacts. Rock Soil Mech. 2014, 35, 2845–2854. [Google Scholar]
  20. Dong, H.Z.; Luo, R.H.; Zhang, L. Seapage and heat transfer model of a single fracture of rock and relevant parameter sensitivity analysis. J. Hohai Univ. (Nat. Sci.) 2013, 41, 42–47. [Google Scholar] [CrossRef]
  21. Zhao, J. Experimental study of flow-rock heat transfer in rock fractures. Chin. J. Rock Mech. Eng. 1999, 18, 119–123. [Google Scholar] [CrossRef]
  22. He, Y.L.; Yang, L.Z. Mechanism of effects of temperature and effective stress on permeability of sandstone. Chin. J. Rock Mech. Eng. 2005, 24, 2420–2427. [Google Scholar] [CrossRef]
  23. Huang, W.B.; Cao, W.J.; Guo, J.; Jiang, F.M. An analytical method to determine the fluid-rock heat transfer rate in two-equation thermal model for EGS heat reservoir. Int. J. Heat Mass Transf. 2017, 113. [Google Scholar] [CrossRef]
  24. Li, Z.W.; Feng, X.T.; Zhang, Y.J.; Zhang, C.; Xu, T.F.; Wang, Y.S. Experimental research on the convection heat transfer characteristics of distilled water in manmade smooth and rough rock fractures. Energy 2017, 133, 206–218. [Google Scholar] [CrossRef]
  25. Luo, J.; Zhu, Y.; Guo, Q.; Tan, L.; Zhuang, Y.; Liu, M.; Zhang, C.; Xiang, W.; Rohn, J. Experimental investigation of the hydraulic and heat-transfer properties of artificially fractured granite. Sci. Rep. 2017, 7, 39882. [Google Scholar] [CrossRef] [PubMed]
  26. Yasuhara, H.; Polak, A.; Mitani, Y.; Grader, A.S.; Halleck, P.M.; Elsworth, D. Evolution of fracture permeability through fluid–rock reaction under hydrothermal conditions. Earth Planet. Sci. Lett. 2006, 244, 186–200. [Google Scholar] [CrossRef]
  27. Schober, A.; Exner, U. 3D structural modelling of an outcrop-scale fold train using photogrammetry and GPS mapping. Aust. J. Earth Sci. 2011, 104, 73–79. [Google Scholar]
  28. Yanqing, W. Basic theory for rock hydraulics. Hydrogeol. Eng. Geol. 1997, 1, 24–28. [Google Scholar]
  29. Raven, K.G.; Gale, J.E. Water flow in a natural rock fracture as a function of stress and sample size. Int. J. Rock Mech. Min. Sci. Geomech. Abstr. 1985, 22, 251–261. [Google Scholar] [CrossRef]
Figure 1. Two sets of granite samples with single fracture: (a) Samples with plane fracture, P1–P2; (b) Samples with rough fracture, R1–R4.
Energies 11 01228 g001
Figure 2. Sketch of fracture surface and its projection area. The area ratio parameter was defined to divide the fracture surface by the projection area.
Energies 11 01228 g002
Figure 3. 3D model of the rock sample with rough fracture surface.
Energies 11 01228 g003
Figure 4. Sketch of the flow testing device.
Energies 11 01228 g004
Figure 5. Photo showing the design for the monitoring of the temperature distribution along the flow path: (a) fracture slits for the placement of the sensors; (b) the prepared rock samples for the flow-through test.
Energies 11 01228 g005
Figure 6. Cube-shaped rock sample for testing the heat transport process at rock mass using infrared imaging technique.
Energies 11 01228 g006
Figure 7. Variation of hydraulic properties with injection pressure: (a) Variation of flow rate with injection pressure; (b) Variation of hydraulic conductivity with injection pressure.
Energies 11 01228 g007
Figure 8. Variation of hydraulic properties with confining pressure: (a) Variation of flow rate with confining pressure; (b) variation of hydraulic conductivity with confining pressure.
Energies 11 01228 g008
Figure 9. Variation of hydraulic properties of fractures with temperature changes: (a) Variation of the flow rate with increasing temperature; (b) variation of hydraulic conductivity with increasing temperature.
Energies 11 01228 g009
Figure 10. Variation of hydraulic properties with area ratio changes: (a) Variation of hydraulic conductivity with area ratio under different injection pressures; (b) variation of hydraulic conductivity with area ratio for constant injection pressure under different confining pressures.
Energies 11 01228 g010
Figure 11. Temperature distribution at different positions along the flow path: (a) with injection pressure of 10 kPa; (b) with injection pressure of 100 kPa.
Energies 11 01228 g011
Figure 12. Heat transfer process during the perfusion of a cold fluid through the fractured rock sample. (Side-on view of the sample with flow running up in fracture, as it is displayed in the center of image). The temperature in the middle of the sample surface is: (a) and (b) show the initial state of the test; (c) and (d) present the temperature decrease obviously in the fracture, (d) and (e) display that cold plume enlarge to rock mass, indicating heat conduction in the rock mass; (g) and (h) show a sharply temperature decreasing in rock mass caused by the cold fluid through the fracture.
Energies 11 01228 g012
Figure 13. The specific heat transfer exchange rate under different injection pressures: (a) injection pressure is 100 kPa; (b) injection pressure is 200 kPa.
Energies 11 01228 g013
Table 1. Thermophysical properties of the rock samples.
No.Thermal ConductivityVolumetric Heat CapacityThermal DiffusivityDensity
(W/m·K)(MJ/m3·K)(m2/s)(kg/m3)
13.052.131.43 × 10−62.71 × 10³
22.992.111.42 × 10−62.58 × 10³
32.871.981.45 × 10−62.65 × 10³
42.982.061.45 × 10−62.67 × 10³
52.962.101.41 × 10−62.64 × 10³
62.992.091.43 × 10−62.66 × 10³
Table 2. Area ratio of the fractures for the prepared rock samples.
Morphological Type of FracturesNo.Area Ratio
PlaneP11.013
P21.022
RoughR13.210
R22.814
R32.385
R41.936
Table 3. Measuring setup of the flowing tests.
No.Injection Pressure (kPa)Confining Pressure (kPa)Temperature Range (°C)Gradient (kPa/°C)
P1, P2, R1, R2, R3, R450–3004002050
P1, P2, R1, R2, R3, R4100150–4002050
R1, R2, R3, R420040040–8010
Table 4. Experimental setup for the determination of the heat transfer properties.
No.Injection Pressure (kPa)Confining Pressure (kPa)Temperature Range (°C)Gradient (kPa/°C)
P110, 10030040–8010
R1, R2100, 20040040–8010

