1. Introduction
The demand for electrical energy has increased dramatically in recent years and to increase the penetration of renewable energy, MTDC has recognized a key technology for connecting the offshore and onshore renewable energy with the corresponding national grids.
Currently, different concepts for the protection of MTDC network are characterized, each with their own merits and demerits [
1,
2,
3,
4,
5,
6,
7]. The first concept is to apply AC breakers on the AC sides. AC interruption is much easier due to the natural zero crossing of the current, but the shortcoming of this concept is the de-energization of the whole system during any troubleshooting, and it clears the fault in 50–100 ms [
1]. The second concept is to apply simple DC circuit breakers (DCCB’s) on the DC side of the converters to isolate the fault [
2]. This needs more power switches since its cost is high and the on-state losses are intensified. Use of superconducting fault current limiters (FCLs) is a decent concept for the DCCB to limit the current, but it is a costly technology, and alone it cannot entirely break the fault currents [
3,
4]. The exemplary concept is to apply the HCB to break the faulty portion of the MTDC network selectively and achieve fast interruption during a rising slope within 2–7 ms [
5]. Due to excessive dependence on semiconductor devices and new technology, the costs are high, and the technology is not fully mature [
6]. It is also concerned with the development of the protection logic having less communication time for co-ordination when acquiring the data and tripping HCBs [
7].
The significance of different techniques for the protection of MTDC has been acknowledged and discussed [
8,
9,
10,
11,
12,
13,
14,
15,
16,
17,
18,
19,
20,
21]. The faults in low voltage DC networks can be indicated by overcurrent [
8]. The same concept is not feasible to implement for large-scale MTDC networks since the protection of non-faulted lines can sense the high values of the fault current and also, faults with high resistance are difficult to analyze with the overcurrent. The current differential scheme is an excellent choice to detect the fault selectivity [
9]. Time delay to return the fault detection signal is a problem for remote areas in the case of long transmission lines. Moreover, distributed capacitance of line would distort the signal, and precise synchronization of data is required [
10,
11]. The single-ended differential protection scheme by using the multipoint optical current measuring sensors along with the whole length of transmission lines has been presented in [
12]. The differential current method by using predefined threshold values is taken into account, if the load current changes suddenly, the predefined threshold value will not be valid, and it also uses the only current signal for detection of a fault. A method for tracing fault location using multiple measurements at different points with traveling waves in MTDC network is presented in [
13]. The need for fast and reliable communication between multiple measuring units may limit its practical implementation. A non-communication- based protection algorithm for MTDC is presented and addresses some issues raised above by the use of current data at one end without communication in [
14]. Adding the shunt capacitor may increase its cost as well as complexity for other parameters. The work done in [
15] proposed wavelet transform analysis for detection of faulted cables in MTDC arrangements. A discrete wavelet transform is used as criterion for detection of a fault. However, the technique was tested for bolted faults, and not implemented for overhead lines. A differential protection algorithm has been proposed recently for MTDC networks [
16]. Since high-speed communication is needed for the execution of the protection scheme, it increases the complications and the cost of the system.
The fault detection performance can be improved for DC lines by utilizing the transient components for designing the protection scheme without communication [
17]. A transient fault current technique is used for the protection of MTDC in [
18]. The protection scheme is presented for the line current commutated converters since the operation and control of voltage source converter (VSC) are entirely different. Furthermore, the VSC topology is promising and provides more control as compared to a line commutated converter (LCC). Protection schemes have been proposed for two terminal VSC-HVDC networks by using transient harmonics [
19,
20,
21]. Transient harmonics analyzes each terminal of the line to detect the DC faults. Since fault detection is based on the single frequency component, it would be certainly affected by signal noise or filter capacitors. Further investigation is needed for adaptability of harmonic components as fault detection in MTDC networks.
The basic aim of this paper is to identify the fault and isolate the specific faulty portion of a MTDC network in a very short interval with high reliability. In order to solve the aforementioned problem, a protection scheme for the DC line faults is proposed by using CDWM and verified by the harmonics of the system voltage without communication between the terminals. Owing to the non-communication based scheme, the time interval for the protection of MTDC network is reduced significantly. It can carefully detect the fault location and isolate the faulty part from the rest of the MTDC network with the help of HCB. Moreover, it can also classify the nature of a fault with the help of the voltage drop. The proposed scheme is implemented on each terminal of a MTDC network for the protection of the overall system in case of L-L or L-G faults. The focus of the proposed method is to attain rapid fault detection, improving reliability by isolating the faulty part and differentiating among the different faults. Detailed simulations are performed in PSCAD/EMTDC to validate the performance of the proposed scheme for different possible cases in the MTDC network and results are confirmed in Matlab for the accuracy of the proposed method. As the proposed scheme is simulated under various fault conditions in standardized simulation environments, the remarkable response of the proposed scheme in handling the faults, as validated by the results, makes it advantageous for its implementation in real-time systems. Moreover, the response of the different key parameters on the system is also discussed.
The remaining structure of the paper is arranged as follows:
Section 2 describes DC faults in MTDC networks.
Section 3 and
Section 4 present the methodology and protection scheme for detection and isolation of faults.
Section 5 explains the simulation of the MTDC network, cable and the concept of HCB model. Results for the propagation delay in cables, different possible fault cases, validation of scheme in Matlab and comparative analysis are discussed in
Section 6. The conclusions are drawn in
Section 7.
2. DC Faults in MTDC Networks
Potential causes of faults in MTDC networks are mainly categorized into three groups depending on the network topology. The line to ground (L-G) faults either on positive or negative lines, Line to line (L-L) faults and AC side faults in MTDC networks. AC side faults should be isolated with conventional AC side breakers. In the following text, L-G faults and L-L faults are discussed to design the appropriate protection scheme. The protection scheme must protect and differentiate the faults reliably within milliseconds [
22,
23].
The DC side faults are a challenge to isolate in a limited interval of time to protect the whole system. Moreover, the short circuit with another line or ground faults with low impedance on the DC side propagates a low voltage surge with the speed of light in vacuum and reflects back as a high voltage surge after its arrival at the terminal.
Primary causes of tripping are the L-G faults in the case of overhead lines, due to arcing phenomena triggered by the weather being temporary [
24]. The lightning surge can be modeled as a current source that is injected in the line, having the standard surge 1.2/50 µs. On the other hand, most of the faults in cables are permanent due to insulation damage. The healthy pole is significantly affected as the healthy-pole voltage usually jumps towards 2.0 p.u. This would impose significant voltage stress on the pole. Moreover, the L-G faults are not only dependent on the value of fault resistance, but also on the grounding configuration, the impedance of the grounding electrodes and the configuration of the converter transformer. The protection must operate within a minimum time to avoid damage to the converter and the collapse of the whole system.
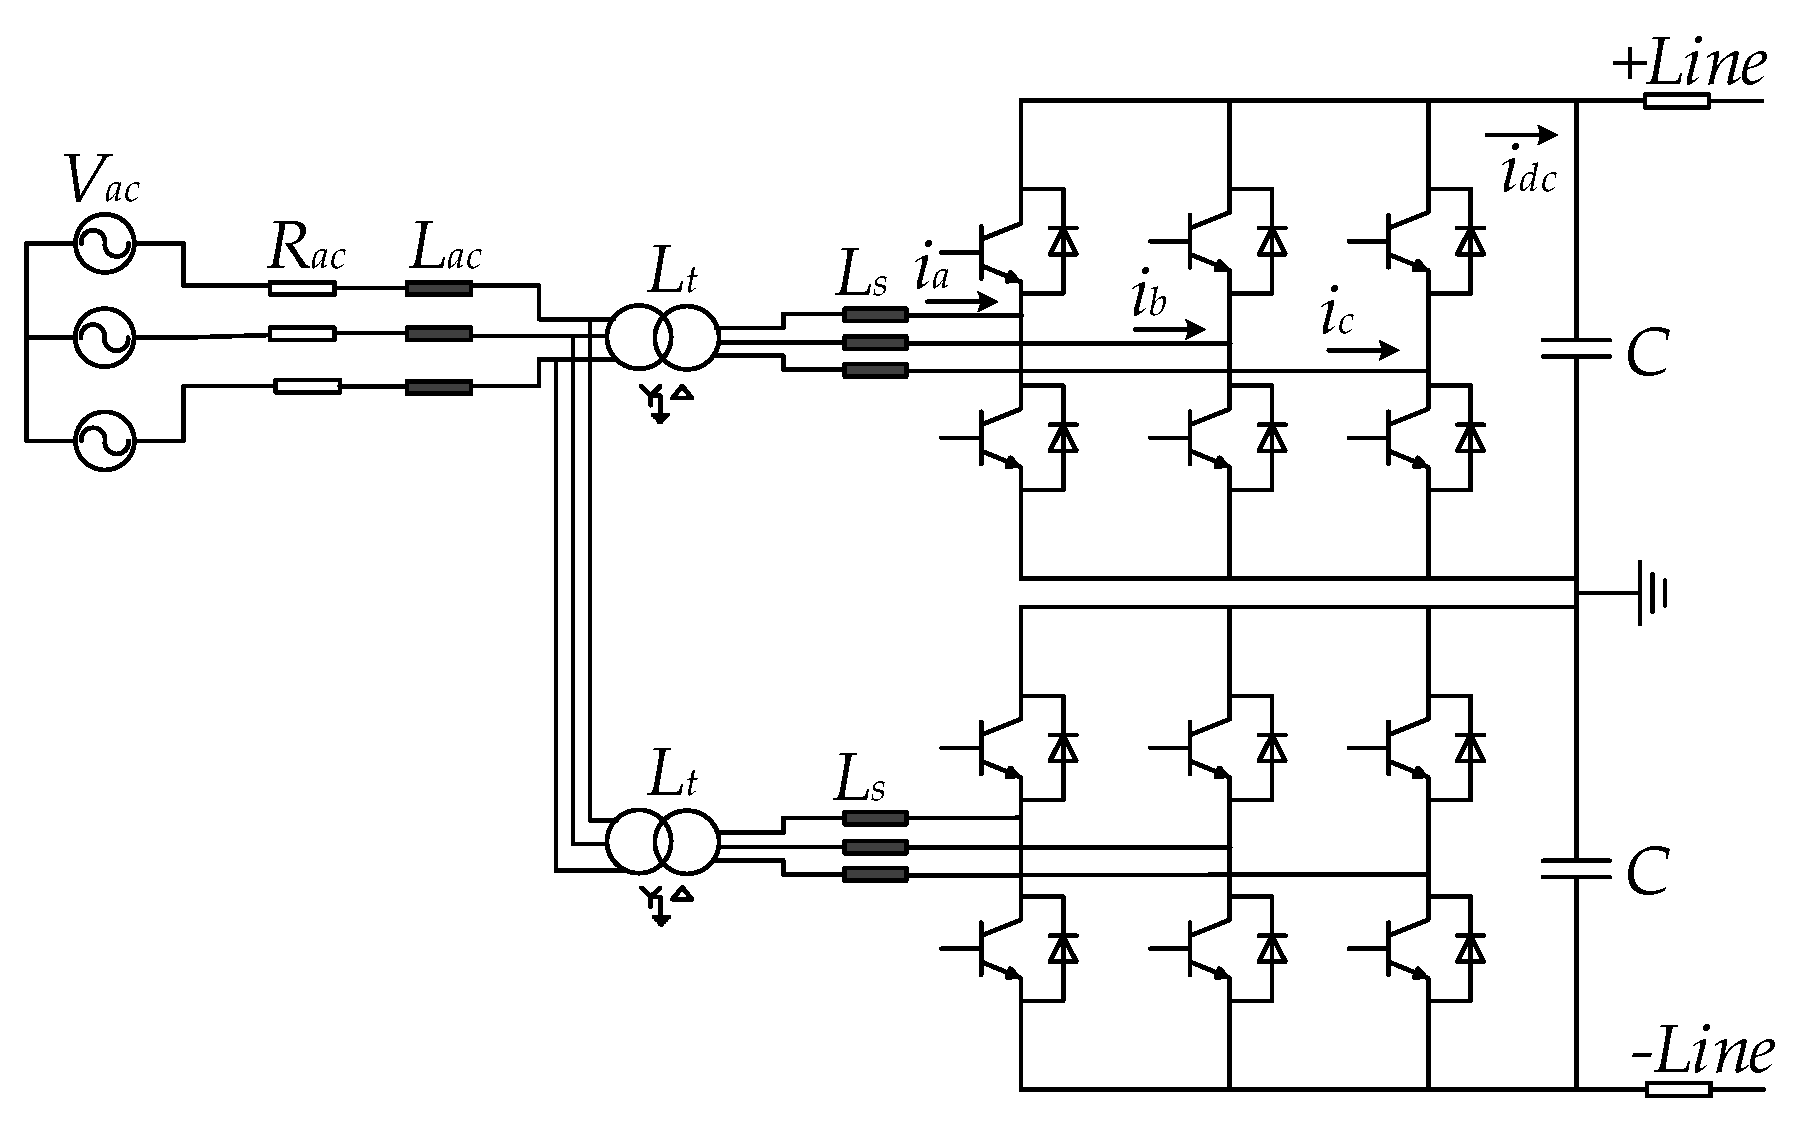
For the L-L faults, the fault period can be divided into three stages. In the first stage, the capacitors discharge with a sharp peak. The insulated gate bipolar transistor (IGBTs) are blocked to be protected from over current, and the anti-parallel diodes across the IGBT’s conduct in the opposite direction to prevent the valves from over voltage. In the next stage, the DC voltage drops, and at the same time, the link inductance drives with the freewheeling diodes even when the voltage drops to zero. In the last stage, the AC infeed continuously feeds the fault current of DC through the freewheeling diodes in case of half-bridge converters, and the converter can not block it without protection scheme. On the other hand, AC-side infeed can be blocked in case of full-bridge modular multi-level converters (MMCs).
Overcurrents damage the valves, diodes and other sensitive equipment. The IGBTs are turned off within 10 µs at the time of the fault, but the current flows through the freewheeling diodes on the AC sides. Since the topology should have one cycle to avoid damage to the converter, it should work to isolate the fault within a minimum time [
22].
3. Methodology
At the time of a fault, the system current and voltage change significantly. These changes should quickly and efficiently identify the fault by using the CDWM.
Consider
being a sample of the current signal at an arbitrary time
t with a fundamental frequency that is calibrated in radians per second:
where
and
are real numbers.
Some notations are defined for the data window method: the fixed time interval between two samples is ; moreover, the primary frequency between samples, .
Also, we consider the samples are taken at different intervals of time at
,
and
as expressed below:
By relating the samples with the signal amplitudes
and
:
and
can be obtained from two samples, and if
and
then the output is:
If the number of samples are
k = 1, 2, 3, …; and, the number of windows are
l = 1, 2, 3, …; so, the
l-th and (
l + 1)-th window are compared. In the case where the consecutive windows have different rates of change, a fault identification signal is generated and passes on for fault verification. The last three samples
,
and
based on the algorithm are pre-fault, fault, and the post-fault samples:
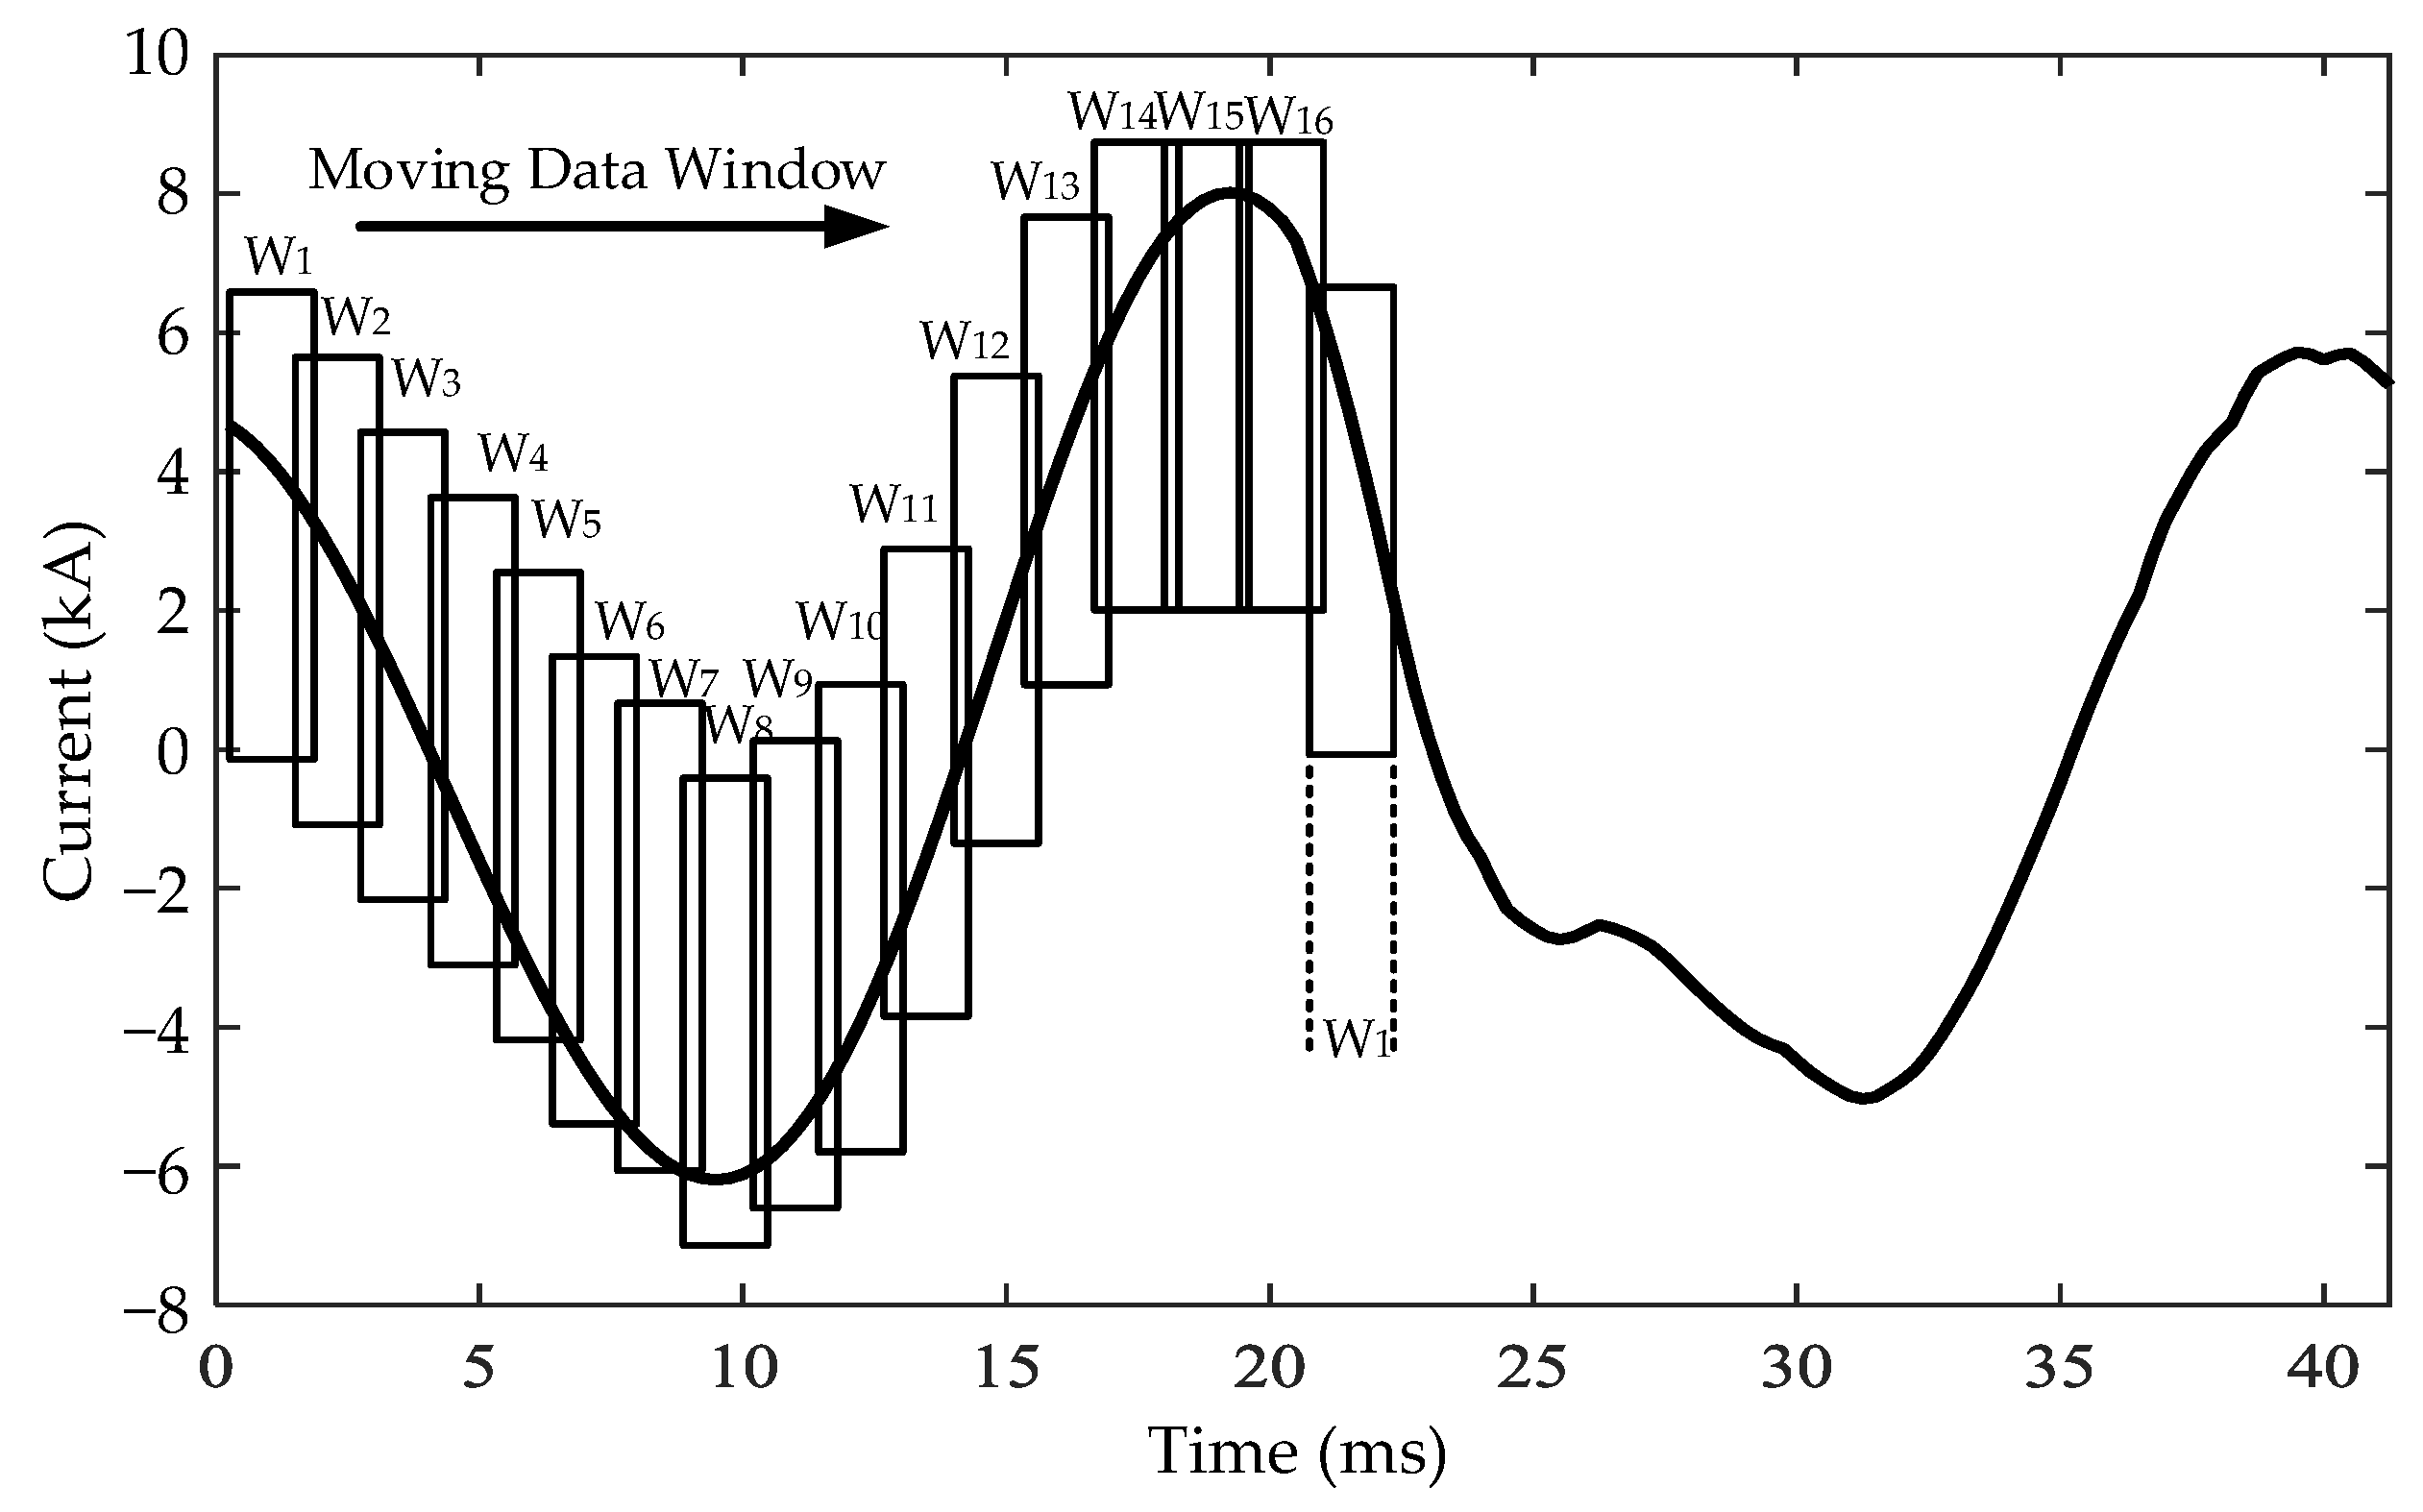
The algorithm described by the equations has three samples of data. The newest sample can be calculated with the old samples. Existing algorithms use sampling rates from four to 64 samples per cycle [
25]. In this paper, 16 moving windows in one cycle have been taken as a reference on the AC side for the DC side faults, and a current signal is expressed in
Figure 1, the sample time (
) will be 1.25 ms. A high sampling rate requires a more powerful processor that can calculate the next window in a very short time.
The fundamental frequency components for
K samples per cycle expressed in [
25]:
where
, and if
L is the last sample and to make the results stationary, the equation rotates by the angle,
:
The subtraction between (10) and (11) is the last point of (10) and first point of (11),
Equation (12) is valid for any interval of the window, and the generalised formula for the algorithm becomes:
4. Identification and Isolation Scheme for MTDC Networks
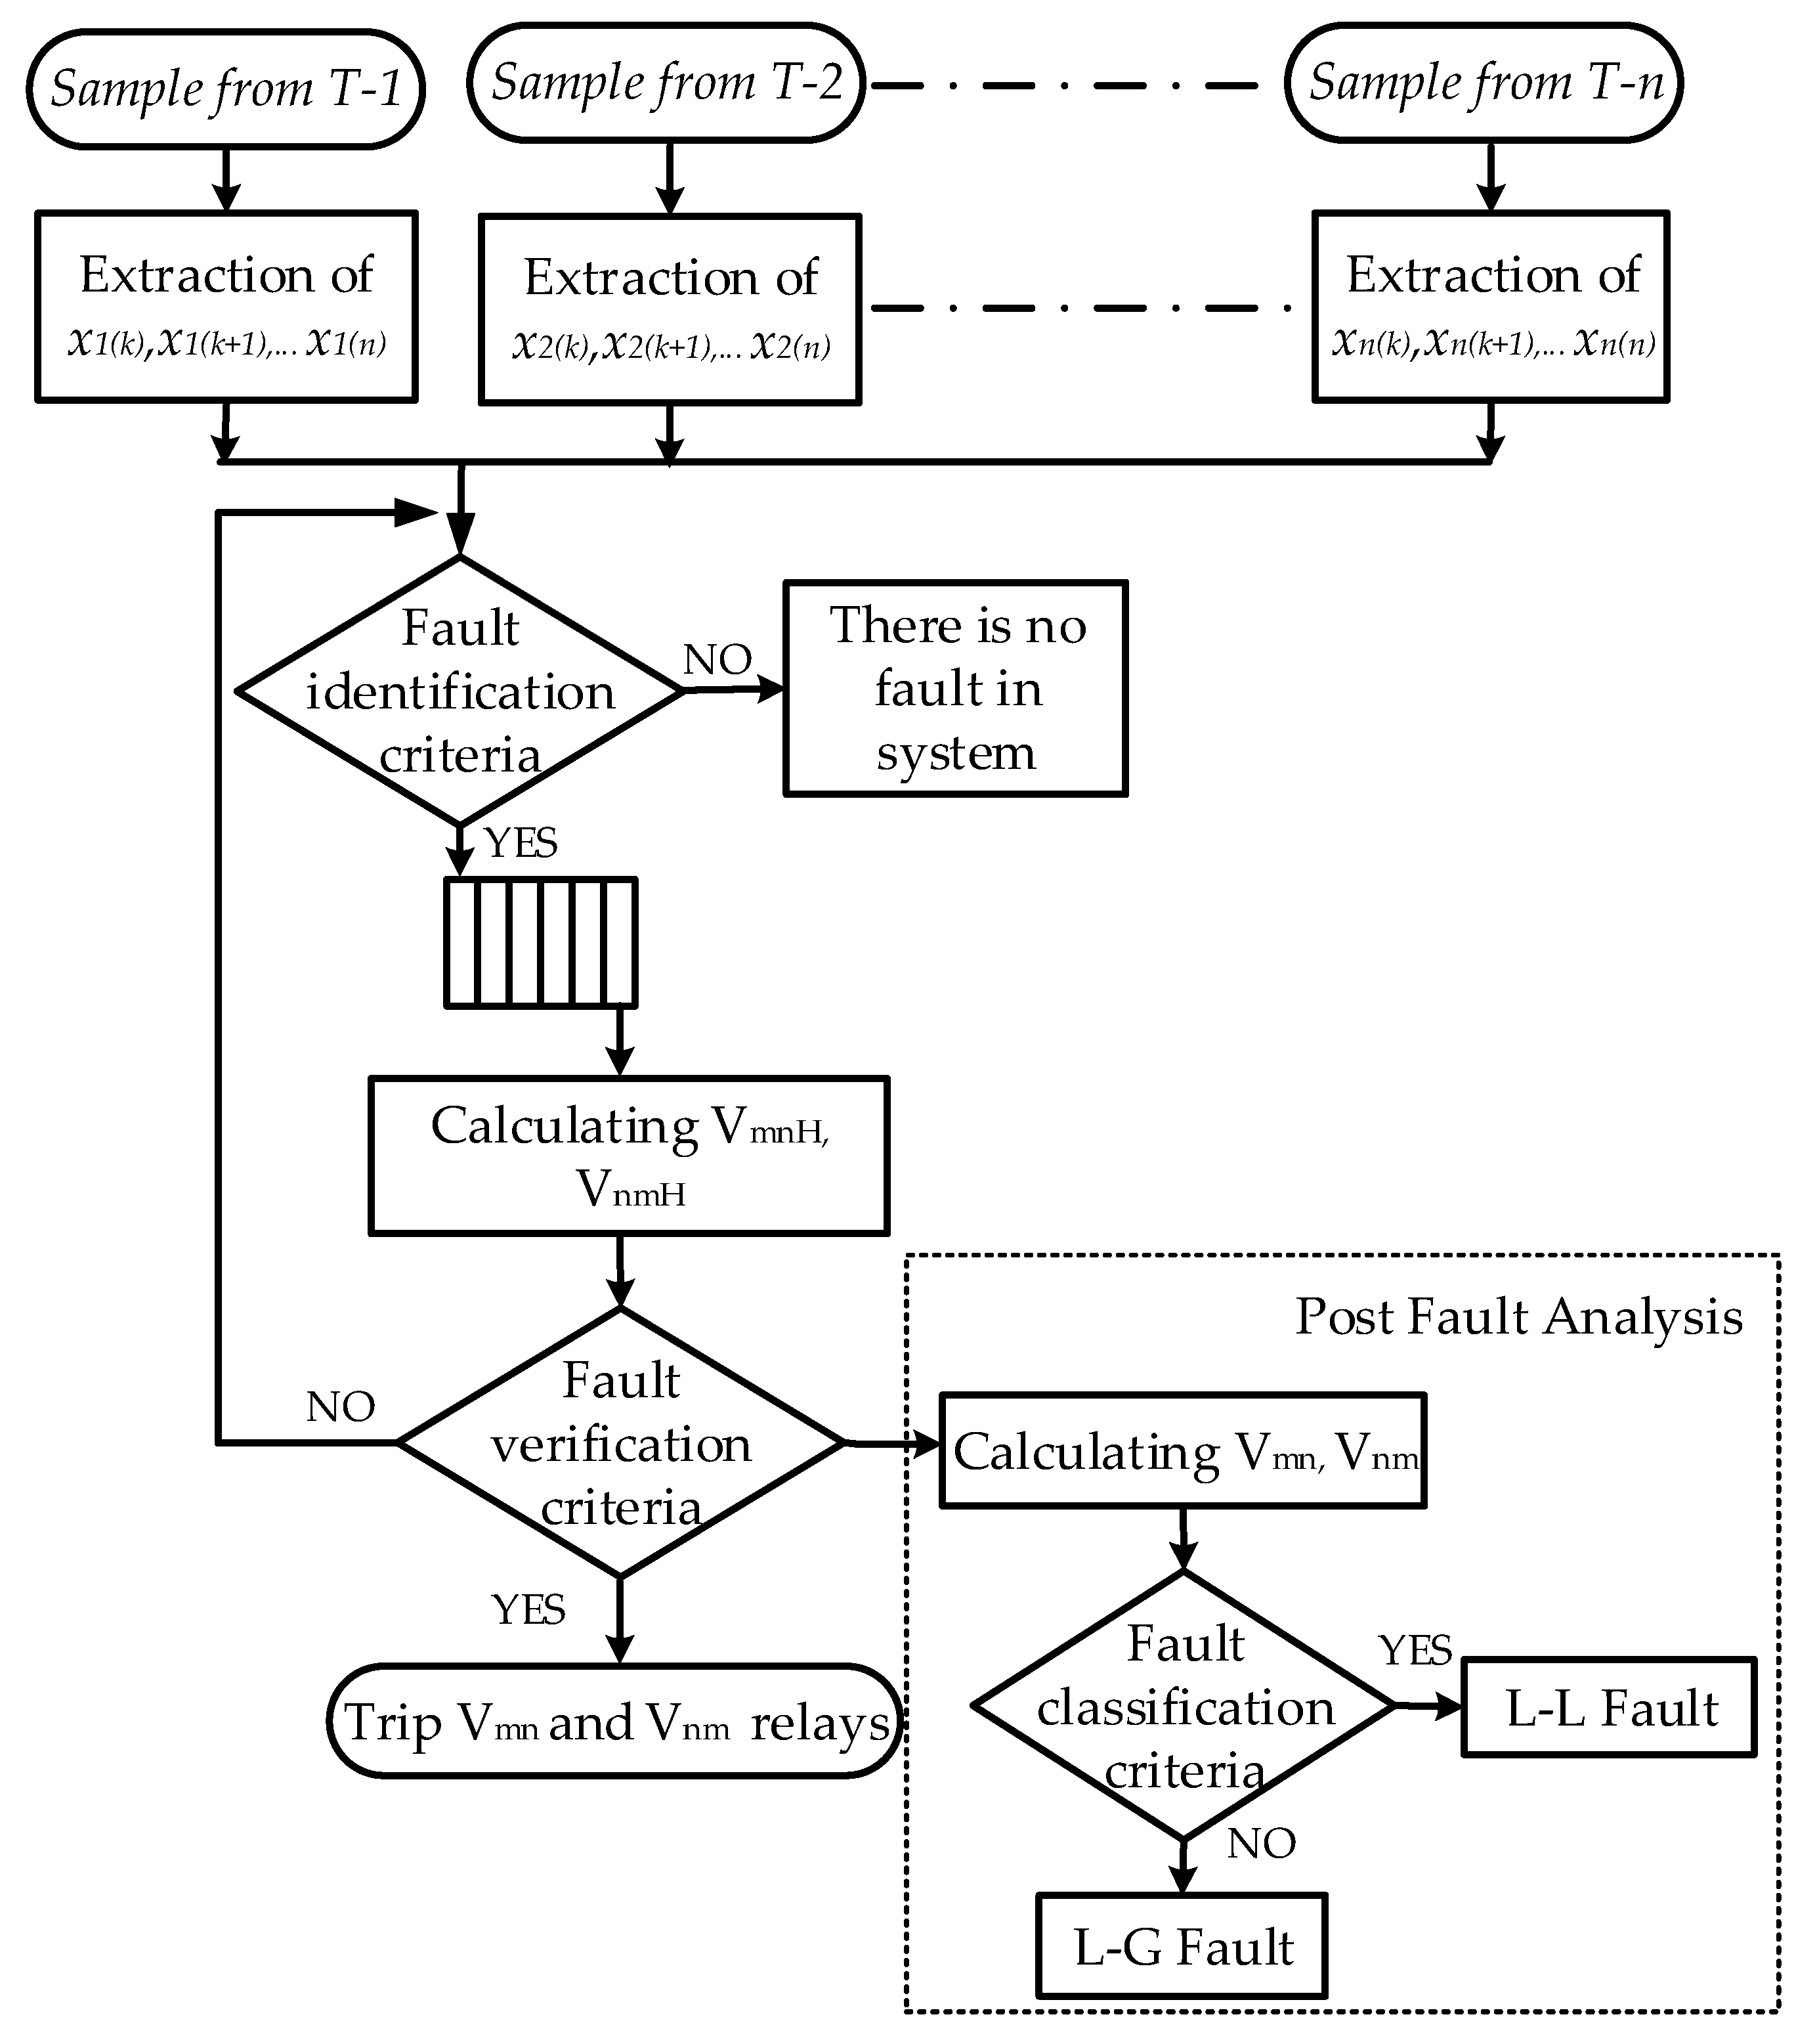
Based on the aforementioned analysis, the identification and isolation scheme has been expressed in
Figure 2. If the signal is entirely periodic, then
and the window remains same. On the other hand, when the consecutive windows have a different rate of change, then a trip signal must be generated that can initiate the protection scheme. The currents from each terminal of MTDC network are processed per pole, and the windows are calculated for each signal continuously as in Equation (15):
The new window can be calculated from the previous window and compared with each other. Comparison of the consecutive current window should help to identify the fault, and the fault identification criteria are expressed in Equation (16):
There may be a fault or short time harmonics in the system. This can be verified by double-checking through the harmonics of the system voltage, which are extracted through the mathematical modeling based on the discrete Fourier Transform (DFT). Some notations are used for the data window method:
VmnH highest value of the harmonics of the system voltage;
VnmH second highest value of the harmonics of the system voltage;
Vhset the threshold value of the harmonics of the system voltage;
Vmn lowest terminal voltage in MTDC network;
Vnm second lowest terminal voltage in MTDC network;
The threshold value of the harmonics is set as 0.01 p.u. from a lot of simulations for fault criteria, and if the value of the harmonics
VmnH or
VnmH is higher than
Vhset, a fault on the DC line is verified as expressed in (17). The corresponding relays trip the HCB without communication and initiate the post-fault analysis:
For identification of fault location and categorization of the nature of the fault, further, analysis of the voltages and categorizing them by the voltage level is expressed in the post-fault analysis in
Figure 2. The lowest terminal voltage
Vmn is nearest to the fault place. Similarly, to find the direction of fault location from the lowest terminal voltage, the second lowest terminal voltage
Vnm should help to find the direction of fault as presented in (18). A trip single is generated respectively for HCBs to isolate the faulty portion. Thus, to find the nature of the fault, the voltage drop must be compared to post-fault analysis. If the voltage drops to zero, then there should be a L-L fault. Otherwise, there would be a L-G fault. Moreover, the above statement is not valid in some conditions. If there is a highly resistive L-L fault, then the voltage will not drop to zero. In the case of L-G faults, the faulted pole voltage will collapse towards zero while the healthy pole voltage will jump towards 2 p.u.
6. Results and Discussion
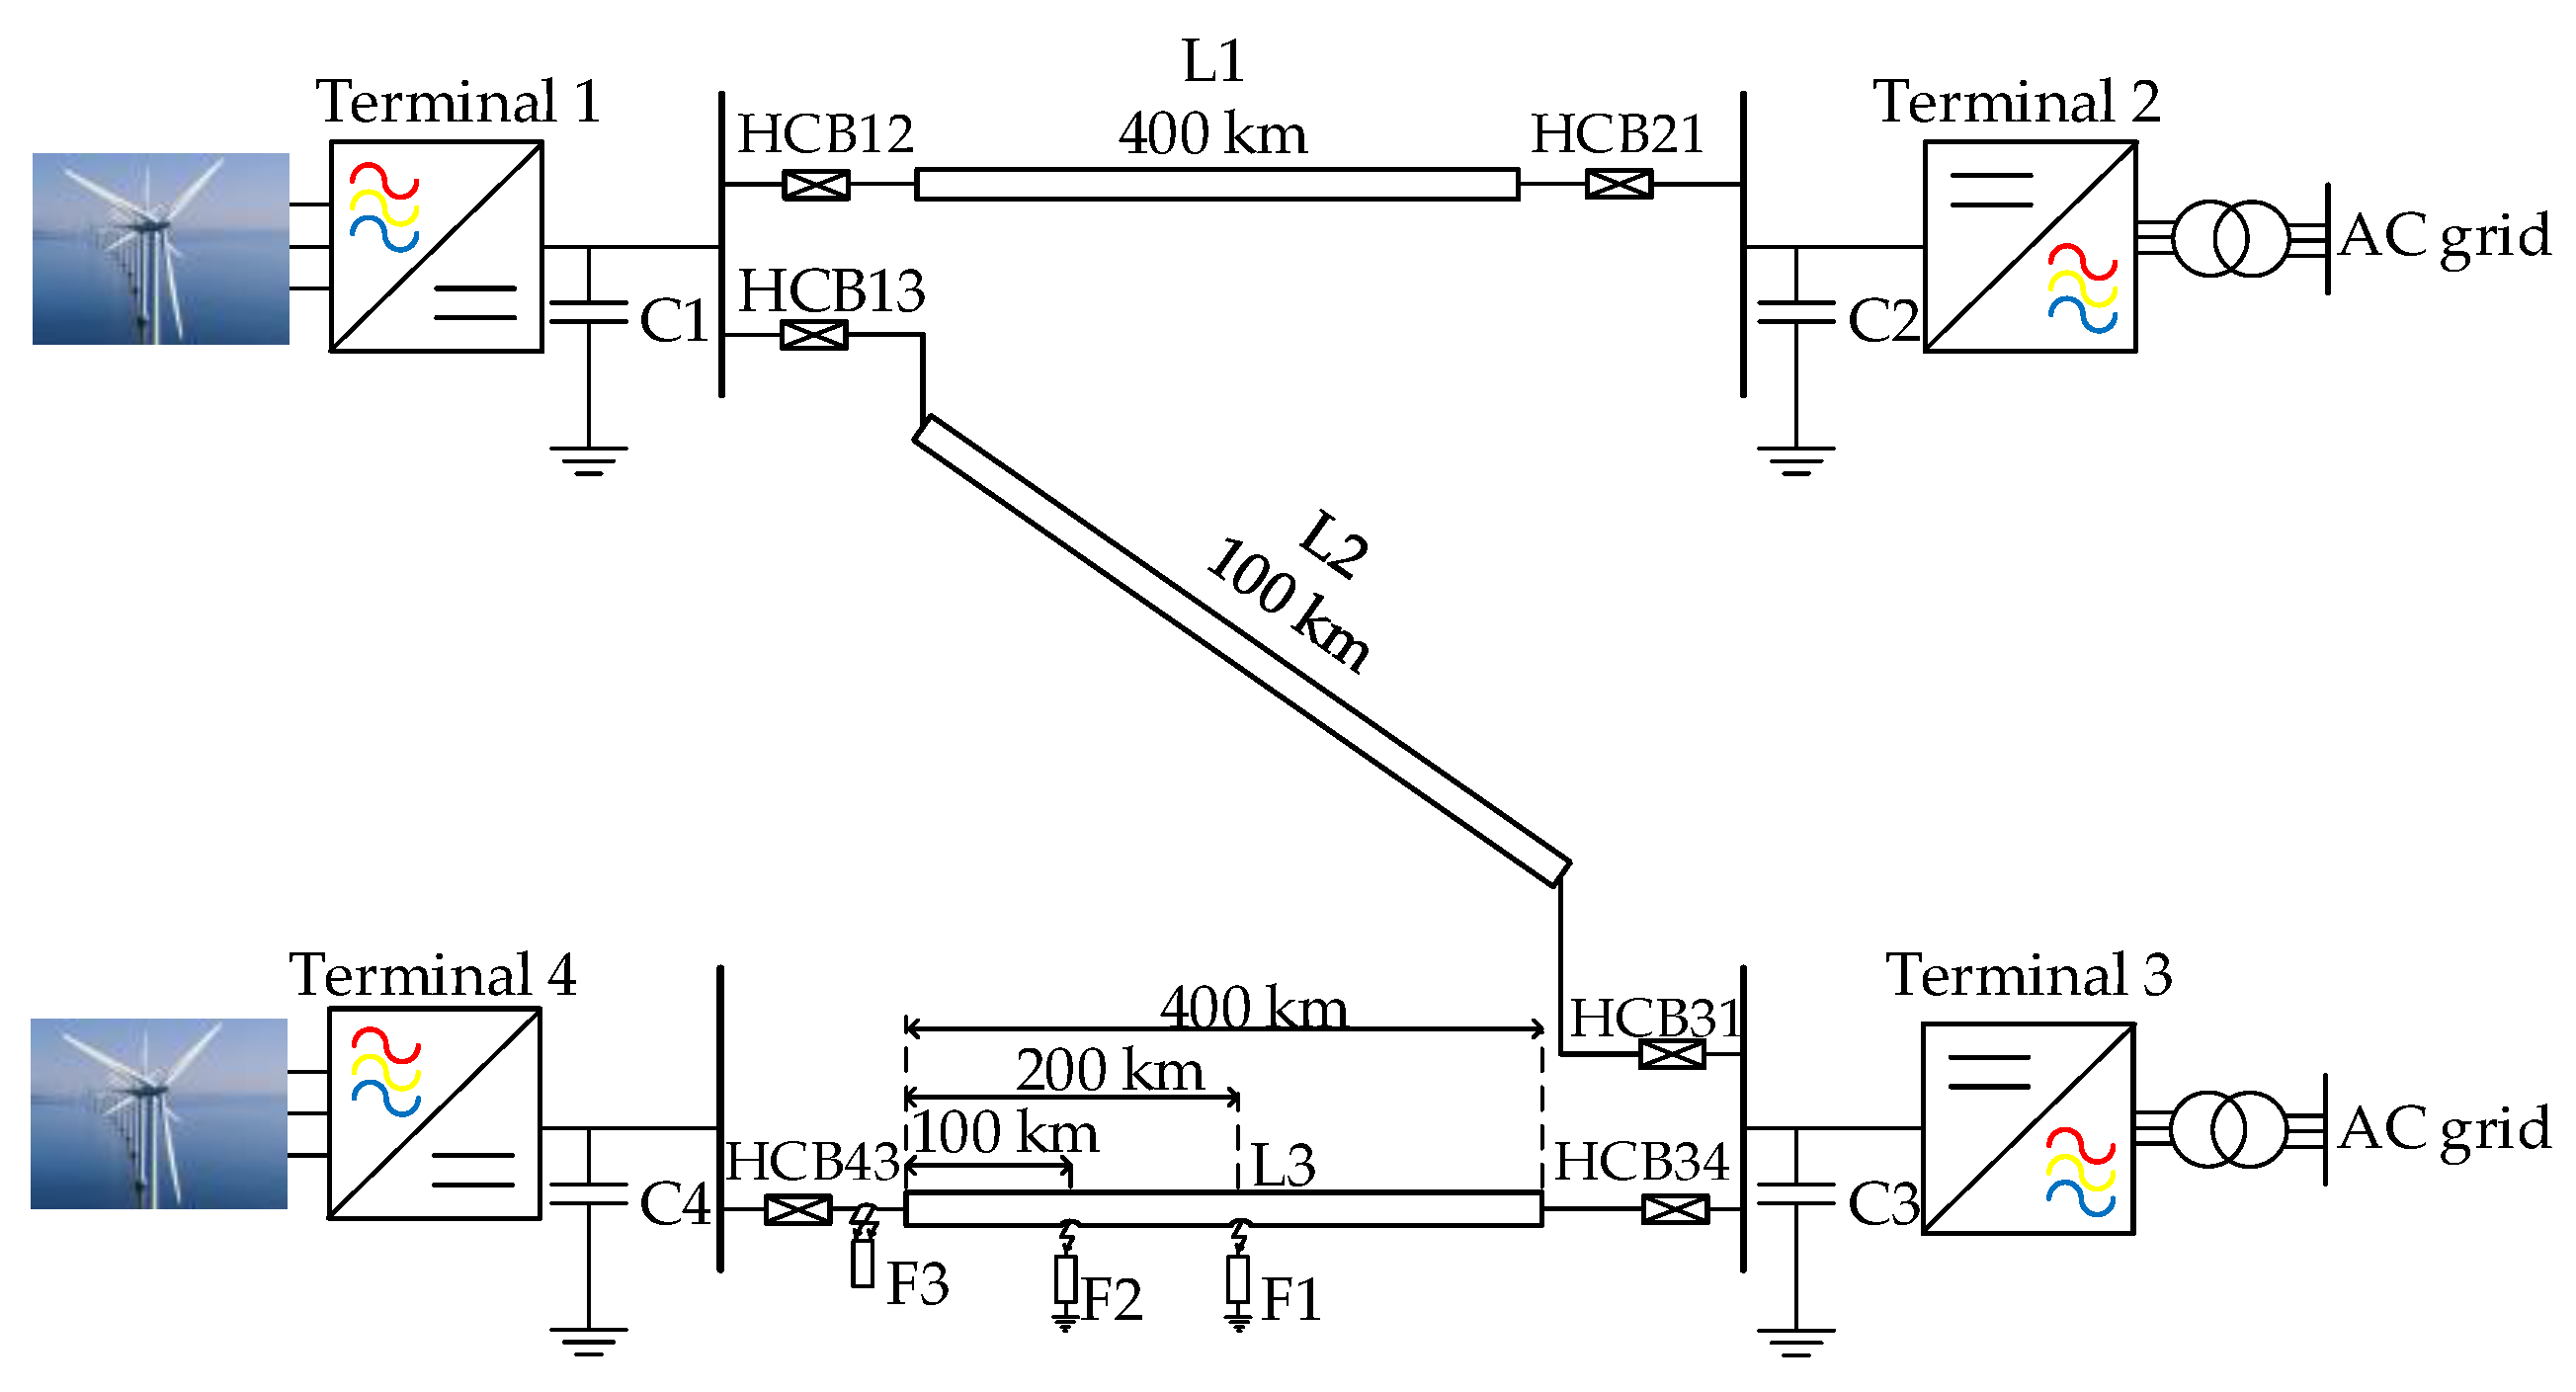
The simulation results are expressed and analyzed for four terminal MTDC network based on VSC. In this paper, different fault cases are discussed, which comprise of L-G and L-L faults at different locations. The L-L DC fault is more severe for interrupting the MTDC network as compared to the L-G fault. In all simulations, the currents in the DC cables, HCB’s currents and harmonics voltage of the VSC terminals are inspected to understand how the fault current progresses during fault conditions. Hence, these parameters are essential to implement the protection scheme. Fault location and clearing time are not foreseeable in large MTDC networks. Also, it is essential to check the terminal voltage and power in the VSC converters, which are used to analyze the system behavior. Moreover, the proposed protection scheme is also validated with the Matlab after computing the data from simulations. Furthermore, the impact of the key parameters for the proposed scheme is evaluated. At last, the proposed protection scheme is compared with some previously existing protection schemes.
6.1. Propagation Delay of the Cable
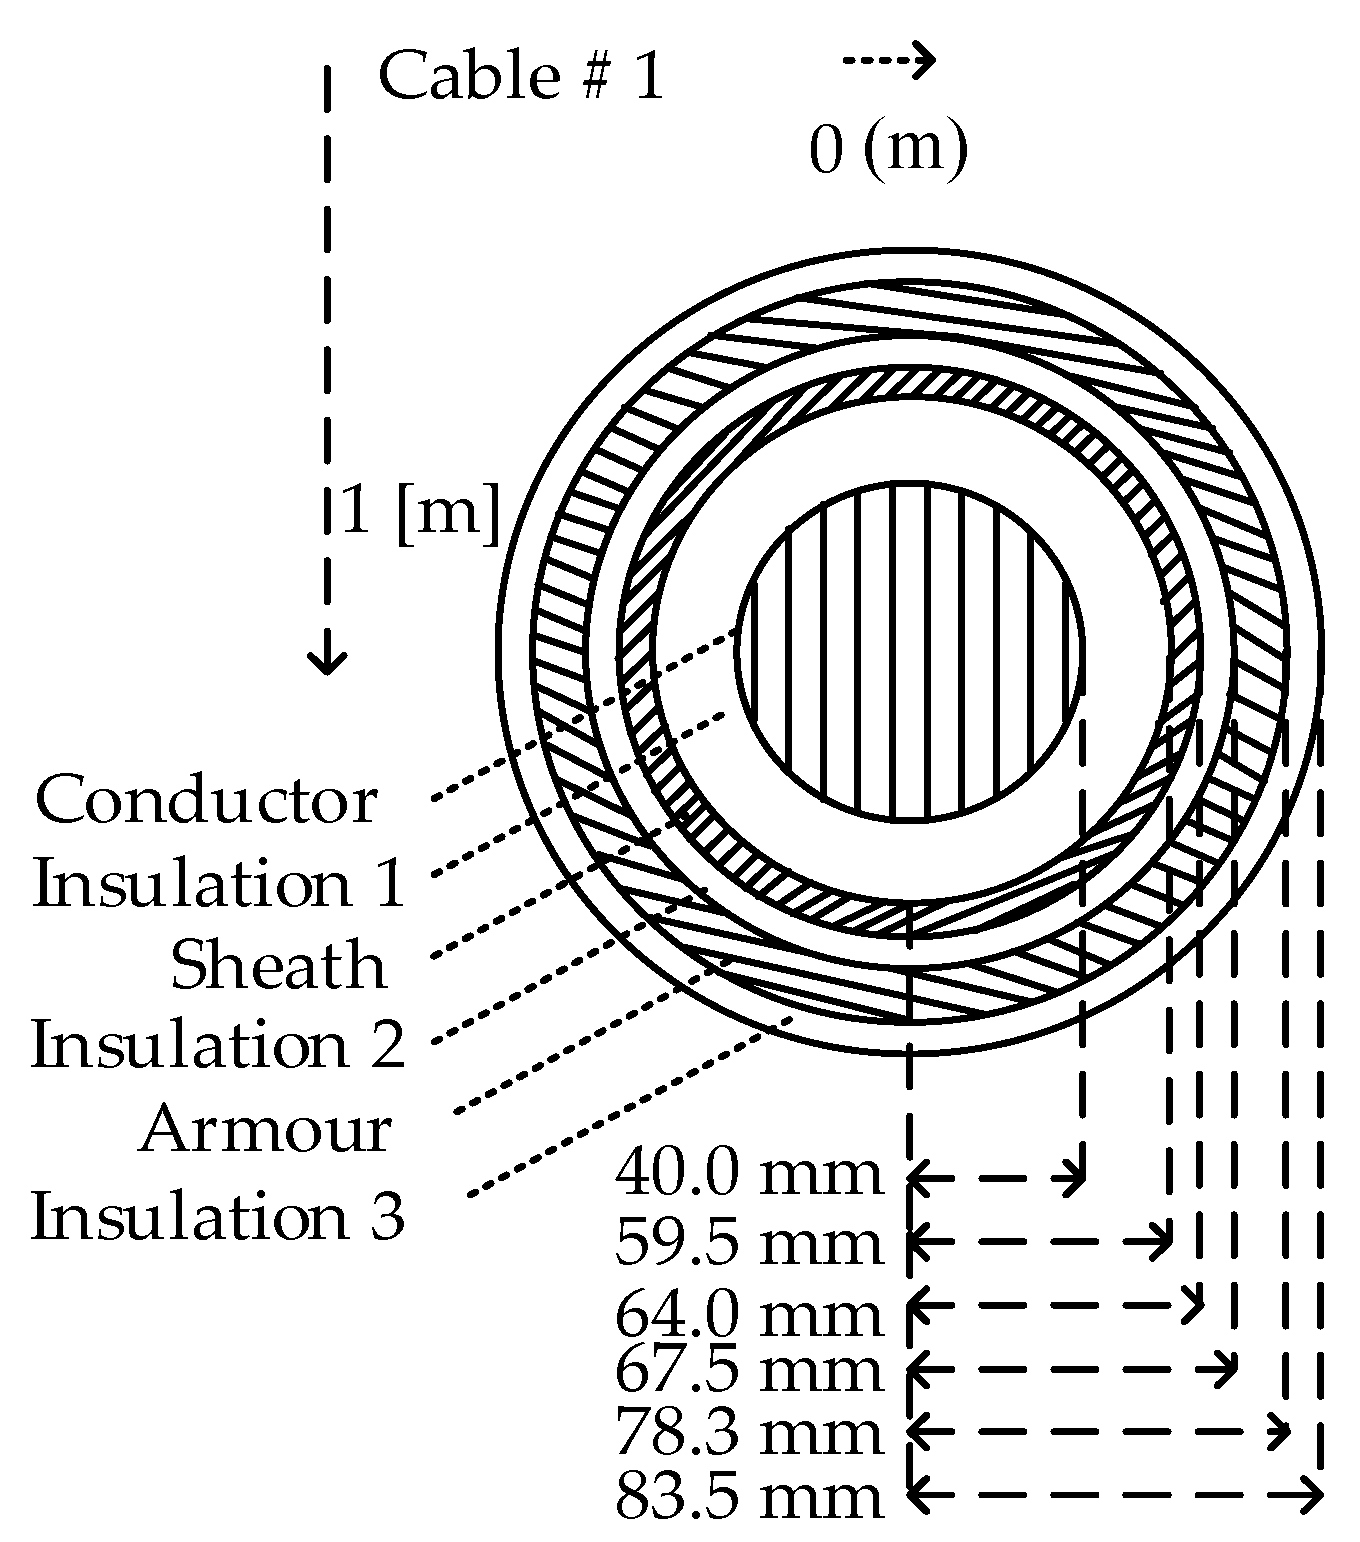
The significance of wave propagation delays from the fault point to the relay locations is considered in this section. The wave propagation delay is modeled by using a detailed DC cable model [
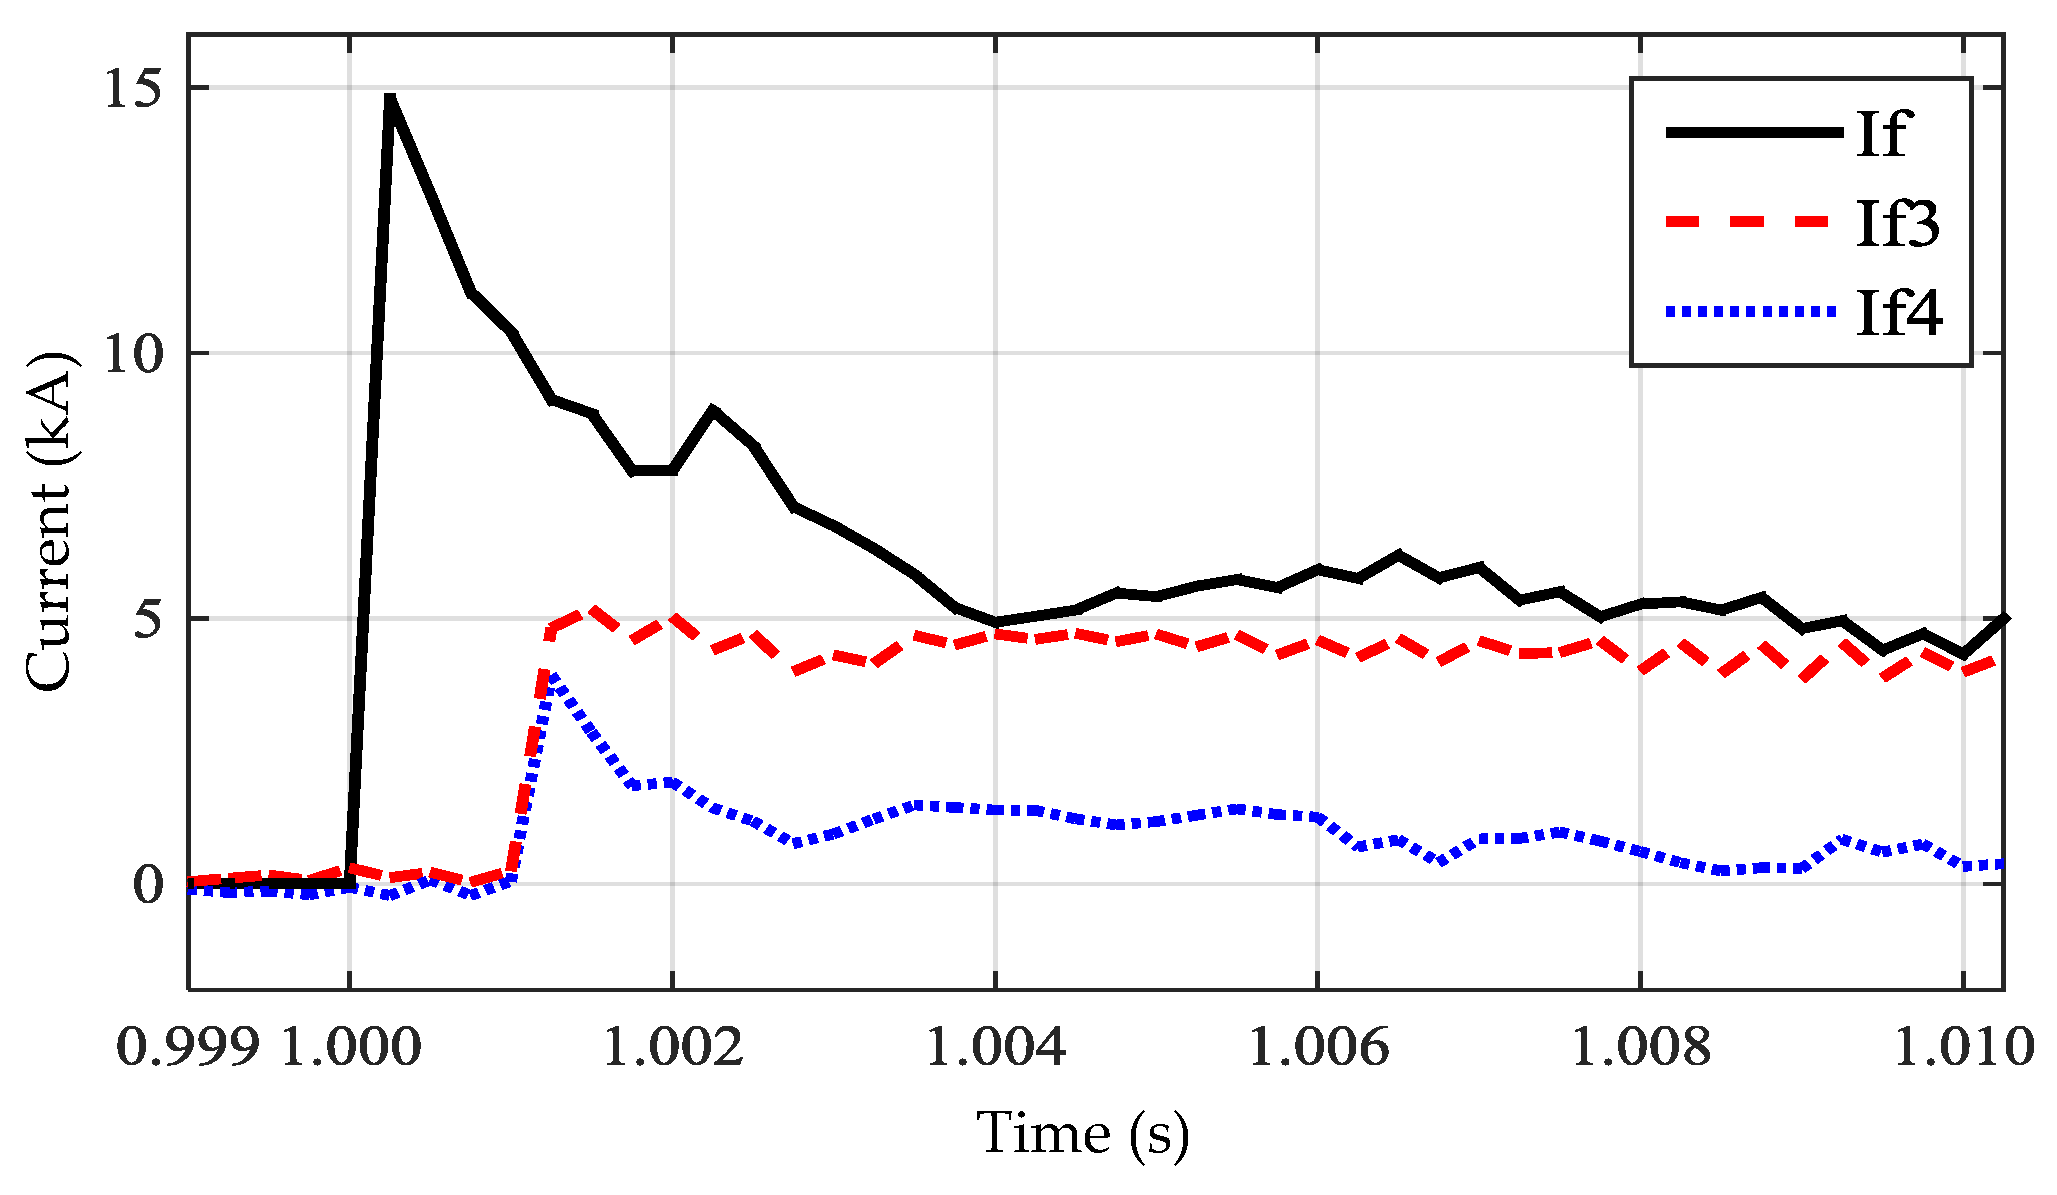
35]. The propagation speed is taken as the speed of light through the fiber optic (200 km/ms). A L-G fault at
t = 1.0 s is incepted in the middle of L3, and the length of the line is 400 km. Propagation delay in the MTDC network is verified in
Figure 8. The fault surge should arrive after 1 ms time delay at each terminal.
If is the fault current at the fault point
If3 and
If4 are the currents at the VSC3 and VSC4 terminals respectively. The fault surge arrived at terminal 3 and 4 after 1 ms time delay as can be seen in
Figure 8. Consideration of time delay is an essential aspect in designing the protection scheme of MTDC network.
6.2. L-G Fault Without Protection Topology
Analysis of a fault without any protection scheme is motivating to evaluate the fault behavior in the network. It is interesting to find the fault current values to design the protection scheme for MTDC networks. Therefore, a L-G fault is analyzed at the center of L3 to examine the system voltage, power, currents in the circuit breakers (CB) and dc cables as expressed in
Figure 9,
Figure 10,
Figure 11 and
Figure 12. A fault is incepted at
t = 1.0 s as can be seen in the results.
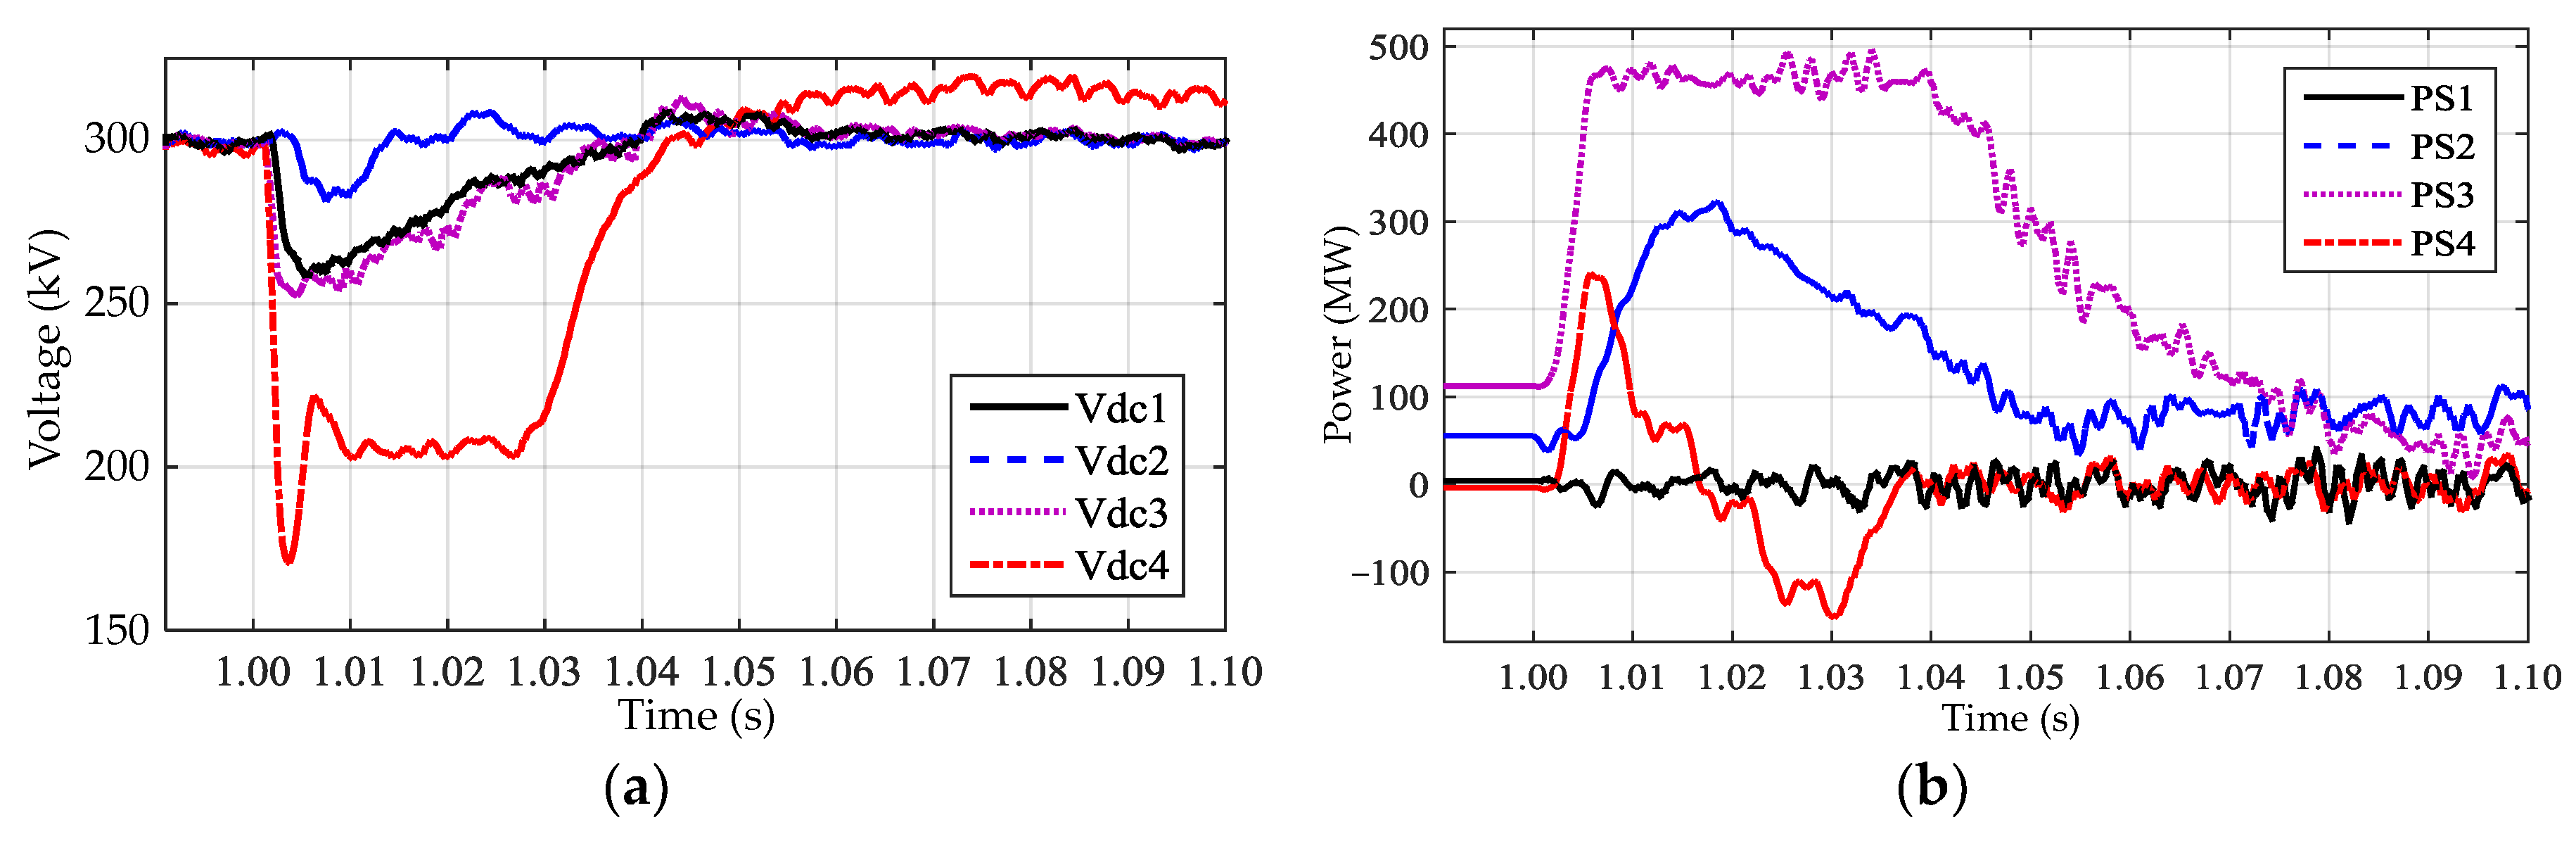
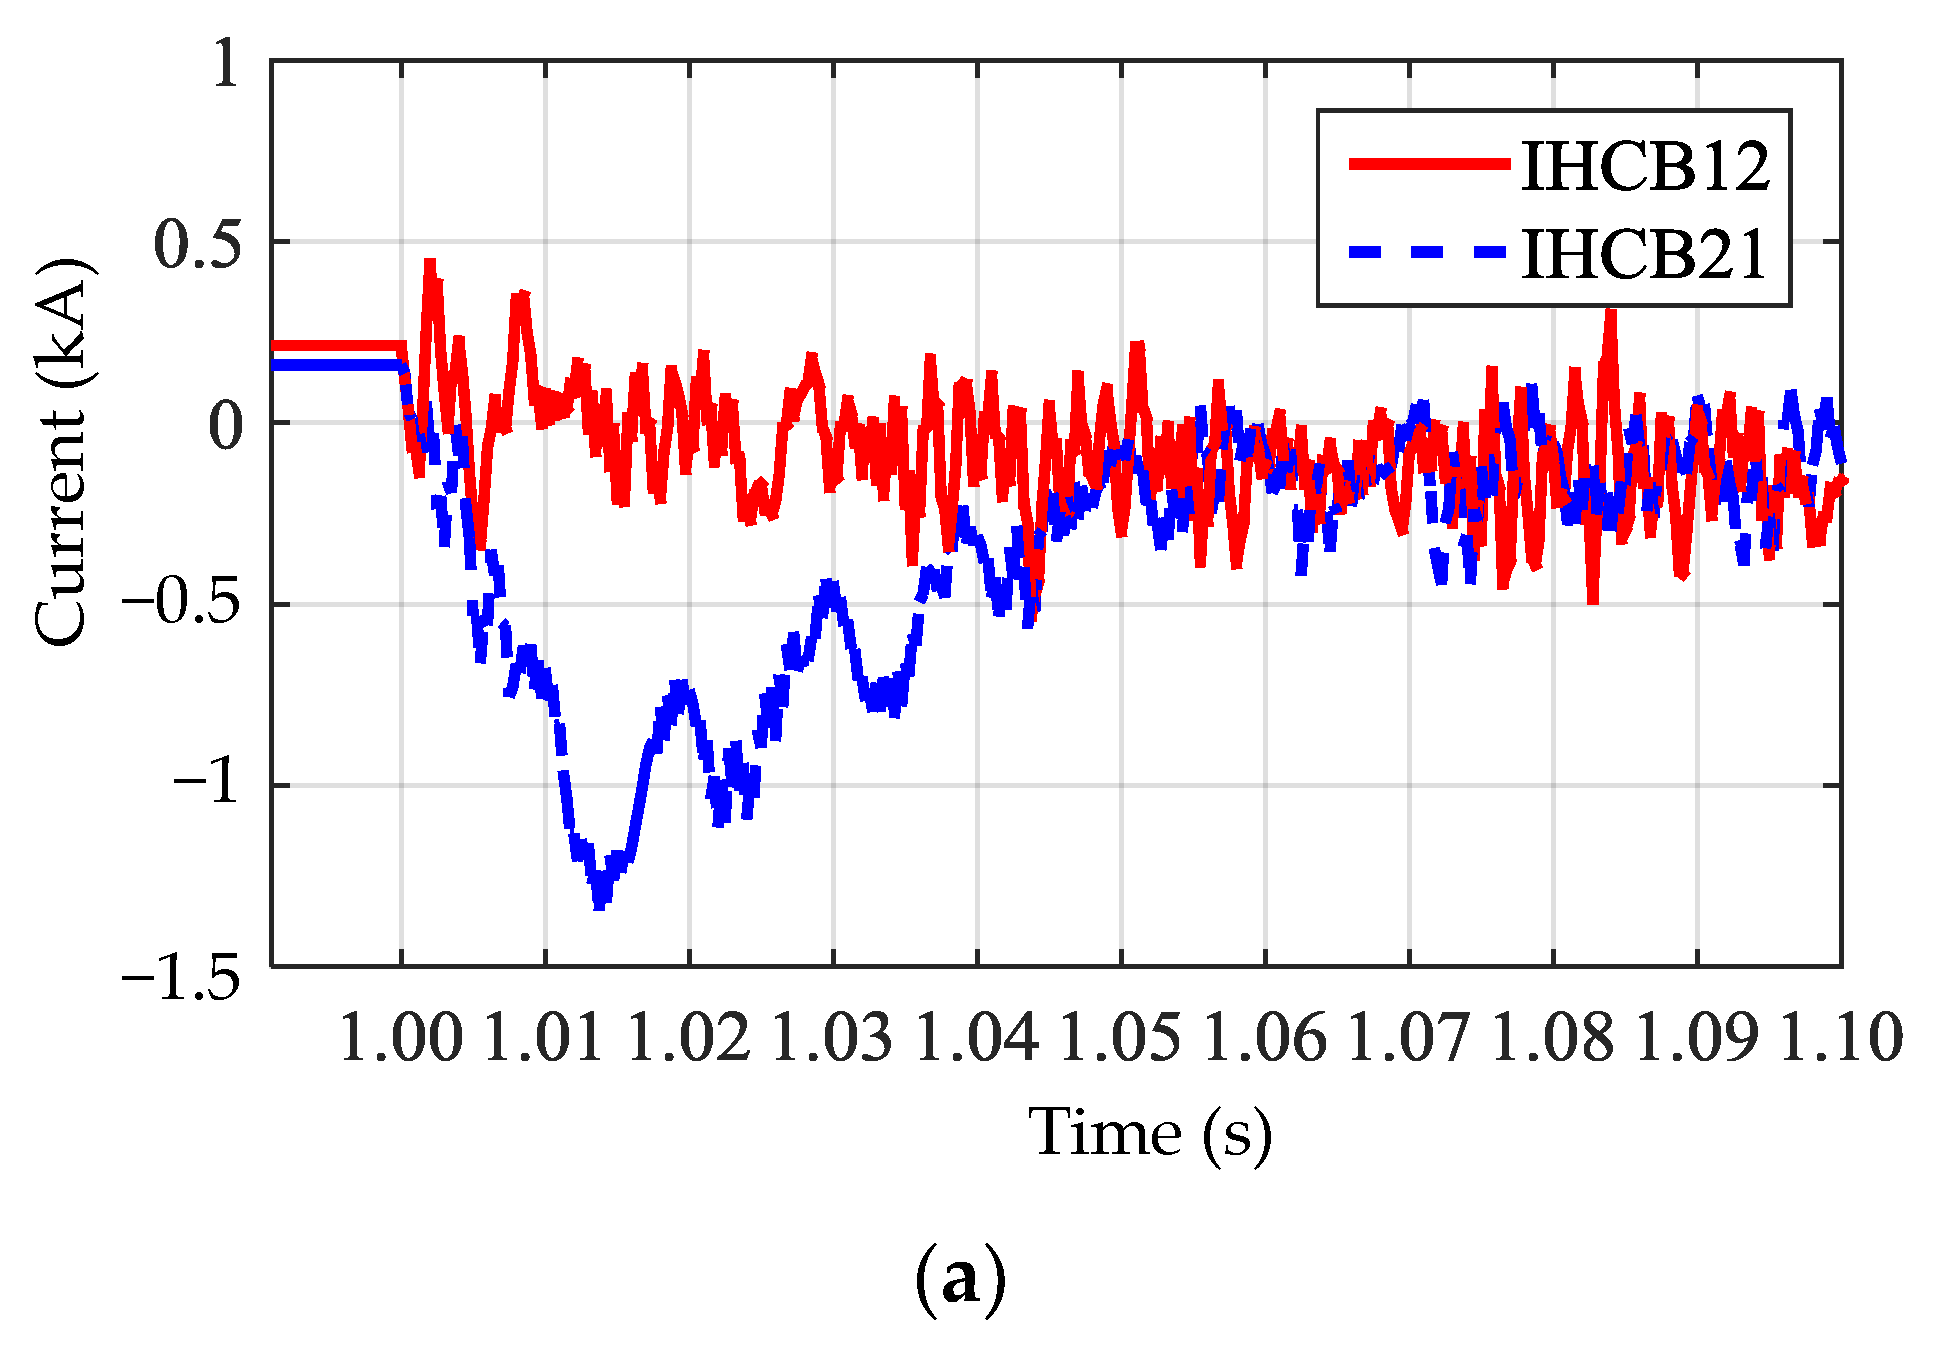
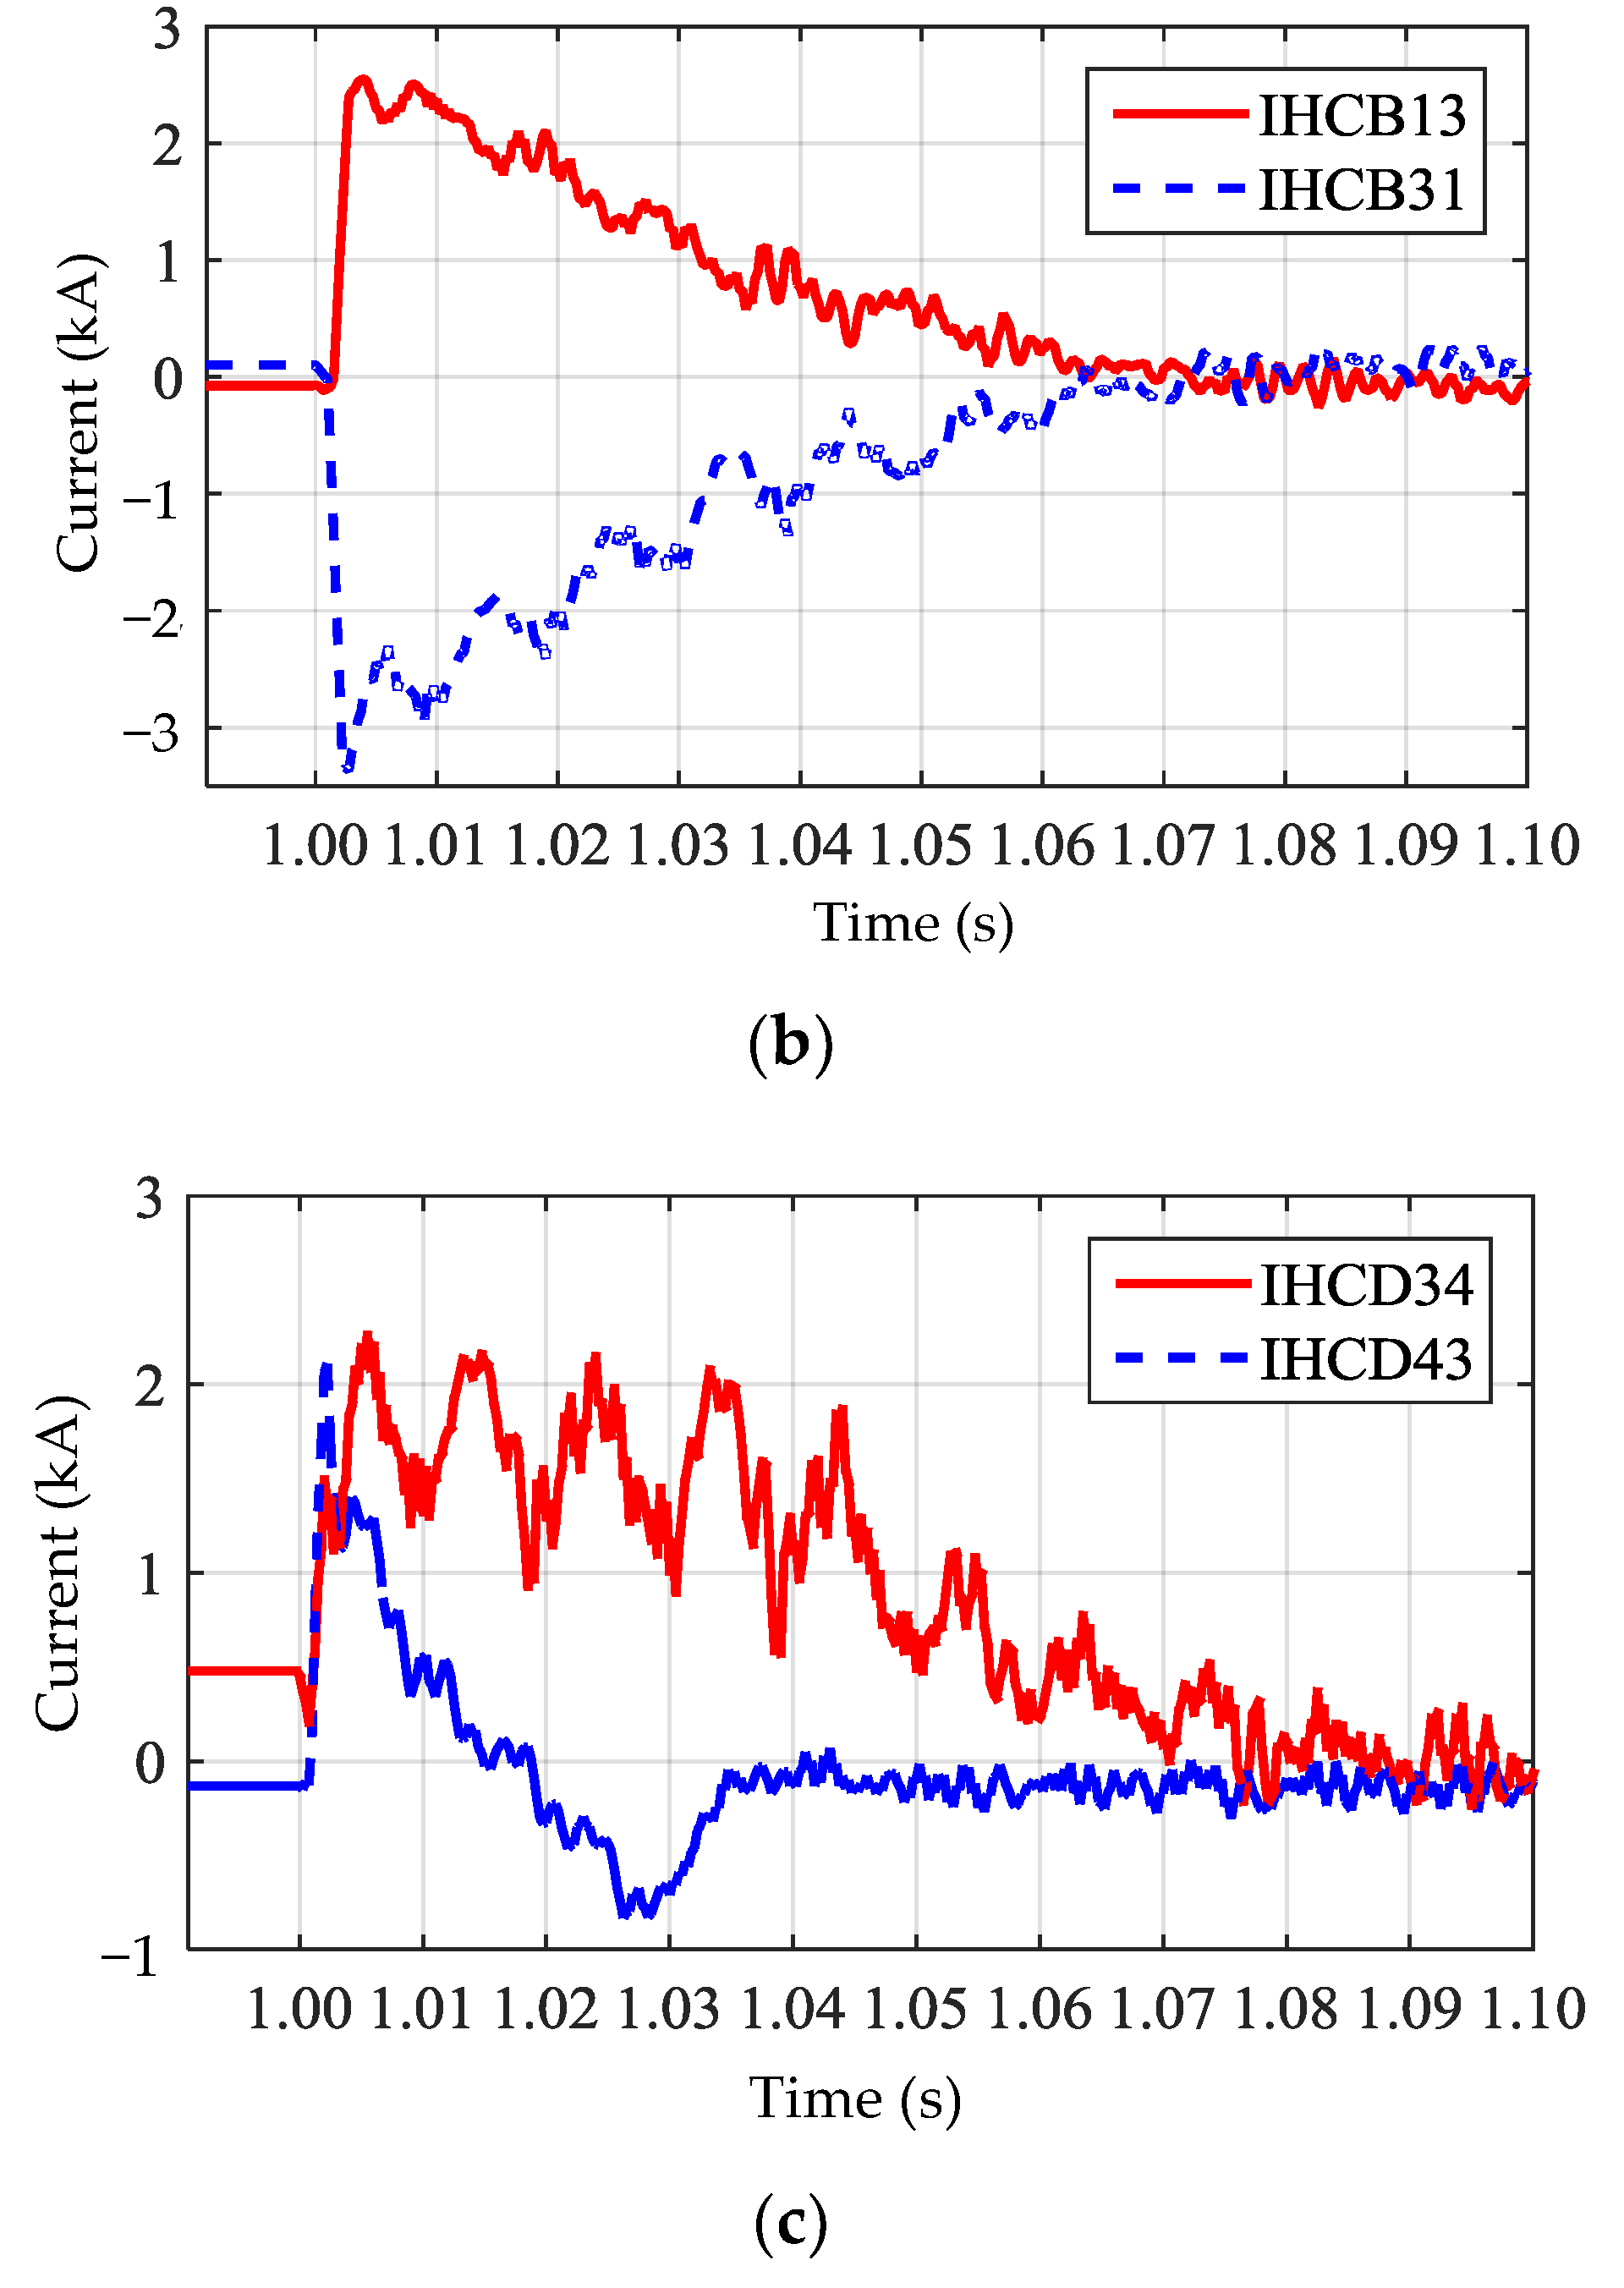
Figure 9 depicts the terminal voltage and power of the system. At the time of the fault, all terminal voltages drop according to the distance from the fault location. Since Vdc3 and Vdc4 effects more because of the nearest location. However, Vdc4 drops greatly because of the single source at terminal 4 as compared to the terminal 3. Moreover, the power at terminal 3 rise more because of the nearest location to the fault and also due to the infeed of terminal 1 and 2. The findings of the DC current have shown that the capacitors at VSC’s discharge quickly and will cause the transient for a very short time during the first peak. After words, the ac infeed starts to feed the fault current as the dc voltage level below the voltage of the ac side of the terminal and freewheeling diodes become conducting. Meanwhile, it also charges the dc capacitors. The dc capacitors periodically charged and discharged during the fault time. The downfall current shows the charging of capacitances. The fault and pre-fault currents in the HCB’s is expressed in
Figure 11. The initial transient fault currents drop to 1–2 p.u. with a time constant of 70–80 ms depending upon the location.
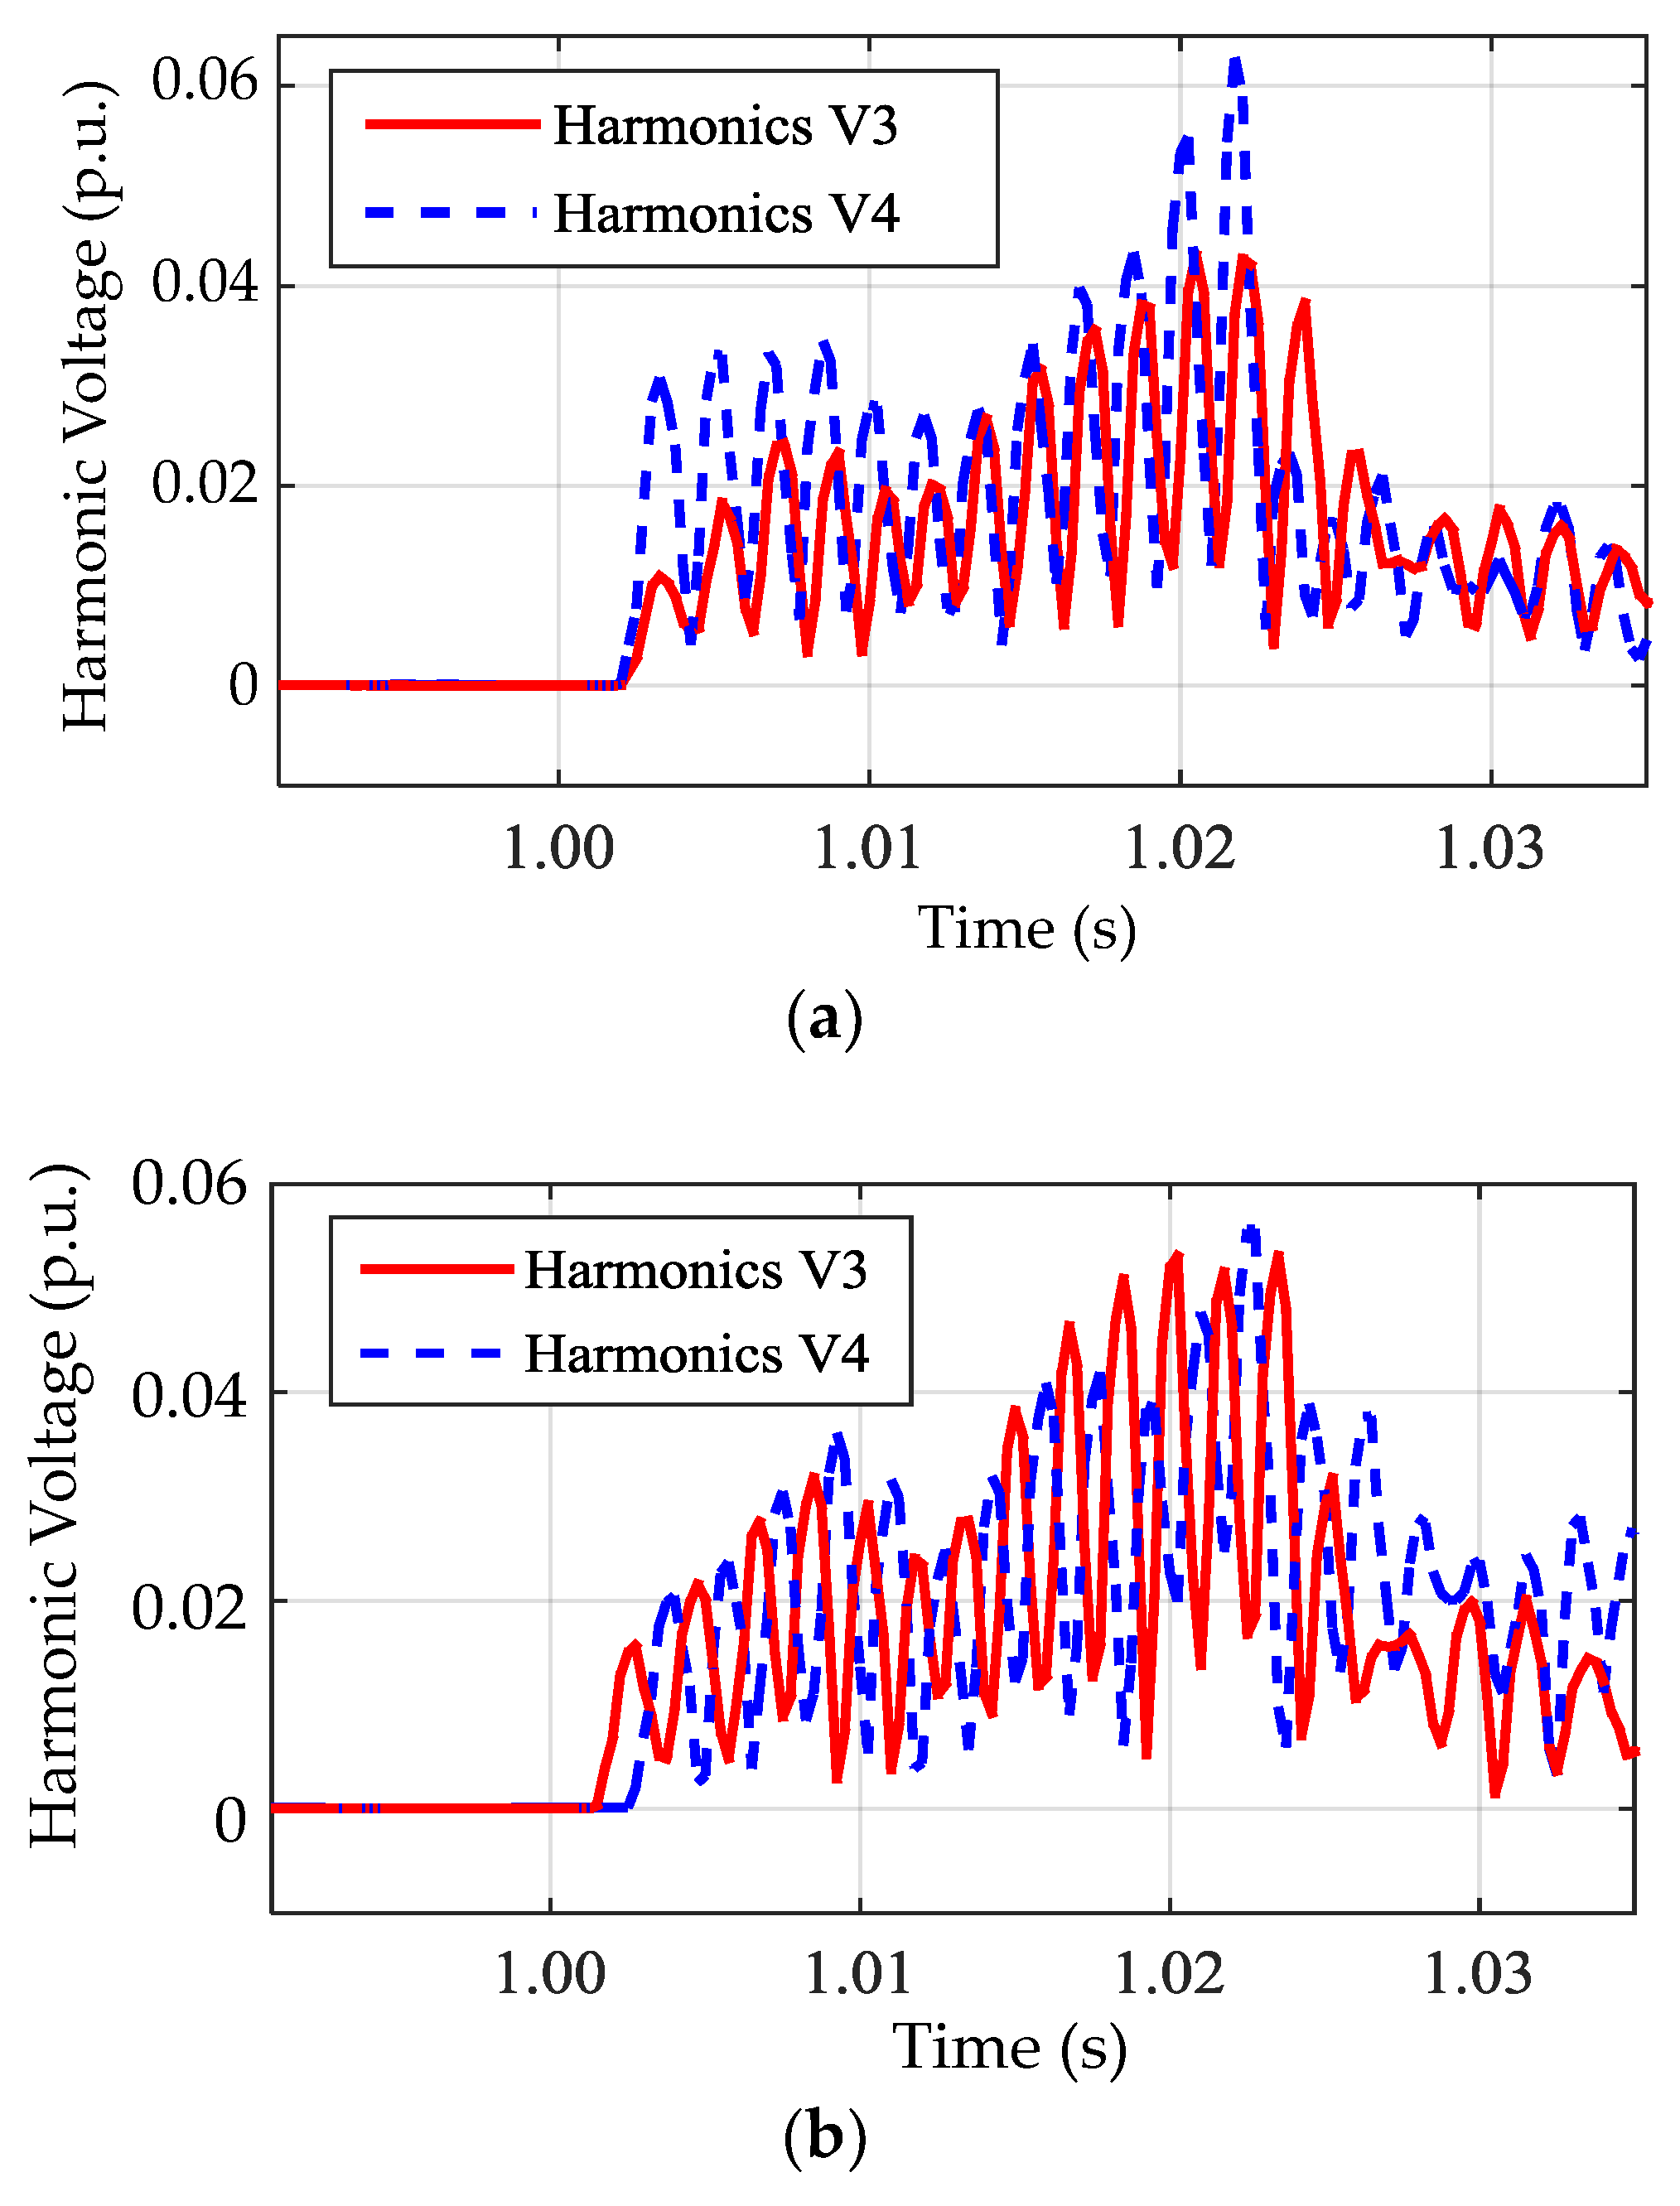
Figure 12 expressed the 12th harmonic voltages for different faults. In the top Figure, the fault occurs in the middle of the line, and the harmonics are above the threshold limit, and it arrived at T-3 and T-4 at the same time. In the middle Figure, the fault is near to the T-3. Since the harmonics at T-3 (red curve) arrived earlier then T-4 (blue curve). Likewise in the bottom Figure, the fault is near to the T-4. The harmonics at T-4 (blue curve) arrived earlier then T-3 (red curve). In normal condition, the p.u. harmonics are zero, and at the time of the fault, its value exceeds the threshold value. As a result, it is concluded that whenever the fault occurs and the parameters of the system cross the boundary values, the protection scheme must be operated properly.
6.3. Different Fault Cases to Analyze the Proposed Scheme
To assess the suggested protection scheme performance of MTDC network, different fault cases are analyzed. All possible conditions are discussed and described in
Table 2.
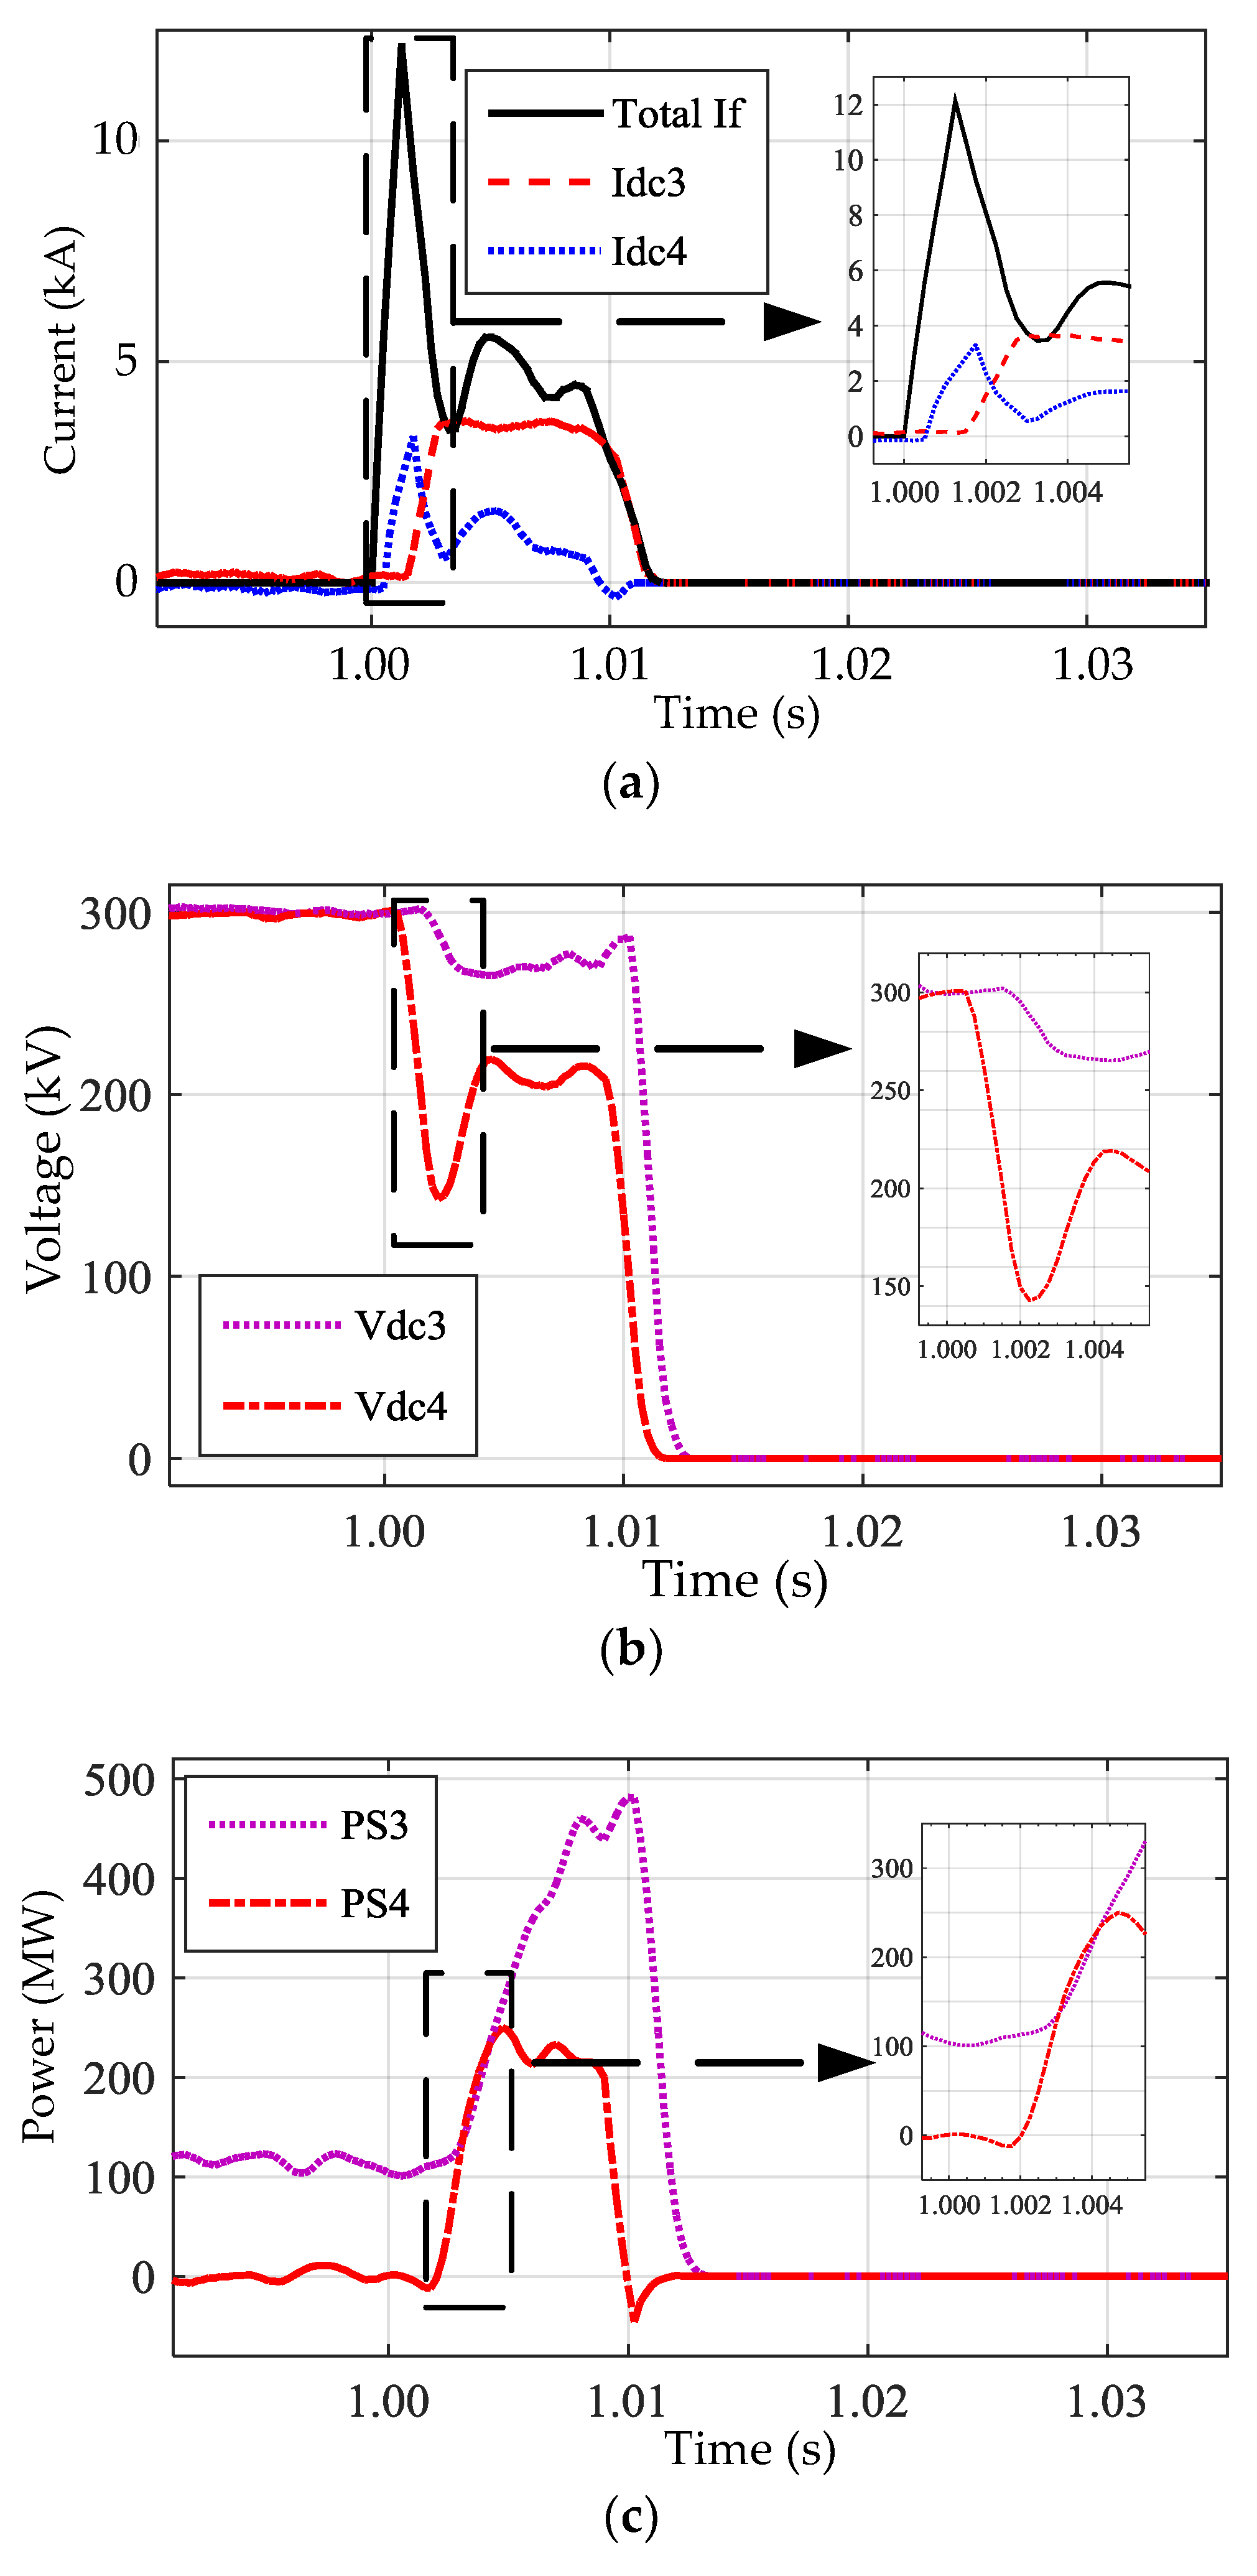
6.3.1. Case I
A L-G fault F1 is simulated at the center of line 3 to assess the performance of the proposed technique, and the fault occurs at
t = 1.0 s. At the time of the fault, the current in the lines showed an abrupt change. This abrupt change has been identified by the CDWM and verified with the harmonics of the system voltage as explained in
Section 4 to detect the fault. The proposed method has analyzed the fault location according to the protection technique and sent a trip signal to HCB34 (black curve) and HCB43 (green curve) at 3 ms after the fault to disconnect the faulty part as seen in
Figure 13. The HCBs take 7 ms to completely break the circuit as observed in the HCB modeling. Afterward, the faulty part fully disconnects from the healthy network, and the remaining part becomes stable as shown in
Figure 14,
Figure 15 and
Figure 16. Since before the fault, the voltage is stable to its rated values as can be seen in
Figure 14. During the fault, the Vdc3 and Vdc4 get affected as they are nearest to the fault location. After clearing the fault by the HCB34 and HCB43, the faulted terminals are disconnected, and the voltage becomes zero. Therefore, rest of the system becomes stable. Similarly,
Figure 15 expresses the DC currents of the system. Idc3 and Idc4 are tripped by the respective breakers.
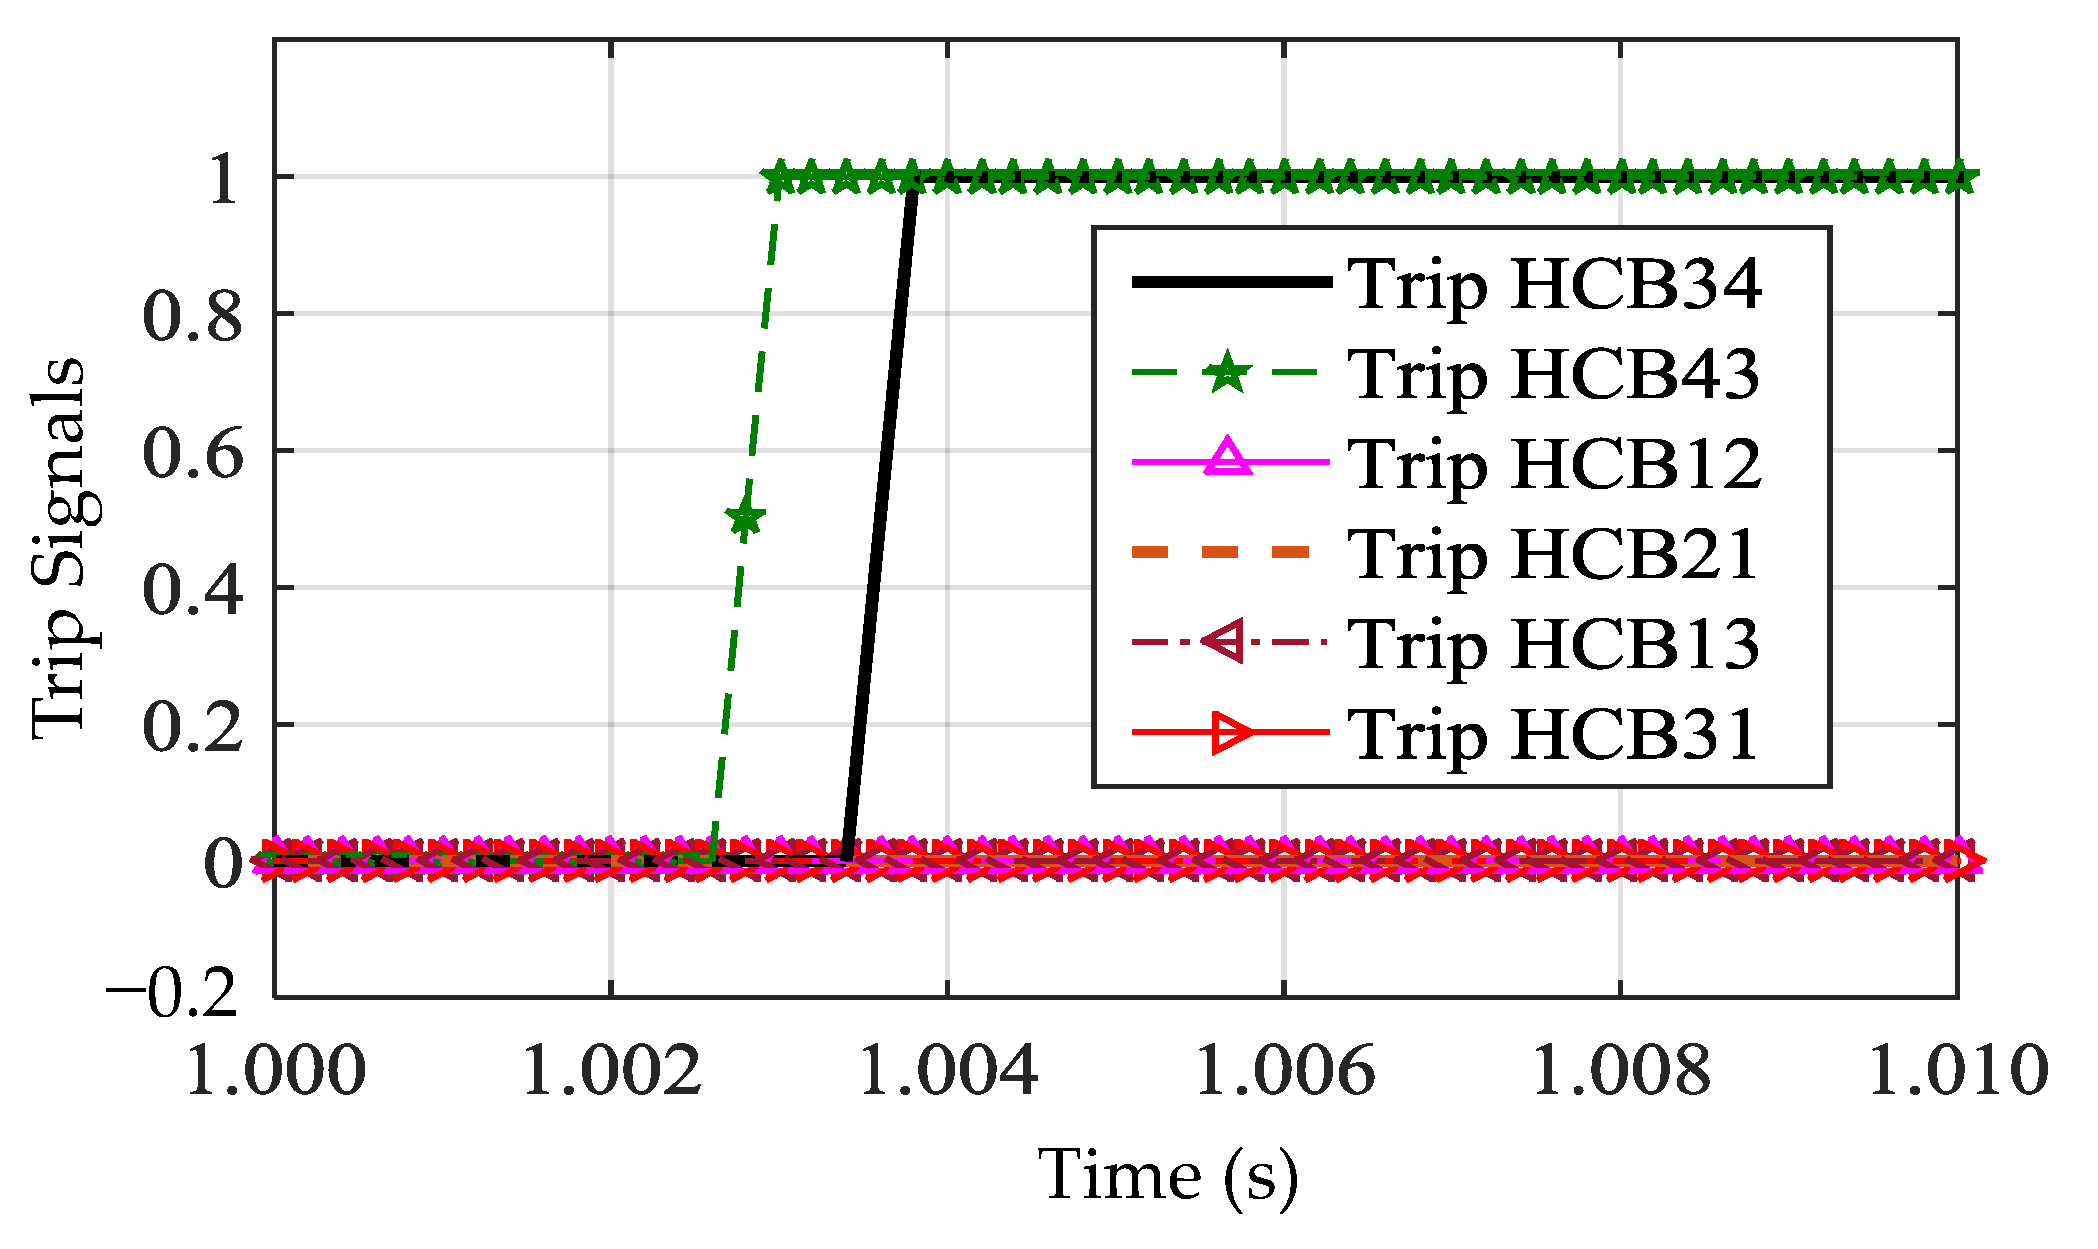
6.3.2. Case II
A L-G fault F2 is simulated at an unequal distance on line 3 as it can be seen in
Figure 3. The fault location is 100 km from terminal 4 and 300 km from terminal 3. Due to the propagation delay, the effect of fault propagates at terminal 4 earlier than terminal 3. Therefore, a trip signal is received earlier at HCB43 (green curve) than HCB34 (black curve) as displayed in
Figure 17 after verifying the fault. The fault currents, voltages and powers of the effected part have been depicted in
Figure 18. The effect of fault current at terminal 4 has arrived just in 0.5 ms (blue curve). Moreover, the fault current at terminal 3 has arrived with a delay of 1 ms (red curve).
The proposed method has tripped HCB34 and HCB43 to disconnect the faulty part with the same sequence of the protection scheme. Currents, voltages, and powers of the effected part become zero after clearing the fault and remaining part becomes stable.
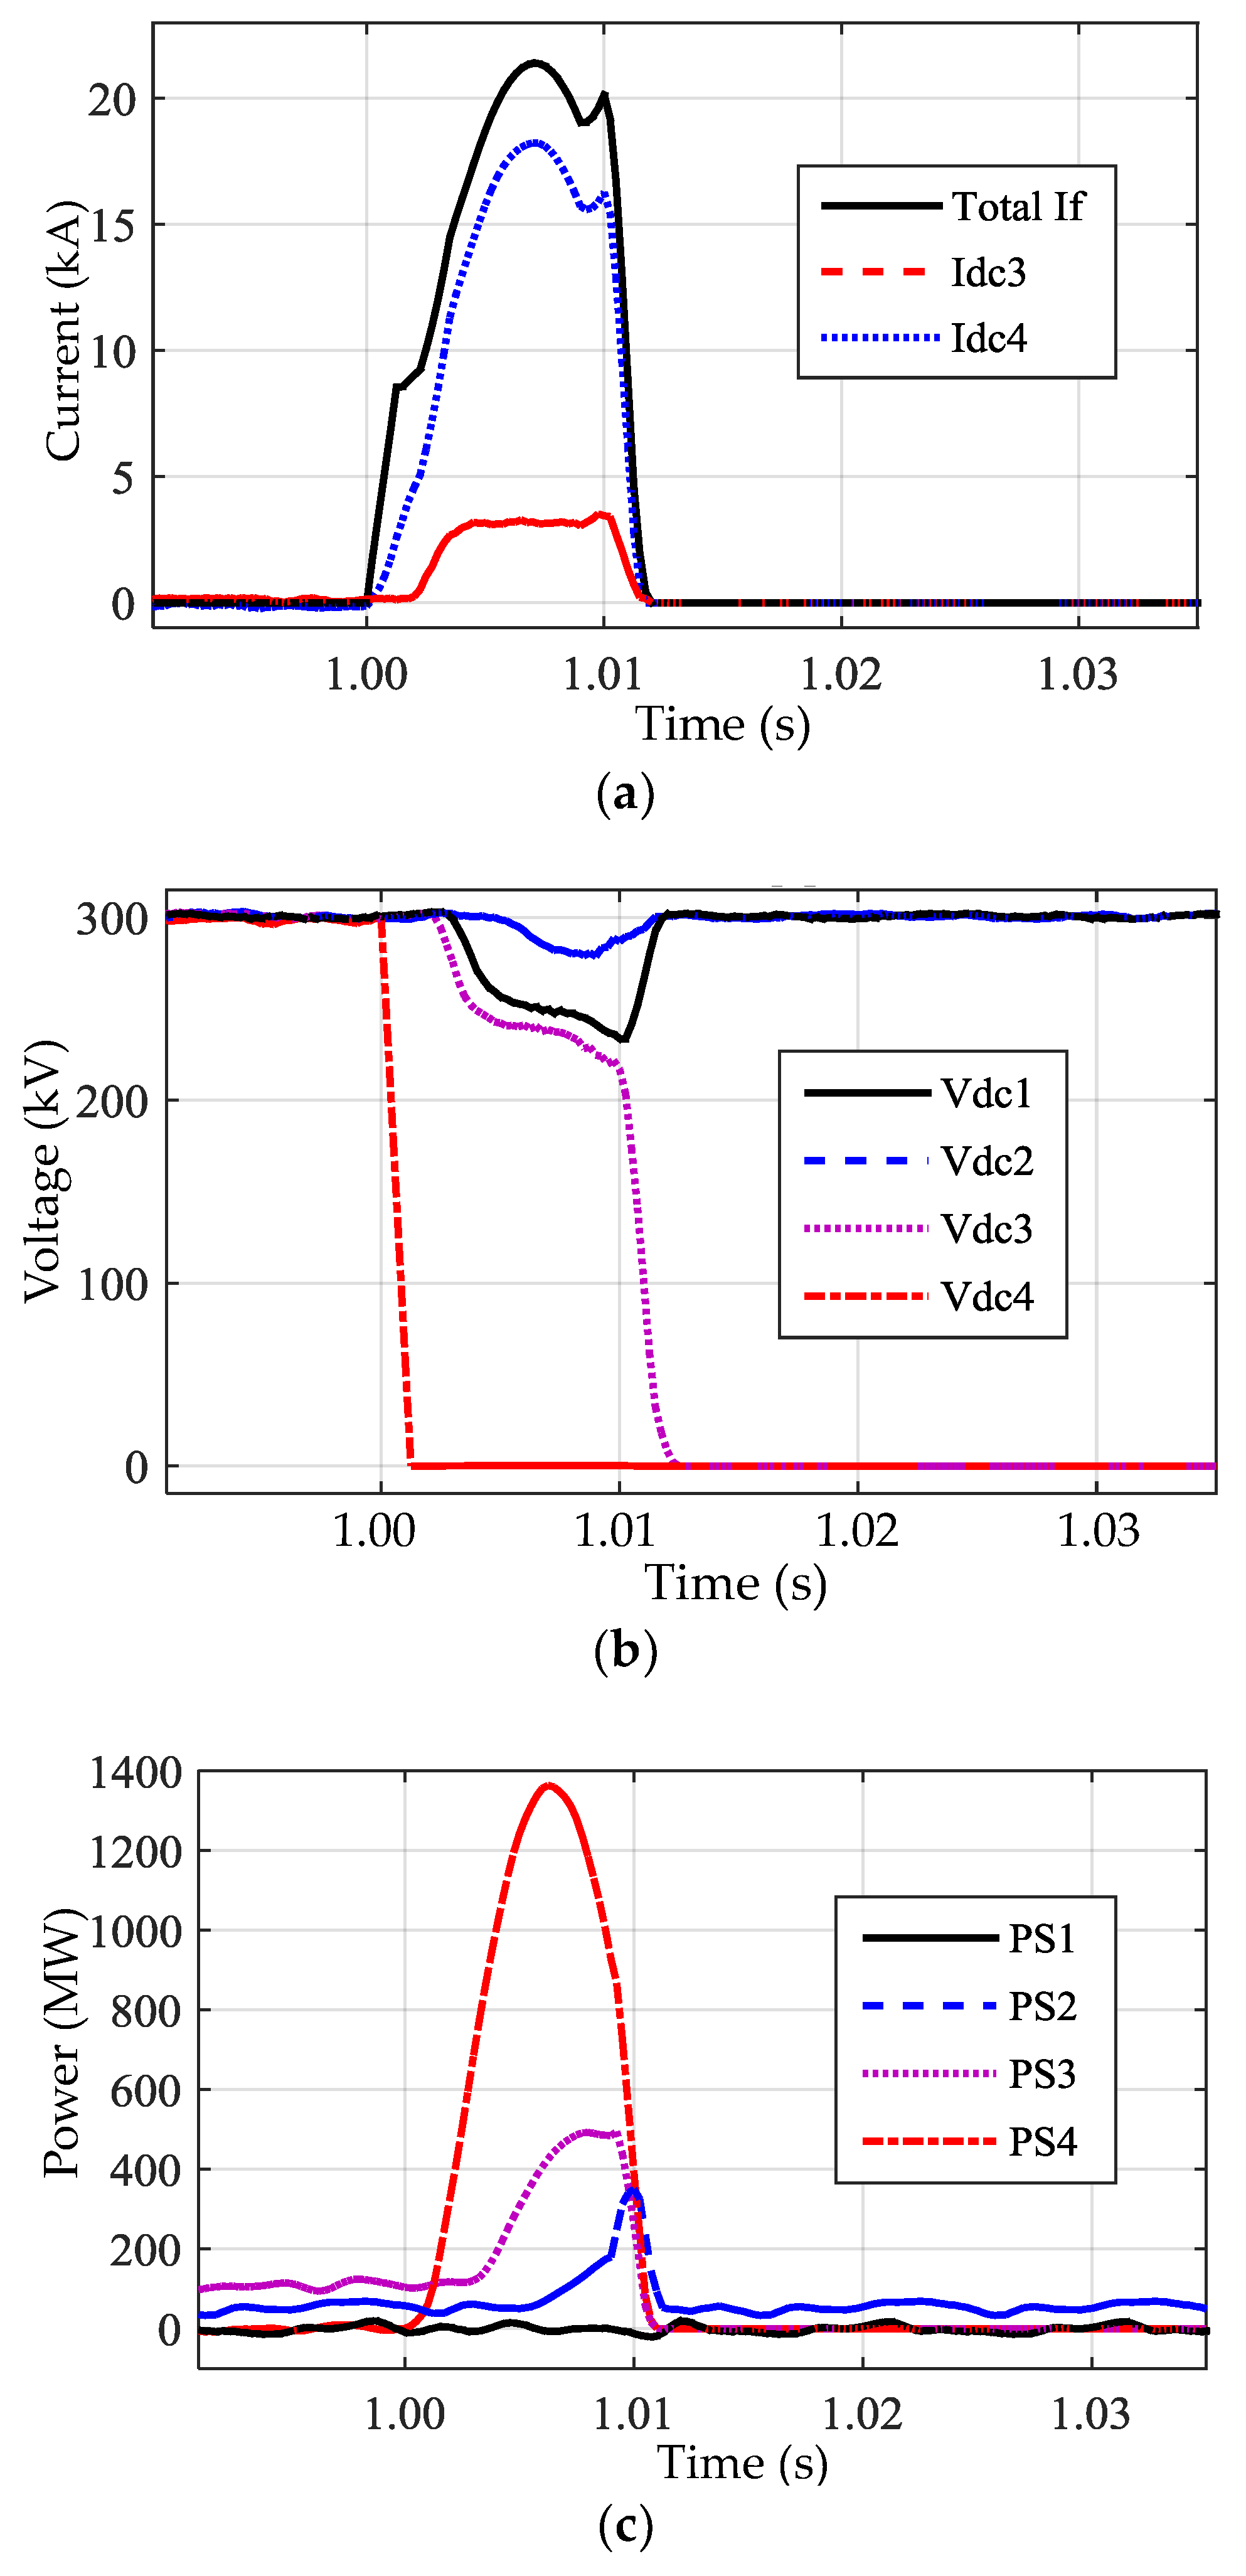
6.3.3. Case III
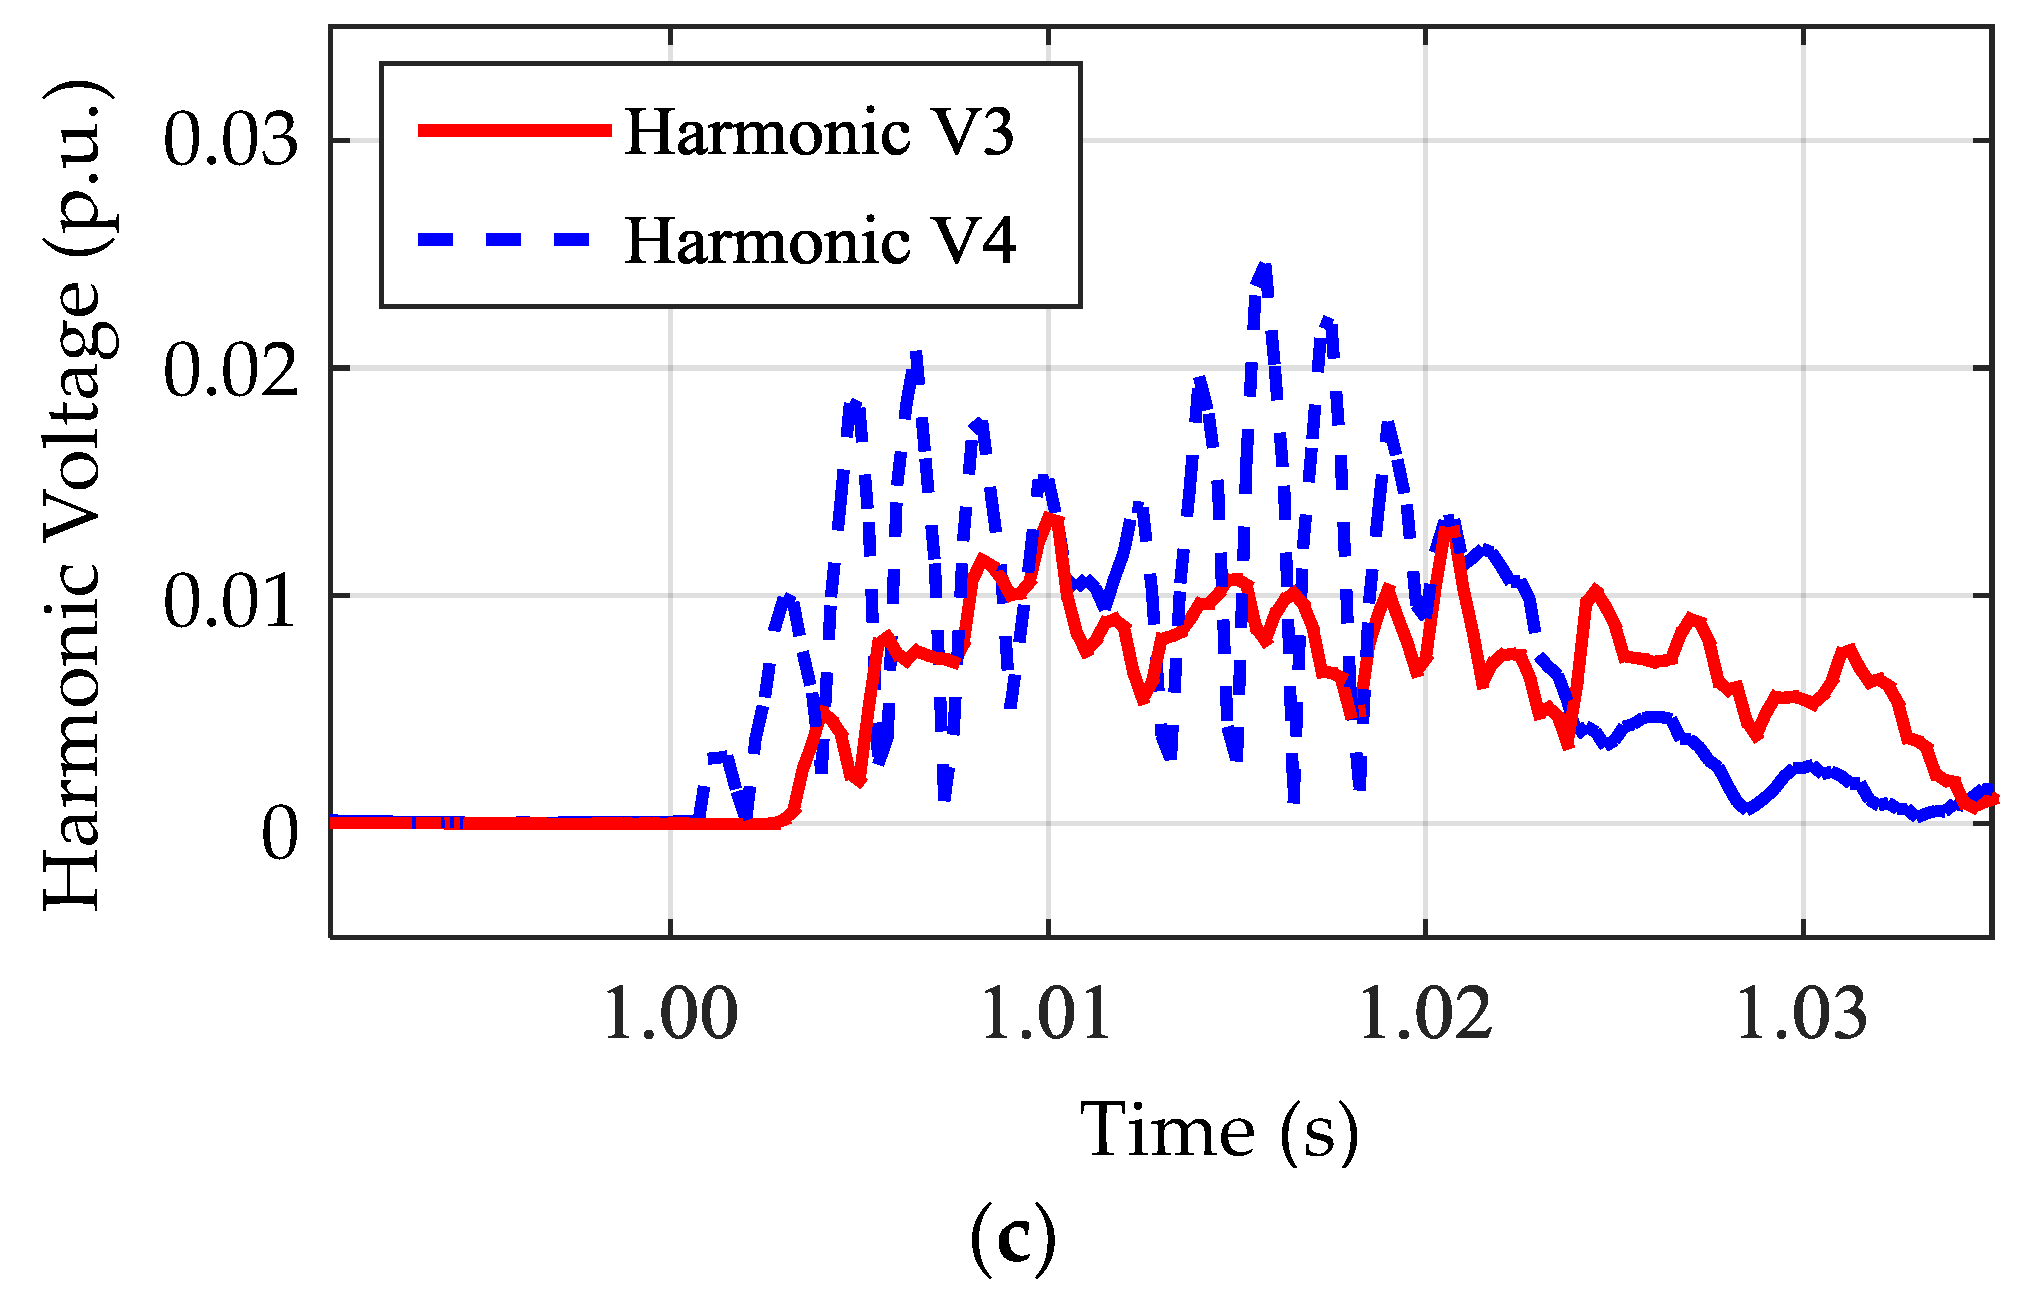
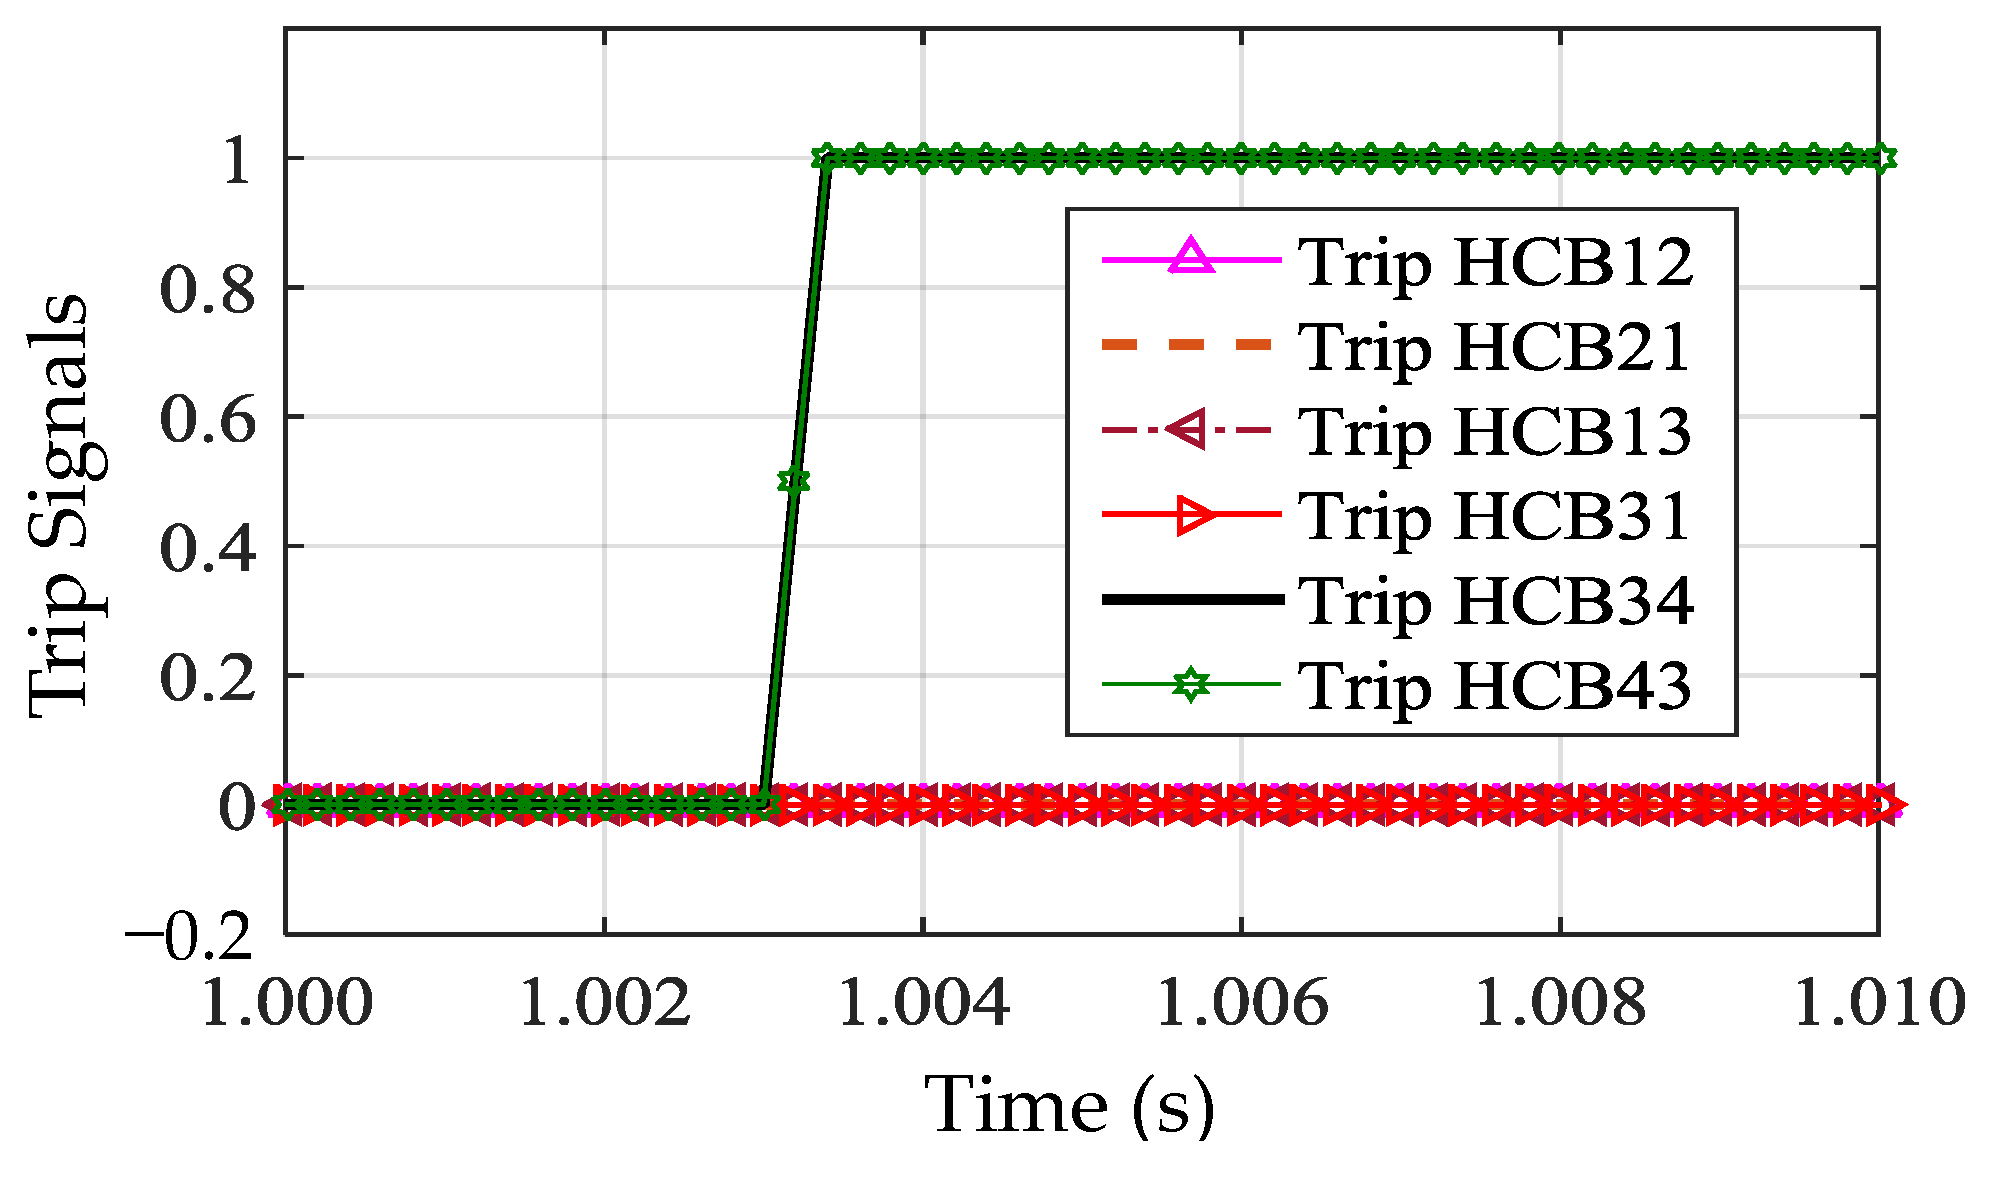
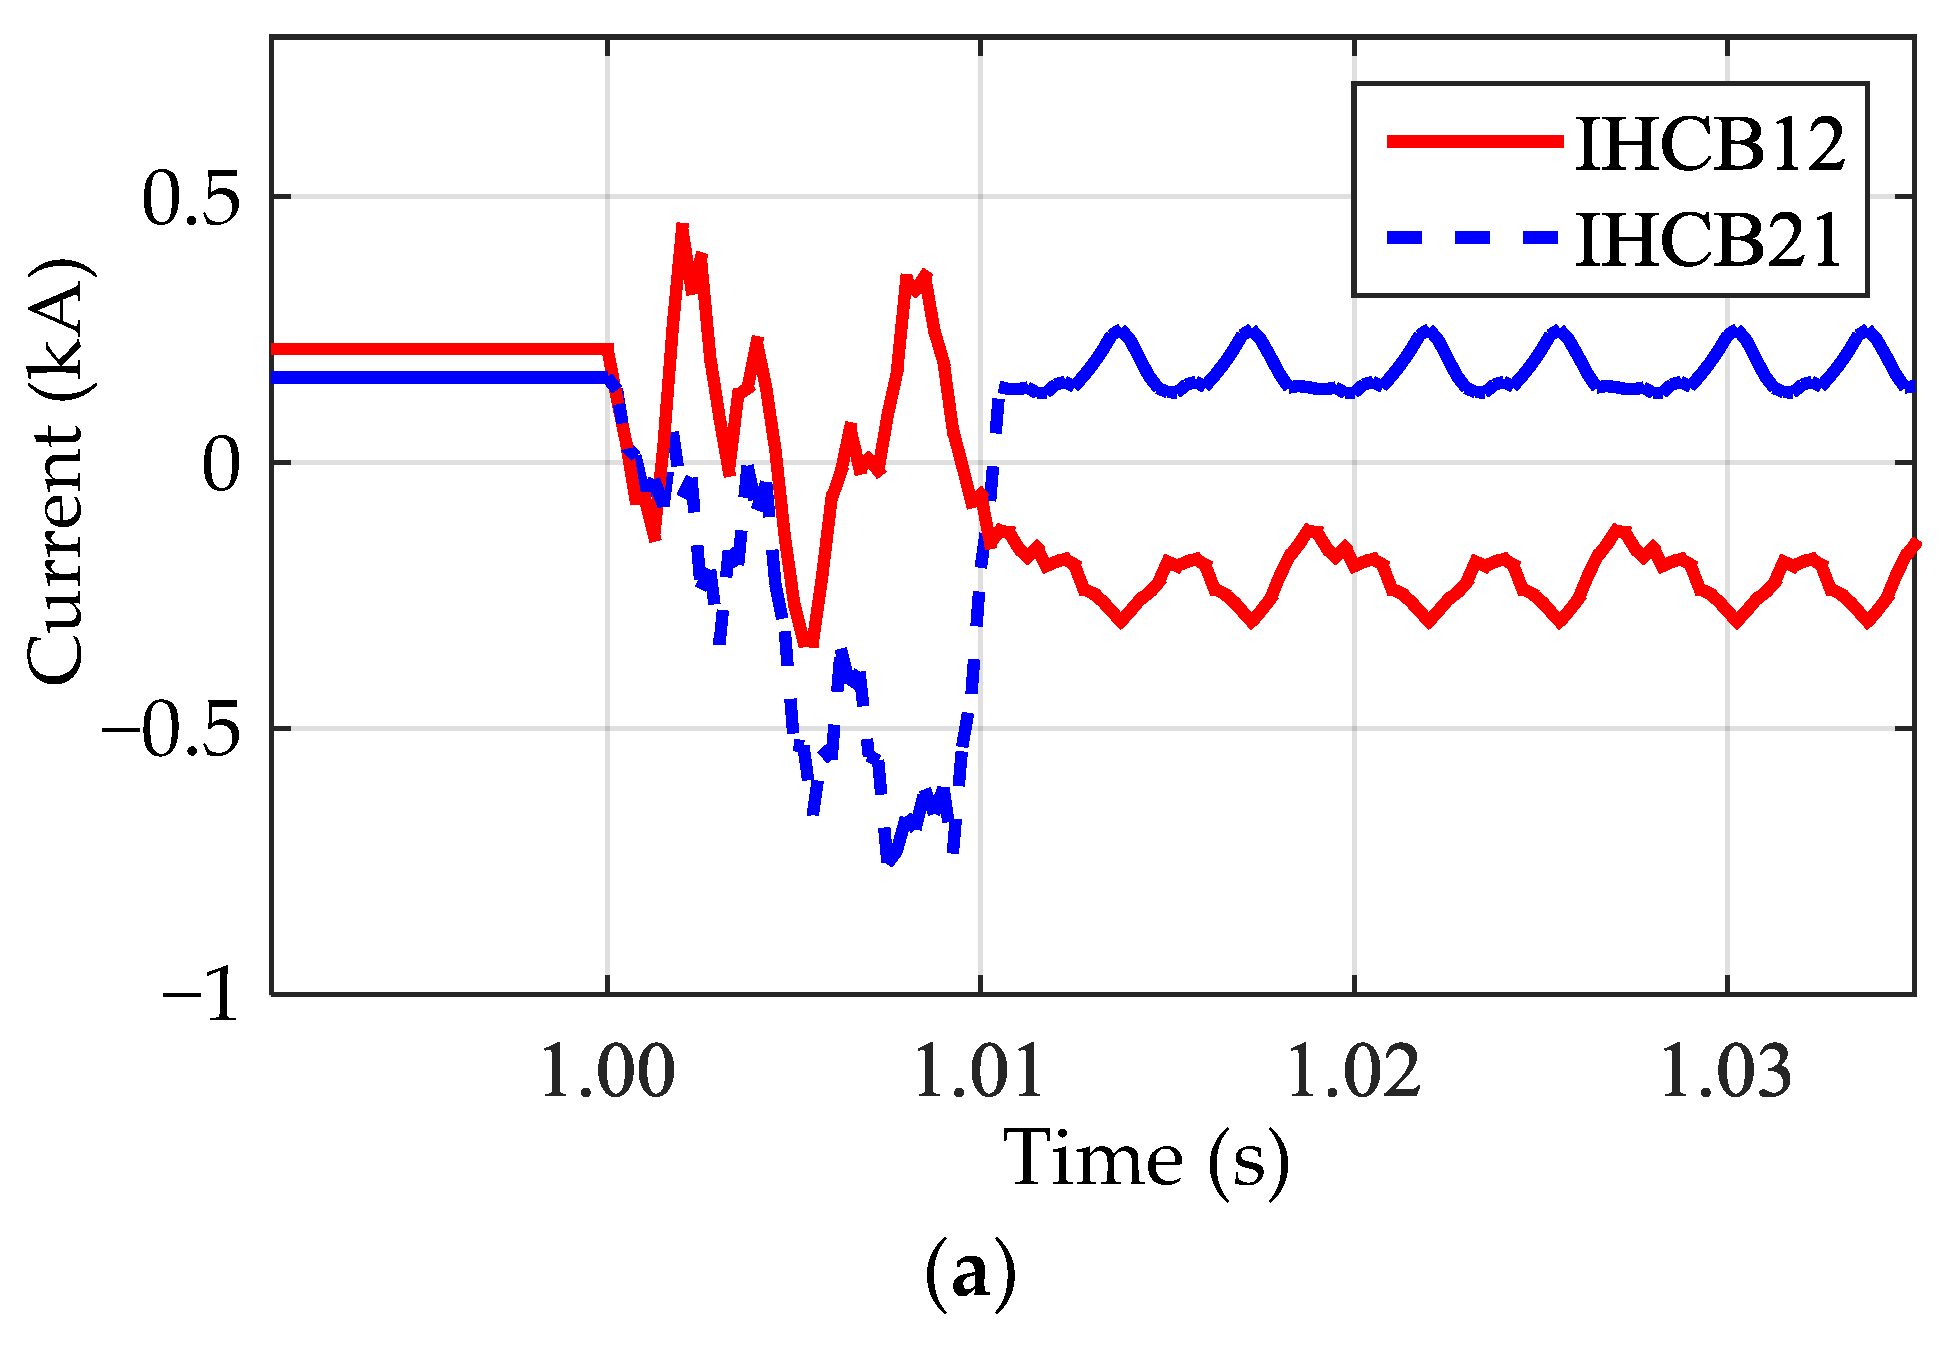
A L-L fault F3 is simulated near the terminal 4 as can be seen in
Figure 3. The L-L fault is the most severe case for the interruption in the MTDC network. The current rises multiple times, and the voltage drops to zero as shown in
Figure 19. After identifying the aforementioned changes in the current, and harmonics voltages of the system. The proposed scheme successfully trips HCB43 and HCB34 without physical communication among the terminals and also classifies the nature of L-L fault with the post-fault analysis.
6.4. Validation of Protection Scheme with Matlab
The proposed protection scheme performance is tested and verified under different fault conditions by using Matlab after computing the data from simulations.
Figure 20 shows the different fault conditions from fault A to fault F, and
Table 3 express the output results. Results show that the harmonics of the voltage are above the set value of the fault detection criteria and it has successfully detected the fault for all cases and generated the trip signal for the closest circuit breaker from the fault point. Meanwhile, fault classification has been achieved by the use of post-fault analysis with communication. The outcomes prove that the proposed protection scheme is promising for VSC-MTDC network.
6.5. Impact Analysis of Different Key Parameters on the Proposed Scheme
DC capacitors and surrounding feeder cable capacitances are dominant elements for the first few microseconds, whenever a fault occurs. Subsequently, the capacitive discharges die out in a short time interval with higher
di/
dt values. Afterward, the infeed of the AC is the main contributor to the fault current, and it also charges the capacitive components periodically. This capacitive charge is discharged through fault resistance. Fault resistance, DC capacitance, and surrounding feeder length mainly affect the fault currents and terminal voltages. Hence, these are the key parameters that mainly affect the proposed scheme and detailed simulation results expressed in
Table 4.
Fault resistance value influences the value of fault current; CB current and terminal voltage drop. Simulation results have illustrated the dependence of fault resistance to the proposed scheme. Size of fault resistance has been varied from 0.01 Ω to 200 Ω, keeping all other parameters constant. Results proved a decrease in the value of fault current and voltage drop with increasing value of fault resistor. At 200 Ω fault resistance, fault current reduced less than 1 kA, and voltage drop was also negligible.
Similarly, the value of the DC capacitor also affects the value of the fault current, CB current, and terminal voltage drop. The results of simulations have explained its dependence on the DC capacitance. Size of DC capacitor has been varied from to , and all the other constraints are kept constant. Results proved that decrement in the value of voltage drop and fault current was associated with incremental DC capacitance values. More substantial value of capacitor size stabilized the terminal voltage.
Surrounding cable length has less influence on the fault current and voltage drop due to its capacitance. Hence it cannot be ignored. The value of surrounding cable affected the fault current and terminal voltage drop. Results illustrate the dependence of fault current and voltage drop on the length of the conductor. The length of cable has been varied from 100 km to 1000 km keeping all other parameters constant. The results have proven that the value of fault current and voltage drop increases with the increase of surrounding cable length. The surrounding cable length does not affect much and has the dominating effect of discharging cable in first few milliseconds. Increase in cable length can also increase the time delay of contribution from rest of the system that is connected to the cable.
6.6. Comparative Analysis
The proposed protection scheme is compared with some state-of-the-art techniques. DC fault ride through the scheme is expressed in [
36], which is based on the differential current technique, and need physical communication for operating the protection scheme. The proposed scheme does not require any communication time delay, as no communication is required for obtaining current signals from both ends. In short, the operating time of CDWM is much rapid as compared to the existing schemes, and it is based on current as well as voltage to enhance the reliability of the system. The analytical formulas for the calculation of fault current are proposed in [
37]. Hence, it is only valid for the L-G fault and discusses the dominating period of the ac infeed only. On the other hand, the proposed scheme is equally viable for both L-G and L-L faults, as shown in
Table 3. The single-ended differential protection scheme is a reliable competitor for protection of MTDC by using multipoint optical current computing sensors across the intact length of transmission lines [
12]. It uses a differential current method by utilizing the predefined threshold values. However, in case of sudden changes in the load current, the predefined threshold values are not valid. Moreover, the only current signal is used for fault detection. Likewise, multiple sensors are installed along the transmission line that may become less efficient or defective with the passage of time. As a result, it effects the performance of overall system. The other downsides of this technique are heavy capital and maintenance cost of the optical sensors as well as fiber optic cable. As compared to it, the proposed scheme doesn’t need any communication for measuring the differential current, it is not only based on the current signal to enhance the reliability of the system, there is no heavy cost in executing the proposed scheme.


